Embed Size (px)
Citation preview

RESEARCH ARTICLE
Artificial intelligence modeling to evaluate field performanceof photocatalytic asphalt pavement for ambient air purification
Somayeh Asadi & Marwa Hassan & Ataallah Nadiri &Heather Dylla
Received: 21 August 2013 /Accepted: 21 March 2014# Springer-Verlag Berlin Heidelberg 2014
Abstract In recent years, the application of titanium dioxide(TiO2) as a photocatalyst in asphalt pavement has receivedconsiderable attention for purifying ambient air from traffic-emitted pollutants via photocatalytic processes. In order tocontrol the increasing deterioration of ambient air quality,urgent and proper risk assessment tools are deemed necessary.However, in practice, monitoring all process parameters forvarious operating conditions is difficult due to the complexand non-linear nature of air pollution-based problems.Therefore, the development of models to predict air pollutantconcentrations is very useful because it can provide earlywarnings to the population and also reduce the number ofmeasuring sites. This study used artificial neural network(ANN) and neuro-fuzzy (NF) models to predict NOx concen-tration in the air as a function of traffic count (Tr) and climaticconditions including humidity (H), temperature (T), solar
radiation (S), and wind speed (W) before and after the appli-cation of TiO2 on the pavement surface. These models areuseful for modeling because of their ability to be trained usinghistorical data and because of their capability for modelinghighly non-linear relationships. To build these models, datawere collected from a field study where an aqueous nano TiO2
solution was sprayed on a 0.2-mile of asphalt pavement inBaton Rouge, LA. Results of this study showed that the NFmodel provided a better fitting to NOx measurements than theANN model in the training, validation, and test steps. Resultsof a parametric study indicated that traffic level, relativehumidity, and solar radiation had the most influence on pho-tocatalytic efficiency.
Keywords Artificial neural network . Neuro-fuzzy . Nitrogenoxides . Titanium dioxide . Photocatalytic pavement
Introduction
Photocatalytic pavements are currently being investigated as apotential solution to remove air pollutants. These pavementsconsist of a surface layer of titanium dioxide (TiO2) nanopar-ticles, which can reduce or oxidize both organic and inorganicparticles that are absorbed into active sites when irradiated byUV light (Beeldens 2006). Several laboratory studies haveshown the effectiveness of photocatalytic pavements; howev-er, understanding the efficacies in real-world environmentremains a challenge (Berdahl and Akbari 2008). Previousresearchers have shown that the efficiency of photocatalyticpavement depends on environmental factors including theconcentration of pollutants, relative humidity, temperature,UV intensity, and wind speed, which complicate the interpre-tation of field test results (Sleiman et al. 2009; Venturini andBacchi 2009; Bengtsson and Castellote 2010; Hassan et al.2012).
Responsible editor: Michael Matthies
S. AsadiDepartment of Civil and Architectural Engineering, Texas A&MUniversity-Kingsville, MSC 194, 700 University Blvd, Kingsville,TX 7836, USAe-mail: [email protected]
M. Hassan (*)Department of Construction Management, Louisiana StateUniversity, 3130 A PFT Hall, Baton Rouge, LA 70803, USAe-mail: [email protected]
A. NadiriUniversity of Tabriz, 29 Bahman Boulevard, Tabriz, East Azarbaijan,Irane-mail: [email protected]
H. DyllaDepartment of Construction Management, Louisiana StateUniversity, Baton Rouge, LA 70803, USAe-mail: [email protected]
Environ Sci Pollut ResDOI 10.1007/s11356-014-2821-z

Two techniques have been used to evaluate the photocata-lytic degradation in the field. The first is to measure thereduction of NOx concentration directly by measuring theambient air pollution concentrations and the second is tomeasure the reduction indirectly by measuring the by-products created from the degradation process (Dylla et al.2012b). Using these two techniques, several approaches havebeen used in order to study photocatalytic efficiency in thefield (Venturini and Bacchi 2009; Beeldens 2008; Maggoset al. 2007, 2008; Li and Qian 2009; Chen and Chu 2011).A review of the literature reveals that several approaches areavailable for predicting NOx concentrations in the air. Oneapproach is to create a model to predict the concentrations ofNOx in the air for a given area without photocatalytic pave-ment and an area with photocatalytic pavement. There areseveral roadway microenvironments pollution dispersionmodels such as Gaussian plume dispersion, computationalfluid dynamics (CFD), atmospheric box, and statisticalmodels (Lin and Yu 2008). Both statistical and computationalfluid dynamic models have been developed to characterizephotocatalyt ic environments (Dylla et al . 2013;Moussiopoulos et al. 2008). Among these, statistical modelsare simple and do not require additional laboratory kineticstudies to predict photocatalytic efficiency.
Many scientific investigations have been conducted topredict different air pollutants’ concentrations using statisticaltools including regression, multi-regression, and artificial neu-ral networks (Karppinen et al. 2000; Lin and Wu 2003;Sharma et al. 2004). Using these tools, the pollution concen-trations are estimated by statistical relationship between vari-ous factors collected at a particular receptor (Sharma et al.2004). Regression statistics previously used by authors toevaluate the efficiency of photocatalytic pavements providedfair results. The developed model considered different factorssuch as solar radiation, relative humidity, wind speed, traffic,and temperature (Dylla et al. 2013). The results of the statis-tical models showed a good agreement between the predictedand observed data but some points had high errors. Statisticalmodels may be able to obtain a relationship between the inputand the output variables without describing the causes andeffects in the formation of pollutants. However, they are notable to evaluate the intrinsic non-linear nature of the problemand to predict short-term pollution levels (Agirre-Basurkoet al. 2006; Barai et al. 2007; Akkoyunlu et al. 2010;Yetilmezsoy and Abdul-Wahab 2012).
To overcome this problem,mathematical models have beenused as vital tools in both design and operation especially incases which deal with high dimensional data such as airquality. A review of literature reveals that several artificialintelligence (AI) models are available for predicting the airpollutant concentrations (He and Ma 2010; Sousa et al. 2007;Abdul-Wahab and Al Alawi 2002; Carnevale et al. 2009; Pireset al. 2012). Over the last four decades, different AI models
including artificial neural network (ANN) and neuro-fuzzy(NF) have been proposed as alternatives to traditional statisti-cal models. AI models can be used in the modeling of differentreal-life processes in environmental engineering due to theirpredictive capabilities and non-linear characteristics(Hydrology 2000; Maier and Dandy 2000); (Asghari et al.2010; Maier et al. 2010; Nadiri et al. 2013a, b). Using AImodels, some studies predict the concentrations of differentair pollutions such as carbon monoxide (CO) (Gautam et al.2008; Cai et al. 2009), particles measuring 10 μm or less(PM10) (Hooyberghs et al. 2005; Patricio and Jorge 2006;Paschalidou et al. 2011), ozone (Sousa et al. 2007; Abdul-Wahab and Al Alawi 2002; Pires et al. 2012; Salazar-Ruizet al. 2008) and sulfur monoxide (SO) (Brunelli et al. 2007).Sousa et al. (2007) constructed multiple linear regression andartificial neural networks models based on principal compo-nents to predict ozone concentrations. A new methodologybased on feedforward artificial neural networks using princi-pal components as inputs was used to predict next day hourlyozone concentrations. Then, they compared the results of thedeveloped model with multiple linear regressions,feedforward artificial neural networks based on the originaldata, and also with principal component regression. Theyfound that the use of principal components as inputs improvedboth model prediction by reducing their complexity and elim-inating data collinearity. Later, He and Ma (He and Ma 2010)used a back-propagation neural network based on principalcomponent analysis to model the internal greenhouse humid-ity during winter season in North China. The results of thismodel were compared with the stepwise regression model.The results indicated that the stepwise regression method wasless accurate than the back-propagation neural networkmodel.
Each AI method has its own advantages. The fuzzy modelstend to be robust to parameter changes, and are also tolerant toimprecision and uncertainty (Bardossy and Disse 1993).While the ANN model represents non-linear relationshipsand learns these relationships directly from the data beingmodeled (Palani et al. 2008). Obviously, the NF model takesadvantage of the fuzzy logic (FL) and ANN in modeling. TheNF model combines the advantages of fuzzy systems—dealwith explicit knowledge—ANN deals with implicit knowl-edge. This NF model, by taking advantage of ANN and fuzzylogic methods, have shown high capability to estimate airpollution (Yildirim and Bayramoglu 2006; Carnevale et al.2009).
The objective of this study was the construction of AImodels which give the possibility of predicting the NOx
concentration in the air for a given area without photocatalyticpavement and an area with photocatalytic pavement as afunction of traffic count (Tr) and climatic conditions includinghumidity (H), temperature (T), solar radiation (S), and windspeed (W). This model relates the NOx concentration to both
Environ Sci Pollut Res

meteorological variables as well as to traffic volume and helpto understand the effect of each parameter on the efficiency ofphotocatalytic asphalt pavement to reduce NOx concentrationin the air. The AI models are useful for modeling because oftheir ability to be trained using historical data and because oftheir capability for modeling highly non-linear relationships.
Field site description
Data used in the models were obtained from a field studylocated in Baton Rouge, Louisiana, where 0.2 miles of asphaltpavement was sprayed with an aqueous TiO2 solution (Dyllaet al. 2013). The photocatalytic spray coat was a mixture ofTiO2 anatase nanorods 12 nm wide by 75 nm long suspendedin an aqueous liquid at 2 % by volume (Dylla and Hassan2012a). Before application, the roadway was cleared of anydebris. A primer was applied before the photocatalytic coat. Adistributor truck was used in the application process. Mountedon the back of the truck, a spray bar fitted with nozzlesdistributed TiO2 water-based solution at the specified applica-tion rate, 16.1 to 21.5ml/m2. The application rate was adjustedby altering the truck speed. Further, the nozzles had electro-static precipitators to separate the TiO2 nanoparticlessuspended in the aqueous solution and to ensure a more evencoverage.
Equipment used for field data collection was housedin an air-conditioned trailer. A Thermo 42i NOx analyz-er was used for monitoring NO, NO2, and NOx concen-trations. The NOx analyzer was calibrated in accordanceto EPA calibration procedures using the gas phase titra-tion (GPT) alternative. A Thermo 146i gas calibratorwas used for calibration of the NOx analyzer. TheNOx analyzer was calibrated at five different spans forNO and four different ozone settings for NO2 to con-firm linearity and ozone converter efficiency. In addi-tion, the Department of Environmental Quality (DEQ)air monitoring station is located next to the air-conditioned trailer. After calibration, the NOx analyzerwas connected to ambient air at the pavement levelusing a stainless steel pipe placed in the middle laneand was covered with a protective bump.
To monitor climatic conditions at the site, a Davis 6152Wireless Vantage Pro weather station was installed in the fieldwhich recorded and stored meteorological data including hu-midity, ambient air temperature, wind speed, and solar radia-tion continuously each minute. A portable Peek ADR-1000traffic counter capable of counting vehicles per 5-min inter-vals was employed. Traffic counter was installed to count thenumber of vehicles per 5-min per lane. In order to consider theeffect of climatic conditions on the performance of photocat-alytic activities, data were collected under different climaticconditions.
Parameters selection
The goal of this study was to predict NOx concentration in theair as a function of different parameters before and afterapplication of TiO2 on the asphalt pavement. The selectedparameters and their range of variation are shown in Table 1.These parameters were selected based on laboratory test re-sults (Hassan et al. 2012). Laboratory results established arelationship between NOx concentration and humidity, UVintensity, temperature, and flow rate.
Methodology
Artificial intelligence methods
Different non-linear AI models may be used for air pollutants’prediction. In this study, ANN and NF models were adoptedfor prediction of NOx concentrations. The main goal of themodels is to predict NOx concentration and investigate thesensitivity of NOx concentration to related variables defined asinput data. The input data for the AI models for the case studyin Baton Rouge, LA, are shown in Table 1. A brief descriptionof the two AI models is provided in the following sections.
ANN
An ANN model was developed to predict NOx concentrationin this study. ANN is a universal approximator to surrogate
Table 1 Parameters range ofvariation Description Min Max Mean Standard deviation
Tr (V/5 min) Traffic count 0 36 15 13.4
S (W/m2) Solar radiation 0 858 123 197.2
W (m/s) Wind speed 0 4 0.8 0.91
H (%) Relative humidity 32 94 77 14.01
T (°C) Temperature 11 30 20.4 4.11
Environ Sci Pollut Res

complex systems (Hydrology 2000; Maier et al. 2010). Neuralnetworks are composed by simple connected elements(neurons) operating in parallel. Each neuron includes a non-linear function relating inputs and outputs (activation func-tion). The most widely used neural network is the multi-layerperceptron (MLP) network (Hydrology 2000; Nourani et al.2008) that consists of an input layer, a hidden layer, and anoutput layer. This study considers one hidden layer for theMLP network as shown in Fig. 1a. The structure of the ANNmodel, applied to predict NOx concentration, contains fiveneurons in the input layer pertain to the input data (Tr, H, S,W,and T), one neuron in the output layer and four neurons in thehidden layer that was determined via trial and error.
The normalized input signal spreads through the network ina forward direction via connections between neurons.Incoming signals are linearly combined and converted tooutgoing signals. The signal conversion is conducted byassigned activation functions. The mathematical expressionfor a three-layer feedforward ANN is given as (Hydrology2000; Nadiri et al. 2013a):
Oj ¼ f 1 bj þXi
W jiI i
!ð1Þ
Ok ¼ NOx ¼ f 2 bk þXj
W kjOj
!ð2Þ
where f1 and f2 are the activation functions for the hidden andoutput layers, respectively, Ii is the i
th input,Oj is the jth output,
Wji and Wkj are weights that control the strength of connec-tions between two layers, and the biases bj and bk are used toadjust the mean value for input layer and hidden layer, respec-tively. The activation function for the hidden layer is typicallya continuous and bounded non-linear transfer function such assigmoid and log sigmoid functions. The activation functionfor the output layer is usually a linear function. In this study,hyperbolic tangent sigmoid and linear function was selectedfor f1 and f2, respectively. The output Ok of the ANN is theNOx concentration. In the ANN training step, a supervisedlearning algorithm was used to estimate the weights Wji andWkj (Hydrology 2000). To construct ANN model and toprevent over-fitting, a cross validation method procedure isusually recommended (Hydrology 2000). The cross validationinvolves partitioning a sample of data into complementarysubsets, performing the analysis on one subset (training set),and validating the analysis on the other subsets (called thevalidation set and testing set). Therefore, the measured datawere randomly divided into three groups, training (70 %),validation (15 %), and testing (15 %).
NF
Neuro-fuzzy (NF), as shown in Fig. 1b, combines the advan-tage of the FL and ANNmethods by applying various learningtechniques developed in the ANN literature to optimize the FLmodel (Nayak et al. 2004). Based on the fuzzy-set theory, anelement of the world belongs to a set, specifying a feature ofthe element (linguistic variable), with a value ranging from 0to 1 according to a function (membership function). Fuzzy
Fig. 1 Schematics of a ANNstructure and b NF structure
Environ Sci Pollut Res

sets have also ambiguous boundaries and gradual transitionsbetween defined sets, which are appropriate to deal with thenature of uncertainty in the system and human errors (Pulido-Calvo and Gutiérrez-Estrada 2009). Following the conven-tional logic, an inference system based on the rules in the formof “if-then” is formulated for the fuzzy logic (Carnevale et al.2009).
The first step for preparation of the NF model to predictNOx concentration is construction of a FL model. A FL modeldeveloped by Takagi and Sugeno (Takagi and Sugeno 1985;Sugeno and Yasukawa 1993) termed as TS-FL model, wasadopted. In this model, the output membership functions areeither constant (zero order) or linear (first order). Input clustersand output membership functions are extracted by a clusteringprocess. An effective subtractive clustering method (Chen andWang 1999) for TS-FL modeling was used for the extractionof clusters and fuzzy “if-then” rules. The important parameterin subtractive clustering, which controls number of clustersand fuzzy “if-then” rules, is cluster radius that takes valuesbetween 0 and 1. Decreasing the cluster radius increases thenumber of clusters and leads to smaller clusters. In contrast, alarge cluster radius produces large clusters in the data andresults in few rules (Aqil et al. 2007). ATS-FL model withoutsufficient number of rules cannot cover the entire domain andwith too many rules, becomes complicated and may lead tolow performance. Therefore, the cluster radius had to beoptimized via trial and error to have a suitable number ofclusters and rules. Searching for the optimal cluster radiuscan be accomplished by systematically varying cluster radiusvalue from 0 to 1 until a minimal root mean squared error(RMSE) is achieved.
To apply the first-order TS-FL model, a generalizedGaussian function was used to develop membershipfunctions for the five input data, see Table 1. Eachinput was clustered into nine classes. Then, based onmembership functions of the five input data, a set offuzzy if-then rules were developed to linearly aggregatethe input data as the output. Since the subtractive clus-tering method was used, the number of rules was equalto the number of clusters. For NOx prediction in thisstudy, a fuzzy “if-then” rule i can be expressed as:
Rule i: if (Tr belongs to MFTri ), (H belongs to MFH
i ), (Sbelongs to MFS
i ), (W belongs to MFWi ), and (T belongs to
MFTi ), then
NOxð Þi ¼ miTr þ niH þ piS þ qiW þ ziT þ ci ð3Þ
where NOx is the output of rule i, MFTri denotes the member-
ship function of the ith cluster of input Tr, MFTri represents the
membership function of the ith cluster of inputH, and so forth.mi, pi, qi, zi, and ci are coefficients to be determined by linearleast-squares estimation. The second step of NF construction
is adopting a five-layer MLP network to optimize coefficientsof linear membership function of output and also the Gaussianmembership function parameters of input. The NF structure isshown in Fig. 1b. In each layer, the operations are as follows:
Layer 1: Generate membership function of input data. Theoutput of neuron i is defined by
O1i ¼ μji Xð Þ ð4Þ
where j is the number of input and i denotes the membershipfunction index. X={Tr, H, S, W, T} represents a set of input.μji(X) is a fuzzy set associated with neuron i which is amembership function.Layer 2: Calculate firing strength Wi for the ith rule via
multiplication via “and” operator:
O2i ¼ wi ¼ μ1i Xð Þμ2i Xð Þμ3i Xð Þμ4i Xð Þμ5i Xð Þð5Þ
Layer 3: Compute the normalized firing strengths for the ith
neuron:
O3i ¼ wi ¼ wiX
i
wi
ð6Þ
Layer 4: Compute the contribution of the ith rule in themodel output based on the first-order TS-FLmethod:
O4i ¼ wi NOxð Þi ¼ wi miTr þ niH þ piS þ qiW þ ziT þ cið Þ
ð7Þ
Layer 5: Calculate the final output as the weighted averageof all rule outputs (aggregation):
O5i ¼ NOx
Xi
wi NOxð Þi ð8Þ
The NF parameters in Eq. 8 and the mem-bership function parameters were optimizedusing a hybrid algorithm, which is a combi-nation of the gradient decent and the least-squares method (Aqil et al. 2007).
Environ Sci Pollut Res
Efficiency criteria
Two statistical measures were used to evaluate the effective-ness of the ANN and NF models and their ability to makeaccurate predictions. The root mean square error (RMSE) iscalculated by:
RMSE ¼
ffiffiffiffiffiffiffiffiffiffiffiffiffiffiffiffiffiffiffiffiffiffiffiffiffiffiffiffiffiffiXi¼1
n
Y i −bY j
� �2n
vuuutð9Þ
where Y i; bY i and n are the measured data, the predicted data,and the number of measurements, respectively. RMSE indi-cates the discrepancy between measured and predicted values.The R2, coefficient of determination, was also used, which isgiven by:
R2 ¼ 1−
Xi
n
Y i−bY� �2Xi
n
Y i −Y� �2 ð10Þ
where Y is the mean of observed data. The best fit betweenmeasured and predicted values will give RMSE and R2 closeto 0 and 1, respectively.
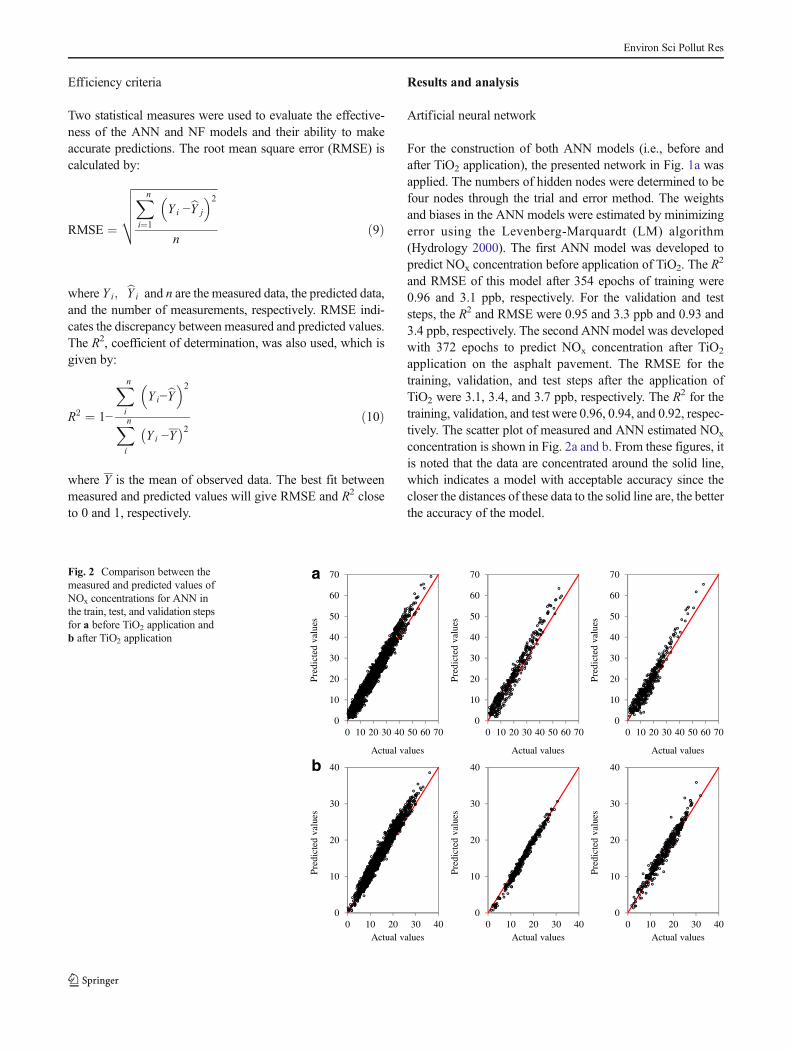
Results and analysis
Artificial neural network
For the construction of both ANN models (i.e., before andafter TiO2 application), the presented network in Fig. 1a wasapplied. The numbers of hidden nodes were determined to befour nodes through the trial and error method. The weightsand biases in the ANN models were estimated by minimizingerror using the Levenberg-Marquardt (LM) algorithm(Hydrology 2000). The first ANN model was developed topredict NOx concentration before application of TiO2. The R
2
and RMSE of this model after 354 epochs of training were0.96 and 3.1 ppb, respectively. For the validation and teststeps, the R2 and RMSE were 0.95 and 3.3 ppb and 0.93 and3.4 ppb, respectively. The second ANNmodel was developedwith 372 epochs to predict NOx concentration after TiO2
application on the asphalt pavement. The RMSE for thetraining, validation, and test steps after the application ofTiO2 were 3.1, 3.4, and 3.7 ppb, respectively. The R2 for thetraining, validation, and test were 0.96, 0.94, and 0.92, respec-tively. The scatter plot of measured and ANN estimated NOx
concentration is shown in Fig. 2a and b. From these figures, itis noted that the data are concentrated around the solid line,which indicates a model with acceptable accuracy since thecloser the distances of these data to the solid line are, the betterthe accuracy of the model.
0
10
20
30
40
50
60
70
0 10 20 30 40 50 60 70
Pre
dict
ed v
alue
s
Actual values
0
10
20
30
40
50
60
70
0 10 20 30 40 50 60 70
Pre
dict
ed v
alue
s
Actual values
0
10
20
30
40
50
60
70
0 10 20 30 40 50 60 70
Pre
dict
ed v
alue
s
Actual values
0
10
20
30
40
0 10 20 30 40
Pre
dict
ed v
alue
s
Actual values
0
10
20
30
40
0 10 20 30 40
Pre
dict
ed v
alue
s
Actual values
0
10
20
30
40
0 10 20 30 40
Pre
dict
ed v
alue
s
Actual values
a
b
Fig. 2 Comparison between themeasured and predicted values ofNOx concentrations for ANN inthe train, test, and validation stepsfor a before TiO2 application andb after TiO2 application
Environ Sci Pollut Res

Neuro-fuzzy
The first step for construction of the two NF models (i.e.,before and after TiO2 application) was the determination ofoptimal TS-FL clusters of five input data and rules. To devel-op an efficient TS-FL model with a reasonable number offuzzy “if-then” rules, the cluster radius was optimized. Basedon the minimum RMSE criteria for both models, a clusterradius of 0.5 and three rules were determined for the TS-FLmodel. In each rule, the parameters, mi, pi, qi, zi, and ci in theoutput membership function were estimated by the least-square error method. The second step was using ANNmodelsto estimate parameters in the Gaussian membership functionsand the coefficients of the model output (Eq. 8). A hybridalgorithm, which combines the least-squares method and theback-propagation gradient descent method, was employed(Zounemat-Kermani and Teshnehlab 2008).
The first NF model was developed to predict the NOx
concentration before TiO2 application. The R2 and RMSE of
this model after five epochs of training were 0.98 and 1.7 ppb,respectively. The R2 and RMSE of 0.97 and 1.8 ppb wereobtained in the validation step. The R2 and RMSE were 0.96and 2.1 ppb, respectively, in the test step. The second NFmodel with five epochs was developed to predict NOx con-centration after the application of TiO2. The RMSE for thetraining, validation, and testing steps after application of TiO2
were 2.1, 2.15, and 2.16 ppb, respectively. The coefficients ofdetermination for the train, validation, and test steps were
0.97, 0.95, and 0.94, respectively. The measured and NFestimated NOx concentration scatter plots are shown inFig. 3a, b. It can be observed that the data obtained from NFmodel are well correlated with the measured data points,which correspond to an excellent fit.
The RMSE and the coefficients of determination for ANNand NF models are presented in Table 2. By taking advantageof FL and ANN models, the NF models provided a slightly
Table 2 Fitting test pa-rameters for ANN andNF models
Criterion Step Model
ANN NF
Before application
R2 Train 0.96 0.98
RMSE 3.1 1.77
R2 Validation 0.95 0.97
RMSE 3.3 1.83
R2 Test 0.93 0.96
RMSE 3.4 2.11
After application
R2 Train 0.96 0.97
RMSE 3.1 2.1
R2 Validation 0.94 0.95
RMSE 3.4 2.15
R2 Test 0.92 0.94
RMSE 3.7 2.16
0
10
20
30
40
50
60
70
0 10 20 30 40 50 60 70
Pre
dict
ed v
alue
s
Actual values
0
10
20
30
40
50
60
70
0 10 20 30 40 50 60 70
Pre
dict
ed v
alue
s
Actual values
0
10
20
30
40
50
60
70
0 10 20 30 40 50 60 70
Pre
dict
ed v
alue
s
Actual values
0
10
20
30
40
0 10 20 30 40
Pre
dict
ed v
alue
s
Actual values
0
10
20
30
40
0 10 20 30 40
Pre
dict
ed v
alue
sActual values
0
10
20
30
40
0 10 20 30 40
Pre
dict
ed v
alue
s
Actual values
a
b
Fig. 3 Comparison between themeasured and predicted values ofNOx concentrations for NF in thetrain, test, and validation steps fora before TiO2 application and bAfter TiO2 application
Environ Sci Pollut Res

better fitting to NOx data than ANN model in the training,validation, and testing steps. Both models outperformed thestatistical model initially used by the authors (Dylla et al.2013).
Parametric study
The photocatalytic efficiency depends on several environmen-tal factors and operating conditions, which makes it verycomplex to investigate. A parametric study was conductedusing the NF models to study the effects of different param-eters on NOx reduction efficiency. The NF model was useddue to its considerable accuracy over ANN in the training,validation, and test steps. The objective of the parametricstudy was to evaluate the effect of each factor on the photo-catalytic degradation of NOx. To achieve this objective, asensitivity analysis was carried out in which each parameterwas varied between the minimum and maximum level whilethe other parameters were kept constant at the mean value.The minimum, maximum, and mean values of each parameterare presented in Table 1.
Effect of traffic flow
The first parameter investigated in this study was the trafficflow. Figure 4 shows a direct relationship between the numberof vehicles per 5 min and NOx concentrations. It should benoted that in order to evaluate the effect of traffic flow on theNOx reduction based on the NFmodels, other parameters suchas humidity, solar radiation, wind speed, and ambient temper-ature were kept constant at their mean values. As expected,increasing traffic flow increases NOx concentration as morepollutants are emitted to the environment. The developedmodel predicted that the TiO2 photocatalytic coating resultedin a significant reduction of NOx concentration at the differenttraffic levels. The model predicted approximately 60 % NOx
reduction efficiency at the maximum number of vehicles per5 min.
Effect of relative humidity
Figure 5 shows the effect of relative humidity on NOx con-centrations per 5 min before and after the application of TiO2
0
5
10
15
20
25
30
35
Max Mean Min
Con
cent
ratio
n (p
pb)
Number of Vehicle ( V/5 min)
Before AfterFig. 4 Effect of traffic levels onNOx concentration
0
5
10
15
20
25
Max Mean Min
Con
cent
ratio
n (p
pb)
Humidity
Before AfterFig. 5 Effect of humidity onNOx
Concentration
Environ Sci Pollut Res

based on the NFmodel. As shown in this figure, increasing therelative humidity increases NOx concentrations in bothmodels. Nevertheless, NOx concentrations before applicationare higher than after application at the different humiditylevels indicating that the TiO2 photocatalytic layer is reducingNOx concentrations in ambient air. Figure 5 shows a cleartrend, as the humidity increases, NOx concentration increases.This is mainly due to the excessive water vapor building onthe TiO2 catalyst surface. Excessive water inhibits the photo-catalytic reaction as it competes with pollutants for adsorptionsites on the surface. This is in agreement with laboratory testresults (Hassan et al. 2012).
Effect of solar radiation
Photocatalytic oxidation necessitates UV light, part of thesolar radiation spectrum, for the reaction to take place(Fujishima et al. 2000). The wavelength is the main factorinfluencing photocatalytic activity; in contrast, the strength ofphoton flux affects the rate of degradation (Fujishima et al.
2000; Zhao and Yang 2003). Therefore, an increase in UVirradiance is expected to increase photocatalytic NOx reduc-tion efficiency. Increasing solar radiation from minimum(0 W/m2) to maximum level (858 W/m2) significantly in-creased the photocatalytic reaction rate, which resulted inhigher NOx reduction efficiency (Fig. 6). Based on the NFmodels, at a solar radiation of 858 W/m2, NOx reductionefficiency per 5 min was approximately 77 %.
Effect of wind speed
Figure 7 presents the effect of wind speed on NOx concentra-tion per 5-min interval before and after application of TiO2. Asshown in this figure, increasing wind speed decreases NOx
concentration. This can be attributed to the fact that higherwind speed will help disperse the pollutants at the pavementlevel at a faster rate. Based on the model, at the maximumwind speed (4 m/s), NOx reduction efficiency per 5 min wasapproximately 42 % which is in agreement with laboratoryresults. It should be noted that higher wind speed would
0
5
10
15
20
25
Max Mean Min
Con
cent
ratio
n (p
pb)
Solar Radiation (W/m^2)
Before AfterFig. 6 Effects of solar radiationon NOx concentration
0
5
10
15
20
Max Mean Min
Con
cent
ratio
n (p
pb)
Wind Speed (m/s)
Before AfterFig. 7 Effects of a solar radiationand b wind speed on NOx
Concentration
Environ Sci Pollut Res

reduce the time available for the photocatalytic reaction totake place (Sleiman et al. 2009; Hassan et al. 2012).
Summary and conclusions
This study improves the previous regression models devel-oped by authors to assess and predict photocatalytic pave-ment’s field efficiency by employing artificial intelligencemodels. Both artificial neural network (ANN) and neuro-fuzzy (NF) models were used to predict NOx concentrationsin the air as a function of traffic count (Tr) and climaticconditions including humidity (H), solar radiation (S), andwind speed (W) before and after the application of TiO2 onthe pavement surface. Data were collected from a full-scalefield study of a photocatalytic asphalt pavement located inBaton Rouge, LA.
Results showed that the NF model provided betterfitting to NOx measurements than ANN model in thetraining, validation, and testing steps. The R2 andRMSE of NF model for the train, validation, and teststeps were higher than ANN model. The R2 of the NFmodel was 0.98, 0.97, and 0.96, respectively for train,validation, and test steps before TiO2 application. TheRMSE of the NF model was 1.77, 1.83, and 2.11 ppb,respectively, for train, validation, and test steps whichwere considerably lower than the RMSE obtained byANN model.
Results of a parametric study showed that the traffic level,relative humidity, ambient air temperature, solar radiation, andwind speed have significant effects on the performance ofTiO2 in NOx degradation. Traffic level, relative humidity,and solar radiation had the most significant effects on photo-catalytic NOx reduction. The increase in wind speed andrelative humidity negatively affected the effectiveness ofNOx reduction efficiency. However, the increase in UV lightintensity improved NOx removal efficiency of the surfacecoating. The model predicted approximately 60 % NOx re-duction efficiency at the maximum number of vehicles per5 min, 77 % efficiency at solar radiation of 858 W/m2, 42 %efficiency at the maximum wind speed (4 m/s). Based on theresults obtained in this study, further research is needed toassess the effects of additional factors including the impact ofvehicle classification and vehicle activity. In addition, thedurability of the photocatalytic coating in the field should beassessed.
Acknowledgments This work was funded through a grant from theGulf Coast Research Center for Evacuation and Transportation Resilien-cy. The authors would like to acknowledge PURETI for donating thematerials needed for the construction of the field study and the support ofLouisiana Transportation Research Center (LTRC) for granting access totheir laboratory.
References
Abdul-Wahab SA, Al Alawi SM (2002) Assessment and prediction oftropospheric ozone concentration levels using artificial neural net-works. Environ Model Softw 17(3):219–228
Agirre-Basurko E, Ibarra-Berastegi G, Madariaga I (2006) Regressionand multilayer perceptron-based models to forecast hourly O3 andNO2 levels in the Bilbao area. EnvironModel Softw 21(4):430–446
Akkoyunlu A, Yetilmezsoy K, Erturk F, Oztemel E (2010) A neuralnetwork-based approach for the prediction of urban SO2 concentra-tions in the Istanbul metropolitan area. Int J Environ Pollut 40(4):301–321
Aqil M, Kita I, Yano A, Nishiyama S (2007) Analysis and prediction offlow from local source in a river basin using a neuro-fuzzy model-ling tool. J Environ Manag 85(1):215–223
ASCE Task Committee on Application of Artificial Neural Networks inHydrology (2000) Artificial neural network in hydrology, part I andII. J Hydraul Eng 5(2):115–137
Asghari MA, Nadiri AA, Fijani E (2010) Spatial prediction offluorideconcentration using artificial neural networks and geostaticmodels. J Water Soil Sci 19(1):129–145
Barai SV, Dikshit AK, Sharma S (2007) Neural network models for airquality prediction: a comparative study. Soft Comput Ind Appl 39:290–305
Bardossy A, Disse M (1993) Fuzzy rule-based models for infiltration.Water Resour Res 29(2):373–382
Beeldens A (2006) An environmental friendly solution for air purificationand self-cleaning effect: the application of TiO2 as photocatalyst inconcrete. In: Proceedings of Transport Research Arena, Göteborg,Belgian Road Research Centre, Sweden
Beeldens A (2008) Air purification by pavement blocks: final results ofthe research at the BRRC. In: Transport Research Arena Europe,Ljubljana
Bengtsson N, Castellote M (2010) Photocatalytic activity for NO degra-dation by construction materials: parametric study and multivariablecorrelations. J Adv Oxid Technol 13(3):341–349
Berdahl P, Akbari H (2008) Evaluation of titanium dioxide as aphotocatalyst for removing air pollutants. California EnergyCommission. PIER Energy-Related Environmental ResearchProgram
Brunelli U, Piazza V, Pignato L, Sorbello F, Vitabile S (2007) Two-daysahead prediction of daily maximum concentrations of SO2, O3,PM10, NO2, CO in the urban area of Palermo, Italy. AtmosEnviron 41:2967–2995
Cai M, Yin Y, Xie M (2009) Prediction of hourly air pollutant concen-trations near urban arterials using artificial neural network approach.Transp Res D 14:32–41
Carnevale C, Finzi G, Pisoni E, Volta M (2009) Neuro-fuzzy and neuralnetwork systems for air quality control. Atmos Environ 43:4811–4821
Chen M, Chu J-W (2011) NOx photocatalytic degradation on activeconcrete road surface—from experiment to real-scale application. JClean Prod 19(11):1266–1272
Chen MS, Wang SW (1999) Fuzzy clustering analysis for optimizingfuzzy membership functions. Fuzzy Sets Syst 103(2):239–254
Dylla H, Hassan MM (2012a) Characterization of nanoparticle releaseduring construction of photocatalytic pavements using engineerednanoparticles. J Nanoparticle Res 14:4
Dylla H, Hassan MM, Osborn D (2012b) Field evaluation of photocata-lytic concrete pavements’ ability to remove nitrogen oxides. JTransp Res Rec 2290:154–160
Dylla H, Asadi S, Hassan M (2013) Evaluating photocatalytic asphaltpavement effectiveness in real world environments through devel-oping models: a statistical and kinetic study. In: 88th AmericanAsphalt Pavement Technology Annual Meeting, Denver, CO
Environ Sci Pollut Res

Fujishima A, Rao TN, Tryk DA (2000) Titanium dioxide photocatalysis.J Photochem Photobiol C: Photochem Rev 1(1):1–21
Gautam AK, Chelani AB, Jain VK, Devotta S (2008) A new scheme topredict chaotic time series of air pollutant concentrations usingartificial neural network and nearest neighbor searching. AtmosEnviron 42:4409–4417
Hassan M, Mohammad L, Asadi S, Dylla H, Cooper S (2012) Sustainablephotocatalytic asphalt pavements for mitigation of nitrogen oxide andsulfur dioxide vehicle emissions. J Mater Civ Eng 25(3):365–371
He F, Ma C (2010) Modeling greenhouse air humidity by means ofartificial neural network and principal component analysis.Comput Electron Agric 71:S19–S23. doi:10.1016/j.compag.2009.07.011
Hooyberghs J, Mensink C, Dumont G, Fierens F, Brasseur O (2005) Aneural network forecast for daily average PM10 concentrations inBelgium. Atmos Environ 39:3279–3289
Karppinen A, Kukkonen J, Elolähde T, Konttinen M, Koskentalo T,Rantakrans E (2000) A modelling system for predicting urban airpollution: model description and applications in the Helsinki metro-politan area. Atmos Environ 34:3723–3733
Li L, Qian C (2009) A lab study of photo-catalytic oxidation and removalof nitrogen oxides in vehicular emissions and its fieldwork onNanjin no.3 bridge of Yangtze River. J Pavement Resour Technol2(5):218–222
Lin CH, Wu YL (2003) Semi-statistical model for evaluating the effectsof source emissions and meteorological effects on daily averageNOx concentrations in south Taiwan. Atmos Environ 37:2051–2059
Lin J, Yu D (2008) Traffic-related air quality assessment for open roadtolling highway facility. J Environ Manag 88:962–969
Maggos T, Bartiz J, Liakou M, Gobin C (2007) Photocatalytic degrada-tion of NOx gases using TiO2-containing paint: A real scale study. JHazard Mater 146:668–673
Maggos T, Plassais A, Bartzis JG, Vasilakos C, Moussiopoulos A,Bonafous L (2008) Photocatalytic degradation of NOx in a pilotstreet canyon configuration using TiO2-mortar panels. EnvironMonit Assess 136:35–44
Maier HR, Dandy GC (2000) Neural network for the prediction andforecasting water resources variables: a review of modeling issuesand applications. Environ Model Softw 15(1):101–124
Maier HR, Jain A, Dandy GC, Sudheer KP (2010) Methods used for thedevelopment of neural networks for the prediction of water resourcevariables in river systems: current status and future directions.Environ Model Softw 25(8):891–909
Moussiopoulos N, Barmpas Ph, Ossanlis I, Bartiz J (2008) Comparisonof numerical and experimental results for the evaluation of thedepollution effectiveness of photocatalytic coverings in street can-yons. 13 (3):357–368
Nadiri AA, Chitsazan N, Tsai F, Moghaddam A (2013a) Bayesian artifi-cial intelligence model averaging for hydraulic conductivity estima-tion. J Hydrol Eng 19(3):520–532. doi:10.1061/(ASCE)HE.1943-5584.0000824
Nadiri AA, Fijani E, Tsai F, Moghaddam AA (2013b) Supervised com-mittee machine with artificial intelligence for prediction of fluorideconcentration. J Hydroinformatics 15(4):1474–1490
Nayak PC, Sudheer KP, Rangan DM, Ramasastri KS (2004) A neuro-fuzzy computing technique for modeling hydrological time series. JHydrol 291(1–2):52–66
Nourani V, Asgharimogaddam A, Nadiri AA (2008) An ANN-basedmodel for spatiotemporal groundwater level forecasting. HydrolProcess 22:5054–5066
Palani S, Liong SY, Tkalich P (2008) An ANN application for waterquality forecasting. Mar Pollut Bull 56(9):1586–1597
Paschalidou AK, Karakitsios S, Kleanthous S, Kassomenos PA (2011)Forecasting hourly PM10 concentration in Cyprus through artificialneural networks and multiple regression models: implications tolocal environmental management. Environ Sci Pollut Res 18(2):316–327
Patricio P, Jorge R (2006) An integrated neural network model for PM10forecasting. Atmos Environ 430:2845–2851
Pires JCM, Gonçalves B, Azevedo FG, Carneiro AP, Rego N,Assembleia AJB, Lima JFB, Silva PA, Alves C, Martins FG(2012) Optimization of artificial neural network models throughgenetic algorithms for surface ozone concentration forecasting.Environ Sci Pollut Res 19:3228–3234
Pulido-Calvo I, Gutiérrez-Estrada JC (2009) Improved irrigation waterdemand forecasting using a soft-computing hybrid model. BiosystEng 102(2):202–218
Salazar-Ruiz E, Ordieres JB, Vergara EP, Capuz-Rizo SF (2008)Development and comparative analysis of tropospheric ozone pre-diction models using linear and artificial intelligence-based modelsin Mexicali, Baja California (Mexico) and Calexico, California(US). Environ Model Softw 23(8):1056–1069. doi:10.1016/j.envsoft.2007.11.009
Sharma N, Chaudhry KK, Chalapati Rao CV (2004) Vehicular pollutionprediction modeling: a review of highway dispersion models.Transp Rev 24(4):409–435
SleimanM, Conchon P, Ferronato C, Chovelon JM (2009) Photocatalyticoxidation of toluene at indoor air levels (ppbv): towards a betterassessment of conversion, reaction intermediates andmineralization.Appl Catal B Environ 86(3–4):159–165
Sousa S, Martins F, Alvimferraz M, Pereira M (2007) Multiple linearregression and artificial neural networks based on principal compo-nents to predict ozone concentrations. Environ Model Softw 22(1):97–103. doi:10.1016/j.envsoft.2005.12.002
Sugeno M, Yasukawa T (1993) A fuzzy logic-based approach to qualita-tive modelling. IEEE Trans Fuzzy Syst 1(1):7–31
Takagi T, Sugeno M (1985) Fuzzy identification of systems and itsapplication to modeling and control. IEEE Trans Syst Man Cybern15(1):116–132
Venturini L, Bacchi M (2009) Research, design, and development of aphotocatalytic asphalt pavement. Proceedings of 2nd InternationalConference on Environmentally Friendly Roads. ENVIROAD,Warsaw, Poland
Yetilmezsoy K, Abdul-Wahab S (2012) A prognostic approach based onfuzzy-logic methodology to forecast PM10 levels in Khaldiya resi-dential area, Kuwait. Aerosol Air Qual Res 12:1217–1236
Yildirim Y, Bayramoglu M (2006) Adaptive neuro-fuzzy based model-ling for prediction of air pollution daily levels in city of Zonguldak.Chemosphere 63:1575–1582
Zhao J, Yang X (2003) Photocatalytic oxidation of indoor air purification:a literature review. Build Environ 38:645–654
Zounemat-Kermani M, Teshnehlab M (2008) Using adaptive neuro-fuzzy inference system for hydrological time series prediction.Appl Soft Comput 8(2):928–936
Environ Sci Pollut Res