Embed Size (px)
Citation preview
Articles
www.thelancet.com Published online January 30, 2012 DOI:10.1016/S0140-6736(11)61710-8 1
Published OnlineJanuary 30, 2012DOI:10.1016/S0140-6736(11)61710-8
See Online/CommentDOI:10.1016/S0140-6736(11)61926-0
Primary Care Research Group, Institute of Health Services Research (C E Clark FRCP, Prof R S Taylor PhD, Prof J L Campbell MD), Vascular Medicine, Peninsula NIHR Clinical Research Facility and Institute of Biomedical and Clinical Science (Prof A C Shore PhD), and Peninsula Collaboration for Leadership in Applied Health Research and Care (O C Ukoumunne PhD), Peninsula College of Medicine and Dentistry, University of Exeter, Exeter, Devon, UK
Correspondence to:Dr Christopher E Clark, Primary Care Research Group, Institute of Health Services Research, Peninsula College of Medicine and Dentistry, University of Exeter, Exeter, Devon EX1 2LU, [email protected]
Association of a diff erence in systolic blood pressure between arms with vascular disease and mortality: a systematic review and meta-analysisChristopher E Clark, Rod S Taylor, Angela C Shore, Obioha C Ukoumunne, John L Campbell
SummaryBackground Diff erences in systolic blood pressure (SBP) of 10 mm Hg or more or 15 mm Hg or more between arms have been associated with peripheral vascular disease and attributed to subclavian stenosis. We investigated whether an association exists between this diff erence and central or peripheral vascular disease, and mortality.
Methods We searched Medline, Embase, Cumulative Index to Nursing and Allied Health Literature, Cochrane, and Medline In Process databases for studies published before July, 2011, showing diff erences in SBP between arms, with data for subclavian stenosis, peripheral vascular disease, cerebrovascular disease, cardiovascular disease, or survival. We used random eff ects meta-analysis to combine estimates of the association between diff erences in SBP between arms and each outcome.
Findings We identifi ed 28 eligible studies for review, 20 of which were included in our meta-analyses. In fi ve invasive studies using angiography, mean diff erence in SBP between arms was 36·9 mm Hg (95% CI 35·4–38·4) for proven subclavian stenosis (>50% occlusion), and a diff erence of 10 mm Hg or more was strongly associated with subclavian stenosis (risk ratio [RR] 8·8, 95% CI 3·6–21·2). In non-invasive studies, pooled fi ndings showed that a diff erence of 15 mm Hg or more was associated with peripheral vascular disease (nine cohorts; RR 2·5, 95% CI 1·6–3·8; sensitivity 15%, 9–23; specifi city 96%, 94–98); pre-existing cerebrovascular disease (fi ve cohorts; RR 1·6, 1·1–2·4; sensitivity 8%, 2–26; specifi city 93%, 86–97); and increased cardio vascular mortality (four cohorts; hazard ratio [HR] 1·7, 95% CI 1·1–2·5) and all-cause mortality (HR 1·6, 1·1–2·3). A diff erence of 10 mm Hg or higher was associated with peripheral vascular disease (fi ve studies; RR 2·4, 1·5–3·9; sensitivity 32%, 23–41; specifi city 91%, 86–94).
Interpretation A diff erence in SBP of 10 mm Hg or more, or of 15 mm Hg or more, between arms might help to identify patients who need further vascular assessment. A diff erence of 15 mm Hg or more could be a useful indicator of risk of vascular disease and death.
Funding Royal College of General Practitioners, South West GP Trust, and Peninsula Collaboration for Leadership in Applied Health Research and Care.
IntroductionPeripheral vascular disease is a risk factor for future cardiovascular events and mortality,1 and it is associated with reduced arterial pressures in legs.2,3 Early detection of the disease is important because interventions to promote smoking cessation, lower blood pressure, or off er statin therapy can reduce mortality.4–6 Most cases, however, are clinically silent,7 and gold-standard non-invasive identifi cation of this disease requires detection of a reduced ankle-brachial pressure index at rest or after a stress test.8 This measurement requires time, experience, and training;9 it is not routinely undertaken in primary-care assessment of hypertensive patients and is not proposed within the UK vascular check programme.10,11
Data suggest that a diff erence in systolic blood pressure (SBP) of 10 mm Hg or more or of 15 mm Hg or more between arms might, like a reduced ankle-brachial pressure, suggest poor prognosis.12–15 Researchers have linked a diff erence of more than 15 mm Hg with subclavian stenosis14,16,17 and atherosclerotic plaque,18,19 although no radiological investigation of atherosclerotic lesions in
unselected populations has been undertaken. The latest guidance from the European Society of Hypertension and European Society of Cardiology advises that a diff erence between arms is due to peripheral vascular disease.20 Although these guidelines are the fi rst to identify the disorder as the pathological basis for diff erences, no evidence is cited to justify this statement and thus it seems to be based on consensus (Dominiczak, A, University of Glasgow, and Parati, G, Università degli Studi Milano-Bicocca, personal communications).
The new National Institute for Health and Clinical Excellence (NICE) clinical guideline for hypertension21 states that a diff erence of less than 10 mm Hg can be regarded as normal; however, a diff erence of more than 20 mm Hg between arms is unusual, occurring in less than 4% of people and usually associated with underlying vascular disease. Our previous meta-analysis of studies of opportunistic populations at low risk of bias22 showed a pooled prevalence for a diff erence of 20 mm Hg or more of 4·2%, but we also reported a prevalence of 19·6% for a diff erence of 10 mm Hg or more. The NICE guideline21
Articles
2 www.thelancet.com Published online January 30, 2012 DOI:10.1016/S0140-6736(11)61710-8
does not address diff erences of 10–20 mm Hg, perhaps because their clinical signifi cance is unknown.
Bilateral brachial blood-pressure measurements can be easily done and are recommended in assessment of new hypertensive patients.23 Detection of a diff erence in SBP between arms could be a pragmatic way to select patients at high risk of asymptomatic peripheral vascular disease in primary care. Although the need to check blood pressure in both arms is recognised in present guidelines,21,23 the advice is not followed by most UK general practitioners,24 which could be because of inertia in adoption of the workload25 or because a clearly presented synthesis of the evidence for this intervention is lacking.26
How diff erences are measured is important; a simul-taneous method obtaining repeated pairs of measure-ments with one or two automated sphygmomanometers avoids overestimation of prevalence.27 However, this method needs additional resources, and many studies have used a pragmatic sequential measurement protocol22 that can still detect the probable presence of diff erences between arms.28
We aimed to establish whether a diff erence in SBP between arms is associated with ipsilateral angio-graphically proven subclavian stenosis on the side of the arm with the lowest pressure, with peripheral or cardiovascular disease, and with an increased risk of cardiovascular-related or all-cause mortality.
MethodsSearch strategy and selection criteriaWe undertook a systematic review in accordance with recognised methods.29 We searched the Medline, Embase, Cumulative Index to Nursing and Allied Health Literature, Cochrane Library, and Medline In Process databases for reports published between each database’s start date, and July 31, 2011. We used various search terms (webappendix). We searched one author’s (CEC) reference archive and reference lists of included primary studies for additional
studies. Included study authors were contacted for further information and unpublished data if necessary.
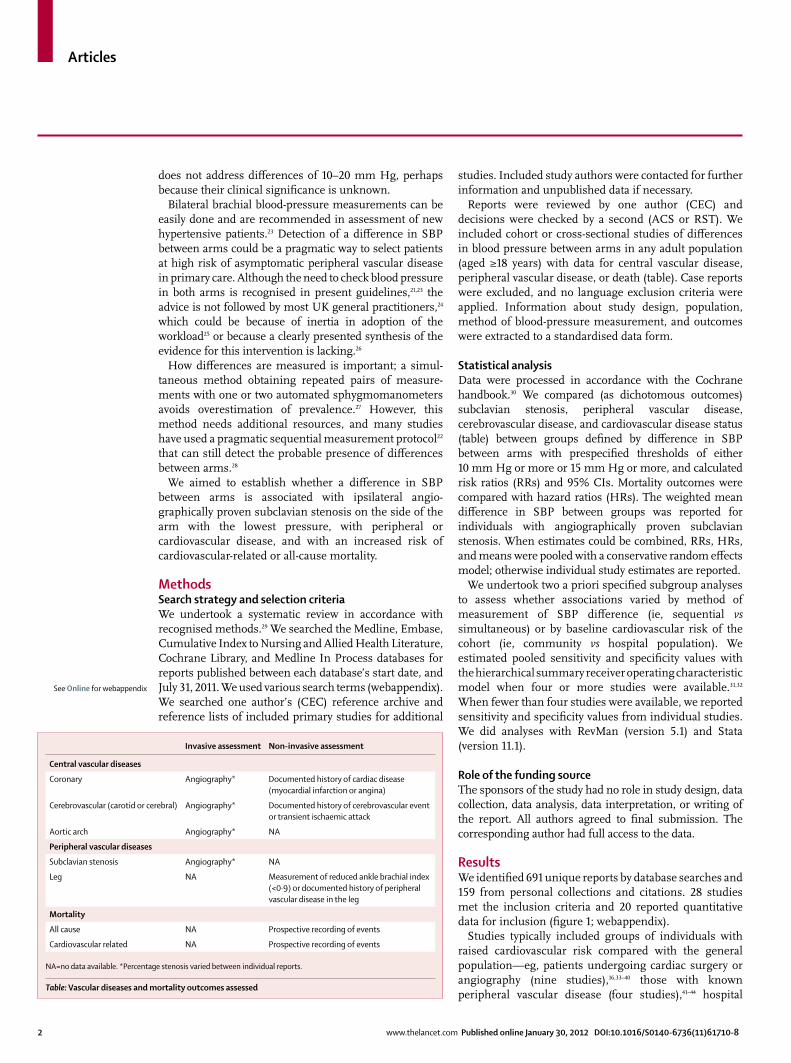
Reports were reviewed by one author (CEC) and decisions were checked by a second (ACS or RST). We included cohort or cross-sectional studies of diff erences in blood pressure between arms in any adult population (aged ≥18 years) with data for central vascular disease, peripheral vascular disease, or death (table). Case reports were excluded, and no language exclusion criteria were applied. Information about study design, population, method of blood-pressure measurement, and outcomes were extracted to a standardised data form.
Statistical analysisData were processed in accordance with the Cochrane handbook.30 We compared (as dichotomous outcomes) subclavian stenosis, peripheral vascular disease, cerebrovascular disease, and cardiovascular disease status (table) between groups defi ned by diff erence in SBP between arms with prespecifi ed thresholds of either 10 mm Hg or more or 15 mm Hg or more, and calculated risk ratios (RRs) and 95% CIs. Mortality outcomes were compared with hazard ratios (HRs). The weighted mean diff erence in SBP between groups was reported for individuals with angiographically proven subclavian stenosis. When estimates could be combined, RRs, HRs, and means were pooled with a conservative random eff ects model; otherwise individual study estimates are reported.
We undertook two a priori specifi ed subgroup analyses to assess whether associations varied by method of measurement of SBP diff erence (ie, sequential vs simultaneous) or by baseline cardiovascular risk of the cohort (ie, community vs hospital population). We estimated pooled sensitivity and specifi city values with the hierarchical summary receiver operating characteristic model when four or more studies were available.31,32 When fewer than four studies were available, we reported sensitivity and specifi city values from individual studies. We did analyses with RevMan (version 5.1) and Stata (version 11.1).
Role of the funding sourceThe sponsors of the study had no role in study design, data collection, data analysis, data interpretation, or writing of the report. All authors agreed to fi nal submission. The corresponding author had full access to the data.
ResultsWe identifi ed 691 unique reports by database searches and 159 from personal collections and citations. 28 studies met the inclusion criteria and 20 reported quantitative data for inclusion (fi gure 1; webappendix).
Studies typically included groups of individuals with raised cardiovascular risk compared with the general population—eg, patients undergoing cardiac surgery or angiography (nine studies),16,33–40 those with known peripheral vascular disease (four studies),41–44 hospital
See Online for webappendix
Invasive assessment Non-invasive assessment
Central vascular diseases
Coronary Angiography* Documented history of cardiac disease (myocardial infarction or angina)
Cerebrovascular (carotid or cerebral) Angiography* Documented history of cerebrovascular event or transient ischaemic attack
Aortic arch Angiography* NA
Peripheral vascular diseases
Subclavian stenosis Angiography* NA
Leg NA Measurement of reduced ankle brachial index (<0·9) or documented history of peripheral vascular disease in the leg
Mortality
All cause NA Prospective recording of events
Cardiovascular related NA Prospective recording of events
NA=no data available. *Percentage stenosis varied between individual reports.
Table: Vascular diseases and mortality outcomes assessed

Articles
www.thelancet.com Published online January 30, 2012 DOI:10.1016/S0140-6736(11)61710-8 3
inpatients (two studies),45,46 or cardiology and vascular outpatients (four studies).13,14,47,48 Investigators of nine studies collected data in primary-care settings or from community-based populations.12,15,17,18,49–53 Two studies were of the same cohort; therefore, data for objective assessment of peripheral vascular disease were used in cross-sectional analyses51 and prospective data in survival analyses.12 Researchers of 12 studies (13 cohorts) used a method of repeated simultaneous bilateral blood-pressure measurements,14,16,37,39,45–47,49–53 and seven repeated sequential measurements.12–15,17,18,41 The rest used pairs of brachial blood-pressure measurements33,34,44,48 or methods that were unclear.35,36,38,40,42,43
From fi ve case series of patients with angiographically proven asymptomatic subclavian stenosis (defi ned as >50% occlusion for two studies,35,43 but not defi ned for the other three; 135 cases),39,40,44 we estimated mean blood pressure to be 36·9 mm Hg (95% CI 35·4–38·4) lower in the arm with stenosis than in the other. The diff erence was similar in two other studies that could not be pooled (41 mm Hg33 and 21 mm Hg36 ); one further study37 showed a mean intra-arterial pressure gradient of 28 mm Hg (95% CI 14·4–41·6) across stenoses of more than 75% in ten patients. A subgroup analysis showed no variation in the mean diff erence between studies with repeated simultaneous blood-pressure measurements and those with sequential single measurements (mean 33·5 mm Hg vs 37·1 mm Hg; mean diff erence 3·6 mm Hg, 95% CI –3·9 to 11·1, p>0·20).39
Investigators of three studies,34,38,42 all using a sequential method of measurement, recorded prevalence of subclavian stenosis at angiography and between-arm diff erences. We could pool two of these datasets (n=532), to give an RR of 8·8 (95% CI 3·6–21·2, p<0·0001) for subclavian stenosis of more than 50% occlusion at angiography and a diff erence of 10 mm Hg or more.34,42 English and colleagues34 analysed diff erences of 20 mm Hg or higher in 458 patients to give an RR of 7·4 (2·9–18·7, p<0·0001). Sensitivity was 65% (95% CI 35–86) and specifi city 85% (82–88) for identifi cation of subclavian stenosis with a diff erence of 10 mm Hg or more; sensitivity was 35% (14–62) and specifi city 94% (92–96) with a diff erence of 20 mm Hg or higher. In Calligaro and co-workers’ investigation,42 sensitivity was 75% (19–99) and specifi city 75% (58–88) for identifi cation of subclavian stenosis with a cutoff of 10 mm Hg or higher. Osborn and colleagues38 reported that all four patients with a diff erence of 15 mm Hg or higher had a subclavian stenosis of more than 50% occlusion compared with none of 55 with a diff erence less than 15 mm Hg.
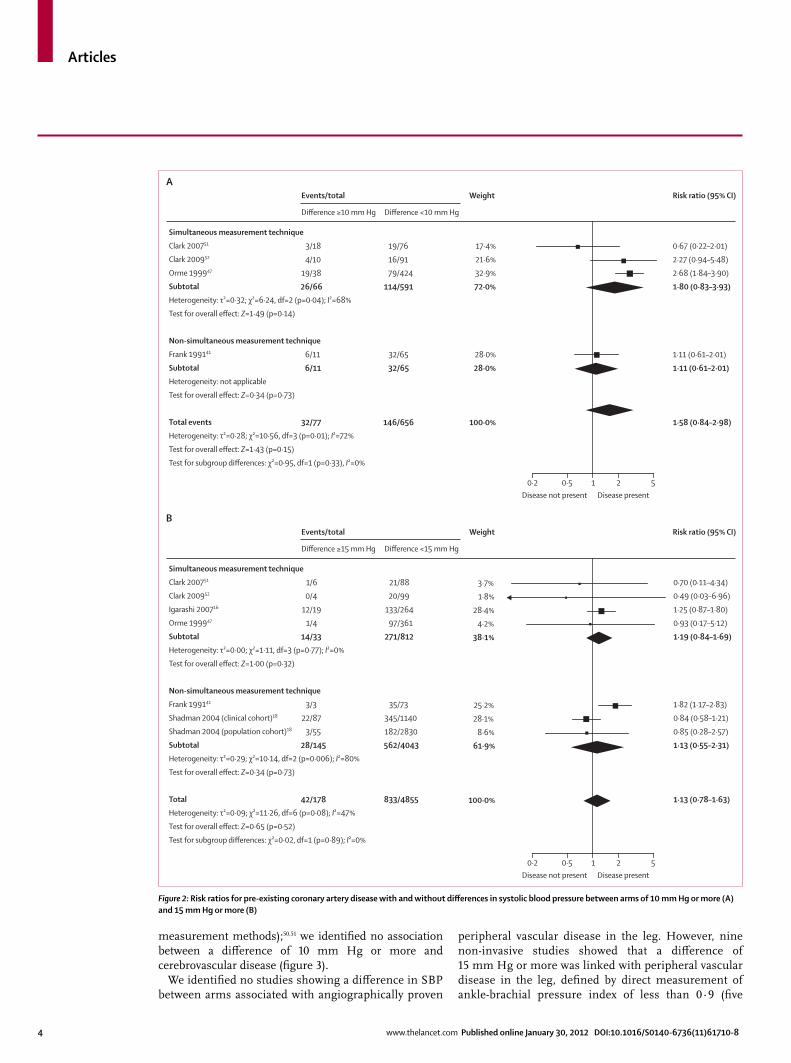
Only one study reported coronary angiogram fi ndings and diff erences in SBP between arms.16 Disease of at least one coronary artery was identifi ed in 12 (63%) of 19 patients with diff erences of 15 mm Hg or more, compared with 153 (58%) of 264 patients with diff erences of less than 15 mm Hg (RR 1·1, 95% CI 0·8–1·6, p=0·64).
Seven non-invasive cohorts reported an association between a diff erence between arms and history of coronary artery disease. When we compared groups with and without a diff erence of 15 mm Hg or higher, the pooled RR across six studies16,18,41,47,50,51 showed no signifi cant association (fi gure 2). Subgroup analysis showed that method of measurement of blood-pressure diff erence (simultaneous vs non-simultaneous) had no eff ect on this association (fi gure 2). When we restricted analysis to the four community-recruited cohorts,18,47,50,51 the fi ndings did not change (data not shown). Investigators of four non-invasive studies estimated the association between a diff erence of 10 mm Hg or more and coronary artery disease;41,47,50,51 when pooled, we noted little evidence for an association (fi gure 2). Other studies that could not be included in a meta-analysis did not show an association between a diff erence and ischaemic heart disease (data not shown).15,45,46 One angiographic study33 (n=228) showed an association between a diff erence in SBP between arms of 15 mm Hg or more and aortic arch disease (RR 3·7, 95% CI 2·6–11·2, p<0·0001) and carotid stenosis (occlusion of more than 80%; RR 3·0, 95% CI 1·9–4·9, p<0·0001).
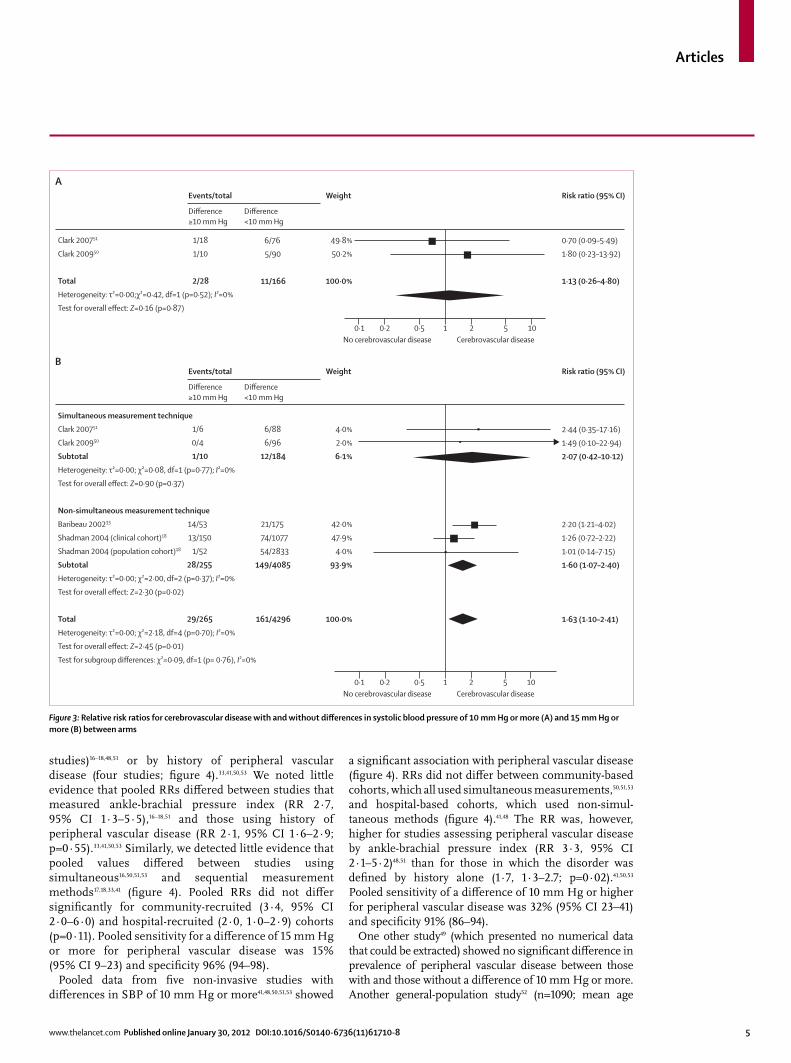
Five cohorts (four non-invasive studies)18,33,50,51 reported prevalence of previous cerebrovascular accident or transient ischaemic attack (from clinical records). Pooled analysis showed a signifi cant association between cerebrovascular disease and diff erences of 15 mm Hg or more (fi gure 3). Pooled sensitivity was 8% (95% CI 2–26) and specifi city 93% (86–97). However, we noted no association when analysis was restricted to non-invasive studies using a simultaneous measurement method (fi gure 3).50,51 Data for a diff erence of 10 mm Hg or more were available from two studies (both using simultaneous
Figure 1: Study selection
691 records identifiedby database search
159 records identifiedfrom personal archivesand citation lists
850 records screened740 records excluded
on the basis of titleand abstract
82 full-text articlesexcluded
6 reports not retrieved65 no data relevant to
review5 letters or editorials3 commentaries2 case reports1 systematic review
8 reports not suitablefor meta-analysis
110 full-text articlesassessed for eligibility
28 studies included inqualitative synthesis
20 studies included inquantitative synthesis(meta-analysis)
Articles
4 www.thelancet.com Published online January 30, 2012 DOI:10.1016/S0140-6736(11)61710-8
measurement methods);50,51 we identifi ed no association between a diff erence of 10 mm Hg or more and cerebrovascular disease (fi gure 3).
We identifi ed no studies showing a diff erence in SBP between arms associated with angiographically proven
peripheral vascular disease in the leg. However, nine non-invasive studies showed that a diff erence of 15 mm Hg or more was linked with peripheral vascular disease in the leg, defi ned by direct measurement of ankle-brachial pressure index of less than 0·9 (fi ve
Disease not present Disease present0·2 0·5 1 2 5
Simultaneous measurement technique
Clark 200751
Clark 200952
Orme 199947
Subtotal
Heterogeneity: τ²=0·32; χ²=6·24, df=2 (p=0·04); I²=68%
Test for overall effect: Z=1·49 (p=0·14)
Non-simultaneous measurement technique
Frank 199141
Subtotal
Heterogeneity: not applicable
Test for overall effect: Z=0·34 (p=0·73)
Total events
Heterogeneity: τ²=0·28; χ²=10·56, df=3 (p=0·01); I²=72%
Test for overall effect: Z=1·43 (p=0·15)
Test for subgroup differences: χ²=0·95, df=1 (p=0·33), I²=0%
3/18
4/10
19/38
26/66
6/11
6/11
32/77
19/76
16/91
79/424
114/591
32/65
32/65
146/656
17·4%
21·6%
32·9%
72·0%
28·0%
28·0%
100·0%
0·67 (0·22–2·01)
2·27 (0·94–5·48)
2·68 (1·84–3·90)
1·80 (0·83–3·93)
1·11 (0·61–2·01)
1·11 (0·61–2·01)
1·58 (0·84–2·98)
Difference ≥10 mm Hg
Events/total Weight
Difference <10 mm Hg
Risk ratio (95% CI)A
Simultaneous measurement technique
Clark 200751
Clark 200952
Igarashi 200716
Orme 199947
Subtotal
Heterogeneity: τ²=0·00; χ²=1·11, df=3 (p=0·77); I²=0%
Test for overall effect: Z=1·00 (p=0·32)
Non-simultaneous measurement technique
Frank 199141
Shadman 2004 (clinical cohort)18
Shadman 2004 (population cohort)18
Subtotal
Heterogeneity: τ²=0·29; χ²=10·14, df=2 (p=0·006); I²=80%
Test for overall effect: Z=0·34 (p=0·73)
Total
Heterogeneity: τ²=0·09; χ²=11·26, df=6 (p=0·08); I²=47%
Test for overall effect: Z=0·65 (p=0·52)
Test for subgroup differences: χ²=0·02, df=1 (p=0·89); I²=0%
1/6
0/4
12/19
1/4
14/33
3/3
22/87
3/55
28/145
42/178
Difference ≥15 mm Hg
Events/total Weight
Difference <15 mm Hg
Risk ratio (95% CI)B
Disease not present Disease present0·2 0·5 1 2 5
21/88
20/99
133/264
97/361
271/812
35/73
345/1140
182/2830
562/4043
833/4855
3·7%
1·8%
28·4%
4·2%
38·1%
25·2%
28·1%
8·6%
61·9%
100·0%
0·70 (0·11–4·34)
0·49 (0·03–6·96)
1·25 (0·87–1·80)
0·93 (0·17–5·12)
1·19 (0·84–1·69)
1·82 (1·17–2·83)
0·84 (0·58–1·21)
0·85 (0·28–2·57)
1·13 (0·55–2·31)
1·13 (0·78–1·63)
Figure 2: Risk ratios for pre-existing coronary artery disease with and without diff erences in systolic blood pressure between arms of 10 mm Hg or more (A) and 15 mm Hg or more (B)
Articles
www.thelancet.com Published online January 30, 2012 DOI:10.1016/S0140-6736(11)61710-8 5
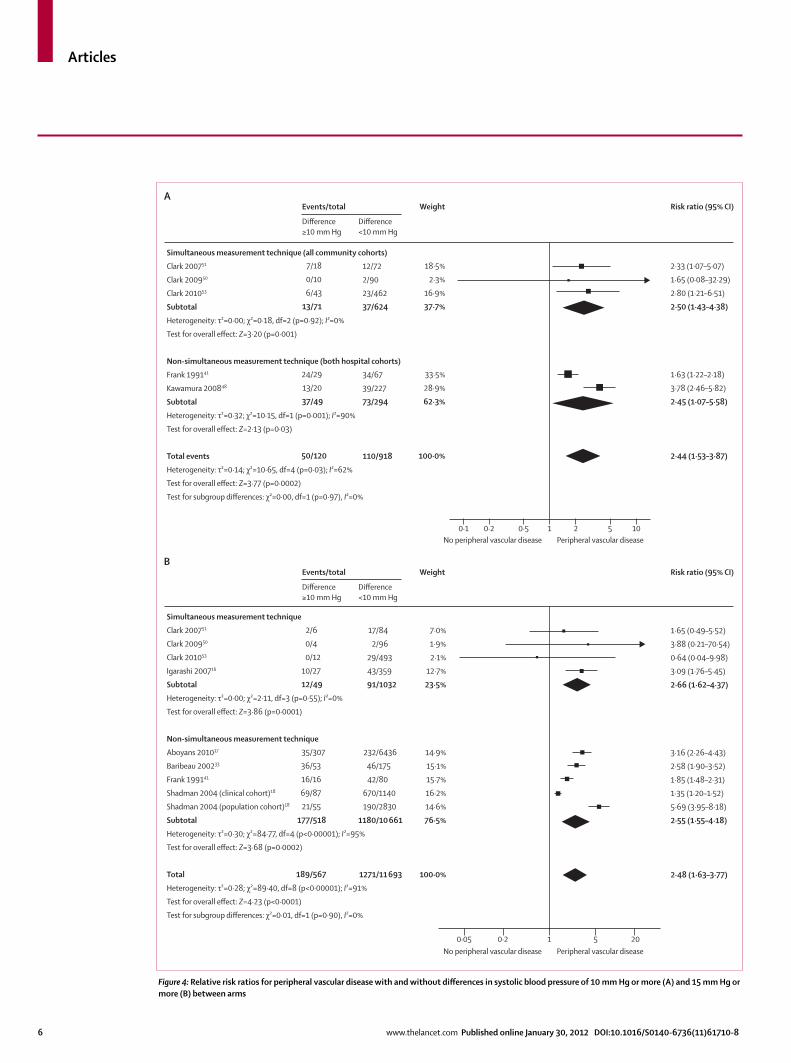
studies)16–18,48,51 or by history of peripheral vascular disease (four studies; fi gure 4).33,41,50,53 We noted little evidence that pooled RRs diff ered between studies that measured ankle-brachial pressure index (RR 2·7, 95% CI 1·3–5·5),16–18,51 and those using history of peripheral vascular disease (RR 2·1, 95% CI 1·6–2·9; p=0·55).33,41,50,53 Similarly, we detected little evidence that pooled values diff ered between studies using simultaneous16,50,51,53 and sequential measurement methods17,18,33,41 (fi gure 4). Pooled RRs did not diff er signifi cantly for community-recruited (3·4, 95% CI 2·0–6·0) and hospital-recruited (2·0, 1·0–2·9) cohorts (p=0·11). Pooled sensitivity for a diff erence of 15 mm Hg or more for peripheral vascular disease was 15% (95% CI 9–23) and specifi city 96% (94–98).
Pooled data from fi ve non-invasive studies with diff erences in SBP of 10 mm Hg or more41,48,50,51,53 showed
a signifi cant association with peripheral vascular disease (fi gure 4). RRs did not diff er between community-based cohorts, which all used simultaneous measurements,50,51,53 and hospital-based cohorts, which used non-simul-taneous methods (fi gure 4).41,48 The RR was, however, higher for studies assessing peripheral vascular disease by ankle-brachial pressure index (RR 3·3, 95% CI 2·1–5·2)48,51 than for those in which the disorder was defi ned by history alone (1·7, 1·3–2.7; p=0·02).41,50,53 Pooled sensitivity of a diff erence of 10 mm Hg or higher for peripheral vascular disease was 32% (95% CI 23–41) and specifi city 91% (86–94).
One other study49 (which presented no numerical data that could be extracted) showed no signifi cant diff erence in prevalence of peripheral vascular disease between those with and those without a diff erence of 10 mm Hg or more. Another general-population study52 (n=1090; mean age
Figure 3: Relative risk ratios for cerebrovascular disease with and without diff erences in systolic blood pressure of 10 mm Hg or more (A) and 15 mm Hg or more (B) between arms
Clark 200751
Clark 200950
Total
Heterogeneity: τ²=0·00;χ²=0·42, df=1 (p=0·52); I²=0%
Test for overall effect: Z=0·16 (p=0·87)
1/18
1/10
2/28
6/76
5/90
11/166
49·8%
50·2%
100·0%
0·70 (0·09–5·49)
1·80 (0·23–13·92)
1·13 (0·26–4·80)
Weight
Difference ≥10 mm Hg
Events/total
Difference <10 mm Hg
Difference ≥10 mm Hg
Events/total
Difference <10 mm Hg
Risk ratio (95% CI)
A
B
Simultaneous measurement technique
Clark 200751
Clark 200950
Subtotal
Heterogeneity: τ²=0·00; χ²=0·08, df=1 (p=0·77); I²=0%
Test for overall effect: Z=0·90 (p=0·37)
Non-simultaneous measurement technique
Baribeau 200233
Shadman 2004 (clinical cohort)18
Shadman 2004 (population cohort)18
Subtotal
Heterogeneity: τ²=0·00; χ²=2·00, df=2 (p=0·37); I²=0%
Test for overall effect: Z=2·30 (p=0·02)
Total
Heterogeneity: τ²=0·00; χ²=2·18, df=4 (p=0·70); I²=0%
Test for overall effect: Z=2·45 (p=0·01)
Test for subgroup differences: χ²=0·09, df=1 (p= 0·76), I²=0%
1/6
0/4
1/10
14/53
13/150
1/52
28/255
29/265
6/88
6/96
12/184
21/175
74/1077
54/2833
149/4085
161/4296
4·0%
2·0%
6·1%
42·0%
47·9%
4·0%
93·9%
100·0%
2·44 (0·35–17·16)
1·49 (0·10–22·94)
2·07 (0·42–10·12)
2·20 (1·21–4·02)
1·26 (0·72–2·22)
1·01 (0·14–7·15)
1·60 (1·07–2·40)
1·63 (1·10–2·41)
Weight
0·1 0·2No cerebrovascular disease Cerebrovascular disease
0·5 1 2 5 10
0·1 0·2No cerebrovascular disease Cerebrovascular disease
0·5 1 2 5 10
Risk ratio (95% CI)
Articles
6 www.thelancet.com Published online January 30, 2012 DOI:10.1016/S0140-6736(11)61710-8
Figure 4: Relative risk ratios for peripheral vascular disease with and without diff erences in systolic blood pressure of 10 mm Hg or more (A) and 15 mm Hg or more (B) between arms
Simultaneous measurement technique (all community cohorts)
Clark 200751
Clark 200950
Clark 201053
Subtotal
Heterogeneity: τ²=0·00; χ²=0·18, df=2 (p=0·92); I²=0%
Test for overall effect: Z=3·20 (p=0·001)
Non-simultaneous measurement technique (both hospital cohorts)
Frank 199141
Kawamura 200848
Subtotal
Heterogeneity: τ²=0·32; χ²=10·15, df=1 (p=0·001); I²=90%
Test for overall effect: Z=2·13 (p=0·03)
Total events
Heterogeneity: τ²=0·14; χ²=10·65, df=4 (p=0·03); I²=62%
Test for overall effect: Z=3·77 (p=0·0002)
Test for subgroup differences: χ²=0·00, df=1 (p=0·97), I²=0%
7/18
0/10
6/43
13/71
24/29
13/20
37/49
50/120
12/72
2/90
23/462
37/624
34/67
39/227
73/294
110/918
18·5%
2·3%
16·9%
37·7%
33·5%
28·9%
62·3%
100·0%
2·33 (1·07–5·07)
1·65 (0·08–32·29)
2·80 (1·21–6·51)
2·50 (1·43–4·38)
1·63 (1·22–2·18)
3·78 (2·46–5·82)
2·45 (1·07–5·58)
2·44 (1·53–3·87)
Weight Risk ratio (95% CI)A
B
Simultaneous measurement technique
Clark 200751
Clark 200950
Clark 201053
Igarashi 200716
Subtotal
Heterogeneity: τ²=0·00; χ²=2·11, df=3 (p=0·55); I²=0%
Test for overall effect: Z=3·86 (p=0·0001)
Non-simultaneous measurement technique
Aboyans 201017
Baribeau 200233
Frank 199141
Shadman 2004 (clinical cohort)18
Shadman 2004 (population cohort)18
Subtotal
Heterogeneity: τ²=0·30; χ²=84·77, df=4 (p<0·00001); I²=95%
Test for overall effect: Z=3·68 (p=0·0002)
Total
Heterogeneity: τ²=0·28; χ²=89·40, df=8 (p<0·00001); I²=91%
Test for overall effect: Z=4·23 (p<0·0001)
Test for subgroup differences: χ²=0·01, df=1 (p=0·90), I²=0%
2/6
0/4
0/12
10/27
12/49
35/307
36/53
16/16
69/87
21/55
177/518
189/567
17/84
2/96
29/493
43/359
91/1032
232/6436
46/175
42/80
670/1140
190/2830
1180/10 661
1271/11 693
7·0%
1·9%
2·1%
12·7%
23·5%
14·9%
15·1%
15·7%
16·2%
14·6%
76·5%
100·0%
1·65 (0·49–5·52)
3·88 (0·21–70·54)
0·64 (0·04–9·98)
3·09 (1·76–5·45)
2·66 (1·62–4·37)
3·16 (2·26–4·43)
2·58 (1·90–3·52)
1·85 (1·48–2·31)
1·35 (1·20–1·52)
5·69 (3·95–8·18)
2·55 (1·55–4·18)
2·48 (1·63–3·77)
Difference ≥10 mm Hg
Events/total Weight
Difference <10 mm Hg
Difference ≥10 mm Hg
Events/total
Difference <10 mm Hg
0·1 0·2No peripheral vascular disease Peripheral vascular disease
No peripheral vascular disease Peripheral vascular disease
0·5 1 2 5 10
0·05 0·2 1 5 20
Risk ratio (95% CI)
Articles
www.thelancet.com Published online January 30, 2012 DOI:10.1016/S0140-6736(11)61710-8 7
62·4 years) not included in the meta-analysis (authors were contacted but we received no reply) showed that prevalence of a diff erence of more than 10 mm Hg was 9·1% (95% CI 7·4–10·8), and that ankle-brachial pressure index and a diff erence in SBP were weakly negatively cor related (r=–0·23, p<0·001), which accords with other reports.16,51
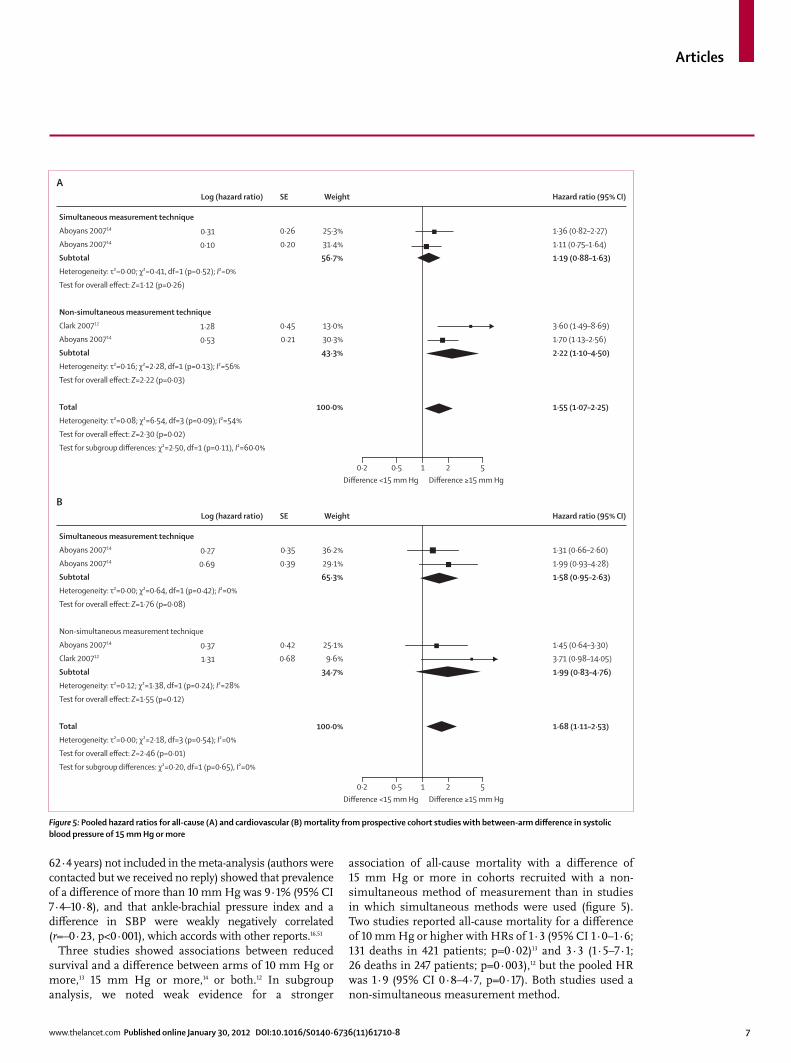
Three studies showed associations between reduced survival and a diff erence between arms of 10 mm Hg or more,13 15 mm Hg or more,14 or both.12 In subgroup analysis, we noted weak evidence for a stronger
association of all-cause mortality with a diff erence of 15 mm Hg or more in cohorts recruited with a non-simultaneous method of measurement than in studies in which simultaneous methods were used (fi gure 5). Two studies reported all-cause mortality for a diff erence of 10 mm Hg or higher with HRs of 1·3 (95% CI 1·0–1·6; 131 deaths in 421 patients; p=0·02)13 and 3·3 (1·5–7·1; 26 deaths in 247 patients; p=0·003),12 but the pooled HR was 1·9 (95% CI 0·8–4·7, p=0·17). Both studies used a non-simultaneous measurement method.
Figure 5: Pooled hazard ratios for all-cause (A) and cardiovascular (B) mortality from prospective cohort studies with between-arm diff erence in systolic blood pressure of 15 mm Hg or more
Difference <15 mm Hg Difference ≥15 mm Hg0·2 0·5 1 2 5
Simultaneous measurement technique
Aboyans 200714
Aboyans 200714
Subtotal
Heterogeneity: τ²=0·00; χ²=0·41, df=1 (p=0·52); I²=0%
Test for overall effect: Z=1·12 (p=0·26)
Non-simultaneous measurement technique
Clark 200712
Aboyans 200714
Subtotal
Heterogeneity: τ²=0·16; χ²=2·28, df=1 (p=0·13); I²=56%
Test for overall effect: Z=2·22 (p=0·03)
Total
Heterogeneity: τ²=0·08; χ²=6·54, df=3 (p=0·09); I²=54%
Test for overall effect: Z=2·30 (p=0·02)
Test for subgroup differences: χ²=2·50, df=1 (p=0·11), I²=60·0%
0·31
0·10
1·28
0·53
Log (hazard ratio)
ASE
0·26
0·20
0·45
0·21
Weight
25·3%
31·4%
56·7%
13·0%
30·3%
43·3%
100·0%
Hazard ratio (95% CI)
1·36 (0·82–2·27)
1·11 (0·75–1·64)
1·19 (0·88–1·63)
3·60 (1·49–8·69)
1·70 (1·13–2·56)
2·22 (1·10–4·50)
1·55 (1·07–2·25)
Difference <15 mm Hg Difference ≥15 mm Hg0·2 0·5 1 2 5
Simultaneous measurement technique
Aboyans 200714
Aboyans 200714
Subtotal
Heterogeneity: τ²=0·00; χ²=0·64, df=1 (p=0·42); I²=0%
Test for overall effect: Z=1·76 (p=0·08)
Non-simultaneous measurement technique
Aboyans 200714
Clark 200712
Subtotal
Heterogeneity: τ²=0·12; χ²=1·38, df=1 (p=0·24); I²=28%
Test for overall effect: Z=1·55 (p=0·12)
Total
Heterogeneity: τ²=0·00; χ²=2·18, df=3 (p=0·54); I²=0%
Test for overall effect: Z=2·46 (p=0·01)
Test for subgroup differences: χ²=0·20, df=1 (p=0·65), I²=0%
0·27
0·69
0·37
1·31
Log (hazard ratio)
BSE
0·35
0·39
0·42
0·68
Weight
36·2%
29·1%
65·3%
25·1%
9·6%
34·7%
100·0%
Hazard ratio (95% CI)
1·31 (0·66–2·60)
1·99 (0·93–4·28)
1·58 (0·95–2·63)
1·45 (0·64–3·30)
3·71 (0·98–14·05)
1·99 (0·83–4·76)
1·68 (1·11–2·53)
Articles
8 www.thelancet.com Published online January 30, 2012 DOI:10.1016/S0140-6736(11)61710-8
For cardiovascular-related mortality, the pooled HR from four cohorts (two studies)12,14 showed a signifi cant association with a diff erence of 15 mm Hg or more, with little evidence of a diff erence according to method of measurement (fi gure 5). Only one12 reported an HR for cardiovascular mortality with a diff erence of 10 mm Hg or more, providing weak evidence of an association (HR 2·8, 95% CI 0·9–9·2, p=0·09; 11 deaths in 247 patients).
DiscussionA diff erence in SBP of 10 mm Hg or higher or 15 mm Hg or more between arms is associated with peripheral vascular disease with low sensitivity but high specifi city. This fi nding is consistent for diff erent methods of measurement or diagnosis for both community-recruited and hospital-recruited cohorts. A diff erence of 15 mm Hg or more is also associated with the presence of cerebrovascular disease. Data from prospective studies showed that a diff erence of 15 mm Hg or more is associated with increased all-cause and cardiovascular mortality.
Although our search was not restricted by language, no translation services were available. Data were extracted from non-English studies but some data could have been missed. We had insuffi cient studies for funnel-plot assessment of any outcome, and therefore we are unable to establish the eff ect of small study or publication bias on our fi ndings.54 Most researchers recruited patients with heightened cardiovascular risk compared with the general population—eg, those undergoing angiography for clinical reasons; only nine studies12,15,17,18,49–53 used unselected community or primary-care cohorts. These cohorts consisted of people with either diabetes or hypertension, and results should be interpreted in this context. Subgroup analyses, however, indicated little diff erence in association with diff erence in SBP between these cohorts.
One meta-analysis showed that prevalence of a diff erence in SBP of 10 mm Hg or more between arms is roughly doubled when diagnosis is based on one pair of measurements, uses a sequential approach, or uses manual rather than automated measurements.27 Only 12 of 28 studies in this review used the gold-standard method of repeated simultaneous measure ments,14,16,37,39,45–47,49–53 so accuracy of patient classifi cation in the other studies cannot be assumed. Subgroup analyses, however, indicated little diff erence between the two methods of assessment. Diastolic pressures can also diff er,22 but only three studies meeting the inclusion criteria reported data for diastolic blood pressure and so no analyses were done.41,47,51
Reduced ankle-brachial pressure indices are strongly correlated with angiographic evidence of large-vessel disease in the leg.2,55 Prevalence of large-vessel arterial disease in white Americans (mean age 66 years) is 11·7%,7 and is grossly underestimated by assessment of claudication symp toms.56,57 Several studies included in our report have shown either independent and signifi cant associations of a diff erence with reduced ankle-brachial pressure, or negative correlations of
magnitude of between-arm diff erence with ankle-brachial pressure. Our fi ndings strengthen the hypothesis that a diff erence is due to peripheral vascular disease, and thus might represent a sign of clinical importance;58 the association of a diff erence of 15 mm Hg or more with angiographic evidence of carotid or aortic arch disease further supports this notion.33
Consistency of RRs for diff erent methods of measurement of diff erences in SBP between arms is surprising in view of the eff ect of measurement on prevalence.22,27 One sequential measurement can exclude patients without a true between-arm diff erence,28 but the trend towards an increased RR in survival studies not using a simultaneous measurement method suggests that bias is possible if a gold-standard assessment technique is not used. Future epidemiological studies of between-arm diff erence should use a repeated simultaneous measurement method.27
Although asymptomatic peripheral vascular disease is common in patients with coronary artery disease,59 we did not identify an association of coronary artery disease with a diff erence in SBP. However, we did record an association between increased cardiovascular and all-cause mortality, suggesting that a diff erence does indicate a raised cardiovascular risk in a similar way to reduced ankle-brachial pressure index.1
Early identifi cation of peripheral vascular disease allows interventions to be given and might improve outcomes. Screening in primary care is feasible but not widespread.60 Overall prevalence of the disorder in our analyses was 12–15%. These fi gures are similar to published estimates of community prevalence, implying that these fi ndings could be generalised.7,61,62 The high specifi cities reported here suggest that detection of a diff erence might be useful in assessments designed to identify the disorder in patients at highest risk. Prevalences for a diff erence in community-based cohorts in our review suggest that less than 5% of patients would need such assessment if a cutoff of 15 mm Hg was adopted. The increased mortality with this cutoff would support such an intervention.
Three prospective studies reported increased mortality with a diff erence in SBP. The cohorts in these studies were recruited from vascular and renal clinics13,14 or were primary-care patients with hypertension.12 Only one cohort could be regarded as representative of a wider population.14 Therefore this review suggests that a diff erence is an independent predictor of cardiovascular events and death in populations at high baseline cardiovascular risk, but this cannot be generalised to patients without cardiovascular risk factors.
Subclavian steal syndrome due to subclavian stenosis is usually associated with a diff erence in SBP of 10 mm Hg or higher between arms.63 Detection is important when patients are assessed for coronary artery bypass graft to avoid angina due to coronary-subclavian steal phenomenon when the internal mammary artery is used. Minor

Articles
www.thelancet.com Published online January 30, 2012 DOI:10.1016/S0140-6736(11)61710-8 9
Practitioners (grant No SFB-2009-06) and the South West GP Trust. CEC
and OCU are supported by The Peninsula Collaboration for Leadership in
Applied Health Research and Care, a collaboration between the Peninsula
College of Medicine and Dentistry, University of Exeter, University of
Plymouth, and National Health Service South West, funded by the
National Institute for Health Research. The University of Exeter is the
research sponsor for this study. The views and opinions expressed in this
report are those of the authors and not necessarily those of the National
Health Service, the National Institute for Health Research, or the
Department of Health.
References1 Ankle Brachial Index Collaboration, Fowkes FG, Murray GD, et al.
Ankle brachial index combined with Framingham Risk Score to predict cardiovascular events and mortality: a meta-analysis. JAMA 2008; 300: 197–208.
2 Zheng ZJ, Sharrett AR, Chambless LE, et al. Associations of ankle-brachial index with clinical coronary heart disease, stroke and preclinical carotid and popliteal atherosclerosis: the Atherosclerosis Risk in Communities (ARIC) study. Atherosclerosis 1997; 131: 115–25.
3 Cui R, Kitamura A, Yamagishi K, et al. Ankle-arm blood pressure index as a correlate of preclinical carotid atherosclerosis in elderly Japanese men. Atherosclerosis 2006; 184: 420–24.
4 Donnelly R, Yeung JMC. Management of intermittent claudication: the importance of secondary prevention. Eur J Vasc Endovasc Surg 2002; 23: 100–07.
5 The Heart Outcomes Prevention Evaluation Study Investigators. Eff ects of an angiotensin-converting-enzyme inhibitor, ramipril, on cardiovascular events in high-risk patients. N Engl J Med 2000; 342: 145–53.
6 Aung PP, Maxwell H, Jepson RG, Price J, Leng GC. Lipid-lowering for peripheral arterial disease of the lower limb. Cochrane Database Syst Rev 2007; 4: CD000123.
7 Criqui MH, Fronek A, Barrett-Connor E, Klauber MR, Gabriel S, Goodman D. The prevalence of peripheral arterial disease in a defi ned population. Circulation 1985; 71: 510–15.
8 Donnelly R, Hinwood D, London NJM. ABC of arterial and venous disease: non-invasive methods of arterial and venous assessment. BMJ 2000; 320: 698–701.
9 Ray SA, Srodon PD, Taylor RS, Dormandy JA. Reliability of ankle:brachial pressure index measurement by junior doctors. Br J Surg 1994; 81: 188–90.
10 Department of Health. Putting prevention fi rst—vascular checks: risk assessment and management. London: Department of Health, 2008.
11 University of Leicester. The handbook for vascular risk assessment, risk reduction and risk management. London: UK National Screening Committee, 2008.
12 Clark CE, Powell RJ, Campbell JL. The interarm blood pressure diff erence as predictor of cardiovascular events in patients with hypertension in primary care: cohort study. J Hum Hypertens 2007; 21: 633–36.
13 Agarwal R, Bunaye Z, Bekele DM. Prognostic signifi cance of between-arm blood pressure diff erences. Hypertension 2008; 51: 657–62.
14 Aboyans V, Criqui MH, McDermott MM, et al. The vital prognosis of subclavian stenosis. J Am Coll Cardiol 2007; 49: 1540–45.
15 Clark CE, Powell RJ. The diff erential blood pressure sign in general practice: prevalence and prognostic value. Fam Pract 2002; 19: 439–41.
16 Igarashi Y, Chikamori T, Tomiyama H, et al. Clinical signifi cance of inter-arm pressure diff erence and ankle-brachial pressure index in patients with suspected coronary artery disease. J Cardiol 2007; 50: 281–89.
17 Aboyans V, Kamineni A, Allison MA, et al. The epidemiology of subclavian stenosis and its association with markers of subclinical atherosclerosis: the Multi-Ethnic Study of Atherosclerosis (MESA). Atherosclerosis 2010; 211: 266–70.
18 Shadman R, Criqui MH, Bundens WP, et al. Subclavian artery stenosis: prevalence, risk factors, and association with cardiovascular diseases. J Am Coll Cardiol 2004; 44: 618–23.
19 HeTie C, Luo Y, Wen Z, et al. Development of the synchronous sphygmomanometer for four limbs—technical basics and medical practice. Chin J Biomed Eng 2002; 21: 182–86.
20 Mancia G, De Backer G, Dominiczak A, et al. 2007 Guidelines for the management of arterial hypertension. Eur Heart J 2007; 28: 1462–536.
subclavian stenoses are common,64,65 but our data suggest that mean diff erence exceeds 35 mm Hg for angiographically proven subclavian stenosis of more than 50%. Smaller diff erences of more than 10 mm Hg or 20 mm Hg have high specifi city for angiograph-ically proven subclavian stenosis, and diff erences of 10–16 mm Hg have been proposed as cutoff values to select patients for subclavian angiography to exclude stenosis preoperatively.34,38,66,67 The sensitivities reported do not mean that a diff erence in SBP of less than 10 mm Hg, or of less than 15 mm Hg (ie, a negative result), can reliably rule out subclavian stenosis. These data are derived from patients referred for coronary angiography; no investigators have yet examined the pathological basis of a diff erence in unselected populations, and so the defi nition of subclavian stenosis should not be used in studies according to measurement of the diff erence alone.14,17,18
What constitutes a clinically important diff erence in SBP between arms is unclear. However, we have associated a diff erence with an increased likelihood of peripheral vascular disease and with prospective diff erences in survival. Further research is needed to establish the upper limit of normal between-arm diff erences, particularly for diastolic measurements. Further survival studies in populations recruited from community settings are needed to establish whether these fi ndings can be generalised. Guidelines continue to describe a diff erence of 10 mm Hg or more as rare,68 yet our own studies have suggested that prevalence ranges from 10% in diabetic patients to 20% in general and hypertensive populations.12,22,50
In conclusion, our fi ndings suggest that a diff erence in SBP of 10 mm Hg or more or 15 mm Hg or more between arms could identify patients at high risk of asymptomatic peripheral vascular disease and mortality who might benefi t from further assessment. Findings from our study should be incorporated into future guidelines for hypertension and blood-pressure measure ment to justify bilateral brachial measurement in the assessment of individuals, and to promote targeted screening for peripheral vascular disease and aggressive risk factor management in subjects with a demonstrable systolic between-arm diff erence.
ContributorsCEC conceived the study and all authors were involved in study design.
CEC developed the search strategy and acts as guarantor for the study.
CEC, ACS, and RST selected studies. CEC, OCU, and RST extracted data
and did analyses. CEC wrote the fi rst draft and all co-authors contributed
to various drafts. All authors agreed on the fi nal manuscript, and CEC
takes fi nal responsibility.
Confl icts of interestWe declare that we have no confl icts of interest.
AcknowledgmentsWe thank Joy Choules and the staff of Exeter Medical Library for their
assistance in obtaining the full text papers for this Article; Victor Aboyans
(Centre hospitalier universitaire Limoges) for responding to author
enquiries; and Chris Hyde and Willie Hamilton (Peninsual College of
Medicine and Dentistry) for constructive comments. This research was
funded by the Scientifi c Foundation Board of the Royal College of General

Articles
10 www.thelancet.com Published online January 30, 2012 DOI:10.1016/S0140-6736(11)61710-8
21 National Institute for Health and Clinical Excellence. Hypertension: the clinical management of primary hypertension in adults, CG127. London: National Institute for Health and Clinical Excellence, 2011.
22 Clark CE, Campbell JL, Evans PH, Millward A. Prevalence and clinical implications of the inter-arm blood pressure diff erence: a systematic review. J Hum Hypertens 2006; 20: 923–31.
23 Williams B, Poulter NR, Brown MJ, et al. Guidelines for management of hypertension: report of the fourth working party of the British Hypertension Society, 2004-BHS IV. J Hum Hypertens 2004; 18: 139–85.
24 Heneghan C, Perera R, Mant D, Glasziou P. Hypertension guideline recommendations in general practice: awareness, agreement, adoption, and adherence. Br J Gen Pract 2007; 57: 948–52.
25 Anekwe L. Inter-arm diff erences may pick out patients with peripheral heart disease. May 10, 2007. http://www.pulsetoday.co.uk/main-content/-/article_display_list/10950600/inter-arm-diff erences-may-pick-out-patients-with-peripheral-arterial-disease (accessed Jan 18, 2012).
26 Parker E, Glasziou P. Use of evidence in hypertension guidelines: should we measure in both arms? Br J Gen Pract 2009; 59: e87–92.
27 Verberk WJ, Kessels AGH, Thien T. Blood pressure measurement method and inter-arm diff erences, a meta-analysis. Am J Hypertens 2011; 24: 1201–08.
28 Clark CE, Campbell JL, Evans PH, Shore A, Taylor R. Detection of an interarm blood pressure diff erence in primary care diabetes care. Diabetic Medicine 2009; 26 (suppl 1): 128.
29 Akers J, University of York. Systematic reviews: CRD’s guidance for undertaking reviews in health care. York, UK: Centre for Reviews and Dissemination, 2009.
30 Higgins JPT, Green S. Cochrane handbook for systematic reviews of interventions, version 5.0.2. Chichester, UK: John Wiley, 2009.
31 Harbord RM, Deeks JJ, Egger M, Whiting P, Sterne JA. A unifi cation of models for meta-analysis of diagnostic accuracy studies. Biostatistics 2007; 8: 239–51.
32 Harbord RM, Whiting P. metandi: Meta-analysis of diagnostic accuracy using hierarchical logistic regression. Stata J 2009; 9: 211–29.
33 Baribeau Y, Westbrook B, Charlesworth D, Hearne M, Bradley W, Maloney C. Brachial gradient in cardiac surgical patients. Circulation 2002; 106 (suppl 1): I11–13.
34 English JA, Carell ES, Guidera SA, Tripp HF. Angiographic prevalence and clinical predictors of left subclavian stenosis in patients undergoing diagnostic cardiac catheterization. Catheter Cardiovasc Interv 2001; 54: 8–11.
35 Westerband A, Rodriguez JA, Ramaiah VG, Diethrich EB. Endovascular therapy in prevention and management of coronary-subclavian steal. J Vasc Surg 2003; 38: 699–703.
36 Magaard F, Ekestrom S. Peroperative measurements of blood fl ow and pressure in occlusion and/or stenosis of the subclavian artery and the brachiocephalic trunk. Scand J Thorac Cardiovasc Surg 1976; 10: 85–95.
37 Matsumura K, Sato K, Utsumi N, et al. Prevalence of left subclavian artery stenosis in coronary arteriography patients and the diagnostic accuracy of simultaneous bilateral brachial blood pressure measurements and the usefulness of percutaneous transluminal angioplasty of the left subclavian artery. Jpn J Intervent Cardiol 2002; 17: 382–87.
38 Osborn L, Vernon S, Reynolds B, Timm T, Allen K. Screening for subclavian artery stenosis in patients who are candidates for coronary bypass surgery. Catheter Cardiovasc Interv 2002; 56: 162–65.
39 Lobato EB, Kern KB, Bauder H, Hughes L, Sulek CA. Incidence of coronary-subclavian steal syndrome in patients undergoing noncardiac surgery. J Cardiothorac Vasc Anesth 2001; 15: 689–92.
40 Wang KQ, Wang ZG, Yang BZ, et al. Long-term results of endovascular therapy for proximal subclavian arterial obstructive lesions. Chin Med J 2010; 123: 45–50.
41 Frank SM, Norris EJ, Christopherson R, Beattie C. Right and left arm blood pressure discrepancies in vascular surgery patients. Anesthesiology 1991; 75: 457–63.
42 Calligaro KD, Ascer E, Veith FJ, et al. Unsuspected infl ow disease in candidates for axillofemoral bypass operations: a prospective study. J Vasc Surg 1990; 11: 832–37.
43 Walker PM, Paley D, Harris KA, Thompson A, Johnston KW. What determines the symptoms associated with subclavian artery occlusive disease? J Vasc Surg 1985; 2: 154–57.
44 Tan TY, Schminke U, Lien LM, Tegeler CH. Subclavian steal syndrome: can the blood pressure diff erence between arms predict the severity of steal? J Neuroimaging 2002; 12: 131–35.
45 Karagiannis A, Tziomalos K, Krikis N, et al. The unilateral measurement of blood pressure may mask the diagnosis or delay the eff ective treatment of hypertension. Angiology 2005; 56: 565–69.
46 Lane D, Beevers M, Barnes N, et al. Inter-arm diff erences in blood pressure: when are they clinically signifi cant? J Hypertens 2002; 20: 1089–95.
47 Orme S, Ralph SG, Birchall A, Lawson-Matthew P, McLean K, Channer KS. The normal range for inter-arm diff erences in blood pressure. Age Ageing 1999; 28: 537–42.
48 Kawamura T. Assessing Ankle-Brachial Index (ABI) by using automated oscillometric devices. Arq Bras Cardiol 2008; 90: 294–98.
49 Mendelson G, Nassimiha D, Aronow W. Simultaneous measurements of blood pressures in right and left brachial arteries. Cardiol Rev 2004; 12: 276–78.
50 Clark CE, Greaves C, Evans PH, Dickens A, Campbell JL. The interarm blood pressure diff erence in Type 2 diabetes: a barrier to eff ective management? Br J Gen Pract 2009; 59: 428–32.
51 Clark CE, Campbell JL, Powell RJ, Thompson JF. The inter-arm blood pressure diff erence and peripheral vascular disease: cross sectional study. Fam Pract 2007; 24: 420–26.
52 Kimura A, Hashimoto J, Watabe D, et al. Patient characteristics and factors associated with inter-arm diff erence of blood pressure measurements in a general population in Ohasama, Japan. J Hypertens 2004; 22: 2277–83.
53 Clark CE, Githens-Mazer G, Rowley J, Shore AC, Hattersley A, Campbell JL. Systolic inter-arm blood pressure diff erence is associated with peripheral vascular disease in people with diabetes in primary care. Diabet Med 2010; 27 (suppl 1): 44.
54 Sterne JAC, Sutton AJ, Ioannidis JPA, et al. Recommendations for examining and interpreting funnel plot asymmetry in meta-analyses of randomised controlled trials. BMJ 2011; 343: d4002.
55 Kiekara O, Riekkinen H, Soimakallio S, Lansimies E. Correlation of angiographically determined reduction of vascular lumen with lower-limb systolic pressures. Acta Chir Scand 1985; 151: 437–40.
56 Hughson WG, Mann JI, Garrod A. Intermittent claudication: prevalence and risk factors. BMJ 1978; 1: 1379–81.
57 Rose G. The diagnosis of ischaemic heart pain and intermittent claudication in fi eld surveys. Bull World Health Organ 1962; 27: 645–58.
58 Clark CE. Diff erence in blood pressure between arms might refl ect peripheral vascular disease. BMJ 2001; 323: 399–400.
59 Dieter RS, Biring T, Tomasson J, et al. Classic intermittent claudication is an uncommon manifestation of lower extremity peripheral arterial disease in hospitalized patients with coronary artery disease. Angiology 2004; 55: 625–28.
60 Campbell NC, McNiff C, Sheran J, Brittenden J, Lee AJ, Ritchie LD. Targeted screening for peripheral arterial disease in general practice. Br J Gen Pract 2007; 57: 311–15.
61 Fowkes FG, Price JF, Stewart MCW, et al. Aspirin for prevention of cardiovascular events in a general population screened for a low ankle brachial index: a randomized controlled trial. JAMA 2010; 303: 841–48.
62 Coni N, Tennison B, Troup M. Prevalence of lower-extremity arterial-disease among elderly people in the community. Br J Gen Pract 1992; 42: 149–52.
63 Lawson JD, Petracek MR, Buckspan GS, Dean RH. Subclavian steal: review of the clinical manifestations. South Med J 1979; 72: 1369–73.
64 Gutierrez GR, Mahrer P, Aharonian V, Mansukhani P, Bruss J. Prevalence of subclavian artery stenosis in patients with peripheral vascular disease. Angiology 2001; 52: 189–94.
65 Moll F, Six J, Mutsaerts D. Misleading upper extremity blood pressure measurements in vascular occlusive disease. Bruit 1983; 8: 18–19.
66 Sumner DS. Noninvasive assessment of upper extremity and hand ischemia. J Vasc Surg 1986; 3: 560–64.
67 Costa S, Fitzsimmons P, Terry E, Scott R. Coronary-subclavian steal: case series and review of diagnostic and therapeutic strategies—three case reports. Angiology 2007; 58: 242–48.
68 Parati G, Stergiou GS, Asmar R, et al. European Society of Hypertension practice guidelines for home blood pressure monitoring. J Hum Hypertens 2010; 24: 779–85.
Comment
www.thelancet.com Published online January 30, 2012 DOI:10.1016/S0140-6736(11)61926-0 1
Do diff erences in blood pressure between arms matter?In The Lancet, Christopher Clark and colleagues1 present data from a systematic review and meta-analysis assessing the available evidence linking diff erences in blood pressure between arms with both central and peripheral vascular disease. They establish that systolic diff erences of at least 15 mm Hg are associated with an increased risk of peripheral vascular disease (relative risk 2·5, 95% CI 1·6–3·8) and report weaker but signifi cant associations with cerebrovascular disease and mortality. When subclavian stenoses are angiographically proven, Clark and co-workers estimate that the mean diff erence in blood pressure between arms is 36·9 mm Hg (95% CI 35·4–38·4), and rates of subclavian stenosis are high when diff erences are present.
National and international hypertension guidelines have recommended measurement of blood pressure in both arms for some years, but the justifi cation has been poor and subsequent adoption in primary care negligible.2–4 The main reason for these recom-mendations has been reduction of measurement error, although the European Society of Hypertension and European Society of Cardiology guidelines5 refer to diff erences between arms as a sign of peripheral vascular disease. Key issues are how to measure such diff erences, which measurement of blood pressure to use, and what to do when a diff erence is detected.
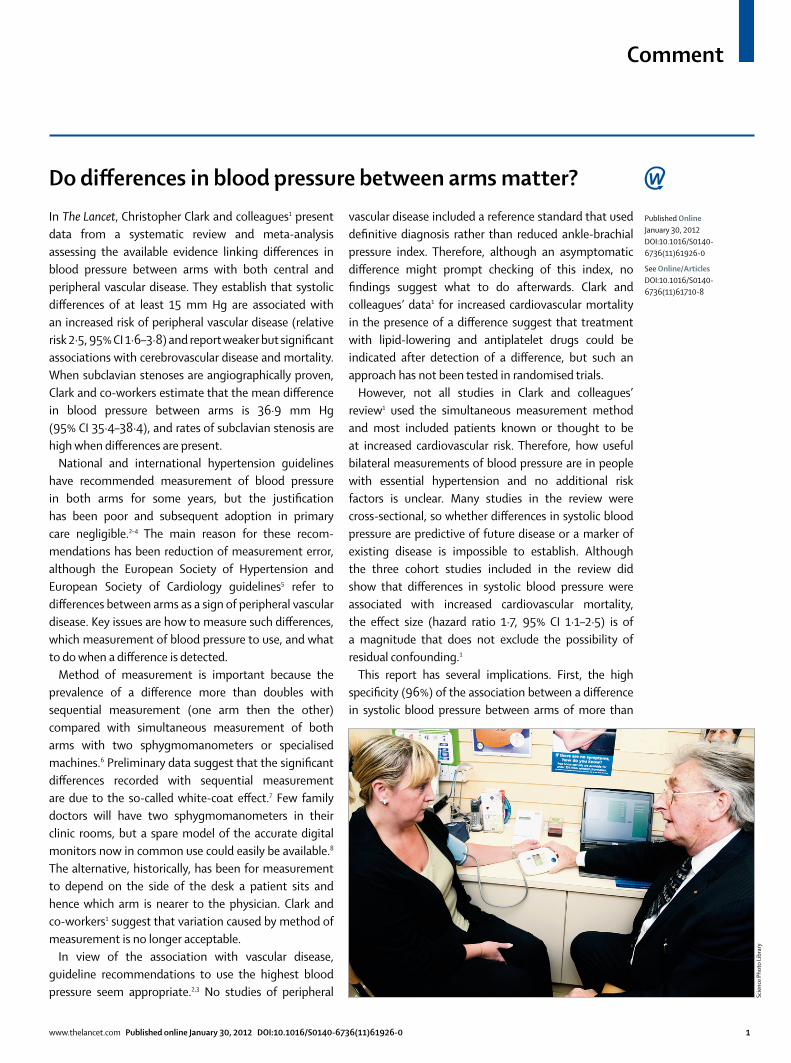
Method of measurement is important because the prevalence of a diff erence more than doubles with sequential measurement (one arm then the other) compared with simultaneous measurement of both arms with two sphygmomanometers or specialised machines.6 Preliminary data suggest that the signifi cant diff erences recorded with sequential measurement are due to the so-called white-coat eff ect.7 Few family doctors will have two sphygmomanometers in their clinic rooms, but a spare model of the accurate digital monitors now in common use could easily be available.8 The alternative, historically, has been for measurement to depend on the side of the desk a patient sits and hence which arm is nearer to the physician. Clark and co-workers1 suggest that variation caused by method of measurement is no longer acceptable.
In view of the association with vascular disease, guideline recommendations to use the highest blood pressure seem appropriate.2,3 No studies of peripheral
vascular disease included a reference standard that used defi nitive diagnosis rather than reduced ankle-brachial pressure index. Therefore, although an asymptomatic diff erence might prompt checking of this index, no fi ndings suggest what to do afterwards. Clark and colleagues’ data1 for increased cardiovascular mortality in the presence of a diff erence suggest that treatment with lipid-lowering and antiplatelet drugs could be indicated after detection of a diff erence, but such an approach has not been tested in randomised trials.
However, not all studies in Clark and colleagues’ review1 used the simultaneous measurement method and most included patients known or thought to be at increased cardiovascular risk. Therefore, how useful bilateral measurements of blood pressure are in people with essential hypertension and no additional risk factors is unclear. Many studies in the review were cross-sectional, so whether diff erences in systolic blood pressure are predictive of future disease or a marker of existing disease is impossible to establish. Although the three cohort studies included in the review did show that diff erences in systolic blood pressure were associated with increased cardiovascular mortality, the eff ect size (hazard ratio 1·7, 95% CI 1·1–2·5) is of a magnitude that does not exclude the possibility of residual confounding.1
This report has several implications. First, the high specifi city (96%) of the association between a diff erence in systolic blood pressure between arms of more than
Published OnlineJanuary 30, 2012DOI:10.1016/S0140-6736(11)61926-0
See Online/ArticlesDOI:10.1016/S0140-6736(11)61710-8
Scie
nce
Phot
o Li
brar
y
Comment
2 www.thelancet.com Published online January 30, 2012 DOI:10.1016/S0140-6736(11)61926-0
15 mm Hg and peripheral vascular disease justifi es use of this measure as a sign of disease. Second, the low sensitivity (15%) shows that measurement of diff erences is of little value as a screening test for peripheral vascular disease, and ankle-brachial pressure indices will still be necessary for diagnosis. Third, the high prevalence of diff erences in some of the studies (eg, 7% of participants had an inter-arm diff erence of 15 mm Hg or higher in one community-dwelling cohort)9 suggests that many people with hypertension will be missed when blood pressure is measured in only one arm. Further research is needed to clarify whether substantial diff erences between arms should prompt aggressive management of cardiovascular risk factors. Overall, Clark and colleagues’ systematic review and meta-analysis1 supports existing guidelines stating that blood pressure should be measured in both arms. Ascertainment of diff erences should become part of routine care, as opposed to a guideline recommendation that is mostly ignored.
*Richard J McManus, Jonathan MantDepartment of Primary Care Health Sciences, University of Oxford, Oxford OX1 2ET, UK (RJM); and Department of Public Health and Primary Care, University of Cambridge, Cambridge, UK (JM)[email protected]
We declare that we have no confl icts of interest.
1 Clark CE, Taylor RS, Shore AC, Ukoumunne OC, Campbell JL. Association of a diff erence in systolic blood pressure between arms with vascular disease and mortality: a systematic review and meta-analysis. Lancet 2012; published online Jan 30. DOI:10.1016/S0140-6736(11)61710-8.
2 Krause T, Lovibond K, Caulfi eld M, McCormack T, Williams B. Management of hypertension: summary of NICE guidance. BMJ 2011; published online Aug 25. DOI:10.1136/bmj.d4891.
3 Chobanian AV, Bakris GL, Black HR, et al. The seventh report of the joint national committee on prevention, detection, evaluation, and treatment of high blood pressure: the JNC 7 report. JAMA 2003; 289: 2560–72.
4 Heneghan C, Perera R, Mant D, Glasziou P. Hypertension guideline recommendations in general practice: awareness, agreement, adoption, and adherence. Br J Gen Pract 2007; 57: 948–52.
5 Mancia G, De Backer G, Dominiczak A, et al. 2007 ESH-ESC guidelines for the management of arterial hypertension: the task force for the management of arterial hypertension of the European Society of Hypertension (ESH) and of the European Society of Cardiology (ESC). Blood Press 2007; 16: 135–232.
6 Verberk WJ, Kessels AG, Thien T. Blood pressure measurement method and inter-arm diff erences: a meta-analysis. Am J Hypertens 2011; 24: 1201–08.
7 Martin U, Holder R, McManus RJ. Right and left arm blood pressure variability: a manifestation of “white coat” eff ect? British Hypertension Society Annual Scientifi c meeting; Cambridge, UK; Sept 14–16, 2009: S15.
8 A’Court C, Stevens R, Sanders S, Ward A, McManus R, Heneghan C. Type and accuracy of sphygmomanometers in primary care: a cross-sectional observational study. Br J Gen Pract 2011; 61: e598–e603.
9 Aboyans V, Criqui MH, McDermott MM, et al. The vital prognosis of subclavian stenosis. J Am Coll Cardiol 2007; 49: 1540–45.