Embed Size (px)
Citation preview
www.vadosezonejournal.org · Vol. 8, No. 2, May 2009 510
Y M is being studied extensively to deter-
mine whether it is a suitable site for a high-level nuclear
waste repository. In particular, much research has been conducted
on the hydrologic and geochemical properties of the vadose and
saturated zones surrounding Yucca Mountain (Robinson and
Bussod, 2000). Experiments have been performed at the pro-
posed waste storage horizon in the Exploratory Science Facility;
however, rocks below this level are diffi cult to access within Yucca
Mountain (Bechtel SAIC Company, 2004a,b).
Th e Busted Butte Unsaturated Zone Transport Test (UZTT)
was designed to access exposures of the Topopah Spring Tuff
and the Calico Hills Tuff , units stratigraphically correlative and
mineralogically similar to the unsaturated rocks underlying the
proposed repository (Robinson and Bussod, 2000; Turin et al.,
2002). Busted Butte is located at the Nevada Test Site, approxi-
mately 160 km northwest of Las Vegas, NV, and 8 km southeast
of Yucca Mountain. Th e UZTT was initiated to explore the in
situ behavior of solute and colloid movement through the tuff
horizons that underlie the proposed repository. Specifi c issues of
concern include the interaction of solute and colloid transport
with heterogeneity and fractures, applicability of measured labo-
ratory parameters to the fi eld scale and site scale, and evaluation
of numerical models for unsaturated transport in fractured tuff .
Th e Busted Butte UZTT consisted of three phases of in situ
tracer injection and breakthrough analysis. Phases 1A and 1B
were designed as multicomponent scoping studies to aid in the
design and analysis of the later Phase 2 experiment. Phase 1 tests
consisted of parallel pairs of injection and collection boreholes
that essentially captured three-dimensional fl ow on the scale of
a meter or less. Phase 1A, described in Robinson and Bussod
(2000), was designed to capture the qualitative aspects of unsatu-
rated zone transport at this site. Th e objective of Phase 1B was to
identify the dominant physical processes controlling solute trans-
port through unsaturated tuff at low fl ow rates across submeter
distances and to determine whether the hydrogeologic properties
of rocks measured in the laboratory are useful in describing the
behavior of rocks in the fi eld. Additionally, Phase 1B was located
to include a naturally occurring fracture within the test block,
providing insight into our understanding of the role of fractures
on transport in the Topopah Springs Tuff at low fl ow rates. Phase
2 was run to explore transport in a larger three-dimensional block
using an array of perpendicular injection and collection boreholes
as well as a larger range in injection rates. A primary conclusion
from numerical modeling of both Phase 1A and Phase 2 is that
capillary forces are suffi cient to explain much of the fl ow and
Untangling Diff usion from Advec on in Unsaturated Porous Media: Experimental Data, Modeling, and Parameter Uncertainty Philip H. Stauff er,* Jasper A. Vrugt, H. Jake Turin, Carl W. Gable, and Wendy E. Soll
P.H. Stauff er, J.A. Vrugt, H.J. Turin, C.W. Gable, and W.E. Soll (deceased), Los Alamos Na onal Lab., P.O. Box 1663, Los Alamos, NM 87545. Received 5 Mar. 2008. *Corresponding author (stauff [email protected]).
Vadose Zone J. 8:510–522doi:10.2136/vzj2008.0055
© Soil Science Society of America677 S. Segoe Rd. Madison, WI 53711 USA.All rights reserved. No part of this periodical may be reproduced or transmi ed in any form or by any means, electronic or mechanical, including photocopying, recording, or any informa on storage and retrieval system, without permission in wri ng from the publisher.
A : FEHM, fi nite element heat and mass transfer porous fl ow simulator; LANL. Los Alamos National Laboratory; SCEM-UA, Shuffl ed Complex Evolution Metropolis algorithm.
S S
: UZI
G U
SGS
We conducted a series of experimental and modeling tests using data from the Busted Bu e Unsaturated Zone Transport Test. First, we conducted a suite of reac ve (e.g., Li), nonreac ve (Br), and colloidal tracer experiments. These tracers were injected for 190 d from two point sources at rates of 1 and 8 mL/h, respec vely. We then used a numerical simu-lator (FEHM), populated with laboratory-measured hydrologic proper es, to verify that our conceptual model of the tracer test yielded a good fi t to the tracer breakthrough data. Addi onally, we used the AMALGAM-SO and SCEM-UA search algorithms to fi nd op mal parameter es mates in our conceptual model and es mate their (nonlinear) uncer-tainty. To this end, the FEHM model was executed more than 50,000 mes using parallel compu ng on a distributed computer cluster. The experimental and modeling results show that (i) no breakthrough of colloids was observed, low breakthroughs of Li were found, and signifi cant and rapid breakthrough of Br was measured, (ii) measured hydraulic parameters from rock core samples provide a rela vely accurate descrip on of fl ow and transport at the scale and fl ow rates of the Busted Bu e test, and (iii) the Millington–Quirk model of diff usion as a func on of volumetric water content can fi t the experimental breakthrough data well; however, (iv) a constant diff usion model with a much lower eff ec ve diff usion coeffi cient also fi ts the data well, and (v) numerous diff erent op mized parameter combina ons exist that fi t the observed Br data acceptably well. This implies that one should be par cularly careful in assigning values of the unsaturated subsurface fl ow and transport parameters without recourse to examining both parameter and model formula on uncertainty.

www.vadosezonejournal.org · Vol. 8, No. 2, May 2009 511
transport in the test block (Robinson and Bussod, 2000; Tseng
et al., 2003).
We investigated tracer breakthrough data from Phase 1B of
the Busted Butte UZTT with observations of probable infl uences
from experimental design and sampling techniques. Th e fi nite
element heat and mass transfer porous fl ow simulator (FEHM;
Zyvoloski et al., 1997; Zyvoloski, 2007), populated with labora-
tory-measured hydrologic properties, was then used to verify that
our conceptual model of transport through unsaturated tuff can
reproduce the Phase 1B tracer data. Th e fi nite element heat and
mass transfer porous fl ow simulator solves multiphase fl uid fl ow
and tracer transport on a numerical grid representing the domain
of the tracer test at the Busted Butte fi eld site.
We conducted a number of diff erent optimization runs to
fully explore the parameter space and better understand the opti-
mized values of the parameters. To this end, we conducted a
parallel implementation of AMALGAM-SO (Vrugt et al., 2008)
to fi nd the best attainable values by sampling a broad range of
porosity, saturation, van Genuchten’s n and α, the horizontal
and vertical permeability, and the eff ective porous medium dif-
fusion coeffi cient of the rock. Unfortunately, this optimization
fi nds a single best parameter combination without recourse to
examining the uncertainty associated with this solution. Th us, in
a second step, we use the Shuffl ed Complex Evolution Metropolis
(SCEM-UA) global optimization algorithm developed by Vrugt
et al. (2003a,b) to densely sample the parameter space in the
vicinity of the global optimum. Th is exhaustive evaluation of the
solution space was used to estimate parameter uncertainty and
correlation and therefore provides important insights into which
processes in FEHM are very well understood and which processes
are not very well understood at the Busted Butte fi eld site.
Hydrogeologic Se ngBusted Butte lies in the north-central part of the Basin and
Range physiographic province, which is characterized by exten-
sional tectonism and magmatism active during the Middle and
Late Cenozoic eras (Stuckless and Dudley, 2002). Busted Butte is
a small (2.5 by 1 km) mountain block composed of the Miocene
Paintbrush Group (Scott and Bonk, 1984). Th e Busted Butte Test
Site is located within a horst bound by the Paintbrush Canyon
Fault on the west and the Busted Butte Fault on the east (Bussod
et al., 1998). Th e Busted Butte test block lies in the unsaturated
zone within the Topopah Spring Tuff unit of the Paintbrush
group, a moderately to densely welded, rhyolitic ash-fl ow tuff
dated at 12.8 million yr. It is divided into two units, a lower crys-
tal-poor unit (Tptpv1) and an upper crystal-rich unit (Tptpv2).
Th e tuff is compositionally zoned, with high-silica rhyolite in
Tptpv1 and quartz latite in Tptpv2 (Stuckless and Dudley, 2002).
Th e Tptpv2 unit consists of a tan, partly welded ignimbrite with
columnar jointing. Pumice clasts are typically 1 to 6 cm in their
long dimension and exhibit fl attening ratios from 6:1 to 8:1. Th e
matrix consists of black glass shards in a tan ashy matrix. Welding
increases upsection (Bechtel SAIC Company, 2004b). Th e Phase
1B tracer test block is located in the lower part of Tptpv2 just
above the contact between the two units.
Tracer Test DesignTh e underground test facility constructed at Busted Butte
consists of a 75-m main adit and a 19-m test alcove perpendicular
to the adit. Th e excavated adit provided access to exposed surfaces
of the Topopah Springs and Calico Hills tuff s. Construction was
coordinated to ensure minimal disturbance of the in situ test
block. To limit evaporation from the test region, shotcrete and
sodium silicate glass were applied to the tunnel walls and an
airlock was constructed at the entryway.
Before testing, numerous rock and pore water samples were
collected from nearby outcrops and from the tunnel. Pore water
and rock samples were analyzed at the Los Alamos National
Laboratory (LANL) for their chemical composition and lithologic
and mineralogic properties (Turin et al., 2002). Th ese samples
were used to characterize the lithology and to create synthetic
pore water for use in the tracer test.
Phase 1B made use of four horizontal, 2-m-long, 0.1-m-diam-
eter boreholes. Figure 1 shows a vertical cross-section of the drilling
face with stratigraphy and the relative locations of the diff erent
boreholes within the Phase 1B test. Tracer injection began with
an average injection rate of 8 mL/h in Borehole 5 and 1 mL/h in
Borehole 7. Injection in Borehole 7 was terminated after 181 d,
while injection in Borehole 5 was terminated after 190 d.
A variety of nonreactive, reactive, and colloidal tracers
(Table 1) were injected simultaneously to provide a range of
breakthrough data to help validate our conceptual models for
the diff erent styles of transport at this site. Additionally, the
simultaneous use of multiple tracers with diff erent transport
properties is likely to increase information retrieval from the
subsurface and should better constrain the various parameters
that are necessary for accurate prediction of fl ow and transport.
Turin et al. (2002) provided a detailed discussion of the criteria
used to select each tracer. Bromide is a nonreactive tracer and
should move with the injected water. A nonreactive tracer in
the context of this study means that no signifi cant quantity of
the tracer interacts with the rock during the time of the experi-
ment, while a reactive tracer showed measurable retardation in
controlled laboratory tracer studies (Anghel et al., 2002; Turin et
al., 2002). Sodium fl uorescein and pyridone are also nonreactive
F . 1. Phase 1B geometry on the ver cal drilling face of the alcove, showing the rela ve loca ons of the injec on boreholes (BH-5 and BH-7), collec on boreholes (BH-6 and BH-8) and the tuff units Tptpv2–Tptpv1 contact.
T 1. Composi on of the Phase 1B tracer solu on.
Tracer Concentra on
LiBr 500 ± <5 mg/LSodium fl uorescein (uranine, acid yellow 73) 500 ± <5 mg/LPentafl uorobenzoic acid in Borehole 7 100 ± <1 mg/L2,6-difl uorobenzoic acid in Borehole 5 100 ± <1 mg/LCarbomoyl-2(1H)-pyridone 100 ± <1 mg/LFluorescent polystyrene microspheres 1 ± <0.01 mL/L
www.vadosezonejournal.org · Vol. 8, No. 2, May 2009 512
and were used as markers that could be detected in the fi eld using
ultraviolet illumination at concentration levels of approximately
10 mg/kg. Pentafl uorobenzoic acid and 2,6-difl uorobenzoic acid
(2,6-diFBA) are nonreactive tracers and were used to tag the
two injection boreholes according to injection rates (i.e., 8 and
1 mL/h rates, respectively) in the event that injection from one
test reached the receptor pads for the other test. Lithium was
chosen as a weakly sorbing tracer. Fluorescent polystyrene latex
microspheres of two sizes (0.3- and 1-μm diameter) were used as
colloid tracers. To minimize the reactivity of the tracer solution
with country rock, synthetic pore water based on the measured
in situ composition was used (Turin et al., 2002).
Injection and sampling of tracers was accomplished using
two pneumatically infl ated borehole sealing and measurement
systems (Tseng and Bussod, 2001; Turin et al., 2004). Tracer
solution was pumped from a tank into the injection boreholes
and delivered to a fabric pad, held in place by the packer, which
helped to confi ne the fl ow to a well-defi ned injection point at
130 cm into each borehole. Moisture sensors were mounted
on the outside of the packers at each injection port to monitor
both ambient and injection moisture levels. Sensors consisted of
two wires separated a fi xed distance apart and embedded in the
pad assembly, and the resistance between these two wires was
measured using a datalogger (Bechtel SAIC Company, 2004b).
Th e packers were made of transparent material to allow visual
inspection of the injection points and borehole geology with both
standard and ultraviolet illumination.
Pore-water samples were collected from Boreholes 6 and 8
(Fig. 1) using absorptive fi lter paper pads and an inverting mem-
brane. Th e inverting membranes consisted of welded tubes of
double-coated polyester fabric 0.1 m in diameter. A mesh pocket
ran the length of each membrane to hold the sampling pads in
place. Each pad consisted of a bundle of 10 disks of Whatman
no. 42 fi lter paper approximately 0.047 m in diameter, and pads
were located along the borehole at approximately 10-cm intervals.
Th e membranes were removed and replaced every 1 to 2 wk. After
removal, the pads were packaged individually in 60-mL amber
Nalgene bottles and shipped to LANL for analysis. Bromide and
the fl uorobenzoic acids were extracted from the pads using a
bicarbonate–carbonate buff er solution, and Li was extracted using
2% HNO3. A total of 176 pads were extracted for tracers, and
the extracts were analyzed by ion chromatography, inductively
coupled plasma–mass spectrometry, high performance liquid
chromatography, spectrofl uorimetry, and epifl uorescent micros-
copy. Th e total moisture content of the pads was determined by
oven drying. Tracer concentrations were determined by dividing
the mass of a given tracer from the extraction by the total mois-
ture content of that sample. Turin et al. (2004) described the
extraction technique in more detail.
Tracer Breakthrough MeasurementsBreakthrough of all five solute tracers was detected in
Borehole 6, directly beneath the 8 mL/h injection site in Borehole
5. No breakthrough was detected in Borehole 8, which is situated
below the 1 mL/h injection site in Borehole 7. No clear evidence
of microsphere breakthrough was detected in either borehole.
All fi ve tracers observed in Borehole 6 showed peak con-
centrations at a horizontal distance of approximately 130 cm
from the end of the borehole, directly below the injection port
in Borehole 5; however, the maximum recovery of a given tracer
at a given collection point varied greatly in Borehole 6. Bromide
and 2,6-diFBA, both anionic nonreactive tracers, showed similar
and reasonable breakthrough patterns, with initial breakthrough
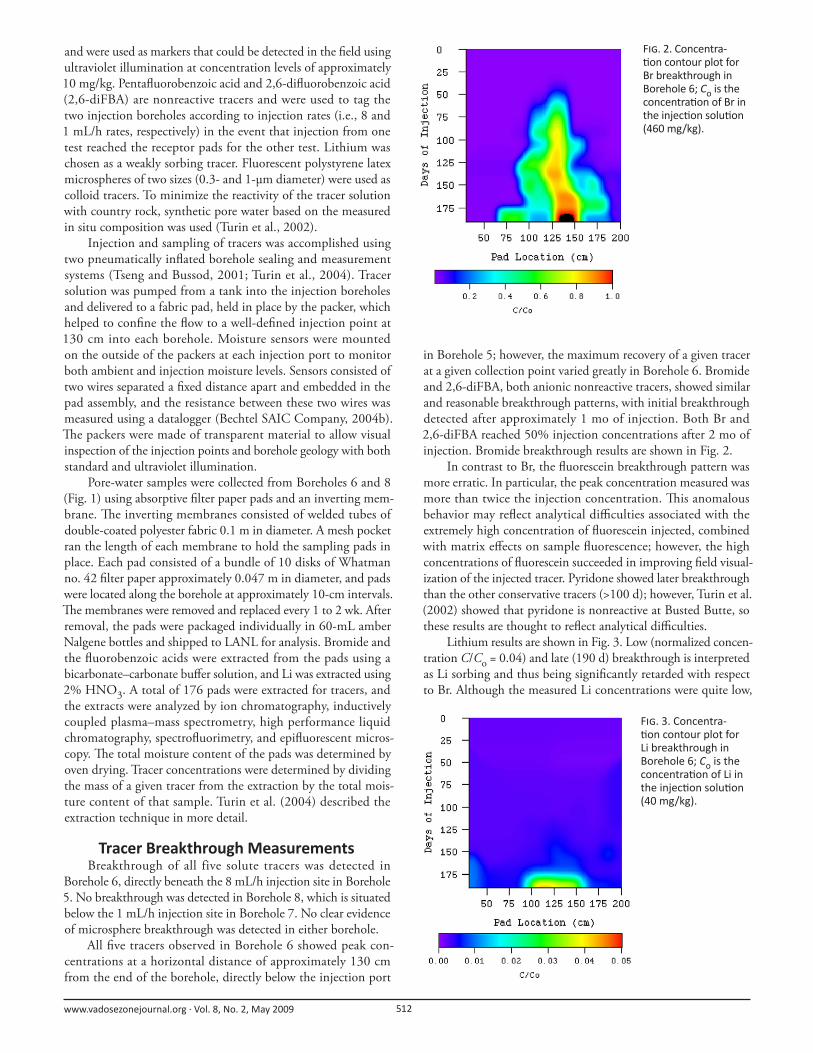
detected after approximately 1 mo of injection. Both Br and
2,6-diFBA reached 50% injection concentrations after 2 mo of
injection. Bromide breakthrough results are shown in Fig. 2.
In contrast to Br, the fl uorescein breakthrough pattern was
more erratic. In particular, the peak concentration measured was
more than twice the injection concentration. Th is anomalous
behavior may refl ect analytical diffi culties associated with the
extremely high concentration of fl uorescein injected, combined
with matrix eff ects on sample fl uorescence; however, the high
concentrations of fl uorescein succeeded in improving fi eld visual-
ization of the injected tracer. Pyridone showed later breakthrough
than the other conservative tracers (>100 d); however, Turin et al.
(2002) showed that pyridone is nonreactive at Busted Butte, so
these results are thought to refl ect analytical diffi culties.
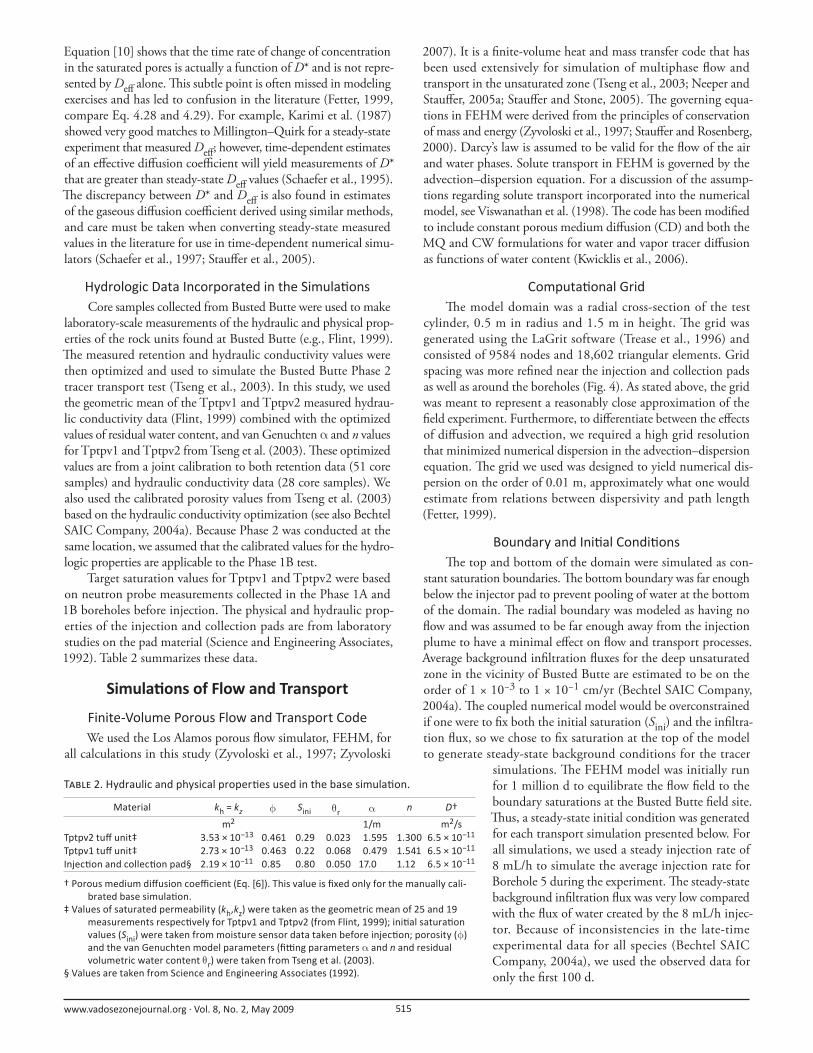
Lithium results are shown in Fig. 3. Low (normalized concen-
tration C/Co = 0.04) and late (190 d) breakthrough is interpreted
as Li sorbing and thus being signifi cantly retarded with respect
to Br. Although the measured Li concentrations were quite low,
F . 2. Concentra- on contour plot for
Br breakthrough in Borehole 6; Co is the concentra on of Br in the injec on solu on (460 mg/kg).
F . 3. Concentra- on contour plot for
Li breakthrough in Borehole 6; Co is the concentra on of Li in the injec on solu on (40 mg/kg).

www.vadosezonejournal.org · Vol. 8, No. 2, May 2009 513
their contrast with background levels and their consistent loca-
tion both in time and space indicate that Li breakthrough was
indeed observed in the fi eld.
A qualitative discussion of the Phase 1B tracer results can
be found in Robinson and Bussod (2000). Th ey asserted that,
although the earliest breakthrough occurred at the location of the
fracture that connects Borehole 5 to Borehole 6 (at 130 cm in
from the drilling face, Fig. 2), the fi rst arrival of Br at the collector
in Borehole 6 was between 28 and 35 d, far longer than would
be expected if fl ow had been channeled preferentially through
the fracture based on a reasonable increase in fracture permeabil-
ity. Additionally, Br was detected in <100 d in lateral collector
pads located up to 30 cm away from the fracture plane (Fig. 2).
Th e conclusion that the fracture at this site is not contributing
signifi cantly to fl ow and transport is also supported by Bechtel
SAIC Company (2004a). Because the previous work concluded
that the fracture located within the test block played little to no
role in fl ow or transport, we do not further discuss fracture fl ow
with respect to Phase 1B.
We used the tracer data to constrain numerical models that
were designed to provide insight into hydrologic parameterization
at the scale of the Busted Butte test bed.
Tracer Test Conceptual ModelModel Domain
To simplify the numerical analysis, the test block was con-
ceptualized as a vertical cylinder with a radius of 0.5 m and a
height of 1.5 m. Assuming radial symmetry, the test block was
simplifi ed as a radial plane that was projected around the verti-
cal axis to solve the equations of fl ow and tracer transport in a
three-dimensional volume (Fig. 4). Th e test cylinder was divided
into two lithologic units along the assumed horizontal contact
between Unit 2 and Unit 1 of the Topopah Springs Tuff . Each
lithologic unit was assumed to be homogeneous. As a result of the
simplifi ed radial geometry, the injection and collection boreholes
were modeled as spheres along the central axis of the cylinder. Th e
injection pad was explicitly included in the bottom of Borehole
5. Th e collection pad located directly beneath the injector was
explicitly included at the top of Borehole 6. Th ese modifi cations
are relatively minor and the numerical grid captures the volume
and radial nature of the experimental fl ow much more closely
than a two-dimensional Cartesian representation. Th e approxi-
mation of radial symmetry introduces more spherical fl ow than
would be simulated in a true three-dimensional representation
of the domain; however, the eff ect is fairly small and quantifi -
able. We calculated that the radial symmetry assumption provided
3.5% more volume for the injected water to move into; however,
this slight change in volume does not signifi cantly change any of
our conclusions.
Flow and Transport ModelsUnsaturated water fl ow was modeled using the water reten-
tion relationships of van Genuchten (1980), and the following
two equations describe the relative permeability and capillary
pressure functions that were used in this study:
( )⎡ ⎤= − −⎢ ⎥
⎢ ⎥⎣ ⎦
21/
l 1.0 1.0mmR S S [1]
( ) −−= ρ −α
1.01/cap l
11.0
mmP g S [2]
where m (dimensionless) = (1 − 1/n), Rl (dimensionless) is the
relative permeability multiplier for the liquid water saturated
permeability, S (dimensionless) is the saturation, Pcap (Pa) is
the capillary pressure, ρl (kg/m3) is the liquid water density, g
(m/s2) is the magnitude of the gravitational force vector, and
α (m−1) and n (dimensionless) are experimentally determined
fi tting parameters.
We assumed that advective fl uid fl ow is driven by the sum
of the matric and gravitational potentials and can be represented
using a two-phase formulation of Darcy’s law for the movement
of both water and air (Stauff er and Rosenberg, 2000; Zyvoloski
et al., 1997). Characteristic curves were generated by optimiz-
ing laboratory data to the van Genuchten–Mualem model,
described in more detail by Tseng et al. (2003). Solute transport
was described by the advection–dispersion equation, with modi-
fi cations to include sorption (Fetter, 1999). In this theory, tracer
migration is controlled by bulk water fl ow, mechanical mixing
(dispersion), chemical reactions, and molecular diff usion. In
unsaturated porous media, the molecular diff usion coeffi cient can
be expressed as a function of volumetric water content because
the random motions that cause diff usion are restricted to ever
more tortuous pathways as water content decreases (Millington
and Quirk, 1961).
Tracer Chosen for Simula onBromide was chosen for the solute transport modeling study
because it was the most robust of the nonreactive tracers and
showed the most stable breakthrough from the experimental data.
Lithium was evaluated for use in this study as the reactive tracer;
however, breakthrough levels were considered too low to be useful
F . 4. Model domain with the numerical grid shown and the tuff units Tptpv2–Tptpv1 contact. Injec on occurred at radius r = 0.0 and eleva- on z = 0.95 m and the
axial collector is located at r = 0, z = 0.7 m.

www.vadosezonejournal.org · Vol. 8, No. 2, May 2009 514
in modeling. Th e free water diff usion coeffi cient for Br is 2.09 ×
10−9 m2/s at 20°C (Fetter, 1999).
Models for Diff usion as a Func on of Water ContentA porous medium diff usion coeffi cient, D* (m2/s), was used
in the model to account for the tortuosity of the porous medium,
which reduces the ability of a chemical to diff use through the
water in the pore spaces (Clennell, 1997). Th is parameter should
not be confused with the matrix diff usion parameter used in
large-scale simulations to account for interaction between frac-
tures and the surrounding porous medium (Liu et al., 2005). We
investigated two alternate functions from the literature that are
commonly used to calculate diff usion as a function of volumetric
water content and converted them into formulations that could
be used in the simulations.
Th e fi rst function is based on a modifi ed version of the
Millington–Quirk (MQ) tortuosity relationship (Jury and
Gardner, 1991) and calculates an eff ective diff usion coeffi cient,
Deff (m2/s), as
θ=
φ
10/3free w
eff 2
DD [3]
where Dfree is the free-water diff usion coeffi cient, θw (m3/m3)
is the volumetric water content, defi ned as the volume of water
divided by the total volume of rock, and φ (dimensionless)
denotes the porosity.
The second function that we explored was adapted
from Conca and Wright (2000), here referred to as the CW
model. Th eir formulation is based on measurements using the
Unsaturated Flow Apparatus (UFA) and covers a range of soil
and rock types for solutions of NaCl and KCl. Th e UFA does
not directly measure diffusion; however, it measures electri-
cal current in an essentially uniform water content so that the
Nernst–Einstein equation can be used to estimate Deff . A good
fi t to the UFA data is expressed (in m2/s) as (adapted from Conca
and Wright, 2000)
− + θ + θ=2
w w8.1 2.7(log ) 0.32(log )eff 10D [4]
Figure 5A shows values of Deff calculated using these two models.
At high volumetric water contents, the models break down, giving
values that are close to the free-water diff usion coeffi cient. Both
Eq. [3] and [4] are based on solution of the steady-state equation
for contaminant fl ux (Fick’s fi rst law):
= ∇effJ D C [5]
where C is the concentration (mol/L) and J is the solute fl ux [mol/
(m2 s)] (Stauff er, 2006). Th e fi nite element heat and mass transfer
porous fl ow simulator and other porous fl ow simulators generally use
the following equation for solute fl ux that explicitly removes volu-
metric water content, isolating the diff usion coeffi cient that is seen by
chemicals within the liquid-fi lled pores (Ho and Webb, 1998):
= θ ∇w *J D C [6]
leading to a relationship between the porous medium diff usion
coeffi cient, D*, and reported values of Deff as
=θ
eff
w
*D
D [7]
Figure 5B shows values of D* calculated from both the MQ and
CW models. Th e values at any volumetric water content are
higher than the values calculated using Eq. [3] and [4]. Because
Eq. [5] does not separate the water content from the actual porous
medium diff usion coeffi cient, one cannot simply substitute Deff
into Fick’s second law. Th e correct form of Fick’s second law for
partially saturated porous media is expressed as (Bear and Verruijt,
1989, Eq. 6.3.2; Fetter, 1999, Eq. 4.33)
θ=∇⋅ =∇⋅θ ∇w
w
d*
d
CJ D C
t [8]
Substituting J from Eq. [5], we arrive at
θ=∇⋅ ∇w
eff
d
d
CD C
t [9]
Th is can be rewritten, assuming that volumetric water content is
not changing locally, in the more traditional form as
=∇⋅ ∇ =∇⋅ ∇θ
eff
w
d*
d
C DC D C
t [10]
F . 5. Comparison of the Millington–Quirk and Conca–Wright formula ons for (A) the eff ec ve diff usion coeffi cient, Deff , from Eq. [5], and (B) the porous medium diff usion coeffi cient, D* from Eq. [6]. The porosity used in the calcula on of the Millington–Quirk curve (φ = 0.463) is from the base case model (Table 2).
www.vadosezonejournal.org · Vol. 8, No. 2, May 2009 515
Equation [10] shows that the time rate of change of concentration
in the saturated pores is actually a function of D* and is not repre-
sented by Deff alone. Th is subtle point is often missed in modeling
exercises and has led to confusion in the literature (Fetter, 1999,
compare Eq. 4.28 and 4.29). For example, Karimi et al. (1987)
showed very good matches to Millington–Quirk for a steady-state
experiment that measured Deff ; however, time-dependent estimates
of an eff ective diff usion coeffi cient will yield measurements of D*
that are greater than steady-state Deff values (Schaefer et al., 1995).
Th e discrepancy between D* and Deff is also found in estimates
of the gaseous diff usion coeffi cient derived using similar methods,
and care must be taken when converting steady-state measured
values in the literature for use in time-dependent numerical simu-
lators (Schaefer et al., 1997; Stauff er et al., 2005).
Hydrologic Data Incorporated in the Simula onsCore samples collected from Busted Butte were used to make
laboratory-scale measurements of the hydraulic and physical prop-
erties of the rock units found at Busted Butte (e.g., Flint, 1999).
Th e measured retention and hydraulic conductivity values were
then optimized and used to simulate the Busted Butte Phase 2
tracer transport test (Tseng et al., 2003). In this study, we used
the geometric mean of the Tptpv1 and Tptpv2 measured hydrau-
lic conductivity data (Flint, 1999) combined with the optimized
values of residual water content, and van Genuchten α and n values
for Tptpv1 and Tptpv2 from Tseng et al. (2003). Th ese optimized
values are from a joint calibration to both retention data (51 core
samples) and hydraulic conductivity data (28 core samples). We
also used the calibrated porosity values from Tseng et al. (2003)
based on the hydraulic conductivity optimization (see also Bechtel
SAIC Company, 2004a). Because Phase 2 was conducted at the
same location, we assumed that the calibrated values for the hydro-
logic properties are applicable to the Phase 1B test.
Target saturation values for Tptpv1 and Tptpv2 were based
on neutron probe measurements collected in the Phase 1A and
1B boreholes before injection. Th e physical and hydraulic prop-
erties of the injection and collection pads are from laboratory
studies on the pad material (Science and Engineering Associates,
1992). Table 2 summarizes these data.
Simula ons of Flow and Transport
Finite-Volume Porous Flow and Transport CodeWe used the Los Alamos porous fl ow simulator, FEHM, for
all calculations in this study (Zyvoloski et al., 1997; Zyvoloski
2007). It is a fi nite-volume heat and mass transfer code that has
been used extensively for simulation of multiphase fl ow and
transport in the unsaturated zone (Tseng et al., 2003; Neeper and
Stauff er, 2005a; Stauff er and Stone, 2005). Th e governing equa-
tions in FEHM were derived from the principles of conservation
of mass and energy (Zyvoloski et al., 1997; Stauff er and Rosenberg,
2000). Darcy’s law is assumed to be valid for the fl ow of the air
and water phases. Solute transport in FEHM is governed by the
advection–dispersion equation. For a discussion of the assump-
tions regarding solute transport incorporated into the numerical
model, see Viswanathan et al. (1998). Th e code has been modifi ed
to include constant porous medium diff usion (CD) and both the
MQ and CW formulations for water and vapor tracer diff usion
as functions of water content (Kwicklis et al., 2006).
Computa onal GridTh e model domain was a radial cross-section of the test
cylinder, 0.5 m in radius and 1.5 m in height. Th e grid was
generated using the LaGrit software (Trease et al., 1996) and
consisted of 9584 nodes and 18,602 triangular elements. Grid
spacing was more refi ned near the injection and collection pads
as well as around the boreholes (Fig. 4). As stated above, the grid
was meant to represent a reasonably close approximation of the
fi eld experiment. Furthermore, to diff erentiate between the eff ects
of diff usion and advection, we required a high grid resolution
that minimized numerical dispersion in the advection–dispersion
equation. Th e grid we used was designed to yield numerical dis-
persion on the order of 0.01 m, approximately what one would
estimate from relations between dispersivity and path length
(Fetter, 1999).
Boundary and Ini al Condi onsTh e top and bottom of the domain were simulated as con-
stant saturation boundaries. Th e bottom boundary was far enough
below the injector pad to prevent pooling of water at the bottom
of the domain. Th e radial boundary was modeled as having no
fl ow and was assumed to be far enough away from the injection
plume to have a minimal eff ect on fl ow and transport processes.
Average background infi ltration fl uxes for the deep unsaturated
zone in the vicinity of Busted Butte are estimated to be on the
order of 1 × 10⁻³ to 1 × 10⁻¹ cm/yr (Bechtel SAIC Company,
2004a). Th e coupled numerical model would be overconstrained
if one were to fi x both the initial saturation (Sini) and the infi ltra-
tion fl ux, so we chose to fi x saturation at the top of the model
to generate steady-state background conditions for the tracer
simulations. Th e FEHM model was initially run
for 1 million d to equilibrate the fl ow fi eld to the
boundary saturations at the Busted Butte fi eld site.
Th us, a steady-state initial condition was generated
for each transport simulation presented below. For
all simulations, we used a steady injection rate of
8 mL/h to simulate the average injection rate for
Borehole 5 during the experiment. Th e steady-state
background infi ltration fl ux was very low compared
with the fl ux of water created by the 8 mL/h injec-
tor. Because of inconsistencies in the late-time
experimental data for all species (Bechtel SAIC
Company, 2004a), we used the observed data for
only the fi rst 100 d.
T 2. Hydraulic and physical proper es used in the base simula on.
Material kh = kz φ Sini θr α n D†
m2 1/m m2/sTptpv2 tuff unit‡ 3.53 × 10⁻¹³ 0.461 0.29 0.023 1.595 1.300 6.5 × 10⁻¹¹
Tptpv1 tuff unit‡ 2.73 × 10⁻¹³ 0.463 0.22 0.068 0.479 1.541 6.5 × 10⁻¹¹
Injec on and collec on pad§ 2.19 × 10⁻¹¹ 0.85 0.80 0.050 17.0 1.12 6.5 × 10⁻¹¹
† Porous medium diff usion coeffi cient (Eq. [6]). This value is fi xed only for the manually cali-brated base simula on.
‡ Values of saturated permeability (kh,kz) were taken as the geometric mean of 25 and 19 measurements respec vely for Tptpv1 and Tptpv2 (from Flint, 1999); ini al satura on values (Sini) were taken from moisture sensor data taken before injec on; porosity (φ) and the van Genuchten model parameters (fi ng parameters α and n and residual volumetric water content θr) were taken from Tseng et al. (2003).
§ Values are taken from Science and Engineering Associates (1992).
www.vadosezonejournal.org · Vol. 8, No. 2, May 2009 516
Base Simula onTable 2 presents our best estimates of the hydrogeologic
parameters derived from previous studies using experiments on
rock core samples at the experimental fi eld site. Th ese values were
used to create a base simulation with FEHM. Th is fi rst simu-
lation demonstrated whether the previously determined values
of the hydrologic parameters for Tptpv2 provided an accurate
prediction of the Phase 1B tracer test. First, the base simulation
resulted in a background volumetric water content in the Tptpv2
of about 0.13, which is within measured neutron probe values
for this site and in agreement with observations of water content
presented in Tseng et al. (2003). Second, steady-state infi ltration
fl ux in the domain before injection was approximately 0.04 cm/
yr, which is well within the range of previously estimated values
of background infi ltration.
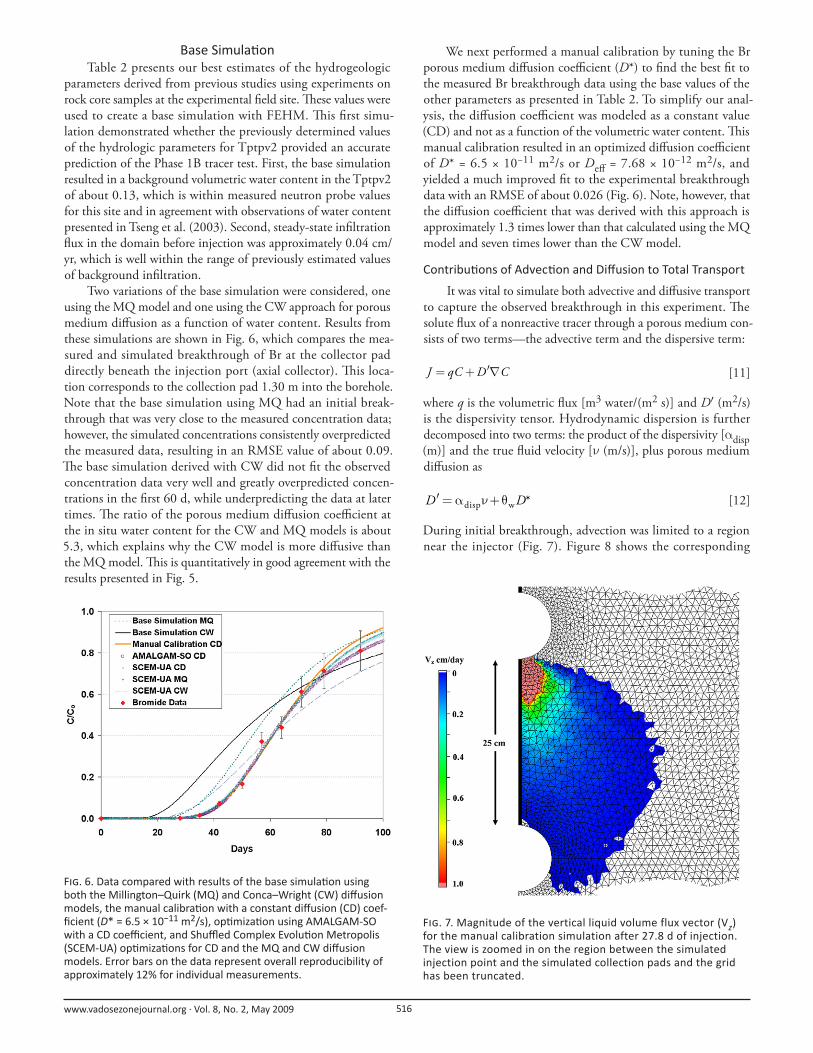
Two variations of the base simulation were considered, one
using the MQ model and one using the CW approach for porous
medium diff usion as a function of water content. Results from
these simulations are shown in Fig. 6, which compares the mea-
sured and simulated breakthrough of Br at the collector pad
directly beneath the injection port (axial collector). Th is loca-
tion corresponds to the collection pad 1.30 m into the borehole.
Note that the base simulation using MQ had an initial break-
through that was very close to the measured concentration data;
however, the simulated concentrations consistently overpredicted
the measured data, resulting in an RMSE value of about 0.09.
Th e base simulation derived with CW did not fi t the observed
concentration data very well and greatly overpredicted concen-
trations in the fi rst 60 d, while underpredicting the data at later
times. Th e ratio of the porous medium diff usion coeffi cient at
the in situ water content for the CW and MQ models is about
5.3, which explains why the CW model is more diff usive than
the MQ model. Th is is quantitatively in good agreement with the
results presented in Fig. 5.
We next performed a manual calibration by tuning the Br
porous medium diff usion coeffi cient (D*) to fi nd the best fi t to
the measured Br breakthrough data using the base values of the
other parameters as presented in Table 2. To simplify our anal-
ysis, the diff usion coeffi cient was modeled as a constant value
(CD) and not as a function of the volumetric water content. Th is
manual calibration resulted in an optimized diff usion coeffi cient
of D* = 6.5 × 10⁻¹¹ m2/s or Deff = 7.68 × 10⁻¹² m2/s, and
yielded a much improved fi t to the experimental breakthrough
data with an RMSE of about 0.026 (Fig. 6). Note, however, that
the diff usion coeffi cient that was derived with this approach is
approximately 1.3 times lower than that calculated using the MQ
model and seven times lower than the CW model.
Contribu ons of Advec on and Diff usion to Total Transport
It was vital to simulate both advective and diff usive transport
to capture the observed breakthrough in this experiment. Th e
solute fl ux of a nonreactive tracer through a porous medium con-
sists of two terms—the advective term and the dispersive term:
J qC D C′= + ∇ [11]
where q is the volumetric fl ux [m3 water/(m2 s)] and D′ (m2/s)
is the dispersivity tensor. Hydrodynamic dispersion is further
decomposed into two terms: the product of the dispersivity [αdisp
(m)] and the true fl uid velocity [ν (m/s)], plus porous medium
diff usion as
′=α ν+ θdisp w *D D [12]
During initial breakthrough, advection was limited to a region
near the injector (Fig. 7). Figure 8 shows the corresponding
F . 6. Data compared with results of the base simula on using both the Millington–Quirk (MQ) and Conca–Wright (CW) diff usion models, the manual calibra on with a constant diff usion (CD) coef-fi cient (D* = 6.5 × 10⁻¹¹ m2/s), op miza on using AMALGAM-SO with a CD coeffi cient, and Shuffl ed Complex Evolu on Metropolis (SCEM-UA) op miza ons for CD and the MQ and CW diff usion models. Error bars on the data represent overall reproducibility of approximately 12% for individual measurements.
F . 7. Magnitude of the vertical liquid volume flux vector (Vz) for the manual calibration simulation after 27.8 d of injection. The view is zoomed in on the region between the simulated injection point and the simulated collection pads and the grid has been truncated.
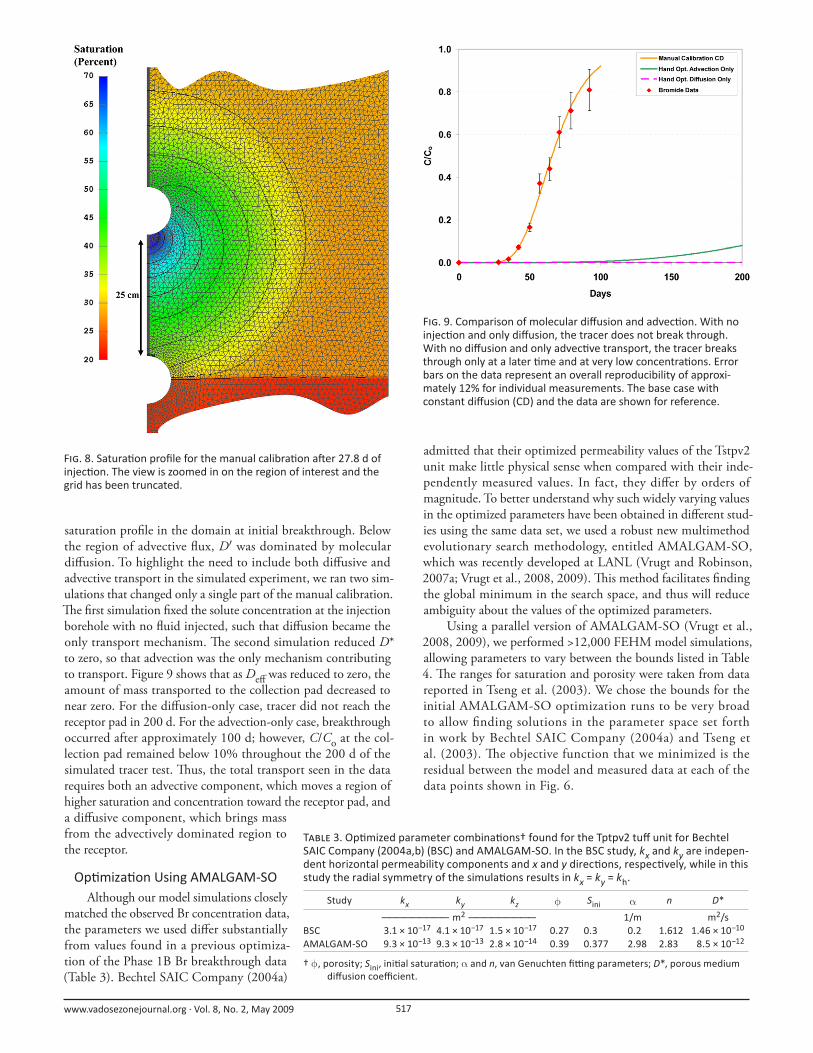
www.vadosezonejournal.org · Vol. 8, No. 2, May 2009 517
saturation profi le in the domain at initial breakthrough. Below
the region of advective fl ux, D′ was dominated by molecular
diff usion. To highlight the need to include both diff usive and
advective transport in the simulated experiment, we ran two sim-
ulations that changed only a single part of the manual calibration.
Th e fi rst simulation fi xed the solute concentration at the injection
borehole with no fl uid injected, such that diff usion became the
only transport mechanism. Th e second simulation reduced D*
to zero, so that advection was the only mechanism contributing
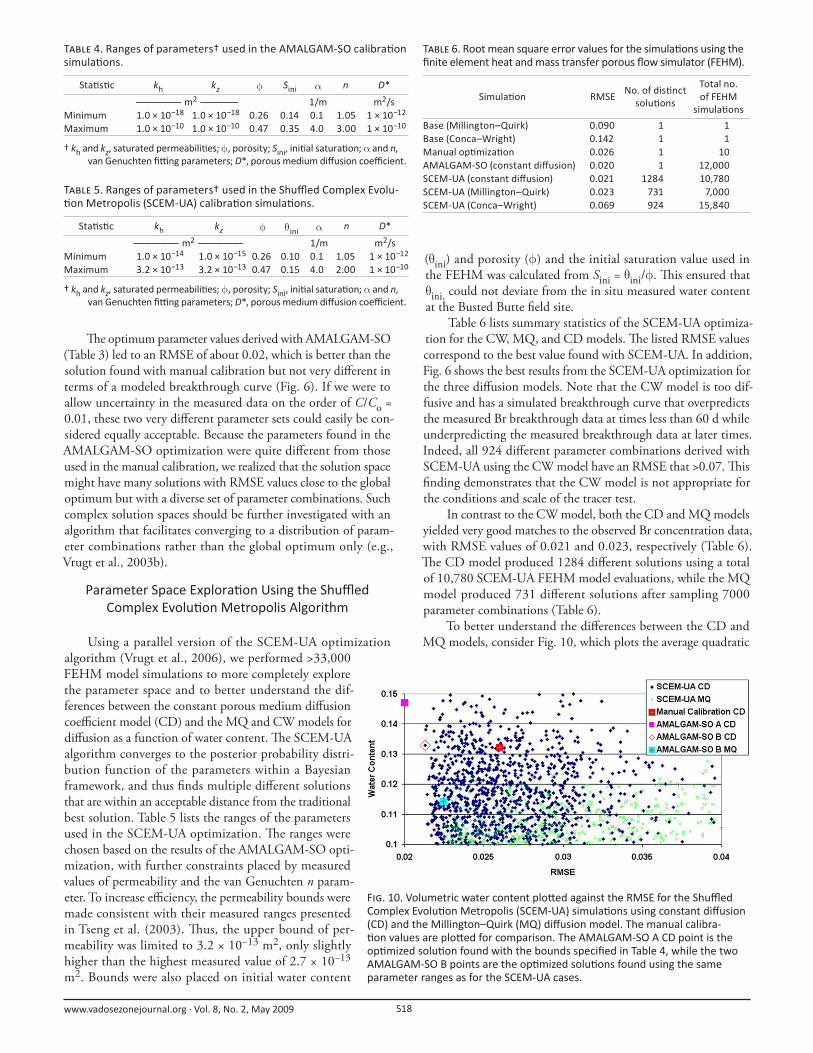
to transport. Figure 9 shows that as Deff was reduced to zero, the
amount of mass transported to the collection pad decreased to
near zero. For the diff usion-only case, tracer did not reach the
receptor pad in 200 d. For the advection-only case, breakthrough
occurred after approximately 100 d; however, C/Co at the col-
lection pad remained below 10% throughout the 200 d of the
simulated tracer test. Th us, the total transport seen in the data
requires both an advective component, which moves a region of
higher saturation and concentration toward the receptor pad, and
a diff usive component, which brings mass
from the advectively dominated region to
the receptor.
Op miza on Using AMALGAM-SOAlthough our model simulations closely
matched the observed Br concentration data,
the parameters we used diff er substantially
from values found in a previous optimiza-
tion of the Phase 1B Br breakthrough data
(Table 3). Bechtel SAIC Company (2004a)
admitted that their optimized permeability values of the Tstpv2
unit make little physical sense when compared with their inde-
pendently measured values. In fact, they diff er by orders of
magnitude. To better understand why such widely varying values
in the optimized parameters have been obtained in diff erent stud-
ies using the same data set, we used a robust new multimethod
evolutionary search methodology, entitled AMALGAM-SO,
which was recently developed at LANL (Vrugt and Robinson,
2007a; Vrugt et al., 2008, 2009). Th is method facilitates fi nding
the global minimum in the search space, and thus will reduce
ambiguity about the values of the optimized parameters.
Using a parallel version of AMALGAM-SO (Vrugt et al.,
2008, 2009), we performed >12,000 FEHM model simulations,
allowing parameters to vary between the bounds listed in Table
4. Th e ranges for saturation and porosity were taken from data
reported in Tseng et al. (2003). We chose the bounds for the
initial AMALGAM-SO optimization runs to be very broad
to allow fi nding solutions in the parameter space set forth
in work by Bechtel SAIC Company (2004a) and Tseng et
al. (2003). Th e objective function that we minimized is the
residual between the model and measured data at each of the
data points shown in Fig. 6.
F . 8. Satura on profi le for the manual calibra on a er 27.8 d of injec on. The view is zoomed in on the region of interest and the grid has been truncated.
F . 9. Comparison of molecular diff usion and advec on. With no injec on and only diff usion, the tracer does not break through. With no diff usion and only advec ve transport, the tracer breaks through only at a later me and at very low concentra ons. Error bars on the data represent an overall reproducibility of approxi-mately 12% for individual measurements. The base case with constant diff usion (CD) and the data are shown for reference.
T 3. Op mized parameter combina ons† found for the Tptpv2 tuff unit for Bechtel SAIC Company (2004a,b) (BSC) and AMALGAM-SO. In the BSC study, kx and ky are indepen-dent horizontal permeability components and x and y direc ons, respec vely, while in this study the radial symmetry of the simula ons results in kx = ky = kh.
Study kx ky kz φ Sini α n D*
————————— m2 ————————— 1/m m2/sBSC 3.1 × 10⁻¹⁷ 4.1 × 10⁻¹⁷ 1.5 × 10⁻¹⁷ 0.27 0.3 0.2 1.612 1.46 × 10⁻¹⁰
AMALGAM-SO 9.3 × 10⁻¹³ 9.3 × 10⁻¹³ 2.8 × 10⁻¹⁴ 0.39 0.377 2.98 2.83 8.5 × 10⁻¹²
† φ, porosity; Sini, ini al satura on; α and n, van Genuchten fi ng parameters; D*, porous medium diff usion coeffi cient.
www.vadosezonejournal.org · Vol. 8, No. 2, May 2009 518
Th e optimum parameter values derived with AMALGAM-SO
(Table 3) led to an RMSE of about 0.02, which is better than the
solution found with manual calibration but not very diff erent in
terms of a modeled breakthrough curve (Fig. 6). If we were to
allow uncertainty in the measured data on the order of C/Co =
0.01, these two very diff erent parameter sets could easily be con-
sidered equally acceptable. Because the parameters found in the
AMALGAM-SO optimization were quite diff erent from those
used in the manual calibration, we realized that the solution space
might have many solutions with RMSE values close to the global
optimum but with a diverse set of parameter combinations. Such
complex solution spaces should be further investigated with an
algorithm that facilitates converging to a distribution of param-
eter combinations rather than the global optimum only (e.g.,
Vrugt et al., 2003b).
Parameter Space Explora on Using the Shuffl ed Complex Evolu on Metropolis Algorithm
Using a parallel version of the SCEM-UA optimization
algorithm (Vrugt et al., 2006), we performed >33,000
FEHM model simulations to more completely explore
the parameter space and to better understand the dif-
ferences between the constant porous medium diff usion
coeffi cient model (CD) and the MQ and CW models for
diff usion as a function of water content. Th e SCEM-UA
algorithm converges to the posterior probability distri-
bution function of the parameters within a Bayesian
framework, and thus fi nds multiple diff erent solutions
that are within an acceptable distance from the traditional
best solution. Table 5 lists the ranges of the parameters
used in the SCEM-UA optimization. Th e ranges were
chosen based on the results of the AMALGAM-SO opti-
mization, with further constraints placed by measured
values of permeability and the van Genuchten n param-
eter. To increase effi ciency, the permeability bounds were
made consistent with their measured ranges presented
in Tseng et al. (2003). Th us, the upper bound of per-
meability was limited to 3.2 × 10⁻¹³ m2, only slightly
higher than the highest measured value of 2.7 × 10⁻¹³
m2. Bounds were also placed on initial water content
(θini) and porosity (φ) and the initial saturation value used in
the FEHM was calculated from Sini = θini/φ. Th is ensured that
θini, could not deviate from the in situ measured water content
at the Busted Butte fi eld site.
Table 6 lists summary statistics of the SCEM-UA optimiza-
tion for the CW, MQ, and CD models. Th e listed RMSE values
correspond to the best value found with SCEM-UA. In addition,
Fig. 6 shows the best results from the SCEM-UA optimization for
the three diff usion models. Note that the CW model is too dif-
fusive and has a simulated breakthrough curve that overpredicts
the measured Br breakthrough data at times less than 60 d while
underpredicting the measured breakthrough data at later times.
Indeed, all 924 diff erent parameter combinations derived with
SCEM-UA using the CW model have an RMSE that >0.07. Th is
fi nding demonstrates that the CW model is not appropriate for
the conditions and scale of the tracer test.
In contrast to the CW model, both the CD and MQ models
yielded very good matches to the observed Br concentration data,
with RMSE values of 0.021 and 0.023, respectively (Table 6).
Th e CD model produced 1284 diff erent solutions using a total
of 10,780 SCEM-UA FEHM model evaluations, while the MQ
model produced 731 diff erent solutions after sampling 7000
parameter combinations (Table 6).
To better understand the diff erences between the CD and
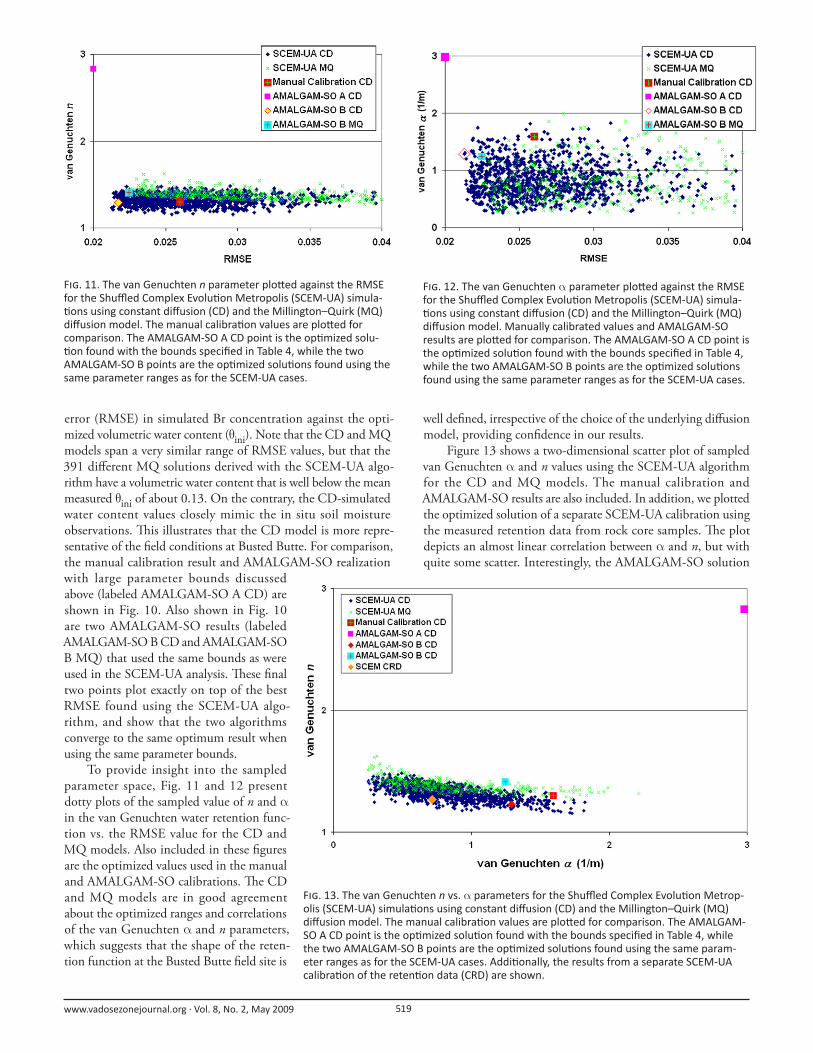
MQ models, consider Fig. 10, which plots the average quadratic
T 4. Ranges of parameters† used in the AMALGAM-SO calibra on simula ons.
Sta s c kh kz φ Sini α n D*
—————— m2 ————— 1/m m2/sMinimum 1.0 × 10⁻¹⁸ 1.0 × 10⁻¹⁸ 0.26 0.14 0.1 1.05 1 × 10⁻¹²
Maximum 1.0 × 10⁻¹⁰ 1.0 × 10⁻¹⁰ 0.47 0.35 4.0 3.00 1 × 10⁻¹⁰
† kh and kz, saturated permeabili es; φ, porosity; Sini, ini al satura on; α and n, van Genuchten fi ng parameters; D*, porous medium diff usion coeffi cient.
T 5. Ranges of parameters† used in the Shuffl ed Complex Evolu- on Metropolis (SCEM-UA) calibra on simula ons.
Sta s c kh kz φ θ ini α n D*
—————— m2 —————— 1/m m2/sMinimum 1.0 × 10⁻¹⁴ 1.0 × 10⁻¹⁵ 0.26 0.10 0.1 1.05 1 × 10⁻¹²
Maximum 3.2 × 10⁻¹³ 3.2 × 10⁻¹³ 0.47 0.15 4.0 2.00 1 × 10⁻¹⁰
† kh and kz, saturated permeabili es; φ, porosity; Sini, ini al satura on; α and n, van Genuchten fi ng parameters; D*, porous medium diff usion coeffi cient.
T 6. Root mean square error values for the simula ons using the fi nite element heat and mass transfer porous fl ow simulator (FEHM).
Simula on RMSENo. of dis nct
solu ons
Total no. of FEHM
simula ons
Base (Millington–Quirk) 0.090 1 1Base (Conca–Wright) 0.142 1 1Manual op miza on 0.026 1 10AMALGAM-SO (constant diff usion) 0.020 1 12,000SCEM-UA (constant diff usion) 0.021 1284 10,780SCEM-UA (Millington–Quirk) 0.023 731 7,000SCEM-UA (Conca–Wright) 0.069 924 15,840
F . 10. Volumetric water content plo ed against the RMSE for the Shuffl ed Complex Evolu on Metropolis (SCEM-UA) simula ons using constant diff usion (CD) and the Millington–Quirk (MQ) diff usion model. The manual calibra- on values are plo ed for comparison. The AMALGAM-SO A CD point is the
op mized solu on found with the bounds specifi ed in Table 4, while the two AMALGAM-SO B points are the op mized solu ons found using the same parameter ranges as for the SCEM-UA cases.
www.vadosezonejournal.org · Vol. 8, No. 2, May 2009 519
error (RMSE) in simulated Br concentration against the opti-
mized volumetric water content (θini). Note that the CD and MQ
models span a very similar range of RMSE values, but that the
391 diff erent MQ solutions derived with the SCEM-UA algo-
rithm have a volumetric water content that is well below the mean
measured θini of about 0.13. On the contrary, the CD-simulated
water content values closely mimic the in situ soil moisture
observations. Th is illustrates that the CD model is more repre-
sentative of the fi eld conditions at Busted Butte. For comparison,
the manual calibration result and AMALGAM-SO realization
with large parameter bounds discussed
above (labeled AMALGAM-SO A CD) are
shown in Fig. 10. Also shown in Fig. 10
are two AMALGAM-SO results (labeled
AMALGAM-SO B CD and AMALGAM-SO
B MQ) that used the same bounds as were
used in the SCEM-UA analysis. Th ese fi nal
two points plot exactly on top of the best
RMSE found using the SCEM-UA algo-
rithm, and show that the two algorithms
converge to the same optimum result when
using the same parameter bounds.
To provide insight into the sampled
parameter space, Fig. 11 and 12 present
dotty plots of the sampled value of n and α
in the van Genuchten water retention func-
tion vs. the RMSE value for the CD and
MQ models. Also included in these fi gures
are the optimized values used in the manual
and AMALGAM-SO calibrations. Th e CD
and MQ models are in good agreement
about the optimized ranges and correlations
of the van Genuchten α and n parameters,
which suggests that the shape of the reten-
tion function at the Busted Butte fi eld site is
well defi ned, irrespective of the choice of the underlying diff usion
model, providing confi dence in our results.
Figure 13 shows a two-dimensional scatter plot of sampled
van Genuchten α and n values using the SCEM-UA algorithm
for the CD and MQ models. The manual calibration and
AMALGAM-SO results are also included. In addition, we plotted
the optimized solution of a separate SCEM-UA calibration using
the measured retention data from rock core samples. Th e plot
depicts an almost linear correlation between α and n, but with
quite some scatter. Interestingly, the AMALGAM-SO solution
F . 11. The van Genuchten n parameter plo ed against the RMSE for the Shuffl ed Complex Evolu on Metropolis (SCEM-UA) simula- ons using constant diff usion (CD) and the Millington–Quirk (MQ)
diff usion model. The manual calibra on values are plo ed for comparison. The AMALGAM-SO A CD point is the op mized solu- on found with the bounds specifi ed in Table 4, while the two
AMALGAM-SO B points are the op mized solu ons found using the same parameter ranges as for the SCEM-UA cases.
F . 12. The van Genuchten α parameter plo ed against the RMSE for the Shuffl ed Complex Evolu on Metropolis (SCEM-UA) simula- ons using constant diff usion (CD) and the Millington–Quirk (MQ)
diff usion model. Manually calibrated values and AMALGAM-SO results are plo ed for comparison. The AMALGAM-SO A CD point is the op mized solu on found with the bounds specifi ed in Table 4, while the two AMALGAM-SO B points are the op mized solu ons found using the same parameter ranges as for the SCEM-UA cases.
F . 13. The van Genuchten n vs. α parameters for the Shuffl ed Complex Evolu on Metrop-olis (SCEM-UA) simula ons using constant diff usion (CD) and the Millington–Quirk (MQ) diff usion model. The manual calibra on values are plo ed for comparison. The AMALGAM-SO A CD point is the op mized solu on found with the bounds specifi ed in Table 4, while the two AMALGAM-SO B points are the op mized solu ons found using the same param-eter ranges as for the SCEM-UA cases. Addi onally, the results from a separate SCEM-UA calibra on of the reten on data (CRD) are shown.

www.vadosezonejournal.org · Vol. 8, No. 2, May 2009 520
with large parameter bounds (labeled AMALGAM-SO A
CD) does not plot anywhere near the high-density region
found with the SCEM-UA algorithm and appears physi-
cally unrealistic considering the optimized values of α and
n separately obtained from rock core samples. Th ese results
reinforce the importance of constrained optimization, with
parameter bounds dictated by values determined using inde-
pendent measurements.
Figure 14 plots the optimized horizontal and vertical
permeability (kh and kv) for the same solutions shown in Fig.
10 to 13. Th e CD and MQ models show good agreement
because values are aligned along the kh = kv line. Th e MQ
model predicts that kv should be slightly less than kh, while
the CD model predicts that kv should be slightly higher than
kh. Seemingly, the horizontal and vertical permeability are
of very similar magnitude, something that is to be expected
given the properties of the volcanic tuff at the Busted Butte
fi eld site. In contrast, the AMALGAM-SO solution with
large parameter bounds (labeled AMALGAM-SO A CD)
resulted in a horizontal permeability that is 1.5 orders of
magnitude greater than the vertical permeability. Th is graph
also helps to justify our use of tighter bounds on the per-
meability ranges, since very few values lie off the perfectly
linear 1:1 correlation, and as vertical permeability increased
above 3 × 10⁻¹³ m2, advective transport was too rapid and
not consistent with the experimental data.
Finally, we present D* as a function of the RMSE for
the CD and MQ models. Figure 15 shows that the CD
model assigns a very high probability to the diff usion coef-
fi cient at the Busted Butte fi eld site being smaller than 2
× 10−11 m2/s (75%), while the MQ model more evenly
spreads the probability mass of D* between 4 × 10⁻¹¹ and
1 × 10⁻¹⁰ m2/s. We conclude that both models give a very
good fi t to the observed Br concentration data at the Busted
Butte fi eld site but result in quite diff erent optimized values
and distributions of D*. Th is is an important fi nding that
deserves careful interpretation. Interestingly, we found no
correlation between D* and either α or kv, implying that the
trade-off between advective and diff usive transport is likely
to be controlled by more complex parameter interactions.
DiscussionAlthough the AMALGAM-SO and manual calibration
parameter estimates gave good matches to the measured
Br concentration data, these two approaches do not pro-
vide insight into parameter uncertainty. Th e SCEM-UA
algorithm provides a methodology to assess ranges of indi-
vidual parameters that can be considered acceptable given
the experimental data for calibration. Ranges derived from
a SCEM-UA analysis such as this could be useful in large-scale
Monte Carlo style performance assessments (PA) (Robinson et
al., 2003). For example, Fig. 11 suggests that a very narrow range
of the van Genuchten parameter n would be appropriate, while
Fig. 12 reduces the original range in α by more than a factor of
two. Figure 13 provides justifi cation for correlating α and n, thus
reducing the sampling needs in Monte Carlo simulations. Figure
14 shows that the AMALGAM-SO A CD optimization, with
higher bounds permitted on n, led to an optimized solution with
signifi cant permeability anisotropy; however, when the bounds
on n were tightened to refl ect the site data, no signifi cant anisot-
ropy in permeability was found to fi t the breakthrough data using
any of the optimization techniques. Th us, Fig. 14 gives strong
evidence that allowing large anisotropy in permeability is not
justifi ed and also suggests a correlation that could reduce param-
eter sampling needs for PA calculations. Figure 15 shows that
two conceptual models for the porous medium diff usion coef-
fi cient would need to be used in PA calculations if one wanted
to appropriately capture the underlying uncertainty in transport
dominated by diff usion. Th is is consistent with approaches such
F . 14. Ver cal vs. horizontal permeability for the Shuffl ed Complex Evolu- on Metropolis (SCEM-UA) simula ons with RMSE <0.04 using constant
diff usion (CD) and the Millington–Quirk (MQ) diff usion model. The manual calibra on values are plo ed for comparison. The AMALGAM-SO A CD point is the op mized solu on found with the bounds specifi ed in Table 4, while the two AMALGAM-SO B points are the op mized solu ons found using the same parameter ranges as for the SCEM-UA cases. The diagonal line high-lights the region where horizontal and ver cal permeability are equal.
F . 15. The porous medium diff usion coeffi cient vs. RMSE for the Shuffl ed Complex Evolu on Metropolis (SCEM-UA) simula ons using constant dif-fusion (CD) and the Millington-Quirk (MQ) diff usion model. The manual calibra on values are plo ed for comparison. The AMALGAM-SO A CD point is the op mized solu on found with the bounds specifi ed in Table 4, while the two AMALGAM-SO B points are the op mized solu ons found using the same parameter ranges as for the SCEM-UA cases.

www.vadosezonejournal.org · Vol. 8, No. 2, May 2009 521
as Bayesian model averaging that are currently emerging in the
hydrologic literature (Neuman, 2003; Meyer et al., 2007; Vrugt
and Robinson, 2007b).
Although the CW and MQ models provide accurate
descriptions of fl ow and transport at very small spatial scales and
steady-state conditions, the transient nature and 25-cm transport
distance of the Phase 1B experiment has revealed a possible short-
coming in these model formulations. We posit that the porous
medium diff usion coeffi cient may be inversely related to the
experimental length scale. Th is would explain why the CW mea-
surements done on very small samples yielded consistently larger
diff usion coeffi cients than MQ estimates done on larger samples.
Following logic similar to that used to justify the increase in dis-
persivity that occurs as the fl ow path length increases (Gelhar et
al., 1992), we conjecture that diff usion may be reduced at larger
scales because harmonic averaging of heterogeneity in longer
paths puts more weight on areas of low diff usivity, thus increasing
the length of the tortuous path needed for a molecule to diff use
through the subsurface. Th is idea is supported by Kwicklis et al.
(2006), who also found that MQ and CW were overly diff usive
and their modeling required a lower D* to fi t long-term records
of stable isotopes and Cl− from the subsurface of the Nevada
Test Site. Support for the use a harmonically averaged diff usion
coeffi cient in the direction of transport can be found by analogy
to the well-known harmonic permeability relationship in porous
fl ow, because both diff usive transport and porous fl ow solve the
same diff usion equation.
Simulations that pinpoint the eff ects of diff usion and advec-
tion show that both the advective and diff usive mechanisms are
very important for solute transport in the Phase 1B experiment
(Fig. 7–9). Modeling results from the Phase 2 tracer test showed
that the system was insensitive to changes in the diff usion coef-
fi cient at scales >1 m (Tseng et al., 2003). Th e insensitivity of
Phase 2 to changes in the Br diff usion coeffi cient is related to
the higher fl ow velocities and one-dimensional fl ow fi eld, as dis-
cussed above. Phase 1A (Robinson and Bussod, 2000) was a more
qualitative experiment and did not have the spatial and temporal
resolution to determine an accurate eff ective diff usion coeffi cient.
Th erefore, the Phase 1B experiment provides important insight
that could not have been obtained from either Phase 1A or Phase
2 and highlights the need to collect experimental data at diff erent
spatial scales.
Finally, this study shows that unsaturated transport prob-
lems may have many near-optimum parameter combinations.
To ensure that uncertainty is adequately captured, one should
therefore use a range of parameter values in model predictions of
long-term fl ow and transport.
ConclusionsOptimized hydraulic parameters from laboratory-derived
retention functions of rock core samples provided a good descrip-
tion of Br breakthrough data at the collector located directly
beneath the injector. Th e simulations showed that both capillary
forces and gravity control the advective fl ux, while molecular dif-
fusion at this site is dependent on the highly tortuous pathways
that form in unsaturated rocks. Th e scale of the experiment was
such that we were clearly able to diff erentiate between diff usion
and advection.
Our optimization results with AMALGAM-SO and
SCEM-UA provide the necessary information to be able to
draw sound conclusions about which diff usion models were
best supported given the experimental data at the Busted Butte
fi eld site. Moreover, the posterior distribution derived with the
SCEM-UA algorithm provides important insight into parameter
uncertainty, and correlation, and can be used to effi ciently gener-
ate model output predictive distributions. Optimization results
lying far from independently measured hydrologic data show the
importance of constraining search algorithms to sample values of
parameters that are representative of fi eld measurements.
All our simulations support the conclusion that tracer break-
through in this experiment cannot be described adequately using
the CW model to calculate the unsaturated diff usion coeffi cient
as a function of porosity and volumetric water content. Th e MQ
model provided an excellent match to the observed Br concentra-
tion data; however, a lower constant porous medium diff usion
model, with a coeffi cient of approximately 1 × 10⁻¹¹ m2/s, also
yielded a signifi cant cluster of local solutions. Th is suggests that
at the scale of the experiment, diff usion may be reduced below
values calculated using MQ. Reducing porous medium diff u-
sion coeffi cients in partially saturated rock and soil could have
broad implications for understanding contaminant transport in
diff usion-controlled environments in the subsurface.
ATh is paper is dedicated in honor and loving memory of Wendy Soll,
whose vision and guidance form the foundation of this paper—fare thee well, Wendy. Th e experimental design, data collection, and initial modeling were supported by the Yucca Mountain Site Characterization Program Offi ce as part of the Civilian Radioactive Waste Management Program. Th is project is managed by the U.S. Department of Energy, Yucca Mountain Site Characterization Project. Special thanks to Gilles Bussod, without whom the tracer test would not have been possible. We thank T. Stockton of Neptune Inc. for providing the curve fi t to the Conca–Wright diff usion as a function of volumetric water content data, and gratefully acknowledge Michael Sully and John Tauxe for insightful discussions into the dependence of diff usion on volumetric water content. We also thank Bruce Robinson for many conversations that helped to improve this work. We highly appreciate the computer support provided by the SARA center for parallel computing at the University of Amsterdam, the Netherlands. J.A. Vrugt was supported by a J. Robert Oppenheimer Fellowship of the Los Alamos Postdoctoral Program. YMP project review led by Ming Zhu helped refi ne our argu-ments signifi cantly.
ReferencesAnghel, I., H.J. Turin, and P.W. Reimus. 2002. Lithium sorption to Yucca
Mountain tuff s. Appl. Geochem. 17:819–824.
Bear, J., and A. Verruijt. 1989. Modeling groundwater fl ow and pollution. D.
Reidel Publ. Co., Dordrecht, the Netherlands.
Bechtel SAIC Company. 2004a. Radionuclide transport models under ambient
conditions. DOC.20041101.0002, MDL-NBS-HS-000008 Rev 2. BSC,
Las Vegas, NV.
Bechtel SAIC Company. 2004b. In situ fi eld testing of processes. ANL-NBS-
HS-000005 REV 03. 1180. BSC, Las Vegas, NV.
Bussod, G.Y, K. Coen, and R.C. Eckhardt. 1998. LA testing status report: Bust-
ed Butte unsaturated zone transport test. YMP Deliverable SPU85M4.
Los Alamos Natl. Lab., Los Alamos, NM.
Clennell, B. 1997. Tortuosity: A guide through the maze. p. 299–344. In M.A.
Lovell and P.K. Harvey (ed.) Developments in petrophysics. Geol. Soc.
Spec. Publ. 122. Geol. Soc. London.
Conca, J.L., and J. Wright. 2000. Aqueous diff usion in the vadose zone. p. 796–
797. In B.B. Looney and R.W. Falta (ed.) Th e vadose zone. Battelle Press,
Columbus, OH.
Fetter, C.W. 1999. Contaminant hydrogeology. 2nd ed. Prentice Hall, Upper
Saddle River, NJ.

www.vadosezonejournal.org · Vol. 8, No. 2, May 2009 522
Flint, L.E. 1999. Laboratory and centrifuge measurements of physical and hy-
draulic properties of core samples from Busted Butte boreholes. Yucca
Mountain Project-U.S. Geological Survey Technical Data Record, DTN:
GS990708312242.008. Yucca Mountain Project.
Gelhar, L.W., C. Welty, and K.R. Rehfeldt. 1992. A critical review of data on
fi eld-scale dispersion in aquifers. Water Resour. Res. 28:1955–1974.
Ho, C., and S. Webb. 1998. Review of porous media enhanced vapor-phase
diff usion mechanisms, models, and data: Does enhanced vapor-phase dif-
fusion exist? J. Porous Media 1:71–92.
Jury, W.A., and W.R. Gardner. 1991. Soil physics. 5th ed. John Wiley & Sons,
New York.
Karimi, A.A., W.J. Farmer, and M.M. Cliath. 1987. Vapor-phase diff usion of
benzene in soil. J. Environ. Qual. 16:38–43.
Kwicklis, E.M., A.V. Wolfsberg, P.H. Stauff er, M.A. Walvrood, and M.J. Sully.
2006. Multiphase multicomponent parameter estimation for liquid and
vapor fl uxes in deep arid systems using hydrologic data and natural envi-
ronmental tracers. Vadose Zone J. 5:924–950.
Liu, H.H., G.S. Bodvarsson, and G. Zhang. 2005. Scale dependency of the ef-
fective matrix diff usion coeffi cient. Vadose Zone J. 3:312–315.
Meyer, P.D., M. Ye, M.L. Rockhold, S.P. Neuman, and K.J. Cantrell. 2007.
Combined estimation of hydrogeologic conceptual model, parameter, and
scenario uncertainty with application to uranium transport at the Han-
ford Site 300 Area. NUREG/CR-6940, PNNL-16396. U.S. Nucl. Regul.
Commiss., Washington, DC.
Millington, R.J., and J.P. Quirk. 1961. Permeability of porous solids. Trans.
Faraday Soc. 57:1200–1207.
Neeper, D.A., and P.H. Stauff er. 2005. Unidirectional gas fl ow in soil porosity re-
sulting from barometric pressure cycles. J. Contam. Hydrol. 78:281–289.
Neuman, S.P. 2003. Maximum likelihood Bayesian averaging of alternative
conceptual-mathematical models. Stochastic Environ. Res. Risk Assess.
17:291–305.
Robinson, B.A., and G.Y. Bussod. 2000. Radionuclide transport in the unsatu-
rated zone at Yucca Mountain: Numerical model and preliminary fi eld ob-
servations. p. 323–336. In B. Faybishenko et al. (ed.) Dynamics of fl uids
in fractured rocks: Concepts and recent advances. Geophys. Monogr. 122.
Am. Geophys. Union, Washington, DC.
Robinson, B.A., C. Li, and C.K. Ho. 2003. Performance assessment model de-
velopment and analysis of radionuclide transport in the unsaturated zone,
Yucca Mountain, Nevada. J. Contam. Hydrol. 62–63:249–268.
Schaefer, C.E., R.R. Arands, H.A. van der Sloot, and D.S. Kosson. 1995. Pre-
diction and experimental validation of liquid-phase diff usion resistance in
unsaturated soils. J. Contam. Hydrol. 20:145–166.
Schaefer, C.E., R.R. Arands, H.A. van der Sloot, and D.S. Kosson. 1997. Mod-
eling of the gaseous diff usion coeffi cient through unsaturated systems. J.
Contam. Hydrol. 29:1–21.
Science and Engineering Associates. 1992. Th e use of absorbent materials to collect
in situ vadose zone liquids. Topical Rep. SEATR-92–01. SEA, Santa Fe, NM.
Scott, R.B., and J. Bonk. 1984. Preliminary geologic map of Yucca Moun-
tain, Nye County, Nevada with geologic sections (1:12000). USGS-
OFR-84-494. USGS, Reston, VA.
Stauff er, P.H. 2006. Flux fl ummoxed. Ground Water 44:125–128.
Stauff er, P.H., K.H. Birdsell, M.S. Witkowski, and J.K. Hopkins. 2005. Vadose
zone transport of 1,1,1-trichloroethane: Conceptual model validation
through numerical simulation. Vadose Zone J. 4:760–773.
Stauff er, P.H., and N.D. Rosenberg. 2000. Vapor phase transport at a hillside
landfi ll. Environ. Eng. Geosci. 6:71–84.
Stauff er, P.H., and W.J. Stone. 2005. Surface water–groundwater connection
at the Los Alamos Canyon Weir Site: 2. Modeling of tracer test results.
Vadose Zone J. 4:718–728.
Stuckless, J.S., and W.W. Dudley. 2002. Th e geohydrologic setting of Yucca
Mountain, Nevada. Appl. Geochem. 17:659–682.
Trease, H., D. George, C.W. Gable, J. Fowler, A. Kuprat, and A. Khamyaseh.
1996. Th e X3D grid generation system. In B.K. Soni et al. (ed.) Numerical
grid generation in computational fl uid dynamics and related fi elds. Eng.
Res. Ctr., Mississippi State Univ. Press, Mississippi State, MS.
Tseng, P.-H., and G.Y. Bussod. 2001. Evaluation of the fi lter paper technique for
in-situ sampling of solute transport in unsaturated soils and tuff s. Water
Resour. Res. 37:1913–1928.
Tseng, P.-H., W.E. Soll, C.W. Gable, H.J. Turin, and G.Y. Bussod. 2003. Model-
ing unsaturated fl ow and transport processes at the Busted Butte Field Test
Site, Nevada. J. Contam. Hydrol. 62–63:303–318.
Turin, H.J., A.R. Groff man, L.E. Wolfsberg, J.L. Roach, and B.A. Strietelmeier.
2002. Tracer and radionuclide sorption to vitric tuff s of Busted Butte, Ne-
vada. Appl. Geochem. 17:825–836.
Turin, H.J., C.L. Jones, A.R. Groff man, S. Dalvit, S.D. Dunn, W.E. Lowry, and
W.E. Soll. 2004. Collection of unsaturated-zone water samples for tracer
analysis: Evaluation of an inverting membrane technique. Ground Water
Monit. Rev. 24:95–101.
van Genuchten, M.Th . 1980. A closed form equation for predicting hydraulic
conductivity of unsaturated soils. Soil Sci. Soc. Am. J. 44:892–898.
Viswanathan, H.S., B.A. Robinson, A.J. Valocchi, and I.R. Triay. 1998. A reac-
tive transport model of neptunium migration from the potential repository
at Yucca Mountain. J. Hydrol. 209:251–280.
Vrugt, J.A., W. Bouten, H.V. Gupta, and J.W. Hopmans. 2003b. Toward im-
proved identifi ability of soil hydraulic parameters: Suitable parametric
model. Vadose Zone J. 2:98–113.
Vrugt, J.A., H.V. Gupta, W. Bouten, and S. Sorooshian. 2003a. A Shuffl ed Com-
plex Evolution Metropolis algorithm for optimization and uncertainty as-
sessment of hydrologic model parameters. Water Resour. Res. 39(8):1201,
doi:10.1029/2002WR001642.
Vrugt, J.A., B.O. Nuallain, B.A. Robinson, W. Bouten, S.C. Dekker, and P.M.A.
Sloot. 2006. Application of parallel computing to stochastic parameter es-
timation in environmental models. Comput. Geosci. 32:1139–1155.
Vrugt, J.A., and B.A. Robinson. 2007a. Improved evolutionary optimization
from genetically adaptive multimethod search. Proc. Natl. Acad. Sci.
104:708–711.
Vrugt, J.A., and B.A. Robinson. 2007b. Treatment of uncertainty using ensemble
methods: Comparison of sequential data assimilation and Bayesian model av-
eraging. Water Resour. Res. 43:W01411, doi:10.1029/2005WR004838.
Vrugt, J.A., B.A. Robinson, and J.M. Hyman. 2009. Self-adaptive multimethod
search for global optimization in real-parameter spaces. IEEE Trans. Evol.
Comput. (in press).
Vrugt, J.A., P.H. Stauff er, Th . Wöhling, B.A. Robinson, and V.V. Vesselinov.
2008. Inverse modeling of subsurface fl ow and transport properties using
recent advances in global optimization, parallel computing, and sequential
data assimilation. Vadose Zone J. 7:843–864.
Zyvoloski, G.A. 2007. FEHM: A control volume fi nite element code for simu-
lating subsurface multi-phase multi-fl uid heat and mass transfer. Rep.
LAUR-07–3359. Los Alamos Natl. Lab., Los Alamos, NM.
Zyvoloski, G.A., B.A. Robinson, Z.V. Dash, and L.L. Trease. 1997. Summary
of the models and methods for the FEHM application: A fi nite-element
heat- and mass-transfer code. Rep. LA-13307-MS. Los Alamos Natl. Lab.,
Los Alamos, NM.