Embed Size (px)
Citation preview

Acc
epte
d A
rtic
le
This article has been accepted for publication and undergone full peer review but has not been through the copyediting, typesetting, pagination and proofreading process, which may lead to differences between this version and the Version of Record. Please cite this article as doi: 10.1111/aogs.13051 This article is protected by copyright. All rights reserved.
Received Date : 02-Jun-2015 Revised Date : 12-Oct-2016 Accepted Date : 16-Oct-2016 Article type : Original Research Article
Prediction of progression to severe disease in women with late preterm
hypertensive disorders of pregnancy
Running headline: Prediction of severe hypertensive disease late preterm
Eva F. Zwertbroek1; Kim Broekhuijsen1; Josje Langenveld2; Gert-Jan van Baaren3; Paul P. van
den Berg1; Henk. A. Bremer4; Wessel Ganzevoort3; Aren. J. van Loon5; Ben W.J. Mol6; Maria G.
van Pampus7; Denise A.M. Perquin8; Robbert J.P. Rijnders9; Hubertina CJ Scheepers10; J. Marko
Sikkema11; Mallory D. Woiski12; Henk Groen13; Maureen T.M. Franssen1; HYPITAT-II study
group.
1. Department of Obstetrics and Gynecology, University of Groningen, University Medical
Centre Groningen, Groningen,
2. Department of Obstetrics and Gynecology, Atrium Medical Centre Parkstad, Heerlen,
3. Department of Obstetrics and Gynecology, Academic Medical Centre, Amsterdam,
4. Department of Obstetrics and Gynecology, Reinier de Graaf Gasthuis, Delft,
5. Department of Obstetrics and Gynecology, Martini Hospital, Groningen, The Netherlands
6. The Robinson Research Institute, School of Paediatrics and Reproductive Health,
University of Adelaide, Adelaide, SA, Australia
7. Department of Obstetrics and Gynecology, Onze Lieve Vrouwe Gasthuis, Amsterdam,
8. Department of Obstetrics and Gynecology, Medical Centre Leeuwarden, Leeuwarden,
9. Department of Obstetrics and Gynecology, Jeroen Bosch Hospital, ’s-Hertogenbosch,
10. Department of Obstetrics and Gynecology, Grow, School for Oncology and
Developmental Biology, Maastricht University Medical Centre, Maastricht,
11. Department of Obstetrics and Gynecology, ZGT Almelo, Amelo,
12. Department of Obstetrics and Gynecology, Radboud University Medical Centre,
Nijmegen,

Acc
epte
d A
rtic
le
This article is protected by copyright. All rights reserved.
13. Department of Epidemiology-HPC FA40, University of Groningen, University Medical
Centre Groningen, Groningen, The Netherlands
Corresponding author:
Eva Zwertbroek
University of Groningen, University Medical Center Groningen, Department of Obstetrics and
Gynecology, CB21, PO box 30 001, 9700 RB Groningen, the Netherlands
Email: [email protected]
Conflicts of Interest notification
The authors report no conflicts of interest.
Abstract
Introduction: If hypertensive disorders of pregnancy (HDP) are diagnosed before term, the
benefits of immediate delivery need to be weighed against the neonatal consequences of preterm
delivery. If we are able to predict which women are at high risk of progression to severe disease,
they could be targeted for delivery and maternal complications may be reduced. In addition, this
may prevent unnecessary preterm births in women at low risk. Material and methods: We
developed a prediction model using data from the HYPITAT-II trail, which evaluated immediate
delivery versus expectant monitoring in women with non-severe HDP between 34 and 37 weeks
of gestation. Univariate and multivariate logistic regression analysis were used to identify relevant
variables from clinical and laboratory parameters. The performance of the resulting prediction
model was assessed by ROC analysis, calibration and bootstrapping, using the average predicted
probabilities. Results: We included 519 women of whom 115 (22.2%) developed severe HDP. The
prediction model included: maternal age (OR 0.92 per year), gestational age (OR 0.87 per week),
systolic blood pressure (OR 1.05 per mmHg), the presence of chronic hypertension (OR 2.4),
platelet count (OR 0.996), creatinine (OR 1.02) and lactate dehydrogenase (OR 1.003). The model
showed good fit (p = 0.64), fair discrimination (AUC 0.76, 95%CI 0.73 – 0.81, p < 0.001) and
could stratify women in three risk groups of average, intermediate and high risk (predicted
probabilities < 0.22, < 0.44 and > 0.45 respectively). Conclusion: In women with non-severe
hypertension in pregnancy near term, progression to severe disease can be predicted. This model
requires external validation before it can be applied in practice.

Acc
epte
d A
rtic
le
This article is protected by copyright. All rights reserved.
Keywords
Clinical prediction model; preeclampsia; gestational hypertension; chronic hypertension; high-risk
pregnancy.
Abbreviations
CI, confidence interval.
ALT alanine transaminase
AST aspartate transaminase
AUC, area under the curve
BP, blood pressure;
HELLP, hemolysis, elevated liver enzymes, and low platelets;
HYPITAT trial, HYpertension and Preeclampsia Intervention Trial in the Almost Term patient;
HDP, hypertensive disorders of pregnancy
LDH lactate dehydrogenase
ROC curve receiver operating characteristic curve.
Key Message
In women with non-severe hypertensive disorders of pregnancy late preterm or near term,
unnecessary preterm births and progression to severe disease might be prevented by using a model
to predict progression to severe hypertensive disorders of pregnancy.
Introduction
Hypertensive disorders of pregnancy (HDP) include chronic hypertension, gestational
hypertension and preeclampsia, the latter either new-onset or superimposed in women with pre-
existing (chronic) hypertension (superimposed preeclampsia). As to date, these disorders
complicate approximately 10% of all pregnancies (1). Hypertensive disorders are very strongly
associated with maternal morbidity and mortality such as eclampsia, placental abruption,
syndrome of Hemolysis, Elevated Liver enzymes and Low Platelets (HELLP), and also with
neonatal stillbirth and morbidity, mainly due to iatrogenic preterm birth (2)(3).
Delivery is the only effective treatment to prevent maternal or fetal complications in HDP. For
women with HDP at term, delivery can be considered, in the view of similar risk of neonatal
complications compared to expectant management and improved maternal outcome (4). However,
preterm delivery may result in short term neonatal morbidity such as respiratory distress

Acc
epte
d A
rtic
le
This article is protected by copyright. All rights reserved.
syndrome, or morbidity beyond the neonatal period such as neurological developmental problems,
school related problems and impaired growth (5). Therefore, if HDP are diagnosed before term,
the benefits of delivery need to be weighed against the consequences of preterm delivery.
The HYPITAT-II study could not demonstrate a significant difference in severe adverse maternal
outcome after routine delivery of women with late preterm HDP (between 34 and 37 weeks of
gestation). Routine delivery did however significantly increase the risk of neonatal respiratory
distress syndrome when delivery was induced (6).
It remains unclear whether expectant monitoring is the best management strategy for all women
with late preterm hypertensive disorders; delivery might be beneficial in subgroups with a high
risk of developing severe disease or for those with a more advanced gestational age. If women at
high risk of progression to severe disease could be identified and targeted for delivery, maternal
complications may be further reduced, while at the same this may prevent unnecessary preterm
births in women at low risk (7).
Several predictors of maternal morbidity in women with hypertensive disorders of pregnancy have
been studied (8-12). However, the prognostic value of these indicators in a multivariate approach
is unclear for women with late preterm hypertensive disorders. Therefore, we assessed the
prognostic capacity of clinical features and laboratory findings at inclusion with respect to
progression to severe HDP as indication for delivery during expectant monitoring in women with
late preterm hypertensive disorders.
Material and methods
We used data from women participating in the HYPITAT-II trial who were managed by expectant
monitoring. The HYPITAT-II trial was a multi-center randomized controlled trial, performed in
the Netherlands between March 2009 and March 2013, comparing immediate delivery to
expectant monitoring for women with non-severe late preterm HDP. The trial was approved by the
Institutional Review Board of the Academic Medical Centre in Amsterdam (08/244), and had
local approval from the boards of the other participating hospitals.
The inclusion criteria of this study were a pregnancy complicated by gestational hypertension,
preeclampsia, deteriorating chronic hypertension, or superimposed preeclampsia, and a gestational
age from 34+0 up to and including 36+6 weeks. Some women were diagnosed with HDP before

Acc
epte
d A
rtic
le
This article is protected by copyright. All rights reserved.
34 weeks, but were included at 34 weeks of gestation. Gestational hypertension was defined as a
diastolic blood pressure (BP) ≥ 100 mmHg measured at two occasions at least six hours apart with
its onset after 20 weeks of gestation. Preeclampsia was defined as a diastolic BP ≥90 mmHg and
proteinuria. Proteinuria was defined as ≥ 300 mg total protein in a 24h urine collection or a spot
protein-creatinine ratio of ≥ 30 mg/mmol (PCR). Women with chronic hypertension (defined as
BP ≥ 140/90 mmHg before 20 weeks of gestation(13)(14) could be included if they had either
superimposed preeclampsia (defined as new onset of proteinuria) or deteriorating hypertension
(defined as the need for new/additional antihypertensive medication after 34 weeks). These cases
of HDP are categorized as “chronic hypertension” in this study.
Exclusion criteria were maternal age <18 years, the presence of severe hypertensive disorder
(diastolic BP ≥ 110 mmHg and/or systolic BP ≥ 170 mmHg despite medication, proteinuria ≥
5g/L), HELLP syndrome, renal or heart disease, HIV seropositivity, pulmonary edema or
cyanosis, non-reassuring fetal heart rate, fetal abnormalities, abnormal karyotype and ruptured
membranes.
After informed consent was obtained women were randomized to either a policy that aimed for
delivery (intervention group) or a policy that aimed for expectant monitoring until 37 weeks of
gestation (expectant group). Women in the expectant management group (both randomized and
non-randomized) were monitored until 37 weeks of gestation or until an indication for delivery
occurred, whichever was sooner. Monitoring consisted of frequent maternal BP measurements,
assessments of proteinuria, laboratory tests and regular assessment of the fetal condition.
Women who refused randomization but gave informed consent to collect their data were included
in a cohort group. These women were managed according to the protocol for randomized women,
with the only difference that they chose their own treatment in consultation with their attending
obstetrician.
In the present study, from the total HYPITAT-II population, women who were randomized for
expectant monitoring were included, as well as all non-randomized women who were monitored
expectantly. The study profile is shown in figure 1.
The primary endpoint for the current study was progression to a severe hypertensive disorder as
indication for delivery. This endpoint was chosen considering two main reasons. Firstly, it is more

Acc
epte
d A
rtic
le
This article is protected by copyright. All rights reserved.
relevant to the clinician to predict which women will develop an indication for delivery, than to
predict which women will develop adverse outcomes (regardless of the conducted management).
Secondly, ‘severe disease’ is widely accepted as indication for delivery(13-17), which was also the
case in the HYPITAT-II protocol.
Severe hypertensive disorder as indication for delivery was defined as the occurrence of any of the
following: a diastolic BP ≥ 110 mmHg despite medication, a systolic BP ≥ 160 mmHg despite
medication, eclampsia, HELLP syndrome (platelet count <100 x 109/L, aspartate transaminase
(AST) > 70 U/L or alanine transaminase (ALT) > 70 U/L, and lactate dehydrogenase
(LDH) > 600 U/L), anuria (defined as a urinary production <30 ml/hour lasting ≥4 hours),
pulmonary edema, or severe preeclamptic complaints (13,14,16,17). Cases of women who were
recorded to have “severe HDP” as indication for delivery but who did not have any of the defining
characteristics of severe HDP as listed above were assessed by the study group on an individual
basis.
We evaluated whether our primary outcome measure (HDP as indication for delivery) could be
predicted with several characteristics at hospital admission. Candidate predictors were selected
based on previous studies (4,8,10-12,18-26). Selected predictors were maternal characteristics
(ethnicity, maternal age, education, smoking), clinical characteristics (diastolic BP, systolic BP,
body mass index, gravidity, parity, gestational age at diagnosis, previous abortion, previous
cesarean section, type of HDP, history of HDP, comorbidity) or laboratory findings (proteinuria,
ALT, AST, LDH, creatinine, uric acid, platelets, hematocrit, hemoglobin) measured at baseline.
The current study population consisted of all 519 women who were managed expectantly in the
HYPITAT-II study. With the observed prevalence of an indication for delivery, this sample size
provided sufficient power to study up to 10 predictors.
Our primary outcome measure, severe HDP necessitating delivery, had no missing data. However,
a few potentially prognostic variables did have a percentage of missing values >5% (e.g. the
proteinuria variables had up to 40% missing values). Exclusion of cases with missing values
would have led to loss of statistical power in the multivariable approach and, more seriously,
potentially biased results (27). Therefore, we used multiple imputation to handle these missing
values (28). Ten multiple imputed datasets were generated using predictive mean matching.
Appropriate confidence intervals for the ten imputed datasets were calculated using Rubins Rules

Acc
epte
d A
rtic
le
This article is protected by copyright. All rights reserved.
(29). This type of multiple imputation provided a sensitivity analysis to evaluate the influence of
imputation.
Statistical analysis
Descriptive statistics were generated using PASW Statistics 22.0 (IBM Corp., Armonk, NY).
Baseline characteristics were compared between women who developed severe disease and
women who did not. P-values were calculated using univariate logistic regression analysis based
on original data. Univariate logistic regression was performed to assess the predictive value of all
candidate predictors using the imputed datasets. We calculated pooled odds ratios, 95%
confidence intervals and p-values from the ten datasets. Predictors with a p-value <0.157 were
selected for the multivariate logistic regression analysis (28)(30). We used backward stepwise
selection to generate the prediction model (28). The model performance was assessed by
calibration and the Hosmer Lemeshow test for goodness of fit, with p-values closer to one
indicating better fit. To evaluate the discriminative performance in the model, area under the
receiver-operating characteristic (ROC) curve was calculated using the predicted and the actual
outcome. The mean predicted probabilities were calculated across the ten imputations. The
calibration of the model was assessed by plotting observed and predicted events for 10 subgroups
of women based on deciles of the predicted probability of severe disease. In every subgroup the
mean predicted and mean observed probability were calculated. If the predicted probability equals
the observed probability all points would be on the line x = y and the calibration would be perfect.
The model was internally validated with bootstrapping using R-project software 3.0.2. 2013
(https://www.r-project.org/) (package rms, with the same model parameters as in the final
multivariate model). For a detailed statistical report see Supporting Information Appendix S1.
Results
Between March 2009 and March 2013, 897 women were included in the HYPITAT-II trial. The
expectant monitoring group consist of 351 (39.0%) women who were randomized to this group
and 168 (18.8%) women were non-randomized and monitored expectantly. In total, 519 women
underwent expectant monitoring in the HYPITAT-II trial and were included in our study. From
our total cohort, 163 (31%) women were diagnosed with gestational hypertension, 292 (56%) with
preeclampsia and 64 (12%) women had chronic hypertension at inclusion. Severe hypertensive
disorder as an indication for delivery occurred in 115 (22%) women.

Acc
epte
d A
rtic
le
This article is protected by copyright. All rights reserved.
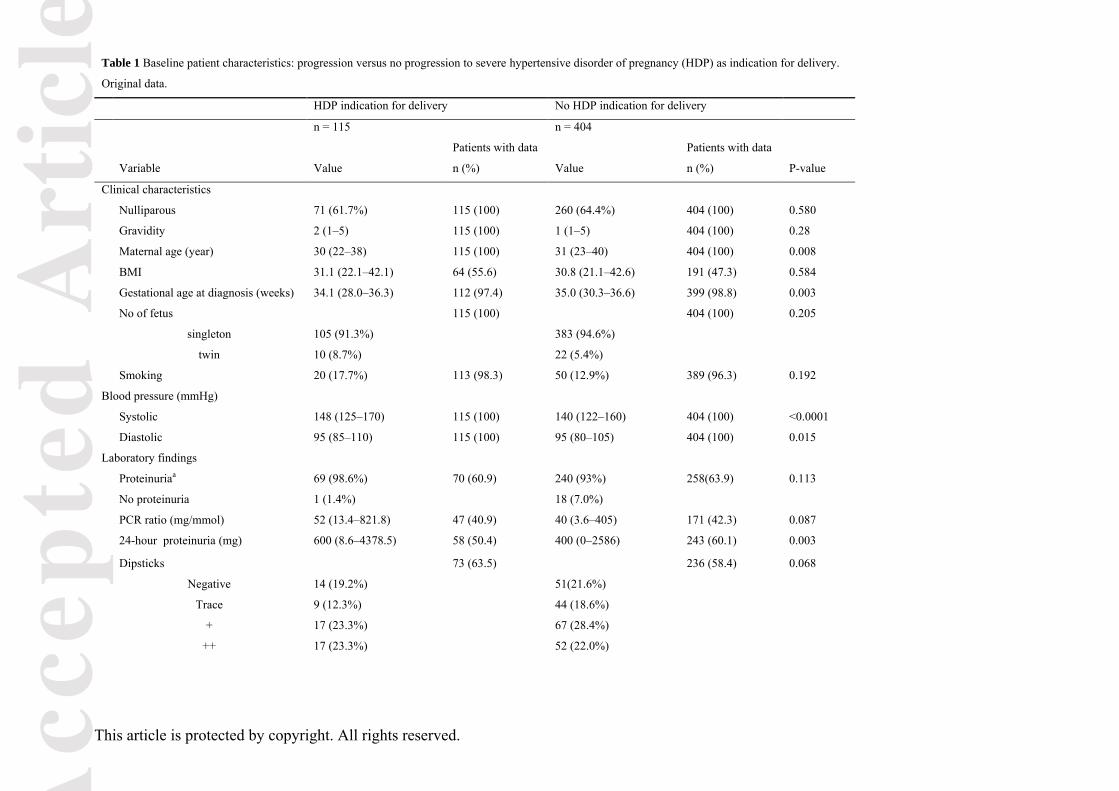
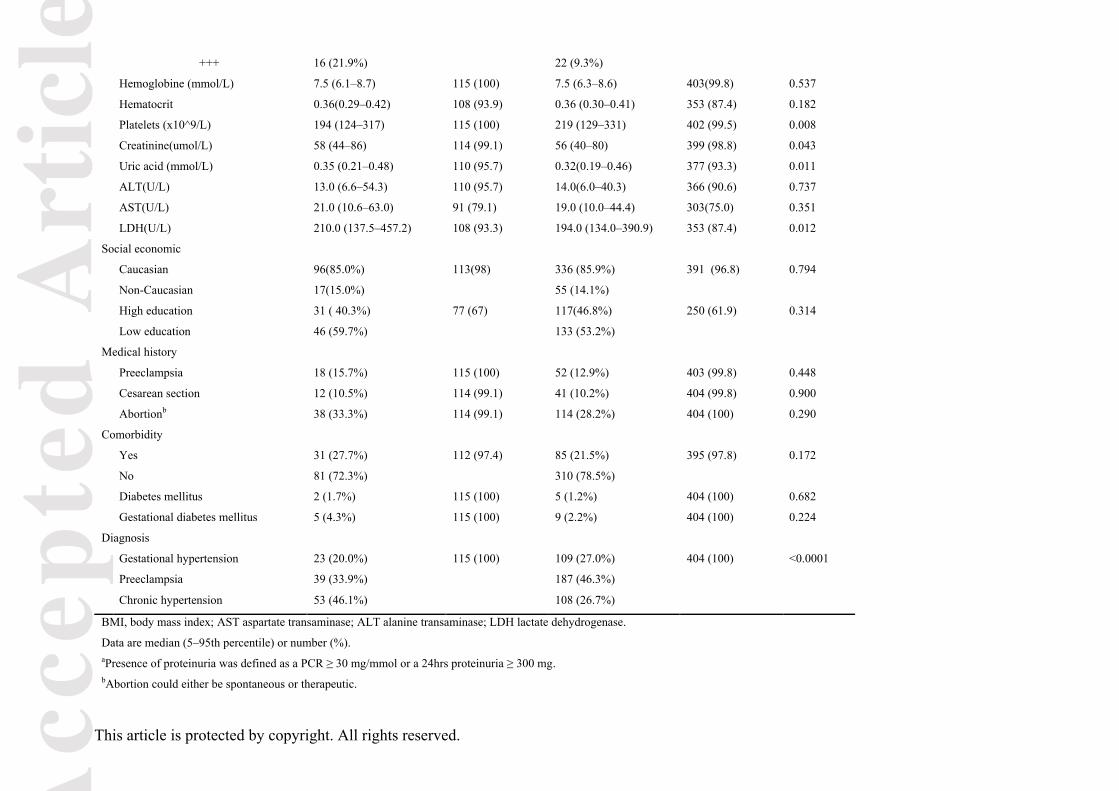
Baseline characteristics comparing women with and without development of severe HDP are
presented in table 1. Women who developed a severe hypertensive disorder were younger (p =
0.008) and had a lower gestational age at diagnosis (p = 0.003) compared to women who did not.
Women with existing pre-pregnancy chronic hypertension were more likely to progress to severe
HDP when compared to women with preeclampsia or gestational hypertension (p < 0.0001), while
women with preeclampsia were more likely to develop severe HDP compared to women with
gestational hypertension. Women who developed severe HDP had higher systolic (p < 0.0001) and
diastolic (p = 0.015) blood pressures and had more severe proteinuria as measured in 24-hour
urine collections (p = 0.003). Lower levels of platelets (p = 0.008) and creatinine (p = 0.043) and
higher levels of uric acid (p = 0.011) and LDH (p = 0.012) were associated with progression to
severe HDP.
Table 2 shows the pooled results of the univariate analyses, based on the imputed datasets. The
following continuous variables were considered for multivariable analysis: maternal age,
gestational age at diagnosis, diastolic and systolic blood pressure, PCR, 24-hour proteinuria,
platelets, creatinine, uric acid and LDH. Binary variables were comorbidity, presence of
proteinuria and diagnosis of chronic hypertension. Presence of proteinuria was chosen from the
three proteinuria variables that were eligible for multivariate analysis. This binary variable had
promising p-values and odds ratios compared to the other variables and above all, had less missing
values.
Table 3 shows the predictors included in the final model, i.e. maternal age, presence of co-
morbidity, diagnosis of deteriorating chronic hypertension or superimposed preeclampsia,
gestational age at diagnosis in weeks, systolic blood pressure, platelet count, creatinine, LDH and
presence of proteinuria, all measured at inclusion. The Hosmer-Lemeshow test for goodness of fit
showed a good fit of the model (p = 0.642).
The ROC-curve is presented in figure 2. It showed fair discriminative performance (area under the
curve (AUC) 0.76, 95%CI 0.73–0.81, p < 0.001) in our study population. The performance of the
model was fair. With regard to calibration (figure 3) the model slightly overestimated the risk for
the probabilities ranging from zero to 0.1. In terms of risk stratification, three groups could be
identified, carrying a different risk of progression to severe hypertensive disorder as an indication
Acc
epte
d A
rtic
le
This article is protected by copyright. All rights reserved.
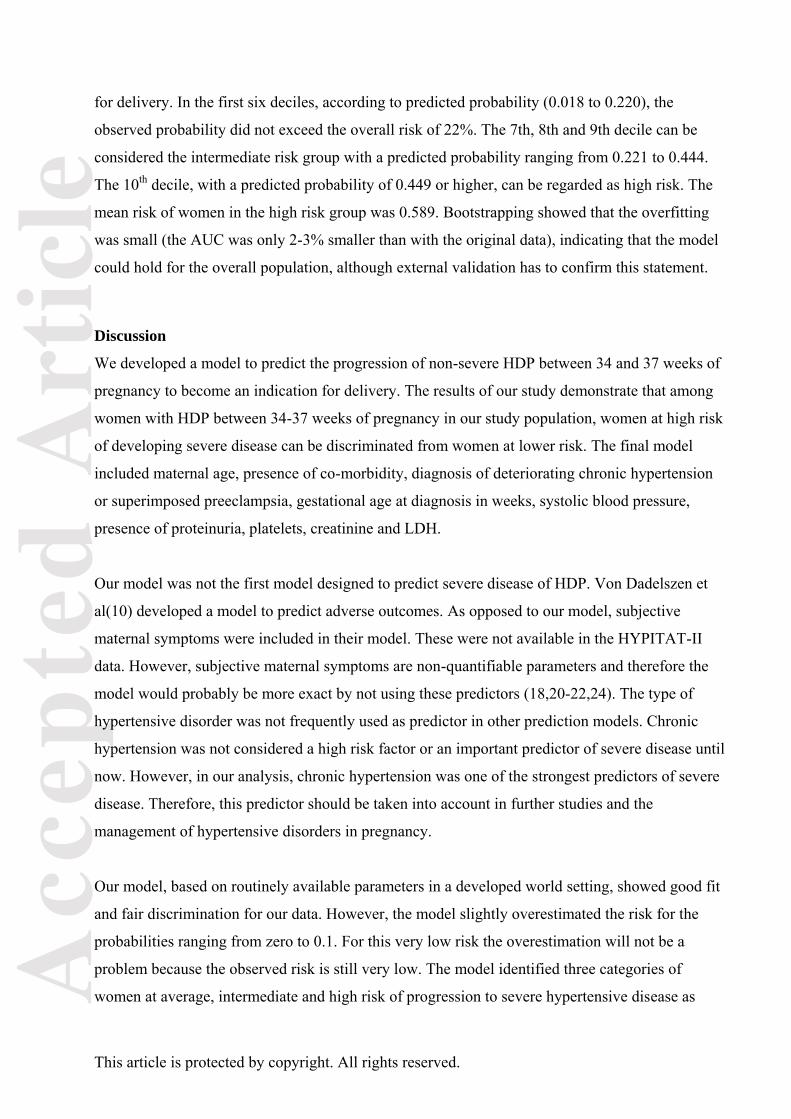
for delivery. In the first six deciles, according to predicted probability (0.018 to 0.220), the
observed probability did not exceed the overall risk of 22%. The 7th, 8th and 9th decile can be
considered the intermediate risk group with a predicted probability ranging from 0.221 to 0.444.
The 10th decile, with a predicted probability of 0.449 or higher, can be regarded as high risk. The
mean risk of women in the high risk group was 0.589. Bootstrapping showed that the overfitting
was small (the AUC was only 2-3% smaller than with the original data), indicating that the model
could hold for the overall population, although external validation has to confirm this statement.
Discussion
We developed a model to predict the progression of non-severe HDP between 34 and 37 weeks of
pregnancy to become an indication for delivery. The results of our study demonstrate that among
women with HDP between 34-37 weeks of pregnancy in our study population, women at high risk
of developing severe disease can be discriminated from women at lower risk. The final model
included maternal age, presence of co-morbidity, diagnosis of deteriorating chronic hypertension
or superimposed preeclampsia, gestational age at diagnosis in weeks, systolic blood pressure,
presence of proteinuria, platelets, creatinine and LDH.
Our model was not the first model designed to predict severe disease of HDP. Von Dadelszen et
al(10) developed a model to predict adverse outcomes. As opposed to our model, subjective
maternal symptoms were included in their model. These were not available in the HYPITAT-II
data. However, subjective maternal symptoms are non-quantifiable parameters and therefore the
model would probably be more exact by not using these predictors (18,20-22,24). The type of
hypertensive disorder was not frequently used as predictor in other prediction models. Chronic
hypertension was not considered a high risk factor or an important predictor of severe disease until
now. However, in our analysis, chronic hypertension was one of the strongest predictors of severe
disease. Therefore, this predictor should be taken into account in further studies and the
management of hypertensive disorders in pregnancy.
Our model, based on routinely available parameters in a developed world setting, showed good fit
and fair discrimination for our data. However, the model slightly overestimated the risk for the
probabilities ranging from zero to 0.1. For this very low risk the overestimation will not be a
problem because the observed risk is still very low. The model identified three categories of
women at average, intermediate and high risk of progression to severe hypertensive disease as

Acc
epte
d A
rtic
le
This article is protected by copyright. All rights reserved.
indication for delivery. For this population of women, the overall risk of developing severe disease
as an indication for delivery was 22%. Since the distinctive thresholds of medium and high risk
are higher than this average risk population, the model is very useful to distinguish the medium
and high risk group from the low risk group. 40% of women in our study population were at
medium or high risk of developing severe disease. Regarding this large percentage, the use of this
model is very relevant.
This study has several strengths and limitations. Data were derived through a large multicenter
study, including participants from a large number of hospitals throughout the Netherlands. We
believe that this group is representative for women with mild HDP between 34-37 weeks
gestational age. A limitation was the various numbers of missing values. For the multivariate
approach these missing values were imputed to avoid loss of statistical power and, more seriously,
biased results. Both PCR and 24-hour proteinuria had missing values, indicating that both of these
techniques are used in the Netherlands to determine whether significant proteinuria is present.
PCR was used more often than 24-hour proteinuria. Therefore, we used the dichotomous variable
‘presence of proteinuria’ yes or no, to reduce the number of values that needed imputation.
Proteinuria was defined as ≥ 300 mg total protein in a 24h urine collection or a spot protein-
creatinine ratio of ≥ 30 mg/mmol (PCR). Another possible limitation was the allowance of
antihypertensive medication in the study. However, there was no relation between use of
hypertensive medication and progression to severe disease (data not shown). We included women
with gestational hypertension with a diastolic BP > 100 mmHg, instead of a diastolic BP > 90
mmHg, as is used in the diagnostic criteria. This may also be considered a limitation of the study.
No conclusions can therefore be drawn for this subgroup of very mild gestational hypertension.
However, we believe that for women with gestational hypertension and a diastolic BP of 90–100
mm Hg, who probably have an even lower risk of adverse maternal outcomes than patients in our
study population, expectant monitoring should be considered.
In clinical practice, this model can assist clinicians to stratify women in categories of average,
intermediate and high risk. Women at average risk (ranging from 0.018 to 0.220) can be
monitored according to current regular care. For the intermediate risk group (ranging from 0.221
to 0.444), more frequent monitoring or cervical ripening in case of an unripe cervix could be
considered. Our model provides risk stratification based on maternal parameters and therefore the
fetus should be monitored in ongoing pregnancy. The probability of developing severe disease in
the high risk group ranged from 0.449 to 0.964 and the mean risk was 0.589. In this selected 10%

Acc
epte
d A
rtic
le
This article is protected by copyright. All rights reserved.
of the population, immediate delivery should be considered, as the risk of severe maternal disease
is 60% while the risk of neonatal respiratory distress syndrome for immediate delivery is 5.7% for
the total population(6). The maternal benefits of delivery may outweigh the risk of the neonatal
consequences of preterm delivery. These clinical recommendations could be implemented once
the model is externally validated. No recommendations regarding less frequent monitoring in the
average risk group can be made, since our prediction is based on the current standard of
monitoring. This model provides the opportunity to calculate an individualized risk for all women,
integrating all risk factors and their respective contributions into one estimate, rather than just
knowing the risk factors. The calculated risk enables caretakers to identify individual women at
average, intermediate or high risk.
Further research is necessary to externally validate the model to investigate whether the model
holds in another less selected population. We will test the model on international data and
eventually prospectively evaluate implementation in Dutch clinics. Furthermore, in this model
angiogenic factors were not considered. These factors emerged as possible predictors for
developing complications in women with HDP during planning and execution of the HYPITAT-II
study. However, we recommend to investigate these factors in future studies on hypertensive
disease in pregnancy in combination with clinical and laboratory parameters to predict maternal
severe disease late preterm. Nevertheless, until angiogenic factors have been studied sufficiently
and have been implemented into clinical practice, our model, based on routinely available
parameters is of relevance.
In conclusion, HYPITAT-II results showed that immediate delivery cannot be recommended for
all women who developed HDP during late preterm pregnancy (34 – 37 weeks of gestation): any
decrease in the risk of adverse maternal outcomes was likely to be small, while the risk of neonatal
RDS increased significantly. As delivery might be beneficial in subgroups of women with a high
risk of developing severe disease, we developed a model to predict the progression of HDP
between 34 and 37 weeks of pregnancy. This model stratifies women in groups of low, medium
and high risk. This model has the potential to guide doctors in management of the individual
women and prevent unnecessary interventions or preventable progression to severe disease after
external validation.

Acc
epte
d A
rtic
le
This article is protected by copyright. All rights reserved.
Acknowledgments
We thank research nurses and midwives of our consortium, and residents, midwives, nurses, and
gynecologists of the participating centers for their help with recruitment and data collection.
Funding
This trial was funded by “ZonMw”, the Netherlands Organisation for Health Research and
Development, program “Doelmatigheidsonderzoek” (Health Care Efficiency Research, grant
171102012).
References
(1) Hutcheon JA, Lisonkova S, Joseph KS. Epidemiology of pre-eclampsia and the other hypertensive
disorders of pregnancy. Best Pract Res Clin Obstet Gynaecol 2011 Aug;25(4):391-403.
(2) Abalos E, Cuesta C, Carroli G, Qureshi Z, Widmer M, Vogel JP, et al. Pre-eclampsia, eclampsia and
adverse maternal and perinatal outcomes: a secondary analysis of the World Health Organization
Multicountry Survey on Maternal and Newborn Health. BJOG 2014 Mar;121 Suppl 1:14-24.
(3) Broekhuijsen K, Ravelli AC, Langenveld J, Van Pampus MG, Van Den Berg PP, Mol BW, et al.
Maternal and neonatal outcomes of pregnancy in women with chronic hypertension: a retrospective
analysis of a national register. Acta Obstet Gynecol Scand. 2015 Dec;94(12):1337-45.
(4) Koopmans CM, Bijlenga D, Groen H, Vijgen SM, Aarnoudse JG, Bekedam DJ, et al. Induction of
labour versus expectant monitoring for gestational hypertension or mild pre-eclampsia after 36 weeks'
gestation (HYPITAT): a multicentre, open-label randomised controlled trial. Lancet 2009 Sep
19;374(9694):979-988.
(5) Teune MJ, Bakhuizen S, Gyamfi Bannerman C, Opmeer BC, van Kaam AH, van Wassenaer AG, et al.
A systematic review of severe morbidity in infants born late preterm. Am J Obstet Gynecol 2011
Oct;205(4):374.e1-374.e9.
(6) Broekhuijsen K, van Baaren GJ, van Pampus MG, Ganzevoort W, Sikkema JM, Woiski MD, et al.
Immediate delivery versus expectant monitoring for hypertensive disorders of pregnancy between 34 and
37 weeks of gestation (HYPITAT-II): an open-label, randomised controlled trial. Lancet. 2015 Jun
20;385(9986):2492-501.

Acc
epte
d A
rtic
le
This article is protected by copyright. All rights reserved.
(7) Holland MG, Refuerzo JS, Ramin SM, Saade GR, Blackwell SC. Late preterm birth: how often is it
avoidable? Am J Obstet Gynecol 2009 Oct;201(4):404.e1-404.e4.
(8) Martin JN,Jr, May WL, Magann EF, Terrone DA, Rinehart BK, Blake PG. Early risk assessment of
severe preeclampsia: admission battery of symptoms and laboratory tests to predict likelihood of
subsequent significant maternal morbidity. Am J Obstet Gynecol 1999 Jun;180(6 Pt 1):1407-1414.
(9) Koopmans CM, van Pampus MG, Groen H, Aarnoudse JG, van den Berg PP, Mol BW. Accuracy of
serum uric acid as a predictive test for maternal complications in pre-eclampsia: bivariate meta-analysis
and decision analysis. Eur J Obstet Gynecol Reprod Biol 2009 Sep;146(1):8-14.
(10) von Dadelszen P, Payne B, Li J, Ansermino JM, Broughton Pipkin F, Cote AM, et al. Prediction of
adverse maternal outcomes in pre-eclampsia: development and validation of the fullPIERS model. Lancet
2011 Jan 15;377(9761):219-227.
(11) Menzies J, Magee LA, Macnab YC, Ansermino JM, Li J, Douglas MJ, et al. Current CHS and
NHBPEP criteria for severe preeclampsia do not uniformly predict adverse maternal or perinatal outcomes.
Hypertens Pregnancy 2007;26(4):447-462.
(12) Thangaratinam S, Coomarasamy A, O'Mahony F, Sharp S, Zamora J, Khan KS, et al. Estimation of
proteinuria as a predictor of complications of pre-eclampsia: a systematic review. BMC Med 2009 Mar
24;7:10-7015-7-10.
(13) Dutch society of obstetrics and gynecology: guidelines for hypertensive disorders in pregnancy 2011.
Original: Nederlandse vereniging voor obstetrie en gynaecologie. Richtlijn hypertensieve aandoeningen in
de zwangerschap. 2011; Available at: http://nvog-
documenten.nl/uploaded/docs/Hypertensieve%20aandoeningen%20in%20de%20zwangerschap.pdf.
Accessed may/1, 2014.
(14) American College of Obstetricians and Gynecologists, Task Force on Hypertension in Pregnancy.
Hypertension in pregnancy. Report of the American College of Obstetricians and Gynecologists' Task
Force on Hypertension in Pregnancy. Obstet Gynecol 2013 Nov;122(5):1122-1131.
(15) National Collaborating Centre for Women's and Children's Health (UK). Hypertension in Pregnancy:
The Management of Hypertensive Disorders During Pregnancy. 2010 Aug.
(16) Lowe SA, Brown MA, Dekker GA, Gatt S, McLintock CK, McMahon LP, et al. Guidelines for the
management of hypertensive disorders of pregnancy 2008. Aust N Z J Obstet Gynaecol 2009
Jun;49(3):242-246.

Acc
epte
d A
rtic
le
This article is protected by copyright. All rights reserved.
(17) Magee LA, Helewa M, Moutquin JM, von Dadelszen P, Hypertension Guideline Committee, Strategic
Training Initiative in Research in the Reproductive Health Sciences (STIRRHS) Scholars. Diagnosis,
evaluation, and management of the hypertensive disorders of pregnancy. J Obstet Gynaecol Can 2008
Mar;30(3 Suppl):S1-48.
(18) van der Tuuk K, Koopmans CM, Groen H, Aarnoudse JG, van den Berg PP, van Beek JJ, et al.
Prediction of progression to a high risk situation in women with gestational hypertension or mild pre-
eclampsia at term. Aust N Z J Obstet Gynaecol 2011 Aug;51(4):339-346.
(19) Morris RK, Riley RD, Doug M, Deeks JJ, Kilby MD. Diagnostic accuracy of spot urinary protein and
albumin to creatinine ratios for detection of significant proteinuria or adverse pregnancy outcome in
patients with suspected pre-eclampsia: systematic review and meta-analysis. BMJ 2012 Jul 9;345:e4342.
(20) Nisell H, Palm K, Wolff K. Prediction of maternal and fetal complications in preeclampsia. Acta
Obstet Gynecol Scand 2000 Jan;79(1):19-23.
(21) Caetano M, Ornstein MP, von Dadelszen P, Hannah ME, Logan AG, Gruslin A, et al. A survey of
canadian practitioners regarding diagnosis and evaluation of the hypertensive disorders of pregnancy.
Hypertens Pregnancy 2004;23(2):197-209.
(22) von Dadelszen P, Magee LA, Devarakonda RM, Hamilton T, Ainsworth LM, Yin R, et al. The
prediction of adverse maternal outcomes in preeclampsia. J Obstet Gynaecol Can 2004 Oct;26(10):871-
879.
(23) Waugh J, Bell SC, Kilby MD, Lambert P, Shennan A, Halligan A. Urine protein estimation in
hypertensive pregnancy: which thresholds and laboratory assay best predict clinical outcome? Hypertens
Pregnancy 2005;24(3):291-302.
(24) Ganzevoort W, Rep A, de Vries JI, Bonsel GJ, Wolf H, PETRA-investigators. Prediction of maternal
complications and adverse infant outcome at admission for temporizing management of early-onset severe
hypertensive disorders of pregnancy. Am J Obstet Gynecol 2006 Aug;195(2):495-503.
(25) Thangaratinam S, Ismail KM, Sharp S, Coomarasamy A, Khan KS, Tests in Prediction of Pre-
eclampsia Severity review group. Accuracy of serum uric acid in predicting complications of pre-
eclampsia: a systematic review. BJOG 2006 Apr;113(4):369-378.
(26) Thangaratinam S, Ismail K, Sharp S, Coomarasamy A, O'Mahony F, Khan KS, et al. Prioritisation of
tests for the prediction of preeclampsia complications: a Delphi survey. Hypertens Pregnancy
2007;26(1):131-138.

Acc
epte
d A
rtic
le
This article is protected by copyright. All rights reserved.
(27) Steyerberg EW, Harrell FE,Jr, Borsboom GJ, Eijkemans MJ, Vergouwe Y, Habbema JD. Internal
validation of predictive models: efficiency of some procedures for logistic regression analysis. J Clin
Epidemiol 2001 Aug;54(8):774-781.
(28) Royston P, Moons KG, Altman DG, Vergouwe Y. Prognosis and prognostic research: Developing a
prognostic model. BMJ 2009 Mar 31;338:b604.
(29) Marshall A, Altman DG, Holder RL, Royston P. Combining estimates of interest in prognostic
modelling studies after multiple imputation: current practice and guidelines. BMC Med Res Methodol 2009
Jul 28;9:57-2288-9-57.
(30) Sauerbrei W. The use of resampling methods to simplify regression models in medical statistics.
Applied Statistics 1999;48(3):313-329.
Supporting Information
Appendix S1. Statistical report.
Legends of Figures
Figure 1: Study profile.
Figure 2: Receiver-operating characteristic (ROC) graph of prediction model for progression to
severe disease, calculated by multivariable analysis. AUC, area under the curve; CI, confidence
interval.
Figure 3: Calibration plot demonstrating the association between the risks of progression to
severe disease as predicted by the logistic model and the observed progression to severe disease.
Acc
epte
d A
rtic
le
This article is protected by copyright. All rights reserved.
Table 1 Baseline patient characteristics: progression versus no progression to severe hypertensive disorder of pregnancy (HDP) as indication for delivery.
Original data.
HDP indication for delivery No HDP indication for delivery
n = 115 n = 404
Variable Value
Patients with data
n (%) Value
Patients with data
n (%) P-value
Clinical characteristics
Nulliparous 71 (61.7%) 115 (100) 260 (64.4%) 404 (100) 0.580
Gravidity 2 (1–5) 115 (100) 1 (1–5) 404 (100) 0.28
Maternal age (year) 30 (22–38) 115 (100) 31 (23–40) 404 (100) 0.008
BMI 31.1 (22.1–42.1) 64 (55.6) 30.8 (21.1–42.6) 191 (47.3) 0.584
Gestational age at diagnosis (weeks) 34.1 (28.0–36.3) 112 (97.4) 35.0 (30.3–36.6) 399 (98.8) 0.003
No of fetus 115 (100) 404 (100) 0.205
singleton 105 (91.3%) 383 (94.6%)
twin 10 (8.7%) 22 (5.4%)
Smoking 20 (17.7%) 113 (98.3) 50 (12.9%) 389 (96.3) 0.192
Blood pressure (mmHg)
Systolic 148 (125–170) 115 (100) 140 (122–160) 404 (100) <0.0001
Diastolic 95 (85–110) 115 (100) 95 (80–105) 404 (100) 0.015
Laboratory findings
Proteinuriaa 69 (98.6%) 70 (60.9) 240 (93%) 258(63.9) 0.113
No proteinuria 1 (1.4%) 18 (7.0%)
PCR ratio (mg/mmol) 52 (13.4–821.8) 47 (40.9) 40 (3.6–405) 171 (42.3) 0.087
24-hour proteinuria (mg) 600 (8.6–4378.5) 58 (50.4) 400 (0–2586) 243 (60.1) 0.003
Dipsticks 73 (63.5) 236 (58.4) 0.068
Negative 14 (19.2%) 51(21.6%)
Trace 9 (12.3%) 44 (18.6%)
+ 17 (23.3%) 67 (28.4%)
++ 17 (23.3%) 52 (22.0%)
Acc
epte
d A
rtic
le
This article is protected by copyright. All rights reserved.
+++ 16 (21.9%) 22 (9.3%)
Hemoglobine (mmol/L) 7.5 (6.1–8.7) 115 (100) 7.5 (6.3–8.6) 403(99.8) 0.537
Hematocrit 0.36(0.29–0.42) 108 (93.9) 0.36 (0.30–0.41) 353 (87.4) 0.182
Platelets (x10^9/L) 194 (124–317) 115 (100) 219 (129–331) 402 (99.5) 0.008
Creatinine(umol/L) 58 (44–86) 114 (99.1) 56 (40–80) 399 (98.8) 0.043
Uric acid (mmol/L) 0.35 (0.21–0.48) 110 (95.7) 0.32(0.19–0.46) 377 (93.3) 0.011
ALT(U/L) 13.0 (6.6–54.3) 110 (95.7) 14.0(6.0–40.3) 366 (90.6) 0.737
AST(U/L) 21.0 (10.6–63.0) 91 (79.1) 19.0 (10.0–44.4) 303(75.0) 0.351
LDH(U/L) 210.0 (137.5–457.2) 108 (93.3) 194.0 (134.0–390.9) 353 (87.4) 0.012
Social economic
Caucasian 96(85.0%) 113(98) 336 (85.9%) 391 (96.8) 0.794
Non-Caucasian 17(15.0%) 55 (14.1%)
High education 31 ( 40.3%) 77 (67) 117(46.8%) 250 (61.9) 0.314
Low education 46 (59.7%) 133 (53.2%)
Medical history
Preeclampsia 18 (15.7%) 115 (100) 52 (12.9%) 403 (99.8) 0.448
Cesarean section 12 (10.5%) 114 (99.1) 41 (10.2%) 404 (99.8) 0.900
Abortionb 38 (33.3%) 114 (99.1) 114 (28.2%) 404 (100) 0.290
Comorbidity
Yes 31 (27.7%) 112 (97.4) 85 (21.5%) 395 (97.8) 0.172
No 81 (72.3%) 310 (78.5%)
Diabetes mellitus 2 (1.7%) 115 (100) 5 (1.2%) 404 (100) 0.682
Gestational diabetes mellitus 5 (4.3%) 115 (100) 9 (2.2%) 404 (100) 0.224
Diagnosis
Gestational hypertension 23 (20.0%) 115 (100) 109 (27.0%) 404 (100) <0.0001
Preeclampsia 39 (33.9%) 187 (46.3%)
Chronic hypertension 53 (46.1%) 108 (26.7%)
BMI, body mass index; AST aspartate transaminase; ALT alanine transaminase; LDH lactate dehydrogenase.
Data are median (5–95th percentile) or number (%). aPresence of proteinuria was defined as a PCR ≥ 30 mg/mmol or a 24hrs proteinuria ≥ 300 mg. bAbortion could either be spontaneous or therapeutic.

Acc
epte
d A
rtic
le
This article is protected by copyright. All rights reserved.
Table 2 Results of the univariate analysis of predictors of progression to severe disease as
indication for delivery, pooled estimates based on imputed data.
Variable OR 95%CI P value
Clinical characteristics
Multiparity1 1.119 0.730–1.716 0.607
Gravidity1 1.080 0.714-1.634 0.716
Maternal age2 0.945 0.906–0.985 0.008
BMI2 1.019 0.977–1.062 0.370
Gestational age at diagnosis (weeks) 2 0.890 0.822–0.963 0.004
Systolic BP2 1.041 1.022–1.060 <0.0001
Diastolic BP2 1.037 1.007–1.068 0.015
No. of fetus2 1.654 0.760–3.601 0.205
Smoking1 1.454 0.827–2.557 0.193
Laboratory findings
Presence of proteinuria1,6 1.808 1.017–3.214 0.044
PCR2,4 1.255 1.025–1.538 0.028
24-hour proteinuria2,4 1.098 0.962–1.255 0.161
Dipsticks (vs. negative)3
Trace 0.647 0.264–1.583 0.337
+ 0.808 0.394–1.657 0.559
++ 1.075 0.475–2.429 0.861
+++ 2.237 0.963–5.195 0.061
Hemoglobine 2 0.913 0.683–1.220 0.539
Hematocrit2 0.7335 0.382-1.405 0.350
Platelets2 0.995 0.992–0.999 0.008
Creatinine2 1.016 1.001–1.030 0.035
Uric acid2 1.3735 1.054-1.789 0.019
ALT2 1.002 0.992–1.011 0.756
AST2 1.006 0.995–1.017 0.289
LDH2 1.003 1.001–1.005 0.015
Social economic
Caucasian1 0.918 0.209–1.656 0.776
High education1 0.850 0.523–1.271 0.366
Medical history1
Preeclampsia 1.245 0.696–2.227 0.460
Cesarean section 1.098 0.560–2.153 0.785
Abortion 1.270 0.813–1.984 0.293
Comorbidity1
Yes 1.411 0.875–2.275 0.158
Diabetes mellitus in pregnancy 1.995 0.655–6.074 0.224
Diabetes mellitus 1.412 0.270–7.377 0.682
Diagnosis1

Acc
epte
d A
rtic
le
This article is protected by copyright. All rights reserved.
Chronic hypertension 2.343 1.527–3.594 <0.0001
Gestational hypertension 0.677 0.408–1.123 0.131
If the variable had a P-value <0.157 in the univariate analysis, it was considered in the final
(multivariate) model.
OR, odds ratio; CI, confidence interval; BMI, body mass index; BP, blood pressure; AST
aspartate transaminase; ALT alanine transaminase; LDH lactate dehydrogenase. 1 binary variable 2 continuous variable 3 categorical variable 4 natural logarithm was taken of this variable 5 OR per 0.1 6 Presence of proteinuria was defined as a PCR ≥ 30 mg/mmol or a 24hrs proteinuria ≥ 300 mg
Table 3 Multivariate analysis of predictors of progression to severe disease requiring delivery, pooled estimates
based on imputed data.
Variable OR 95%CI β-value P value
Clinical characteristics
Maternal age (years) 0.919 0.876–0.961 - 0.086 <0.0001
Gestational age at diagnosis (weeks) 0.874 0.799–0.957 -0.135 0.004
Systolic blood pressure (mmHg) 1.046 1.025–1.067 0.045 <0.0001
Comorbidity (yes/no) 1.519 0.890–2.593 0.418 0.126
Chronic hypertension (yes/no) 2.371 1.466–3.833 0.863 <0.0001
Laboratory findings
Presence of proteinuria1(yes/no) 1.769 0.920–3.401 0.570 0.087
Platelets(x10^9/L) 0.996 0.992–1.000 -0.004 0.034
Creatinine (umol/L) 1.015 0.998–1.032 0.015 0.078
Lactate dehydrogenase (U/L) 1.003 1.000–1.006 0.003 0.034
1 Presence of proteinuria was defined as a PCR ≥ 30 mg/mmol or a 24hrs proteinuria ≥ 300 mg

Acc
epte
d A
rtic
le
This article is protected by copyright. All rights reserved.

Acc
epte
d A
rtic
le
This article is protected by copyright. All rights reserved.