Embed Size (px)
Citation preview

Acc
epte
d A
rtic
le
This article has been accepted for publication and undergone full peer review but has not
been through the copyediting, typesetting, pagination and proofreading process, which may
lead to differences between this version and the Version of Record. Please cite this article as
doi: 10.1111/jdi.12596
This article is protected by copyright. All rights reserved.
Received Date : 17-Jul-2016 Revised Date : 03-Nov-2016 Accepted Date : 07-Nov-2016 Article type : Original Article
The Relationship of HbA1c, Fasting, and Postprandial Hyperglycemia in
Subjects with Type 2 Diabetes Mellitus in Malaysia
Lee Ling Lim1, Alan JM Brnabic2, Siew Pheng Chan1, Luqman Ibrahim1,
Sharmila Sunita Paramasivam1, Jeyakantha Ratnasingam1, Shireene Ratna
Vethakkan1, Alexander Tong Boon Tan1
1Division of Endocrinology, Department of Internal Medicine, University of Malaya,
Kuala Lumpur, Malaysia
2Consultant Biostatistician, Sydney, Australia
Manuscript Category: Original Article
Short Running Title: HbA1c, CGM and 24-hour Hyperglycemia
Word Counts: 3,760
Email address for all authors (according to order)
Acc
epte
d A
rtic
le
This article is protected by copyright. All rights reserved.
Corresponding author and person to whom reprint request should be
addressed:
Dr Lee Ling Lim, MRCP (UK)
Division of Endocrinology,
Department of Internal Medicine,
University of Malaya Medical Centre,
59100 Kuala Lumpur, Malaysia.
Phone: +603-79492622
Fax: +603-79492030
Email: [email protected]
ABSTRACT
Aims/Introduction: Studies on the relative contributions of fasting and postprandial
hyperglycemia (FH and PPH) to HbA1c in type 2 diabetes (T2D) subjects have
yielded inconsistent results. We aimed to assess the relationship by using
continuous glucose monitoring (CGM) in a multi-ethnic cohort.

Acc
epte
d A
rtic
le
This article is protected by copyright. All rights reserved.
Materials and Methods: 100 T2D adults were assessed with 6-day CGM and HbA1c.
Area under the curve (AUC) ≥5.6 mmol/L was defined as AUCTOTAL. AUC ≥ each
pre-prandial glucose for 4 hours was defined as AUCPPH. The total PPH (AUCTPPH)
was the sum of the various AUCPPH. The post-prandial contribution to overall
hyperglycemia was calculated as (AUCTPPH/ AUCTOTAL) × 100%.
Results: This study comprised of Malays, Indians, and Chinese T2D at 34%, 34%,
and 28% respectively. Overall, mean PPH significantly decreased as HbA1c
advanced (MMRM adjusted, Beta-estimate = -3.0, p=0.009). Age (p=0.010) and
hypoglycemia (p=0.006) predicted the contribution difference. In oral antidiabetic
drug (OAD)-treated subjects (n=58), FH contribution increased from 54% (HbA1c 6-
6.9%) to 67% (HbA1c ≥10%). FH predominance was significant in poorly-controlled
groups (p=0.028 at HbA1c 9-9.9%; p=0.015 at HbA1c ≥10%). Among insulin-users
(n=42), FH predominated when HbA1c ≥10% before adjustment for hypoglycemia
(p=0.047), whilst PPH was numerically greater when HbA1c <8%.
Conclusions: FH and PPH contributions were equal in well-controlled Malaysians
T2D in real-world practice. FH predominated when HbA1c was ≥9% and ≥10% in
OAD- and insulin-treated subjects respectively. A unique observation was the
greater PPH contribution when HbA1c <8% despite the use of basal and mealtime
insulin in this multi-ethnic cohort, which required further validation.
Keywords: Fasting hyperglycemia, Post-prandial hyperglycemia, Continuous
glucose monitoring
Acc
epte
d A
rtic
le
This article is protected by copyright. All rights reserved.
(ClinicalTrials.gov: NCT 02117154)
1. INTRODUCTION
First described more than 40 years ago1, glycated hemoglobin (HbA1c) is currently
almost ubiquitous as a measure of glycemic control in diabetes mellitus2. It has been
shown to correlate with the development of diabetes complications3,4 and several
organisations have also endorsed its use for diagnosis5,6. HbA1c provides an
indication of overall glycemic control over a 60 to 90 day duration7, with more recent
glycemia exerting a greater influence8,9.
The relationship between fasting and post-prandial glucose levels with HbA1c among
subjects with type 2 diabetes (T2D) has been widely debated10-12 with the seminal
description by Monnier et al of fasting hyperglycemia (FH) predominating at higher
HbA1c levels and post-prandial hyperglycemia (PPH) predominating at lower HbA1c
levels being the most widely expounded13. Several other studies have been
performed with contrasting results, perhaps due to differences in study populations,
methodologies and anti-hyperglycemic therapies15-21.
In East Asians, similar findings as Monnier et al’s with predominance of PPH at lower
HbA1c levels were reported15-17. One of the main differences of these studies was on
the HbA1c threshold in which the shift of FH and PPH predominance occurred15-17.
Wang et al and Kikuchi et al reported the changes in the predominance of PPH were
at HbA1c less than 7 and 8% in Taiwanese Chinese and Japanese population
respectively, and vice versa for FH15,16. An interesting observation among treatment-
naïve Chinese T2D subjects from Sichuan, China was the equal contributions of FH
Acc
epte
d A
rtic
le
This article is protected by copyright. All rights reserved.
and PPH at HbA1c 7 – 9%; whilst PPH predominated when HbA1c ≤ 7% and FH was
greater at HbA1c > 9%17. Of note, the shift in both FH and PPH contributions in this
Chinese cohort was not as acute as previous studies, where a plateau was
demonstrated in moderate hyperglycemia subjects (HbA1c 7 – 9%)17. Among type 1
diabetes (T1D) and insulin-treated T2D subjects, a higher degree of correlation
between HbA1c and PPH was also found in a Japanese study18.
In contrast, two European studies have suggested that FH had better correlation with
HbA1c than PPH among T2D patients, who were either treatment-naïve or on oral
anti-diabetic drugs (OADs)19,20. Importantly, this observation was strengthened in a
large insulin-treated Caucasian T2D cohort, where FH was predominant across the
HbA1c range21.
The prevalence of T2D is alarmingly high at 17.5% among adults aged ≥ 18 years in
Malaysia, in which half of them were undiagnosed22. Marked inter-ethnic variations in
the prevalence were identified, i.e. Indians, Malays, Chinese, and Aborigines at
22.1%, 14.6%, 12.0%, and 10.7% respectively22. It is well recognized that Asian T2D
phenotypes have significant pancreatic beta-cell dysfunction and higher insulin
resistance, which can give rise to distinct daily glycemic excursions compared to
Caucasian counterparts23. However, there is a dearth of information on this
relationship among Malaysians. Given these disparities and technological
advancement that allow for more accurate glycemic assessment, we aimed to
evaluate the relative contributions of FH and PPH to HbA1c by using 6-day CGM
among multi-ethnic Malaysians with T2D in real-world settings.

Acc
epte
d A
rtic
le
This article is protected by copyright. All rights reserved.
2. MATERIALS AND METHODS
2.1. Study Design and Subjects Selection
This was a prospective observational study conducted at the University of Malaya
Medical Center (UMMC), an academic medical institution with 1,300 beds serving a
population of 1.8 million in Kuala Lumpur, Malaysia. Eligible T2D subjects were
consecutively enrolled from the specialized diabetes clinic into one of the following
HbA1c quintiles: 6 - 6.9% (42 - 52 mmol/mol), 7 - 7.9% (53 - 63 mmol/mol), 8 - 8.9%
(64 - 74 mmol/mol), 9 - 9.9% (75 - 85 mmol/mol), ≥ 10% (≥ 86 mmol/mol).
Recruitment was capped at 20 subjects per quintile, giving a total of 100 subjects.
The inclusion criteria were: T2D for at least three months on stable doses of either
OADs, insulin (basal, premix, multiple dose insulin) or OAD plus insulin
combinations; HbA1c ≥ 6% (42mmol/mol); estimated glomerular filtration rate (eGFR)
≥ 60 ml/min/1.73m2 [Modification of Diet in Renal Disease (MDRD) formula] and
normal hemoglobin level. The exclusion criteria were newly diagnosed T2D of less
than three months; T1D; T2D on lifestyle intervention only; current or previous
history of hospitalization in the past three months; presence of co-morbidities
(chronic liver disease, advanced cardiac disease with New York Heart Association
class III/IV, malignancy, and on steroid therapy); eGFR < 60ml/ min/1.73m2;
conditions affecting the accuracy of HbA1c (anemia, hemoglobinopathies, blood
transfusion within three months before and after enrolment, on erythropoietin
therapy), and patients who were pregnant, lactating or planning for pregnancy. The
research protocol was approved by the UMMC Ethics Committee (MEC reference
number 988.5) and registered at ClinicalTrials.gov (NCT 02117154). Written
Acc
epte
d A
rtic
le
This article is protected by copyright. All rights reserved.
informed consent was obtained from each subject before any study procedure in
keeping with the Declaration of Helsinki.
Each subject underwent three 6-day CGM periods, i.e. at baseline, at the end of one
month and at the end of two months. All data were used in the analysis. Four-point
SMBG was performed during each CGM period for calibration purpose. Blood was
taken for HbA1c level at baseline, month one and month two. Every subject
completed an event log sheet during each CGM period. All meals recorded by
subjects were included in the analysis. Management of T2D of enrolled patients was
based on the investigators’ discretion, as per standard of care throughout the study
period.
2.2. Continuous Glucose Monitoring
CGM was performed using iPro™2 with Enlite sensors (Medtronic International) with
288 readings per day for six days. As CGM was not real time, glucose readings were
downloaded for analysis at the end of each six-day period. Each subject conducted
SMBG using Roche Accuchek Performa glucometers (glucose range of 0.6 – 33.3
mmol/L and hematocrit range of 10 – 65%). HbA1c was analysed by using ion-
exchange High Performance Liquid Chromatography (HLPC) method (NGSP/
DCCT-aligned; Bio-rad VariantTM II Turbo). Its correlations of variance (CV) were < 2%
(intra-assay) and < 2.3% (inter-assay).
Our definitions of glycemic area under the curve (AUC) were similar to previous
studies13,14,15,20. The lowest glucose threshold was set at 5.6 mmol/L13,14,15,20. AUC ≥
5.6 mmol/L was defined as AUCTOTAL. The glucose value immediately before the
Acc
epte
d A
rtic
le
This article is protected by copyright. All rights reserved.
time of each meal marked by the patient in the event log sheet was recorded as pre-
prandial glucose. AUC above each pre-prandial glucose for four hours was defined
as post-prandial AUC (AUCPPH)14. The total PPH (AUCTPPH) was the sum of the
AUCPPH of every meal. The contribution of total PPH to overall glycemia was
calculated as (AUCTPPH/ AUCTOTAL) × 100%. The contribution of FH to overall
glycemia (AUCFH) was calculated as (AUCTOTAL – AUCTPPH)/ AUCTOTAL x 100%.
Hypoglycemia was defined as the occurrence of at least two CGM readings ≤ 3.3
mmol/L within a duration of 20 minutes24.
2.3. Statistical Analysis
SAS for Windows, version 9.3 (SAS Institute Inc) was used for analysis. AUC was
determined by using the trapezoidal rule and calculated for each day (up to six days
for every subject), and for each CGM period (baseline, month one, and month two).
The AUCTOTAL, AUCFH and AUCTPPH were calculated as the average of all observed
days for each CGM period separately. The average percentages of AUCTOTAL,
AUCFH and AUCTPPH obtained at three different CGM periods were subsequently
calculated. P-values from the univariate analysis used to compare between quintiles
of HbA1c were generated from the F-test for continuous variables, and either the
Fisher’s exact test or the Monte Carlo estimation of Fisher’s exact test for categorical
variables. Longitudinal multivariate analyses were used to assess the relative
contributions of FH and PPH to HbA1c as well as to determine predictors of the
relative contribution of PPH to HbA1c. In particular, mixed model repeated measures
(MMRM) were fitted with average percentages of AUCTOTAL, AUCFH and AUCTPPH
obtained at three different CGM periods as the outcome, and HbA1c as the
explanatory variable. Other variables in the model included age, gender, CGM
Acc
epte
d A
rtic
le
This article is protected by copyright. All rights reserved.
period, presence of hypoglycemia, total dose and type of insulin, use of sulfonylurea,
metformin, alpha-glucosidase inhibitor (AGI), and dipeptidyl peptidase-4 inhibitors
(DPP4-i). The unstructured covariance matrix was used for all models after
assessment of best fit using Bayesian Information Criterion. Βeta-coefficients, least-
squares means and least-squares mean differences with associated 95% confidence
intervals (95% CI), and p-values were presented for continuous HbA1c levels.
Comparisons between quintiles using MMRM were adjusted for multiplicity using the
Dunnet-Hsu procedure. P-values < 0.05 were considered to denote statistical
significance. Values quoted were mean ± standard deviation (SD) unless stated
otherwise.
3. RESULTS
3.1 Baseline Clinical Data
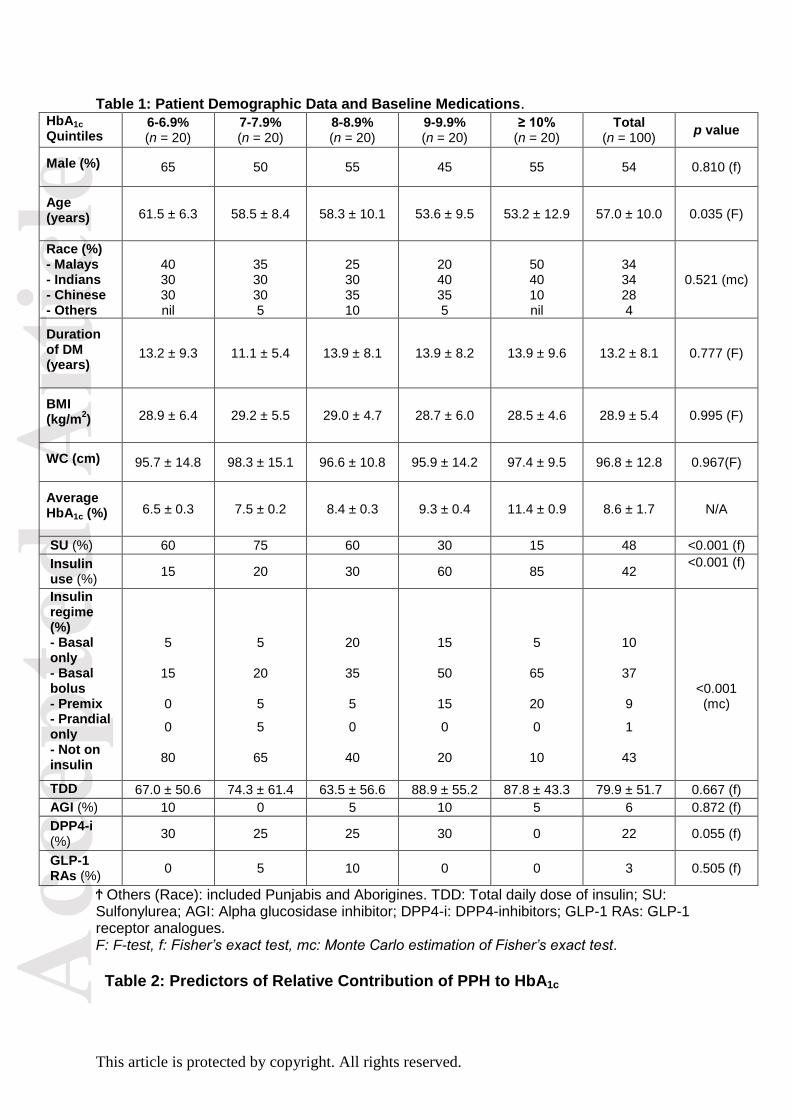
All 100 subjects completed the study, with 34% Malays and Indians respectively,
28% Chinese, and 4% other ethnicities (Punjabis, Aborigines). The mean age and
duration of T2D were 57.0 ± 10.0 and 13.2 ± 8.1 years respectively. In general, the
subjects were obese, with a mean body mass index (BMI) of 28.9 ± 5.4 kg/m2 and a
waist circumference (WC) of 96.8 ± 12.8 cm. The average number of recorded meals
ranged from two to five meals/day. The baseline characteristics of all subjects were
shown in Table 1.
All subjects were on metformin except for one who had severe metformin-related
gastrointestinal intolerance. There was a significantly greater use of insulin,
especially basal bolus regimen (p < 0.001), for subjects in the higher HbA1c quintiles.
Most well-controlled T2D subjects were on OADs, whereby sulfonylureas were most

Acc
epte
d A
rtic
le
This article is protected by copyright. All rights reserved.
commonly prescribed (p < 0.001). Use of other treatments that affect PPH (AGI and
incretins) were not significantly different between each quintile. The baseline
medications were summarized in Table 1.
3.2 Relative Contributions of FH and PPH to 24-Hour Hyperglycemia
The relative contributions of FH and PPH to overall hyperglycemia was shown in
Figure 2A. There was a statistically significant decreasing trend in mean PPH
contribution to 24-hour hyperglycemia with worsening control of T2D (MMRM
adjusted, Beta-estimate = -3.0, p = 0.009). In other words, the relative contribution of
FH was greater as HbA1c increased.
FH began to predominate when HbA1c ≥ 8% (64 mmol/mol). At HbA1c 8 - 8.9% (64 –
74 mmol/mol), the relative contributions of FH and PPH were 57% and 43%
respectively (p = 0.037). FH was numerically predominant at HbA1c 9 - 9.9% (75 - 85
mmol/mol), but this did not achieve statistical significance. At HbA1c ≥ 10%, FH
contribution was 61% as opposed to PPH contribution of 39% (p = 0.006). The
relative contributions of FH and PPH were equal when HbA1c was < 8% (64
mmol/mol).
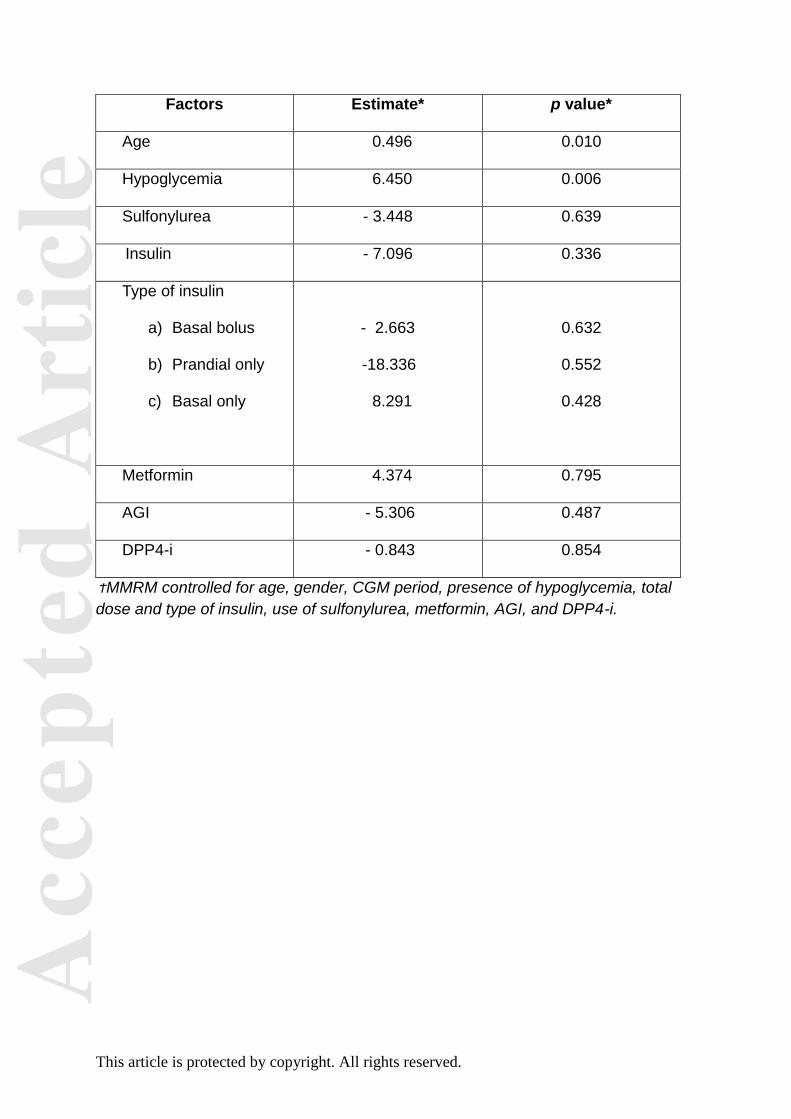
Our study also examined the effect of various factors on PPH contribution to HbA1c
(Table 2). Older age (p = 0.010) and the presence of hypoglycemia (p = 0.006) were
the only significant predictors of greater PPH contribution to HbA1c.
Acc
epte
d A
rtic
le
This article is protected by copyright. All rights reserved.
3.3 Subgroup Analyses
In our cohort, 58 T2D subjects were treated with OAD(s) only. The relative
contribution of FH increased with deteriorating HbA1c, i.e. 54% (HbA1c 6 - 6.9%),
54% (7 – 7.9%), 58% (8 – 8.9%), 62% (9 - 9.9%), and 67% (≥ 10%) (Figure 2B). The
significant predominance of FH was observed in poorly controlled subjects with
HbA1c 9 - 9.9% (75 – 85 mmol/mol; p = 0.028) and HbA1c ≥ 10% (≥ 86 mmol/mol; p =
0.015). The differences in contribution between FH and PPH did not achieve
statistical significance at HbA1c 6 – 6.9% (p = 0.443) and HbA1c 7 – 7.9% (p = 0.486).
There were 42 insulin-treated T2D subjects, of whom a similar trend of greater FH
contribution at higher HbA1c (Figure 2C) was identified. The relative contributions of
FH with HbA1c 6 - 6.9%, 7 – 7.9%, 8 – 8.9%, 9 - 9.9%, and ≥ 10% were 39%, 44%,
54%, 50%, and 58% respectively. Subjects with HbA1c ≥ 10% had significantly higher
FH contribution (p = 0.047). However, this was not significant after adjusted for
hypoglycemia (p = 0.075). On a separate note, the contribution of PPH was greater
when HbA1c < 8%, but this was not statistically significant as a result of a smaller
sample size.
4. DISCUSSION
Current research was the first prospective study assessing the relative contributions
of FH, PPH, and HbA1c by using CGM in a multiracial T2D cohort (Malays, Indians,
Chinese) in real-world setting. Present analysis observed that FH and PPH
contributions to HbA1c were equal in relatively well-controlled T2D subjects (HbA1c <

Acc
epte
d A
rtic
le
This article is protected by copyright. All rights reserved.
8%), which was consistent with previous Chinese studies15,17. These results
remained similar even with the application of Riddle et al’s AUC calculation method,
together with a significant predominance of FH at HbA1c 8 – 8.9% (57.5%, p = 0.043)
and HbA1c ≥ 10% (61.1%, p = 0.005) in the overall cohort21. Of note, this finding was
contrary to the Monnier et al’s, where higher PPH contribution at lower HbA1c levels
was reported among Caucasians with T2D. A comparison between the eight studies
examining this relationship was summarized in table 3, which could have further
expounded on the discrepancy of results.
Our study indicated a significant trend of decreasing PPH contribution (and therefore
increasing FH contribution) as HbA1c increased in both OAD- and insulin-treated
multi-ethnic Malaysian T2D subjects (HbA1c ≥ 9% and 10% respectively). This added
further information on the findings of previous studies which included either drug-
naïve or OAD-treated T2D among Caucasians and East Asians only, except Kikuchi
et al who also recruited those on basal insulin13,16,17,20. In addition, Wang et al
reported a trend towards greater FH contribution with HbA1c > 8% among Taiwanese
Chinese, although the difference was not statistically significant15. This could
possibly because their highest quintile had a very broad HbA1c range of 8.8 – 12.7%
(73 – 115 mmol/mol), compared to the even HbA1c range in our study. Overall, these
data suggested that in both Caucasian and Asian subjects with poorly controlled T2D
(HbA1c ≥ 8%) irrespective of treatment regimen, FH was predominant and should
therefore be the focus of therapy.
Among OAD(s)-treated subjects, FH and PPH contributions were equal, despite
showing a non-significant trend of higher FH contribution at 54 – 58% with HbA1c <
9% (75 mmol/mol) in our cohort. Previous studies, which involved mainly Caucasians

Acc
epte
d A
rtic
le
This article is protected by copyright. All rights reserved.
and East Asians with T2D, had mostly described the predominance of PPH at low
HbA1c levels13,15,16,17. The explanation for this variation from what had been
previously observed was unclear. As our study subjects had a longer duration of
T2D, PPH contribution was hypothesized to be higher as a consequence of greater
pancreatic beta-cell insufficiency. However, this was not demonstrated in our study.
The influence of OAD(s) on this relationship was taken into consideration – neither
incretin therapies nor AGI was found to be the significant predictor of the contribution
difference. Our results were in concordance with Peter et al, where greater FH
contribution remained (56.5 - 76.5%) when HbA1c was < 9%20. Despite reporting a
reduced FH contribution from 56.5% to 47.0% (and therefore greater PPH
contribution) at HbA1c < 7% after adjusting for overestimation of nocturnal glycemia in
this British cohort, it was important to note that the reference group was a totally
different population than the study subjects20. In drug-naïve Chinese T2D patients,
equal contributions of FH and PPH at HbA1c 7 – 9% was demonstrated16. When
HbA1c < 7%, PPH contribution predominated at 77.2% in this cohort16. These
findings suggested that controlling FH and PPH concomitantly were important in
lowering HbA1c to 7 – 9% in both drug-naïve and OAD-treated Chinese T2D,
perhaps with greater emphasis on PPH when HbA1c < 7%.
In contrast to above findings, a non-significant trend of greater contribution of PPH at
HbA1c < 8% was shown among insulin-treated Malaysian T2D subjects. Moreover,
the observation of a significantly greater contribution of FH at higher HbA1c level (≥
10% in our study) among insulin users was clinically relevant and reinforced the
importance of treating FH in poorly controlled T2D subjects.

Acc
epte
d A
rtic
le
This article is protected by copyright. All rights reserved.
We attempted to determine the factors that could possibly affect the contribution
difference. Based on the secondary analysis, advancing age was a significant
predictor of greater PPH contribution in current Malaysian cohort. We hypothesized
that this might represent a greater degree of beta-cell insufficiency in older
individuals. The presence of hypoglycemia did significantly predict greater PPH
contribution, which might be explained by defensive eating or overcorrection of
hypoglycemia leading to elevated post-prandial glucose levels. As this was an
observational study, these results should be interpreted with caution.
Our study had a few strengths. First, patients from three main ethnic groups,
comprising of Malays, Indians, and Chinese living in Malaysia were enrolled. It is
notable that the correlation of glycemic parameters can possibly be modified as
sequelae of inter-ethnic genetic and phenotypic heterogeneity. Furthermore, use of
6-day CGM provided far greater glycemic insights compared to previous studies,
which mainly used SMBG or discrete plasma glucose values. Only two studies used
3-day CGM15,17. Each of our subjects had a total of 18 days of CGM over a two-
month period, i.e. in the 100 subjects we had a total of 1800 days of data, which at
288 readings per day gave a total of 518,400 glucose values. To the best of our
knowledge, this represents the most comprehensive assessment in this area to date.
In addition, all our subjects were allowed to consume their normal routine diets, thus
providing “real-life” data which were reflective of daily nutritional patterns and
glycemic excursions of Malaysians with T2D. Each logged meal (not just the three
main meals) was considered in the analysis, which again contributed to the
robustness of our data. Of note, our cohort had the widest HbA1c range compared to
other studies, i.e. 6 – 14% (42 - 130 mmol/ mol).
Acc
epte
d A
rtic
le
This article is protected by copyright. All rights reserved.
A few limitations were recognized in our study. First, the detectable glucose range of
CGM was between 2.2 – 22.2 mmol/L and a small number of subjects had readings
above or below these values. Second, we relied on our subjects to have accurate
logs of their meal times to facilitate PPH measurements as precise as possible.
Third, we were not able to capture the glycemic profiles on non-CGM days, which
would have provided further robustness to our data. Better dietary and drug
adherence on CGM days could be observed, especially when subjects were aware
that they were under monitoring (Hawthorne effects). Fourth, the repetitive CGM
performed at different intervals on the same individuals could contribute to the
possible bias on the assessment of FH and PPH contributions. Nonetheless,
applying the MMRM analysis took into account this possibility, together with better
between-subject correlations at different time intervals, could help in minimizing the
potential bias. It would be good to have the subgroup analysis on single ethnicity-
based contribution differences. However, our sample size was limited to detect such
variations.
In conclusion, our study, by utilizing 6-day CGM, observed equal contributions of FH
and PPH among well-controlled multi-ethnic T2D cohort (HbA1c < 8%) in real-world
practice. The contribution of PPH declined progressively when HbA1c advanced in
both OAD- and insulin-treated T2D subjects. In real-life setting, FH was the main
contributor when HbA1c was ≥ 9% in OAD-treated subjects and ≥ 10% among insulin
users. A unique observation which required further validation was the greater
contribution of PPH when HbA1c < 8% despite the use of both basal and mealtime
insulin. CGM was an accurate glycemic monitoring tool in daily clinical practice as
reflected in our study. Future research on this relationship by ethnicity, focusing

Acc
epte
d A
rtic
le
This article is protected by copyright. All rights reserved.
among Asians, is important in view of the genetic and phenotypic disparities in T2D
population. Our observations also call for more studies with larger sample sizes to
verify the effects of insulin therapy on FH and PPH contributions across HbA1c
ranges. These findings are crucial as they provide useful guide to clinicians in
personalizing the treatment regimens for Asians with T2D.
5. ACKNOWLEDGEMENTS
The authors would like to thank the research team and all study patients for their
immense co-operation throughout the study period. The authors wish to thank
Medtronic International for the biostatistical support.
This study was selected as an Oral Presentation at the 10th International Diabetes
Federation – Western Pacific Region (IDF-WPR) Congress & 6th Asian Association
for the Study of Diabetes (AASD) Scientific Meeting, Singapore, 21st – 24th
November 2014.
6. DISCLOSURE
All authors have no conflict of interest pertaining to this study.
7. AUTHORS’ CONTRIBUTION
LLL - Involved in the recruitment and follow-up of patients, statistical analysis and
writing of the manuscript. AJMB - Performed the statistical analysis and involved in
manuscript writing. LI, SSP, JR – Involved in the recruitment and follow-up of
Acc
epte
d A
rtic
le
This article is protected by copyright. All rights reserved.
patients. SPC, SRV, ATBT - Participated in the recruitment of patients and writing of
the manuscript including final proof reading. All authors read and approved the final
manuscript.
8. REFERENCES
1. Rahbar S, Blumenfeld O, Ranney HM. Studies of unusual haemoglobin in
patients with diabetes mellitus. Biochem Biophys Res Commun 1969; 36:
838-843.
2. Global Guideline for Type 2 Diabetes. International Diabetes Federation 2012.
3. The Effect of Intensive Treatment of Diabetes on the Development and
Progression of Long-Term Complications in Insulin-Dependent Diabetes
Mellitus. The Diabetes Control and Complications Trial Research Group. N
Engl J Med 1993; 329:977-986
4. R. Holman, Sanjoy Paul, M.A. Bethel et al. 10-year Follow-up of Intensive
Glucose Control in Type 2 Diabetes. United Kingdom Prospective Diabetes
Study (UKPDS) Group. N Engl J Med 2008;359; 15, Oct 9
5. American Diabetes Association Standards of Medical Care in Diabetes 2015.
Diabetes Care 2015; 38(Suppl. 1): S1–S2. DOI: 10.2337/dc15-S001
6. Use of Glycated Haemoglobin (HbA1c) in the Diagnosis of Diabetes Mellitus.
World Health Organization 2011.
7. Goldstein DE, Little RR, Lorenz RA et al. Tests of glycemia in diabetes.
Diabetes Care 2004; 27(7):1761–73
8. Kilpatrick ES. Glycated haemoglobin in the year 2000. J Clin Pathol 2000;
53(5):335–9.
Acc
epte
d A
rtic
le
This article is protected by copyright. All rights reserved.
9. Tahara Y, Shima K. Kinetics of HbA1c, glycated albumin, and fructosamine
and analysis of their weight functions against preceding plasma glucose level.
Diabetes Care 1995; 18(4):440-7.
10. Trovati M, Burzacca S, Mularoni E et al. A comparison of the predictive power
for overall blood glucose control of a “good” fasting level in type 2 diabetic
patients on diet alone or with oral agents. Diabet Med 1992; 9:134–137
11. Bouma M, Dekker JH, de Sonnaville JJ et al. How valid is fasting plasma
glucose as a parameter of glycemic controlling non–insulin-using patients with
type 2 diabetes? Diabetes Care 1999; 22:904–907
12. Avignon A, Radauceanu, Monnier L. Non-fasting plasma glucose is a better
marker of diabetic control than fasting plasma glucose in type 2 diabetes.
Diabetes Care 1997; 20:1822–1826
13. Monnier L, Lapinski H, Colette C. Contributions of fasting and postprandial
plasma glucose increments to the overall diurnal hyperglycemia of type 2
diabetic patients: variations with increasing levels of HbA1c. Diabetes Care
2003;26:881–885
14. Monnier L, Colette C, Owens D. Postprandial and basal glucose in type 2
diabetes: assessment and respective impacts. Diabetes Technol Ther 2011
Jun;13. Suppl 1: S25-32. doi: 10.1089/dia.2010.0239.
15. JS Wang, ST Tu, IT Lee. Contribution of postprandial glucose to excess
hyperglycaemia in Asian type 2 diabetic patients using continuous glucose
monitoring. Diabetes Metab Res Rev 2011; 27: 79–84
16. Kikuchi K, Nezu U, Shirakawa J et al. Correlations of Fasting and
Postprandial Blood Glucose Increments to the Overall Diurnal Hyperglycemic
Acc
epte
d A
rtic
le
This article is protected by copyright. All rights reserved.
Status in Type 2 Diabetic Patients: Variations with Levels of HbA1c.
Endocrine Journal 2010, 57 (3), 259-266
17. Kang X, Wang C, Chen D et al. Contributions of Basal Glucose and
Postprandial Glucose Concentrations to Hemoglobin A1c in the Newly
Diagnosed Patients with Type 2 Diabetes - the Preliminary Study. Diabetes
Technol Ther 2015 Jul;17(7):445-8. doi: 10.1089/dia.2014.0327.
18. Shimizu H, Uehara Y, Okada S et al. Contribution of fasting and postprandial
hyperglycemia to Hemoglobin A1c in Insulin-treated Japanese Diabetic
Patients. Endocrine Journal 2008; 55: 753-756.
19. Bonora E, Calcaterra F, Lombardi S et al. Plasma glucose levels throughout
the day and HbA1c interrelationships in type 2 diabetes: implications for
treatment and monitoring of metabolic control. Diabetes Care 2001; 24:2023–
2029
20. Peter R, Dunseath G, Luzio SD et al. Estimates of the relative and absolute
diurnal contributions of fasting and post-prandial plasma glucose over
a range of hyperglycaemia in type 2 diabetes. Diabetes Metab 2013;
Sep;39(4):337-42. doi: 10.1016/j.diabet.2013.07.001.
21. Riddle M, Umpierrez G, DiGenio A et al. Contributions of basal and
postprandial hyperglycemia over a wide range of A1C levels before and after
treatment intensification in type 2 diabetes. Diabetes Care 2011; 34:2508–
2514
22. National Health and Morbidity Survey 2015. Ministry of Health Malaysia
(NMRR 14-1064-21877)

Acc
epte
d A
rtic
le
This article is protected by copyright. All rights reserved.
23. Kong AP, Xu G, Brown N, So WY, Ma RC, Chan JC. Diabetes and its
comorbidities-where East meets West. Nat Rev Endocrinol. 2013
Sep;9(9):537-47. doi: 10.1038/nrendo.2013.102
24. RW Beck.Prolonged Nocturnal Hypoglycemia Is Common during 12 Months
of Continuous Glucose Monitoring in Children and Adults with Type 1
Diabetes. Juvenile Diabetes Research Foundation Continuous Glucose
Monitoring Study Group. Diabetes Care 2010; 33:1004–1008
9. FIGURE LEGENDS
Figure 1: Definitions of Glycemic AUC. AUCTOTAL = AUC ≥ 5.6 mmol/L. AUCPPH = AUC above each pre-prandial glucose (blue shaded areas). AUCFH = AUCTOTAL – AUCPPH (grey shaded areas) Figure 2: Relative Contribution of FH and PPH to HbA1c by MMRM analysis. (A) Overall cohort (n = 100). In the overall cohort, there was significantly decreasing trend in mean PPH as HbA1c increased (MMRM adjusted, Beta-estimate = -3.0, p = 0.009). (B) Oral antidiabetic agents-treated T2D subjects (n = 58) (C) Insulin-treated T2D subjects (n = 42). Greater contribution of FH was observed prior to the adjustment for hypoglycemia at HbA1c ≥ 10% (p = 0.047)*. However, the contribution difference was not significant after adjusted for hypoglycemia (p = 0.075). *MMRM controlled for age, gender, CGM period, presence of hypoglycemia, total dose and type of insulin, use of sulfonylurea, metformin, AGI, and DPP4-i. Table 1: Patient Demographic Data and Baseline Medications. TDD: Total daily dose of insulin; SU: Sulfonylurea; AGI: Alpha glucosidase inhibitor; DPP4-i: DPP4-inhibitors; GLP-1 RAs: GLP-1 receptor analogues. F: F-test, f: Fisher’s exact test, mc: Monte Carlo estimation of Fisher’s exact test. Table 2: Predictors of Relative Contribution of PPH to HbA1c. *MMRM controlled for age, gender, CGM period, presence of hypoglycemia, total dose and type of insulin, use of sulfonylurea, metformin, AGI, and DPP4-i.
Table 3: Comparison of studies on the relationship between FH, PPH and HbA1c. MTF: Metformin; SU: Sulfonylurea; AGI: Alpha-glucosidase inhibitor. There was no HbA1c range reported in the Kang et al’s study (only classification into HbA1c ≤ 7.0%, 7.0 – 9.0% and > 9.0%).
Acc
epte
d A
rtic
le
This article is protected by copyright. All rights reserved.
Table 1: Patient Demographic Data and Baseline Medications. HbA1c Quintiles
6-6.9% (n = 20)
7-7.9% (n = 20)
8-8.9% (n = 20)
9-9.9% (n = 20)
≥ 10% (n = 20)
Total (n = 100)
p value
Male (%)
65 50 55 45 55 54 0.810 (f)
Age (years)
61.5 ± 6.3 58.5 ± 8.4 58.3 ± 10.1 53.6 ± 9.5 53.2 ± 12.9 57.0 ± 10.0 0.035 (F)
Race (%) - Malays - Indians - Chinese - Others
40 30 30 nil
35 30 30 5
25 30 35 10
20 40 35 5
50 40 10 nil
34 34 28 4
0.521 (mc)
Duration of DM (years)
13.2 ± 9.3 11.1 ± 5.4 13.9 ± 8.1 13.9 ± 8.2 13.9 ± 9.6 13.2 ± 8.1 0.777 (F)
BMI (kg/m
2)
28.9 ± 6.4 29.2 ± 5.5 29.0 ± 4.7 28.7 ± 6.0 28.5 ± 4.6 28.9 ± 5.4 0.995 (F)
WC (cm)
95.7 ± 14.8 98.3 ± 15.1 96.6 ± 10.8 95.9 ± 14.2 97.4 ± 9.5 96.8 ± 12.8 0.967(F)
Average HbA1c (%)
6.5 ± 0.3 7.5 ± 0.2 8.4 ± 0.3 9.3 ± 0.4 11.4 ± 0.9 8.6 ± 1.7 N/A
SU (%) 60 75 60 30 15 48 <0.001 (f)
Insulin use (%)
15 20 30 60 85 42 <0.001 (f)
Insulin regime (%) - Basal only - Basal bolus - Premix - Prandial only - Not on insulin
5
15 0
0
80
5
20 5
5
65
20
35 5
0
40
15
50
15
0
20
5
65
20
0
10
10
37 9
1
43
<0.001 (mc)
TDD 67.0 ± 50.6 74.3 ± 61.4 63.5 ± 56.6 88.9 ± 55.2 87.8 ± 43.3 79.9 ± 51.7 0.667 (f)
AGI (%) 10 0 5 10 5 6 0.872 (f)
DPP4-i (%)
30 25 25 30 0 22 0.055 (f)
GLP-1 RAs (%)
0 5 10 0 0 3 0.505 (f)
Ϯ Others (Race): included Punjabis and Aborigines. TDD: Total daily dose of insulin; SU: Sulfonylurea; AGI: Alpha glucosidase inhibitor; DPP4-i: DPP4-inhibitors; GLP-1 RAs: GLP-1 receptor analogues. F: F-test, f: Fisher’s exact test, mc: Monte Carlo estimation of Fisher’s exact test.
Table 2: Predictors of Relative Contribution of PPH to HbA1c
Acc
epte
d A
rtic
le
This article is protected by copyright. All rights reserved.
Factors Estimate* p value*
Age 0.496 0.010
Hypoglycemia 6.450 0.006
Sulfonylurea - 3.448 0.639
Insulin - 7.096 0.336
Type of insulin
a) Basal bolus
b) Prandial only
c) Basal only
- 2.663
-18.336
8.291
0.632
0.552
0.428
Metformin 4.374 0.795
AGI - 5.306 0.487
DPP4-i - 0.843 0.854
ϮMMRM controlled for age, gender, CGM period, presence of hypoglycemia, total
dose and type of insulin, use of sulfonylurea, metformin, AGI, and DPP4-i.

Acc
epte
d A
rtic
le
This article is protected by copyright. All rights reserved.
Table 3: Comparison of studies on the relationship between FH, PPH and HbA1c. Monnier (2003) Shimizu (2008) Kikuchi (2010) Riddle (2011) Wang (2011) Peter (2013) Kang (2015) Our Study
n 290 57 66 1699 (6 trials) 121 52 59 100
Type of Subjects
(a) T2D on diet control, SU or MTF (b) Non-insulin & non-AGI treated (c) Caucasians
(a) 15 T1D, 42 T2D (b) Premix or basal bolus Insulin treated (c) Japanese
(a) T2D on diet control, MTF/PIO/SU or basal insulin (b) Not on prandial or premix insulin & non-AGI treated (c) Japanese
(a) T2D on MTF/ SU or combination of SU & MTF (b) Add on basal or premix insulin (c) 94.6% White
(a) T2D on MTF + SU/AGI (b) Non-insulin treated (c) Chinese, Taiwan
(a) T2D on SU/MTF, or both (b) Non-insulin treated (c) Caucasians
(a) Newly diagnosed T2D (b) Drug-naïve (c) Chinese, China
(a) T2D on all treatment regimes (b) 58%: insulin use (c) Multi-ethnic (Malays, Indians, Chinese)
Glucose thres-hold (mmol/L)
≥ 6.1 ND (Mean HbA1c
7.83%)
5.2 – 18.3 ≥ 5.6 ≥ 5.6 ≥ 5.6 ≥ 6.1 ≥ 5.6
Methods (a) One-day, four-point venous blood - 20/290 had 24-hour CGM (b) Two standardized meals
Six-point SMBG (one week)
(a) Six-point SMBG (one day) (b) Three standardized meals
Seven-point SMBG (Baseline, week 24/28)
(a) 3-day CGM (One-time period) (b) Three main recorded meals
(a) Multiple venous blood for four hours after each meal (b) Three standardized meals
3-day CGM (One-time period)
(a) 6-day CGM (monthly x 3) (b) All recorded meals
HbA1c range (%)
6.3 – 11.4 ND 5.7 – 12.5 7.6 – 10.0 5.7 – 12.7 5.9 – 9.6
classified into ≤7%, 7 to 9% and
>9%
6.0 – 14.0
Key Findings
Greater PPH at HbA1c <7.3% Greater FH at HbA1c ≥9.3%
PPH had better correlation with HbA1c
PPH strongly correlated at HbA1c <8.0%, and vice versa for FH
FH predominated across the HbA1c range despite on OAD(s)
Greater PPH at HbA1c ≤7.0% Equal FH and PPH at HbA1c >7.0%
At baseline: Greater FH across the HbA1c range After adjusted for nocturnal hypoglycaemia: Greater PPH at HbA1c <7.0% Greater FH at HbA1c ≥7.0%
Greater PPH at HbA1c ≤7.0% Equal FH and PPH at HbA1c 7.0-9.0% Greater FH at HbA1c >9.0%
Equal FH and PPH at HbA1c <8.0% Greater FH at HbA1c ≥8.0%
ϮMTF: Metformin; SU: Sulfonylurea; AGI: Alpha-glucosidase inhibitor; ND: Not documented.

Acc
epte
d A
rtic
le
This article is protected by copyright. All rights reserved.

Acc
epte
d A
rtic
le
This article is protected by copyright. All rights reserved.

Acc
epte
d A
rtic
le
This article is protected by copyright. All rights reserved.