Embed Size (px)
Citation preview
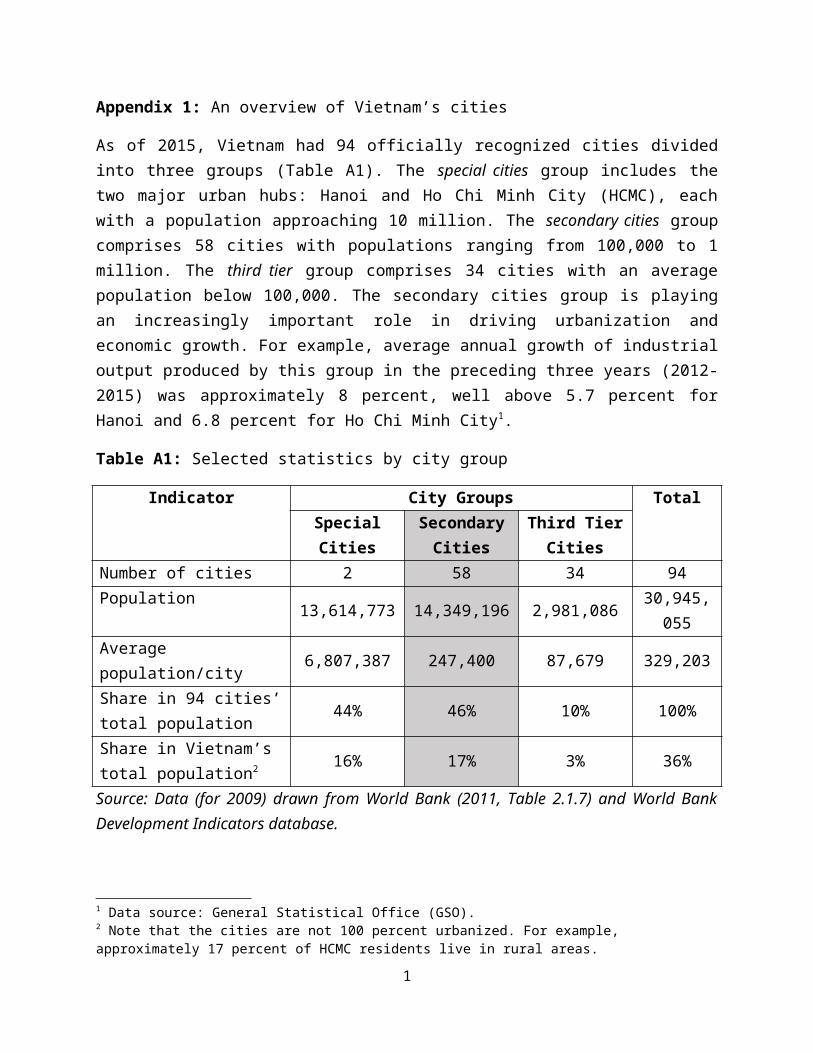
Appendix 1: An overview of Vietnam’s cities
As of 2015, Vietnam had 94 officially recognized cities divided into three groups (Table A1). The special cities group includes the two major urban hubs: Hanoi and Ho Chi Minh City (HCMC), each with a population approaching 10 million. The secondary cities group comprises 58 cities with populations ranging from 100,000 to 1 million. The third tier group comprises 34 cities with an average population below 100,000. The secondary cities group is playing an increasingly important role in driving urbanization and economic growth. For example, average annual growth of industrial output produced by this group in the preceding three years (2012-2015) was approximately 8 percent, well above 5.7 percent for Hanoi and 6.8 percent for Ho Chi Minh City1.
Table A1: Selected statistics by city group
Indicator City Groups TotalSpecial Cities Secondary
CitiesThird Tier
CitiesNumber of cities 2 58 34 94Population 13,614,773 14,349,196 2,981,086 30,945,055Average population/city 6,807,387 247,400 87,679 329,203Share in 94 cities’ total population
44% 46% 10% 100%
Share in Vietnam’s total population2 16% 17% 3% 36%
Source: Data (for 2009) drawn from World Bank (2011, Table 2.1.7) and World Bank Development Indicators database.
1 Data source: General Statistical Office (GSO).2 Note that the cities are not 100 percent urbanized. For example, approximately 17 percent of HCMC residents live in rural areas.
1

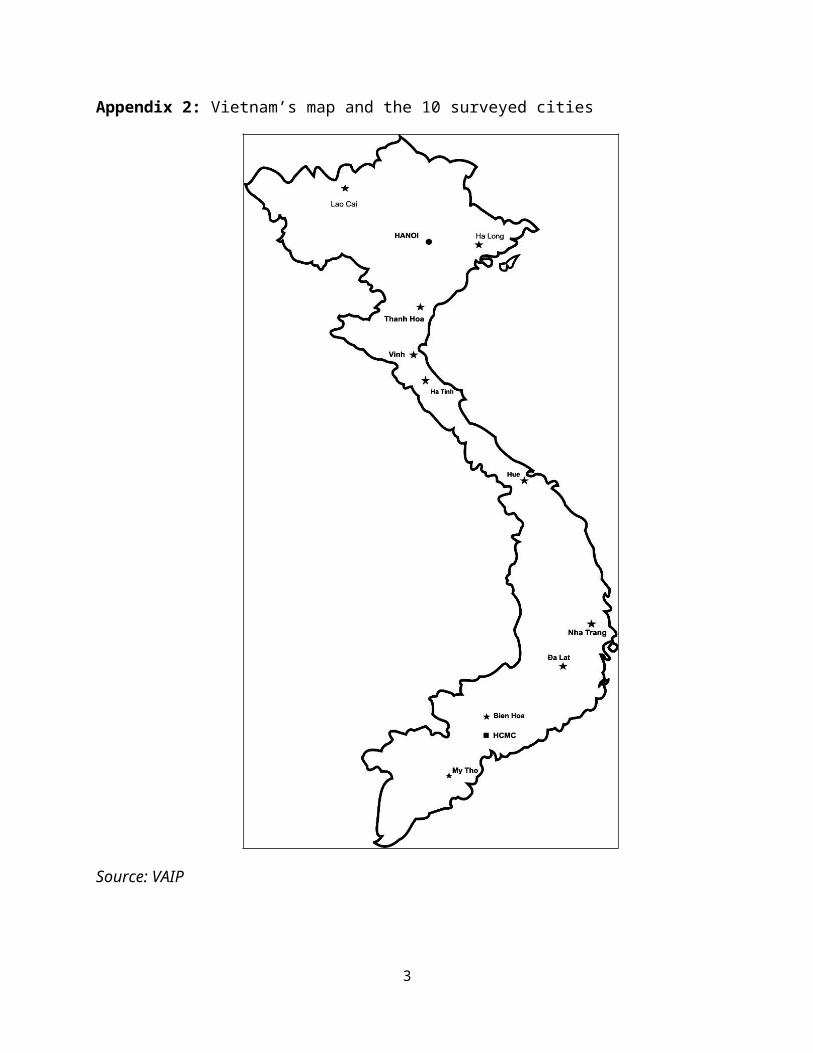
Appendix 2: Vietnam’s map and the 10 surveyed cities
Source: VAIP
2
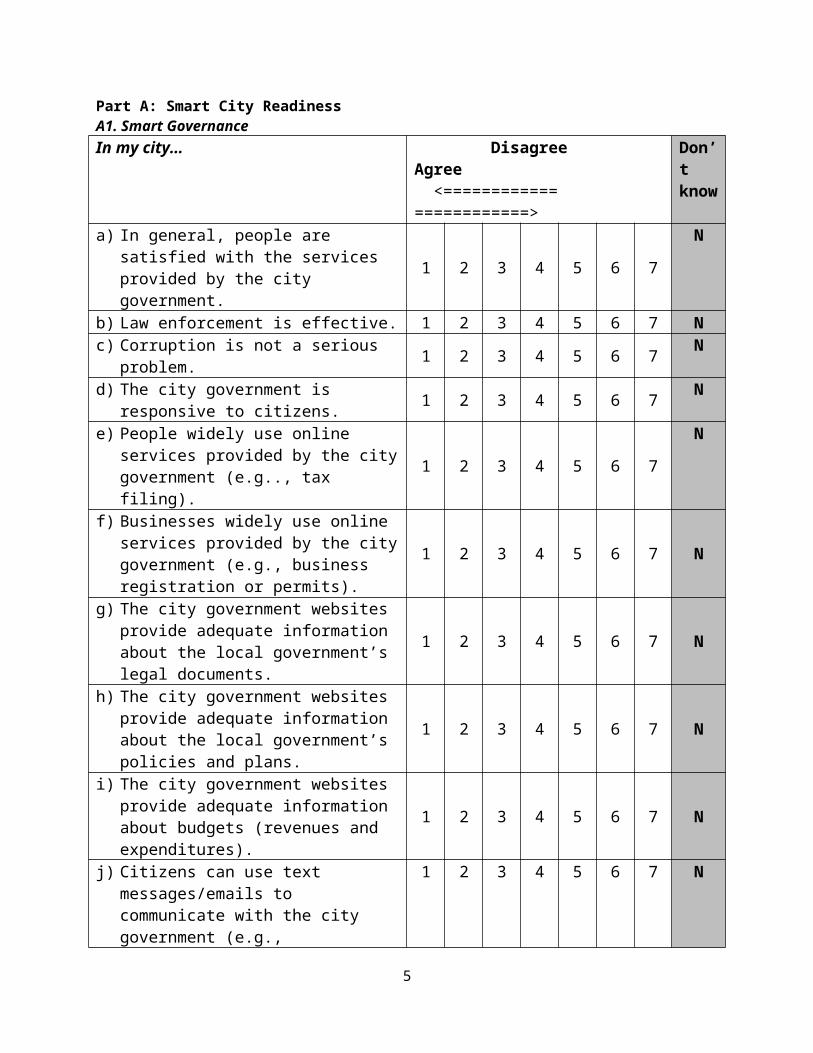
Appendix 3: A summary of the questionnaire
Survey Questionnaire
Instruction for Sections A and B: please indicate your agreement or disagreement with each of the following statements. Circle the appropriate number that best expresses your opinion about the city.
1 means “strongly disagree”
2 means “generally disagree”
3 means “somewhat disagree”
4 means “neither disagree nor agree”
5 means “somewhat agree”
6 means “generally agree”
7 means “strongly agree”
You may circle “N” (not applicable) if you are unable to answer a question using the number system.
3

Part A: Smart City ReadinessA1. Smart GovernanceIn my city… Disagree
Agree <============ ============>
Don’t know
a) In general, people are satisfied with the services provided by the city government. 1 2 3 4 5 6 7 N
b) Law enforcement is effective. 1 2 3 4 5 6 7 Nc) Corruption is not a serious problem. 1 2 3 4 5 6 7 Nd) The city government is responsive to
citizens. 1 2 3 4 5 6 7 N
e) People widely use online services provided by the city government (e.g.., tax filing). 1 2 3 4 5 6 7 N
f) Businesses widely use online services provided by the city government (e.g., business registration or permits).
1 2 3 4 5 6 7 N
g) The city government websites provide adequate information about the local government’s legal documents.
1 2 3 4 5 6 7 N
h) The city government websites provide adequate information about the local government’s policies and plans.
1 2 3 4 5 6 7 N
i) The city government websites provide adequate information about budgets (revenues and expenditures).
1 2 3 4 5 6 7 N
j) Citizens can use text messages/emails to communicate with the city government (e.g., complaining, expressing opinions, or reporting a violation of city codes).
1 2 3 4 5 6 7 N
k) Citizens can track the status and progress of their service request online. 1 2 3 4 5 6 7 N
l) The city government often consults with citizens through mobile or internet tools in formulating a policy, making an important decision, or seeking to improve public services.
1 2 3 4 5 6 7 N
m) Senior government officials widely use social media (e.g., Facebook, Twitter) to communicate with the public.
1 2 3 4 5 6 7 N
n) Mobile and internet technologies have enabled the city government to significantly improve its efficiency and effectiveness.
1 2 3 4 5 6 7 N
o) Mobile and internet technologies have enabled the city government to
1 2 3 4 5 6 7 N
4
significantly improve their reach to citizens.
p) People can use mobile phones or internet to rate the performance of some departments/agencies of the city government.
1 2 3 4 5 6 7 N
q) E-government is widely used by the city government. 1 2 3 4 5 6 7 N
r) The city government has an ICT (information and communications technology) master plan.
1 2 3 4 5 6 7 N
s) The city government has established a vision to transform the city into a smart city.
1 2 3 4 5 6 7 N
t) The city government has launched initiatives to transform the city into a smart city.
1 2 3 4 5 6 7 N
5

A2. Smart EconomyIn my city… Disagree
Agree <============ ============>
Don’t know
a) The private sector plays an important role in the local economy. 1 2 3 4 5 6 7 N
b) Entrepreneurship is strong. 1 2 3 4 5 6 7 Nc) Business associations and forums are
vibrant. 1 2 3 4 5 6 7 N
d) Businesses, in general, are keen to learn from best practices in management. 1 2 3 4 5 6 7 N
e) Businesses, in general, have made significant efforts to upgrade production technology.
1 2 3 4 5 6 7 N
f) The local business environment is fair and competitive. 1 2 3 4 5 6 7 N
g) Businesses, in general, vigorously embrace ICT to foster performance, learning, and networking.
1 2 3 4 5 6 7 N
h) People can find jobs on the internet. 1 2 3 4 5 6 7 Ni) The supply of skilled labor is abundant. 1 2 3 4 5 6 7 Nj) E-commerce is widely adopted. 1 2 3 4 5 6 7 Nk) FDI (foreign direct investment) has a strong
presence in the local economy. 1 2 3 4 5 6 7 N
l) International trade (exports and imports) is an important component of the local economy.
1 2 3 4 5 6 7 N
m) The economy has passed the stage of cheap-labor dependence. 1 2 3 4 5 6 7 N
n) The business services sector is strong (e.g., activities related to legal services, accounting, business and management consultancy, architecture and engineering, and business real estate)
1 2 3 4 5 6 7 N
o) Other, please specify__________________________________ 1 2 3 4 5 6 7 N
6

A3. Smart Human Capital Development In my city… Disagree
Agree <============ ============>
Don’t know
a) Parents pay special attention to and prioritize investment in children’s education.
1 2 3 4 5 6 7NA
b) The primary education system is good. 1 2 3 4 5 6 7 NAc) The secondary education system is good. 1 2 3 4 5 6 7 NAd) The tertiary education system is good. 1 2 3 4 5 6 7 NAe) The vocational education and training
system is good. 1 2 3 4 5 6 7 NA
f) People embrace life-long learning. 1 2 3 4 5 6 7 NAg) People widely use mobile phones for
communication. 1 2 3 4 5 6 7 NA
h) People widely use mobile phones for learning. 1 2 3 4 5 6 7 NA
i) People widely use the internet for communication. 1 2 3 4 5 6 7 NA
j) People widely use the internet for learning. 1 2 3 4 5 6 7 NAk) People are supportive of the country’s open-
up policy. 1 2 3 4 5 6 7 NA
l) People share a strong aspiration to build a prosperous future for the city. 1 2 3 4 5 6 7 NA
m) English is widely used. 1 2 3 4 5 6 7 NAn) People make great efforts in cooperation
and social cohesion. 1 2 3 4 5 6 7 NA
o) Cultural facilities (e.g., theaters and libraries) well meet the people’s demand. 1 2 3 4 5 6 7 NA
p) There are many quality attractions for international tourists. 1 2 3 4 5 6 7 NA
q) The hospital system is convenient and reliable. 1 2 3 4 5 6 7 NA
r) Slum housing is not a serious problem. 1 2 3 4 5 6 7 NAs) Poverty is not a serious problem. 1 2 3 4 5 6 7 NAt) Unemployment is not a serious problem. 1 2 3 4 5 6 7 NAu) Inequality (e.g. the gap between the rich and
poor) is not a serious problem. 1 2 3 4 5 6 7 NA
v) Crime, social ills (e.g. drug addiction and prostitution), and violence are not serious problems.
1 2 3 4 5 6 7 NA
w) Other, please specify__________________________________ 1 2 3 4 5 6 7 NA
7

A4. Smart InfrastructureIn my city… Disagree
Agree <============ ============>
Don’t know
a) Urban planning is good. 1 2 3 4 5 6 7 Nb) Traffic congestion is not a problem. 1 2 3 4 5 6 7 Nc) The road system is adequate. 1 2 3 4 5 6 7 Nd) Traffic accidents are not a common
problem. 1 2 3 4 5 6 7 N
e) People are satisfied with public transport services. 1 2 3 4 5 6 7 N
f) The sewage and drainage system is good. 1 2 3 4 5 6 7 Ng) The garbage collection and treatment system
is good. 1 2 3 4 5 6 7 N
h) Mobile phone reception is clear. 1 2 3 4 5 6 7 Ni) All high schools have access to internet. 1 2 3 4 5 6 7 Nj) Internet connectivity speed is fast. 1 2 3 4 5 6 7 Nk) Access to internet is available everywhere in
the city (e.g., internet cafés, Wi-Fi, mobile). 1 2 3 4 5 6 7 N
l) Electricity companies have started to install smart meters in homes and businesses. 1 2 3 4 5 6 7 N
m) Water companies have started to install smart meters in homes and businesses. 1 2 3 4 5 6 7 N
n) CCTV has been widely used for traffic management. 1 2 3 4 5 6 7 N
o) People can use GrabTaxi to get a taxi. 1 2 3 4 5 6 7 Np) ICTs are used for managing the lighting
system. 1 2 3 4 5 6 7 N
q) ICTs are used for parking management. 1 2 3 4 5 6 7 Nr) Mobile and internet technologies have
helped the city improve traffic management and reduce traffic congestion.
1 2 3 4 5 6 7 N
s) Other, please specify__________________________________ 1 2 3 4 5 6 7 N
8

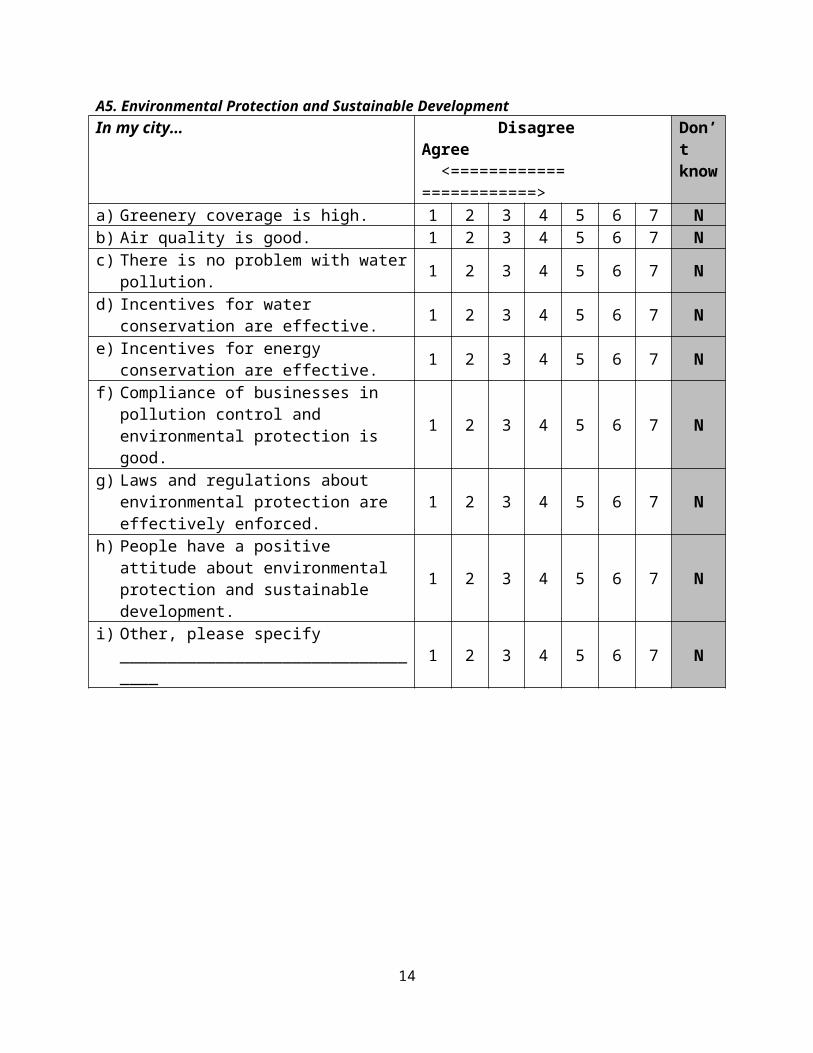
A5. Environmental Protection and Sustainable DevelopmentIn my city… Disagree
Agree <============ ============>
Don’t know
a) Greenery coverage is high. 1 2 3 4 5 6 7 Nb) Air quality is good. 1 2 3 4 5 6 7 Nc) There is no problem with water pollution. 1 2 3 4 5 6 7 Nd) Incentives for water conservation are
effective. 1 2 3 4 5 6 7 N
e) Incentives for energy conservation are effective. 1 2 3 4 5 6 7 N
f) Compliance of businesses in pollution control and environmental protection is good.
1 2 3 4 5 6 7 N
g) Laws and regulations about environmental protection are effectively enforced. 1 2 3 4 5 6 7 N
h) People have a positive attitude about environmental protection and sustainable development.
1 2 3 4 5 6 7 N
i) Other, please specify__________________________________ 1 2 3 4 5 6 7 N
9

Part B: The Dynamics of Transformation In my city, the following have significantly improved in the past three years…
Disagree Agree <============ ============>
Don’t know
Governancea) Government capability 1 2 3 4 5 6 7 Nb) Government transparency 1 2 3 4 5 6 7 Nc) Control of corruption 1 2 3 4 5 6 7 Nd) E-government 1 2 3 4 5 6 7 Ne) Government-citizen relations 1 2 3 4 5 6 7 NEconomyf) Private sector development 1 2 3 4 5 6 7 Ng) Attracting FDI 1 2 3 4 5 6 7 Nh) Job creation 1 2 3 4 5 6 7 NHuman capital developmenti) Education and training facilities 1 2 3 4 5 6 7 Nj) Use of internet and smart phones 1 2 3 4 5 6 7 Nk) Health care facilities 1 2 3 4 5 6 7 Nl) Housing development 1 2 3 4 5 6 7 Nm) Parks, greenery, and public entertainment
facilities 1 2 3 4 5 6 7 N
n) Safety and social order 1 2 3 4 5 6 7 NInfrastructureo) Urban planning and management 1 2 3 4 5 6 7 Np) Basic infrastructure (roads, electricity,
clean water, drainage systems, and waste management)
1 2 3 4 5 6 7 N
q) Mobile phone coverage 1 2 3 4 5 6 7 Nr) Internet connectivity speed 1 2 3 4 5 6 7 Ns) Traffic control 1 2 3 4 5 6 7 NEnvironment and sustainable developmentt) Control of pollution 1 2 3 4 5 6 7 Nu) Efficient use of energy and water 1 2 3 4 5 6 7 Nv) Attitudes of people towards environmental
protection and sustainable development 1 2 3 4 5 6 7 N
10

Part C: Priorities and Barriers for Smart City DevelopmentC1. PrioritiesPlease select from the list below the top five (5) priorities that your city must address in order to succeed in smart city development. Rank these priorities from 1 to 5 according to their importance.
Priority Ranka. Improving basic infrastructure (roads, electricity, water, etc.)b. Upgrading ICT connectivity (mobile coverage and broadband)c. Promoting the private sectord. Attracting FDIe. Improving job creationf. Enhancing the competence of the city governmentg. Strengthening the fight against corruptionh. Making more government services available onlinei. Making the government more transparentj. Empowering citizens, enabling them to participate in evaluation of the
performance of the local government by mobile phone or the internet on a regular basis
k. Upgrading the education and training system.l. Making more effective efforts in improving environmental quality and greenerym. Making the city safer by reducing crime and social ills (e.g., drug addiction,
prostitution, illegal gambling)n. Other, please specify
_____________________________________
C2. BarriersPlease select from the list below the top five (5) barriers that hinder your city from succeeding in smart city development. Rank these barriers from 1 to 5 according to their seriousness.
Barrier Ranka. Lack of a visionary development strategyb. Lack of funding for investing in smart city projectsc. Outdated institutions and regulatory systemd. Lack of capability to implement and manage changee. Lack of a clear purposef. Lack of implementation strategyg. Lack of accountabilityh. Lack of community supporti. Lack of understanding of smart city development conceptsj. Lack of good solutions to existing problemsk. Other, please specify
_____________________________________
11

Profile Information 1. City name: _____________________
2. Your primary area of profession:1) ____Government official 2) ____Business management 3) ____Academics/Expert 4) ____Retired5) ____Student 6) ____Other, please specify ____________________
3. Your work experience: the total number of years you worked in your lifetime is 1) ____Less than 3 years 2) ____3–5 years 3) ____6–10 years4) ____11–20 years 5) ____More than 20 years
4. Number of years you have lived in the city: 1) ____Less than 3 years 2) ____3–5 years 3) ____6–10 years4) ____11–20 years 5) ____More than 20 years
5. Your age:1) ____Below 30 2) ____31–40 3) ____41–50 4) ____51–60 5) ____Above 60
6. Gender:1) ____Female 2) ____Male
7. You are a frequent user of:a. Mobile phone: ____Yes ____Nob. Email: ____Yes ____Noc. Smartphone: ____Yes ____Nod. Social media: ____Yes ____No
12

Appendix 4: Checks of internal consistency reliability
Cronbach’s alpha coefficient is useful for checking the reliability of results by evaluating the interrelatedness of multiple-item measures under an investigated dimension (Cortina 1993). The alpha coefficient is calculated based on the Spearman-Brown Prophecy Formula (Nunnally and Bernstein 1994), yielding values between 0 and 1. Concerning the benchmark for judging values of alpha, Nunnally and Bernstein (1994: 265) suggest that for an exploratory study, a threshold of 0.70 is modest evidence of reliability. Table 1 reports Cronbach’s alpha coefficient for six constructs, which include the five dimensions of smart cities and perceptions about changing dynamics. The figure under each construct is the number of questions in the questionnaire in this category. The alpha coefficient is reported for each city and for the entire sample.
Table A2: Cronbach’s alpha coefficient by construct and city
City
SmartGovernment
(20)
SmartEconomy
(14)
Smart Human Capital
Development (22)
Smart Infra-
structure and
mobility (18)
Smart Environ-
ment
(8)
Changing Dynamics
(21)
Bien-Hoa 0.9038 0.9191 0.9266 0.9312 0.9485 0.9679Da-Lat 0.9407 0.9117 0.9203 0.8937 0.9122 0.9581Ha-Long 0.9444 0.9239 0.9326 0.9444 0.9019 0.9569Ha-Tinh 0.9593 0.9457 0.9216 0.9558 0.9454 0.9715Hue 0.9439 0.8309 0.8666 0.9016 0.8768 0.9589Lao-Cai 0.9525 0.9347 0.9303 0.9246 0.9519 0.9751My-Tho 0.9444 0.9079 0.9258 0.8828 0.8995 0.9301Nha-Trang 0.9429 0.9167 0.9468 0.9207 0.9419 0.9575Thanh-Hoa 0.787 0.8572 0.8167 0.7946 0.8704 0.9051Vinh 0.9436 0.8825 0.9198 0.9132 0.9428 0.9572All sample 0.9453 0.9274 0.9225 0.9158 0.9254 0.9615Note: the figure in parentheses is the number of questions related to the particular dimension.
The alpha exceeds 0.70 for every construct and city, evidence that the survey’s results pass the minimum threshold of internal consistency and reliability. Furthermore, the alpha is above 0.90 for most cities on most constructs, supporting the validity of the survey’s results.
13
Appendix 5: Upward bias by government respondents in assessing governance-related issues
For a number of questions related to governance issues, regressing scores on the dummy variable non-government (=1 if respondent is not from government; =0 otherwise) reveals upward bias in assessments by government respondents. As shown in Table A3, for a given issue, the constant is the mean score given by government respondents, which is 4.8 for citizen satisfaction (column (1), 4.9 for government responsiveness (column (2), and 3.5 for effectiveness in corruption control (column (3). The coefficient on the dummy non-government, however, is negative and statistically significant. Moreover, the magnitude of this coefficient is rather large for government responsiveness (-0607) and effectiveness of corruption control (-0.448).
Table A3: Regression results for scores on selected governance issues
Explanatory variable
Dependent variableCitizens, in general,
satisfy with city government
City government is responsive to citizens
City government is effective in corruption
control(1) (2) (3)
Non-government -0.301** -0.607*** -0.448 (0.128) (0.125) (0.155)
Constant 4.779 4.921 3.518 (0.087) (0.084) (0.113)
N 492 492 492Adj-R2 0.05 0.13 0.14Note: the regressions are based on model (1) presented in Section 3, using Stata areg command.
14