Embed Size (px)
Citation preview

Supplementary Information
Tables
Supplementary Table 1: Demographic of subjects included in CSF multi-analyte profiling from the three cohorts in our study
ADNI UPenn WUSTL CombinedDiagnosis AD CN AD CN AD CN AD CNN (subjects) 69 91 249 26 59 208 377 325Gender (% F) 43% 49% 57% 62% 61% 66% 55% 60%Age, y (SD) 75(8) 76(6) 72(9) 70(11) 76(7) 70(7) 73(9) 72(8)ApoE E4 alleles
0 49% 60% 36% 73% 31% 67% 38% 66%1 36% 32% 50% 27% 61% 30% 49% 30%2 14% 8% 14% 0% 8% 2% 13% 4%
MMSE score at baseline (SD)
24(2) 29(1) 21(6) 29(1) 25(4) 29(1) 22(5) 29(1)
MMSE groups
0-10 0% 0% 5% 0% 0% 0% 3% 0%11-20
6% 0% 26% 0% 15% 0% 21% 0%
21-25
77% 1% 34% 0% 39% 2% 43% 1%
26-29
17% 58% 25% 38% 37% 54% 25% 54%
30 0% 41% 0% 46% 9% 44% 2% 43%
Abbreviations: AD = Alzheimer’s disease; CN = Cognitive Normal; MMSE = Mini-Mental State Examination score

Supplementary Table 2: 52 MAP-RBM analytes that are in common across all three cohorts.
Protein Name Abbreviation
Alpha1Antitrypsin AATAngiotensin Converting Enzyme ACEAlpha2Macroglobulin A2MAngiopoietin 2 ANG2Apolipoprotein AI APOAIApolipoprotein CIII APOCIIIApolipoprotein H APOHApolipoprotein a Lp(a) / LPAAXL Receptor Tyrosine Kinase AXLBeta 2 Microglobulin B2MComplement C3 C3Calcitonin CALCD40 antigen CD40AChromogranin A CGAC Reactive Protein CRPChemokine CC4 HCC4Fatty Acid Binding Protein heart FABPFerritin FRTNFibrinogen FIBRINFollicle Stimulating Hormone FSHHeparin Binding EGF Like Growth Factor HBEGF
Hepatocyte Growth Factor HGFIntercellular Adhesion Molecule 1 ICAM1Immunoglobulin A IGAInsulin like Growth Factor Binding Protein IGFBP
Interleukin 16 IL16Interleukin 8 IL8Leptin LEPTINMonocyte Chemotactic Protein 1 MCP1Macrophage Migration Inhibitory Factor MMIF
Macrophage Inflammatory Protein 1 beta MIP1B
Matrix Metalloproteinase 3 MMP3Myoglobin MYOPlasminogen Activator Inhibitor 1 PAI-1

Pancreatic Polypeptide PPPProstatic Acid Phosphatase PAPPregnancy Associated Plasma Protein A PAPPA
Prolactin PRLT Cell Specific Protein RANTESResistin RETNS100 calcium binding protein B S100BSerum Amyloid P Component SAPStem Cell Factor SCFSerum Glutamic Oxaloacetic Transaminase SGOT
Sex Hormone Binding Globulin SHBGSortilin SORTTissue Factor TFTissue Inhibitor of Metalloproteinases 1 TIMP1
Tumor Necrosis Factor Receptor 2 TNFR2TNF Related Apoptosis Inducing Ligand Receptor TNFRAILR
Vascular Endothelial Growth Factor VEGFvon Willebrand Factor VWF

Supplementary Table 3: Effects of Age, gender and APOE on 52 MAP-RBM analytes across all three cohorts. ANCOVA models were built and unadjusted p-values are listed. Those that surpass FDR adjusted p<0.05 are highlighted.
ADNI UPenn WUSTL
Age Gender APOE Age Gender APOE Age Gender APOEAAT 0.057 0.031 0.530 0.004 0.058 1.000 0.021 0.006 0.240ACE 0.077 0.330 0.290 0.640 0.420 0.320 0.310 0.390 0.024A2M 0.016 0.690 0.740 0.000 0.023 0.990 0.000 0.640 0.370ANG2 0.013 0.150 0.120 0.003 0.100 0.450 0.012 0.870 0.040APOAI 0.160 0.170 0.810 0.061 0.750 0.170 0.091 0.009 0.024APOCIII 0.030 0.210 0.100 0.026 0.510 0.560 0.001 0.037 0.690APOH 0.019 0.000 0.800 0.005 0.005 0.470 0.005 0.000 0.930LPA 0.430 0.096 0.150 0.150 0.340 0.035 0.340 0.003 0.850AXL 0.260 0.710 0.160 0.720 0.650 0.210 0.850 0.990 0.041B2M 0.002 0.190 0.470 0.000 0.510 0.790 0.016 0.660 0.093C3 0.056 0.016 0.910 0.000 0.033 0.300 0.000 0.077 0.650CAL 0.650 0.520 0.360 0.037 0.000 0.380 0.059 0.009 0.210CD40A 0.000 0.370 0.014 0.001 0.065 0.520 0.051 0.029 0.180CGA 0.290 0.380 0.550 0.690 0.065 0.310 0.840 0.270 0.140CRP 0.640 0.350 0.830 0.008 0.200 0.000 0.170 0.400 0.000HCC4 0.880 0.057 0.086 0.000 0.043 0.620 0.001 0.001 0.560FABP 0.540 0.180 0.059 0.500 0.610 0.029 0.007 0.340 0.420FRTN 0.010 0.087 0.420 0.001 0.008 0.420 0.060 0.320 0.250FIBRIN 0.110 0.009 0.460 0.430 0.270 0.024 0.000 0.000 0.094FSH 0.750 0.000 0.140 0.340 0.000 0.780 0.250 0.000 0.910HBEGF 0.073 0.890 0.059 0.900 0.150 0.280 0.560 0.860 0.120HGF 0.290 0.150 0.340 0.008 0.810 0.450 0.044 0.670 0.810ICAM1 0.002 0.180 0.720 0.005 0.470 0.840 0.065 0.690 0.091IGA 0.190 0.000 0.840 0.020 0.000 0.790 0.058 0.008 0.920IGFBP 0.001 0.021 0.410 0.000 0.007 0.530 0.000 0.870 0.980IL16 0.046 0.570 0.100 0.007 0.150 0.500 0.110 0.035 0.002IL8 0.210 0.680 0.120 0.005 0.006 0.950 0.080 0.390 0.680LEPTIN 0.510 0.000 0.460 0.023 0.000 0.260 0.034 0.000 0.550MCP1 0.029 0.006 0.091 0.031 0.200 0.630 0.110 0.017 0.610MMIF 0.350 0.850 0.500 0.012 0.460 0.570 0.000 0.470 0.038MIP1B 0.310 0.860 0.580 0.220 0.410 0.940 0.350 0.660 0.570MMP3 0.002 0.011 0.047 0.084 0.110 0.750 0.006 0.490 0.210MYO 0.130 0.002 0.990 0.330 0.036 0.120 0.012 0.000 0.760PAI-1 0.000 0.024 0.270 0.000 0.670 0.570 0.000 0.007 0.016

PPP 0.004 0.390 0.720 0.000 0.002 0.560 0.000 0.009 0.110PAP 0.140 0.290 0.610 0.450 0.730 0.360 0.260 0.270 0.780PAPPA 0.130 0.058 0.550 0.000 0.000 0.750 0.870 0.610 0.310PRL 0.990 0.005 0.140 0.290 0.007 0.036 0.140 0.085 0.360RANTES 0.950 0.730 0.500 0.030 0.470 0.490 0.014 0.490 0.710RETN 0.680 0.480 0.024 0.000 0.580 0.260 0.000 0.220 0.620S100B 0.110 0.190 0.430 0.031 0.042 0.140 0.040 0.027 0.440SAP 0.140 0.000 0.110 0.210 0.000 0.950 0.310 0.000 0.170SCF 0.620 0.590 0.100 0.000 0.380 0.350 0.100 0.930 0.005SGOT 0.660 0.260 0.790 0.071 0.930 0.350 0.760 0.450 0.018SHBG 0.007 0.160 0.710 0.000 0.009 0.470 0.000 0.600 0.990SORT 0.440 0.920 0.500 0.210 0.350 0.330 0.220 0.710 0.980TF 0.020 0.490 0.260 0.180 0.960 0.270 0.640 0.540 0.160TIMP1 0.000 0.010 1.000 0.000 0.170 0.340 0.001 0.850 0.780TNFR2 0.000 0.100 0.330 0.000 0.900 0.520 0.000 0.820 0.950TNFRAILR 0.002 0.110 0.540 0.000 0.380 0.730 0.000 0.580 0.580
VEGF 0.003 0.330 0.790 0.064 0.990 0.520 0.950 0.620 0.004VWF 0.000 0.460 0.220 0.000 0.160 0.810 0.000 0.680 0.970
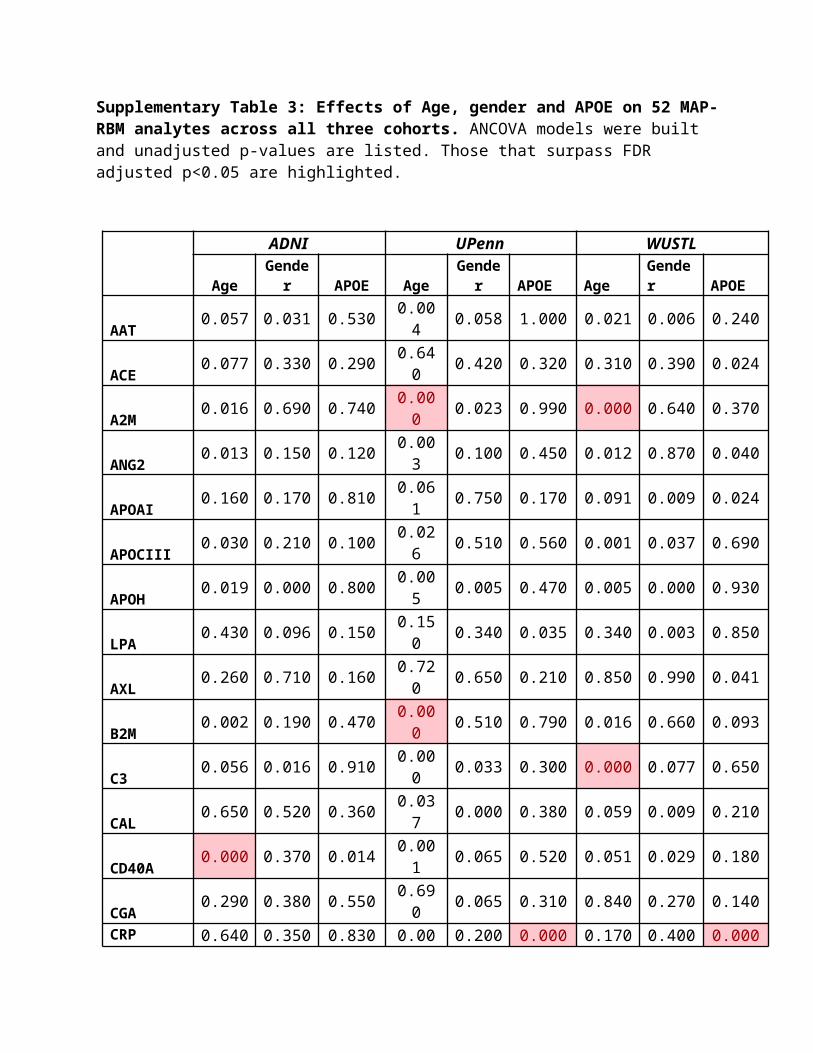
Supplementary Table 4: Adjusted p-values from the univariate linear regression analyses performed on each 54 MAP-RBM analytes in each of the cohorts (using CSF Aβ1-42 levels as outcome). Highlighted are those that have surpass FDR adjusted p<0.05.
ADNI UPenn WUSTL CombinedAAT 0.866 0.992 0.935 0.945ACE 0.942 0.286 0.118 0.129A2M 0.968 0.235 0.897 0.466ANG2 0.736 0.716 0.092 0.221APOAI 0.739 0.286 0.712 0.829APOCIII 0.739 0.794 0.935 0.954APOH 0.771 0.178 0.935 0.390LPA 0.739 0.050 0.735 0.012AXL 0.417 0.510 0.554 0.134B2M 0.866 0.968 0.118 0.619C3 0.739 0.232 0.935 0.466CAL 0.866 0.857 0.774 0.658CD40A 0.106 0.119 0.118 0.001CGA 0.942 0.794 0.239 0.492CRP 0.106 0.178 0.935 0.864HCC4 0.963 0.178 0.935 0.405FABP 0.007 0.013 0.554 0.000FRTN 0.739 0.704 0.935 0.466FIBRIN 0.739 0.684 0.196 0.983FSH 0.963 0.735 0.935 0.864HBEGF 0.739 0.178 0.935 0.460HGF 0.023 0.286 0.935 0.013ICAM1 0.963 0.684 0.554 0.852IGA 0.963 0.395 0.935 0.483IGFBP 0.968 0.966 0.575 0.954IL16 0.771 0.857 0.561 0.864IL8 0.968 0.178 0.561 0.171LEPTIN 0.968 0.945 0.712 0.864MCP1 0.968 0.647 0.512 0.466MMIF 0.106 0.671 0.935 0.102MIP1B 0.973 0.286 0.935 0.492MMP3 0.736 0.934 0.209 0.935MYO 0.739 0.178 0.935 0.248PAI-1 0.739 0.286 0.092 0.065PPP 0.417 0.422 0.512 0.102PAP 0.968 0.723 0.935 0.829

PAPPA 0.955 0.684 0.963 0.974PRL 0.115 0.119 0.935 0.005RANTES 0.968 0.178 0.554 0.102RETN 0.771 0.000 0.860 0.000S100B 0.700 0.966 0.935 0.829SAP 0.771 0.253 0.935 0.470SCF 0.963 0.713 0.092 0.974SGOT 0.968 0.647 0.935 0.864SHBG 0.942 0.857 0.935 0.829SORT 0.247 0.338 0.935 0.936TF 0.963 0.713 0.092 0.487TIMP1 0.963 0.330 0.935 0.466TNFR2 0.771 0.178 0.712 0.221TNFRAILR 0.968 0.981 0.935 0.954VEGF 0.067 0.009 0.000 0.000VWF 0.739 0.713 0.897 0.956

Figures
a) FABP

b) CD40A
c) PRL
d) LPA
e) HGF
Supplementary Figure 1: MAP-RBM analytes that significantly associated with Aβ1-42 levels in some of the cohorts. a) FABP; b) CD40A; c) PRL; d) LPA; and e) HGF.

a)
b)

c)
d)
Supplementary Figure 2: MAP-RBM analytes across MMSE groups in the combined cohorts: a) IGA; b) LPA; c) PPP; and d) TF.


![Group 8 surpass presentation[1]](https://img.dokumen.tips/doc/110x75/55896ac1d8b42a8e268b4729/group-8-surpass-presentation1.jpg)


![Breakthrougher I [Surpass Your Aspirations]](https://img.dokumen.tips/doc/110x75/577cd3591a28ab9e78970b36/breakthrougher-i-surpass-your-aspirations.jpg)