Embed Size (px)
Citation preview

IiBolt. Beranek. and. Newman. Inc.
j1 Report No. 4068
ADAO0863 40
ARPANET Routing Algorithm ImprovementsThird Semiannual Technical ReportE.C. Rosen, J.G. Herman, 1. Richer, and J.M. Mc~uIIlan
ITI
Prepared for: JUL 8 1980?Defense Advanced Research Projects Agency
I ~andADefense Communications AgentyA
Q>. jAP 0-.
LA-y
S8s0 7 7 026

UNCLASSIMSRCURITY CLMhSIPIeATto IF u~m, PAGE (noh. 001. 8£er*er
I_~~~RA INSTRUCTIONSEIJSIO NREPORT DOCUMENTATION PAGE BEFORE_____________FORM
I. REPORT NUMaER GOVT ACCXSNON NO- 3 RECIPIENT*S CATALOG NUMUER
4088 0% 3Routing Algorithm Imnrovements * SarYEOFuPR a PEmOO CReD
•-• " : 10/1/78 - 4/1/79
4. PERFORMING ORO. REPORT NUMBER4o88
4. CONTRACT OR GRANýT HUM3R(8)
E..C. Rosen J.M MoQuillaGHemnI. /RicherF' ~ ~ 37--02~
S. PERFORMING ORGANIZATION NAME AND ADDRESS .--- 1G.[[email protected];••N TASK
Bolt Beranek and New=an Inc. A4]J yA- rO_)N5 - -e -_i • 50 Moulton Street, Cambridge, MA 02138'- mnw c n 57"-349 - -
I1. CONTROLLING OFFICE NAME AND ADDRESS '
Defense Advanced Research Projects Agency /p 791400 Wilson Blvd., Arlington, VA 22290 168S-: 168
13. MONITORING AGENCY NAME & AODRESS(5I dllfemeau trtm Contrallsg Oafice) IS. SECURITY CLASS. (of thli report)
Defense Supply Service - Washington UNCLASSrIEDRoan 1D 245, The Pentagon IS.. OECLASSIFICATION/DOWNGRAOINGWashington, DC 20310 SCHEDULE
IS. DISTRIBUTION STATEMENT (at th•i Report)
5- 1
U L DSTt~u"~ 5., cuEW21lkabstract .enteed In 8to9W._TrdiI7f
Is. SUPPLEMENTARY NOTES r
IS. KEY WORDS (Continue on reverse side if necee*ey od Identify by block nuniber)
canputer networks, routing algorithms, ARPANET, line up/down procedures,distributed data base, buffer management, network measurement, networktesting, updating
20, tdTRACT(Continue an revere, side It necossev and 100entii bV block numbet)
This report describes progress made during the third six months of acontract to make several improvements to ARPANET rcuting. During thisperiod all aspects of the ARPANET's new routing algorithma were implemented,and the new algorithm was run through an extensive series of tests. The
results of these tests are presented, along with a discussion of our testggoals, techniques, and tools. A full description of the procedu-es neededto handle a dynamically changing topological data base is also presented.
DD FJP, 1473 EDITION Or, Nov5 IS OBSOLETE UNCIASSIFIED
SECURITY CtASSFICATION OF T1415PAGE(hoatl7 Vc)
UM•I i

sCcuRITv CLASSIFICATION OF THIS PAGe (*We* O.,. Eeted)I ~2O~Measurements on the performiance of the AFRPANE' s new line up/down proto-col are presented. Lastly, the procedures used in the ARPANET formanaging buffer space are described.
fF
'"J
IEUPT CLSIICTO OFTI I1 We a rd
I vj
I I
A IA
ma
sgur tAsvcro v hSPG Wo aeao
22 1~_ _ _ _ _ _ _ _ _ _

Uil il*
BBN Report No. 4088
ARPANET Routing Algorithm Improvements
Third Semiannual Technical Report
April 1979
SPONSORED BYDEFENSE ADVANCED RESEARCH PROJECTS AGENCY AND
DEFENSE COMMUNICATIONS AGENCY (DOD)MONITORED BY DSSW UNDER CONTRACT NO. MDA903-78-C-0129
ARPA Order No. 3491
Submitted to:
Director .'r .F Defense Advanced Research Projects Agency , '
ls-MV 1400 Wilson Boulevard . .Arlington, VA 22209
Attention: Program Management i
and to: I.i-."
Defense Communications Engineering Center mist special1860 Wiehle AvenueReston, VA 22090
Attention Dr. R.E. LyonsI LI
The views and conclusions contained, in this document are thoseof the authors and should not be interpreted as necessarily
i 1i representing the official policies, either expressed or implied,of the Defense Advanced Research Projects Agency or the U.S.
F! Government.
U Ii7

Report No. 4088 Bolt Beranek and Newman Inc°.
TABLE OF CONTENTS
INTRODUCTION . . ... . . . . . . . . . . . . . . . . . . . . iii
1. LINE UP/DOWN MEASUREMENTS ....................... 1
- 2. THE S?F TOPOLOGY DATA BASE .. . . . . . . . . . . . . 6
2.1 Data Base Structure .. . . . . . . . . . . . . . . 8
2.2 Requirements for the Data Base Management Module . .. 10
2.3 Dynamic Treatment of the Data Base . . ......... . 16
2.4 Specification of the Data Base Management Module .... 24
3. TESTING THE NEW ROUTING SCHEME -- GOALS . . . . . . . . . . 27
4. TESTING THE NEW ROUTING SCHEME -- TECHNIQUES . . . . . . . 39
5. TESTING THE NEW ROUTING SCHEME -- TOOLS . . . . . . . . . . 53
6. TESTING THE NEW ROUTING SCHEME --- RESULTS . . . . . . . . 68
7. BUFFER MANAGEMENT IN THE HONEYWELL 316/516 IMP . ..... 97
7.1 Introduction .. . . . . . . . . . ........ .. 97
7.2 Description of Buffer Counters . . . . . . 101
7.3 Possible Improvements . . . . . .............. 107
APPENDIX 1 SAMPLE TEST OUTPUT ............... 109
APPENDIX 2 TRAFFIC TESTS . . . . . . . . . . . . . . . . . . 137
Ii

Report No. 4088 Bolt Beranek and Newman Inc.
APPENDIX 3 INSTABILITY TESTS ..... .. . . ....... 145
APPENDIX 4 INSTABILITY/OVERLOAD TESTS . . . . . . . . . . . 155
SAPPENDIX 5 MODERATE LOAD TESTS . . . . . . . . . . . . . . . 160
-~: I- ii-

Report No. 4088 Bolt Beranek and Newman Inc.
INTRODUCTION
This report covers work performed during the period from
October 1, 1978 to April 1, 1979 on the contract to study,
design, and implement improvements to the ARPANET routing
algorithm.
In September 1978, a new line up/down protocol was installed
in the ARPANET. During the past five months we have been
collecting stamtistics on the performance of the protocol. These
statistics, summarized i-i Chapter 1, show that the protocol is
working well.
The design and implementation of the new routing algo.'ithm
in the Honeywell IMPs is now completed. Chapter 2 discusses the
last part of the algorithm to be designed, the aata base
management procedures. The new routing algorithm requires a data
base which specifies the network's topology. Since the ARPANET
topology changes frequently, ab IMPs are reconnected or even
U• reconfigured, it is important for the data base to be modifiable
on a dynamic basis. That is, when a topological change occurs,
the data base should automatically change to reflect the new
topology, without requiring human intervention. Chapter
discusses the procedures we developed for maintaining the data
base dynamically.
- iii-41
IJ
- _ __ m--mm mm wm m .. . .

Report No. 4088 Bolt Beranek and Newman Inc.
The new algorithm has been installed in most of the network
in parallel with the old algorithum. The old algorithm is still
used ordinarily for operating the network, but the network is
capable of switching over to the new algorithm. During the past
several months we have run an extensive series of tests in which
the network was operated with the new algorithm, and these tests
are discussed in Chapters 3-6. Testing a new routing algorithm
is a complex task, which must be approached systematically, and
with a specific set of goals in mind. Our approach to the
testing is discussed in Chapter' 3. In order to be able to test
the new algorithm in the ARPANET while minimizing the possibility
of disrupting network operations, we had to develop a complicated
series of testing procedures. These procedures are discussed in
Chapter 4. In Chapter 5 we discuss the software tools which we
developed in order to test the new algorithm.
The results of our testing are presented in Chapter 6 and in
the five appendices. Our main results are:
1) Utilization of resources (line and processor bandwidth)
by the new routing algorithm is as expected, and
compares quite favorably with the old algorithm.
2) The new algorithm responds quickly and correctly to
topological changes.
-iv-

Report No. 408t Bolt Beranek and Newman Tnc.
3) The new algorithm is capable of detecting congestion,
and will route packets around a congested area.
4) The new algorithm tends to route traffic on min-hop
paths, unless there are special circumstances which make
other paths more attractive.
5) The new algorithm does not show evidence of serious
instability or oscillations due to feedback effects.
6) Routing loops occur only as transients, affecting only
packets which are already in transit at the time when
there is a routing change. The few packets that we have
observed looping have not traversed any node more than
twice. However, the loop can be many hops long.
S7) Under heavy load, the new algorithm will seek out paths
where there is excess bandwidth, in order to try to
"I Ideliver as much traffic as possible to the destination.
Of course, the new routing algorithm does not generate optimal
routing -- no single-path algorithm with statistical input data
could do that. It has performed well, however, and we are ready
to cut the network over to the new algoritm permanently.
As a prelude to developing improved congestion control
techniques for the ARPANET, we have been investigating the buffer
Si [management procedures currently implemented in the ARPANET.
I v

Report No. 4088 Bolt Beranek and- N-ewman Inc.
These are described in Chapter 7, and some possible improvementsto the procedures are discussed.
I!I!
~;j
v1
I 22
- vi-U

"Report No. 4088 Bolt Beranek and Newman Inc.
Kf! 1. LINE UP/DOWN MEASUREMENTS
During September 1978 the new line up/down protocol
(described in our previous semiannual reports) was installed in
the ARPANET. In addition to providing better performance than
the old protocol, the new protocol provides greater flexibility
since the parameter values can be adjusted over a significant
range. As a result of measurements made both prior to the actual
installation and during the initial operation of the new
protocol, the following parameter values were selected for the
various types of network links. The notation (k,n) signifies
that if the higher numbered IMP -- the master -- misses k
I-Heard-Yous during n successive intervals, then the line is
brought down; NUP denotes the number of consecutive I-Heard-Yous
needed to bring a line up:
speed type (k, n) NUP interval
50 kbps terrestrial,satellite (4,20) 60 640 ms. (slow tick)
S230 kbps terrestrial (5 ,5) 60 128 ms.
9.6 kbps terrestrial,
satellite (4,20) 60 1280 vis.
Measurements of the number of line downs were taker over
approximately a five-month period (147 days) from October 1978
through March 1979. Because of the specific implementations of
Ii the protocol and the measurement package, the number of times the
- 1

Report No. 4088 Bolt Beranek and Newman Inc.
master declares a line down is a more accurate indication of the
number of line failures than the number of times the slave
declares the line down. Therefore, except where otherwise
A specified below, the number of line downs refers to the number of
times the master IMPs declared lines down. It is important to
note, however, that this measurement overestimates the actual
number of line failures because a given line failure may cause
! several line down reports, and because other network phenomena
can result in a line being declared down. (A striking example
occurred during a four-week period when IMP 13, GUNTER, had many
power outages; the resulting line downs reported by neighbors of
IMP 13 were excluded from the measurements given below.)
We now discuss the observed performance of the various types
of links. For the 50 kbps terrestrial links, the most common
links in the ARPANET, we observed an overall average interval
between failures on an average line to be 1.8 days. That is, a
"typical" line in the network failed slightly more often than
onca every second day. However, during the first two months of
the five-month measurement period, the average interval was 1.4
days, whereas during the last three months, the average was 2.2
days, a 50% improvement over the first two-month period. Figure
1 shows the weekly measurement data. We do not have an explicit
explanation for this improvement, although it could be the result
of the various topology changes that have been made during the
-2 L
7'F

Report No. 4088 Bolt Beranek and Newman Inc.
past six months. During the most recent three-month period,
three lines (between IMPs 62 and 13, IMPs 62 and 4, and IMPs 59
and 33) accounted for about 18% of the line down reports. On
each of these lines, the average interval between failures was
0.72 days; and for the remaining lines the average interval then
improves to 2.5 days. All the above values were obtained by
dividing the number of lines by the average number of recorded
line downs per day. Since the topology of the ARPANET changes
frequently, the "number of lines" is really an average; also, it
should be noted that Pluribus IMPs were not instrumented toI provide measurement statistics, and reports from test IMPs in
BBN's lab were ignored; thus there were typically about
fifty-three 50 kbps lines on which measurements were taken.
The line between IMPs 15 and 36 is the only 50 kbps
NE satellite link, and IMP 36, HAWAII, is a stub. Thus, if there is
a line failure a report cannot be transmitted from the master.
For this line we therefore examined the number of downs reported
by the slave side: over the five-month measurement period the
average interval between failures was 1.3 days, significantlr
worse than for the terrestrial links.
The average failure interval for the 9.6 kbps terrestrial
line between the LONDON and NORSAR IMPs was 0.62 days (15 hours).
As with the HAWAII line, LONDON is the master and is a stub, so
MI the data is based on reports from the slave.

Report No. 4088 Bolt Beranek and Newman Inc.
o 3.0
z00 •AVERAGE OVER
FLAST 13 WEEKS
OVERALL AVERAGEW 1.5
z
~ I ~ 1.0-AVERAGE OVER
~ FIRST 8 WEEKS•?-i 5 I I II ii It t , I I I... I ii it I i
10118 11/15 12/13 "1/10 2/7 3/71978 1979
MEASUREMENT WEEK
Figure 1-1 Line down data for 50 kbps terrestrial links
A
vI-
pME-~ 7

Report No. 4088 Bolt Beranek and Newman Inc.
No data was obtained on the 9.6 kbps satellite channel
linking NORSAR and SDAC because the master (NORSAR) is a stub,
and SDAC, a Pluribus, does not report line downs.
Finally, for a 230 kbps line, which uses different parameter
values from the lower speed lines, the average interval between
failures was 7.7 days. (There are six high speed lines currently
in the network.)
•KJ

Report No. 4088 Bolt Beranek ard Newman Inc.
2. THE SPF TOPOLOGY DATA BASE
The original specification of the data structure for the SPF
routing algorithm assumed a fixed topology data base. No
consideration was given, at first, to the issues of initializing
and maintaining this data base. To test the first few
stand-alone versions of SPF, the network line table and the IMP
connectivity table were pre-assembled into the program.
This is not sufficient for the final implementation. The
ARPANET topology is not fixed. It changes constantly due to
retrunking, as well as the addition, relocation and deletion of
nodes. These activities regularly involve standard sites and
they occur many times a day in the BBN test lab. It is clear
that the data base must be capable of responding to these
_ changes. To deal with the problems of maintaining dynamic
topology tables, we constructed the data base management module,
which detects and handles messages about lines that are not
already part of the data base as well as performing needed
consistency checking. It also implements a mechanism for the
essential garbage collection function.
The following description of the data base management module
will discuss the design choices that were made, as well as
possible alternative approaches. The description starts by
discussing briefly the structure of the data base itself and the
Ii -6-

Izi Report No. 4 q88 Bolt Beranek and Newman Inc.
it!messages which are used to update it. The major design choices
for the dynamic treatment of the data base are then examined, and
lastly, we give a full description of the module as currently
implemented.
if?
I;
1 i -7-

Report No. 4088 Bolt Beranek and Newman Inc.
2.1 Data Base Structure
The basic element in the data base is a line entry. A line
in this context is the unidirectional trunk between two IMPs.
The reverse direction of a trunk is considered a separate line
entry. . Thus each line has two end points, one of which can be
uniquely designated as the source and the other as the
destination. Associated with each line entry is the information
needed by the SPF computation, such as the delay over the line.
These line entries are grouped into blocks according to
their source IMP numbers, and the blocks are arranged in order of
ascending source IMP number. This is the most logical grouping
for the purpose of the kind of searching that is done during
routing processing. It also allows for a more compact
representation of the line entries, since the source IMP number
does not have to be kept for each line entry. Instead, a table ,
indexed by source IMP number, is kept that contains indexes into
the table of line entries. The index for each IMP points to the
I first entry in the block of line entries for which that IMP is
the source. The individual line entries contain the destination
IMP number for the line they represent as well as other
information associated with the line. The table of line entries
is called LTB and the table of indexes into it is called NTB.

Report No. 4088 Bolt Beranek and Newman Inc.
One useful consequence of this structure is that the number
of line entries for a site can be computed by subtracting its
index from that of the IMP number one greater than it. In the
original specification of the SPF data structure, this
information was explicit).. carried in a separate connectivity
table. Another feature to notice is that nodes which are not on
the network do not have to take up any room in the LTB table,
since t. e NTB table contains the information that a node has no
line entries. The indexes for the site not on the network and
the IMP one greater than it will be the same, indicating that the
site has zero lines. Note in particular that the tables may be
initialized by the simple procedure of clearing call indexes tozero so that all nodes appear to have no lines.
When an IMP is started, the data base is built up gradually
as routing updates are received. In the course of normal
operation, updates can also cause alternations in the structure
• I of the data base. These updates are generated at each IMP in
response to changing network conditions. They are circulated
throughout the network by the flooding transmission mechanisms
described in Chapter 4 of the second Semiannual Technical Report.
An update message contains the IMP number of the node which
generated it and an entry for every line for which the
originating IMP is the source. These line entries are of the
same format as the ones in the LTB table. As we will see later,
S~-9-

Report No. 4 088 Bolt, Beranek and Newman Inc.
i it is an important requirement of the data base management module
4! that each update from a particular source IMP contain a line
entry for each of that IMP's lines.
2.2 Requirements for the Data Base Management Module
The SPF algorithm makes some implicit assumptions about the
structure and consistency of the topology data base. Insuring
that the dynamically changing data base conforms to them at all
times has been a major source of complexity in the management
module. Some of these assumptions are discussed below.
2.2.1 New line entries must be detected
The module that processes a line update assumes that an
I entry for that line already exists in the data base. The first
step is to compare the current entry against the previously
received one in order to determine if there is a change being
reported. If a change is detected, the signed amount of change
is computed and used to determine which routes should change. It
is possible, however, to receive an update about an entirely new
line that has no entry in the data base. The obvious instance of
this is when a site is reconfigured, that is, when the number of
modems at a site is decreased or increased. The simple
reconnection of IMPs will also cause new lines to appear. During
a reconnection, the number of modems on an IMP does not change,
- but the neighbors to which its lines are connected change. Since
-10 -
4-k2 E

Report No. 4088 Bolt Beranek and Newman Inc.
SLTB +120- LTB + 2
0 [_7__ B+
NTB I • 0NTB +2 2NTB *3 2NTB +4 4
36 LT9 +17.NTB +67 172 43NTB +68 175 4 LT1+174
DATA BASE TABLE STRUCTURE
NOTE- THERE IS NO IMP 0 OR IMP2 ON THE NETWORK
HEADER-J
SOURCE IMP
SDESTINATION~~fi DELAY M
""fI TO 8 LINE ENTRIES
ELYIDESTINATION- '°IMPUPDATE MESSAGE FORMAT
Figure 2-1
-11 --
I I i

Report No. 4088 Bolt Beranek and Newman Inc.
a line is defined in our data base by its endpoints, without any
reference to the modem numbers involved, connecting an IMP to
another IMP, with which it previously had no connection, will
generate a new line that must be added to the data base.
It is necessary, therefore, for new entries to be detected
and dealt with in some manner. We have chosen ti create an entry
in the data base for the new line which represents the line as
having been dead. This allows the processing module to then
handle the new update in the same manner as any other update
which reports that a previously dead line has come up.
2.2.2 All line entries must be paired
In order for the SPF processing module to function properly,
every line entry in the data base must have a corresponding line
entry describing the reverse direction. For example, if the data
base has an entry in IMP 1's block for a line from IMP 1 to IMP
2, there must be one in IMP 2's block for the line from IMP' 2 to
IMP 1. Since any given update message can only report on one
direction of the line, this requirement is not necessarily met.
It i3 quite possible for an update with a new line entry to
arrive and for there to be no entry in the data base for the
reverse direction of this line. Obviously, one direction of the
line must be processed before the other.
-12-[

Report No. 4088 Bolt Beranek and Newman Inc.
Rather than rewriting the processing module to tolerate an
unpaired line entry, we decided to check for this condition
before processing the line entry. That is, after checking to see
that a particular line entry exists in the data base, we simply
do the same check again with the end points of the line reversed.
If the reverse entry does not exist, it will be treated in the
same manner as a new entry and a dead line entry created for it,
insuring that the original line now has its twin in the data
base. (It will be seen later, when we discuss garbage
collection, that this requirement that all lines be paired
provides further complication of the data base management
routines.)
2.2.3 Detection of implicitly dead lines
It is possible for lines to go dead in the network, and
possibly even be removed entirely, without some IMPs receiving
1 L any updates that declare them dead. A network partition during
1 which some IMP has its neighbors changed provides a situation in
which this can happen. Imagine that a segment of the network
containing IMPs 1, 2 and 3 is isolated from the rest of the
network. Duriig the isolation, IMP 1 has one of its lines
disconnected from its usual neighbor, IMP 2, and reconnected to a
different one, IMP 3. The IMPs in the isolated segment first
receive an update declaring IMP 1's line to IMP 2 dead. They
also should receive an update from IMP 2. Later they will
"-13-
______________________________

Report No. 4088 Bolt Beranek and Newman Inc.
receive a new update from IMP 1 announcing its new line to IMP 3.
Meanwhile, the rest of the network IMPs do not receive these
updates because they are partitioned from IMP 1. They still
believe IMP 1 has a live line to IMP 2. When the partition ends
and IMP 1 next sends an update, all the IMPs that could not see
it before will create a new entry for the line from IMP 1 to IMP
3. However, they will still believe there is also a line from
IMP 1 to IMP 2, and they will receive no update that will tell
them to declare it dead. Similar situations can arise when IMPs
crash and change neighbors before coming up to the network.
It is possible, however, to detect these lines that should
be declared dead. If every IMP follows the rule that it report
on all its live lines in every update, then any entries in the
data base which are not in the latest update message must be for
lines that are now dead. This means that before processing an
update message, the data base management must take each live
entry in its block for the source of the update and search for it
among the entries in the message. If it fails to find a match,
it must invoke the SPF computation with an update entry declaring
this line dead, thus simulating the effect of an actual update
declaring that line to be down.
In the above example, when the partition is ended and IMP 1
sends its first update, all IMPs will check its contents against
their data bases. Those IMPs which were isolated from IMP 1 will
- 14 -

Report No. 4088 Bolt Beranek and Newman Inc.
detect that there is no entry in the update with a destination of
IMP 2. They will call SPF with an entry showing the line from
IMP 1 to IMP 2 dead and then proceed to process the rest of the
update normally.
Note that with this procedure in effect, routing updates
need never contain entries for lines that have gone down, since
the absence of any entry for a dead line has the same effect as
SI an entry which explicitly declares the line to be dead.
A15
IE
..ij
4'i
4'I ..

Report No. 4088 Bolt Beranek and Newman Inc.
2.3 Dynamic Treatment of the Data Base
2.3.1 Expanding the data base
In order for the data base to adapt to changing topology, it
must be possible for it to expand to accept new entries. Since
our table structure requires that a new entry be inserted into
the block for its source IMP, it is necessary to shuffle all the
blocks above it up one slot and adjust all the appropriate
indexes.
Although this is a time-consuming procedure, the only way to
avoid ever having to expand the data base would be to allocate
the maximum number of line entry slots to each IMP. Alocating
less than this would not allow for the addition of extra lines
at a site or the reassignment of an IMP number to a now site.
Even allocating the maximum number of slots will avoid the need
for dynamically expanding the data base only if dead line entries
can be reused for new line entries. As will be seen later, the
SPF routine does not guarantee this. More importantly, this
scheme is extremely wasteful of table storage. Since the average
ARPANET connectivity is about 2.5, and the maximum number of
lines at a site is currently 5 on Pluribus IMPs, it would require
twice as many line entry slots as are really needed.
i
S~- 16 -

Report No. 4088 Bolt Beranek and Newman Inc.
2.3.2 Garbage Collection
If the data base is allowed to expand and to aicommodate newI entries, some mechanism must be implemented that garbage collects
dead line entries. Otherwise, the steady stream of network
reconfigurations will cause the data base to grow until it
exceeds the space allocated to it and the IMP would have to
restart. The data base will fill up with defunct entries unless
some method of reusing that space is implemented.
Many choices are available in choosing a garbage collection
strategy, but all strategies follow the same basic opeiration by
reusing the space occuried by dead line entries. However, as
discussed in section 2.2.2, a line must always have its reverse
direction in the data base. This means that a dead line can be
removed from the data base only if its reverse direction entry is
also dead and also removed at the same time. It should be noted
that lines are frequently found to be dead in only one direction
in the data base. If an IMP crashes, the neighbors around it
report their lines to it as dead. But no updates are generated
by the dead IMP, so its lines in the data base rev,?in live,
though the SPF computation will not use them since the node is
unreachable. Similar situations arise during network partitions.
It is necessary, therefore, to construct a routine that
searches for pairs of dead lines and removes them in some fashion
-. 17 -

Report No. 4088 Bolt Beranek and Newman Inc.
from the data base. A choice arises at this point in how to
dispose of the collected entries. The most complicated would be
to compress the data base, comDletely removing the two entries
which are being reclaimed. This would make space for two more
entries available for use anywhere in the data base.
A second alternative would be to simply mark the entries as
unused and allow new line entries to use them, rather than to
cause expansion of the data base. This does not require the
extra program code to contract the data base, but it also does
not make the reclaimed space generally available. Instead, it
only provides free slots in the same blocks in which the
previously dead entries were situated. If new entries arrive
from other source IMPs, and these source IMPs have no free
entries in thei2 blocks, it will be necessary to expand the data
base to accommodate these other entries even though there are
already some unused entries. Thus it is possible for the data
base to completel.y fill up even though there are many unused
slots in i*. If no routine for contracting the tables is
avuilable, then the IMP will have to restart. This could happen
in instances of major retrunking where ths. number of lines at
various sites changes. If only the connections between sites
change, with the number of lines at most site3 staying constant,
then this scheme would be sufficient to keep the data base from
overflowing as long as the garbage collection is done between the
- 18 -

Report No. 4088 Bolt Beranek and Newman Inc.
U •time that the old line goes dead and the time that the new one
appears. This method does have the advantage of avoiding
expanding or contracting the data base, both of which are lengthy
processes that lock out the rest of the IMP while they run.
We now come to the question of when to invoke garbage
collection procedures. Four possibilities present themselves.
Dead line entries can be removed from the data base as soon as
they are processed by SPF. Alternatively, the arrival of new
entries can prompt the search for slots that they can reuse. It
is al3o reasonable to construct some periodic process that
garbage collects the data base when no routing is being
processed. Lastly, we can wait until the table reaches its
maximum size and then shrink the data base back to its minimum
size. Each of these approaches will be explored and their
advantages and disadvantages discussed.
It is certainly possible, upon completion of processing an
~ f] update that declares that a line has died, to check thd line's
reverse direction, and if it is also dead, to remove both entries
from the data base. This test would fail in more than half the
T cases, since one direction of a line must necessarily be
processed before the other. In some instances, as showni in
section 2.2.3, the reverse direction of the line cannot be
declared dead. The major disadvantage of this approach, though,
is that it would mostly result in unnecessary work. The vast
- 19 -

Report No. 4088 Bolt Beranek and Newman Inc.
majority of cases where a line goes dead involve no retrunking.
The dead line will reappear as soon as it comes back up, perhaps
in no more than a minute. If the original entries for the line
are garbage collected as soon as they are both marked dead, thenthe updates that later herald the reappearance of the line will
have to be treated as new entries requiring special action. In
other words, the IMP would be spending its time unnecessarily
removing and reinstating the same entries.
A better scheme is to have the arrival of a new entry
prompt a search for a reusable dead one. If such an entry is
found in the block of lines for the source of the new entry, it
can immediately be "usurped". The reverse direction of the
reused entry can either be marked unused or its space compressed
out of the data base. This approach is attractive for two
reasons. First, since most new entries result from aj a
reconnection of sites in the network and not actual
I reconfigurations, it is likely that a usurpable entry will be
S1 found for the current update. The previously existing line will
have been declared dead already, in most cases in both
directions. Secondly, this method allows garbage collected
entries to be reused immediately, thus avoiding the costly
compression of the data base at the same time as avoiding the
need to expand the data base for the new entry. However, if this
is the only garbage collection mechanism used, it is still
1 - 20-
1cIJ ... . ._ __ _ __ _ __ _ __ _

-Report No. 4088 Bolt Beranek and New'man Inc.
possible for the data base to overflow even though there is
unclaimed reusable space in it. Since only the block of entries
where the new entry must be inserted is searched, usurpable
entries in other blocka will not be reclaimed. The success of
this approach thus depends on a correlation between new entries
and usurpable ones.
A periodic garbage collection mechanism is yet another
possibility. It would run when there is no routing work to do
and might search only part of the data base at a time, limiting
the amount of processing done in any one period. The primary
problem with this method focuses on what to do with the entries
that can be removed. As we discussed above, merely marking them
unused does not insure that the data base will not overflow. To
be effective, this method would have to compress the data base as
it removes entries. One pass could be made that identifies and
marks all removable entries, and then a second pass could delete
all marked slots. The problem with this is that every new entry
I that arrives will have to expand the data base so it can be
inserted. This manipulation takes many more instructions than
the job of finding a usurpable entry. The periodic approach has
the further inefficiency of removing lines that are only
momentarily dead.
The last approach we have considered does garbage collection
only when the tables overflow. It would function in the same
-21 -
U1•-

Report No. 4088 Bolt Beranek and Newman Inc.
basic manner as the per'odic mechanism. There are two advantages
to this method. First, no periodic scheduling mechanism needs to
be constructed. Second, since it will be rarely invoked, most
lines which momentarily die in the network will not be garbage
collected. Its main disadvantage is that when it is invoked, it
amust lock out the rest of the IMP while the lengthy compression
is performed. Such a transient may have global network effects.
This scheme also carries the disadvantage of requiring all new
entries to expand the data base.
We have chosen to adopt the method of garbage collecting
when a new entry arrives. The full scheme will be presented in
the next section, but a brief description is given here. When a
new entry arrives we attempt to usurp a dead line for it. If a
Z7i usurpable pair is found, the reverse direction line is marked
ki unused, and the forward direction is used for the new entry. If
0 a usurpable or unused entry is not available, then the data base
is expanded. This scheme is admittedly imperfect, but we feel it
is a reasonable compromise given the present extreme memory
constraints in the Honeywell IMP. It is possible with this
scheme to overflow the data base, at which time the IMP will have
no choice but to restart. We feel it is unlikely that this will
occur for two reasons. First, it is believed that most new lines
represent reconnections and not reconfigurations. This means
g that usurping should work most of the time. Second, we have
-22-

Report No. 4088 Bolt Ber anek and Newman Inc.
Iprovided some slack entries in the data base to provide for the
- relatively rare reconfigurations, Also remember that when an IMP
restarts for any reason such as power failures or after
maintenance, its SPF data base starts out completely compressed.
This should provide for an eventual compression in the data bases
around the network. The degree to which our garbage collection
scheme keeps the data base from growing will have to be watched
in the first few months that SPF runs in the network. Only real
experience with the network will show if it is sufficient.
23
ft
Report No. 4088 Bolt Beranek and Newman Inc.
2.4 Specification of the Data Base Management Module
2.4.1 Detect lines that have died
The first step in processing an update message is to look
for lines that are not reported. Take each live line in the data
base block for the IMP that is the source of the update and try
to find a corresponding entry in the update message. If a match
w01 is found, continue with the next data base entry. If no match
can be made, create a dummy update entry for the missing line
that shows it to be dead. Call the SPF processing module withSIthis entry. Upon return, continue searching the current data
base entries. When finished with this procedure, iterate through
the update message entries, calling SPF for each one. When the
f entire packet has been completed, it can then be marked processed
and another message started.
2.4.2 Insure that entries exist in the data base
Before the SPF module can begin to process an update entry,
a check must be made to insure that entries exist in the data
base for it and its reverse direction. SPF will make a call to
the data base management routine, FNDENT, first for the reverse
direction line and then for the line that it is about to process.
FNDENT returns the index of the line entry currently in the data
base. Now the SPF computation can proceed since it can be sure
that a pair of entries exist in the data base.
-24 -
j]ý '2N4

Report No. 4088 Bolt Beranek and Newman Inc.
2.4.3 FNDENT
This routine performs all the manipulations on the data
base. It is called to locate an entry for a line, and if one
J cannot be found, to create one. As a byproduct, it also performs
garbage collection. It requires two arguments, the source and
the destination IMP numbers for the line it must find.
The first step is to search the source IMP's block for the
appropriate line entry. If such an entry is found, the line
already exists in the data base and FNDENT exits. This is the
result in almost all cases.
If the search fails to find an entry, the line must be new.
FYDENT must now create a new entry in the data base or usurp an
old one. It searches the source's entries again, looking for
dead lines. If it finds one, it checks the destination number.
If it is zero, this is an unused entry which can be immediately
usurped. It does not have a reverse direction. The new
destination number is written into the entry and FNDENT exits.
If the dead entry has a real IMP number in its destination field,
it must be further checked to see if it can be usurped. A dead'I
line can be usurped only if its reverse direction is also dead.
If this check succeeds, the dead line and its twin are usurped.
First mark the reverse entry unused by zeroing its destination
number. Then change the destination number of the forward
-25-

Report No. 4088 Bolt.Beranek and Newman Inc.
direction entry to the new line's destination. FNDENT can then
exit. If the reverse direction of the candidate for usurping is
not dead, this entry cannot be touched. The search for dead
entries in the source IMP's block must continue until a useable
entry is found or the end of the block reached. If no usurpable
entries are found, the data base must be expanded.
The data base is expanded by the following algorithm. Save
the index of the first line entry for 'he IMP whose number is one
greater than that of the source IMP. This will be the slot where
the new entry will go. Check that there is room for one more
entry in the data base. If not, restart the IMP immediately. If
there is room, lock out the retransmission generation routine
which also uses the data base. Increment by one the indexes for
all IMPs greater than the source IMP, Starting with the last
line entry, move each entry up one slot, makirg sure to copy all
V,. information associated with the entry, including the SPF tree
flags. Stop when the slot whose index was saveu hns been copied.
Initialize the new slot to be dead, not in the tree, and to have
the destination IMP number of the new line. Unlock the data base
tables and exit FNDENT.
-26-
v..-. . . . ...

Report No. 4088 Bolt Beranek and Newman Inc.
3. TESTING THE NEW ROUTING SCHEME -- GOALS
In a distributed packet switching network, there are many
aspects of the network's design which affect its performance.
None is more important, however, than the routing scheme. It is
the routing scheme which has the major responsibility for
ensuring that packets get delivered to their destination in as
timely a manner as possible. If the routing scheme performs
badly, packets may never reach their destinations at all, even if
there is a free and clear path to the destination. Packets may
be sent into areas of congestion, even if there is a path around
the congestion. Packets may be sent on a long-delay path; even
if a short-delay path is available. Packets may be routed to
dead lines or dead IMPs. Because of the importance of routing to
the general performance of the network, it is not desirable to
change the routing scheme of an operational network (such as the
ARPANET) without first putting the new routing schem,i through ant extensive series of tests. This is no simple matter. Any
K• routing scheme will have several different modules, each of which
must be tested separately from the others and also jointly with
the others. Measurement tools must be designed and implemented.
Measurement testbeds must be developed. A series of milestones
must be planned, so that the testing can proceed in an orderly
and systematic manner. In this chapter we will discuss the
thinking behind our testing procedures. In the next chapters we
27

Report No. 4088 Bolt Beranek and Newman Inc.
will discuss our testing techniques and tools, and will present
some of the results of our testing.
Any distributed, adaptive routing scheme can be thought of
as having five separate components -- a measurement process, an
updating protocol, a "shortest-path" computation (the quotes are
used because the definition of "short" is relative to a metric
which may bear no relation to any intuitive notion of shortness),
a procedure for managing the data base used by the shortest-path
computation, and a procedure for forwarding packets on the basis
of the output of the shortest-path computation. It should be
noted that the term "routing algorithm" has been avoided here,
because it has been used ambiguously in the past, sometimes
referring to the entire routing scheme, sometimes referring only
to the shortest-path computation. To prevent confusion, the term
"routing algorithm" will not be used here at all. In order for a
W routing scheme to perform well, each ° its components must
perform well, and in addition they must perform well jointly. In
trying to develop a set of testing procedures for the routing
scheme, each component offers a different set of problems;
testing their joint operation offers more problems still. Some
of these problems will be briefly discussed in the following
I paragraphs.
-28-
r _ _ _ - -

Report No. 4088 Bolt Beranek and Newman Inc.S
Both the new and the old ARPANET routing schemcs are
single-path schemes. That is, the shortest-path computation in
eaeh scheme defines one and only one path betweeni any given pair
of IMPs. The forwarding procedure for single-path schemes is
quite simple. The shortest-path computation generates a table
indexed by destination IMP whose values specify the next
inter-IMP trunk to use for each destination. The actual decision
as to which trunk to forward a packet on is made by a simple
table look-up. Because the new routing scheme uses exactly the
same forwarding procedure as the old, no explicit testing or
evaluation of the forwarding procedure is necessary. However, it
is worth pointing out that other sorts of routing schemes might
require non-trivial forwarding procedures for which extensive
testing would be necessary. Consider, for example, a multi-path
routing scheme. In such a scheme, the shortest-path computation
would define several paths to a given destination and would
specify what fraction of the traffic to that destination is to
flow over each path. In such a scheme, the decision as to which
trunk to transmit a particular packet on could not be made by a
simple table look-up. Rather, making this decision could require
- a computation which might have to be made for every packet. The
effects of having to perform the computation would have to be
carefully considered and tested for. In addition, the forwarding
procedure of a multi-path routing scheme could well defeat the
advantages of such a scheme. The shortest-path computation might
- 9-
U
Report No. 4088 Bolt Beranek and Newman Inc.
say to divtde the traffic to a given destination over three paths
in the ratio 0.17856, 0.25384, and 0.56760. However, it is
unlikely that a forwarding procedure could effect such a division
of the traffic. If not, then the routing scheme might not
perform nearly as well as expected, and extensive testing would
be necessary to determine whether its performance was
satisfactory. However, eince the forwarding procedure in the
ARPANET is simple, and remains unchanged, it shall not beIconsidered any further.
The measu-ement process used in the new routing scheme,
however, is quits, different from the measurement process of the
old routing scheme. It is easy 'o see why any adaptive routing
scheme must includt some sort of measurement process. In any
adaptive routing scheme, the output of the shortest.-path
Scomputution is supposed to be sensitive to ýhe state of the
network. In other words, state information about the network
must be provided as input to the computation. So there must be
some sort of process which determines, at eny given time, theI actual values of the state information to be input to the
computation at that time. This process may be dubbed a
measurement process. The measurement process of the old routing
scheme is quite simple. ivery so often, an IMP simply notes hoii
many packets are q'ieued to each of its lines at. that instant.
These queue length measurements serve as the input to the old
M-M3 L
m1

Report No. 4088 Bolt Beranek and Newman Inc.
shortest-path computation. The measurement process in the new
routin3 scheme is much more complex. The average delay per
packet on each network line is actually computed. (For a
detailed discussion of the measurement process used on the new
routing scheme, the reader is referred to our first two
semiannual reports.) In order to test the performance of the new
measurement process in isolation from the other components of the
new routing scheme, we developed the following methodology. We
actually implemented the measurement process in the IMP.
However, the results of the measurement, rather then being input
to a shortest-path computation, were sent to an PDP-10 TENEX
system for inspection and analysis. Our second semiannual report
discusses the results of an extensive series of tests made in
this way. Suffice it to say that the measurement process had
been quite throughlý tested in isolation before being combined
• iwith the other components of the routing scheme.
It is important to realize, though, that a measurement
process which performs well in isolation may not perform well
when combined with the other components of the routing scheme.
When the measurement process is run in combination with the other
components, there are feedback effects which are not present when
it is run in isolation. The inputs to the measurement process
are the actual delays of packets flowing over a line. The output
of the measurement process is the average delay per packet in
31S- 1

Report No. 4088 Bolt Beranek and Newman Inc.
that line. These average delays are the iliput to the
shortest-path computation, whose outputs are the inputs to the
forwarding process. For a particular matrix of offered traffic,
the forwarding process determines how much traffic flows over
each line, and it is this fact that determines the packet delays
on each line. (The word "determines" is being used here in the
sense of "partially determines", rather than "wholly
determines.") So the output of the measurement process at one
time partially determines its inputs at a later time, i.e., there
is a feedback effect. In our second semiannual report we present
some mathematical analysis which shows that under certain
idealized conditions, these feedback effects can cause an
instability in the routing which could make the new routing
scheme perform very badly. One of our major testing goals has
SI been to determine whether any such undesirable feedback effects
SI exist in the operational environment of the ARPANET.
The measurement process is the part of the routing scheme
which is responsible for detecting congestion in the network.
That is, when congestion exists on a particular network line, the
output of the measurement process should be such as to cause
r.ackets to be around that line. It is known that the
measurement process in the old routing scheme could not detect
congestion, and that the old routing would often send packets
into a congested area, thereby making the congestion worse. The
f - 32-

Report No. 4088 Bolt Beranek and Newman Inc.
new routing's measurement process has been specifically designed
so as to be able to detect congestion. However, to tell whether
it actually fulfills this design goal, it is necessary to run all
the components of the routing scheme together. One of our
testing goals has been to determine whether the new routing
scheme really is better at avoiding congestion than the old.
Another aspect of the measurement process (for both the new
and the old routing schemes) is the procedure for determining
whether a line is up or down. The up/down status of each line in
the network is a very important input to the shortest-path
computation. As discussed in our previous two semiannual
reports, the line up/down protocol has recently been changed in
order to make it provide a more meaningful indication of the
usefulness of the line. The way in which this part of the
routing scheme has been tested in isolation from the other
components of the routing scheme has been fully described in our
previous reports. It is worth noting that the line up/down
protocol, unlike the other parts of the measurement process, is
not subject to feedback effects. The decision as to whether to
regard a line as up or down is made on the basis of the error
rate of special protocol packets which are always sent on the
line periodically. This determination is independent of the rate
of flow of ordinary traffic in the line, so it is independent of
the results of the shortest-path computation. Since the line
- 33 -
& •l

Report No. 4088 Bolt Beranek and Newman Inc.
up/down protocol is not subject to feedback effects due to the
other components of the routing scheme, it can be fully tested in
isolation. That is, there is nothing additional to be learned by
testing it in combination with the other components.
Exactly the reverse is true of the updating protocol. It
can only be given a meaningful test in combination with the other
components of the routing scheme. The updating protocol of the
new routing scheme is not only totally different from the
updating protocol of the old routing scheme; it is different from
any other data transmission scheme found in the ARPANET. The
details of the updating protocol and the rationale for its
existence can be found in our previous semiannual reports.
2 However, .n order to formulate our testing goals with respect to
the updating protocol, it is worthwhile to discuss briefly the
role that the updating protocol plays within the routing scheme.
Recall that the input to the shortest-path computation of any
distributed adaptive routing scheme consists of state information
about the lines in the network, which may be called the data base
of the routing scheme. This state information is gathered by a
measurement process, as discussed above. The state of a
particular line can, of course, be directly measured only by the
IMP which transmits over that line. This gives rise to the
following problem: How can each node gain access tc the entire
distributed data base? This problem can be solved in two
£U
All
-34-
SI~mm m m Immunn mmnnmmm m• • U
Report No. 4088 Bolt Beranek and Newman Inc.
different ways. One way is to distribute the shortest-path
computation itself so that each piece of the computation has
direct access to the part of the data base that it needs. This
is the approach taken by the old routing scheme. The
shortest-path computation of the old routing scheme has two sets
of inputs. One input is the locally measured line state
information. The other input is the output of the shortest-path
computation at neighboring nodes. This approach requires each
node to send its immediate neighbors the results of its own
shortest-path computation. Point-to-point communication between
a pair of neighboring nodes does not offer much of a protocol
- 'problem, and the updating protocol of the old routing scheme is
very simple. Despite its apparent simplicity, however, there are
serious problems in any attempt to distribute the shortest-path
L computation. In the old routing scheme, there is no functional
relation between the routing data base at one time and the output
of the shortest-path computation at that time. That is, the
El •output of the computation depends not only on the state of the
lines around the network, but also on the history of the
I' computation, and the order in which certain events occur around
the network. It is this fact which gives rise to many of the
problems of the old routing scheme (such as looping and slowness
to react to changes) which we have discussed in detail in
previous reports.
-35-
41x - -- -

Report No. 4088 Bolt Beranek and Newman Inc.
In order to ensure that the output of the shortest-path
a computation at a given time is a function only of the state of
the routing data base at that time, we decided that the new
routing scheme should not have a distributed computation. This
means we had to take an alternative approach to solving the
problem of the distributed data base. The alternative was to
develop a quick and reliable updating protocol for transmitting
changes in the data base to all nodes in the network. Tnis makes
the entire distributed data base (i.e. the output from each of
the local measurement processes) locally available to each IMP,
enabling each IMP to maintain a complete copy of the entire data
base. This permits a purely local shortest-path computation, so
that there is a deterministic relation between the data base and
the result of the computation, thereby avoiding many of the
problems inherent in the old routing scheme. It must be pointed
out, however, that the ability of the new routing scheme to avoid
such problems is dependent on the updating protocol's really
being quick and reliable. (A full discussion of such issues is
presented in our second semiannual report.) Our updating
protocol was specifically designed to ensure quick and reliable
updating under all conceivable network conditions; one of our
major testing goals has been to determine whether the updating
protocol really meets its design goals. The only real means of
determining this is to run the entire routing scheme under
operational conditions, while monitoring the updating protocol to
-36-
_ U'mml uul

Report No. 4088 Bolt Beranek and Newman Inc.
see whether it does or does not get the routing updates around
- the network in a sufficiently timely and reliable manner. There
is no way to get significant results by testing the updating
protocol in isolation from other components of the routing
scheme.
Another component of the routing scheme which is closely
related to the updating protocol is the data base management
procedure (discussed in detail in Chapter 2). This is the
procedure that receives the routing updates from the updating
protocol and uses them to build tables which are suitable as
input to the shortest-path computation. The sorts of problems
which the data base management procedure gives rise to are not
very subtle. If the tables are not built correctly, the
shortest-path computation will probably either halt, or else go
into an infinite loop, giving immediate feedback as to the nature
_ !of the problems. Problems with other components of the routing
scheme, however, are more likely to result in poor or incorrectIirouting, a condition which is much more difficult to test for
than an infinite loop or a halt. The main problem of any
procedure which builds tables from updates is that any arbitrary
"combination of updates may arrive in any arbitrary order, which
means that the procedure must be completely free of order
* dependencies. It is almost impossible for a programmer to debug
such a procedure without testing it out in a fully operational
- 37 -

Report No. 4088 Bolt Beranek and Newman Inc.
environment (i.e. in combination with the other components of the Irouting scheme), since only in such an environment can one expect
to see enough different combinations of events. One of our major
testing goals was to run the new routing scheme under a wide --
enough variety of conditions to be able to gain confidence in the
data base management procedures.
The final component of the routing scheme is the
shortest-path computation. It may seem odd to discuss this
component last, since most discussions of routing tend to
concentrate primarily (if not exclusively) on the shortest-path
computation. Nevertheless, it is the component which is most
amenable to isolated testing in the absence of tne other
components of the routing scheme. The SPF computation has been
extensively tested as a stand-alone program on a TENEX system, as
well as a Honeywell 316 and a Pluribus. These tests, made with
the use of a test dF.ta generator, were carried out even before
any design work had been done on the other components of the new -
routing schemes. Since then we have run the SPF computations
many times in combination with the other components of the new
routing scheme. In all that testing, no problem with the SPF
computation has ever been discovered. Apparently, all problems
were discovered in the isolated testing.
3i
- 38- II

Report No. 4088 Bolt Beranek and Newman Inc.
:4. TESTING THE NEW ROUTING SCHEME -- TECHNIQUES
In the previous section, we emphasized the need for testing
the new routing scheme in the operational environment of the
ARPANET. However, testing new software in a distributed network
is a complicated procedure, involving different problems than,
say, testing a new operating system for a single computer. To
test an operating system in a computer which supports a user
community, it is necessary to schedule some down-time, during
which users are prevented from accessing the computer. The new
operating system is loaded and put through a series of tests. If
it halts, or goes into an infinite loop, the operator can regain
control of the computer from the console. At the end of the
testing period it is a simple matter to reload the old system.
Testing new software in the ARPANET, however, is nowhere near soif
simple. For one thing, we are not allowed Lo schedule
~ I "down-time" in the ARPANET. We were able to schedule software
testing periods during the early morning hours. During these
periods we were permitted to disrupt the network, in the sense of
letting the network run in a less reliable manner than usual.
But we were requested to keep the network accessible to users as
much as possible. For another thing, most of the ARPANET's IMPs
run unattended. Should an IMP halt, or go into an infinite loop,
there is no operator present to regain control. To be sure, the
Network Control Center (NCC) at BBN has an extensive set of
-39-

• IReport No. 4088 Bolt Beranek and Newman Inc.
I facilities for controlling unattended IMPs at remote sites.
However, these facilities all make use of the network itself. AnIMP which has halted, or which is running in a tight loop, will
not respond to commands from the NCC; such IMPs are out of the
NCC's control. Furthermore, any software problem which causes
the network as a whole to fail or run in a degraded condition can
cause the network to be non-responsive to the NCC's commands.
Because the ARPANET has been designed for operational robustness,
there are very few problems which can cause the network to fail
as a whole. Unfortunately, failure of the routing scheme is
among these few problems. If the routing scheme fails there may
be no way for cor.gnds to get from the NCC to the IMP. Lastly,
loading the entire network with the new routing scheme is a much
I more complicated operation than merely loading a single computer
with a new operating system. One cannot simply load the new
routing into the IMPs one by one, until all the IMPs bn;,e it.
That would mean that during some period of time, some IMPs were
using the new routing scheme while others were using the old; in
general, the network will not run properly unless all IMPs are
using the same routing scheme. Thus even the process of loading -
the new routing scheme into the net can cause problems if it is
not done carefully.
A partial solution to these problems is to do a lot of
testing in the lab before doing any testing in the field (the
-40 -

Report No. 4088 Bolt Beranek and Newman Inc.
field being the actual ARPANET). In fact we did do a great deal
of testing in the lab,, and we never tried anything in the ARPANET
without trying it in the lab first. Our lab resources, however,
are not well-suited for the testing of a new routing scheme. The
lab contains only two Honeywell 316s for use in testing IMP
software. This may have been sufficient for testing most of the
changes which have been made over the years to the IMP software,
but it is not sufficient for testing a routing scheme. it should
be obvious that the ability of a routing scheme to run properly
in a two-node network has little bearing on its ability to run in
a large distributed network. Such a trivial network just does
not give rise to the sort of problems which apply stress to a
routing scheme, since the rcuting problem in a two-node network
is completely trivial. Fortunately, we were able for a few
months to collect a total of four Honeywell 316s in our lab.
From the perspective of routing, a four-node network is
significantly more complex than a two-node network, and we were
able to do quite a bit of testing in the lab network.
I Nevertheless, a four-node network is much simpler than the
ARPANET, and we would not expect, a priori, that the result of
S.-lab testing would be the same as the result of similar tests done
in the field. So we still had to develop techniques for doing
V ;field testing that would minimize the possibility of major
disruptions of the ARPANET due to failure of the new routing
scheme.
-41-

Report No. 4088 Bolt Beranek and Newman Inc.
One should not get the impression that the NCC is completely
helpless if some major problem does arise during testing of the
routing scheme. A small number of operational IMPs are located
on BBN's premises, and these can be controlled from their
consoles. There is a procedure known as "demand reload" by which
one IMP can forcibly reload its neighbors, even if the neighbors
are not communicating with the NCC. Thus if any major problems
arise in the testing of the routing scheme, a good release can be
easily loaded in BBN's local IMPs, and these IMPs can forcibly
reload their neighbors, one at a time, until all the IMPs in the
network have the good release. In fact, we did have to use this
procedure on two occasions to restore the network to operating
condition after problems developed during our testing of the new
routing scheme. However, though the procedure is an effeotive
way of recovering from problems, it is really something that
6 should be used only as a last resort, not something that should
Sbecome a part of our everyday testing procedures. It was
therefore incumbent upon us to develop testing procedures which,
as much as possible, minimized the chances of a major problem
occurring during our tests of the rew routing scheme.
We decided to use a testing procedure similar to the one we
developed for testing the new line up/down protocol. Recall that
in order to test the line up/down protocol, we created an IMP
release that ran both protocols at once, in parallel. However,
-42-

Report No. 4088 Bolt Beranek and Newman Inc.
at any given time, in any given IMP, one of the protocols was
running in "controlling mode", and the other was running in
"phantom mode." That is, both protocols were always running,
exchanging their own special protocol packets over the line, and
coming independently to a decision as to whether the line should
be declared up or down. The actual operational up/down status of
the line, however, was affected only by the decisions of the
protocol which was running in controlling mode. The decisions of
the protocol running in phantom mode were reported to the NCC for
later analysis, but they had no operational effect on the line's
up/down status. In addition, the NCC had the capability of
switching the protocols from one mode to another in order to test
the new protocol und•r,- a variety of conditions.
. Ki We adopted a similar, though more complex, approach to the
testing of the new routing scheme. That is, we prepared an IMPsoftware release which contained all the code for both routing
schemes. This release has five different routing states, each
corresponding to a particular degree of parallelism. The five
states are the following:
I) In state I, the old routing scheme is in controlling
mode, and most of the new routing scheme is deactivated. The
Sonly active component of the new routing scheme is the
measurement process. However, even though the packet delays are
always being measured, routing updates are never generated, so
- 43 -

FPeport No. 4088 Bolt Beranek and Newman Inc. LI
none wIf the other qomponents of the routing scheme have any work
to de. This is the state in which the IMPs run when we are not
doing any testing.
IM) State I1 is similar to state I, except that a little
bit more of the new routing scheme is activated in the phantom
mode. The measurement process causes routing updates to be
WH generated; and enough of the updating protocol is activated to
ensure that all the upoates are sent to all the IMJ's in the
network. However, the reliable transmission aspects of the
updating protocol are not activated. In this state, the data
base management procedure and the shortest path computation do
FW not run at all; routing updates created by the new routing scheme
are simply discarded, instead of being processed.
1i III) In state III, the old routing scheme ..s still run in
Ithe controlling mode, but the new routing scheme is fullyactivated in the phantom mode. That is, all aspects of the new H
routing scheme are operating just as if the old routing scheme
were not there. However, all ordinary user packets are routed as
specified by the old routing scheme, and the results of the new
scheme do not have any effect on the operation of the retwork.
It is possible in this state to flag certain test traffic so that
it (but not other traffic) ir routed according to the new scheme.44
I-I4

• P Reporc No. 4088 Bolt Beranek and Newman Inc.
IV) In state IV, the new routing scheme runs in the
controlling mode, and the old routing scheme runs in the phantom
mode. All packets are routed according to the new scheme.
V) In state V, the new routing scheme runs in the
controlling mode, and the old routing scheme is completely
deactivated.
!ach of these states has a greater impact on the network's
cperation than the states preceding it. This makes the states
progressively more dangerous, in that problems arising when the
network is running in the later states are likely to have a worse
effect, and to be harder to recover from, than are problems
arising when the network is ru:ining in the earlier states. So we
attempted to do as uiuch testing as possible in the earlier states
before proceeding to the later ones. Each of the states is
useful for some kind of testing, but not for others. (State I,
•i I!of course, is not. used for testing at all, but only for normal
network operation.) In state III, it is pos3ibl.e to test the
updating protocol, the data base managehient procedure, and the
shortest path computation to see how they perform together.
However, while the new routing scheme is running in the phantom
mode, there is no feedback between the measurement process and
the shortest-path computations, since packets are not routed
according to the new routing scheme. We can generate some
imperfect feedback by sendirng large amounts of special test
U ___4

R•,port No. 4088 Bolt Beranek and Newman Inc.
traffic, and flagging that traffic so it will be routed according
to the new scheme. If the amount of test traffic is much-greater
than the amount of ordinary traffic, state III becomes
indistinguishable from state IV. To do a full test of the
routing scheme, though, with all feedback mechanisms engaged, it
is necessary to go to state IV.
State II has no utility in and of itself, but is very useful
when combined with state III. That is, one IMP can be put in
state III, while all the rest are in state II. The effect of
this is to use the network as a test data generator while
performing a state III test in a single IMP. This does not yield
as thorough a test as would be obtained by placing the entire
network in state III; it is particularly useful, though, if one
is afraid that a bug in the new routing code will cause the IMP
to halt or loop under actual network conditions.
There are two major reasons why it is important to test the
new routing scheme in state V. One reason has to do with the
distorting effect the old routing scheme, by its mere presence,
may have on the packet delays in the network. In our first
semiannual report we discussed the spikiness and high variability
of the packet delays under what would appear to be steady-state
conditions. We argued that some of this high variability may be
due to the presence of the old routing scheme. The old routing
scheme periodically causes long routing update packets to be
46

Report No. 4088 Bolt Beranek and Newman Inc.
transmitted over the lines, thereby causing spikes in the queuing
delay seen by packets. Also, the old shortest-path computation
runs periodically and takes a large number of processor cycles,
causing spikes in the processing delay seen by packets. These
effects are no less present and no less significant when the old
routing scheme is in phantom mode than when it is in controlling
mode. It is possible that when the old routing scheme is fully
deactivated, the characteristics of the packet delays will be
very different. Since the new routing scheme actually measures
the packet delays, any significant change in the characteristics
of the packet delays could have a significant effect on the
performance of the new routing scheme. That is, the new routing
scheme may perform differently when the old routing scheme is
fully deactivated (state V) then it does when the old routing
scheme is running in the phantom mode (state IV). This makes it
important to test the new routing acheme in state V.
The other reason for testing the new routing scheme in state
V" has to do with the integrity of the IMP program itself.
Removing one routing scheme from the IMP and replacing it with
another is not a simple job. The IM? program is a ten-year-old
highly optimized program vjhich has been under continuous
development. It is not implemented according to "structured
programming"; little pieces of the old routing scheme are
scattered around the IMP program. The task is further
- 47 -
Report No. 4088 Bolt Beranek and Newman Inc.
complicated by the fact that other IMP functions have been
piggybacked on various functions of the old routing scheme. For
example, at one time the old routing updates doubled as the Hello
packet of a line up/down protocols. For another example, at one
i time channel acknowledgements were sent periodically in null
packets which were always transmitted immediately after the old
routing updates. Before releasing the new routing scheme,
therefore, it is important to demonstrate that the network can
function with the old routing scheme totally deactivated. This
can be demonstrated by testing in state V.
Operating a network which contains two routing schemes gives
rise to a number of problems which we had to solve before we
would do our testing. The most straightforward problem had to do
with the limited amount of memory in the IMP. When the amount of
code in the IMP program increases, it takes up space that would
otherwise be available for packet buffers. In order to run our'
tests, we had to add code for the new routing scheme, while
leaving in all the code for the old scheme. We also had to add a
significant amount of code for instrumenting and measuring the
performance of the new scheme. In addition, there is a
significant amount of code required to implement the capability
of switching among the five states described above. After adding
all this code, the IMP had only 27 buffers left. We have in the
past run the IMP with as few as 29 buffers without encountering
-48-

Report No. 4088 Bolt Beranek and Newman Inc.
I any problems; yet when we tried running it with 27 buffers, the
network ran in a degraded fashion, producing long delays and low
throughput which was quite noticeable at the user level. We were
able to solve this problem by putting five buffers' worth of new
routing code into a "package", which could be removed from the
network whenever we did not need it for testing purposes. We
still do not totally understand, though, why the difference
between 29 buffers and 27 buffers makes such a big difference to
the network performance.
Other operational problems arise when an attempt is made to
switch between states. Neither routing scheme can be expected to
perform properly unless it is started in a well-defined initial
state. The only way to ensure the proper initialization is to
restart the IMP whenever it Is desired to activate a previously
inactive routing scheme. Furthermore, when a routing scheme is
deactivated it may have control of various scarce resources. If
the IMP is to operate properly after a test period ends, the IMP
must force the release of all scarce resources which were in use
by the scheme which has been lately deactivated. Additional
problems arise when we attempt to switch a routing scheme running
in phantom mode to controlling mode. In order for the network to
operate properly, all the network nodes must be under the control
of the same routing scheme. This can be easily shown, as
follows. Let nodes 0 and N be neighbors, and suppose that in
-49-
Ll

Report No. 4088 Bolt Beranek and Newman Inc.
node 0, the old routing scheme is in controlling mode, while in
node N, the new routing scheme is in controlling mode. It is
possible that, according to the old routing scheme, the best
route from 0 to a destination node D is via N, while according to
the new routing scheme, the best route from N to D is via 0.
Then packets for D may loop between 0 and N without ever being,
delivered to their destination. Since the two routing schemes
operate independently, there is no way to detect and break this
loop. Thus the network cannot be expected to operate properly
unless the same routing scheme is in control of all the nodes.
The problem just described can occur even if the
non-controlling routing scheme is running in the phantom mode.
An even more serious problem can arise if the non-controlling
scheme is fully deactivated. To see this, suppose the network is
divided into two areas. In one~area (the "old area"), the old
N routing scheme controls, and the new routing scheme is
deactivated. In the other area (the "new area"), the new routing
scheme controls, and the old is deactivated. Now if an IMP goes
down or come3 up in one area, the IMPs in the other area have no
way of detecting that fact, since there is no flow of routingE
update information between the two areas. (Note that this would
j not be the case if the non-controlling routing scheme were
running in the phantom mode.) Then the following situation can
t arise. Let 0 be an IMP in the old area, and let M be an IMP in
-50 -

Report No. 4088 Bolt Beranek and Newman Inc.
the new area. Suppose that M was initially down, so that 0
believes M to be unreachable. When M comes up, 0 will not be
aware of the fact, and will still believe M to be unreachable.
However, as long as 0 has a neighbor N which is in the new area,
all the IMPs in the new area will believe that 0 is up. We now
have a situation where M thinks 0 is up, but 0 thinks M is down.
Suppose that M tries to establish a connection with 0. It will
send out control packets to 0 until it receives a reply from 0.
But since 0 thinks M is down, it will never reply to any of M's
control packets. As a result, M will continue sending out
control packets forever, without ever receiving any reply. This
continuous and uncontrolled transmission of control packets can
lead to network congestion. If routing loops have formed, as
discussed in the previous paragraph, excessive re-transmissicns
of control packets can severely aggravate the problem; making the
congestion much more severe than it would otherwise be.
We see then that when we want to put a non-controlling
routing scheme into controlling mode, it is necessary to restart
all the IMPs simultaneously. Otherwise it is impossible to
ensure that the same routing scheme is in control of all the
nodes at any given time. When we began our testing, the NCC did
not have the capability to restart all the IMPs at once (though
it did, of course, have the capability to restart the IMPs one at
a time.) We had to develop such a capability especially for our
-51-
Report No. 4088 Bolt Beranek and Newman Inc.
testing. This is just one of several improvements to the NCC
capabilities that we developed as part of the routing contract.
The operational problems we have been discussing are neither
particularly profound nor especially difficult to resolve. We
have discussed them at such length because of the significant
impact they made on our testing schedule. The technique of
running the two routing schemes in parallel, and of having five
different states (constituting varying degrees of parallelism),
was developed in order to minimize the possibility that our
testing would cause a widespread or long-lasting network
disruption. We believe that we too, a sound approach; but we
wish to emphasize that safety comes at a price. Not only was the
network software made more complex, but we had to develop new
capabilities for the NCC and we also had to carefully refine our
operational procedures. Furthermore, the vast majority of
problems we encountered during our testing were operational in
nature. That is, when a major problem did develop during our
testing, it was much more likely to be due to a flaw in our
procedures than to a problem in the new routing scheme.
-52-

Report No. 4088 Bolt Beranek and Newman Inc.
5. TESTING THE NEW ROUTING SCHEME -- TOOLS
In oder to determine how well the neu routing scheme was
performing, we had to develop various instrumentation and
measurement tools. In general, we opted to keep our measurement
tools very simple. In our experience, when tools of great
complexity and sophistication are used for measuring network
performance, there is great difficulty in interpreting the data
generated by their use. It is difficult to be sure that such
tools are doing exactly what they are supposed to be doing, and
it is extremely difficult to get such tools debugged. When one
is attempting to measure a network's performance, one must be
able to have confidence in the measurement tools and procedures,
so that one can be sure that the measurement results really do
represent particular states of the network, and are not simply
artifacts of the tools. This argues for keeping the tools as
simple and easy to understand as possible.
The most obvious means of testing the performance of a
routing scheme is to create various offered traffic loads and
then see how much of the traffic was routed over the various
alternative paths. To do this we developed a tool known as the
"tagged packet." A tagged packet is just an ordinary packet with
a particular bit set in the host-IMP leader. However, the data
field of a tagged packet is used to carry a trace of the packet's
path through the network; instead of ordinary user data. When a
- 53 -
Report No. 4088 Bolt Beranek and Newman Inc.
tagged packet is first submitted to the network, its data field
does not contain any meaningful information. At each
intermediate node that the packet passes through on the way to
its destination, the packet is "tagged" with that node's IMP
number, and with the delay that the packet experienced in
traveling through that IMP. Thus when the packet arrives at its
destination, it contains a precise record of the path it
traversed, as well as its delay. The value of delay whichii
appears in the packet tag for a particular node is the same value
which is input to the measurement process at that node.
(Actually, the delay which appears in the packet tags is not
Squite so precise as the delay which is really input to the
measurement process. The latter is measured in units of 0.8
milliseconds, but the former is truncated to units of 6.4 ms., so
that we can fit it into an eight-bit field.)
Figure 5-1 shows the contents of a typical tagged packet.
This particular packet traveled a very long path, 15 hops, from
IMP 43 to IMP 9. (Note that since the tags are created as the
packet is about to be sent on an inter-IMP line, there is no tag
entry for the destination IMP.) The packet did not encounter
much queueing delay on this path -- it was a long packet, and
19.2 milliseconds is its transmission delay on a 50 kbps line.
Only on the lines between 43 and 56, 12 and 47, and 47 and 6 did
it experience a delay larger than its transmission delay. Note
A 54-__•Uu w

Report No. 4088 Bolt Beranek and Newman Inc.
that the line between 6 and 44 has a speed of 230.4 kbps, so the
delay through IMP 6 is less than 6.4 ms.
MESSAGE 838IMP: 43 DELAY: 25.6 MS.IMP: 56 DELAY: 19.2 MS.IMP: 11 DELAY: 19.2 MS.IMP: 15 DELAY: 19.2 MS.IMP: 45 DELAY: 19.2 MS.
IMP: 34 DELAY: 19.2 MS.IMP: 4 DELAY: 19.2 MS.IMP: 25 DELAY: 19.2 MS.IMP: 24 DELAY: 19.2 MS.IMP: 12 DELAY: 25.6 MS.IMP: 47 DELAY: 44.8 MS.IMP: 6 DELAY: 0.0 MS.IMP: 44 DELAY: 19.2 MS.IMP: 10 DELAY: 19.2 MS.IMP: 37 DELAY: 19.2 MS.
Figure 5-1
When many thousands of tagged packets are generated, it is
desirable to have a program which reduces the data to someii
suitable form. We developed such a program, and figure 5-2 shows
some sample output from it. In this example, we have collected
tagged packets from three source IMPs -- 14, 47, and 50. All had
a single destination -- IMP 9. The output shows exactly how many
packets from each source were collected (2672 from IMP 14, 2667
from IMP 47, and 2675 from IMP 50). It also shows the average
delay per packet for the packets from each source (34.94 ms. for
- 55 -

Report No. 4088 Bolt Beranek and Newman Inc.
SOURCE: 14 COUNT: 2672 DELAY: 34.94 MS.
PATH: 14-18-10-37- 9COUNT: 2672 DELAY: 34.94 100%
PERCENTAGE OF LOOPING PACKETS = 0.00%AVERAGE PATH LENGTH = 4.00 HOPS
SOURCE: 47 COUNT: 2667 DELAY: 32.40 MS.
PATH: 47-55-59- 9COUNT: 2667 DELAY: 32.40 100%
PERCENTAGE OF LOOPING PACKETS = 0.00%AVERAGE PATH LENGTH = 3.00 HOPS
SOURCE: 50 COUNT: 2675 DELAY: 43.56 MS.
PATH: 50-14-18-10-37- 9COUNT: 1417 DELAY: 45.62 53%
PATH: 50-29-46-60-58- 9COUNT: 1258 DELAY: 41.24 47%
PERCENTAGE OF LOOPING PACKETS = 0.00%AVERAGE PATH LENGTH = 5.00 HOPS
TOTAL MESSAGES FROM ALL SOURCES: 8014PERCENT LOOPING PACKETS = 0.00%
Figure 5-2
-56-

Report No. 4088 Bolt Beranek and Newman Inc.
IMP 14, 32.44 ms. for IMP 47, and 43.56 ms. for IMP 50). L1.1 the
packets from IMP 14 followed the same path, as did all the
packets from IMP 47. On the ther hand, two different pnths were
used to route traffic from IMP 54. The output shows exactly how
many of these packets (in absolute numbers and percentages)
travelled each of the paths, as well as the delay on each path.
The reduction program also computes the average path length for
each source-destination pair, and counts the number of looping
packets (packets which traverse some IMP more than once) from
each source. The output of this program enables us to see
exactly how packets get routed under a variety of network
conditions.
In order to process the tagged packets, it is necessary
first to collect them on our TENEX system, which is a host on IMP
X 5. However, it is sometimes convenient to experiment with
O ' traffic flows that do not have IMP 5 as their destination. (Note
K that the packets shown in Figures 5-1 and 5-2 were directed to
IMP 9, not IMP 5.) We devised the following procedure to achieve
this. Whenever a raw tagged packet is destined for the discard
fake host at any IMP, it is not discarded; rather it is
forwarded to TENEX without any further tagging. (A "raw" packet
is a datagram, a special kind of data packet which is not subject
to any end-end flow control or sequencing. The "discard fake
host" in each IMP is a special destination which ordinarily
- 57

Report No. 4088 Bolt Beranek and Newman Inc.
serves as an infinite data sink, discarding all packets it
1 receives.)
it is worth pointing out that although the tagged packet
- mechanism is quite simple in concept, it turned out t, be
surprisingly difficult to mplement correctly. It is one of
those things that is easy to design into a network initially, but
difficult to graft into an existing network. One source of
'k difficulties is that the iMP really does not expect the contents
of a packet's d2ta field to change, and a good deal of special
care must be given if this is not the case (as with the tagged
packets). Another source of difficulties is that there are many
special causes to consider. For example, The number of nodes
traversed by the packet may be greater than the number of data
words in the packet (in which case the packet is too small to
contain all the tags), or a packet may first be queued for a
line, then re-routed to another because the first line goes down.tj•
Nevertheless, once all these difficulties were discovered and
eliminated, the tagged packet provided a very simple and
straightforward means of evaluating the new routing scheme's
performance under a variety of conditions.
In order to use the tagged packet, we had to have a way of
generating variable amounts of tagged traffic. To do this, we
used the IMPs' message generator. Message generator is a fake
host in each IMP. It is capable of transmitting one packet every
-58 -
N•0

Report No. 4088 Bolt Beranek and Newman Inc.
n "fast ticks", where n is a power of two and a fast tick is a
period of 25.6 ms. The size of the generated packets, th.! value
of n, the destination of the packets, and the settings of other
bits in the host-IMP leader field are parameters which have to be
set before the message generator is activated. (Among these
other leader bits are the bits which specify whether a packet is
raw or not, as well as whether it is tagged or not.) We did not
find it necessary to make any changes to the message generators
themselves, but we did make some improvements to the NCC's
capability of controlling the message generator. One improvement
was to extend the functionality of the message generator command
so that it would set all the message parameters at an IMP at
once, and another was to set the same parameters at several IMPs
at once. This sort of improvement may not srem very important,
but it must be remembered that our testing sessions were quite
PE •limited in length. Thus it was very important to be able to
start up our experiments quickly, with as small a probability of
i: •making an error as possible. The improved message generator
command contributed greatly to this.
Another simple and straightforward method of measuring the
performance of the new routing scheme is simply to install a set
of counters in the IMP, each of which counts the number of
occurrences of some important event. We esLabllshed the
following ten counters:
- 59 -

i Report No. 4088 Bolt Beranek and Newman Inc.
1) Updates generated - Each IMP keeps a counter of the
number of routing updates it generated. The number of updates
generated by an IMP depends on the changes in delay on the lines
leading from that IMP -- the more frequently there is a
significant change, the more often there are updates generated.
The delay does not usually change frequently by a significant
amount unless there is a great deal of traffic, so the value of
the counter should be roughly proportional to the amount of
traffic through the IMP. Since it is the measurement process
which decides when to send an update, this counter enables us to
make a simple check on its performance.
2) Update packets processed - Each IMP keeps a count of the
number of routing updates it has processed, so we can determine
if the frequency of routing update processing at some IMP is
Ssimilar to what we expect. Also, since all routing updates are
processed at all IMPs, at any given time this counter should have
the same value in all IMPs. If that were not the case, it would
prove that the updating protocol was failing to deliver all the
updates to all the IMPs.
3) Line updates processed - Ever:, update packet from a
particular IMP contains information on all the lines emanating
from that IMP. That is, every update packet contains several
"line updates", a line update 'being the update for a particular
line. The shortest path computation processes the line updates
-60-

Report No. 4088 Bolt Beranek and Newman Inc.
one at a time, so it is the number of line updates rather than
the number of update packets which determines how often the
computation runs. In order to see how often the computation is
run, the number of line updates is counted. This number should
also be the same in all the IMPs.
4) Average length of routing update queue - When routing
update packets arrive at an IMP they are queued for processing.
The average size of this queue is an indication of how much
computational load is placed on the IMP due to the processing of
routing updates. We measure the average queue length with the
following techniques. Whenever a routing update packet arrives,
the number of routing update packets which are already on the
queue (including any packet which is currently being processed)
is counted, and this count is added to a cumulative counter.
When this cumulative counter is divided by the total number of
it •update packets processed, the result is the average number of
update packets behind which a newly arriving update must wait,
i.e., the average queue length.
5) Maximum length of routing update queue- In order to get
some idea of the variance in the length of the routing update
queue, we also keep track of its maximum length.
6) Number of line updates which report changes - The new
I routing scheme sometimes causes updates to be generated even if
-61-

Report No. 4088 Bolt Beranek and Newman Inc.
there is no change in the line-state information. It is
interesting to know what proportion of the line updates actually
report changes. This number should also be a constant from IMP
to IMP.
7) Number of updates which may cause changes in
shortest-path tree - The shortest-path computation that runs in
each node produces a shortest-path tree of the network with that
node as the root. Certain line updates can never cause changes
in a node's shortest-path tree. If the line update reports no
change, or if it reports on a line which is not in the
shortest-path tree ana that line has not improved, then no change
in the tree can result. Each IMP keeps a count of the number of
line updates it processes which raay cause changes in its tree
(which is not the same as the number which actually do cause
changes in the tree). Since each IMP has a different
shortest-path tree, this number is not a constant from IMP to
IMP. Rather, it gives an indication of which IMPs have to
perform the most computational work to react to changes in
network delay.
8) Old updates - The updating protocol has been carefully
designed to ensure that updates which are received out of
sequence are discarded, rather than being processed out of order.
Each IMP maintains a count of the number of update packets
arriving out of sequence.
-62-

:1
Report No. 4088 Bolt Beranek and Newman Inc.
9) Duplicate current updates - Because of the way the
updating is done, it is possible for an IMP to receive duplicate
copies of some update. The number of such duplicates is counted.
10) Retransmissions of routing updates - The updating
protocol employs a positive acknowledgement retransmission
scheme. An update will be retransmitted on a line if the
acknowledgement for the update is not received within a certain
amount of time. The number of retransmissions made on each line
is counted.
11) Received spurious retransmissions - A "spurious"
retransmission is one which was not really necessary. For
example, if an acknowledgement does not get through, the update
being acknowledged will be retransmitted, although it has already
been correctly received. The same thing will happen if the
retransmission time-out period is too short. All update packets
carry a special bit indicating whether or not they are
retransmissions. This enables the IMPs to count the number of
spurious retransmissions they receive. By comparing this number
with the number of retransmissions sent to the IMP, one can
determine what fraction of the retransmissions are spurious.
It is possible to zero out all these counters in all IMPs
from the NCC at the beginning of each test session. At the end
of each test session, the counters are collected into a TENEX
- 63 -

Report No. 4088 Bolt Beranek and Newman Inc.
file, where they are converted to a human-readable form.
Unfortunately it is not possible to take a network-wide snapshot
of the state of the counters at some instant. It takes about
10-15 minutes to collect the counters, and during this interval
the counters keep on counting. This means that in comparing
counters from different IMPs we must remember that the counters
have not all been collected simultaneously. However, this has
not proven to be a real problem in practice. Appendix 1 shows
the values of these counters after one test session.
It is often useful, when testing the new routing scheme, to
be able to look at the shortest-path tree that has been computed
by an IMP. To facilitate this, we developed a program which
looks into a running IMP (or, alternatively, an IMP core dump),
figures out what the tree is, and prints it out in an easily
readable format. Figure 5-3 shows some sample output from this
program. The "father-son" relation is indicated by vertical
spacing, and the "sibling" relation is indicated by a horizontal
line. This program for displaying trees is a very valuable
software tool. Before it was developed, the only way to look at
the tree in some IMP was to stop the IMP, dump it, and then spend
30 minutes crawling through the dump, trying to reconstruct the
tree. (Any tool which saves a person 30 minutes at a shot is
very valuable indeed!)
-64

Report No. 4088 Bolt Beranek and Newman Inc.
3615
11------------------- 16 ---- 4522 ---------------- 56 51 34
52 ------- 48 43 2 21----435- 7 62 64 32 25
3 23 13 33----59 241 53----17 9 12
54 38 28-19-39 40----58-37 47 ------- 5526 8 49-63 46 6 14
5 61 31-44 50 ---- 1830 29-2066
Figure 5-3
We also developed a set of programs enabling all routing
updates, or only those routing updates from a particular IMP, to
& t be collected on TENEX, where they can be processed. This enables
us to directly inspect the outputs created by the de.Lay
measurement process while the new routing scheme is running. We
have also used the IMP's standard trace package to collect data
on the delays of individual packets.
Before proceeding to the next chapter, where the results of
our testing will be summarized, it is worthwhile discussing
briefly some of the possible software tools which we considered
but chose not to develop. For instance, we did not develop any
-65-

Report No. 4088 Bolt. Beranek and Newman Inc.
instrumentation code for timing the new routing scheme. As a
result, we cannot claim to have measured the amount of CPU £
bandwidth devoted to routing. Since the shortest-path
computation is interruptable by many other processes, attempting
to time it would involve a large amount of IMP code which turns
the timers off whenever the code is interrupted, and then back on
when the code resumes. Additional complications arise from the
fact that pieces of the routing code occur at different places in
the IMP, and at different priority levels. Although it would
have been very desirable to have exact timing information about
the new routing scheme, we were dissuaded by the complexity of
the task. Not only would it have required an excessive amount of
programmez time, but it would have caused us to violate the rule
I thsat all measurement tools should be simp~le.
In our first semiannual'report, we described the Snapshot
Measurement Package, a software package which can be loaded into
the IMP and used to evaluate the performance of a routing scheme
under extremely heavy loads. Unfortunately, we have not been
able to use this package recently for the simple reason that it
will not fit into the IMP al)ng with the two routing schemes.
As discussed previously, each IMP counts the number of line
updates which may result in changes to its shortest-path tree.
It would have been more desirable to count the number of updates
which do cause changes, and to measure to magnitude of these
-66-

Report No. 4088 Bolt Beranek and Newman Inc.
changes. Unfortunately, there is no single )oint within the
shortest-path computation at which one can tell whether a change
has been made. During the computation, the shortest-path tree
may be transformed several times, but there is no simple way of
knowing whether any of these transformations will survive to the
end of the computation, or whether they will be transformed
again, possibly back to what they were initially. The only way
to tell whether a routing change has been made in the course of a
particular instance of running the shortest-path computation is
to save a copy of the initial tree, so it can be directly
compared with the tree which exists after the computation is
done. The memory and processing expenses to do this (especially
the former) are too great to make it worthwhile.
As described previously, we have the ability to display the
shortest-path tree in any IMP. This enables us to do some
spot-checking but it does not give us a means of systematically
• Fexamining the way the trees change in response to particular
events. We considered the possibility of implementing an
event-driven routine which would write a representation of the
shortest-path tree into a packet, which could then be transmitted
to our TENEX system. In order to do this, the IMP would have to
run with interrupts inhibited for as long as it takes to copy the
tree. This is clearly undesirable, so we decided not to
implement the feature.
67

Report No. 4088 Bolt Beranek and Newman Inc.
6. TESTING THE NEW ROUTING SCHEME --- RESULTS
In this chapter we present selected results from our testing
of the new routing scheme. It is not our intention here to
discuss all our tests nor to present all our data. Rather, we
present rerults which we believe to typify the performance of the
new routing scheme. For presentation purposes, we divide our
tests into five categories: topological stress tests, resource
utilization tests, updating protocol tests, traffic flow tests,
and packet delay tests. This way of categorizing our tests is
purely a matter of presentation, and does not correspond to any
chronological or operational categorization.
1. Topological stress tests. A routing scheme must be '
to react quickly and correctly to sudden changes in the topology
of the network (a line or a node coming up or going down.) The
routing scheme must not only be able to respond to single
topological changes, but also to multiple simultaneous changes,
including those sets of changes which lead to network partitions.
One way to stress the routing scheme is to induce such
topological changes, both singly and in combination. This puts
stress on all the significant components of the routing scheme.
When a line goes up or down, the measurement process must detect
that immediately, and cause an update to be sent. Determining
whether this actually works is more complicated than it may seem,
since there are many situations that may bring a line down, and
68

Fepor
Report No. 4088 Bolt Beranek and Newman Inc.
the measurement process must detect all of them. When lines go
up and down in rapid succession, a great deal of stress is placed
on the data base management procedures. Applying topological
stress is the best way to detect any incorrect order-dependencies
which exist. Inducing topological stress also tests the
reachability algorithm of the shortest path computation. When
the topology changes, the shortest-path computation must be able
to determine which IMPs are unreachable. Topological changes
also stress the updating protocol. In our second semiannual
report, we discussed the way in which partitions of the network
can cause the IMPs to get out of sync with each other. The
updating protocol was carefully designed to avoid any such
problems, but only by actually partitioning the network could we
determine whether our design really worked. Also, the presence
of topological changes puts greater than normal stress on the
part of the updating protocol which attempts to ensure that no
I updates are processed out of order. Ordinarily, updates from a
I given IMP must be separated by at least 10 seconds (the
measurement period). However, if a line at some IMP goes down or
comes up, two updates from that IMP may be sent with an
arbitrarily small interval between them. This makes it much more
likely that the updates will arrive at some other IMP out of
order, and thus it exercises the part of the updating protocol
that detects out-of-order updates.
-69-

Report No. 4088 Bolt Beranek and Newman Inc.
We caused lines to go up and down using five different
methods:
a) Altering a particular memory location in the IMP. This
causes the line to go down, and then to come back up as
soon as possible (i.e. one minute later).
b) Looping and unlooping lines by command from the NCC. A
line looped in this way stays down until it is unlooped
by another command. 2
c) Looping and unlooping lines by pressing a button on the
modem simulator box. (This could only be done at IMPs
located on BBN's premises, which used modem simulators
rather than real modems and phone lines.)
d) Physically pulling out and inserting cables into a modem
simulator box.
e) Physically pulling out cables and re-connecting the,.. in
a different configuration. Thus not only does a line go
down, but when it comes back up, the IMPs it is
connected to have different neighbors over that line
than they did before.
To induce IMPs to go up and down, we sometimes restarted them by
command from the NCC (which causes the IMP to go down and then
come back up within several minutes), and we sometimes halted
-70!i *4
Report No. 4088 Bolt Beranek and Newman Inc.
them manually by means of the console switches. We have induced
partitions by various combinations of these procedures; and have
experimented with partitions of various sizes and durations. In
addition, during many of our field tests, lines and/or IMPs went
up or down due to "natural causes", providing further unplanned
topological stress tests.
These tests turned up both program bugs (mostly in the data
base management procedure) and design bugs. It is interesting to
note that we were not able to detect all these bugs by testing in
the lab. We found additional bugs when we tested in the ARPANET,
with all IMPs but one in state II, and a single IMP in state III.
We found more bugs yet when we tested the whole network in state
III. After these correctic's, it appears that the new routing
scheme does respond correctly and quickly to topological changes.
Such changes do cause immediate transmission of routing updates.
These updates are processed correctly, and the correct changes
are made in the shortest-path tree. Nodes are considered
unreachable by the new routing scheme when, and only when, they
really are unreachable. The network recovers correctly from
partitions, without loss of update synchronization. When a lot
of traffic is being routed over a line which goes down, the
traffic is re-routed without creating a network disturbance.
When a line comes up, immediate use is made of it, whenever
possible. Since we have put the new routing scheme through a
- 71 -
Report No. 4088 Bolt Beranek and Newman Inc.
large variety of topological stress tests, we are confident of
its ability to withstand the topological stresses that are placed
on it under operational conditions.
2. Resource utilization. Several of the counters described
in the previous chapter have enabled us to draw conclusions about
the utilization of resources by the new routing scheme. These
are reported on in this section. All measurements reported here
were taken while the network was running in state V.
a) Length of routing queue. When measured over a period of
about an hour, most IMPs show a maximum routing queue
length of 2. That is, at most IMPs, there was at least
one routing update which arrived during the hour thst
had to wait on the queue while two other routing updates
were processed first. Many IMPs show a maximum queue
length of 3. Once in a rare while, a maximum queue
AK- length of 5 is detected, and maximum queue lengths of 1
are not uncommon. The average queue length, on the
other hand, has never been observed to be qbove 0.05 in
any IMP, regardless of its maximum queue length.
Typical values of the average queue length are 0.02 and
0.03. This means that almost all routing updates are
processed as soon as they are received; it is very rare
for a routing update to have to be queued.
-72-
WI ....

C- -~ ____________-___-_j-__ ____ _ _ -- -
Report No. 4088 Bolt Beranek and Newman Inc.
b) Total number of updates generated. The number of
updates generated at particular IMP varies greatly.
Lightly loaded IMPs generate updates at close to the
minimum frequency (once every 50 seconds), and heavily
loaded IMPs at close to the maximum frequency (once
every 10 seconds). Several one-hour measurements taken
during our testing periods have shown the total number
of update packets processed by each IMP to be about
5000, or about 1.4 up•ate packets per second. If we
assume that every update packet contains 2.5 line
updates (actually the average update packet seems to
contain about 2.2 - 2.4 line updates) then the total
line bandwidth due to routing updates (assuming that no
updates are retr3nsmitted, and that all updates flow on
all lines) is 246 bits per second. This is 0.5% of a 50
kbps .ine, and 2.6% of a 9600 bps line. This compares
favorably with the 3 ' 15% used by the old routing
scheme.
c) Fraction of the updates which report changes. Since
routing updates are always sent at least at some minimum
frequency, even if there is no change in delay, not all
line updates report changes. The fraction of line
updates which do report changes has been observed to
vary from as little as U.26 to as much as 0.56, with
- 73 -

Report No. 4088 Bolt Beranek and Newman Inc.
0.45 a more typical value. The fraction of line updates
which may cause changes in some IMP's shortest-path tree
varies greatly from IMP to IMP, but is typically about
one-third. (That is, if 45% of the line upoates report
changes, about one third of these, or 15%, may cause
changes in the shortest-path tree of an average IMP.)
These figures indicate that the amounts of processor and
line bandwidth taken by the new routing scheme are quite modest,
well within our expectations, and present no problem. It must be
pointed out, however, that our testing periods are generally
during early morning hours, when the network is quite ligvtly
loaded.
3. Updating Protocol. The average number of
retransmissions of routing updates per line varies considerably,
depending on network conditions. During a fairly typical
one-hour measurement, we found the average number of
retransmissions per line to be 66 (with a standard deviation of
,118). Since there were about 5000 update packets sent on each
line during that period, the average increase in line bandwidth
due to retransmissions is about 1.3%. However, the peak increase
due to retransmissions approaches 15%.
Almost all of these retransmissions have been unnecessary.
That is, in most cases, the number of retransmissions madp on
- 74 -

Report No. 4088 Bolt Beranek and Newman Inc.
lines leading to a given IMP is exactly the same as the number of
spurious retransmissions received by that IMP. We have, however,
observed small numbers of IMPs (about 5) receiving small numbers
(fewer than five) of non-spurious retransmissions. It must be
pointed out, however, that our measurements have been made during
Searly morning test periods when the network was quiet.
Significantly different results may be obtained when measurements
are done during network busy hours.
Only a tiny number of routing updates have ever been
observed to arrive out-of-sequence.. In one one-hour measurement,
a single IMP received 17 out-of-sequence updates. In another,
each of five IMPs received a single out-of-sequence update.
Each IMP also counts the number of updates it receives
J 1which, although they are in proper sequence, have already been
seen (i.e. are duplicates). The updating protocol sends all
updates on all lines, so each IMP necessaril; ,ees each update n4[ times, if it has n lines. So if there are a to,_ of m update
packets, each IMP must see at least m*(n-1) dur-licate updates.
I Any receivec spurious retransmissions are also counted as
duplicates. When the expected duplicates and the spurious
retransmissions are subtracted from the count of duplicates, we
found during a one-hour measurement that each IMP received. an
average of 193 duplicate updates (with standard deviation of
161). When retransmissions and duplicates are taken into
-75-

S-- • <••• • • • • , z• • • •
Report No. 4088 Bolt Beranek and Newman Inc.
account, the average line utilization due to routing updates is
0.53% of a 50 kbps line and 2.7% of a 9600 bps line.
4. Traffic tests. We performed a number of" tests to see
how the new routing scheme reacts to particular offered traffic
loads. One of our goals was to determine how well the new
routing scheme does at routing traffic around congested areas.
Figure 6-1a shows the shortest-path tree at node 30 before one of
3063140
149 ------------------- 95 58 --------- 37 ------------------ 59
60 10 12146 44-18 24 ---------------- 5529 6 25 47
19------.50 426-17 14-20 34
38 28-13 45 ----------- 2153 62 15 2
48 36-16 ---- 11 51-3222 ---- 56 4352 33
35-7 123
Figure 6-la
our experiments. (The network was running in state V at this
time.) Note that node 24 has a rather large subtree, consisting
of 21 nodes. After displaying the tree, we turned on a message
-76-

Report No. 4088 Bolt Beranek and Newman Inc.
generator to send traffic from node 24 to node 25. The generator
was set to its maximum rate. Figure 6-1b shows node 30's tree
-4 306340
49 ---------------------- 95 58 ------------- 37 ------- 59
60 10 12 ---- 3346 44-18 24-55 129 6 25 47 23
19 ------------- 50 726---- 17 14-20 5238 28 ------- 13 3553 62
482211
15 ---- 5636-16-45 43
51 34 324 2
21
Figure 6-lb
after the generator was turned on. Note that the size of node
24's subtree has been reduced to 1. That is, before the
generator was turned on, node 30 was willing to use the line
:" between 24 and 25 to send traffic to any of 21 IMPs; after the
generator was turned on, node 30 was willing to use that line
only for traffic destined for node 25. Figure 6-Ic shows node
30's tree after the generator was turned off. The subtree of
node 24 has now been enlarged to 10 nodes. This shows that the
new routing scheme was able to detect the load placed on the line
between 24 and 25, and react to it properly.
- 77

Report No. 4088 Bolt Beranek and Newman Inc.
306340
9 ---------------- 4959....-.------------- 58 ---- 37 5
12 ------- 33 60 1024-----.55 1 46 18-4425 4723 29 14 6
4 7 19 ----- 5034 52 26-17 20
21 ---- 45 35--22 38 282 15 !1-48 53
51-32 16-36 56 1343 62
Figure 6-Ic
2l We also performed experiments in which we deliberately
SIinduced severe congestion in order to see how the new routing
scheme would react. We prepared a special software patch which,
when placed in an IMP, would cause that IMP to refuse to
acknowledge a specifiable percentage of the packets which arrive
over a particular line. These packets then have to get
retransmitted by the neighbor, causing the delay on that line to
get very large. We placed this patch in IMP 59, causing it to
refuse to acknowledge packets from its neighbor IMP 64. Packets
from other neighbors of 59 were not affected by this patch. We
Si - 78-
Li f

Report No. 4088 Bolt Beranek and Newman Inc.
sent 20 packets per second (each packet being 1192 bits long)
from 64 to 59, in order to induce a high delay on the line
between 64 and 59. Then we sent tagged packets from IMP 43 (a
neighbor of 64) to IMP 9 (a neighbor of' 59). The min-hop path
for such packets is 43-64-59-9. However, because of the
congestion on line 64-69, we would expect at least some of the
packets to travel alternate routes of greater hop length. We
performed six experiments. The results of these experiments are
shown in Appendix 2, along with a map of the ARPANET as it was
when these experiments were done. The reader should refer to
this appendix while reading the discussion below.
a) For our first experiment, we set node 59 to reject (i.e.
to fail to acknowledge) 80% of the traffic arriving on
its line from 64. We sent tagged packets from 43 to 9
at the rate of 10 packets per second, with each packet
containing 1192 bits (including all overhead and
framing). The results shown in Appendix 2a indicate
that all the traffic from 43 to 9 avoided the min-hop
path, travelling over five longer alternate paths.
Close inspection of these five paths shows that there
are really only two disjoint paths used, the other three
being minor variants of the first two. The traffic from
43 divides almost equally over their two paths, with
slightly more traffic using the path which is slightly
-79-
1 1.4

Report No. 4088 Bolt Beranek and Newman Inc.
shorter. This is the best result that can be expected
from a single-path routing scheme.
It is worth noting that this sort of performance would
not be possible witn the old routing scheme. Note that
some packets traveled a 12-hop path, even though a
(badly congested) 3-hop path was available. The old
routing scheme assigns each network line a "delay" which
is between 4 and 12. Thus the highest possible delay on
a 3-hop path would be 36, and the lowest possible delay
on a 12-hop path would be 48. Since 36<48, the old
routing scheme would always use the 3-hop path, no
matter hoew badly congested it was. The new routing
scheme shows much greater adaptability.
b) In our second experiment, whose results can be found in
Appendix 2b, we set node 59 to reject only 67% of the
packets arriving on the line from 64. This causes line
64-59 to have a lower delay than in the first
experiment. We see now that 28% of the traffic from 43
to 9 did use the min-hop path, experiencing a rather
large delay. The other 77% of the traffic traveled over
altern'ate paths. As can be seen from the results, the
amount of traffic on an alternate path is inversely
related to the delay on that path.
!8o
i ii.4----- - . - - -- .- --

~ L
Report No. 4088 Bolt Beranek and Newman Inc.
In comparing experiments a and b, we see that the new
routing scheme has a tendency to gravitate to min-hop
routing unless there is a very strong reason to avoid
it.
It is also worth noting that of 2010 packets collected,
only one looped.
c) Our third experiment was just a repeat of our first,
except that the amount of traffic from 43 to 9 was
doubled to 20 packets per second. Here 2% of the
traffic from 43 traveled the high-delay min-hop path,
and the other 98% split evenly between variants of the
two disjoint alternate paths. What is interesting to
note here is that the number of variants of these paths
has increased from 5 to 7. This illustrates an
interesting property of the new routing scheme. As the
offered traffic load increases, there is a tendency to
look for paths where there is excess bandwidth, and to
try to make use of the excess.
d) Our fourth experiment is a repeat of the second, with
the traffic rate from 43 increased to 20 packets per
second. (Or it may be considered as a repeat of the
third experiment with the pe'rcentage of packets from 64
rejected by 59 decreased from 80% to 67%). The results
- 81 -A

Report No. 4088 Bolt Beranek and Newman Inc.
are similar to those of the second experiment. A
significant proportion of the traffic traveled the
15 min-hop path, and the remainder is divided over variants
W5 of the two disjoint alternate paths. The number of
non-looping variants is only 4, but there are 10 paths
which contain loops. The percentage of looping packets
is less than 1%; these packets were already on their way
across the network when a routing change was made
causing them to backtrack and change paths. In none of
these loops is any node traversed more than twice. This
indicates that the loops are a purely transient
phenomenon occurring during a period of adaptation,
rather than a long-term phenomenon due to some problem
with the routing scheme. However, it must also be noted
that some of these loops contain a large number of hops,
and packets which loop do have a significantly larger
end-end delay than do other packets.
e) Our fifth experiment was a duplicate of the first,
except that we also sent tagged packets from node 56 (a
neighbor of 43) to node 9. Both 43 and 56 sent at a
rate of 10 packets per second. Virtually no traffic
traveled over the min-hop path. Node 43 sent about 60%
of its traffic along the "northerly" alternate path, and
40% along the "southerly" one. Node 56 split its[ •traffic in the opposite proportion.
-82-
N i
S. . . ..

Report No. 4088 Bolt Beranek and Newman Inc.
This last routing pattern is interesting, and deserves some
discussion. One might have expected, a P.iori, that node 56
would have sent all of its traffic on the southerly route, while
43 would have sent all of its traffic on the northerly route.
These are the respective minimum delay routes, and use of these
routes would prevent traffic flows from the two source nodes from
interfering with each other (until they actually reach their
destination). However, this sort of reasoning must be used with
extreme caution. It is true that the traffic from 43 which went
north experienced a smaller delay than the traffic that went
south. But is simply does not follow that it would have been
better had all the traffic from 43 gone north. This is
especially true since we have no way of knowing what other
traffic flows existed in the rest of the network at the time we
Ii did our experiment. It is interesting, though, to compare the
delay from 43 to 9 which we observed in the first experiment with
that which we observed in this experiment. Other things being
equal (which might or might not have been the case), this will
enable us to see how the introduction of the traffic flow from 56
to 9 impacted the delay of the traffic flow from 43 to 9.
In the first experiment, the average delay of packets from
43 to 9 along the northerly path (43-32-2-21-34-4-25-24-12-59-9)
£ was 312.3 ms., or 31.23 ms. per hop. The corresponding delay in
-T the fifth experiment was 333.87 ms. or 33.39 ms. per hop. This
-83-

Report No. 4088 Bolt Beranek and Newman Inc.
is an increase of only 2.2 ms. per hop. In the first
experiment, the average delay from 43 to 9 over all paths was
317.51 ms., or 28.66 ms. per hop. The corresponding delay in the
fifth experiment is 33.12 ms. per hop. This is an increase of
less than 4.5 ms. per hop. The new routing scheme treats the
per-hop delays in quantized units of 6.4 ms.; increases of less
than this value would not be expected to cause a large change in
the routing patterns.
Another interesting fact about the fifth experiment is that
the average delay from 56 to 9 along the southerly path is almost
the same as the average delay from 43 to 9 along the northerly
path. That is, there are a pair of neighbvrs who see
Sapproximately equal delays along a disjoint pair of paths to a
common destination. Under the old routing scheme, this sort of
situation tends to cause the formation of long-lasting ping-pong
loops between the pair of neighbors. Under the new routing
scheme, no such loops are formed, and the only penalty is a small
increase on the average per-hop delay (though it must be admitted
that there is a larger increase in che variance of the per-hop
delay.)
In many of these experiments, paths were used which are
slight variants of the main paths. These variants tend to be
very similar to the main paths, but have a few more hops.
Examining these variants shows an important property of the new
-84- :4

Report No. 4088 Bolt 3eranek and Newman Inc.
routing scheme, namely that it shows a tendency to seek out and
use paths en which there is excess bandwidth, as long as these
paths do not diverge too greatly from the paths of least delay.
Under conditions oi overload, the paths with thq fewest number of
hops fill up quickly, and the new routing scheme has been
observed to try to use all possible paths in order to deliver the
packets to their destination. That is, under overload
conditions, the new routing scheme can attempt to fill the whole
net with traffic. This is appropriate from the perspective of
routing, but it illustrates the need for improved flow control
and congestion ccýntrol techniques to prevent the network from
overloading.
In our second semiannual report we presented sore
mathematical analysis which purported to show that the new
routing scheme would enter an unstabl- state under certain
conditions. When in this state, the traffic in the network would
oscillate wildly from one bad path to another, never settling
down to a good path. This sort of oscillation was predicted to
be especially bad when the network consists of a loo1 topology.
We engaged in an extensive series of tests to determine whether
instability could be a real problem for the new routing scheme as
implemented in the ARPANET. Appendix 3 contains the results of
* some of the experiments which we did in our lab. We set up a
four-node loop network at the lab, and gave it a stub connection
- 85 -
-Wg

Report No. 4088 Bolt Beranek and Newman Inc.
to the ARPANET (so that we could use the ARPANET to collect data
from our lab net) - this network is pictured in Appendix 3. The
experiments are discussed and described below.
a) In our first experiment, we had each of nodes 60, 61,
and 66 send 10 packets per second to node 30, with each
packet being 1192 bits long. Nodes 61 and 66, the
immediate neighbors of 30, each sent 99% of their
traffic to 30 over the single hop path. Node 60 split
its traffic over the two possible paths. If routing
oscillations were present, we would expect that 61 would
send half its traffic via 66, ard 66 would send half its
traffic via 61, but this has not occurred.
It is interesting to note the behavior of the traffic
from node 60. Rather than splitting 50-50 over the two
possible paths, it splits 60-40. Furthermore, the delay
on the path via 66 is only half the delay on the path
via 61. Our explanation for this is as follows. In
node 30's internal numbering scheme, the line to node 66
is line 2, and the line to node 61 is line 3. If
packets arrive simultaneously on both lines, the packet
from the line with the smallest number is processed
first. Therefore, if both lines are heavily utilized, a
greater delay is seen on the line from 61 to 30 than on
the line from 66 to 30. This sort of "unfairness" was
observed very frequently in our lab tests.
86

Report No. 4088 Bolt Beranek and Newman Inc.
b) Our second experiment was a repeat of the first, except
that we doubled the rate at which packets were
transmitted. We see that although the delays are much
higher than in the first experiment, there is little
change in the traffic patteris. The only difference is
a slightly greater tendency for packets to enter 30 via
"66. The routing does not show oscillation or
instability.
The mathematical work presented in our second semiannual
report suggested that, if oscillations did occur, they
could be dampened by the use of a bias. A bias is a
value which is added to the actual delay on a line
before the shortest-path computation is done. Our
experiments have all been done without the use of any
explicit bias. However, it must also be pointed out
that the new routing scheme will never report a delay of
0 on any line. (If it did, long-term routing loops
might form.) The smallest reportable delay is 1 unit,
or 6.4 ms. It is worth noting that when we repeated our
experiments with a unit of 0.8 ms., we obtained the same
results.
c) In our third experiment, we sent 10 packets per second
from 60 and 66 to 30, but no traffic from 61. The
packets were 1192 bits long. Again, no instability is
-87-

Report No. 4088 Bolt Beranek and Newman Inc.
noted. Node 66 sent all its traffic on the one-hop
path, while node 60 split its traffic almost evenly,
with slightly more traffic traveling on the path with
slightly less delay.
d) Our fourth experiment duplicated the third, but with
double the amount ot traffic. The delays are much
longer, but there is no significant change in the
traffic pattern.
e) For our fifth experiment, we added another line, between
61 and 66, to our lab network in order to introduce a
more complex topology. Each of nodes 60, 61, and 66
sent 10 packets per second to node 30. Comparing the
results of the experiment with those of our first
experiment, we see that although the delay from node 60
is slightly better, the delay from nodes 60 and 61 is
significantly worse. Node 66 sent 15% of its traffic
over the cross-link, while node 61 sent 13% of its
traffic over the cross-link, even though the delay of
the traffic which used the cross-link was much worse
than the delay of the traffic that did not. This seems
to be due to the attempt of node 61 to take advantage of
the fact that the delay on the line 66-30 is less than
the delay on the line 61-30. That is, it makes sense
for 61 to send some proportion of its traffic on the
S- 88

iHReport No. 4088, Bolt Beranek and Newmanr Incý.
two-hop path (61-66-30), and that is the sort of
"performance that would be expected of a multi-path
routing scheme. However, in a single-path routing
scheme, there is no way to control the exact proportion
of traffic which uses the two-hop path. As a result,
"too much" traffic is sent over the two-hop path,
causing the delay on that path to get too high; at the
same time, the delay on the one-hop path gets too low.
When this happens, 61 switches back to using the one-hop
path; which is correct. However, the routing scheme
seems to overcompensate by causing some of the traffic
from 66 to go on the two-hop path via 61. It is
interesting that while the delay on the path 66-61-30 is
twice the delay on the path 61-66-30, the latter path
causes twice the traffic of the former path. This
indicates that the more sub-optimal a path is, the• V sooner it is removed.
S3j ] Appendix 4 shows the results of an experiment done in the
real network to test the stability of the routing it. a
topological loop under conditions of overload. We sent traffic
ii from nodes 13, 53, 38, 26, and 17 to node 19. We removed the
line between nodes 13 and 62 so that this traffic could not get
to 19 by heading west, out of the loop. Nodes 26, 38, and 17
sent 10 packets per second, while nodes 13 and 53 sent 20 packets
89

f Report No. 4088 Bolt Beranek and Newman Inc.
4 per second. All packets were 1192 bits long. This amounts to
, 83.4 Kilobits per second of traffic. Since this is too much
traffic to be sent to TENEX, we were not able to collect tagged
packets from all five sources at the same time; rather, we
collected tagged packets from two sources at a time. Therefore,
I we should not attempt to compare the absolute numbers of packets
sent from each source but only the percentages.
It is easy to see that there is no way this 83.4 kbps can be
delivered to node 19 without overloading the neighboring IMPs.
Node 19 can receive traffic over two 50 kbps lines. However, if
53, 38, and 26 all sent their traffic into 19 over the same line,
there is 48 Kilobits per second on a single line, not counting
any user traffic, or retransmissions on that line. This is more
traffic than can be handled. (This is especially true since the
line from 26 to 19 is 19's line number 3, i.e., it is the least
favored of 19's three modems.) But any other routing pattern
results in more than 50 kbps of traffic on a 50 kbps line.
The results are quite interesting. Node 17 sent almost 100%
of its traffic to 19 on the one-hop path (99.88%, to be exact).
Node 26, the other neighbor of 19, sent only 94% of its traffic
on the one-hop path, and 6% going around the loop the long way.
The next neighbors, 38 and 13, each split their traffic in about
an 80/20 ratio, with the majority of the traffic taking the
min-hop route. Node 53 split its traffic in a 68/32 ratio, with
ii - 90 -I .... . . .. _

Report No-. 4088 Bolt Beranek and Newman Inc.
the majority taking the more lightly loaded path, which was also
the path with less delay. The most interesting result of this
experiment is the fact that the routing was such as to equalize
Sthe average amount of our test traffic on the lines leading
towards 19. The line from 26 to 19 carried 41.4 kbps of traffic,
while the line from 17 to 19 carried 42.4 kbps. The line from 38
to 26 carried 33.1 kbps of traffic, while the line from 13 to 17
carried 33.6 kbps of traffic. Thus it appears that under heavy
load, the new routing scheme tends to equalize the average line
loading over the long term.
Appendix 5 contains the results of two experiments designed
to show how the routing behaves under more moderate loadings.
These are described below.
J_ a) In this experiment, nodes 38, 26, 13, and 17 were each
L set to send 19.5 kbps of traffic to node 19. This
results in a flow of 78 kbps to node 19, which is quite
, a high load for the ARPANET. Nevertheless, all traffic
traveled in the min-hop routes.
b) In the second experiment, each of nodes 45, 34, 21, 16,I 51, and 2 sent about 2500 bits per second to node 15.
All traffic was min-hop, except for that from 21, which
split about evenly between the 3-hop path and the 4-hop
path. It is interesting that the 4-hop path from 21
- -91-

Report No. 4088 Bolt Beranek and Newman Inc.
contains a 230.4 kbps line, the line from 16 to 15.
This experiment shows that the new routing scheme is
able to take advantage of lines of differing speeds. It
also shows that routing tends to be min-hop under light
loads.
The results of these traffic tests can be summarized as
j follows:
i) The new routing scheme is capable of detecting
congestion, ana will route traffic around congested
areas.
ii) Routing loops only occur as transients, and packets
never travel any node more than twice. However, the
actual size of the loop can be many hops, resulting in a
long delay for packets whioh do loop.
iii) Traffic tends to be routed rain-hop in the absence of any
special circumstances.
iv) Under heavy load, the new routing scheme does not give
optimal routing (which would be impossible for any
single-path algorithm). However, it does not oscillate
wildly between bad routing patterns.
5. Characteristics of individual packet delays. In our
first semiannual report, we presented data showing that the
-92-
LE

aReport No. 4088 Bolt Beranek and Newman Inc.
delays of individual packets traversing a line are much more
* variable than would be expected. In particular, even when enough
traffic is placed over the line to saturate it, many packets
still show very low delays. We could not explain why the delays
were so variable, but we speculated that much of the variability
might be due to various side-effects of the old routing scheme.
Now that we have the ability to turn the old routing off, we have
gathered some more data on packet delays to see if turning off
the old routing causes any major change in the characteristics of
the packet delays. It does not. Figures 6-2 and 6-3 plot packet
delay vs. time on the line between IMPs 12 and 24, and between 24
Sand 25, respectively. These plots were obtained by sampling
every tenth packet through the IMP. In each plot, we first
sampled only the ordinary user traffic for several minutes, then
H turned on a message generator to saturate the line, then turned
it off again after about 10 minutes. (Full details of the
experimental technique can be found in the first semiannual
{ report.) Even though the old routing was turned off during these
experiments, the extreme variability in delay remains. We still
L!• do not kncw whether this variability can be explained by queueing
theory, or whether it is due to some sub-optimality in the IMP
V protocols or software. We are currently investigating this
phenomenon by simulation, and will continue to look for the
correct explanation.
i11 ~93
lk-

Report No. 4088 Bolt Beranek and Newman Inc.
00
Ln
LU
(M~
0, U, .. ., . :C\I
in
f I.
VI.
3OW NI HiBO
U - 94 -

'Lilhe-port No. 4088 Bolt Beran'--k and Newman Inc.
in
In
Ur)
N N
CM
A in
I -qA
M MM
1-4 ..) to U
.SW NI* **.4*3.
*~.d~W% **~~.* .*J . .95~'

Report No. 4088 Bolt Beranek and Newman- Inc-.
To summarize, the new routing scheme seems to be working
about as expected. While it does not result in optimal routing,
it does perform well, and is successful in eliminating maiy of
I the problems associated with the old routing scheme. We have not
encountered any unforeseen problems with the new routing -- its
overhead is low, it results in good routing patterns, and it does
not suffer from undesirable feedback effects. We are now ready
to operate the network with the new routing scheme, removing the
old routing for good.
Sjo
I
-96-
Ni]

Report No. 4088 Bolt Beranek and Newman Inc.
7. BUFFER MANAGEMENT IN THE HONEYWELL 316/516 IMP
7.1 Introduction
Many congestion control schemes work by dividing the buffer
pool into several smaller pools, and associating each of these
pools with a particular function. By setting a lower limit on
the size of a pool, one can ensure that there are always a
certain minimum number of buffers available to serve the
associated function. By setting an upper limit on the size of a
pool, one can ensure that no more than a certain maximum number
of buffers are devoted to the associated function. The way in
which these maximum and minimum values are chosen determines the
relative priority of the various functions. That is, if several
functions are competing for a lim:.ted number of buffers, the
competition is arbitrated by the maximum and minimum sizes of the
H •various pools. As a prelude to considering congestion control
• Ischemes for the ARPANET, we have investigated the current buffer
management scheme. The purpose of this chapter is to describe
that scheme.
The IMP maintains four buffer counters, each of which
specifies the number of buffers currently dedicated to specific
functions. The counters are:
1) Free- the free count is just the number of free
Ii (unused) buffers.
-. 97-

Report No. 4088 Bolt Beranek and Nawman Inc.
2) Store-and-forward - this counts the number of buffers in
use by the modem-out process, which includes:
a) Buffers which are queued for transmission on aninter-IMP trunk.
b) Buffers awaiting acknowledgement over an inter-IMP
trunk.
c) Buffers currently in transmission on an inter-IMPtrunk.
d) Buffers which were formerly queued for transmissionon an inter-IMP trunk which went down.
It is, however, possible for a buffer to be in one of
the above categories witiout being counted as
store-and-forward. This shall be discussed later.
3) Allocated -- This counts the number of buffers which
have been pre-allocated by the source-destination
protocol. An allocated buffer also counts as free until
the packet for which it was allocated arriies.
4. 4) Reassembly -- This counts the number of buffers
correctly in use by all other functions.
It is also possible for buffers to be uncounted. There "s a
period of time after a buffer is no longer free, but before the
IMP has decided lwat to do with it.
This is illustrated in Figure 7-1. When a packet arrives
from a neighboring IMP, the "modem in" process gets a free buffer
-98-

Report No. 4088 Bolt Beranek and Newman Inc.
REEEHost
FREModem UN- T ES Host"R"• ~COUNTE'''r' SEM&L Y Ok. .t
i ,
Modem STORE-FORWARD Modem FRE
out out
BUFFER MANAGEMENT IN THE 316/516 IMP
Figure 7-1
- 99 -

I Report No. 4088 Bolt Beranek and Newman I-nc-.
for it, and places the buffer on the queue for the TASK process.
The buffer is uncounted until TASK looks at it and determines how
it should be counted. However, not all buffers on the TASK queueare uncounted. When packets are queued for transmission on a
line which then goes down, these packets are replaced on the TASK
queue for forwarding over a live line. These packets are always
counted as store-and-forward even while they are on the TASK
queue. Buffers which contain input from a real ot iie host, or
SI which contain end-end control packets, are placed on the TASK
queue so TASK can decide how to forward them to their
destinations. These packets are counted in reassembly while they
are on the TASK rueue.
A packet which is removed from the head of the TASK queue
must either be sent to a neighboring IMP, or not. In the former
case, it must be counted as store-and-forward; in the latter case
as reassembly. However, there is a maximum value above which
TASK is not allowed to increase these counters. If TASK cannot
process a packet without increasing some counter above the
maximum, TASK will refuse the packet. In the case of a packet
j which has arrived from a neighboring IMP (i.e., an uncounted
packet), the packet will be dropped without acknowledgement,
L Jcausing the neighboring IMP to send it again later. When other
j! types of packets are refused, they are held in the IMP and
resubmitted to TASK later.
-100-
i i _ _ _ _ w ~ m ~ m mmm mmmmm mm

Report No. 4088 Bolt Ber'inek and-Nýewman In-c.
7.2 Description of Buffer Counters
7.2.1 Allocated
Buffers which are allocated by the source-destination
protocol are counted Ls follows. When the allocate request is
granted, the allocate count is increased by 1 or by 8, as
appropriate. However, the allocated buffers still count as free,
not as reassembly (and they remain on the fret queue.) When the
first packet of the allocated message arrives, the allocate count
is decreased by 1 or 8, and the reassembly count correspondingly
increased. However, the free count is only decremented as each
individual buffer is removed from the free queue, as each
individual packet of the allocated message arrives.
7.2.2 Store and Forward
Let m be the number of modems (i.e. inter-IMP trunks) at a
-i particular IMP. Then the most buffers which can be in use by
FI modem-out at any one time (call it SFMAX) is 6 + 2m, if there is
no 16-channel satellite line. if there is a 16-channel line,
SFMAX is 13 + 2"(m+I). (The assumption is that a 16-channel line
is entitled to 8 extra buffers for output and one extra buffer
for input.)
There is also a minimum number of buffers which must be
available for use by modem-out. That is, this number of buffers
1
- 101 -

Report No. 4088 Bolt Beranek and Newman Inc-.
(call it SFMIN) cannot, under any circumstances, be counted as
•! reassembly or allocated. SFMIN is usually 3m, but there is one
exception. Let B be the total number of buffers in the IMP. If
(B-SFMIN) mod 8 = 0, then SFMIN is set to 3m-1. The reason for
this will become apparent later. Note also that with both SFMIN
and SFMAX, m is never taken as less than 2, even if the IMP is
actually a stub.
The actual mechanism for adjusting the store-and-forward
count is controlled by two parameters in the IMP known as MAXS
and MINF. MAXS = SFMAX - m. MINF is set to a constant 3. When
TASK processes a packet, and determines that the packet needs to
go out a particular modem, it checks to see whether any oiher
packets are either queued for, in transmission on, or awaiting
acks on that modem. If not, then the packet is queued for the
modem, and no adjustments are made to the store-and-forward
count. This ensures that at least one packet can always be
transmitted on each line, no matter how many packets are being
transmitted on the other lines. (Failure to guarantee this can
lead to direct store-and-forward lockup.) However, this means
that one buffer per line is uncounted. If at least one other
packet is either queued for or awaiting acks on that modem, then
the following two checks are made:
a) Is the difference between the free count and the
allocate count greater than MINF? (i.e are there MINF
free buffers which have not been allocated?)
-102-

Report No. 4088 Bolt Beranek and Newman Inc.
b) Is the store-and-forw'ard count less then MAXS?
If both these questions are answered affirmatively, then the
packet can be queued for the modem (if certain other checks are
passed, such as availability of a logical channel.) If it is
queued for the modem, then the store-and-forward count is
incremented by one.
When a packet is acked, its buffer is freed, and the
store-and-forward count is decremented by one. There is one
exception. If the time comes to free a buffer, and at that time
there are no other buffers queued for that modem or awaiting
acknowledgement over that modem, then the store-and-forward count
is not decremented. This special case is necessary since one
buffer on each line is uncounted.
If a line goes down, so that all the packets transmitted on
it or queued for it have to be re-routed, the store-and-forward
count is incremented by one. This ensures that each re-routed
buffer is counted as store-and-forward, even if it was previously
uncounted.
In summary, the purpose of these mechanisms is to ensure
that:
a) A certain minimum number of buffers are always available
for modem-out.
- 103 -

Report No. 4088 Bolt Beranek and Newman Inc.
§ b1) A certain minimum number of buffers are never available
for modem-out, so that modem-out cannot lock out other
processes.
c) It is always possible to have at least one packet in
flight on each inter-IMP line, regardless of the IMP's
buffer utilization condition. This prevents direct
store-and-forward lockups.
7.2.3 Reassembly
p The reassembly count is controlled by the parameter MAXR.
At initialization time, MAXR is set to B - SFMIN. Note that MAXR
cannot be a multiple of 8, because of the way SFMIN is computed.
Any process requesting a buffer which would have to be counted as
reassembly must specify a parameter p. The following two checks
must be made.
a) Is the sum of the allocate count and the reassembly
count less than the difference between MAXR and p?
b) Is the difference between the free count and the
allocate count less than the sum of MINF and p?
Only if these two questions are answered affirmatively can a
reassembly buffer (or an allocate buffer) be obtained. When the
two questions can be answered affirmatively, that means that the
number of free buffers is at least MINF+p, and that at least p of
those can still be taken for reassembly, if that should prove
necessary.
- 104

Report No. 4088 Bolt Beranek and Newman Inc.
The value of p that is used by a particular process when
trying to get a buffer establishes that process's priority in
obtaining buffers (i.e., a process which uses p=O can get the
last buffer, subject of course to the MAXR check). The processes
which need reassembly buffers, and the values of p they u-?: are
as follows:
1) Creating control packets: p=O
A process which needs to send an end-to-end control
packet is allowed to take the last reassembly buffer.
2) Ordinary host input: p=2
The IMP will not accept a packet from a host unless two
free buffers remain in the reassembly pool.
3) Unallocated single packet messages, including raw
packets: p=2
The IMP will not accept unallocated single packet
messages for host output unless two free buffers remain
in the reassembly pool.
14) Allocated single packet messages: p=1
The IMP will not pre-allocate a buffer for a single
packet message unless one free buffer remains in the
reassembly pool.
5) Allocated multi-packet messages: p:9
The IMP will not pre-allocate a buffer for a
multi-packet message unless there are enough free
buffers available for the reassembly pool to hold all
105

Report No. 4088 Bolt Beranek and Newman Inc*.
eight packets of the message, plus an additional free
buffer.
6) Packets to be sent to the teletype in the NCC: p=8
When a packet has a checksum error, it will be sent to a
special diagnostic teletype in the NCC, as long as there
are still eight free buffers in the reassembly pool.
7) Packet core message received from a dead IMP: p=2
"Packet core" is the name of a special protocol used for
communication between the NCC and an IMP which is in its
loader/dumper.
8) Packet core message to be sent to a dead IMP: p=O
7.2.4 Uncounted
Ordinarily, the receipt of a packet on one of the IMP's
lines causes a buffer to go from "free" to "uncounted". There
is, however, one exception. When a packet is received, it is
ordinarily placed on the TASK queue. However, before this is
done, the IMP tries to get a free buffer to use for receiving the
next packet. If there are no free buffers, then the buffer will
not be placed on the TASK queue. Rather, it will be retained for
the next input. The effect of this is to discard the packet
without acknowledgement, causing the neighboring IMP to
retransmit it at a later time.
- 106 -
II

Report No. 4088 Bolt Beranele and Newman Inc.
7.3 Possible Improvements
Whenever a packet is received from a neighboring IMP, any
acknowledgements which have been piggy-backed in that packet
should always be processed, since processing of the
acknowledgements may enable the IMP to free some of its
store-and-forward buffers. However, when a pzcket arrives, and
takes the last free buffer, the packet is discarded, and its
piggybacked acknowledgements are not looked a'.. This may cause
buffers to remain occupied when they could be freed. That is,
the time when it is most important to free buffers az soon as
possible is the time when buffers are least likely to be freed.
There does not seem to be any reason not to process the
acknowledgements, and failure to do so degrades the IMP's
performance unnecessarily. Furthermore, it is not clear that the
packet should be discarded at all, even after its
acknowledgements are processed. Presumably, the reason for
discarding the packet is so that its buffer can be re-used to
receive the next input, which otherwise would be lost due to lack
of buffers. However, there seems to be little point to throwing
away one input so that the next can be received.
When TASK checks the buffer counts to see whether it is
permissible to "move" a buffer into store-and-forward or
reassembly, it does not check to see how the buffer is currently
j counted. Rather, it assumes, falsely, that all buffers in the
-107-

Report No. 4088 Bolt Beranek ard Newman Inc.
TASK queue are uncounted. This leads. to two sorts of problems.
Recall that TASK will almost always refuse a buffer if there are
not 3 free buffers in the IMP. The apparent assumption is that a
refused buffer will be freed, bringing the free buffer pool
closer to its minimum acceptable value. This assumption is true
in the case of uncounted buffers, which will be freed if they are
refused by TASK, but it is not true in the case of buffers which
are already counted in store-and-forward or reassembly. These
buffers will not be freed if refused. Rather, they will simply
be held and resubmitted to TASK later. Refusing such buffers
therefore actually delays their being freed, which is exactly the
opposite of what is intended.
A related problem arises if the store-and-forward count has
already reached its maximum value. Then TASK will refuse all
buffers which have to be forwarded to a neighboring IMP (except
in the special case where no packet is queued for or in flight to
that IMP.) TASK will refuse a buffer for this reason, even if
the buffer is already counted in store-and-forward. Again, this
is a counter-productive strategy. Accepting a buffer which is
already counted in store-and-forward cannot possibly increase the
store-and-forward count, so there is no reason to refuse it.
Since buffers on the TASK queue which are already in
store-and-forward are only those buffers which had to be
re-routed due to a line failure, this problem causes the network
to be slower to respond to a line failure than is necessary.
S1o8
-108

Report No. 4088 Bolt Beranek and Newman Inc.
APPENDIX 1 -- SAMPLE TEST OUTPUT
In chapter 5 we discussed certain measurements which were
Smade by keeping counters in the IMP. This appendix contains some
sample computer output generated after collecting these counters.
These measurements were made while the network was running in
state V (see chapter 5), and they cover a period of slightly more
than one hour. The meaning of each measurement is discussed in
chapter 4. The interpretation of the text labels is as follows:
DUPL CURR UPDATES -- number of routing update messages
received which, although current, are duplicates of
previously received ones.
RCVD SPURIOUS RTS -- number of spurious retransmissions
received.
UPDATES GENERATED -- number of routing update messages
generated by this source IMP.
RETRANS n -- number of retransmissions of routing update
messages from this IMP to IMP n.
I DELAY CHANGES-- number of line updates which report changes
f - in delay.
POSS. TREE CHANGES -- number of line updates which may cause
changes in this IMP's shortest-path tree.
LINE UPDATES -- total number of line updates received.
- UPDATE PACKETS -- total number of update packets processed.
-109-

Report No. 4088 Bolt Beranek and Newman Inc.
AVERAGE QUEUE -- average length of routing update queue whennew update arrives.
MAX QUEUE -- maximum length of routing update queue.
FRACTION OF DELAY CHANGES -- number of delay changes divided
by number of line updates.
FRACTION POSS. CHANGES IN TREE -- number of line updates
which may cause changes in tree divided by total number of
line updates.
LINES PER PACKET -- number of line updates divided by number
of update packets.
The output is ordered by IMP in decreasing order of
distance from the NCC.
36. HAWAII
DUPL CURR UPDATES 34757RCVD SPURIOUS RTS 33664UPDATES GENERATED 137RETRANS 15 963DELAY CHANGES 5235POSS. TREE CHANGES 2013LINE UPDATES 11479UPDATE'PACKETS 4975AVERAGE QUEUE 0.03457286MAX QUEUE 2FRACTION OF DELAY CHANGES 0.456050172FRACTION POSS. CHANGES IN TREE = 0.175363704LINES PER PACKET 2.307336568
-110-

Report No. 4088 Bolt Beranek and Newman Inc.
15. AMES15
DUPL CURR UPDATES 49980RCVD SPURIOUS RTS 1033UPDATES GENERATED 118RETRANS 16 21RETRANS 45 29RETRANS 36 33913RETRANS 11 9DELAY CHANGES 5240POSS. TREE CHANGES 1940LINE UPDATES 11503UPDATE PACKETS 4986AVERAGE QUEUE 0.01965503MAX QUEUE 2FRA2TION OF DELAY CHANGES 0.455335408FRACTION POSS. CHANGES IN TREE 0.168578378LINES PER PACKET 2.308062553
45. MOFFETT
DUPL CURR UPDATES 5129RCVD SPURIOUS RTS 40
SUPDATES GENERATED 94RETRANS 15 7RETRANS 34 6DELAY CHANGES 5245
LPOSS. TREE CHANGES 1949LINE UPDATES 11517UPDATE PACKETS 4992
I AVERAGE QUEUE 0.02944711MAX QUEUE 2FRACTION OF DELAY CHANGES = 0.455413728FRACTION POSS. CHANGES IN TREE 0.169228091LINES PER PACKET 2.307091236
SI
g I
L9
I [!
- 111 -

Report No. 4088 Bolt Beranek and Newman Inc.
34. LBL
DUPL CURR UPDATES 10302RCVD SPURIOUS RTS 129UPDATES GENERATED 98RETRANS 21 17RETRANS 4 51RETRANS 45 11DELAY CHANGES 5257POSS. TREE CHANGES 1911LINE UPDATES 11574UPDATE PACKETS 5016AVERAGE QUEUE 0.03189792MAX QUEUE 2FRACTION OF DELAY CHANGES 0.454207703FRACTION POSS. CHANGES IN TREE = 0.165111452LINES PER PACKET = 2.307416200
21. LLL
DUPL CURR UPDATES 5180RCVD SPURIOUS RTS 44UPDATES GENERATED 94RETRANS 2 9RETRANS 34 13DELAY CHANGES 5268POSS. TREE CHANGES 1836LINE UPDATES 11608UPDATE PACKETS 5031AVERAGE QUEUE 0,02663486MAX QUEUE 2FRACTION OF DELAY CHANGES 0.453824937FRACTION POSS. CHANGES IN TREE 0.158166781LINES PER PACKET 2.307294726
I
-12
i1_
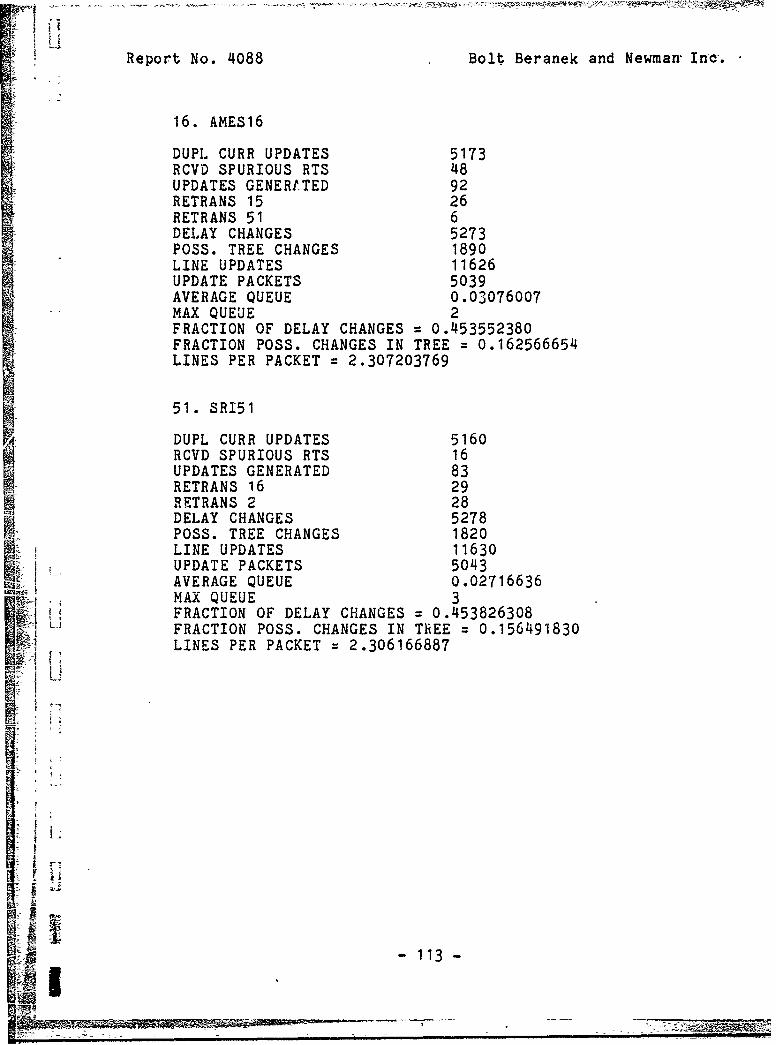
SIs
Report No. 4088 Bolt Beranek and Newman Inc.
16. AMES16
DUPL CURR UPDATES 5173RCVD SPURIOUS RTS 48UPDATES GENERLTED 92RETRANS 15 26RETRANS 51 6DELAY CHANGES 5273POSS. TREE CHANGES 1890LINE UPDATES 11626UPDATE PACKETS 5039AVERAGE QUEUE 0.03076007MAX QUEUE 2FRACTION OF DELAY CHANGES 0.453552380FRACTION POSS. CHANGES IN TREE = 0.162566654LINES PER PACKET = 2.307203769
51. SR151DUPL CURR UPDATES 5160
RCVD SPURIOUS RTS 16UPDATES GENERATED 83RETRANS 16 29RETRANS 2 28DELAY CHANGES 5278POSS. TREE CHANGES 1820
. LINE UPDATES 11630UPDATE PACKETS 5043AVERAGE QUEUE 0.02716636
, MAX QUEUE 3FRACTION OF DELAY CHANGES 0.453826308FRACTION POSS. CHANGES IN TREE 0.156491830LINES PER PACKET 2.306166887
|I-
i - 113 -
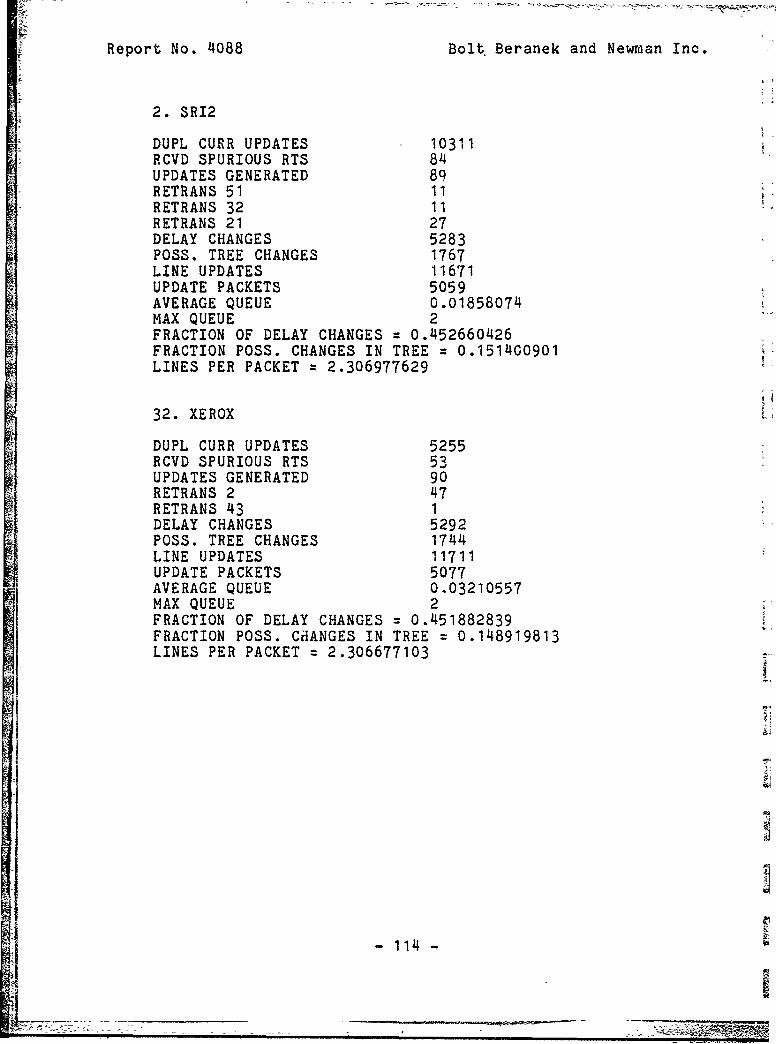
Report No. 4088 Bolt. Beranek and Newman Inc.
2. SR12
DUPL CURR UPDATES 10311RCVD SPURIOUS RTS 84UPDATES GENERATED 89RETRANS 51 11RETRANS 32 11RETRANS 21 27DELAY CHANGES 5283POSS. TREE CHANGES 1767LINE UPDATES 11671UPDATE PACKETS 5059AVERAGE QUEUE 0.01858074MAX QUEUE 2FRACTION OF DELAY CHANGES 0.452660426FRACTION POSS. CHANGES IN TREE = 0.151400901LINES PER PACKET = 2.306977629
32. XEROX
DUPL CURR UPDATES 5255RCVD SPURIOUS RTS 53UPDATES GENERATED 90RETRANS 2 47RETRANS 43 1DELAY CHANGES 5292POSS. TREE CHANGES 1744LINE UPDATES 11711UPDATE PACKETS 5077AVERAGE QUEUE 0.03210557MAX QUEUE 2I FRACTION OF DELAY CHANGES 0.451882839FRACTION POSS. CHANGES IN TREE 0.148919813LINES PER PACKET 2.306677103
11
- 114 -

Report No. 4088 Bolt Beranek and Newman Inc.
56. SUMEX
DUPL CURR UPDATES 5229RCVD SFURNOUS RTS 41UPDATES GEWEr.'ATED 93RETRANS 433RETRANS i IDELAY CHANGES 5299POSS. TREE CHANGES 1857LINE UPDATES 11717
UPDATE PACKETS 5081AVERAGE QUEUE 0.01574493MAX QUEUE 2FRACTIUN OF DELAY C;IANCES 0.452248356FRACTION POSS. CHANGES IN TREE : 0.158437662LINES PER PACKET = 2.306042075
43. TYMSHhRE
DUPL CURR UPDATES 10386RCVD SPURIOUS RTS 63UPDATES GENERATED 78RETRANS 32 42RETRANS 33 11RETRANS 56 30DELAY CHANGES 5302POSS. TREE CHANGE6 707.LINE UPDATES 11733
UPDATE PACKETS 5089AVERAGE QUEUE 0.01434466
MAX QUEUE~ 2- I L FRACTION OF DELAY CHA.'GES 0.451887831
FRACTION POSS, CHANGES IN TREE 0.145487084LINES PER PACKET 2.305560946
115

Report No. 4088 Bolt Beranek and Newman rno.
11. STANFORD
DUPL CURR UPDATES 10569RCVD SPURIOUS RTS 59UPDATES GENERATED 98RETRANS 15 49RETRANS 22 159RETRANS 56 11DELAY CHANGES 5310POSS. TREE CHANGES 2010LINE UPDATES 11806UPDATE PACKETS 5120SAVERAGE QUEUE 0.04472656MAX QUEUE 2FRACTION OF DELAY CHANGES z 0.449771299FRACTION POSS. CHANGES IN TREE 0.170252412LINES PER PACKET 2.305859327
22. ISI22
DUPL CURR UPDATES 10865RCVD SPURIOUS RTS 211UPDATES GENERATED 98RETRANS 11 35RETRANS 48 31RETRANS 52 277DELAY CHANGES 5328POSS. TREE CHANGES 2041LINE UPDATES 11831UPDATE PACKETS 5130AVERAGE QUEUE 0.01968810MAX QUEUE 2FRACTION OF DELAY CHANGES 0.450342312FRACTION POSS. CHANGES IN TREE 0.172512888LINES PER PACKET 2.306237697
I
Ii
- 116 -

S•• -- • • ... .. .. --- •
Report No. 4088 Bolt Beranek and Newman Inc.
35. ACCAT
DUPL CURR UPDATES 155RCVD SPURIOUS RTS 87UPDATES GENERATED 68DELAY CHANGES 5336POSS. TREE CHANGES 2029LINE UPDATES 11854 SUPDATE PACKETS 5141AVERAGE QUEUE 0.03676327MAX QUEUE 3FRACTION OF DELAY CHANGES 0.450143396FRACTION POSS. CHANGES IN TREE = 0.171165846LINES PER PACKET = 2.305777072
52. ISI52
DUPL CURR UPDATES 10536RCVD SPURIOUS RTS 41UPDATES GENERATED 92RETRANS 7 29RETRANS 22 16RETRANS 35 87DELAY CHANGES 5345POSS. TREE CHANGES 2017LINE UPDATES 11894UPDATE PACKETS 5160AVERAGE QUEUE 0.02403100MAX QUEUE 2FRACTION OF DELAY CHANGES 0.449386239
÷ FRACTION POSS. CHANGES IN TREE 0,169581294LINES PER PACKET 2.305038690
117
f

Report No. 4088 Bolt Beranek and Newman Inc.
7. RAND
DUPL CURR UPDATES 5361RCVD SPURIOUS RTS 67UPDATES GENERATED 89RETRANS 23 23 'RETRANS 52 14 LDELAY CHANGES 5351POSS. TREE CHANGES 1933LINE UPDATES 11932UPDATE PACKETS 5176AVERAGE QUEUE 0.03265069MAX QUEUE 2FRACTION OF DELAY CHANGES 0.448457926FRACTION POSS. CHANGES IN TREE = 0.162001334LINES PER PACKET = 2.305254936
23. USC
DUPL CURR UPDATES 5355RCVD SPURIOUS RTS 45UPDATES GENERATED 86RETRANS 7 38RETRANS 1 10DELAY CHANGES 5357POSS. TREE CdANGES 1821LINE UPDATES 11951UPDATE PACKETS 5185AVERAGE QUEUE 0.03529411MAX QUEUE 3FRACTION OF DELAY CHANGES 0.448247000FRACTION POSS. CHANGES IN TREE 0.152372181LINES PER PACKET = 2.304917931
[IJ
Fi
-118
Li-11-_
L ... ..... .. , - . ...

Report No. 4088 Bolt Beranek and Newman Inc.
1. UCLA
DUPL CURR UPDATES 5569RCVD SPURIOUS RTS 266UPDATES GENERATED 84RETRANS 23 22RETRANS 33 15DELAY CHANGES 5358POSS. TREE CHANGES 1706LINE UPDATES 11958UPDATE PACKETS 5187AVERAGE QUEUE 0.02024291MAX QUEUE 2FRACTION OF DELAY CHANGES 0.448068231FRACTION POSS. CHANGES IN TREE z 0.142665997LINES PER PACKET 2.305378794
33. NPS
DUPL CURR UPDATES 11692RCVD SPURIOUS RTS 631UPDATES GENERATED 79RETRANS 43 59RETRANS 1 256RETRANS 59 323DELAY CHANGES 5363POSS. TREE CHANGES 1665LINE UPDATES 11973UPDATE PACKETS 5194
H AVERAGE QUEUE 0.03754331MAX QUEUE 3FRACTION OF DELAY CHANGES z 0.447924494FRACTION POSS. CHANGES IN TREE 0.139062888
~J ULINES PER PACKET 2.305159687
I11
L I
- 119 -

Report No. 4088 Bolt Beranek and Newman Inc.
48. AFWL
DUPL CURR UPDATES 5861RCVD SPURIOUS RTS 304UPDATES GENERATED 90RETRANS 22 36RETRANS 62 225DELAY CHANGES 5372POSS. TREE CHANGES 2079LINE UPDATES 12024UPDATE PACKETS 5218AVERAGE QUEUE 0.03583748MAX QUEUE 3FRACTION OF DELAY CHANGES = 0.446773111FRACTION POSS. CHANGES IN TREE 0.172904185LINES PER PACKET 2.304331064
4. UTAH
DUPL CURR UPDATES 5693RCVD SPURIOUS RTS 200UPDATES GENERATED 88RETRANS 34 110RETRANS 25 72DELAY CHANGES 5376POSS. TREE CHANGES 2029LINE UPDATES 12041UPDATE PACKETS 5225AVERAGE QUEUE 0.03502392
LMAX QUEUE 2FRACTION OF DELAY CHANGES = 0.446474537
jFRACTION POSS. CHANGES IN TREE = 0.168507598LINES PER PACKET 2.304497599
-120-

Report No. 4088 Bolt Beranek and Newman Inc.
25. DOCB
DUPL CURR UPDATES 5768RCVD SPURIOUS RTS 238UPDATES GENERATED 84RETRANS 4 150RETRANS 24 70DELAY CHANGES 5381POSS. TREE CHANGES 2033LINE UPDATES 12070UPDATE PACKETS 5237AVERAGE QUEUE 0.03532556MAX QUEUE 2FRACTION OF DELAY CHANGES 0.445816069FRACTION POSS. CHANGES IN TREE = 0.168434128LINES PER PACKET = 2.304754614
24. GWC
DUPL CURR UPDATES 5705RCVD SPURIOUS RTS 184UPDATES GENERATED 88RETRANS 12 35RETRANS 25 169DELAY CHANGES 5389POSS. TREE CHANGES 1879LINE UPDATES 12080UPDATE PACKETS 5241AVERAGE QUEUE 0.03186'414MAX QUEUE 2FRACTION OF DELAY CHANGES 0.446109265FRACTION POSS. CHANGES IN TREE 0.155546352LINES PER PACKET 2.304903626
- 121 -

Report No. 4088 Bolt Beranek and Newman Inc.
62. TEXAS
DUPL CURR UPDATES 5600RCVD SPURIOUS RTS 250UPDATES GENERATED 84RETRANS 13 15RETRANS 48 25DELAY CHANGES 5400POSS. TREE CHANGES 2056LINE UPDATES 12118"UPDATE PACKETS 5260AVERAGE QUEUE 0.01806083MAX QUEUE 2FRACTION OF DELAY CHANGES: 0.445618078FRACTION POSS. CHANGES IN TREE = 0.169664956LINES PER PACKET 2.303802251
13. GUNTER
DUPL CURR UPDATES 8111RCVD SPURIOUS RTS 219UPDATES GENERATED 157RETRANS 62 34RETRANS 53 87RETRANS 17 55DELAY CHANGES 5411POSS. TnEE CHANGES 2623LINE UPDATES 12154UPDATE PACKETS 5276AVERAGE QUEUE 0.05079605MAX QUEUE 3FRACTION OF DELAY CHANGES = 0.445203214FRACTION POSS. CHANGES IN TREE 0.2158137t8LINES PER PACKET 2.303639054
- 122 -
|r

Report No. 408 Bolt Beranek and Newman Inc.
53. EGLIN
"DUPL CURR UPDATES 5726RCVD SPURIOUS RTS 185UPDATES GENERATED 152RETRANS 13 10RETRANS 38 105DELAY CHANGES 5423POSS. TREE CHANGES 2616LINE UPDATES 12186UPDATE PACKETS 5290AVERAGE QUEUE 0.03440453MAX QUEUE 2FRACTION OF DELAY CHANGES 0.445018872FRACTION POSS. CHANGES IN TREE = 0.214672572LINES PER PACKET = 2.303591609
28. ARPA
DUPL CURR UPDATES 179RCVD SPURIOUS RTS 84UPDATES GENERATED 95DELAY CHANGES 5434POSS. TREE CHANGES 2554LINE UPDATES 12232UPDATE PACKETS 5312AVERAGE QUEUE 0.04442770MAX QUEUE 2
_ FRACTION OF DELAY CHANGES 0.4442445r3FRACTION POSS. CHANGES IN TREE O.L08796598LINES PER PACKET 2.302710771
-123 -

Report No. 4088 Bolt Beranek and Newman Inc.
17. MITRE
DUPL CURR UPDATES 11127RCVD SPURIOUS RTS 82UPDATES GENERATED 129RETRANS 13 194RETRANS 19 11RETRANS 28 85DELAY CHANGES 5441POSS. TREE CHANGES 2515LINE UPDATES 12258UPDATE PACKETS 5322AVERAGE QUEUE 0.04998120MAX QUEUE 3FRACTION OF DELAY CHANGES 0.443873375FRACTION POSS. CHANGES IN TREE 0.205172128LINES PER PACKET 2.303269386
38. BRAGG
DUPL CURR UPDATES 5817RCVD SPURIOUS RTS 230UPDATES GENERATED 152RETRANS 26 11RETRANS 53 97DELAY CHANGES 5452POSS. TREE CHANGES 2604LINE UPDATES 12290UPDATE PACKETS 5336AVERAGE QUEUE 0.05284857MAX QUEUE 3FRACTION OF DELAY CHANGES = 0.443612679FRACTION POSS. CHANGES IN TREE 0.211879573LINES PER PACKET 2.303223371
- 124 -
3t

Report No. 4088 Bolt Beranek and Newman Inc.
26. PENTAGON
DUPL CURR UPDATES 5668RCVD SPURIOUS RTS 80UPDATES GENERATED 124RETRANS 38 123RETRANS 19 2DELAY CHANCES 5462POSS. TREE CHANGES 2495LINE UPDATES 12329UPDATE PACKETS 5354AVERAGE QUEUE 0.04650728M3X QUEUE 2FRACTION OF DELAY C'!AdGES 0.443020507FRACTION POSS. CHANGES IN TREE = 0.202368393LINES PER PACKET = 2.302764177
19. NBS
DUPL CURR UPDATES 10941RCVD SPURIOUS RTS 28UPDATES GENERATED 106RETRANS 17 28RETRANS 29 22RETRANS 26 69DELAY CHANGES 5476F ')SS. TREE CHANGES 2388LINE UPDATES 12348UPDhLTE PACKETS 5363AVERAGE QUEUE 0.04586984MA; QUEUE 2FRACTION OF DELAY CHANGES = 0.443472623FRACTION POSS. CHANGES iN TREE 0.193391636LINES PER PACKET 2.3024142550
.i12
tL -- 1 5-

Report No. 4088 Bolt Beranek and Newman Inc.
12. DTI
DUPL CURR UPDATES 11105RCVD SPURIOUS RTS 98UPDATES GENERATED 110RETRANS 59 11RETRANS 24 I12RETRANS 55 30DELAY CHANGES 5476POSS. TREE CHANGES 1829 U
LINE UPDATES 12367UPDATE PACKETS 5371AVERAGE QUEUE r.01582573MAX QUEUE 2FRACTION OF DELAY CHANGES 0.442791298FRACTION POSS- [•ANGES IN TREE G.147893585LINES PER PACKET • 2.302550673
55. ANL
DUPL CURR UPDATES 5691"" RCVD SPURIOUS RTS 94
UPDATES GENERATED 107RETRAYS 47 96RETRANS 12 23DELAY CHANGES 5482POSS. TREE CHANGES 1936LINE UPDATES 12384UPDATE PACKETS 5378AVERAGE QUEUE 0.02975C83MAX QUEUE 2FRACTION OF DELAY CHANGES 0.442667946FRACTION POSS. CHANGES IN TREE : 0.156330741LINES PER PACKET 2.302714705
- J
II-126 IL

Report No. 4088 Bolt Beranek and Newman Inc.
47. WPAFB
DUPL CURE UPDATES 5741RCVD SPURIOUS RTS 128UPDATES GENERATED 108RETRANS 14 68RETRANS 55 65DELAY CHANGES 5489POSS. TREE CHANGES 2031LINE UPDATES 12409UPDATE PACKETS 5390AVERAGE QUEUE 0.03302411MAX QUEUE 2FRACTION OF DELAY CHANGES 0.442340224°FRACTION POSS. CHANGES IN TREE 0.163671523LINES PER PACKET = 2.302226305
14. CMU
DUPL CURR UPDATES 11134RCVD SPURIOUS RTS 114UPDATES GENERATED 128RETRANS 47 33RETRANS 50 18RETRANS 18 47DELAY CHANGES 5497POSS. TREE CHANGES 2089LINE UPDATES 12429UPDATE PACKETS 5401AVERAGE QUEUE 0.01870024
SMAX Y'>.UE 2FRACTION OF DELAY CHANGES = 0.442272096FRACTION POSS. CHANGES IN TREE 0.168074660LINES PER PACKET 2.301240444
11
I -127-

Report No. 4088 Bolt Beranek and Newman Inc.
18. RADC
DUPL CURR UPDATES 5665RCVD SPURIOUS RTS 84UPDATES GENERATED 109RETRANS 10 47RETRANS 14 25DELAY CHANGES 5508POSS. TREE CHANGES 1992LINE UPDATES 12459UPDATE PACKETS 5412AVERAGE QUEUE 0.03215077MAX QUEUE 2FRACTION OF DELAY CHANGES 0.442090049FRACTION POSS. CHANGES IN TREE = 0.159884415LINES PER PACKET = 2.302106380
10. LINCOLN
DUPL CURR UPDATES 11086RCVD SPURIOUS RTS 62UPDATES GENERATED 102RETRANS 44 44RETRANS 18 37RETRANS 37 11DELAY CHANGES 5511POSS. TREE CHANGES 1832
|LINE UPDATES 12485UPDATE PACKETS 5423AVERAGE QUEUE 0.01512078MAX QUEUE 1FRACTION OF DELAY CHANGES 0.441409677FRACTION POSS. CHANGES IN TREE 0.146736077LINES PER PACKET 2.302231192
- 128 -

Report No. 4088 Bolt Beranek and Newman Inc.
44. MIT44
DUPL CURR UPDATES 5584RCVD SPURIOUS RTS 44UPDATES GENERATED 79RETRANS 6 36DELAY CHANGES 5513POSS. TREE CHANGES 1859LINE UPDATES 12497UPDATE PACKETS 5428AVERAGE QUEUE 0.03389830MAX QUEUE 2S FRACTION OF DELAY CHANGES 0.441145867
FRACTION POSS. CHANGES IN TREE = 0.148755699LINES PER PACKET = 2.302321195
6. MIT6
DUPL CURR UPDATES 108RCVD SPURIOUS RTS 36UPDATES GENERATED 72DELAY CHANGES 5519POSS. TREE CHANGES 1857LINE UPDATES 12525UPDATE PACKETS 5441AVERAGE QUEUE 0.02297371MAX QUEUE 1FRACTION OF DELAY CHANGES = 0.440638720FRACTION POSS. CHANGES IN TREE 0.148263469LINES PER PACKET 2.301966547
- 129 -

Report No. 4088 Bolt Beranek and Newman Inc.
20. DCEC
DUPL CURR UPDATES 208RCVD SPURIOUS RTS 111UPDATES GENERATED 97DELAY CHANGES 5525POSS. TREE CHANGES 2290LINE UPDATES 12539UPDATE PACKETS 5450AVERAGE QUEUE 0.036(9724MAX QUEUE 2FRACTION OF DELAY CHANGES 0.440625235FRACTION POSS. CHANGES IN TREE = 0.182630188LINES PER PACKET = 2.300733923
50. DARCOM
DUPL CURR UPDATES 11205RCVD SPURIOUS RTS 27UPDATES GENERATED 134RETRANS 14 23RETRANS 29 11RETRANS 20 111DELAY CHANGES 5534POSS. TREE CHANGES 2263LINE UPDATES 12578UPDATE PACKETS 5466AVERAGE QUEUE 0.04024880MAX QUEUE 2FRACTION OF DELAY CHANGES 0.439974546FRACTION POSS. CHANGES IN TREE = 0.179917313LINES PER PACKET = 2.301134228
- 130 -

Report No. 4088 Bolt Beranek and-Newman Inc.-
29. ABERDEEN
DUPL CURR UPDATES 11204RCVD SPURIOUS RTS 63UPDATES GENERATED 143RETRANS 46 30RETRANS 19 18RETRANS 50 8DELAY CHANGES 5544POSS. TREE CHANGES 2290LINE UPDATES 12625UPDATE PACKETS 5486AVERAGE QUEUE 0.01239518MAX QUEUE 1FRACTION OF DELAY CHANGES = 0.439128711FRACTION POSS. CHANGES IN TREE = 0.181386135LINES PER PACKET = 2.301312327
46. RUTGERS
DUPL CURR UPDATES 5705RCVD SPURIOUS RTS 62UPDATES GENERATED 110RETRANS 29 30
L RETRANS 60 17DELAY CHANGES 5551POSS. TREE CHANGES 2144LINE UPDATES 12644UPDATE PACKETS 5496AVERAGE QUEUE 0.03074963MAX QUEUE 2
OR FRACTION OF DELAY CHANGES = 0.439022451FRACTION POSS. CHANGES IN TREE 0.169566586LINES PER PACKET 2.300582170
-131

Report No. 4088 Bolt Beranek and Newman Inc.
60. CORADCOM
DUPL CURR UPDATES 5707RCVD SPURIOUS RTS 46UPDATES GENERATED 123RETRANS 46 32RETRANS 58 11DELAY CHANGES 5557POSS. TREE CHANGES 1957LINE UPDATES 12660UPDATE PACKETS 5502AVERAGE QUEUE 0.02653580MAX QUEUE 2FRACTION OF DELAY CHANGES 0.438941538FRACTION POSS. CHANGES IN TREE = 0.154581353LINES PER PACKET = 2.300981402
58. NYU
DUPL CURR UPDATES 5759RCVD SPURIOUS RTS 85UPDATES GENERATED 128RETRANS 9 17SRETRANS 60 29
SDELAY CHANGES 5565SPOSS. TREE CHANGES 1725
LINE UPDATES 12685UPDATE PACKETS 5513AVERAGE QUEUE 0.02122256MAX QUEUE 2FRACTION OF DELAY CHANGES = 0.438707128FRACTION POSS. CHANGES IN TREE = 0.135987386LINES PER PACKET 2.300925016
S- 132-
M&747

Report No. 4088 Bolt Beranek and Newman Inc.
37. DEC
DUPL CURR UPDATES 5700RCVD SPURIOUS RTS 58UPDATES GENERATED 105RETRANS 10 15RETRANS 9 5DELAY CHANGES 5573POSS. TREE CHANGES 1659LINE UPDATES 12713UPDATE PACKETS 5525AVERAGE QUEUE 0.01520361MAX QUEUE 1FRACTION OF DELAY CHANGES 0.438370168FRACTION POSS. CHANGES IN TREE = 0.130496338LINES PER PACKET 2.300995469
59. SCOTT
DUPL CURR UPDATES 12459RCVD SPURIOUS RTS 504UPDATES GENERATED 105RETRANS 12 41RETRANS 9 135RETRANS 33 642DELAY CHANGES 5579POSS. TREE CHANGES 1639LINE UPDATES 12737UPDATE PACKETS 5536AVERAGE QUEUE 0.02366329• iMAX QUEUE 2
FRACTION OF DELAY CHANGES 0.438015222FRACTION POSS. CHANGES IN TREE 0.128680221LINES PER PACKET 2.300758600
S- 1i33 -

Report No. 4088 Bolt Beranek and Newman Inc.
9. HARVARD
DUPL CURR UPDATFS 17132x RCVD SPURIOUS RTS 150
UPDATES GENERATED 98RETRANS 40 26RETRANS 58 75RETRANS 37 47RETR!NS 59 150DELAY CHANGES 5584POSS. TREE CHANGES 1482LINE UPDATES 12750UPDATE PACKETS 5542AVERAGE QUEUE 0.02959220MAX QUEUE 2FRACTION OF DELAY CHANGES = 0.437960773FRACTION POSS. CHANGES IN TREE 0.116235293
ff LINES PER PACKET = 2.300613403
63. BBN63
DUPL CURR UPDATES 208RCVD SPURIOUS RTS 133UPDATES GENERATED 74RETRANS 40 1DELAY CHANGES 5586POSS. TREE CHANGES 1423LINE UPDATES 12769UPDATE PACKETS 5550AVERAGE QUEUE 0.01675675MAX QUEUE 1FRACTION OF DELAY CHANGES 0.437465727FRACTION POSS. CHANGES IN TREE 0.111441772LINES PER PACKET 2.300720691
-134-

Report No. 4088 Bolt Beranek and Newman Inc.
40. BBN40
DUPL CURR UPDATES 11353RCVD SPURIOUS RTS 22UPDATES GENERATED 78RETRANS 49 23RETRANS 9 1RETRANS 63 133DELAY CHANGES 5594POSS. TREE CHANGES 1419LINE UPDATES 12783UPDATE PACKETS 5556AVERAGE QUEUE 0.03779697MAX QUEUE 5FRACTION OF DELAY CHANGES 0.437612444FRACTION POSS. CHANGES IN TREE = 0.111006803LINES PER PACKET = 2.300755858
49. RCC49
DUPL CURR UPDATES 5656RCVD SPURIOUS RTS 19UPDATES GENERATED 72RETRANS 5 124DELAY CHANGES 5596POSS. TREE CHANGES 1396LINE UPDATES 12791
W UPDATE PACKETS 5559AVERAGE QUEUE 0.03004137MAX QUEUE 2FRACTION OF DELAY CHANGES 0.437495112FRACTION POSS. CHANGES IN TREE 0.109139237LINES PER PACKET 2.300953388
I i~1"
S1 1
S~- 135 -

Report No. 4088 Bolt Beranek and Newman Inc.
5. RCC5
DUPL CURR UPDATES 196RCVD SPURIOUS RTS 123UPDATES GENERATED 73RETRANS 49 1DELAY CHANGES 5602POSS. TREE CHANGES 1403LINE UPDATES 12805UPDATE PACKETS 5566AVERAGE QUEUE 0.02317642MAX QUEUE 1FRACTION OF DELAY CHANGES 0.437485352FRACTION POSS. CHANGES IN TREE 0.109566573LINES PER PACKET 2.300574898
iJ
- 136 -

BN IReport No. 4088 Bolt Beranek and Newman Inc.
APPENDIX 2 -- TRAFFIC TESTS
This appendix contains the results of 5 experiments
performed on 1/4/79. The experiments are discu3sed in chapter 6.
In all of these experiments, node 64 was sending 20 packets per
second to node 59, with each packet containing 1192 bits. Node
59 was set to refuse to acknowledge a certain fraction of the
traffic ai'riving from node 64. Modes 56 and 43 sent tagged
packets to node 9.
a) In this experiment, node 43 sent 10 packets per second to node
9, with each packet containing 1192 bits. Node 59 was set to
reject 80% of the traffic arriving from node 64.
SOURCE: 43 COUNT: 1836 DELAY: 317.51 MS.
PATH: 43-32- 2-21-34- 4-25-24-12-59- 9COUNT: 879 DELAY: 312.30 48%
PATH: 43-56-11-22-48-62-13-17-19-29-46-58- 9COUNT: 801 DELAY: 316.80 44%
PATH: 43-56-11-22-48-62-13-53-38-26-19-29-46-58- 9COUNT: 75 DELAY: 358.07 4%
PATH: 43-56-11-15-45-34- 4-25-24-12-59- 9COUNT: 80 DELAY: 342.64 4%
PATH: 43-32- 2-51-16-15-45-34- 4-25-24-12-59- 9COUNT: 1 DELAY: 423.20 0%
PERCENTAGE OF LOOPING PACKETS : 0.00%I AVERAGE PATH LENGTH =11.08 HOPS
A " 3

• • •-':o• •L• •'• ........ • ........ • ............ •_ •-•-• •, •Tr-T•'•.• :-•d•;• •.•• ,• Report No, 4088 Bolt Beranek and Newman Inc.
i i•,°1"' • • r• •, 9-•I
! ° •
• --1 i
) •' -- I
• -, . T• "•
• • •.- p..
, i t• ,m• '•i '.• • ,.•=I I.'.-!
S- 138 -

Report No. 4088 Bolt Beranek and Newman Inc.
b) In this exeriment, node 43 sent 10 packet& per second to node
9, and node 59 was set to reject 67% of the traffic arriving from
node 64.
SOURCE: 43 COUNT: 2010 DELAY: 499.68 MS.
PATH: 43-64-59- 9COUNT: 557 DELAY:1103.97 28%
PATH: 43-32- 2-21-34- 4-25-24-12-59- 9COUNT: 772 DELAY: 247.20 38%
PATH: 43-56-11-15-45-34- 4-25-24-12-59- 9COUNT: 320 DELAY: 272.36 16%
PATH: 43-56-11-22-48-62-13-17-19-29-46-58 - 9
COUNT: 324 DELAY: 3U3.74 16%
PATH: 43-56-11-22-48-62-13-53-38-26-19-29-46-58- 9
A COUNT: 36 DELAY: 347.82 2%
PATH: 43-32- 2-32-43-64-59- 9COUNT: 1 DELAY: 522.4OLOOP 0%
PERCENTAGE OF LOOPING PACKETS = 0.05%AVERAGE PATH LENGTH 8.61 HOPS
- 139 -1'-

Report No. 4088 Bolt Beranek and Newman Inc.
La) In this experiment, node 43 sent 20 packets per seoond to node
-9 and node 59 was seu to reject 80% of the traffic arriving from
node 64,
SOURCE: 43 COUNT: 3798 DELAY: 422.02 MS.
PATH: 43-64-59- 9COUNT: 84 DELAY:2140.69 2%
PATH: 43-32- 2-21-34- 4-25-24-12-59? 9
COUNT- 1192 DELAY: 387.08 31%
PATH: 43-56-11-15-45-34- 4-25-24-!2-59- 9COUNT: 573 DELAY: 386.76 15a
PATH: 43-56-11-22-48-62-13-17-19-29-46-58- 9COUNT: 1310 DELAY: 358.25 34%
PATH: 43-56-11-22-48-62-13-53-38-26-19-29-46-58- 9 ICOUNT: 525 DELf4: 409.79 14%
PATH: 43-64-33- 1-23- 7-52-22-48-62-13-17-19-29-46-58- 9
COUNT: 82 DELAY: 505.93 2%
PATH: 43-32- 2-51-16-!5-45-34- 4-25-24-12-59- 9COUNT: 29 DELAY: 440.19 1%
PATH: 43-32- 2-51-16-15-11-22-48-62-13-17-19-29-46-58- 9
COUNT: 3 DELAY: 433.60 0%
PERCENTAGE OF LOOPING PACKETS = 0.00%AVERAGE PATH LENGTH =11.40 HOPS
- 4f
I - 140-

I ---
j Report No. 4088 Bolt Beranek and Newman Inc.
d) In this experiment, node 43 sent 20 packets per second to node
9, and node 59 was set to reject 67% of the traffic arriving from
node 64.
SOURCE: 43 COUNT: 4151 DELAY: 531.07 MS.
PATH: 43-56-11-22-52- 7-23- 1-33-64-59- 9COUNT: 79 DELAY:2015.56 2%
VATH: 43-32- 2-21-34- 4-25-24-12-59- 9COUNT: 1751 DELAY: 272.28 42%
PATH: 43-56-11-22-.52-22-48-62-13-17-19-29-46-58- 9
COUNT: 1 DELAY: 380.8OLOOP 0%
IPATH: 43-56-11-22-52- 7-23- 7-52-22-48-62-13-17-19-29-46-58- 9
'.OUNT: 1 DELAY: 480.OOLOOP 0%
PATH: 43-56,-11-22-52- 7-23- 1-23- 7-52-22-48-62-13-17-19-29-46-58- 9
TLI COUNT: 4 DELAY: 913.60LOOP 0%
IL' PATH: 43-64-59- 9COUNT: 787 DELAY:1223.5O 19%
i -IPATH: 43-56-11-22-48-62-13-17-19-29-46-58- 9
COUNT: 778 DELAY: 367.79 19%
PATH: 43-56.-11-15-45-34- 4-25-24-12-59- 9COUNT: 717 DELAY: 317.14 17%
PATH: 43-32- 2-32-43-64-59. 9COUNT: 2 DELAY: 640.80LOOP 0%
PATH: 43-56-11-22-52- 7-23- 7-52-22-48-62-13-53-38-26-19-29-46-58- 9
- 141

Report No. 4088 Bolt Beeanek and Newman Inc.
COUNT: 8 DELAY:2820.OOLOOP 0%
PATH: 43-56-11-22-52- 7-23- 1-23- 7-52-22-48-62-13-53-38-26-19-.29-46-58- 9
COUNT: 7 DELAY:3164.91LOOP 0%
PATH: 43-56-11-22-52- 7-52-22-48-62-13-53-38-26-19-29-46-58- 9
COUNT: 1 DELAY:2482.40LOOP 0%
PATH: 43-56-11-22-52- 7-23- 1-33- 1-23- 7-52-22-48-62-13-53-38-26-19-29-46-58- 9
COUNT: 6 DELAY:3726.40LOOP 0%
PATH: 43-64-43-32- 2-21-34- 4-25-24-12-59- 9COUNT: 8 DELAY:1875.20LOOP 0%
PATH: 43-56-11-56-43-64-59- 9COUNT: I DELAY:1712.80LOOP 0%
SPERCENTAGE OF LOOPING PACKETS = 0.94%AVERAGE PATH LENGTH 9.32 HOPS
1
1 -142 -

Report No. 4088 Bolt Beranek and Newman Inc.
e) In this experiment, nodes 56 and 43 each sent 10 packets per
second to node 9, and node 59 was set to reject 80% of the
traffic arriving from node 64.
SOURCE: 43 COUNT: 2673 DELAY: 357.01 MS.
PATH: 43-64-59- 9COUNT: 4 DELAY:1933.60 0%
PATH: 43-56-11-22-48-62-13-17-19-29-46-58- 9COUNT: 892 DELAY: 378.25 33%
PATH: 43-32- 2-21-34- 4-25-24-12-59- 9COUNT: 1572 DELAY: 333.87 59%
PATH: 43-56-11-15-45-34- 4-25-24-12-59- 9COUNT: 162 DELAY: 412.83 6%
PATH: 43-56-11-22-48-62-13-53-38-26-19-29-46-58- 9COUNT: 43 DELAY: 405.30 2%
Z PERCENTAGE OF LOOPING PACKETS = 0.00%AVERAGE PATH LENGTH =10.78 HOPS
14,ji - 143 -

Report No. 4088 Bolt Beranek and Newman- Inc.
SOURCE: 56 COUNT: 2673 DELAY: 352.32 MS.
PATH: 56-11-22-48-62-13-17-19-29-46-58- 9COUNT: 16311 DELAY: 325.54 61%
PATH: 56-43-56-11-22-48-62-13-17-19-29-46-58- 9COUNT: 4 DELAY:5269.60LOCP 0%
* PATH: 56-43-64-59- 9COUNT: 3 DELAY:6365.33 0%
SPATH : 56-43-32- 2-2 1-34- 4-25-24-12-59- 9
! COUNT: 89 DELAY: 397.29 3%
PATH: 56-11-15-45-34- 4-25-24-12-59- 9COUNT: 903 DELAY: 353.33 34%
Hi PATH: 56-11-22-48-62-13-53-38-26-19-29-46-58- 9
COUNT: 43 DELAY: 376.82 2%
PERCENTAGE OF LOOPING PACKETS = 0.15%
AVERAGE PATH LENGTH =10.69 HOPS
TOTAL MESSAGES FROM ALL SOURCES 5346
PERCENT LOOPING PACKETS 0.07%
°1i4
- 144 -

i Report No. 4088 Bolt Beranek and Newman Inc.
APPENDIX 3 -- INSTABILITY TESTS
This appendix contains the results of 5 experiments
performed on 11/21/78. The experiments are discussed in chapter
6. They were performed on our lab network, pictured in Figure
A3-1.
+ TOARPAwET
Figure A3-1
a) For this experimens, nodes 60, 61, and 66 each sent 10 packets
per second to node 30. Each packet contained 1192 bits.
L145

Report No. 4088 Bolt Beranek and Newman Inc.
SOURCE: 60 COUNT: 1331 DELAY: 108.96 MS.
PATH: 60-61-30COUNT: 525 DELAY: 145.19 39%
PATH: 60-66-30COUNT: 803 DELAY: 74.86 60%
PATH: 60-61-60-66-30- COUNT: 3 DELAY:2897.07LOOP 0%
PERCENTAGE OF LOOPING PACKETS = 0.23%AVERAGE PATH LENGTH 2.00 HOPS
SOURCE: 61 COUNT: 1317 DELAY: 63.04 MS.
PATH: 61-30COUNT: 1310 DELAY: 57.30 99%
PATH: 61-60-66-30COUNT: 7 DELAY:1135.77 I%
PERCENTAGE OF LOOPING PACKETS = 0.00%• jAVERAGE PATH LENGTH 1.01 HOPS
U6
Z 146-

Report No. 4088 Bolt Beranek and Newman Inc.
SOURCE: 66 COUNT: 1349 DELAY: 55.58 MS.
PATH: 66-30COUNT: 1339 DELAY: 51.53 99%
PATH: 66-60-61-30COUNT: 10 DELAY: 598.72 1%
PERCENTAGE OF LOOPING PACKETS = 0.00%AVERAGE PATH LENGTH = 1.01 HOPS
TOTAL MESSAGES FROM ALL SOURCES = 3997PERCENT LOOPING PACKETS 0.08%
-
lu
IR
H -147-
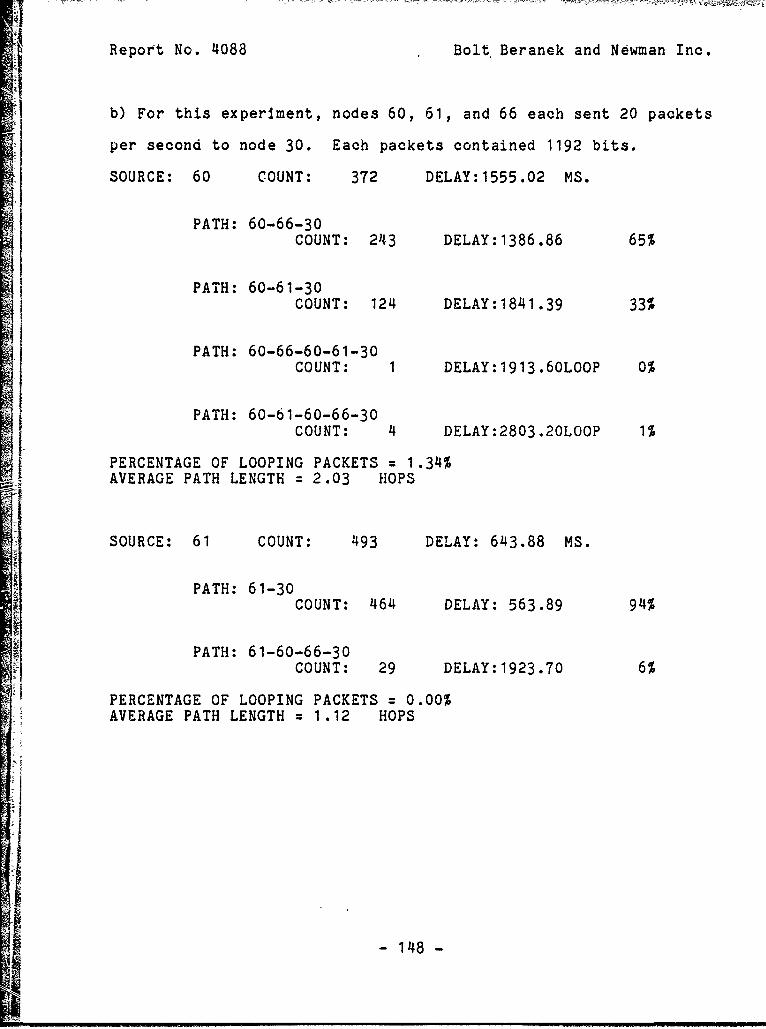
Report No. 4088 Bolt Beranek and Newman Inc.
b) For this experiment, nodes 60, 61, and 66 each sent 20 packets
per second to node 30. Each packets contained 1192 bits.
SOURCE: 60 COUNT: 372 DELAY:1555.02 MS.
PATH: 60-66-30COUNT: 243 DELAY:1386.86 65%
PATH: 60-61-30COUNT: 124 DELAY:1841.39 33%
PATH: 60-66-60-61-30COUNT: 1 DELAY:1913.60LOOP 0%
PATH: 60-61-60-66-30COUNT: 4 DELAY:2803.20LOOP 1%
PERCENTAGE OF LOOPING PACKETS = 1.34%
AVERAGE PATH LENGTH = 2.03 HOPS
SOURCE: 61 COUNT: 493 DELAY: 643.88 MS.
PATH: 61-30COUNT: 464 DELAY: 563.89 94%
PATH: 61-60-66-30COUNT: 29 DELAY:1923.70 6%
PERCENTAGE OF LOOPING PACKETS = 0.00%AVERAGE PATH LENGTH 1.12 HOPS
- 148 -

Report No. 4088 Bolt Beranek and Newman Inc.
SOURCE: 66 COUNT: 594 DELAY: 438.29 MS.
PATH: 66-30COUNT: 592 DELAY: 436.79 100%
PATH: 66-60-61-30COUNT: 2 DELAY: 881.60 0%
PERCENTAGE OF LOOPING PACKETS = 0.00%AVERAGE PATH LENGTH = 1.01 HOPS
TOTAL MESSAGES FROM ALL SOURCES 1459PERCENT LOOPING PACKETS 0.34%
it•
- 149 -

Report No. 4088 Bolt Beranek and Newman Inc.
c) For this experiment, nodes 60 and 66 each sent lu packets per
second to node 30. Each packet contained 1192 bits.
SOURCE: 60 COUNT: 1197 DELAY: 50.60 MS.
PATH: 60-66-30COUNT: 586 DELAY: 52.15 49%
PATH: 60-61-30COUNT: 611 DELAY: 49.12 51%
PERCENTAGE OF LOOPING PACKETS = 0.00%AVERAGE PATH LENGTH = 2.00 HOPS
7!*SOURCE: 66 COUNT: 1192 DELAY: 25.06 MS.
PATH: 66-30COUNT: 1192 DELAY: 25.06 100%
PERCENTAGE OF LOOPING PACKETS = 0.00%AVERAGE PATH LENGTH = 1.00 HOPS
TOTAL MESSAGES FROM ALL SOURCES 2389PERCENT LOOPING PACKETS 0.00%
-150- L

Report No. 4088 Bolt Beranek and Newman Inc.
d) For this experiment, nodes 60 and 66 each sent 20 packets per
second to node 30. Each packet contained 1192 bits.
SOURCE: 60 COUNT: 885 DELAY: 820.94 MS.
PATH: 60-66-30COUNT: 481 DELAY: 729.95 54%
PATH: 60-61-30COUNT: 389 DELAY: 906.83 44%
PATH: 60-66-60-61-30COUNT: 8 DELAY:1148.OOLOOP 1%
PATH: 60-61-60-66-30COUNT: 7 DELAY:1926.40LOOP 1%
PERCENTAGE OF LOOPING PACKETS = 1.69%AVERAGE PATH LENGTH = 2.03 HOPS
SOURCE: 66 COUNT: 893 DELAY: 371.48 "S.
5- PATH: 66-30COUNT: 849 DELAY: 336.34 95%
V PATH: 66-60-61-30COUNT: 44 DELAY:1049.60 5%
PERCENTAGE OF LOOPING PACKETS = 0.00%AVERAGE PATH LENGTH 1.10 HOPS
TOTAL MESSAGES FROM ALL SOURCES 1778"PERCENT LOOPING PACKETS 0.84%
151

Report No. 4088 Bolt Beranek and Newman Inc.
e) For this experiment, we used the network pictured in Figure
A3-2. Nodes 60, 61, and 66 each sent 10 packets per second to
node 30.
I
16
iI
TO
ARPANET
Figure A3-2
152

Report No. 4088 Bolt Beranek and Newman Inc.
SOURCE: 60 COUNT: 1051 DELAY: 104.66 MS
PATH: 60-61-66-30
COUNT: 60 DELAY: 148.91 6%
PATH: 60-66-30COUNT: 719 DELAY: 72.19 68%
PATH: 60-61-30COUNT: 196 DELAY: 138.25 19%
PATH: 60-61-60-66-30COUNT: 3 DELAY: 364.80LOOP 0%
PATH: 60-66-61-30COUNT: '(1 DELAY: 277.93 7%
PATH: 60-66-61-60-66-30COUNT: 2 DELAY: 616.OOLOOP 0%
PERCENTAGE OF LOOPING PACKETS = 0.48%j AVERAGE PATH LENGTH = 2.14 HOPS
SOURCE: 61 COUNT: 1034 DELAY: 77.34 MS.
PATH: 61-66-30COUNT: 293 DELAY: 112.17 28%
PATH: 61-30COUNT: 715 DELAY: 60.17 69%
IT PATH: 61-60-66-30COUNT: 26 DELAY: 157.17 3%
I" PERCENTAGE OF LOOPING PACKETS = 0.00%AVERAGE PATH LENGTH = 1.33 HOPS
- 153 -

Report No. 4088 Bolt Beranek and Newman Inc.
SOURCE: 66 COUNT: 1051 DELAY: 80.58 MS.
PATH: 66-30COUNT: 879 DELAY: 44.34 84%
PATH: 66-. 130
vOUNT: 134 DELAY: 272.53 13%
PATH: 66-61-60-66-30COUNT: 3 DELAY: 514.13LOOP 0%
PATH: 66-60-61-30COUNT: 35 DELAY: 218.56 3%
PERCENTAGE OF LOOPING PACKETS = 0.29%AVERAGE PATH LENGTH = 1.20 HOPS
TOTAL MESSACES FROM ALL SOURCES 3136PERCENT LOOPING PACKETS = 0.26%i!
if
-15J4 -

L Report No., 4088 Bolt Beranek and Newman Inc.
APPENDIX 4 -- INSTABILITY/OVERLOAD TESTS
This appendix contains the results of an experiment done on
2/27/79. Nodes 26, 38, and 17 each sent 10 packets per second to
node 19. Nodes 13 and 53 each sent 20 packets per second to node
19. All packets were 1192 bits long. Puring this experiment,
the line between nodes 13 and 62 was removed from o-pration. The
network, as it was during our experiments, is pictured in Figure
A4-1.
1
i I
L-.
~ I ~=-~- 155 -

Report No. 40)88 Bolt Beranek and Newman Inc.
4 9a. A
..... ..
Pq tx
CL <
I<
-156-

Report No. 4088 Bolt Beranek and Newman Inc.
SOURCE: 13. COUNT: 3503 DELAY: 357.75 MS.
PATH: 13-17-19COUNT: 2869 DELAY: 186.07 82%
PATH: 13-53-38-26-19COUNT: 634 DELAY:113 4 .63 18%
PERCENTAGE OF LOOPING PACKETS = 0.00%1, AVERAGE PATH LENGTH = 2.36 HOPS
j SOURCE: 26 COUNT: 2084 DELAY: 219.85 MS.
PT:26-19COUNT: 1950 DELAY: 121.12 94%
PATH: 26-38-53-13-17-19COUNT: 130 DELAY:1690.02 6%
PATH: 26-38-26-19COUNT: 4 DELAY: 567.20LOOP 0%
PERCENTAGE OF LOOPING PACKETS 0.19%
AVERAGE PATH LENGTH 1 .25 HOPS
SOURCE: 17 COUNT: 2536 DELAY: 86.24 MS.
PATH: 17-19COUNT: 2533 DELAY: 85.89 100%
, PATH: 17-13-53-38-26-19COUNT: 3 DELAY: 382.40 0%
1 PERCENTAGE OF LOOPING PACKETS = 0.00%Ii AVERAGE PATH LENGTH 1.00 HOPS
I - 157 -

Report No. 4088 Bolt Beranek and Newman mnc.
SOURCE: 53 COUNT: 3878 DELAY: 555.83 MS.
PATH: 53-38-26-19COUNT: 2630 DELAY: 471.59 68%
PATH: 53-13-17-19COUNT: 1225 DELAY: 729.06 32%
PATH: 53-13-53-38-26-19COUNT: 17 DELAY:1049.27LOOP 0%
PATH: 53-38-53-13-17-19COUNT: 6 DELAY: 718.40LOOP 0%
PERCENTAGE OF LOOPING PACKETS = 0.59%AVERAGE PATH LENGTH 3.01 HOPS
\
S- ~158 -

Report No. 4088 Bolt Beranek and Newman Inc.
SOURCE: 38 COUNT: 1471 DELAY: 515.56 MS.
PATH: 38-53-13-17-19COUNT: 286 DELAY:1387.12 19%
PATH: 38-26-19COUNT: 1178 DELAY: 297.89 80%
PATH: 38-26-38--53-13-17-19COUNT: 2 DELAY: 373.60LOOP 0%
PATH: 38-53-38-26-191 i COUNT: DELAY:1793.07LOOP 0%
PATH: 38-53-13-53-38-26-19COUNT: 2 DELAY:2315.20LOOP 0%
PERCENTAGE OF LOOPING PACKETS = 0.48%AVERAGE PATH LENGTH 2.40 HOPS
I1.
(I
*1
II) -159

Report No. 4088 Bolt Beranek and Newman Inc.
APPENDIX 5 -- MODERATE LOAD TESTS
This appendix contains the results of two experiments, one
performed on 3/1/79 and the second performed on 12/21/78.
a) For this experiment, nodes 38, 26, 13, and 17 each sent 20
packets per second to node 19. Each packet contained 1112 bits.
Only the data from nodes 38 and 17 are shown here. During this
experiment, the line between nodes 13 and 62 was removed from
operation. The network is pictured in Figure A4-1.
SOURCE: 17 COUNT: 2437 DELAY: 35.60 MS.
PATH: 17-19COUNT: 2437 DELAY: 35.60 too%
PERCENTAGE OF LOOPING PACKETS = 0.00%AVERAGE PATH LENGTH = 1.00 HOPS
SOURCE: 38 COUNT: 2481 DELAY: 55.50 MS.
PATH: 38-26-19COUNT: 2481 DELAY: 55.50 100%
Sk,
PERCENTAGE OF LOOPING PACKETS = 0.00%SAVERAGE PATH LENGTH 2.00 HOPS
TOTAL MESSAGES FROM ALL SOURCES 4919PERCENT LOOPING PACKETS 0.00%
-160-

I Report No. 4088 Bolt Beranek and Newman Inc.
Ii
b) For this experiment, each of nodes 2, 16, 21, 34, 45, and 51tsent approximately 2.5 packets per second to node 15. Each packet
contained 1192 bits.
SOURCE: 2 COUNT: 937 DELAY: 45.52 MS.
I •PATH: 2-51-16-15COUNT: 937 DELAY: 45.52 100%
PERCENTAGE OF LOOPING PACKETS = 0.00%AVERAGE PATH LENGTH = 3.00 HOPS
SOURCE: 16 COUNT: 949 DELAY: 7.13 MS.
PATH: 16-15COUNT: 949 DELAY: 7.13 100%
PERCENTAGE OF LOOPING PACKETS = 0.00%AVERAGE PATH LENGTH = 1.00 HOPS
L SOURCE: 21 COUNT: 937 DELAY: 73.77 MS.
r L PATH: 21- 2-51-16-15COUNT: 453 DELAY: 71.27 48%
PATH: 21-34-45-15P NCOUNT: 484 DELAY: 76.12 52%
PERCENTAGE OF LOOPING PACKETS = 0.00%AVERAGE PATH LENGTH 3.48 HOPS
I - 161 -

Report No. 4088 Bolt Beranek and Newman Inc.
SOURCE: 34 COUNT: 938 DELAY: 48.94 MS.
PATH: 34-45-15COUNT: 938 DELAY: 48.94 100%
PERCENTAGE OF LOOPING PACKETS = 0.00%AVERAGE PATH LENGT" = 2.00 HOPS
SOURCE: 45 COUNT: 945 DELAY: 23.27 MS.
PATH: 45-15COUNT: 945 DELAY: 23.27 100%
PERCENTAGE OF LOOPING PACKETS = 0.00%! AVERAGE PATH LENGTH = 1.00 HOPS
SOURCE: 51 COUNT: 941 DELAY: 33.66 MS.
PATH: 51-16-15COUNT: 941 DELAY: 33.66 100%
I- PERCENTAGE OF LOOPING PACKETS = 0.00%AVERAGE PATH LENGTH 2.00 HOPS
TOTAL MESSAGES FROM ALL SOURCES 5647PERCENT LOOPING PACKETS 0.00%
k16
1~- 162 -