Embed Size (px)
Citation preview

Armenia Power Sector Policy Note
December 2014
THE WORLD BANK
Pub
lic D
iscl
osur
e A
utho
rized
Pub
lic D
iscl
osur
e A
utho
rized
Pub
lic D
iscl
osur
e A
utho
rized
Pub
lic D
iscl
osur
e A
utho
rized

Armenia Power Sector Policy Note
Artur Kochnakyan
Brendan Larkin-Connolly
Denzel Hankinson
Ani Balabanyan
Matteo Morgandi
Anne Olivier
2

Armenia Power Sector Policy Note
3
©2014 The International Bank for Reconstruction and Development / The World Bank 1818 H Street NW Washington DC 20433 Telephone: 202-473-1000 Internet: www.worldbank.org All rights reserved This report is a product of the staff of the International Bank for Reconstruction and Development / The World Bank. The findings, interpretations, and conclusions expressed in this volume do not necessarily reflect the views of the Executive Directors of The World Bank or the governments they represent. The World Bank does not guarantee the accuracy of the data included in this work. The boundaries, colors, denominations and other information shown on any map in this work do not imply any judgment on the part of the World Bank concerning the legal status of any territory or the endorsement or acceptance of such boundaries. Rights and Permissions The material in this report is copyrighted. Copying and/or transmitting portions or all of this work without permission may be a violation of applicable law. The International Bank for Reconstruction and Development / The World Bank encourages dissemination of its work and will normally grant permission to reproduce portions of the work promptly. For permission to photocopy or reprint any part of this work, please send a request with complete information to the Copyright Clearance Centre Inc., 222 Rosewood Drive, Danvers, MA 01923, USA; telephone: 978-750-8400; fax: 202-522-2422; e-mail: [email protected].

Foreword
This presentation was prepared as part of the World Bank’s Power Sector Policy Note for Armenia (the Note).
The objectives of the Note is to inform the Government’s policy thinking by identifying the principal challenges that the power sector faces and outlining solutions for overcoming them. The Note also discusses some broader energy sector issues related to the gas tariff structure and demand.
The Note will also be disseminated to increase understanding and awareness among key stakeholders and the general public on the key challenges facing the power sector and the potential solutions for overcoming them. This will help to promote improved dialogue and collaboration between the Government and the other key stakeholders.
The Note was prepared based on the data generated by the relevant energy companies in Armenia, the Public Service Regulatory Commission, the World Bank internal data bases, and discussions with the Ministry of Energy and Natural Resources and Power System Operator.
4

Synopsis of Main Challenges and Solutions
Highest-cost and dilapidated Hrazdan TPP will need to run post 2016 to avoid supply gap because new lower cost CCGT cannot be realistically constructed earlier than 2020.
Several transmission assets are a threat to supply reliability. Many transmission lines and substations incur high outage rates, which could lead to system-wide failure.
Affordability is a growing concern. Climbing energy costs increased the share of household energy expenses to 10%. It will get worse as the much needed new investments are made.
Deterioration of governance and financial standing of state power companies. In recent years tariffs were frequently lagging cost-recovery, the financial management decisions were not always prudent, and a key generation asset was sold through a direct negotiated sale.
In order to address the above challenges the Government needs to:
Add new generation: Immediately focus public and private financial and implementation capacity on a new gas-fired generation unit of around 500 MW.
Revise tariff structure: Remove perverse tariff incentives that are accelerating winter electricity consumption and unnecessary gas consumption by public facilities and commercial establishments.
Rehabilitate key transmission assets: Rehabilitate key substation and transmission lines critical for system-wide reliability of power supply.
Implement financial recovery plan: Design and implement financial recovery plan for state-owned power companies, including consistent application of cost recovery tariffs.
Protect the poor: Top up social assistance program to make basic level of consumption affordable
5

Table of Contents
• Power Sector Structure
• Synopsis of Challenges and Solutions
• Principal Challenges and Solutions
Supply Adequacy
Supply Security
Affordability
Governance
• Annexes
6
7
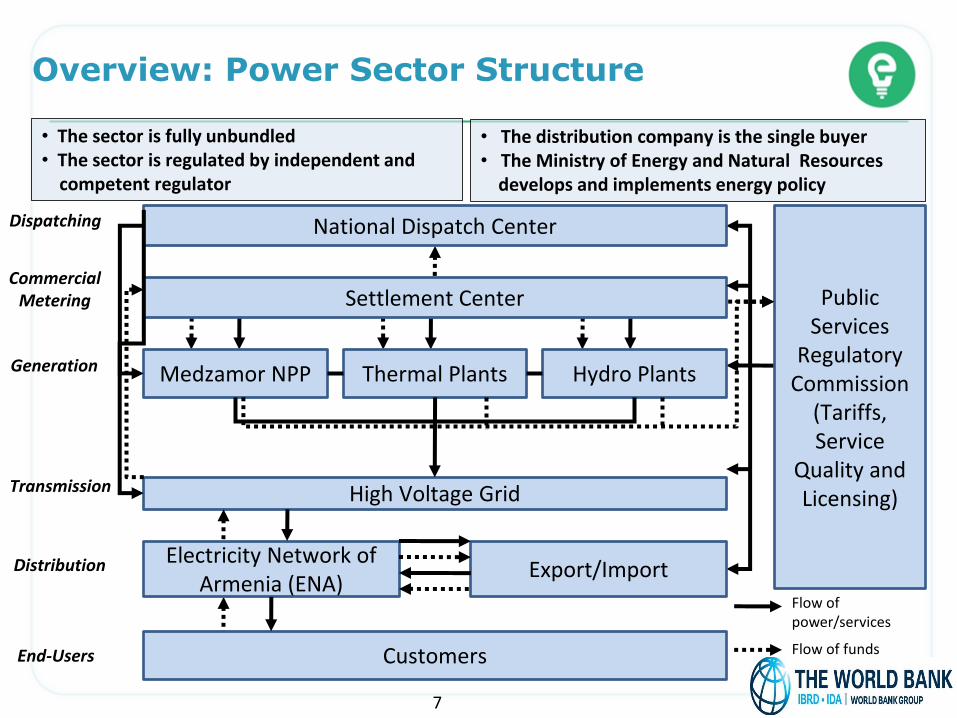
Overview: Power Sector Structure
Medzamor NPP Thermal Plants Hydro Plants
High Voltage Grid
Electricity Network of Armenia (ENA)
Customers
Public Services
Regulatory Commission
(Tariffs, Service
Quality and Licensing)
Generation
Transmission
Distribution
End-Users
• The sector is fully unbundled • The sector is regulated by independent and competent regulator
Export/Import
Settlement Center
National Dispatch Center
Commercial Metering
Dispatching
Flow of power/services
Flow of funds
• The distribution company is the single buyer • The Ministry of Energy and Natural Resources develops and implements energy policy

Build new capacity
Financing options study, feasibility study and ESIA for a new Combined
Cycle Gas Turbine station
Introduce marginal cost based tariffs
Improve tariff structure
Study on energy efficiency potential
Scale up energy efficiency Solutions
Key Next Steps
8
Develop Loriberd and Shnogh
Study on gas tariff structure
Challenges
Generation capacity to meet forecast electricity demand
Suboptimal electricity and gas tariff structures

Challenge #1: Supply Adequacy
To avoid supply gap, highest-cost Hrazdan TPP will need to run until new capacity is built
550 MW Yerevan TPP is retired
Only 50% of 800 MW Hrazdan TPP is available to meet winter peaks
Only 45% of hydro capacity is available to meet winter peaks
All units of Hrazdan TPP will be past their operating lives by 2016
Supply reliability may be jeopardized given disrepair and obsolescence of Hrazdan TPP
Hrazdan TPP uses 40% more gas per 1 kWH compared to a new CCGT
Obsolete and expensive Hrazdan TPP may need to be run until 2020 to avoid supply gap
9
2014
Hrazdan-5 40.1
Yerevan CCGT 34.9
Hrazdan TPP 60.0
Sevan-Hrazdan 8.6
Vorotan 9.4
ANPP 13.7
Small HPPs 25.3
Generation tariffs, VAT inclusive (AMD/kWh)
Effective from August 1, 2014

Challenge #1: Supply Adequacy
Current electricity tariff structure promotes over-consumption in winter, contributing to high peak
Deviations from Marginal Cost Based Pricing Principles: Seasonality. No seasonal tariff, although winter marginal costs are significantly higher than summer.
Time of use. Differential between peak and off-peak, or day and night, tariffs does not reflect the difference in the marginal cost of service.
Fixed charges. No fixed component in the monthly bill despite significant customer-related (and demand-related) costs of service, which are not driven by kWh consumed.
Voltage levels. Allocation of revenue requirement to different customer classes does not reflect differences in the marginal cost of serving different voltage levels.
10

Current gas tariff structure promotes inefficient consumption
– Volume-based tariff encourages high consumption Small volume consumers pay more (156 AMD/m3) than large volume
consumers (~ 114 AMD/m3) for all units consumed Perverse incentive for customers near the edge of the first block (hospitals,
schools, SMEs) to over-consume to obtain the low wholesale price. Several public facilities are not interested in the WB/GEF Energy Efficiency Project given such tariff structure.
– Single-part tariff discourages utility from measures that reduce consumption (no fixed monthly charge and variable energy tariff)
Challenge #1: Supply Adequacy
11

Solutions: Supply Adequacy: Supply Plans Analyzed
A mix of nuclear, natural gas, and renewable energy supply plans were analyzed
VVER has net capacity of 1000 MW Renewable energy (RE) capacity is based on GoA targets for penetration of RE Under each scenario EE savings are assumed to grow by 5 MW per hour each year from 2015 to 2024,
reaching 50 MW per hour in savings by 2024 260 MW of existing Small HPP capacity assumed for all scenarios
Supply Plan Summary
Gas All capacity needs met by new gas plants
Gas + RE Gas plants + 141 MW Loriberd and Shnogh HPPs by 2023 + 540 MW in PV, wind, geothermal by 2030
Large NPP Large NPP (VVER-440) by 2026, with any additional capacity needs met by new gas plants
Large NPP + RE Large NPP + 141 MW Loriberd and Shnogh HPPs by 2023 + 540 MW in PV, wind, geothermal by 2030
12

Solutions: Supply Adequacy: Least Cost Plan (LCP) And Demand Sensitivity
“Gas” is the LCP under the Base-case “Gas” remains the LCP under Low and High power demand scenarios
Long-Run Average Incremental Cost (LRAIC) by Demand Scenario
Supply Plan
Economic NPV (in Million US$)
Base Demand
Low Demand
High Demand
Gas 1,728 1,374 2,123
Gas + RE 2,500 2,297 2,793
Large NPP 3,341 3,015 3,639
Large NPP + RE
4,271 4,134 4,674
13
“Large NPP” is more expensive under Base-case demand given high capital cost and over-capacity
Base-case: Base-case power demand, base-case gas prices based on the formula for pricing of Russian gas imports , and current volume of swap with Iran
“Large NPP” is less expensive under High-case demand
Supply plans with “RE” are more expensive given that most of the RE projects considered have high capital costs and low capacity factors

Solutions: Supply Adequacy: Sensitivity Analysis of LCP
“Gas” is the LCP even in case of High gas prices
LRAIC of Supply Plans under Various Gas Prices
14
Real tariff (US$) 2014 2015 2016 2017 2018 2020 2022 2024 2026 2028 2030 Large consumers (Base-case) $/tcm 239 241 249 258 268 287 308 331 353 370 387 Large consumers (High-case) $/tcm 239 241 254 267 282 313 341 372 401 424 447 Large consumers (Low-case) $/tcm 239 240 244 249 253 262 276 292 312 333 356
LCP is more sensitive to gas price changes given that it is comprised of gas plants only. Other scenarios are
less sensitive given RE and Large NPP
Wholesale gas prices in Orenburg region* will have the largest impact on Armenian gas costs for power sector given the import gas pricing for Armenia
• Wholesale gas price scenarios are based on “Forecast of Social-Economic Development of Russia until 2030” released by Russia’s Ministry of Economic Development;
• Current Gas Purchase Agreement with Russia is assumed to be extended post-2019 with the same pricing formula
∆P(imports) = 0.65 x ∆P(Orenburg price) + 0.35 x ∆US-CPI

Solutions: Supply Adequacy: Renewables
Shongh and Loriberd HPPs should be part of LCP Geothermal may be be part of LCP if >250o resource is found
* For 5 sites for which information is available
Technology Unrealized potential (MW)
Generation (GWh/yr)
Distributed solar PV 1,300 1,800
Concentrating solar power (CSP) 1,200 2,400
Utility scale solar PV 830 – 1,200a 1,700 – 2,100a
Wind 300 650
Geothermal power* at least 150 at least 1,100
Small hydropower 100 340
Shnogh HPP 75 300
Loriberd HPP 66 205
Biomass 30 230
Biogas 5 30
Landfill gas 2 20
Loriberd can be developed as peaking plant adding 66 MW of firm capacity Geothermal is low-cost base load unlike several other RE technologies
15
LEC of Renewable Energy

Total pipeline capacity is sufficient to supply all of the gas required for LCP, however, LCP will be feasible only if Armenia imports more gas from Iran
Solutions: Supply Adequacy: Gas Pipeline Capacity
Combined capacity of North-South and Armenia-Iran pipelines
16
Cu
rre
nt
Imp
ort
s fr
om
Ir
an a
nd
Ru
ssia
Capacity of North-South pipeline
No spare capacity on North-South pipeline in 2025 if imports from Iran are not increased
Currently Armenia receives only 0.4 bcm of gas from Iran under the swap deal whereas the capacity of the Iran-Armenia pipeline is 2.3 bcm/year

Medium NPP may have a cost between LCP and Large NPP
Solutions: Supply Adequacy: Nuclear Portfolios
Medium NPP may have small or no surplus capacity, thus, lower energy cost compared to Large NPP
Medium NPP may have lower per kW capital cost. Even with the same per kW capital cost as Large NPP, it will still be lower cost due to smaller or no capacity surplus
Medium NPP may be a lower cost compared to Large NPP
17
Long-Run Average Incremental Cost by Demand Scenario
Detailed feasibility study will be required to assess technical and economic viability of Medium NPP if the GoA decides to pursue it

Solutions: Supply Adequacy: New Plants Needed
Two new gas plants needed under LCP: 500 MW by 2020 and 500 MW by 2026 One new plant is needed by 2020 under all other supply plans
1st 500 MW Gas Plant 2nd 500 MW Gas Plant
Capacity to meet
Peak: LCP w/ Base Case
Demand
Assumptions: ANPP off-line in 2016 for
rehab, on-line again in 2017, retired in 2026
Reserve margin (RM) = 300 MW
Capacity factor of HPPs based on actual supply during 2013 peak
18
Gas + RE: 345 MW plant by 2020 Large NPP: 500 MW plant by 2020 Large NPP + RE: 345 MW plant by 2020

Solutions: Supply Adequacy: Construction of New CCGT
To commission a new gas-fired CCGT by 2020, the GoA needs to start the project now
For the new gas-fired CCGT to be on-line by 2020, the GoA will need to stick to below schedule:
Key Steps Duration Schedule *
Decide on financing option 6 months February 2015
Select a Consultant for a feasibility study, ESIA and preparation of bidding documents
7 months March 2015
Complete the feasibility study and preparation of bidding documents
12 months March 2016
Complete financial structuring and construction 44 months November 2019
Test and commission the CCGT 2 months January 2020
19
* The schedule assumes project preparation activities start in September 2014

Solutions: Supply Adequacy: Financing New Investments
LCP can be financed entirely with public debt, however…
60% - Legal limit of debt/previous year GDP
All RE projects are planned as private and not included in calculation of public debt impact
Supply Scenario Capital cost (billion $)
Gas 1.2
Gas + RE 2.3
Large NPP 6.1
Large NPP + RE 7.3
Entirely public financing is not a sustainable strategy given large needs in other sectors New CCGTs, Loriberd and Shnogh HPPs, and other RE are good candidates for PPPs
The public debt assumed for “Gas + RE” or Large NPP supply
plans will breach the limit
20

Energy efficiency can help meeting forecast power demand in a least-cost way
Solutions: Supply Adequacy: Energy Efficiency
Type of Facility Energy Savings
(%)
Payback period
(years)
Schools 51-52% 6
Hospitals 51% 5
Street Lighting 45-53% 4-5
Other facilities 41% 5
Cost of electricity savings = AMD 19/kWh or 40% of unit cost under LCP
Actual energy savings achieved under WB/GEF project
Key next steps :
Conduct a comprehensive study to estimate economically and financially viable energy efficiency potential in the country. There are no reliable estimates of sectoral energy efficiency potential
Adopt two-part seasonal and improved time-of-day electricity tariff structure
Eliminate structural flaws in the gas tariff, which create a perverse incentive for some end-users to increase gas consumption to lower bills
Mandate energy efficiency in new construction projects and all facility renovations programs financed by the Government and donors.
Provide capital grants to the poor for energy efficiency retrofits
21

Solutions: Supply Adequacy: Improve Tariff Structure
Two part tariff structure reflects the fact that many costs are not linked to kWh sold:
Per kWh tariff reflects energy and capacity costs
Fixed monthly charge reflects customer-related costs.
Per kWh tariff differentiated by season and time-of-use
Introduce marginal cost based electricity tariff to reduce the need for new supply
Per kWh charge is differentiated by season and time-of-use to better reflect how incremental costs are incurred:
Winter Peak: 8:01 PM -12:00 AM, Sep – Feb
Winter Off-peak: 12:01 AM - 8:00 AM, Sep- Feb
Summer Peak: 8:01 PM - 12:00 AM, Mar - Aug
Summer Off-peak: 12:01 AM - 8:00 AM, Mar – Aug
Conduct a study to determine:
Marginal cost of supply to each category of consumers
Allocate revenue requirement among classes according to marginal costs
Electricity
Gas
22
Two-part seasonal tariff with improved time-of-day bands may reduce peaks and need for new generation

Regional Trade: Short-Term
Limited regional connectivity and short-term trade opportunities
23
Export potential is limited in the short-term Excess short-term summer capacity and fully depreciated generation assets may make summer exports
attractive, however, Exports to Turkey are not possible given unresolved political issues Georgia does not require energy in summer No relationship with Azerbaijan, which could have imported summer energy depending on its gas price
policy for the energy sector Summer energy surplus in Armenia will significantly reduce as gas-for-electricity swap expands with Iran
Short-term average costs (US$/kWh)*
Current export tariffs (US$/kWh)**
Armenia 0.056 No exports
Georgia 0.020 0.020-0.030***
Azerbaijan 0.030 0.040-0.045
Turkey 0.090 -
Iran 0.050 -
In the short-term, winter exports are not feasible given:
Expensive gas-fired generation cannot compete with thermal exports from Azerbaijan
Imports are not realistic given capacity balances in neighboring countries and political issues
One 220 kV and two 110 kV lines with Georgia allow for trading (up to 400 MW) in island operation. However, trading has decreased almost to zero in 2011-2013
Two 220 kV lines with Iran allow for significant trading (around 400 MW). Trading primarily occurs under the electricity-for-gas swap deal
* Bank team estimate; ** Platt’s energy and national public sources; *** Such export tariffs are possible because summer HPP generation costs are below $0.01/kWh

Regional Trade: Long-Term
Limited long-term export opportunities
24
In the long-term, summer and winter exports are not likely to be competitive because: • No excess capacity at existing hydropower plants due to increase in domestic demand • Absence of large low-cost untapped hydropower potential • New gas or nuclear capacity is not likely to be cost-competitive for exports
LRAIC
(US$/kWh)*
Armenia 0.12-0.17
Georgia 0.07-0.08
Azerbaijan 0.04-0.13
Turkey 0.09-0.13
Iran 0.06-0.12
Notes: The LRAICs will largely depend: Georgia: Large HPPs developed and import prices of gas; Azerbaijan: Price of gas for the power sector; Iran: Price of gas for the power sector; Armenia: Gas or new NPP to meet long-term forecast demand
Ongoing and planned regional interconnection projects: $140 million 400 kV line from Hrazdan TPP to Iran (2017). This 1000 MW line
may be used to expand the swap, which is very beneficial for Armenia under current terms
$150 million 400 kV line to Georgia (2020). The Government needs to carefully assess the economic rationale for the project because:
No power trade with Georgia even with existing 220 kV line Limited opportunities for long-term power exports through Georgia: - Georgia has cheap hydropower surplus itself - Georgian transmission interconnections are not sufficient to wheel Armenian power Transit of Georgian power to Iran through 400 kV line to Iran may be considered
* Bank team estimates

Dilapidated critical substations
Challenges
Prioritize investments
Secure financing for rehabilitation of critical transmission lines and
substations
Rehabilitate existing assets
Adopt “Risk Index” for prioritization of transmission investments
Solutions
Key Next Steps
25
Dilapidated critical power transmission lines

Challenge #2: Supply Security
Outages per transmission line 2.5 times higher than the average for well-performing utilities*
26
* An average of a number of US and European utilities

Challenge #2: Supply Security
1. Poor condition of several critical transmission assets due to age (>45 years) and absence of investments in:
- Substations used to evacuate power from large generators (e.g. substation of ANPP)
- Critical power transmission lines evacuating power from large generators (e.g. Echmiadsin 110 kV OTLs from ANPP)
2. Economic costs of bottlenecks include:
- Suboptimal dispatch: Additional cost incurred due to the failure of a transmission asset that forces generation resources to be dispatched in a sub-optimal way
- Emergency repairs: Additional costs incurred by the need for unplanned emergency repairs and replacements when assets unexpectedly fail.
3. Lack of formal methodology for prioritizing transmission investments leads to: (a) ad-hoc decision-making on investments, and (b) difficulty to secure much needed investments
Poor condition of critical power transmission assets jeopardizes supply security HVEN does not have a methodology for prioritizing transmission investments
27

Solutions: Supply Reliability: Prioritization of Investments
• Long-term: Full scale risk assessment based on detailed, component-level information on condition of each asset in the system. Major engineering undertaking.
• Short-term: Basic risk assessment based on available data. A “Risk Index” can be created based on assessment of:
Consquences of Failure (CoF): a higher score means a greater impact on end-users
Probability of Failure (PoF): a higher score means higher probability of failure, based on asset-specific information about:
‐ The age of the asset relative to its useful life
‐ The number of outages experience by that asset over the past five years, and
‐ The duration of outages experienced by that asset over the past five year
Develop/adopt a methodology for prioritizing transmission investments
28

Solutions: Supply Reliability: Risk Index
Risk Index (RI) can be adapted to available data to prioritize investments
The Risk Index is calculated as the estimated product of the Probability of Failure (POF) and Consequences of Failure (CoF): 1. PoF is computed by scoring each asset on the average of three metrics:
− % of life remaining − Number of outages in 2008-2013 − Duration of outages in 2008-2013
2. COF is a quantitative measure of the consequences of an asset’s failure for the system
CoF x PoF = Risk Index
Asset Category Score
Substations at generators 5
Primary lines from generators
4
Secondary lines from generators
3
Other 220 kV lines or substations
2
Other 110 kV lines or substations
1
% of remaining life
Score
<20% 5
21-40% 4
41-60% 3
61-80% 2
>80% 1
# of outages Score
51+ 5
31-50 4
11-30 3
1-10 2
0 1
Duration of outages (minutes)
Score
1,441+ 5
61-1,440 4
11-60 3
1-10 2
0 1
29

Solutions: Supply Reliability:110 kV Lines
7 lines have high rehab priority with total investment cost of $16 million Those lines serve generation units with a failure likely to cause system wide outages
Line Priority Rank Length (km) Cost Financing Status
Sevan 2 10 $1.0 Not secured
Echmiadsin 3 24 $3.3 Not secured
Shahumyan-2 5 33 $3.0 Not secured
Karmir-2 6 10 $0.7 Not secured
Bjni 7 25 $3.8 Not secured
Shahumyan-1 7 14 $3.0 Not secured
Karmir-1 12 10 $1.0 Not secured
TOTAL 126 $16
Echmiadsin and Shahumyan-2 lines are critical for reliability and safety of ANPP
Bjni and Shahumyan-1 also serve ANPP
30

Solutions: Supply Reliability: Transmission Substations
Substation at ANPP has the highest rehab ($20 million) priority given that a failure can cause ANPP safety issues and loss of load
Substation Priority Rank
kV Financing Status
Metsamor 1 110/220 Not secured
Yerevan TPP/CCGT
1 110/220 ETNIP
Haghtanak 4 220 ESRP AF
Lichk 8 220 PTRP
Shahumyan-2 8 220 PTRP
Vanadzor-1 8 220 ETNIP
Eghegnadzor 8 220 PTRP
Shinuhayr 8 220 PTRP
No rehabilitation at Metsamor
substation since 1977
Yerevan TPP currently
relies on only 110 kV part of substation to
connect to transmission
grid
Substation Priority Rank
kV Financing Status
Zovuny 10 220 PTRP
Marash 10 220 PTRP
Charentsavan 10 220 ESRP AF
Ararat-2 10 220 PTRP
Ashnak 10 220 PTRP
Agarak-2 13 220 PTRP
ETNIP - Electricity Transmission Network Improvement Project (WB) ESRP AF - Additional Financing for Electricity Supply Reliability Project (WB) PTRP – Power Transmission Rehabilitation Project (ADB)
Armenia does not have operational back-up dispatch center for emergency situations
31

Increasing electricity and gas tariffs
Challenge
Provide targeted assistance through PFBP
Decide on power and gas subsidy option
Improve targeting through better proxy-means testing
Solutions
Key Next Steps
32
Scale up energy efficiency in residential sector

Challenge #3: Affordability
*Energy/electricity poverty refer to households spending more than 10% of their budgets on energy or electricity.
Energy spending as % of total is estimated at 10% – a level considered to be energy poverty 2013 increase of gas and electricity tariffs is estimated to have increased poverty by 3%
Energy expense share increase was highest for the poor – 13.6% Without gas subsidy provided by the Government since 2011, the increase of the energy share of expenditure for the poor would have been 15.7%
Since April 2011, families registered in PFBP with poverty score above zero paid a reduced tariff of AMD100/m3 for first 300 m3 of consumption
33

Challenge #3: Affordability
Share of gas-based heating is reducing, while wood-based heating is increasing
- Gas based heating may reduce further given significant gas tariff increase in 2013 - Electricity based heating cannot substitute gas given it is 2x more expensive - Increased use of wood for heating has long-term negative consequences for: (a) Public health given higher likelihood of poisonings and accidents with custom-made heaters (a) Forests covering only 9% of Armenia’s territory
34

Challenge #3: Affordability: Results of Qualitative Survey
Poor families struggle to ensure adequate heating
- FBP recipients reported substituting gas with wood so to avoid consuming >300 m3 -threshold for FBP eligibility. The costs of energy use for these households may be underestimated if wood costs are not considered.
- FBP recipients reported using the total amount of assistance on energy during the heating season.
- Poor households reported cutting down on expenses for healthcare and children’s education to cope with energy price increases. Some also report burning old furniture and clothing when they cannot afford wood.
- Manure is a last resort source of energy that is increasingly used in rural areas.
- Poor households reported that they could no longer reduce their energy use without major impact on their health
35
Results of a qualitative heating survey conducted during 2013/2014 heating seasons suggest that:

Challenge #3: Affordability
Large tariff increases will be needed: In 2016, because highest-cost Hrazdan TPP will need to be run to replace ANPP for a year In 2020, under all supply plans given the cost of new gas CCGT In 2026, under all supply plans given the cost of new generation
2013 average tariff
36
Residential tariffs will be the lowest under Least-Cost Plan
(LCP)
Note: All tariffs are in 2013 prices Note: Tariffs were computed using marginal cost based methodology; swap with Iran was included in the forecast of tariffs

Challenge #3: Affordability
LCP will have the lowest impact on poverty
In 2016, tariffs will increase poverty by 2.8% under all investment
scenarios given that expensive Hrazdan TPP will need to replace
ANPP for a year
However, in 2026, LCP (Gas) will increase poverty only by 0.7%,
whereas “Large NPP+RE” by 3.2%
Note: Tariffs were calculated assuming commercial financing for all investments given that public financing is not realistic from public debt sustainability perspective Note: Impacts of all other scenarios fall in between “Gas” (LCP) and “Large NPP + RE” (highest-cost)
37

Solutions: Affordability: Trade-Offs Involved
Coverage, targeting and fiscal trade-offs are involved when selecting subsidy delivery mechanism
Advantages Disadvantages
Lifeline tariff through existing PFBP
• Fairly good targeting (53% of beneficiary households are poor)
• Low administrative costs • Public perception of specific
measure to protect the poor
• Limited coverage - only 16% of poor and 10% of population
• No incentives for energy efficiency and conservation
• No rationale to deliver the benefit through bill in case of electricity,
Additional cash benefit to recipients of PFBP
• No additional administrative costs • More efficient than in-kind subsidy
of electricity
• Limited coverage of poor (16%) • Increased horizontal disparity between
covered and non-covered poor by PFBP • May be perceived as a benefit increase,
not energy-specific (needs appropriate communication)
Cash transfer to all in database with score >0
Broader coverage than PFBP (14% of population in 2012)
• Unknown targeting performance, likely worse than PFBP
38

Solutions: Affordability: Overview of Options
Affordability for the poor will depend on methodology for quantifying the benefit
Objective Description Annual cost per adult-equivalent
Average annual benefit
Option 1. Mitigation of each tariff increase (2013 used in analyses)
Benefit is calculated to allow households to maintain same level of consumption despite price increase. Does not attempt to mitigate existing energy deprivation
5,880 AMD (2,880 gas & 3,000 elect)
19,400 AMD (9,500 elect + 9,900 gas) (5% of mean annual FBP transfer)
Option 2. Closing gap in consumption between Q1 and Q2
Amount needed to close the gap between the median spending on energy of 2nd lowest and the lowest quintile, assuming Q2 is not as energy deprived
10,000 AMD (5,000 gas & 3,000 elect)
32,600 AMD (9,900 elec. + 22,700 gas) (9% of mean annual PFBP transfer)
Option 3. Meeting minimum energy needs
Benefit is calculated depending on number of household residents, size of house, region, etc.
Requires further research into standardized levels of energy consumption
39

Solutions: Affordability: Short-term Options & Fiscal Costs
With existing targeting mechanism only 16-25% of the poor may be covered at an annual cost of 0.05%-0.08% of annual GDP
Option 1 (tariff impact mitigation) & Option 2 (closing gap between Q1 and Q2) would cost the same for electricity, but Option 2 would be more costly for gas.
0.03%
0.04%
0.05%
0.01%
0.02% 0.02%
0.02% 0.02%
0.00%
0.01%
0.02%
0.03%
0.04%
0.05%
0.06%
0%
5%
10%
15%
20%
25%
30%
Targeted gaslifeline tariff
Cash to FBPbeneficiary
Cash to allreg, score >0
Targeted gaslifeline tariff
Cash to FBPbeneficiary
Cash to allreg, score >0
Cash to FBPbeneficiary
Cash to allreg, score >0
Gas (option 1) Gas (option 2) Electricity (option 1 or 2)
% o
f 2
01
2 G
DP
% o
f th
e p
oo
r co
vere
d
Coverage and expenditure of compensation with Options 1 and 2
40

Solutions: Affordability: Medium-term Compensation Options & Fiscal Costs
Broadening coverage to more households will require an updated targeting system
Improving targeting will require: - A new Proxy Means Testing (PMT) formula that uses information on household
composition and characteristics, traceable expenditure and incomes, to derive a probability of households being at specific income threshold
- Extensive piloting in welfare centers, and close monitoring during implementation
Targeting accuracy of improved PMT is higher
Covering 40% of poor with new PMT cost 0.09% of GDP, compared to 0.07% of GDP to cover 21% of the poor under existing targeting mechanism of PFBP
41

Challenges
Solutions
42
Public communication requires improvement
Tariffs frequently lagging cost-recovery
Consistently maintain tariffs at full cost-recovery levels
Sell power sector assets through competitive tenders
Improve communication of sector issues to key stakeholders and general public
Power sector assets sold through direct negotiations
Imprudent financial management of state power companies
Design and implement a financial recovery plan for state-owned power
companies

Challenge #4: Deteriorating Governance: Financial Mismanagement
The state-owned power companies are in financial distress: AMD24 billions of debts and
payables (27% of their total revenue)
43
The financial standing of state-owned power companies deteriorated due to: Low tariffs: The Government tried to mitigate the impact of gas price increases on end-user electricity tariffs by significantly reducing the O&M expenses and by virtually eliminating the profit and depreciation allowed in the tariffs. “Life support” to non-functional chemical plants: The Government used the funds of the state-owned power companies to finance salaries of the Nairit and Vanadzor chemical plants. The total
debt of those chemical plants to the power sector is estimated at AMD22 billion. Financing of the gas subsidy for the poor: The state power sector companies were mandated to finance the ADM1.1 billion gas life-line subsidy to the poor. Financing of non-core business assets: The power sector carries on its balance and pays for operation and capital renovation of a large center used for official government receptions.

Challenge #4: Deteriorating Governance: Tariffs
In recent years, tariffs were frequently lagging cost recovery
In 2009-2013, tariffs were lagging cost recovery because of:
0 or reduced depreciation and return on assets for state-owned companies (e.g. HVEN, Vorotan, Yerevan TPP)
Negligible contributions to ANPP decomissioning fund. Around $7 million is accumulated in ANPP
decommissioning fund whereas around $350 million* will be required starting from 2026
Reducing margin of the distribution company (Electric Networks of Armenia, ENA) due to: Significant unexpected increase of costs due to longer-than-usual periodic maintenance of ANPP
and the need to buy significantly more expensive replacement power from Hrazdan TPP; and Unchanged end-user tariffs. Reduction of the margin had negative financial implications for ENA and may jeopardize reliability of supply
:
ENA capital investments reduced from AMD 28 billion in 2009 to AMD 8 billion in 2012 ENA net profit margin reduced from 3.2% in 2010 to negative 9.2% in 2012
* USAID estimate, 2008
44
Tariffs (AMD/kWh), VAT inclusive 1-Apr-09 1-Oct-09 1-Apr-10 1-Apr-11 1-Apr-12 7-Jul-13 1-Aug-14 HVEN 1.1 0.4 0.9 1.0 0.4 1.3 1.6 Vorotan 1.7 1.2 2.2 5.3 5.7 9.5 9.4

Challenge #4: Deteriorating Governance: Sale of Vorotan and Financial Management
Direct negotiated sale of Vorotan hydropower cascade Imprudent financial management decisions at some state-owned companies
Sale of Vorotan could have been done through competitive process to maximize the benefits:
The GoA received $180 million for 404 MW Vorotan Cascade. This translates into $450,000/MW of installed capacity.
One of the GoA objectives was to attract private investments for much needed rehab. The Government had a Euro 50 million loan from KfW for rehab of Vorotan.
One of the GoA objectives was to attract experienced private operator to improve efficiency. The new private operator (Countour Global) is currently running two hydropower plants in Brazil with installed capacity of 40 MW.* Vorotan has been operated by a competent team without major incidents.
The GoA disclosed very limited information to the public
Imprudent financial management decisions at some state-owned companies:
HVEN took commercial loans that were lent to Vorotan Cascade and Yerevan TPP: There were several instances when HVEN assumed short-term commercial debt that was on-lent to Vorotan Cascade and Yerevan TPP because the latter could not borrow due to week balance sheets.
HVEN was used to implement a project that was not part of its core business: HVEN was used as the implementing entity for the construction of new gas pipeline to Iran and was penalized for US$5 million in 2012 for improper tax accounting of the gas pipeline project with significant impact on its financial standing.
Huge non-business related expenses: AMD 400 million payroll of Nairit financed by Vorotan Cascade
45
* Countour Global web-site, http://www.contourglobal.com/portfolio#, accessed on August 10, 2014

Challenge #4: Deteriorating Governance: Communication
Fragmented public disclosure and discussion of key power sector issues
Limited dialogue or openness to discuss sector specific problems with broader
stakeholders. Sufficient clarifications and information were not provided to the key stakeholders and general public on: (a) new gas agreements signed with Russia in December 2013; (b) sale of Vorotan Cascade; and (c) benefits for Armenia from electricity-gas swap deal with Iran.
Inefficient communication of the power tariff review decisions to the public. Recent electricity tariff increases resulted in false public understanding of the reasons for such increase.
Limited public support for power sector projects and reforms:
Growing, vocal and strong political and social opposition to justified tariff increases
Public skepticism of ongoing and new investments aimed at improvement of reliability and adequacy of power supply
46

Solutions: Governance: Financial Recovery Plan and Competitive Sales
Design and implement a financial recovery plan for state-owned power companies Privatize assets through open and transparent competitive tendering
Design and Implement a financial recovery plan for state-owned power:
Discontinue financing of chemical plants
Discontinue the practice of using state-owned power companies to finance the gas subsidy
Settle the inter-company debts through off-sets and write-offs
Divest non-core business assets
Ensure adequate revenue for sector companies to operate and invest in capital repair and adequate O&M to ensure reliable power supply
Consider open and transparent competitive tenders as the preferred approach for sale of energy assets because:
The legal and regulatory environment in the power sector is conducive for private investments
The GoA would maximize revenue from asset sales
The GoA would attract experienced operator(s)s that can improve management and efficiency
47

Solutions: Governance: Improved Communication
Improvement in communication can generate public support …
Key Pre-Conditions for Improved Communication:
Development of an action-oriented communication plan with consensus building objectives and goals, core messages and their positioning, key audience, the most appropriate channels in the public domain to ensure smooth implementation
Gradual public communication on the most critical issues of the sector, including long-term challenges of supply adequacy and related large investment needs, which will require tariff increases
48

49

Acronyms and Abbreviations
50
AMD Armenian Dram LCP Least Cost Plan
ANPP Armenian Nuclear Power Plant LRAIC Long-Run Average Incremental Cost
BCM Billion Cubic Meters MW Megawatt
CCGT Combined Cycle Gas Turbine NPP Nuclear Power Plant
CNP China Nuclear Power NPV Net Present Value
COF Consequence of Failure OTL Overhead Transmission Line
CPI Consumer Price Index POF Probability of Failure
EE Energy Efficiency PMT Proxy Means Testing
ENA Electric Networks of Armenia PV Photovoltaic
FBP Family Benefit Program RE Renewable Energy
GDP Gross Domestic Product RM Reserve Margin
GWh Gigawatt-hour ROR Run-of-River
HPP Hydropower plant TCM Thousand Cubic Meters
HVEN High Voltage Electric Networks TPP Thermal Power Plant
kV Kilovolt WWTP Waste Water Treatment Plant
kWh Kilowatt-hour

Annex 1: Government Objectives
Outlines the GoA’s strategic objectives
for economic growth, poverty reduction,
and national security
Identifies objectives and priorities in the
energy sector
Emphasizes the importance of
investing in infrastructure
Armenian Development Strategy (ADS): 2014-2025
Energy Sector Development Strategy (2005)
National Energy Security Concept (2013)
Objectives in the Energy Sector: i. uninterrupted supply of energy ii. satisfaction of basic needs of consumers: affordable prices,
reliable energy supply and energy efficiency iii. minimize economic effects of importing energy iv. safe operation of ANPP until it can be replaced with a new
NPP v. environmentally viable energy supply vi. creation of financially viable energy system vii. maintenance and further development of export oriented
and economically efficient power system.
51

2. Efficient use of own resources:
• Increase use of RE resources
• Promote EE
• Explore potential of bio fuels and other possible fuel alternatives
• Search for new fossil fuel deposits
• Diversify imports
3. Safe operation of ANPP & construction of a new NPP:
• Complete ANPP safety enhancement and maintain safe operation
• ANPP decommissioning Feasibility study, design works and commissioning of new ANPP unit
Annex 1: Government Objectives, Cont.
Action Plan of the MENR (2007)
Energy Sector Development Strategy
(2005)
National Program on Energy Saving and RE
(2007)
1. Development of energy security system:
• Identify energy security threats
• Improve institutional & legal foundations
• Gradual liberalization of energy markets
4. Diversification of energy supply & regional integration:
• Gas storage
• Develop oil reserves
• Armenia-Iran and Armenia-Georgia 400/500 kV transmission lines
• Integration into CIS energy market, regional power markets
National Energy Security Concept
(2013)
Policy direction & specific measures
5. Ensure financial sustainability and economic efficiency of sector
6. Ensure energy security in case of emergency situations or time of war
52

Annex 2: Overview: Power Sector
Load Profile (2013)
Generation (2013)
Installed Capacity (MW)
3500
Available Capacity – Summer (MW)
2600 (Higher summer capacity is due to larger
availability of hydro)
Available Capacity – Winter (MW)
1900
Consumption (2013)
Total Consumption (GWh) 5267
Summer Peak Demand (MW) 960
Winter Peak Demand (MW) 1520
2% average annual increase in domestic consumption in 2010-2013
* Adjusted for unusually cold winter of 2013
Electricity Consumption by Customer, 2008- 2013
53

Annex 2: Overview: Power and Gas Tariffs
Gas and electricity tariffs are at short-term cost-recovery level In 2010-2013, electricity and gas tariffs for residential customers in increased by 29%
- Gas tariffs increased due to increase of border price of imported gas from Russia - Electricity tariffs increased given that 30% of generation is gas-based
- Gas tariffs are differentiated by volume of consumption
Electricity tariffs Day Night
(AMD/kWh)
Residential 38 28
0.4 kV 38 28
6 (10) kV 35 25
35+ kV 29 25
- Electricity tariffs are differentiated by voltage levels and time-of-day
Gas tariffs (AMD or USD/cubic meter)
Small consumers (less than 10,000 m3/month
AMD 156
Large consumers (10,000 m3 per month and more)
$277 (AMD 114)
54

Annex 2: Overview: Gas-for-Electricity Swap with Iran
Since 2011, Armenia has been exporting electricity Iran in exchange for gas
Summary of the Agreement: Gas is imported through the Iran-Armenia gas
pipeline with annual capacity of 2.3 billion m3 (commissioned in 2011).
Electricity-for-Gas Swap Agreement targets to increase average annual amount of gas received to 2.3 bcm and electricity supplied – 6.9 billion kWh.
- Currently only 360 million m3 received annually in exchange for 1.2 billion kWh
- Full contractual quantities can be achieved after commissioning of 400 kV transmission line
Exchange rates for electricity supplied under the
Swap Agreement are differentiated by the time of the day:
- 12:01 AM – 8 AM: 6 kWh per 1m3
- 8:01 AM – 8 PM: 3 kWh per 1m3 - 8:01 PM – 12:00 AM: 1.5 kWh per 1m3
Yerevan CCGT is party to the Swap Agreement
Benefits for Armenia: Helps to reduce the cost of domestic supply: New efficient Yerevan CCGT and Hrazdan-
5 generate 4.5 kWh with 1m3 of gas - If electricity is supplied during day and
peak hours, then Armenia keeps 1.5-4.5 kWh of power as profit
- “Profit” power is sold in domestic market without fuel component in the tariff
Benefits for Iran:
Helps to reduce unmet demand in Northern regions
55

Annex 2: Overview: Gas Sector
In 2010-2013, domestic consumption recovered to pre-crisis levels Growth in domestic gas consumption driven by power sector
2008 2011 2013
Number of residential customers 490,000 580,000 626,000
Vertically integrated monopoly gas company 100% owned by the Russian Gazprom
- 2,000 km transmission pipeline
- 11,000 km distribution pipelines
- Installed gas storage capacity of around 190-195 mln m3 with current operational capacity of 127-130 mln m3
Import Pipeline Capacity (bcm/year)
North-South (gas from Russia) 3.65
Iranian pipeline (gas from Iran) 2.30
* Both pipelines owned by Gazprom
56

Annex 3: Electricity Demand Forecast Model
Econometric model derived to forecast electricity demand in Armenia Demand forecasts were produced for both residential and non-residential demand
1) Demand was estimated using a log-log model with the following functional form:
2) The models were fit using data for electricity demand (D), real GDP (Y), and real tariff price (P) for the 1996-2013
3) Assumptions on GDP and tariffs were fed into the models to produce demand estimates
GDP was based on ADS 2014-2025
For the first iteration of demand forecasts real prices were kept constant
For the second iteration, tariffs under the least cost plan were used
𝐿𝑛 𝐷 = 𝛽° + 𝛽1𝐿𝑛 𝑌 + 𝛽2𝐿𝑛 𝑃
Elasticity Estimate
Residential
Price -0.44
Income 0.30
Non-Residential
Price -0.17
Income 0.47
57
Low income elasticity of residential demand is due to 100% access rate and high saturation with household appliances. Low income elasticity of industrial demand is due structure of Armenian economy with forecast growth driven by knowledge intensive and non energy intensive industries (e.g. machinery, IT, software, diamond processing/polishing, tourism)

In 2014-2030, electricity demand is forecast to grow 1.6-3.2% per year
Annex 3: Electricity Demand Forecast
Note: (1) Base GDP growth set using forecasts from the Armenia Development Strategy (2014); low GDP growth is base case minus 2%; high GDP growth is base case plus 2%. (2) Forecast takes into account effects of increased tariffs under least cost plan.
0
2,000
4,000
6,000
8,000
10,000
GW
h
Low High Base
58

Russian gas import prices are expected to be more predictable than before
Gas Price Forecast assumptions: Gas price forecasts are based on the Orenburg wholesale gas price scenarios from the “Forecast of Social-Economic Development of Russia until 2030” released by Russia’s Ministry of Economic Development and Bank team assumptions on the US Urban Consumer Price Index (CPI-U)
Annex 3: Forecast of Gas Import Price
Under the new 2011 agreement, import price of Russian gas is linked to wholesale price in Russia’s Orenburg region and US Consumer Price Index and is adjusted annually
59

Annex 3: Gas Demand Forecast Model
Constant-elasticity demand function was assumed to derive gas demand forecast
1) Demand was estimated using the following linear functional form:
2) D=average rate of growth of demand between successive forecast periods, a=income elasticity; Y=growth of real GDP between successive forecast periods; b=price elasticity of demand; P=change of real gas prices between successive forecast periods
3) Assumptions on GDP and tariffs were fed into the models to produce demand estimates
GDP was based on ADS 2014-2025
Real tariff forecast was derived using forecast domestic price of Russia in Orenburg region and forecast US CPI-U (IMF)
D= a*Y + b*P
Category of Consumer Income Elasticity Price Elasticity
Residential 0.70 -0.25
Industrial and commercial 0.80 -0.10
Transport 0.50 -0.25
60

Annex 4: LCP Analyses: Methodology
1. A dispatch simulation was run for each supply plan under all demand scenarios to determine the annual kWh output of each plant.
2. Generation and emission costs for each supply plant were calculated:
Capital costs for each supply plan were calculated given the international prices
Variable O&M, fuel, and emission costs were calculated using the kWh output multiplied by plant specific characteristics (e.g. heat rate, non-fuel variable cost of generation).
Fixed O&M was assumed to equal the international benchmarks for each generation technology included in the supply plant
Emission costs
3. Economic NPV was calculated as the sum of the total cost of generation and emission costs for each supply plan over the planning period, discounted at 10%
61
Least-cost planning analyses followed the below methodology
Note: Long-run average incremental costs for each supply plan were computed as the ratio of the present value of incremental total costs and present value of all energy generated during the evaluation period

Annex 4: Key Assumptions for LCP Analyses
General Assumptions ANPP out for one year in 2016 for life-extension related work Hrazdan TPP run until new CCGT is on-line Vorotan Cascade and Sevan-Hrazdan Cascades will implement required rehab Actual 2013 hourly generation profile of existing HPPs was used for their forecast
dispatch Iran demand under electricity-for-gas swap deal was modelled assuming actual
2013 hourly exports profile Renewable energy technologies were assigned “capacity credit” based on their
average capacity during top 10% of load hours in a year (solar PV is assumed 0% availability during peaks)
No electricity trade with Georgia No seasonal electricity swap with Iran Gas-for-electricity swap with modelled assuming current levels: 1.2 billion kWh of
electricity in exchange for 360 million cubic meters of gas CO2 emission costs factored in economic analyses Discount rate of 10%
62

Annex 4: Key Assumptions for LCP Analyses
Capital Cost Assumptions
$/kW Data Source
Capital cost of new CCGT 1100 Recent CCGT projects in the region
Capital cost of Medium NPP 4250 Ongoing CNP projects
Capital cost of Large NPP 5500 Pre-feasibility study for Armenia VVER-440 reactor, 2010
Loriberd HPP (storage) 2150 Feasibility Study Update, 2009
Shnogh HPP (ROR) 1850 Government and Bank team estimate
Flash cycle geothermal 3700 GeoFund 2: Armenia Geothermal Project
Utility-scale PV 2400 SREP Investment Plan Project
Wind 2200 SREP Investment Plan Project
63

Annex 4: Nuclear
• The average expected cost of reactors under construction varies widely from country to country, from a low of US$1,951 per kW (India) to a high of US$6,938 per kW (Finland)
• Average expected costs also vary from $1,841 to $8,400 depending on the NPP technology
GoA should consider other commercially available nuclear technologies
Average Expected Cost per kW by Plant Technology
II III III+ IV
VVER-440 Armenia is considering is one of the highest cost
64

Annex 4: Nuclear, cont.
Average construction time of NPP projects increased
Source: Bank Team Research
Recent Experience with Construction Times* of NPPs Globally
*Construction times for nuclear units do not include the Owner’s development time or licensing activities.
• Construction times have steadily increased since the first nuclear plants were built in the 1960s, and in recent years, they have seen wider variation than ever before.1
• Reasons for increased delays in NPP projects include:
Regulation and licensing. Licensing delays have increased following the Fukushima disaster.
Longer public consultations given increased safety concerns.
Scarcity of equipment. Slow global demand has decreased the availability of specialized construction equipment
65

Annex 4: Profile of Loriberd and Shnogh HPPs
Loriberd Shnogh
Loriberd HPP and Tashir SHPP
Two construction options: ROR design Capacity: 54 MW Production: 208 mln. kWh Cost: $114 million Peaking Design Capacity: 66 MW Production: 206 mln. kWh Cost: $128 million Implementation - 2 years for technical studies and tender - 5 years for implementation
One construction option: ROR design Capacity: 75 MW Production: 300 mln. kWh Cost: $137 million Implementation - 2 years for technical studies and tender - 5 years for implementation
66

Annex 5: Renewable Energy Targets
Capacity installed (MW) Generation (GWh)
2020 2025 2030 2020 2025 2030
Small Hydro 377 397 397 1,049 1,106 1,106
Wind 50 100 150 117 232 349
Geothermal 50 100 150 373 745 1,116
PV 40 80 80 88 176 176
Total 492 677 777 1,627 2,259 2,747
Note: All RE targets are included in the renewable energy scenarios.
67


![Construction Sector Update Note[1]](https://img.dokumen.tips/doc/110x75/577d23411a28ab4e1e995914/construction-sector-update-note1.jpg)