Embed Size (px)
Citation preview

A R K A N S A S A G R I C U L T U R A L E X P E R I M E N T S T A T I O NDivision of Agriculture University of Arkansas
July 1998 Special Report 186
Agricultural Experiment Station, University of Arkansas Division of Agriculture, Fayetteville. Milo J. Shult, VicePresident for Agriculture and Director; Charles J. Scifres, Associate Vice President for Agriculture. PS1.5M798PM
The Arkansas Agricultural Experiment Station follows a nondiscriminatory policy in programs and employment.ISSN:0571-0189 CODEN: AUARAN
This proceedings and the companion Southern Conservation Tillage Conference for Sustainable Agriculture are activi-ties of the Southern Extension and Research Activity - Information Exchange Group 20 (SERA-IEG-20), which issponsored by the University of Arkansas, the Southern Association of Agricultural Experiment Station Directors, theSouthern Association of Agricultural Extension Service Directors and the Cooperative State Research, Education, andExtension Service (CSREES).
Proceedings of the
21st Annual SouthernConservation Tillage Conference
for Sustainable Agriculture
North Little Rock, ArkansasJuly 15-17, 1998
Terry C. Keisling, Editor
Arkansas Agricultural Experiment StationFayetteville, Arkansas

iv
Financial Supporters of the 21st AnnualSouthern Conservation Tillage Conference
for Sustainable Agriculture
American Cyanamid
DuPont Agricultural Products
Monsanto
Natural Resources Conservation Service
Zeneca Agricultural Products
University of ArkansasCooperative Extension ServiceAgricultural Experiment Station1890 Cooperative Extension Program

v
Foreword
Conservation tillage, especially no-till, gained greater acceptance during the decades of the 1960s and 1970s. Thisacceptance coincided with the availability of herbicides that could substitute for mechanical cultivation for weedcontrol. Highly erodible locations were usually the first to implement conservation practices.
Conservation tillage generally reduces erosion, conserves energy costs associated with tillage operations and modi-fies soil-water relationships. Conservation tillage often requires greater herbicide use to obtain acceptable weedcontrol. Under reduced tillage scenarios, applied lime and fertilizer tend to concentrate in the surface few inches ofsoil. Greater capture of rainfall and fast transmission of water via large pores to greater depths may pose an increasedpotential for ground water contamination with pesticides and nitrates. In some cases, continual cropping withoutmechanical tillage has resulted in increased surface soil compaction.
Conservation tillage issues that evolved during the 1980s included effective herbicide and fertilizer use, proper soilsampling techniques, insect and disease management, crop residue management, soil-water relations, surface andground water protection and profitability of crop production. Numerous production problems have been addressed, andvarious solutions are being tested. As conservation technology improves, its acceptance continues to increase.
During the 1990s, as much as 35% of the crop land in the United States is being farmed with some kind ofconservation tillage practice. The advent of bioengineering of herbicide-resistant crops has made weed control inconservation tillage easier. With adaptation of conservation tillage, equipment that addresses various problems thatoccur when using conservation tillage has been developed in farm shops and then been offered commercially byequipment companies.
The 1998 conference theme, “MEETING THE CHALLENGES” was chosen for its focus on removing the barriersof further adaptation of conservation tillage while sustaining that which is in place. To be sustainable requires that abalance among profitable agriculture production, socially acceptable practices and environmentally sound practices beachieved. The 1998 conservation tillage conference continues to provide a communication link among various agenciesand personnel interested in improved natural resource management. We here at the University of Arkansas appreciatethe opportunity to host this annual conference and to facilitate the adaptation of conservation tillage technology.
Stan L ChapmanExtension Soil Specialist and Agronomy Section LeaderCooperative Extension ServiceUniversity of ArkansasP.O. Box 391Little Rock, Arkansas 72203
Terry C. KeislingProfessor of AgronomyUniversity of Arkansas Northeast Res. & Ext. Ctr.P.O. Box 48Keiser, Arkansas 72361

vi

vii
A COMPARISON OF TILLAGE SYSTEMS FORWITHIN-FIELD VARIABILITY OF COTTONYIELD AND FIBER PROPERTIESPhilip J. Bauer, John A. DuRant and James R.Frederick...................................................................9
SOIL STRENGTH IN RYE AND FALLOW WINTERCOVER IN THE SOUTHEASTERN COASTALPLAINW.J. Busscher and P.J. Bauer ................................. 13
CULTURAL AND CHEMICAL REDVINE (BRUN-NICHIA OVATA) CONTROL IN SOYBEANT.A. Castillo, T.K. Keisling and L.R. Oliver .......... 16
USING GRID SOIL SAMPLING IN THE MANAGE-MENT OF PROBLEM SOILSM.B. Daniels, S.L. Chapman, R. Matlockand A. Winfrey ....................................................... 19
VESICULAR ARBUSCULAR MYCORRHIZAE(VAM) IN NO-TILLAGE COTTONErnest H. Flint, Jr., Glover B. Triplett, Jr., Seth M.Dabney, William H. Batson, Dawn S. Luthe andClarence E. Watson ................................................ 22
NO-TILLAGE SWEET CORN HYBRID RESPONSETO CARBOFURAN (FURADAN 4 F)R.N. Gallaher and R. McSorley ............................. 25
SWEET CORN RESPONSE TO YARD WASTECOMPOST AND LUPIN HAY FERTILIZERTREATMENTSR.N. Gallaher, J.D. Greenwood andR. McSorley ........................................................... 28
INFLUENCE OF TILLAGE SYSTEM, PLANTINGDATE AND CULTIVAR SELECTION ON SOILWATER AND SOYBEAN YIELD UNDERDRYLAND SOYBEAN PRODUCTIONE.C. Gordon, T.C. Keisling, D.M. Wallace,L.R. Oliver and C.R. Dillon ................................... 32
TWO METHODS OF COMPOSTING GIN TRASHE.C. Gordon, T.C. Keisling, L.R. Oliverand Carl Harris ....................................................... 38
ContentsCOMPARISON OF TILLAGE PRACTICES FOR
COTTON PRODUCTION ON ALLUVIALSOILS IN NORTHEASTERN LOUISIANAE.M. Holman, A.B. Coco and R.L. Hutchinson ..... 42
ASSESSING NUTRIENT STRATIFICATION WITHINA LONG-TERM NO-TILLAGE CORN SOILD.D. Howard, M.D. Mullen and M.E. Essington ... 46
MEASURING SOIL QUALITY ON THE ‘OLDROTATION’Michael D. Hubbs, D.W. Reeves and Charles C.Mitchell Jr. ............................................................. 50
NITROGEN RATES AND COVER CROPS FOR NO-TILL COTTON IN THE MISSISSIPPI BROWNLOAMJ.R. Johnson and J.R. Saunders .............................. 55
TILLAGE STUDIES ON COTTONT.C. Keisling, E.C. Gordon, G.M. Palmerand A.D. Cox .......................................................... 58
NO-TILL PRODUCTION IN THE ARKANSASSOYBEAN RESEARCH VERIFICATIONPROGRAMR.A. Klerk, J.D. Beaty, L.O. Ashlock,C.D. Brown and T.E. Windham ............................... 59
INFLUENCE OF PLANTING DATE AND HARVESTDATE ON COVER CROP PERFORMANCE INA CORN PRODUCTION SYSTEMH.J. Mascagni, Jr. and D.R. Burns .......................... 62
PREPLANT HERBICIDES FOR WEED CONTROLIN CONSERVATION-TILLAGE COTTON(GOSSYPIUM HIRSUTUM L.)Marilyn R. McClelland, M. Cade Smithand Preston C. Carter ............................................. 65
IDENTIFICATION OF CRITICAL SOURCE AREASFOR CONTROL OF SEDIMENT AND PHOS-PHORUS TRANSPORT WITHIN A LARGEWATERSHEDJ.M. McKimmey and H.D. Scott ........................... 70
ARKANSAS AGRICULTURAL EXPERIMENT STATION SPECIAL REPORT 186
8viii
KEYS TO SUCCESSFUL PRODUCTION OFTRANSPLANTED CROPS IN HIGH-RESIDUE,NO-TILL FARMING SYSTEMSRonald Morse ......................................................... 79
EFFECT OF TILLAGE ON SENNA OBTUSIFOLIAAND XANTHIUM STRUMARIUM POPULA-TION, INTERFERENCE AND SEED BANKL.R. Oliver and M.T. Barapour ............................... 83
THE ROLE OF INDUSTRY IN CONSERVATIONTILLAGE AND SUSTAINABLE AGRICULTURERobert G. Palmer ................................................... 87
EVALUATION OF CORN PLANTING DATES FORNORTHERN MISSISSIPPIJ.R. Saunders and J.R. Johnson .............................. 90
CONVENTIONAL VS. ULTRA-NARROW ROW(UNR) COTTON IN DIFFERENT TILLAGESYSTEMSP.J. Wiatrak, D.L. Wright, J.A. Pudelko, B. Kiddand W. Koziara ....................................................... 92
COMPARISON OF BT CORN TO NON BT USINGSTRIP TILLAGE AT FOUR PLANTING DATESD.L. Wright, P.J. Wiatrak, D. Herzog, J.A. Pudelkoand B. Kidd ............................................................. 95

PROCEEDINGS 21ST ANNUAL SOUTHERN CONSERVATION TILLAGE CONFERENCE FOR SUSTAINABLE AGRICULTURE
9
ABSTRACT
here is considerable variability for lint yield withincotton (Gossypium hirsutum L.) fields in the south-eastern Coastal Plain. The objective of this experi-
ment was to determine if soil management techniques andin-furrow application of an insecticide/nematicide influ-ence the amount of variability in cotton yield and fiberproperties. Treatments in the study were tillage (conser-vation vs. conventional) and aldicarb application (1.07 lbai/acre vs. none). In 1997, ‘DPL Acala 90’ was plantedinto large plots (ranging in length from approximately 400to 800 ft, plots were six 38-in.-wide rows) that spannedacross several soil map units. Two harvesting methodswere used to determine variability. First, the large plotswere subdivided into 44-ft-long sections, and two of therows in each section were harvested with a spindle picker.Second, a 6-ft sample was hand-harvested from each ofthree soil map units (Bonneau sand, Eunola loamy sandand Norfolk loamy sand) within each plot. Neither aldicarbapplication nor tillage system affected the variability foryield or micronaire among the machine-harvested samples.Variability for fiber length was less in conservation tillagethan in conventional tillage only when aldicarb was ap-plied. For fiber strength, conservation tillage had lowervariability than conventional tillage for the plots withoutaldicarb. Soil map unit was responsible for much of thevariation in yield, with the Bonneau sand having loweryield than the other two soil map units. Variability forfiber properties was less than variability for yield.
INTRODUCTION
A large amount of variation in cotton growth and pro-ductivity can occur within the cotton fields of the south-eastern Coastal Plain. One of the largest sources appearsto be variation due to soil map unit. Fields in this regiongenerally have many soil map units and a range of physicaland chemical properties that influence crop growth (Karlenet al., 1990). The primary productivity differences amongsoil map units may be in differences in ability to supplywater to crops. Sadler et al. (1998) found a significantrelationship between canopy minus air temperature andsoil map unit in corn (Zea mays) during a severe water
deficit year, which implied that soil physical differencescaused differences in water stress.
Many of the benefits of conservation tillage, especiallywhen used with adequate residue cover, are related to im-proving soil water conditions. Benefits often cited includeincreased rainfall infiltration, reduced runoff and reducedevaporation from the soil surface. Thus, conservation till-age techniques may reduce the amount of field variabilityfor cotton yield by reducing the amount of in-field vari-ability for soil water.
Besides soil map unit, pest infestations are a source ofvariability in the southeastern Coastal Plain cotton fields.Although seldom random, infestations of weeds, insectsand nematodes do not tend to be uniformly distributedthroughout a field. Though pests are rarely uniformly dis-tributed, pest control measures are usually applied uni-formly throughout a field. Part of the reason for this isthe uncertainty of where pest infestations will occur. Also,there is very little spatial data available on the efficacy ofpest control products.
A six-year study was established in the fall of 1996with the overall objective to determine the effects of resi-due amount, tillage system and in-furrow insecticide ap-plication on cotton yield and fiber properties. In this re-port, we describe our results from the first year of con-verting a field to a conservation tillage production system.The objective is to determine if soil management tech-niques and in-furrow application of an insecticide/nemati-cide influence the amount of variability in cotton yieldand fiber properties.
MATERIALS AND METHODS
Seven acres of a 40-acre field at Clemson University’sPee Dee Research and Education Center near Florence,South Carolina, were used for the experiment. The areawas chosen because of the diversity in soil map units andthe ability to have at least two soil map units representedin each plot. Treatments were tillage (conventional or con-servation) and in-furrow insecticide/nematicide applica-tion (aldicarb or none). Experimental design was split-plot with main plots in a randomized complete block. Therewere three blocks. Main plots were the tillage treatments,and subplots were the in-furrow insecticide applicationtreatments. Main plot size was twelve 38-in.-wide rowsthat ranged in length from approximately 400 ft to morethan 800 ft. Six of the rows received an in-furrow applica-
A COMPARISON OF TILLAGE SYSTEMS FOR WITHIN-FIELD VARIABILITYOF COTTON YIELD AND FIBER PROPERTIES
Philip J. Bauer, John A. DuRant and James R. Frederick1
1P.J. Bauer,USDA-ARS, Coastal Plains Soil, Water, and Plant ResearchCenter, Florence, South Carolina. J.A. Durant and J.R. Frederick, ClemsonUniversity, Florence, South Carolina.
T

ARKANSAS AGRICULTURAL EXPERIMENT STATION SPECIAL REPORT 186
10
tion of 1.07 lb ai/acre aldicarb, while the other six wereplanted without insecticide/nematicide protection to serveas controls.
In previous years, the field was in a two-year rotationof corn followed by winter wheat (Triticum aestivum)double-cropped with soybean (Glycine max). Corn wasgrown in the field during the summer of 1996. Followingcorn harvest, stalks were mowed. The experiment wasoriginally designed to include a rye cover crop (both withand without tillage) treatment. Rye was planted 20 No-vember 1996, but because of poor cover crop growth,these plots were pooled with the no-cover-crop main plotsfor this analysis. In the spring of 1997, paraquat was ap-plied to the conservation tillage plots while the conven-tional tillage plots were disked and then smoothed with aharrow equipped with S-shaped tines and rolling baskets.On 2 May, a paratill with shanks spaced 26 in. apart wasused to deep-till the entire experimental area to a depth of16 in.
Cotton (‘Deltapine Acala 90’) was planted 7 May usinga four-row planter equipped with waved coulters. Seedingrate was four seeds per row-ft. Preemergence herbicides(fluometuron and pendimethalin) were applied 8 May.Post-emergence herbicides included pyrithiobac, cyanazineand monosodium methanearsonate. All herbicides wereapplied at recommended rates. Plant nutrients (other thanN) were broadcast applied before cotton planting at ratesbased on soil test results and Clemson University Coop-erative Extension Service recommendations. All N wasside-dress applied in a split application, with 40 lb N/acrebeing applied 13 May and 40 lb N/acre applied 20 June.All N applied was NH
4NO
3.
Two methods of harvest were used to assess the yieldand fiber property variability. The first method involvedseparating each subplot into 50-ft-long sections and re-moving plants from 3 ft of row from each end of thesections so that the harvested area within each section was44 ft long. A two-row spindle picker was used to harvesttwo of the rows in each section. A grab sample ofseedcotton from each harvest bag was collected at harvestfor fiber property determinations. The second method in-volved hand-harvesting 6 ft of row from individual soilmap units within each plot. The map units chosen wereBonneau sand (BoB; loamy, siliceous, thermic ArenicPaleudult), Eunola loamy sand (EuB; Fine-loamy, siliceous,thermic Aquic Hapludult) and Norfolk loamy sand (NoA;fine-loamy, siliceous, thermic Typic Kandiudult). All threesoil map units were present in all plots in two of theblocks. In the other block, the EuB soil map unit was ineach main plot, while the BnA soil map unit was present inonly one of the four main plots, and the NoA map unit waspresent in only three of the four main plots. All seedcottonsamples were ginned on a 10-saw laboratory gin. Samples
of the lint samples were sent to Star-Lab, Inc (Knoxville,Tennessee) for HVI fiber property determinations.
Bartlett’s F test for homogeneity of variance was con-ducted to determine if the amount of variability differedbetween conventional tillage and conservation tillage forboth levels of aldicarb application. Since the experimentaldesign was split-plot with main plots in a randomized com-plete block design, variance components for each subplottreatment consisted of variation due to blocks and towithin-plot variation. Therefore, an analysis of variancefor treatment combination (tillage x aldicarb) was con-ducted to remove the variance component due to blocks,and the residual mean square was used as the estimate ofσ2 for conducting Bartlett’s F test. For the hand-harvestedsamples, data were analyzed by analysis of variance usingthe general linear models (PROC GLM) procedure of SAS.
RESULTS AND DISCUSSION
Estimates of variance and Bartlett’s F test forheterogeniety of variance among the machine-pickedsamples for lint yield, fiber length, strength and micronaireare given in Table 1. The amount of variability for cottonyield did not differ between conventional tillage and con-servation tillage either with or without aldicarb applica-tion (Table 1). Similarly, variability did not differ formicronaire between the tillage systems either with or with-out aldicarb. Heterogeneity of variance was found for bothfiber length and fiber strength. In both cases, the conser-vation tillage had lower variance than did conventional till-age. For fiber length, variance was lower for conservationtillage than for conventional tillage when aldicarb was ap-plied (Table 1). For fiber strength, variance of the conser-vation tillage was less when aldicarb was not applied.
For the machine-harvest sampling method, a significant(P < 0.10) tillage x aldicarb interaction occurred for lintyield (Table 2). With aldicarb, the conventional and con-servation tillage production systems had similar yield(Table 2), averaging 859 lb lint/acre. The interaction wascaused by magnitude differences between aldicarb-treatedand untreated cotton within each tillage system. In conser-vation tillage, yields of cotton without aldicarb were only131 lb/acre less than the cotton treated with aldicarb. Inconventional tillage, the difference between aldicarb-treated and untreated was 212 lb lint/acre (Table 2). Early-season counts indicated that thrips populations were lessin the conservation tillage than in the conventional (datanot shown). Only small, and probably inconsequential, meandifferences among treatments occurred for fiber proper-ties with the machine harvest sampling method. As ex-pected, it appears that much of the within-plot variabilityfound with the machine-harvest method was due to soilmap unit.
Yield and fiber properties from the hand-harvestedsamples are given in Table 3. Averaged over tillage sys-

PROCEEDINGS 21ST ANNUAL SOUTHERN CONSERVATION TILLAGE CONFERENCE FOR SUSTAINABLE AGRICULTURE
11
tems and aldicarb levels, lint yields were 694 lb/acre forthe Bonneau, 913 lb/acre for the Eunola and 1020 lb/acrefor the Norfolk. The average yield increase due to aldicarbwas 158 lb lint/acre. The micronaire response was similarto yield, with lower micronaire occurring on the Bonneausoil map unit than on the other two and aldicarb-treatedcotton having higher micronaire than untreated. As for themachine-harvested samples, variability for fiber length andstrength was small, even when treatment means were sig-nificantly different. Notably, the cotton produced with con-servation tillage on the Bonneau soil grown withoutaldicarb was substantially lower for yield and fiber qualitythan the other treatment combinations in the experiment.
Although the tillage x aldicarb x soil map unit interac-tion was not significant for lint yield (P = 0.198), inspec-tion of the means provides some indication of why thetillage x aldicarb interaction occurred for yield with themachine-picked data. As discussed earlier, yield reduc-tions without aldicarb were less in the conservation tillageproduction system than in the conventional tillage system.Aldicarb did not increase yield for the Eunola and Norfolksoils in the conservation tillage system but resulted in asubstantial yield increase on these two soils in conven-tional tillage (Table 3). For the Bonneau soil, aldicarbtreatment increased yield in both the conservation and con-ventional tillage treatments. Unfortunately, insect pestmonitoring was not conducted on an individual soil mapunit basis in 1997.
These preliminary data suggest that there can be sub-stantial yield and fiber property variation within fields forcotton in the southeastern Coastal Plain. Additionally, al-though within-field variation for yield was not reducedwith conservation tillage, conservation tillage did decreasethe within-plot variation for fiber length and strength. Ap-plication of aldicarb did not reduce within-plot variability,nor did it have much of an effect on variability among soiltypes. More in-depth monitoring of insect and nematodepests is planned.
ACKNOWLEDGMENT AND DISCLAIMER
We thank Bobby Fisher, Van Atkinson and Gene Taylorfor technical assistance and Ellen Whitesides for helpingprepare the manuscript. Mention of a trademark, propri-etary product, or vendor does not constitute a guaranteeor warranty of the product by the USDA or Clemson Uni-versity and does not imply its approval to the exclusion ofother products or vendors that may also be suitable.
LITERATURE CITED
Karlen, D.L., E.J. Sadler and W.J. Busscher. 1990. Crop yieldvariation associated with Coastal Plain soil map units. Soil Sci.Soc. Am. J. 54:859-865.
Sadler, E.J., W.J. Busscher, P.J. Bauer and D.L. Karlen. 1998. Spatialscale requirements for precision farming inferred fromobservations in the southeastern USA. Agron. J. (inpress).
Steel, R.G.D., and J.H. Torrie. 1980. Principles and procedures ofstatistics. Second Edition. McGraw-Hill Book Co., New York,New York.
Table 1. Estimates of variance for yield and selected fiber properties of each tillage x aldicarb combination in the experimentand Bartlett’s F test for homogeneity of variance. Estimates are for the machine-harvested samples.
Estimate of σ2
Tillage Aldicarb n Yield Length Strength Micronaire
Conservation Yes 54 25112 0.00050 0.9222 0.0767No 54 20665 0.00052 0.9820 0.0629
Conventional Yes 58 21976 0.00086 1.3951 0.0688No 58 25963 0.00054 1.7355 0.0712
Bartlett’s F-test Values for Homogeneity of Variance between Tillage SystemsYes 1.14 1.72* 1.51 1.11No 1.26 1.04 1.77* 1.13
*Indicates F value significant at P = 0.05 (F values for determination of significance were estimated from F table values of F0.05 40,40 = 1.69 and F0.05 60,60
=1.53 [Steel and Torrie, 1980]).

ARKANSAS AGRICULTURAL EXPERIMENT STATION SPECIAL REPORT 186
12
Table 2. Average cotton yield and selected fiber properties as affected by tillageand aldicarb application. Data are from machine-picked samples.
Tillage Aldicarb Yield Fiber Length Fiber Strength Micronaire
lb lint/acre in. g/tex unitsConservation Yes 849 1.12 30.0 4.1
No 718 1.11 30.3 4.1Conventional Yes 868 1.12 30.3 4.2
No 656 1.11 30.4 4.1
Significance Level (Prob > F Value) From Analysis of Variance
Tillage 0.788 *** *** 0.469Aldicarb <0.001 *** *** 0.213Tillage x Aldicarb 0.066 *** *** 0.859
*** Hypothesis testing for these variables is invalid because of heterogeniety of variance.
Table 3. Average cotton yield and selected fiber properties as affected by tillage, aldicarb applicationand soil map unit. Data are from hand-harvested samples.
Tillage Aldicarb Soil Map Unit Yield Fiber Length Fiber Strength Micronaire
lb lint/acre in. g/tex unitsConservation Yes Bonneau 795 1.09 32.6 3.7
Eunola 912 1.11 32.4 4.0Norfolk 1056 1.12 32.7 4.1
No Bonneau 527 1.07 29.9 3.2Eunola 908 1.11 32.6 4.2Norfolk 1030 1.11 32.2 3.8
Conventional Yes Bonneau 785 1.12 33.8 3.7Eunola 1085 1.12 32.5 4.1Norfolk 1110 1.13 32.8 4.2
No Bonneau 658 1.10 32.5 3.7Eunola 749 1.11 32.3 3.9Norfolk 880 1.09 31.7 3.8
Significance Level (Prob > F Value) From Analysis of Variance
Tillage 0.704 0.295 0.127 0.259Aldicarb 0.007 0.031 <0.001 0.049Soil <0.001 0.482 0.775 0.003Tillage x Aldicarb 0.273 0.622 0.787 0.890Tillage x Soil 0.736 0.066 0.002 0.460Aldicarb x Soil 0.929 0.627 0.012 0.241Tillage x Aldicarb X Soil 0.198 0.357 0.208 0.205

PROCEEDINGS 21ST ANNUAL SOUTHERN CONSERVATION TILLAGE CONFERENCE FOR SUSTAINABLE AGRICULTURE
13
ABSTRACT
n sandy coastal subsurface hardpan soils, covercrops have the potential to prevent erosion andscavenge nutrients. Our objective was to deter-
mine the effect of cover crops and tillage on soil strengthand cotton yield. Treatments were surface tillage (diskedor none), deep tillage (in-row subsoiled or none) and covercrop (rye or fallow). Soil strength (cone index) differ-ences were measured for tillage treatments (deep tilled <none), depth (higher strength in the pan) and positionacross the row (in row < non-wheel track < wheel track).Lower cone indices were found in the non-tilled rye cover,suggesting that the cover helped maintain low strengths.Higher cone indices in the disked treatments suggestedthat the disking aided recompaction.
INTRODUCTION
In the southeastern Coastal Plains, winter cover is im-portant for long-term conservation tillage crop produc-tion. Cool- and warm-season annual double crops areneeded for successful conservation tillage production ofgrain sorghum [Sorghum bicolor (L.) Moench] and soy-bean [Glycine max (L.) Merrill] on southeastern Pied-mont sandy loams (Langdale et al., 1990). However, be-cause of the long southeastern cotton growing season,double cropping with continuous cotton is not possiblefor much of the region. In addition, low organic matterproduced by cotton can leave a field bare for the winter.
Cover crops provide winter cover to improve erosioncontrol and increase infiltration. They can also scavengenutrients and reduce groundwater pollution. Cover cropsmight also provide the beneficial rotational effect of doublecrops seen by Langdale et al. (1990).
Because of the subsurface root-restricting E horizonof many Coastal Plain soils, in-row subsoiling is neededto help roots penetrate into the clay-textured B horizon.In-row subsoiling provides a narrow, soft zone below therow that roots can use to penetrate through the E and growinto the B horizon. By adding organic matter from bothroots and cover, cover crops may also help maintain lowersoil strength.
Our objective was to determine the influence of sur-face tillage, deep tillage and a rye cover crop on soilstrength and cotton lint yield.
MATERIALS AND METHODS
In 1990, we established cover crop plots at the ClemsonUniversity Pee Dee Research and Education Center nearFlorence, South Carolina. Bauer and Busscher (1993) re-ported the results from the 1991 and 1992 experiment. In1993, cotton was grown on the plots but not harvestedbecause of a drought. All plots were subsoiled in spring1993.
In 1994 and 1995, we changed the treatments tosubsoiling only half the plots. During these two years,experimental treatments were winter cover (rye and fal-low), surface tillage (disking and none) and deep tillage(in-row subsoiling and none). The experimental design wassplit-split plot randomized complete block. Main plotswere winter cover, subplots were surface tillage, and sub-subplots were deep tillage. Subsubplots were 12.7 ft wide(four 38-in. rows) by 50 ft long. The experiment had fourreplicates. The soil was a Norfolk sandy loam (fine, loamy,siliceous, thermic, Typic Kandiudult).
In October 1993 and 1994, after the cotton stalks wereshredded, half the plots were seeded with rye cover (110lb of seed/acre). Plots were seeded in 7.5-in. rows using aJohn Deere 750 grain drill.
In a separate operation immediately prior to planting,half the subsubplots were subsoiled using a KMC four-row subsoiler within 6 in. of the previous year’s rows. Inmid-May, cotton (‘DES 119’) was seeded within 6 in. ofthe previous year’s rows with a four-row Case-IH 900series planter equipped with Yetter wavy coulters. We at-tempted to maintain the same wheel tracks and rows fromyear to year. However, because the old rows were no longervisible, locating wheel tracks was more difficult in thedisked than in the non-disked plots
Nitrogen (80 lb N/acre as ammonium nitrate) was ap-plied in a split application, half at planting and half onemonth after planting. For each application, N was bandedapproximately 4 in. deep and 6 in. from the rows. Lime, P,K, S, B and Mn were applied based on soil test results andClemson University Extension recommendations. Weedswere controlled with a combination of herbicides, cultiva-tion (disked plots only) and hand-weeding. Insects werecontrolled by applying aldicarb (0.75 lb ai/acre) in-fur-row. Other insecticides were applied as needed.
Soil strength was measured in early June with a 0.5-in.-diameter, 30o solid angle cone tip, hand-operated, record-ing penetrometer (Carter, 1967). Strength measurements
SOIL STRENGTH IN RYE AND FALLOW WINTER COVERIN THE SOUTHEASTERN COASTAL PLAIN
W.J. Busscher and P.J. Bauer1
1USDA-ARS, Coastal Plain Soil, Water, and Plant Research Center, Florence,South Carolina.
O
ARKANSAS AGRICULTURAL EXPERIMENT STATION SPECIAL REPORT 186
14
were recorded to a depth of 24 in. at nine positions acrossa mid-plot row (from non-traffic midrow to trafficmidrow). Each measurement was the mean of three probingsfrom each subsubplot. Data were recorded on index cardsand digitized into the computer using the method describedby Busscher et al. (1986). Data were log transformed be-fore analysis for normalization (Cassel and Nelson, 1979).
Along with the cone indices, water contents were mea-sured at 4-in. depth increments in the non-wheel-trackmidrow and in the row. These selected water contentswere considered representative of the water contents foreach subsubplot.
In mid to late October, cotton was chemically defoli-ated. In early November, seed cotton yield was measuredby harvesting two interior rows with a two-row spindlepicker. Each harvest bag was subsampled, and the subsamplewas saw-ginned to measure lint percent. Seed cotton yieldwas multiplied by lint percent to estimate lint yield.
Data were analyzed using ANOVA and the LSD meanseparation procedure (SAS Institute Inc., 1990). Unlessotherwise specified, differences were significant at P =0.05.
RESULTS AND DISCUSSION
In late summer 1994, hail ruined part of the field thatincluded half of replicate one. After this, the replicate wasignored and the other three were used for analysis.
DepthFor both years and over all tillage treatments, cone
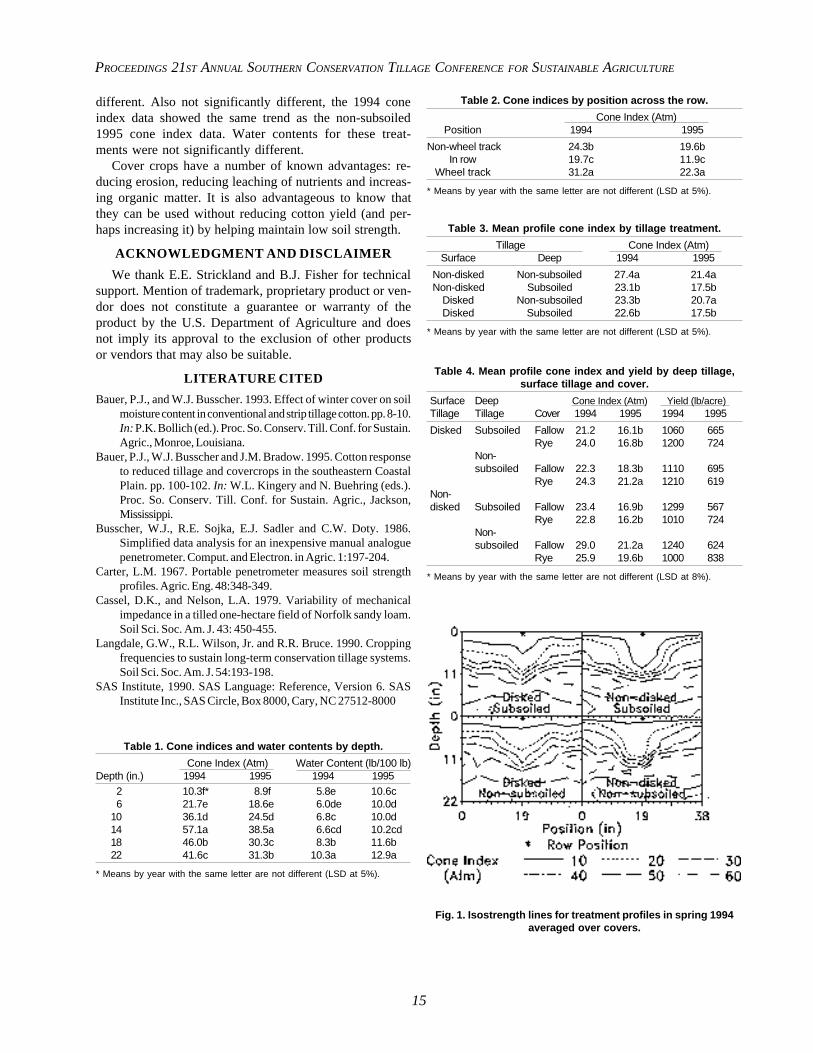
index differed with depth (Table 1 and Fig. 1). The highestcone indices were found at the 12- to 16-in. depths, thebottom of the E horizon. This high subsoil strength wasthe main reason for implementing the deep tillage.
Some cone index differences with depth were causedby water content changes (Table 1). For example, the softersoil below the hard layer (> 16 in.) was also wetter. Atthis depth, soil type generally changed from loamy sand tosandy clay loam. The sandy clay loam held more water andhad structure. The higher water content reduced cone in-dex and provided nourishment for the root, if it couldpenetrate the pan above. The structural faces provided zonesof weakness along which roots could grow, even if thesoil dried and hardened.
PositionCone index varied with position across the row (Table
2 and Fig. 1). These differences distinguished lowerstrength under the non-wheel-track midrow (Fig. 1, posi-tion = 0 in.) than the wheel-track midrow (position = 38in.). The lowest cone indices were found in the midrows(position = 19 in.) because of this year’s deep tillage orresidual effects from past deep tillage in the non-deep-tilled treatments.
TillageMean profile cone indices (M) did not differ between
disked and non-disked treatments. An exception to thiswas the 1994 non-deep-tilled treatments where diskedtreatments had lower M (Table 3). This was a result oflower cone indices in the surface 4 in., caused by thedisking. This zone of lower strength was apparent in theother cases (Fig. 1) but not significantly different.
As expected, M for the deep-tilled treatment was lowerthan for the non-deep-tilled treatment (Table 3). An ex-ception to this was the disked treatment in 1994 whereM’s were about the same for both deep tilled and non-deep-tilled treatments. The similarity of the M’s could beexplained partly by the residual effects of 1993 subsoilingin the non-deep-tilled treatment, giving this profile a loos-ening pattern similar to the deep-tilled treatment (Fig. 1).Also, since both treatments were disked, the upper partsof both profiles were loosened.
CoverMost strength interactions with cover were accompa-
nied by water content differences. The higher strengthshad lower water contents. Most of these differences werein the lower half of the measured profile.
In the non-disked treatments, the rye cover treatmenthad lower cone indices (and higher water content) than thefallow treatment (Table 4). This would be consistent withbetter infiltration usually associated with treatments thathave better cover.
The opposite was seen in the disked treatments, wherethe fallow treatment had the lower cone indices (and higherwater contents). This would be consistent with root uptakeby the rye.
In 1994, cotton yield was higher for fallow cover in thenon-disked treatments and for rye cover in the disked treat-ments (Table 4). This was a result of the large amount ofcover in the 1994 rye cover treatments that made plantingdifficult in the non-disked rye cover and added a signifi-cant amount of organic matter to the disked treatment(Bauer et al. 1995).
In 1995, in the non-subsoiled treatments, cone indiceswere lower for the non-disked rye than fallow and higherfor the disked rye than fallow (Table 4). Lower cone indi-ces for the non-disked rye suggested that the cover (andthe roots from the cover crop growing within the profile)helped maintain low strengths, even for soils with hard-pans at 12- to 16-in. depth. Higher strengths for the diskedrye suggest that disking can eliminate these reductions instrength. Since the profile as a whole was higher in strengthand since disking loosened the upper part of the profile(as seen above), the lower part of the profile, the pan,would have had to be compacted. Lower cone indices sug-gest higher yields for the non-disked treatment. Higheryields were found, although they were not significantly
PROCEEDINGS 21ST ANNUAL SOUTHERN CONSERVATION TILLAGE CONFERENCE FOR SUSTAINABLE AGRICULTURE
15
different. Also not significantly different, the 1994 coneindex data showed the same trend as the non-subsoiled1995 cone index data. Water contents for these treat-ments were not significantly different.
Cover crops have a number of known advantages: re-ducing erosion, reducing leaching of nutrients and increas-ing organic matter. It is also advantageous to know thatthey can be used without reducing cotton yield (and per-haps increasing it) by helping maintain low soil strength.
ACKNOWLEDGMENT AND DISCLAIMER
We thank E.E. Strickland and B.J. Fisher for technicalsupport. Mention of trademark, proprietary product or ven-dor does not constitute a guarantee or warranty of theproduct by the U.S. Department of Agriculture and doesnot imply its approval to the exclusion of other productsor vendors that may also be suitable.
LITERATURE CITED
Bauer, P.J., and W.J. Busscher. 1993. Effect of winter cover on soilmoisture content in conventional and strip tillage cotton. pp. 8-10.In: P.K. Bollich (ed.). Proc. So. Conserv. Till. Conf. for Sustain.Agric., Monroe, Louisiana.
Bauer, P.J., W.J. Busscher and J.M. Bradow. 1995. Cotton responseto reduced tillage and covercrops in the southeastern CoastalPlain. pp. 100-102. In: W.L. Kingery and N. Buehring (eds.).Proc. So. Conserv. Till. Conf. for Sustain. Agric., Jackson,Mississippi.
Busscher, W.J., R.E. Sojka, E.J. Sadler and C.W. Doty. 1986.Simplified data analysis for an inexpensive manual analoguepenetrometer. Comput. and Electron. in Agric. 1:197-204.
Carter, L.M. 1967. Portable penetrometer measures soil strengthprofiles. Agric. Eng. 48:348-349.
Cassel, D.K., and Nelson, L.A. 1979. Variability of mechanicalimpedance in a tilled one-hectare field of Norfolk sandy loam.Soil Sci. Soc. Am. J. 43: 450-455.
Langdale, G.W., R.L. Wilson, Jr. and R.R. Bruce. 1990. Croppingfrequencies to sustain long-term conservation tillage systems.Soil Sci. Soc. Am. J. 54:193-198.
SAS Institute, 1990. SAS Language: Reference, Version 6. SASInstitute Inc., SAS Circle, Box 8000, Cary, NC 27512-8000
Table 1. Cone indices and water contents by depth.
Cone Index (Atm) Water Content (lb/100 lb)Depth (in.) 1994 1995 1994 1995
2 10.3f* 8.9f 5.8e 10.6c6 21.7e 18.6e 6.0de 10.0d
10 36.1d 24.5d 6.8c 10.0d14 57.1a 38.5a 6.6cd 10.2cd18 46.0b 30.3c 8.3b 11.6b22 41.6c 31.3b 10.3a 12.9a
* Means by year with the same letter are not different (LSD at 5%).
Table 2. Cone indices by position across the row.
Cone Index (Atm)Position 1994 1995
Non-wheel track 24.3b 19.6bIn row 19.7c 11.9c
Wheel track 31.2a 22.3a
* Means by year with the same letter are not different (LSD at 5%).
Table 3. Mean profile cone index by tillage treatment.
Tillage Cone Index (Atm)Surface Deep 1994 1995
Non-disked Non-subsoiled 27.4a 21.4aNon-disked Subsoiled 23.1b 17.5b
Disked Non-subsoiled 23.3b 20.7aDisked Subsoiled 22.6b 17.5b
* Means by year with the same letter are not different (LSD at 5%).
Table 4. Mean profile cone index and yield by deep tillage,surface tillage and cover.
Surface Deep Cone Index (Atm) Yield (lb/acre)Tillage Tillage Cover 1994 1995 1994 1995
Disked Subsoiled Fallow 21.2 16.1b 1060 665Rye 24.0 16.8b 1200 724
Non-subsoiled Fallow 22.3 18.3b 1110 695
Rye 24.3 21.2a 1210 619Non-disked Subsoiled Fallow 23.4 16.9b 1299 567
Rye 22.8 16.2b 1010 724Non-subsoiled Fallow 29.0 21.2a 1240 624
Rye 25.9 19.6b 1000 838
* Means by year with the same letter are not different (LSD at 8%).
Fig. 1. Isostrength lines for treatment profiles in spring 1994averaged over covers.
ARKANSAS AGRICULTURAL EXPERIMENT STATION SPECIAL REPORT 186
16
ABSTRACT
long-term field study was initiated in 1996 toevaluate tillage methods and herbicide treatmentsfor redvine control in soybeans (Glycine max).
Aerial photography and Global Positioning System (GPS)/Global Information Systems (GIS) were used to monitorredvine movement. At trial initiation, redvine populationsaveraged 15 to 25 per m2 and resulted in 42 to 50%groundcover. A split plot design was used with tillage typeas the main plot and herbicide treatment as the subplot.Tillage types included no-till, conventional, hyperbolicsubsoiler and moldboard plow. Subsoiling and plowing op-erations were conducted in the fall of 1996. Herbicidetreatments included no herbicide, glyphosate at 1.1 kg ai/ha (1.0 lb ai/acre) applied annually to V2 and V6 soybeansand dicamba at 2.2 kg ai/h (2.0 lb ai/acre) applied 2 weeksprior to 1996 soybean harvest. When a herbicide was notused, moldboard plowing was the only tillage type thatprovided acceptable season-long control (83%). Thesubsoiler provided 50% control of redvine, but by harvestregrowth had occurred, resulting in only 24% control. Stemcounts were reduced by moldboard plowing and subsoiling.Conventional tillage actually increased stem counts.Glyphosate increased control of redvine for all tillage treat-ments except moldboard plowing. Glyphosate at V2 andrepeated at V6 provided redvine control for one monthafter the V6 treatment; however, late-season regrowth re-sulted in only 54 to 66 % control at harvest. Dicambaprovided 96% control regardless of tillage type. Redvinedensity did not affect soybean yield in 1997.
INTRODUCTION
As reduced tillage systems become more popular,redvine and other perennial weeds are becoming an in-creasing problem in the Mississippi Delta (Elmore, 1984).Redvine has an extensive underground stem and root sys-tem, capable of vegetative propagation (DeFelice andOliver, 1980). Control of this weed requires that a sub-stantial concentration of herbicide reach the root system(Shaw and Mack, 1991). If applied during the fall, whenthe redvine plants are translocating sugars to their rootstructures, dicamba can reduce groundcover levels for atleast two years (Elkins et al., 1996). Disruption of theroot structure by deep tillage has also been found to re-
duce redvine groundcover levels (Elkins et al., 1996). Till-age operations may also contribute to the spread of peren-nial weeds throughout a field (Soteres and Murray, 1982).The objective of this study was to further develop redvinecontrol programs in Roundup Ready soybeans with tillagemethods and systemic herbicides and to monitor the re-growth and movement of redvine within the treatment.
MATERIALS AND METHODS
A 10-ha farmer-cooperator field near Keiser, Arkan-sas, containing a high natural population of redvine wasselected for study. A split plot design with four replica-tions was used. The main plots consisted of four tillagemethods: no-till, conventional tillage, hyperbolic subsoilerand moldboard plow. Subsoiling and moldboard plowingoperations were conducted upon initiation of the experi-ment in the fall of 1996. Subplots were herbicide treat-ments and included dicamba applied two weeks prior toharvest in 1996 at 2.2 kg ai/ha, glyphosate applied annu-ally to V2 and V6 soybeans at 1.1 kg ai/ha and an untreatedcheck. ‘Asgrow 4701RR’ soybean cultivar was drill seededto the 15- x 15-m plots 13 May 1997. Visual controlratings were taken at planting, one, two and three monthsafter planting and at harvest. Redvine stem counts/m2 werealso taken from the same plot area each year prior toharvest. The entire plot area was harvested for soybeanyield. Original plot locations were mapped with GlobalPositioning Systems (GPS) technology, and aerial photo-graphs are being taken semiannually to monitor the loca-tion and movement of redvine with the use of GeographicInformation Systems (GIS) software. All data were sub-jected to analysis of variance, with means separated byFishers Least Significant Difference (LSD) at the 0.05significance level.
RESULTS AND DISCUSSION
Tillage AloneWhen no herbicide was used for redvine control, mold-
board plowing was the only tillage treatment that providedacceptable control for the entire growing season (Fig. 1).When the top portion of the soil profile was turned, sub-terranean redvine parts were sliced off 20 cm below thesoil surface. Regrowth from the remaining taproot washindered and may have required the formation of new budsfrom root tissue. Fragmented stem segments were depos-ited at the soil surface. Exposure to cold and wet condi-
1Department of Agronomy, University of Arkansas, Fayetteville, AR 72701.
CULTURAL AND CHEMICAL REDVINE ( BRUNNICHIA OVATA) CONTROL IN SOYBEAN
T.A. Castillo, T.K. Keisling and L.R. Oliver1
A

PROCEEDINGS 21ST ANNUAL SOUTHERN CONSERVATION TILLAGE CONFERENCE FOR SUSTAINABLE AGRICULTURE
17
tions during the winter of 1996-1997 desiccated thesefragments and prevented regeneration. Both factors led toan 83% reduction in stem counts (Table 1). Control withthe hyperbolic subsoiler was much less. The subsoiler dis-turbed less than half of the soil matrix, leaving many es-tablished roots and rhizomes intact for regrowth. At har-vest, control with the subsoiler was similar to that withconventional tillage but higher than the no-till check (Fig.1). Only the conventional-tillage method increased stemcounts (Table 1).
Tillage + GlyphosateSequential applications of glyphosate increased redvine
control over that of tillage alone, except for moldboardplowing (Fig. 2). Glyphosate provided control for onemonth after treatment; however, late summer regrowthcaused final ratings to decline, resulting in 54 to 66%control for all tillage types. Glyphosate reduced stemcounts only in the conventional tillage plots (Table 1).
Tillage + DicambaRegardless of tillage type, dicamba provided excellent
control for the entire year (Fig. 3). Only minimal regrowthoccurred late in the season.
Soybean YieldRedvine density did not affect yield. While the pres-
ence of redvine may alter the microclimate through com-petition for light and soil moisture, the less-than-com-plete plot coverage and narrow-row soybeans compensatedfor the interference. Although redvine may not directlyaffect returns, the long vines often entangle machinery,causing substantial tillage and harvest complications.
CONCLUSIONS
Acceptable redvine control requires that the undergroundportion of the plant be killed by either moldboard plowingor the use of dicamba. Split applications of glyphosate cankeep redvine at a manageable level below the crop canopy.Subsoiling provided early-season control, but stem countsat harvest were not reduced over no-till. Conventional till-age may actually increase redvine populations and areas ofinfestation. Redvine did not affect soybean yields.
ACKNOWLEDGMENTS
The authors would like to thank the Arkansas SoybeanPromotion Board for funding this project and the JimmyFlecher Farm for providing the test area.
LITERATURE CITED
DeFelice, M.S., and L.R. Oliver. 1980. Redvine and trumpetcreepercontrol in soybeans and grain sorghum. Ark. Farm Res. 29(3):5.
Elkins, W.C., D.R. Shaw, J.D. Byrd, Jr., M.A. Blaine and C.H. Tingle.1996. Long-term redvine control. Proc. South. Weed Sci. Soc.49:22.
Elmore, C.D. 1984. Perennial vines in the Delta of Mississippi. Miss.Agric. and For. Exp. Stn. Bull. 927.
Shaw, D.R., and R.E. Mack. 1991. Application timing of herbicides forthe control of redvine (Brunnichia ovata). Weed Technol.5:125-129.
Soteres, J.K., and D.S. Murray. 1982. Root distribution andreproductive biology of honeyvine milkweed (Cynanchumlaeve). Weed Sci. 30:158-163.
Table 1. Reduction in redvine stems/m 2 1996-1997.
Herbicide programTillage Level Untreated Glyphosate* Dicamba**
----------------------%--------------------No-till 11 21 96Conventional -25 19 99Subsoiler 38 46 100Moldboard 83 72 100LSD (0.05%) = 22
*Glyphosate at 1.1 kg ai/ha applied V2 and V6**Dicamba at 2.2 kg ai/ha applied preharvest 1996.
0
20
40
60
80
100
0 1 2 3 4 5
Months After Planting
% C
ontr
olNo-till Conv Subsoil Moldboard
LSD(0.05)
Fig. 1. Redvine control with tillage alone (no herbicide), 1997.
0
20
40
60
80
100
0 1 2 3 4 5
Months After Planting
% C
ontr
ol
No-till Conv Subsoil Moldboard
LSD(0.05)
Fig. 2. Redvine control with tillage and glyphosate (1.1 kg ai/ha) applied to V2 and V6 soybeans (1 and 2 months after
planting in 1997).

ARKANSAS AGRICULTURAL EXPERIMENT STATION SPECIAL REPORT 186
18
0
20
40
60
80
100
0 1 2 3 4 5
Months After Planting
% C
ontr
ol
No-till Conv Subsoil Moldboard
LSD(0.05)
Fig. 3. Redvine control with tillage and dicamba (2.2 kg ai/ha)applied in fall 1996.

PROCEEDINGS 21ST ANNUAL SOUTHERN CONSERVATION TILLAGE CONFERENCE FOR SUSTAINABLE AGRICULTURE
19
RESEARCH PROBLEMS
nderlying soil fertility problems such as high so-dium levels, excess soluble salts and micronutri-ent imbalances can limit plant response to nitro-
gen, phosphorus and potassium fertilizers and lime evenwhen soil test recommendations warrant such additions.Management options for these soils are sometimes lim-ited due to practical and economic constraints. The objec-tive of this study was to determine if the use of precisionagricultural technology could provide information thatwould increase fertility management options on problemsoils.
BACKGROUND INFORMATION
Grid soil sampling is primarily being used as a basisfor variable rate application of fertilizers and lime. Re-gardless of variable rate fertilizer technology, grid soilsampling may be an important management tool. It pro-vides information at a level of detail that may be neces-sary for other purposes, such as setting realistic yieldgoals, explaining yield variability and trouble shootingproblem soils.
Plant response can vary within a field with problemsoils ranging from seedling death in some locations tonormal growth and yield at other locations. This variabil-ity can make it difficult to diagnose and remedy the prob-lem with normal composite soil sampling from good andbad areas. Intensive soil sampling may provide informa-tion so that the problem can be adequately identified andthe spatial extent of the problem adequately delineated.Ultimately, this increased knowledge may lead to increasedmanagement strategies for problem soils.
RESEARCH DESCRIPTION
The study was conducted in the spring of 1997 in south-western Hot Spring County in a 70-acre production field.Historically, soybean yields in parts of this field have beenseverely limited due to excess soluble salts. Within thisfield, the soils are mapped as Adaton, Gurdon and Sardissilt loams. The Gurdon series is closely related in textureand landscape position to the Foley silt loam, which ischaracterized by a natric (high sodium content) horizon.
In order to determine the distribution of soluble saltsand sodium within the field, soil samples were obtainedon approximately a 2.5-acre grid while the field was fal-low. The grid points were somewhat irregular (Fig. 1) andmore dense where there was visual evidence of salt prob-lems (lack of vegetation) to ensure that problems areassmaller than 2.5 acres were not excluded from the sam-pling. At each grid point, samples were collected with anNRCS probe truck using a 3-in.-diameter collection tube.Samples were taken from four depths down to 24 in. in 6-in. increments. The samples were shipped to the Univer-sity of Arkansas Soil Test Lab at Marianna for routine soilanalysis.
The latitude and longitude coordinates were determinedfor each grid point with a hand-held DGPS (Post Process-ing). Coordinates for the perimeter of the field were alsorecorded. Soil nutrient maps were constructed usingSSToolbox GIS software (SST Development Group, Inc.).Soil test point data was converted to surface data usingkriging procedures.
RESULTS
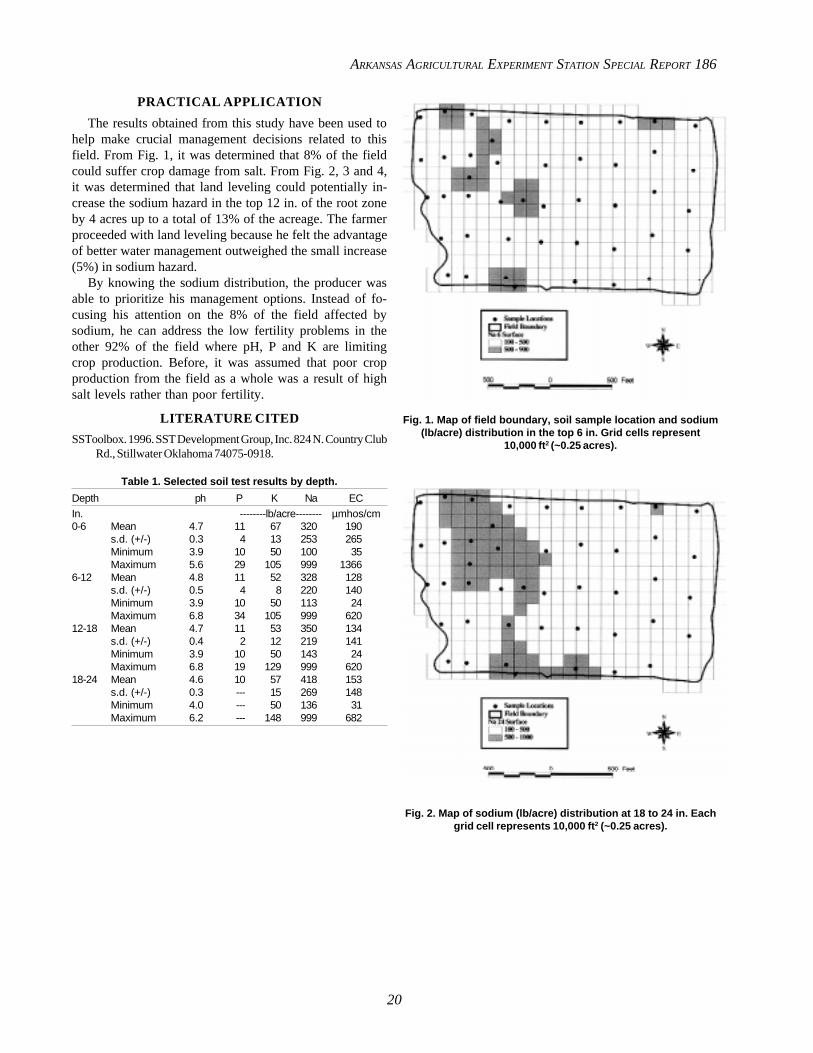
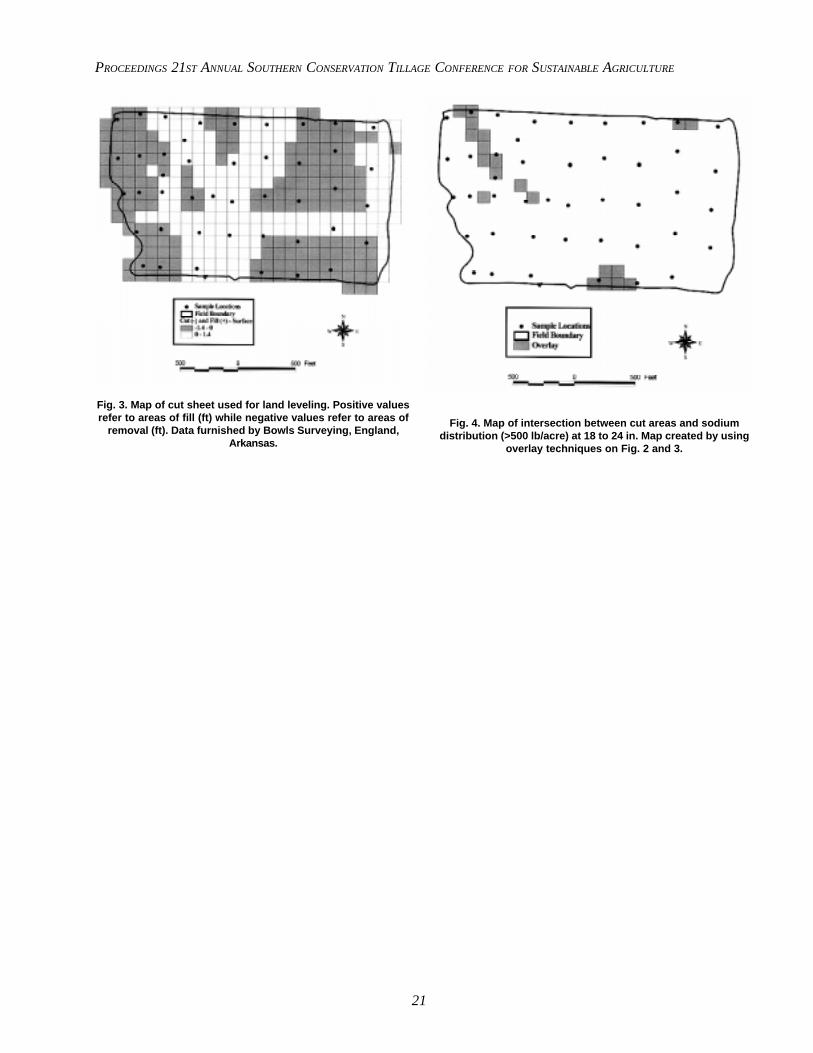
Soil test results indicated low fertility levels of P, Kand pH (Table 1). Field averages of electrical conductivity(EC) and sodium did not indicate excessive levels ofsoluble salts or sodium at any depth interval. However,sodium levels at all depth intervals were highly variableranging from 100 lb/acre to greater than 999 lb/acre(Maximum value reported by lab) with coefficients of varia-tion, ranging from 62 to 80%. For a silt loam texture, it isthought that sodium values exceeding 500 lb/acre wouldadversely impact crop growth. The number of acres ex-ceeding this threshold value increased from 6 acres in thetop 12 in. to 7 acres at the 12- to 18-in. depth interval to24 acres at the 18- to 24-in. depth interval (Fig. 1 and 2).
Because the farmer was considering land leveling thisfield, elevation data (locations recorded with DGPS) rela-tive to a benchmark datum was obtained from Bowls Sur-veying (Fig. 3). Overlaying procedures using GIS softwarewere performed on the maps in Fig. 2 and 3 to determineif land leveling would expose more acreage exceeding the500-lb/acre sodium threshold (Fig. 4). From this analysis,it was determined that potentially 4 more acres of sodiumexceeding the threshold might occur in the top 12 in. ifland leveling was performed.
USING GRID SOIL SAMPLING IN THE MANAGEMENT OF PROBLEM SOILS 1
M.B. Daniels, S.L. Chapman, R. Matlock and A. Winfrey
U
1Published in Arkansas Soil Fertility Studies 1997, Wayne E. Sabbe, editor.Arkansas Agricultural Experiment Station Research Series 459:24-28.
ARKANSAS AGRICULTURAL EXPERIMENT STATION SPECIAL REPORT 186
20
PRACTICAL APPLICATION
The results obtained from this study have been used tohelp make crucial management decisions related to thisfield. From Fig. 1, it was determined that 8% of the fieldcould suffer crop damage from salt. From Fig. 2, 3 and 4,it was determined that land leveling could potentially in-crease the sodium hazard in the top 12 in. of the root zoneby 4 acres up to a total of 13% of the acreage. The farmerproceeded with land leveling because he felt the advantageof better water management outweighed the small increase(5%) in sodium hazard.
By knowing the sodium distribution, the producer wasable to prioritize his management options. Instead of fo-cusing his attention on the 8% of the field affected bysodium, he can address the low fertility problems in theother 92% of the field where pH, P and K are limitingcrop production. Before, it was assumed that poor cropproduction from the field as a whole was a result of highsalt levels rather than poor fertility.
LITERATURE CITED
SSToolbox. 1996. SST Development Group, Inc. 824 N. Country ClubRd., Stillwater Oklahoma 74075-0918.
Table 1. Selected soil test results by depth.
Depth ph P K Na EC
In. --------lb/acre-------- µmhos/cm0-6 Mean 4.7 11 67 320 190
s.d. (+/-) 0.3 4 13 253 265Minimum 3.9 10 50 100 35Maximum 5.6 29 105 999 1366
6-12 Mean 4.8 11 52 328 128s.d. (+/-) 0.5 4 8 220 140Minimum 3.9 10 50 113 24Maximum 6.8 34 105 999 620
12-18 Mean 4.7 11 53 350 134s.d. (+/-) 0.4 2 12 219 141Minimum 3.9 10 50 143 24Maximum 6.8 19 129 999 620
18-24 Mean 4.6 10 57 418 153s.d. (+/-) 0.3 --- 15 269 148Minimum 4.0 --- 50 136 31Maximum 6.2 --- 148 999 682
Fig. 1. Map of field boundary, soil sample location and sodium(lb/acre) distribution in the top 6 in. Grid cells represent
10,000 ft 2 (~0.25 acres).
Fig. 2. Map of sodium (lb/acre) distribution at 18 to 24 in. Eachgrid cell represents 10,000 ft 2 (~0.25 acres).
PROCEEDINGS 21ST ANNUAL SOUTHERN CONSERVATION TILLAGE CONFERENCE FOR SUSTAINABLE AGRICULTURE
21
Fig. 4. Map of intersection between cut areas and sodiumdistribution (>500 lb/acre) at 18 to 24 in. Map created by using
overlay techniques on Fig. 2 and 3.
Fig. 3. Map of cut sheet used for land leveling. Positive valuesrefer to areas of fill (ft) while negative values refer to areas of
removal (ft). Data furnished by Bowls Surveying, England,Arkansas.

ARKANSAS AGRICULTURAL EXPERIMENT STATION SPECIAL REPORT 186
22
INTRODUCTION
erformance of no-tillage cotton (Gossypiumhirsutum L.) in the mid-South has ranged from yielddecreases (Brown et al., 1985; Stevens et al., 1992)
to yield increases (Bradley, 1995; Triplett et al., 1996).Both the Brown et al. (1985) and Stevens et al. (1992)studies were conducted for three years with no-tillageyields improving as studies progressed. Triplett et al.(1996) reported reduced no-tillage yields for the first yearof their study with improved productivity as time pro-gressed so that no-tillage yields were greater than conven-tional during years three through five. Thus, a period oftime may be required for cotton yields to reach their fullpotential following implementation of no-tillage practices.Site characteristics may be a factor, as well, in perfor-mance of different systems as all studies cited were lo-cated on coarse ormedium textured soils.
In the non-irrigated study reported by Triplett et al.(1996), percentage yield improvement with no-tillage wasgreatest during moderately dry years. This implies thatno-tillage improved moisture relations in some manner.Increased moisture for the crop could have resulted fromincreased rainfall infiltration through established macro-pores, slower runoff due to mulch, reduced evaporationunder mulch, some factor not yet identified or a combina-tion of factors. With a pattern of improved crop produc-tivity clearly established for no-tillage in longer-term stud-ies for cotton as well as other crops (Bruce et al., 1995),efforts to identify mechanisms involved become appro-priate. An area that has received scant attention in no-tillage cotton research is the possible contribution of my-corrhizae to the growth and productivity of the crop.
In mycorrhizal associations, fungi of the familyEndogenaceae colonize roots of host plants. Most plantfamilies form mycorrhizal associations, including cotton,corn (Zea mays L.), wheat (Triticum aestivum L.) andmany weed species present between crops or concurrentwith the crop. In these associations the hyphae of the fun-gal species invade plant roots and form arbuscules, whichfacilitate ready exchange of nutrients between the hostand fungus, resulting in the association known as VAM(Vesicular Arbuscular Mycorrhizae). This association canbe parasitic, benign or beneficial, but it is commonly mu-
tualistic with the fungus receiving energy from the plant.The plant, in turn, may receive several benefits from theassociation. Rich and Bird (1974) reported that early-sea-son root and shoot growth of cotton was increased in thepresence of mycorrhizal fungi and that these plants flow-ered and matured bolls earlier. Zak et al. (1998) suggestthat the fungus forms a hyphal network in the soil that canserve as an extension of the plant root system. Thus, aseedling that is colonized early can explore a much greatersoil volume than is possible with a newly developing rootsystem. Inorganic ions such as P and Zn are absorbed bythe fungus and transferred to the plant. This improvementof P nutrition is a critical factor in soils with low P con-tent. In turn, this can lead to reduced fertilizer require-ments and more efficient use of soil nutrients (Marschnerand Dell, 1994).
The hyphal network may also transport moisture to theplant, replacing water lost through transpiration and bettermaintaining plant turgor during dry periods. Mycorrhizalplants recover faster following moderate water deficits(Safir et al., 1971). This also implies that VAM plantsmay exhaust stored soil moisture more thoroughly thanplants without an extensive hyphal network in place. Thecolonized plants may also avoid some stresses caused bynematodes (Hussey and Roncadori, 1982) and some plantdiseases (Linderman, 1992). Tillage fragments the hyphalnetwork so that it must be reestablished as the crop devel-ops. With no-tillage, an existing network remains intactand may be exploited by seedling plants (Zak et al., 1998).The study reported here was initiated to investigate differ-ences in cotton growth, nutrient uptake and VAM coloni-zation as influenced by tillage practices.
MATERIALS AND METHODS
No-tillage following a killed wheat cover crop and con-ventional tillage cotton plots established in 1988, as de-scribed by Triplett et al. (1996), were used in these stud-ies. The cotton was planted in early May 1996. The treat-ments described below were imposed on individual plotsand/or plants within the study area.
Plant DevelopmentNode counts and plant height measurements were be-
gun 5 June when plants were at the four-node stage andapproximately 5 in. tall. Measurements were continued ona weekly basis until 6 July.
1Area Extension Agent, Prof. Plant and Soil Sci. Dept., Agronomist USDA-ARS National Sedimentation Lab., Prof. Plant Path., Prof. Biochemistry andHead MAFES Experimental Statistics.
VESICULAR ARBUSCULAR MYCORRHIZAE (VAM) IN NO-TILLAGE COTTON
Ernest H. Flint, Jr., Glover B. Triplett, Jr., Seth M. Dabney,William H. Batson, Dawn S. Luthe and Clarence E. Watson1
P

PROCEEDINGS 21ST ANNUAL SOUTHERN CONSERVATION TILLAGE CONFERENCE FOR SUSTAINABLE AGRICULTURE
23
Root ColonizationRoot tissue samples were selected at random from both
tillage treatments in two blocks. Block A had a depth tofragipan of 34 in., a 3 to 4% slope and a history of equalyields for both tillage systems. Block B had a 5 to 6%slope, a fragipan depth of 22 in. and a yield history of no-tillage greater than conventional. Plants were sampled on29 June at the 10-node stage. Five 1-cm sections of roottissue were selected from each of four plants in eachtillage system. Root segments were stained, and coloniza-tion sites per cm of root length were recorded.
Hyphal Network and Phosphorus Uptake StudiesThree days after emergence, the following treatments
were imposed on 10 individual seedlings in both tillageblocks: 1) no disturbance, 2) a 4-in.-diameter core cutterused to cut around the plant and a 6-in.-deep core re-moved, wrapped in nylon mesh with 60µ diameter open-ings and replaced and 3) core cut as in 2) but not removed.The nylon mesh openings were small enough to excluderoots but permitted hyphal penetration. To assess the hy-phal network, plants were allowed to develop until maturewith open bolls. The fabric was then removed, stained andexamined for mycorrhizal hyphae. Counts of a single fab-ric sample from each plant were made within a 1000µmicroscope reticle scale, rotating the eyepiece to create acircle of 1000µ. Each hyphal strand crossing a fabric porewas counted and recorded.
In the phosphorus uptake study, 10 days after emer-gence one microcurie of 32P orthophosphate was injected1 in. deep, 6 in. from individual cotton seedlings in treat-ments one, two and three described above. At the initialsampling, plants had only one fully formed leaf. This in-creased to two by the last sampling. Leaves from fourplants were sampled one, four and eight days after 32Papplication by cutting four 1-cm-diameter discs from tis-sue of each leaf. The amount of radioactivity taken up bythe leaves was determined by scintillation spectroscopy.
Physiological EvaluationsThese studies were done with a portable Li-Cor LI-
6400 Photosynthesis System through courtesy of the MSUCrop Simulation Laboratory. The data were collected on13 August 1996 under clear skies with temperatures inthe range of 89 to 91 degrees F. Data collected includedevaluations of stomatal conductivity, transpiration and levelof photosynthesis.
RESULTS
In preliminary results from these studies, the mean nodenumber for conventional tillage and no-tillage plants weresimilar (4.2 and 4.3, respectively). Initial plant heightswere significantly different (5.0 vs. 5.8 in., respectively)
for till and no-tillage. During the measurement period,no-tillage plants developed a node each 4.4 days vs. 4.7days for plants in tilled soil. Plants in tilled soil grewsignificantly more slowly (0.54 in./day) than no-tillageplants (0.83 in./day). Although seedlings emerged in bothtillage systems at the same time, plants in the no-tillagetreatment grew taller and developed more rapidly than thosein the tilled area. Vivekanandan and Fixen (1991) reporteda similar vegetative growth response in corn which theyattributed to mycorrhizal activity.
In the colonization study, the overall VAM coloniza-tion intensity was greater for no-tillage in the deeper soil(Table 1). However, the colonization pattern shown heredoes not explain the previously observed crop yield pat-tern of equal yields for both tillage systems in area A.Little information is available to indicate how degree ofcolonization influences mycorrhizal symbiosis.
In the hyphal network study, 34 hyphae/1000µ circlecrossed the nylon mesh barrier with no-tillage. This wassignificantly greater than the 9 hyphae/1000µ circle in thetilled treatment. By the time the mesh and plants wereremoved, the plant root system completely occupied theconfines of the mesh cylinder. The greater hyphal countsfor no-tillage indicate that the hyphal strands were morenumerous in the untilled soil, complementing the greatercolonization intensity shown in Table 1. This supports, butdoes not confirm, the presence of a more established hy-phal network in untilled soil.
In the phosphorus uptake study, no radioisotope activ-ity level significantly greater than background was detecteduntil eight days following injection of the tracer and thenonly for the uncut treatment (Table 2). Since P is immo-bile in the soil, the isotope was accessed by the planteither by root uptake or transported through VAM hyphae.Lack of uptake for the cut treatment supports the premisethat the hyphal network was disrupted by cutting and wasnot reestablished and functional when the small plants weresampled.
Results from the physiological measurements are shownin Table 3. The no-tillage cotton plants were more ac-tively transpiring at the time measurements were taken.This suggests that plants under no-tillage were able toobtain more moisture from the soil than under conven-tional tillage; however, the level of photosynthesis wassimilar for the two tillage treatments.
Results from the studies with cotton reported here com-pare favorably with published reports dealing with VAMand other crops. While no cause-and-effect relationshipsare definitely established, evidence is such that the role ofVAM in no-tillage cotton production warrants further ex-ploration.

ARKANSAS AGRICULTURAL EXPERIMENT STATION SPECIAL REPORT 186
24
LITERATURE CITED
Bradley, J.F. 1995. Success with no-till cotton. pp. In: M.R.McClelland et al. (ed.). Conservation -tillage systems for cotton.Ark. Agric. Exp. Stn. Spec. Rep. 169:31-35.
Brown, S.M., T. Whitewell, J.T. Touchton and C.H. Burmester. 1985.Conservation tillage systems for cotton production. Soil Sci. Soc.Am. J. 49:1256-1260.
Bruce, R.R., G.W. Langdale, L.T. West and W.P. Miller. 1995.Surface soil degradation and soil productivity restoration andmaintenance. Soil Sci. Soc. Am. J. 59:654-660.
Hussey, R.S., and R.W. Roncadori. 1982. Vesicular arbuscularmycorrhizae may limit nematode activity and improve plantgrowth. Plant Dis. 66:9-14.
Linderman, R.E., 1992. Vesicular-arbuscular mycorrhizal and soilmicrobial interactions. In: Mycorrhizae in sustainableagriculture. Am. Soc. Agron. Spec. Pub 54:45-69.
Marschner, H., and B. Dell. 1994. Nutrient uptake in mycorrhizalsymbiosis. Plant and Soil. 159:89-102.
Rich, J.R., and G.W. Bird. 1974. Association of early-seasonvesicular-arbuscular mycorrhizae with increased growth anddevelopment of cotton. Phytopathology 64:1421-1425.
Safir, G.R., J.S. Boyer and J.W. Gerdemann. 1971. Mycorrhizalenhancement of water transport in soybeans. Science 172:581-583.
Stevens, W.E., J.R. Johnson, J.J. Varco and J. Parkman. 1992. Tillageand winter cover management effects on fruiting and yield ofcotton. J. Prod. Agric. 5:570-575.
Tinker, P.B.H. 1975. Effects of vesicular mycorrhizae on higherplants. Phil. Trans. R. Soc. Lond. B. 273:445-461.
Triplett, G.B., Jr., S.M. Dabney and J.H. Siefker. 1996. Tillagesystems for cotton on silty upland soils. Agron. J. 88:507-512.
Vivekanandan, M., and P.E. Fixen. 1991. Cropping systems effects onmycorrhizal colonization, early growth, and phosphorus uptake ofcorn. Soil Sci. Soc. Am. J. 55: 136-140.
Zak, J.C., B. McMichael, S. Dhillion and C. Friese. 1998. Arbuscular-mycorrhizal colonization dynamics of cotton (Gossypiumhirsutum L). growing under several production systems on theSouthern High Plains, Texas. Agriculture Ecosystems &Environment. (In press)
Table 1. Colonization of cotton roots by mycorrhizal fungiunder no-tillage and conventional-tillage culture.
Tillage MethodArea No-tillage Conventional
-------------sites per/cm root-------------A 12.25a1 3.10cB 6.35b 4.90bcMean 9.3 4.0LSD (0.05) = 2.371Means not followed by the same letter are different at the 0.05 level ofprobability.
Table 2. Relative amount of 32P (CPM) found in leaf tissue.
Treatment Mean
Uncut 17.43a1
Cut 3.73bMesh 2.53bLSD(0.05)=11.211Means not followed by the same letter are different at the 0.05 level ofprobability
Table 3. Evaluations of stomatal conductivity, transpirationand level of photosynthesis.
Treatment MeanStomatal ConductivityNo-Tillage 0.219a1
Conventional Tillage 0.171bLSD(0.05)= 0.04
TranspirationNo-Tillage 3.77aConventional Tillage 3.18bLSD(0.05)= 0.57
PhotosynthesisNo-Tillage 18.85aConventional Tillage 17.66aLSD(0.05)=1.421Means not followed by the same letter are different at the 0.05 level ofprobability.

PROCEEDINGS 21ST ANNUAL SOUTHERN CONSERVATION TILLAGE CONFERENCE FOR SUSTAINABLE AGRICULTURE
25
INTRODUCTION
weet corn (Zea mays L.) is an economically impor-tant crop for Florida. The hot-humid climate inFlorida provides an environment for off-season
sweet corn production at a time when most of the U.S. istoo cold for corn growth. This same environment also isfavorable for large populations of insect pests, which canreduce yield and quality. Past studies have shown that theuse of the insecticides Counter (terbufos) and Furadan(carbofuran), at planting of field corn, can significantlyincrease yield (Gallaher, 1983, 1986a,b; Gallaher andBaldwin, 1985; Espaillat and Gallaher, 1989). All of theabove research in the 1980’s was with the use of Furadan15G. This granular formulation was widely used at thetime but became restricted and largely unavailable and wasreplaced with a non-granular formulation. The granular prod-uct had the advantage of ease of application and incorpo-ration in the seed furrow or row and was easily activatedaround the seed zone. The liquid product, Furadan 4F avail-able for use at present in Florida, is thought to requiremore sophisticated equipment in order to obtain good ac-tivation in the seed furrow-zone.
In these earlier studies with field corn, we found thatFuradan performed better than Counter under no-tillagemanagement, but the two products were equally effectivein conventional tillage systems. Another discovery wasthat field corn hybrids responded more favorably to theinsecticide that had been used in the hybrid breeding pro-gram. It was not unusual to obtain 40 to 50 bu/acre yieldincreases from the use of insecticides applied in the rowat planting time (Espaillat and Gallaher, 1989). These ma-terials also show activity as nematicides (Norton et al.,1978). After the loss of the granular formulation ofFuradan in Florida, sales of this product were significantlyreduced.
The objectives of this investigation were to determine1) the yield differences among five sweet corn hybridsunder no-till management, 2) the effectiveness of the useof Furadan 4F formulation sprayed in a band over the cornrow at planting and 3) effects on plant-parasitic nematodepopulations.
MATERIALS AND METHODS
The split-plot experiment was conducted on a Arredondofine sand on the University of Florida, Green AcresAgronomy Field Laboratory in 1997. Main plots were fivesweet corn hybrids (‘XPH 3084’; ‘VXT 5 Forever’; ‘VNE2 Endeavor’; ‘VNT 5 Punchline’; ‘XPH 3105’), planted at28,000 plants/acre, in four-row plots, 2.5 ft wide and 20ft long. The two subplots were with the application ofcarbofuran (formulated as Furadan 4F) at 1.0 lb ai/acre(the labeled rate) versus a control without application ofcarbofuran.
The experimental site was planted to a cover crop of‘Tift Blue” lupin (Lupinus angustifoilus L.) in the fall of1996. On 17 April 1997, the sweet corn was planted di-rectly into the standing lupin with a Brown-Harden In-Row Subsoil (Strip-till) no-tillage planter, using John DeereFlexie 71 planter units. On 21 April 1997, 1.8 quarts BicepII (mixture of atrazine and metolachlor)/acre plus 2 quartsRoundup (glyphosate)/acre were broadcast over the ex-periment. On 22 April 1997, the subplot Furadan treat-ments were imposed by spraying the 1.0 lb ai/acre treat-ment in a 6-in. band over the row. The Furadan was mixedwith water at a delivery rate of 30 gallon liquid/acre. Theexperiment was irrigated within a few hours after applica-tion of Furadan with 1/3 acre-in. of water to move theFuradan into the seed zone. On 6 May, 55 lb N/acre wasapplied as ammonium nitrate. On 13 May 480 lb 13 (N) -5 (P
2O
5) - 29 (K
2O) - 1 (Mg) - 2.5 (S)/acre was broadcast
over the experiment. An additional 50 lb N/acre as ammo-nium nitrate was applied 4 June. Supplemental weed con-trol was by hooded sprayer, post-direct application of 1.5pints Gramoxone Extra (paraquat), with non ionic surfac-tant added at the rate of 1 pint/100 gallon water.Gramoxone Extra was sprayed in 30 gallon water/acre.Supplemental gun irrigation water was applied six times atapproximately 1 acre-in. each time during the growingseason.
The two center rows were harvested for fresh ear andstalk weight on 30 June. Subsamples were taken to deter-mine dry matter yield. Soil samples for nematode analysiswere collected over each replication and combined at plant-ing time. Additional samples were collected 18 July fromall plots. Each nematode sample consisted of six cores ofsoil (1 in. diameter and 8 in. deep) collected in a system-atic pattern and then combined into a plastic bag for trans-port. In the laboratory, a 100-cm3 soil subsample was re-
1Agronomy Department and Entomology and Nematology Departmentrespectively, University of Florida, Institute of Food and Agricultural Sciences,Gainesville, FL.
NO-TILLAGE SWEET CORN HYBRID RESPONSE TO CARBOFURAN (FURADAN 4 F)
R.N. Gallaher and R. McSorley1
S

ARKANSAS AGRICULTURAL EXPERIMENT STATION SPECIAL REPORT 186
26
moved for nematode extraction using a modified sievingand centrifugation procedure (Jenkins, 1964). Extractednematodes were identified and counted under an invertedmicroscope. All data were analyzed by an analysis of vari-ance for a split-plot design, followed by mean separationby F test or Duncan’s multiple-range test as appropriate.
RESULTS AND DISCUSSION
All sweet corn hybrids responded to application ofFuradan (Table 1). Averaged over all hybrids, fresh earweight was 25% greater from the application of Furadancompared to the control. This same statistic for fresh stalkweight was a 35% yield increase from application ofFuradan. Fresh ear yield appeared to be greatest for XPH3084, which was equal to VNE 2 Endeavor. Lowest yieldswere obtained by XPH 3105. Average fresh ear yield forVNE 2 was almost 40% greater than that of XPH 3105,and with the application of Furadan the difference waseven greater (almost 45%) (Table 1).
In contrast to what one might expect, Furadan did notreduce nematode numbers as measured 18 July. In fact,root-knot nematode numbers were over 90% greater inplots receiving Furadan compared to the control plots(Table 2). However, of the two highest fresh ear yieldinghybrids, VNE 2 Endeavor, had significantly lower root-knot nematode counts compared to XPH 3084.
Our data show that sweet corn hybrid selection is criti-cal if yield is a major factor under consideration (Table1). With yield increases as much as or more than 35%from the application of Furadan, it is obvious that this isone management input that requires consideration by grow-ers, under conditions of this experiment. These sweet cornyield responses to application of Furadan are similar tothose found for field corn hybrids (Gallaher and Baldwin,1985; Gallaher, 1983, 1986a,b; Espaillat and Gallaher,1989). No information was available regarding type ofpesticide used in the breeding and development of thesweet corn hybrids used in this study. It is also evidentthat Furadan impacted insects or other pests in these sweetcorn hybrids other than the four nematodes measured inthis investigation. It appears that application of Furadanresulted in an environment that stimulated better plantgrowth, which in turn resulted in the healthier plants beingable to tolerate larger populations of root-knot nematodes.This has been observed and reported for other crops andcropping systems (McSorley and Gallaher, 1997).
ACKNOWLEDGMENTS
The authors thank Howard Palmer, Walter Davis, JohnFrederick and Jacqueline Greenwood for technical assis-tance.
LITERATURE CITED
Espaillat, J.R., and R.N. Gallaher. 1989. Corn yield response to tillage,hybrids, and insecticides. pp. 33-36. In: I.D. Teare, E. Brownand C.A. Trimble (eds.). Proceedings, 1989 SouthernConservation Tillage Conference. Special Bulletin 89-1. Inst.Food and Agr. Sci., University of Florida, North Florida Res. andEduc. Center, Quincy, Florida.
Gallaher, R.N. 1983. No-tillage corn and sunflower yield responsefrom Furadan and Counter Pesticides in Alachua County, Floridain 1982. Agronomy Research Report AY-83-05. AgronomyDept., IFAS, Univ. of Florida, Gainesville, Florida.
Gallaher, R.N. 1986a. No-tillage corn response to pesticides, hybrids,and cropping systems at the Green Acres Agronomy Farm in1985. Agronomy Research Report AY-86-05. Agronomy Dept.,IFAS, Univ. of Florida, Gainesville, Florida.
Gallaher, R.N. 1986b. Corn grain yield response to pesticides inconventional and no-tillage management. Agronomy ResearchReport AY-86-09. Agronomy Dept., IFAS, Univ. of Florida,Gainesville, Florida.
Gallaher, R.N., and J.A. Baldwin. 1985. No-tillage corn resultsaffected by hybrids and pesticides in 1984 at the Green AcresAgronomy Farm. Agronomy Research Report AY-85-08.Agronomy Dept., IFAS, Univ. of Florida, Gainesville, Florida.
Jenkins, W.R. 1964. A rapid centrifugal-flotation technique forseparating nematodes from soil. Plant Dis. Reptr. 48:692.
McSorley, R., and R.N. Gallaher. 1997. Methods for managingnematodes in sustainable agriculture. pp. 75-79. In R.N. Gallaherand R. McSorley (eds.). Proceedings 20th Annual SouthernConservation Tillage Conference for Sustainable Agriculture.Special Series SS-AGR-60, the Coop. Extension Service, Inst. ofFood and Agr. Sci., Univ. of Florida, Gainesville, Florida.
Norton, D.C., J. Tollefson, P. Hinz and S.H. Thomas. 1978. Corn yieldincreases relative to nonfumigant chemical control ofnematodes. J. Nematol. 10:160-166.

PROCEEDINGS 21ST ANNUAL SOUTHERN CONSERVATION TILLAGE CONFERENCE FOR SUSTAINABLE AGRICULTURE
27
Table 1. No-till sweet corn yield for five hybrids at two rates ofcarbofuran (Furadan 4F).
Carbofuran rateHybrid 1 lb ai1 0 lb ai Average
----- Fresh ear weight, ton/acre -----XPH 3084 5.37 4.33 4.85 aVNT 5 Forever 4.38 3.86 4.12 bVNE 2 Endeavor 5.01 3.70 4.36 abVNT 5 Punchline 3.57 2.77 3.17 cXPH 3105 3.47 2.85 3.16 c
Average 4.36 3.50 *---Fresh stalk weight, ton/acre---
XPH 3084 8.02 7.23 7.63 aVNT 5 Forever 7.33 5.06 6.20 bVNE 2 Endeavor 6.56 4.52 5.54 bVNT 5 Punchline 6.18 4.04 5.11 bXPH 3105 3.34 2.48 2.91 c
Average 6.29 4.67 *-------Dry ear weight, ton/acre-------
XPH 3084 0.93 c 0.81 a NS 0.87VNT 5 Forever 1.32 b 0.81 a * 1.07VNE 2 Endeavor 1.61 a 0.92 a * 1.27VNT 5 Punchline 1.14 bc 0.74 a * 0.94XPH 3105 1.04 c 0.68 a * 0.86
Average 1.21 0.80------Dry stalk weight, ton/acre------
XPH 3084 1.86 1.87 1.86 aVNT 5 Forever 1.89 1.26 1.58 abVNE 2 Endeavor 1.64 1.32 1.48 bVNT 5 Punchline 1.79 1.11 1.45 bXPH 3105 1.00 0.69 0.84 c
Average 1.64 1.25 *
Data are averages of five replications. Main effect averages in columns(a,b) not followed by the same letter are different (P = 0.05), accordingto Duncan’s multiple-range test. Sub-effect carbofuran with * or NS fordifferences at P = 0.05 or not different at P = 0.05, respectively, accordingto F test, except for the interaction for dry ear weight, in which case LSDwas used (LSD = 0.23).
1Carbofuran was formulated as Furadan 4F.
Table 2. Effect of carbofuran (Furadan 4F) treatment andsweet corn hybrid on population levels of plant-parasitic
nematodes.
Nematodes per 100 cm3 soil18 July
Hybrid 1 April1 + carbofuran2 - carbofuran Average
Ring nematodes, Criconemella sppXPH 3084 123 138 130 aVNT 5 Forever 154 182 168 aVNE 2 Endeavor 170 195 183 aVNT 5 Punchline 122 100 111 aXPH 3105 214 192 203 a
Average 128 157 161 NS
Root-knot nematodes, Meloidogyne incognitaXPH 3084 322 130 226 aVNT 5 Forever 250 123 186 abVNE 2 Endeavor 95 39 67 bVNT 5 Punchline 55 61 58 bXPH 3105 59 51 55 b
Average 14 156 81 *
Stubby-root nematodes, Paratrichodorus minorXPH 3084 5 2 3 aVNT 5 Forever 4 7 5 aVNE 2 Endeavor 9 5 7 aVNT 5 Punchline 2 6 4 aXPH 3105 5 2 3 a
Average 9 5 5 NS
Lesion nematodes, Pratylenchus sppXPH 3084 35 36 35 aVNT 5 Forever 43 39 41 aVNE 2 Endeavor 22 49 36 aVNT 5 Punchline 53 57 55 aXPH 3105 26 37 31 a
Average 10 5 5 NS
Data are means of five replications. Main effect averages in columns(a,b) not followed by the same letter are different (P = 0.10), accordingto Duncan’s multiple-range test. Sub-effect carbofuran with * or NS fordifferences at P = 0.10 or not different at P = 0.10, respectively, accordingto F test. No interactions were significant at P = 0.10.
1Data from 21 April pooled across all treatments; average of fivereplications.
2Carbofuran (Furadan 4F) treatments: + = 1.0 lb ai/acre; - = untreatedcontrol.
ARKANSAS AGRICULTURAL EXPERIMENT STATION SPECIAL REPORT 186
28
INTRODUCTION
he amount of municipal solid waste produced an-nually in Florida grew to approximately 50 mil-lion tons in 1992. This represents over 7.9 lb/
resident/day and is twice the national average of about 4lb/person/day (Smith, 1994). Biodegradable organic wastethat could be composted comprises almost 60% of thetotal municipal solid waste. Compostable organic matterin municipal solid waste includes such things as yard trim-mings, paper, fast foods, animal manure, crop residuesand food processing residuals. Yard waste trimmings makeup 7.4 million tons annually in Florida (Smith, 1994).Should all yard waste trimmings be composted, about 4million tons of compost could be produced annually. Inthe U.S., federal law prohibited the use of unlined land-fills by 1994 (Kidder, 1993). Florida law restricts thedisposal of organic yard waste in lined landfills. Theselaws have encouraged a large industry to develop in Florida,whose objective is to produce wood chip mulch and com-post from yard waste, often called yard waste compost(YWC). These products should be environmentally safe toapply to farmland and result in potential benefits not onlyto the farmer but also to society as a whole. For example,YWC can be applied in large quantities to farmland tohelp improve soil properties and crop yield (Gallaher andMcSorley, 1994, 1995; Giordano et al., 1975; Kluchinskiet al., 1993; Mays and Giordano, 1989; Mays et al., 1973;Wolley, 1995).
Nitrogen is the single-most-important fertilizer inputand is required in the largest quantities for crop produc-tion (Olson and Sander, 1988). A sweet corn crop has asufficient level of N if the concentration in the diagnosticear leaf at full silking and tasseling is between 2.5 and3.0% (Jones et al., 1991). Normal N fertilizer recom-mendations may differ significantly for crops grown onsoils having received large quantities of YWC or otherbiodegradable organic waste product. Legumes are knownto contain significant quantities of N and other fertilizerelements and can serve as sources of organic fertilizer(Wade et al., 1997; Wieland et al., 1997; Xiao et al., 1998).Soil K and Mg increased and diagnostic leaf N and Pconcentrations increased as cowpea (Vigna unguiculata
L.) pod yield increased with increasing rates of lupin hay(Wieland et al., 1997). Studies showed that application of2 to 3 tons of lupin (Lupinus angustifolius L.) hay/acrewould maximize cowpea yield (Wieland et al., 1997; Xiaoet al., 1998). In another study, bushbean pod yield reachedmaximum at 2 tons/acre crimson clover (Trifoliumincarnatum L.) hay (Wade et al., 1997). The objective ofthis study was to investigate the changes in soil propertiesand impact on sweet corn (Zea mays L.) yield from use ofYWC at five rates of lupin hay as an organic source of Nand other nutrients.
MATERIALS AND METHODS
This research was conducted the fifth year (1997) fol-lowing application of 120 ton YWC/acre each year for theprevious four years (Table 1). A winter cover crop of ‘TiftBlue’ lupin was mowed closely just prior to planting sweetcorn. ‘Silver Queen’ sweet corn was planted at 28,000plants/acre in four-row plots, 30 in. wide and 12 ft longusing a Brown-Harden in-row subsoil no-till (strip-till)planter. Seeders on the planter were John Deere Flexie71’s. The three main-plot treatments were residual YWCcumulative treatments (480 ton YWC/acre no-till; 480ton YWC/acre conventional tillage; conventional tillagecontrol) from the past four years. No additional YWC wasapplied in 1997 prior to planting this experiment. Sub-plots were five rates of lupin hay (0, 2, 4, 6, 8 ton/acre) asa source of organic fertilizer, either incorporated just priorto planting or side-dressed as a mulch immediately afterplanting. All treatment combinations were replicated fourtimes. The crop was hand hoed for weed control as needed.Approximately 1 acre-in. of irrigation was applied sixtimes. No chemical management inputs were made. Earleaf samples were collected at early silking and analyzedfor N concentrations (Gallaher et al., 1975). Soil sampleswere collected from the top 8 in. in February priortoplanting corn and in August following corn harvest. Soilsamples were analyzed for extractable nutrients, pH, or-ganic matter and cation exchange capacity. Soils were fur-ther analyzed for plant-parasitic nematodes using appro-priate procedures (McSorley and Gallaher, 1997; andJenkins, 1964). All data were analyzed by analysis of vari-ance for a split-plot design, followed by mean separationby Duncan’s multiple-range test.
SWEET CORN RESPONSE TO YARD WASTE COMPOSTAND LUPIN HAY FERTILIZER TREATMENTS
R.N. Gallaher, J.D. Greenwood and R. McSorley1
1University of Florida, Institute of Food and Agricultural Sciences, AgronomyDepartment (Gallaher and Greenwood) and Entomology and NematologyDepartment (McSorley), Gainesville, Florida.
T

PROCEEDINGS 21ST ANNUAL SOUTHERN CONSERVATION TILLAGE CONFERENCE FOR SUSTAINABLE AGRICULTURE
29
RESULTS AND DISCUSSION
The residual impact of application of large quantitiesof YWC, including large quantities of plant nutrients andorganic matter (Table 1), resulted in significant improve-ment in soil quality for the beginning of this investigation(Table 2). Little differences existed between the two YWCtreatments, but both were several hundred percent greaterin most properties than the control. This condition per-sisted throughout the duration of the experiment, as evi-denced by the summer soil test that followed (Table 2). Itis obvious that the previously applied YWC should have asignificant impact on crops growing under these condi-tions.
Yield of fresh and dry sweet corn ears shows that YWCwas effective in increasing yield as evidenced by the in-tercept for the three YWC treatments (Fig. 1). Yield washighest for the YWC treatment when corn was grown un-der no-tillage management, intermediate for YWC con-ventional tillage and least for the control. These differ-ences among the three YWC treatments were consistentacross all five lupin hay rates (Fig. 1). Data show thatmaximum fresh ear yield was achieved at about 2 ton lupinhay/acre for YWC no-till treatment, about 4 ton lupin hay/acre for YWC conventional tillage treatment and about 6ton lupin hay/acre for the conventional tillage control treat-ment. One possible explanation for the higher yields forYWC no-till treatment is the likely conservation of soilwater from the lack of soil disturbance as well as lupinhay mulch benefits. Lupin hay on the soil surface wouldalso result in slower release of plant nutrients in the hay,and thus reduce the potential for excessive leaching ofnutrients out of the root zone during heavy rainfall events,as compared to incorporation.
Nitrogen concentration in the ear leaf (Table 3) washighly correlated with ear yield (Fig. 1) and was directlycaused by increasing rates of lupin hay (Table 3). Suffi-ciency levels (Jones et al., 1991) for N in the ear leafwere achieved for both YWC treatments at 2 ton YWC/acre but required 6 ton YWC/acre for the control. Thisevidence, along with yield data, further supports the factthat residual effects of YWC not only improve soil qual-ity but also provide an environment for increased cropyield and leaf quality. It also indicates that lupin hay is apossible source of organic fertilizer in all of the YWCtreatments.
Nematodes were not affected either by YWC treat-ments or by the application of lupin hay (Table 4). Signifi-cant quantities of ring and root-knot nematodes werepresent, and both increased in numbers by the end of thecrop season. Therefore, yield differences in this studywere not the result of the nematodes measured.
ACKNOWLEDGMENTS
The authors thank Jim Chichester, Howard Palmer,Walter Davis and John Frederick for technical support andMr. Tom Fulmer of Enviro-Comp Services, Inc., Jackson-ville, Florida, for providing the yard waste compost usedin this study.
LITERATURE CITED
Gallaher, R.N., and R. McSorley. 1994. Soil water conservation frommanagement of yard waste compost in a farmer’s corn field.Agronomy Res. Rept. AY-94-02. Agronomy Dept., Inst. Food& Agr. Sci., Univ. of Florida, Gainesville, Florida.
Gallaher, R.N., and R. McSorley. 1995. Conventional and no-tillagevegetables using yard waste compost. Agronomy Res. Rept.AY-95-01. Agronomy Dept., Inst. Food & Agr. Sci., Univ. ofFlorida, Gainesville, Florida.
Gallaher, R.N., C.O. Weldon and J.G. Futral. 1975. An aluminumblock digester for plant and soil analysis. Soil Sci. Soc. Amer.Proc. 39:803-806.
Giordano, P.M., J.J. Mortvedt and D.A. Mays. 1975. Effect ofmunicipal wastes on crop yields and uptake of heavy metals.Journal of Environmental Quality 4:394-399.
Jenkins, W.R. 1964. A rapid centrifugal-flotation technique forseparating nematodes from soil. Plant Dis. Reptr. 48:692.
Jones, J.B., Jr., H.A. Mills and B. Wolf. 1991. Plant AnalysisHandbook. Micro-Macro Publishing, Inc., Athens, Georgia.
Kidder, G. 1993. Applying non-hazardous wastes to land: I.Opportunities and problems. SS-SOS-43, Notes in Soil andWater Science, Univ. of Fla., Inst. Food & Agr. Sci., Coop. Extn.Serv., Gainesville, Florida.
Kluchinski, D., J.R. Heckman, J. Mahar, D.A. Derr and F. Kelly.1993. Leaf mulching: Using municipal leaf waste as a soilamendment. Special Report by New Jersey Agric. Exp. Station,Rutgers Univ., Trenton, New Jersey.
Mays, D.A., and P.M. Giordano. 1989. Land spreading municipalwaste compost. Biocycle 30:37-39.
Mays, D.A., G.L. Terman and J.C. Duggan. 1973. Municipalcompost: Effects on crop yields and soil properties. Journal ofEnvironmental Quality 2:89-92.
McSorley, R., and R.N. Gallaher. 1997. Methods for managingnematodes in sustainable agriculture. pp. 75-79. In: R.N.Gallaher and R. McSorley (eds.). Proc. 20th Annual SouthernConservation Tillage Conference for Sustainable Agriculture.Special Series SS-AGR-60, University of Florida, Inst. Food &Agr. Sci., Coop. Extn. Serv., Gainesville, Florida.
Olson, R.A., and D.H. Sander. 1988. Corn production. pp. 639-686.In: G.F. Sprague and J.W. Dudley (eds.). Corn and cornimprovement. Number 18 in the Agronomy Series. AmericanSociety of Agronomy, Inc., Crop Science Society of America,Inc. and Soil Science Society of America, Inc., Madison,Wisconsin.
Smith, W.H. 1994. Recycling composted organic materials in Florida.Florida Coop. Extn. Serv., Inst. Food & Agr. Sci., Univ. ofFlorida, Gainesville, Florida. BP-2, July 1994.
Wade, B.L., S.J. Rymph and R.N. Gallaher. 1997. Assessment of soil-incorporated crimson clover hay as an organic fertilizer source inthe production of bush bean. pp. 108-116. In: R.N. Gallaher andR. McSorley (eds.). Proc. 20th Annual Southern Conservation

ARKANSAS AGRICULTURAL EXPERIMENT STATION SPECIAL REPORT 186
30
Tillage Conference for Sustainable Agriculture. Special SeriesSS-AGR-60, University of Florida, Inst. Food & Agr. Sci., Coop.Extn. Serv., Gainesville, Florida.
Wieland, C.E., J.A. Widmann and R.N. Gallaher. 1997. Lupin hay asan organic fertilizer for production of ‘White Acre’ cowpea. pp.100-107. In: R.N. Gallaher and R. McSorley (eds.). Proc. 20thAnnual Southern Conservation Tillage Conference forSustainable Agriculture. Special Series SS-AGR-60, Universityof Florida, Inst. Food & Agr. Sci., Coop. Extn. Serv., Gainesville,Florida.
Wolley, J.S., Jr. 1995. The switch from conventional to sustainable.Resource, April 1995:7-9.
Xiao, Y., M.W. Edenfield, E. Jo and R.N. Gallaher. 1998. Productionand leaf nutritional response of ‘White Acre’ cowpea (Vignaunguiculata) to management strategies of perennial peanut(Arachis glabrata) hay as an organic fertilizer. Agronomy Res.Rept. AY-98-01. Agronomy Dept., Inst. Food & Agr. Sci., Univ.of Florida, Gainesville, Florida.
Table 1. Analysis of yard waste compost used on the GreenAcres Agronomy Field Laboratory research plots.
YearAnalysis 1993 1994 1995 1996
DM %1 45.1 49.8 50.7 57.7OM % 48.2 59.2 42.2 52.2C % 33.5 31.3 33.5 32.0N % 0.81 0.91 0.98 0.63C:N ratio 41.7 34.4 36.4 50.8pH chopped 6.2 7.5 --- 6.5pH ground 6.3 7.1 7.0 6.2Ca % 3.43 3.41 1.14 1.47Mg % 0.18 0.19 0.07 0.17K % 0.22 0.29 0.14 0.31P % 0.17 0.18 0.08 0.15Cu ppm 23.0 18.0 18.0 22.0Fe ppm 1953.0 1825.0 2608.0 2615.0Mn ppm 180.0 188.0 75.0 97.0Zn ppm 102.0 118.0 138.0 148.01DM % = dry matter; OM % = organic matter in DM; chopped = compostsamples were chopped into coarse particles using a grinder; ground =sub-samples of the chopped samples were ground with a Wiley mill topass a 2-mm stainless steel screen. Values are the average of fourreplications. The source of the compost was Wood Resource Recovery,Gainesville, Florida, from 1993 to 1995 and Enviro-Comp Services Inc.,Jacksonville, FL in 1996.
Table 2. Mehlich I extractable elements, Kjeldahl N and other soil analyses after yearly applicationof 120 ton yard waste compost/acre/year from 1993 to 1996.
Cumulative Yard Waste Compost-YWC (120 ton/acre/year)No-till Conv-till Conv-till
Analysis Unit LSD CV 480 ton/acre 480 ton/acre 0 ton/acre
Winter 1997, no YWC added in 1997, test prior to planting sweet cornN ppm 448 21.7% 1613 1530 442P ppm 12 6.3% 140 132 67K ppm 15 20.0% 52 49 25Na ppm 4.3 15.2% 20 19 10Ca ppm 566 21.4% 2163 2042 374Mg ppm 36 17.7% 158 151 46Cu ppm 0.14 19.6% 0.30 0.33 0.61Fe ppm 1.03 14.3% 3.8 4.5 4.1Mn ppm 1.74 13.0% 10.5 9.9 2.8Zn ppm 2.57 13.6% 14.6 14.1 4.0pH 0.15 1.3% 6.9 6.8 6.6BpH NS 0.3% 7.88 7.86 7.86OM % 1.21 21.4% 4.38 4.18 1.31CEC meq/100g 3.18 18.6% 13.35 12.80 3.5
Summer 1997, test following sweet corn harvestN ppm 440 23.2% 1063 1123 428P ppm 22 11.6% 122 126 84K ppm NS 41.6% 40 32 37Na ppm 9.6 15.1% 44 37 30Ca ppm 676 30.2% 1709 1834 336Mg ppm 45 28.7% 115 121 39Cu ppm 0.20 31.2% 0.30 0.33 0.52Fe ppm 2.47 16.1% 7.3 8.5 10.8Mn ppm 3.29 22.1% 10.1 11.2 4.5Zn ppm 4.05 23.6% 12.2 13.4 4.1pH 0.20 2.2% 6.8 6.7 6.2BpH NS 0.3% 7.83 7.82 7.79OM % 0.64 21.5% 4.14 3.82 1.26CEC meq/100g 3.96 25.5% 11.15 11.86 3.89
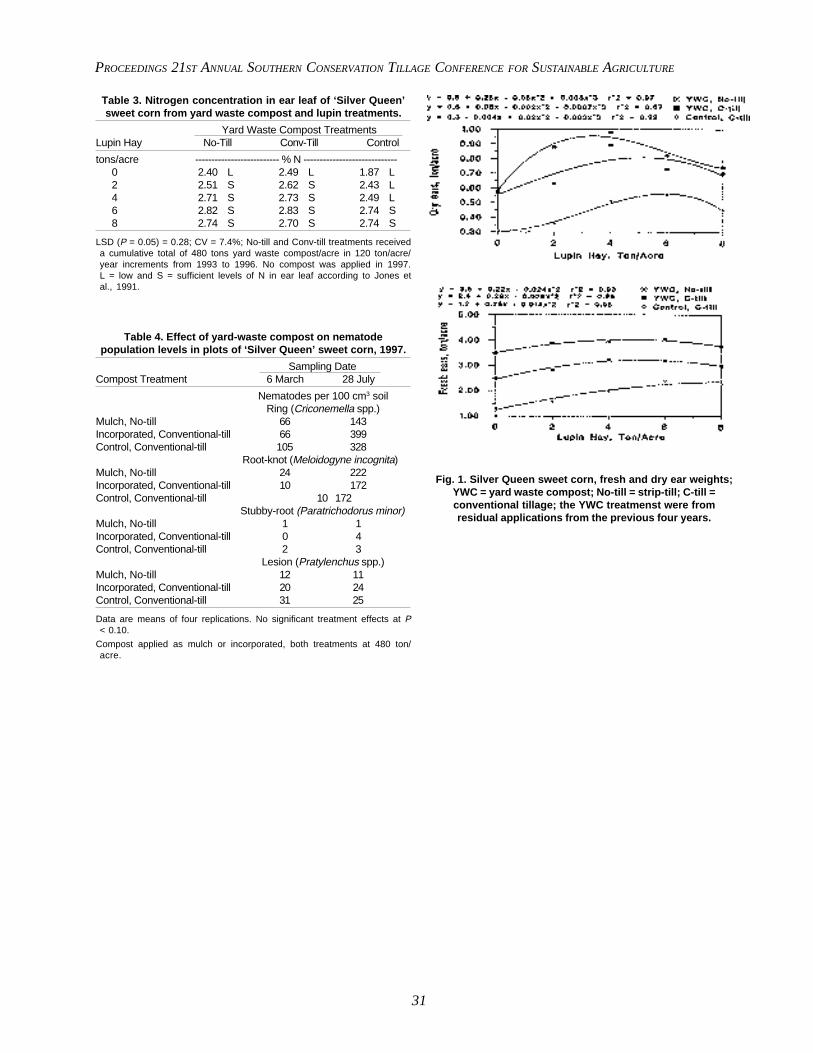
PROCEEDINGS 21ST ANNUAL SOUTHERN CONSERVATION TILLAGE CONFERENCE FOR SUSTAINABLE AGRICULTURE
31
Table 3. Nitrogen concentration in ear leaf of ‘Silver Queen’sweet corn from yard waste compost and lupin treatments.
Yard Waste Compost TreatmentsLupin Hay No-Till Conv-Till Control
tons/acre -------------------------- % N -----------------------------0 2.40 L 2.49 L 1.87 L2 2.51 S 2.62 S 2.43 L4 2.71 S 2.73 S 2.49 L6 2.82 S 2.83 S 2.74 S8 2.74 S 2.70 S 2.74 S
LSD (P = 0.05) = 0.28; CV = 7.4%; No-till and Conv-till treatments receiveda cumulative total of 480 tons yard waste compost/acre in 120 ton/acre/year increments from 1993 to 1996. No compost was applied in 1997.L = low and S = sufficient levels of N in ear leaf according to Jones etal., 1991.
Table 4. Effect of yard-waste compost on nematodepopulation levels in plots of ‘Silver Queen’ sweet corn, 1997.
Sampling DateCompost Treatment 6 March 28 July
Nematodes per 100 cm3 soilRing (Criconemella spp.)
Mulch, No-till 66 143Incorporated, Conventional-till 66 399Control, Conventional-till 105 328
Root-knot (Meloidogyne incognita)Mulch, No-till 24 222Incorporated, Conventional-till 10 172Control, Conventional-till 10 172
Stubby-root (Paratrichodorus minor)Mulch, No-till 1 1Incorporated, Conventional-till 0 4Control, Conventional-till 2 3
Lesion (Pratylenchus spp.)Mulch, No-till 12 11Incorporated, Conventional-till 20 24Control, Conventional-till 31 25
Data are means of four replications. No significant treatment effects at P< 0.10.
Compost applied as mulch or incorporated, both treatments at 480 ton/acre.
Fig. 1. Silver Queen sweet corn, fresh and dry ear weights;YWC = yard waste compost; No-till = strip-till; C-till =conventional tillage; the YWC treatmenst were fromresidual applications from the previous four years.

ARKANSAS AGRICULTURAL EXPERIMENT STATION SPECIAL REPORT 186
32
ABSTRACT
xperiments were conducted at the Northeast Re-search and Extension Center (NEREC) at Keiser,Arkansas, in 1995 and 1996 to determine the influ-
ence of tillage system, planting date and cultivar selectionon soil water storage, soybean (Glycine max, L. Merr.)yield and economics. The soil series was Sharkey siltyclay. ‘Williams 82’, ‘Manokin’ and ‘RA 452’ soybean cul-tivars were planted in mid-April, and RA 452, ‘Pioneer9592’ and ‘Pioneer 9641’ were planted in mid-May, mid-June and mid-July. The cultivars were stripped in threeproduction systems consisting of no-till, fallow and con-ventional. Soil water levels were monitored gravimetri-cally in each tillage system weekly to a depth of 60 cm.The Sharkey silty clay maintained high soil water storageof 8 to 10 cm in the 0- to 60-cm depth. Sharkey silty claywas able to maintain high soil water for April- and May-planted soybean. The adequate soil water resulted in highyields for April- and May-planted soybean with the earlymaturity-group cultivars, Williams 82 and RA 452. De-layed planting dates conserved soil water and resulted inthe highest soybean yields in June- and July-planted soy-bean with Pioneer 9592 and Pioneer 9641. The June no-till production system had the highest costs because ofhigh herbicide usage. The highest net returns correspondedto the highest soybean yields. Overall, under a conven-tional production system on a Sharkey silty clay, the mostprofit was obtained when an early maturity group soybeanwas planted in April or May.
INTRODUCTION
Dryland soybean production encompasses approximately65% of soybean (Glycine max, L. Merr.) grown in Arkan-sas. The low profitability of soybean relative to some otherenterprises has resulted in increased interest in minimuminput production systems. The common occurrence of adrought in the mid-South from mid-July to mid-Septem-ber has contributed to low and stagnant yields in drylandsoybean (Bowers, 1995; Heatherly, 1996). Commonlyplanted Maturity Group V and VI cultivars are in the criti-cal reproductive stages during the late-season drought, andtheir yield potential can be greatly reduced by thesedroughts (Miller, 1994). Dryland producers subjected to
the possibility of drought during a growing season requirea production system to avoid or tolerate the effect of adrought. Manipulation of practices such as tillage system,planting date and cultivar selection could potentially in-crease soybean yield under dryland conditions.
Tillage PracticesTypical soybean production in the mid-South includes
some type of mechanical tillage for seedbed preparation(Bowers, 1995). The general purpose of conventional till-age is to control weeds and create a favorable environ-ment for seed emergence and plant growth. Conventionaltillage provides a tilled soil layer of 15 to 25 cm deep.No-till is a cropping system in which the soil is left un-disturbed prior to planting, and weed control is accom-plished by herbicides. No-till systems are associated withconservation tillage, which is defined as a tillage and plant-ing system that maintains at least 30% of the soil surfacecovered by residue at the time of crop emergence (Dicket al., 1989; Parsch et al., 1993).
CostsDifferent management practices result in varying costs
of production. Webber et al. (1987) noted that no-till pro-duction systems reduce soil erosion, decrease overall fuelconsumption and equipment costs and conserve soil mois-ture. Although no-till generally saves fuel, labor and ma-chinery costs, total costs may be higher due to increasedherbicide expenditures as compared to conventional sys-tems (Letey, 1984).
Planting DateSoybean production in the mid-South has been prima-
rily limited to Maturity Group V and VI cultivars, whichare planted in May and June. Yield reductions due todrought stress occur in these cultivars quite often, be-cause they are blooming, setting pods and beginning seedfill during July and August when there is a high probabilityof soil moisture deficit. Changing the planting date to anearlier or later time would shift the time when soybeanplants bloom, set seed and mature, thus creating the possi-bility that moisture stress could be avoided during thesecritical periods. In the mid-South, higher rainfall amountsoccur in the spring and fall with the greatest spring rain-fall occurring from April to early June. This correspondswith early bloom and pod set in April-planted, early matu-rity, indeterminate and determinate soybean cultivars (Bow-ers, 1995; Miller, 1994). The early maturity group culti-
1Res. Assoc. and Prof. of Agron. located at NEREC, Keiser, Arkansas. FormerGrad. Student, Prof. of Agron., Assoc. Prof. Of Agric. Econ. located atFayetteville, Arkansas, respectively.
INFLUENCE OF TILLAGE SYSTEM, PLANTING DATE AND CULTIVAR SELECTION ONSOIL WATER AND SOYBEAN YIELD UNDER DRYLAND SOYBEAN PRODUCTION
E.C. Gordon, T.C. Keisling, D.M. Wallace, L.R. Oliver and C.R. Dillon1
E
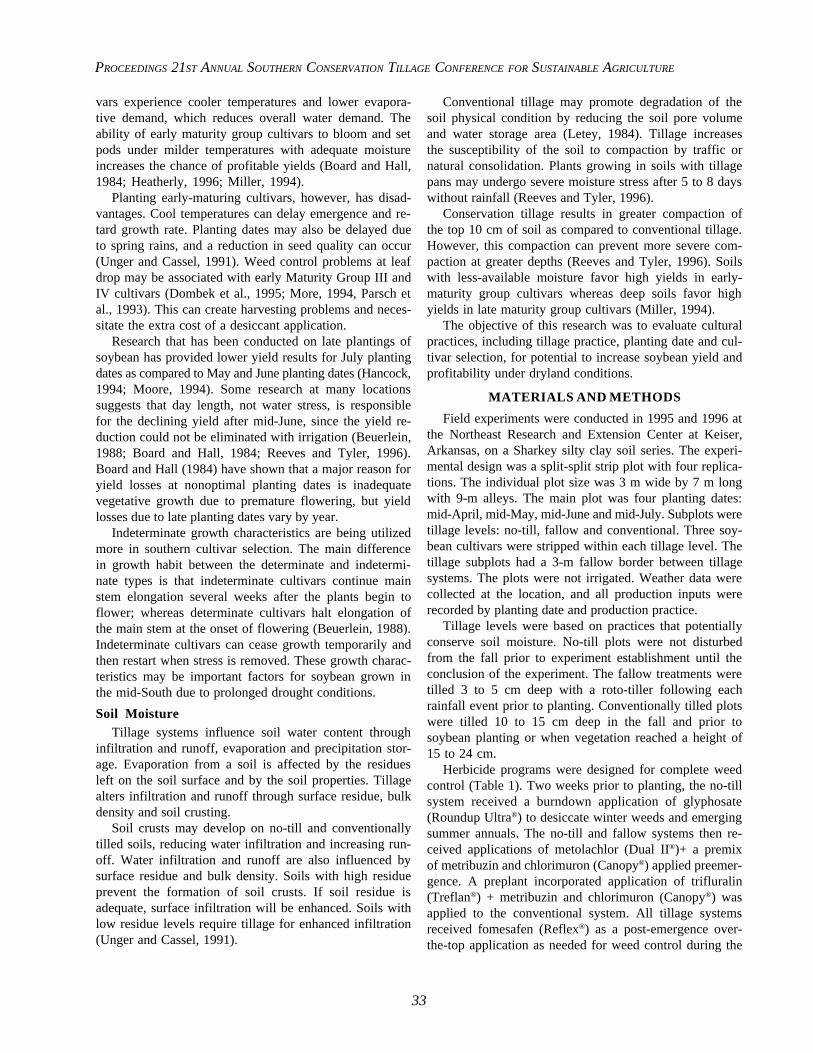
PROCEEDINGS 21ST ANNUAL SOUTHERN CONSERVATION TILLAGE CONFERENCE FOR SUSTAINABLE AGRICULTURE
33
vars experience cooler temperatures and lower evapora-tive demand, which reduces overall water demand. Theability of early maturity group cultivars to bloom and setpods under milder temperatures with adequate moistureincreases the chance of profitable yields (Board and Hall,1984; Heatherly, 1996; Miller, 1994).
Planting early-maturing cultivars, however, has disad-vantages. Cool temperatures can delay emergence and re-tard growth rate. Planting dates may also be delayed dueto spring rains, and a reduction in seed quality can occur(Unger and Cassel, 1991). Weed control problems at leafdrop may be associated with early Maturity Group III andIV cultivars (Dombek et al., 1995; More, 1994, Parsch etal., 1993). This can create harvesting problems and neces-sitate the extra cost of a desiccant application.
Research that has been conducted on late plantings ofsoybean has provided lower yield results for July plantingdates as compared to May and June planting dates (Hancock,1994; Moore, 1994). Some research at many locationssuggests that day length, not water stress, is responsiblefor the declining yield after mid-June, since the yield re-duction could not be eliminated with irrigation (Beuerlein,1988; Board and Hall, 1984; Reeves and Tyler, 1996).Board and Hall (1984) have shown that a major reason foryield losses at nonoptimal planting dates is inadequatevegetative growth due to premature flowering, but yieldlosses due to late planting dates vary by year.
Indeterminate growth characteristics are being utilizedmore in southern cultivar selection. The main differencein growth habit between the determinate and indetermi-nate types is that indeterminate cultivars continue mainstem elongation several weeks after the plants begin toflower; whereas determinate cultivars halt elongation ofthe main stem at the onset of flowering (Beuerlein, 1988).Indeterminate cultivars can cease growth temporarily andthen restart when stress is removed. These growth charac-teristics may be important factors for soybean grown inthe mid-South due to prolonged drought conditions.
Soil MoistureTillage systems influence soil water content through
infiltration and runoff, evaporation and precipitation stor-age. Evaporation from a soil is affected by the residuesleft on the soil surface and by the soil properties. Tillagealters infiltration and runoff through surface residue, bulkdensity and soil crusting.
Soil crusts may develop on no-till and conventionallytilled soils, reducing water infiltration and increasing run-off. Water infiltration and runoff are also influenced bysurface residue and bulk density. Soils with high residueprevent the formation of soil crusts. If soil residue isadequate, surface infiltration will be enhanced. Soils withlow residue levels require tillage for enhanced infiltration(Unger and Cassel, 1991).
Conventional tillage may promote degradation of thesoil physical condition by reducing the soil pore volumeand water storage area (Letey, 1984). Tillage increasesthe susceptibility of the soil to compaction by traffic ornatural consolidation. Plants growing in soils with tillagepans may undergo severe moisture stress after 5 to 8 dayswithout rainfall (Reeves and Tyler, 1996).
Conservation tillage results in greater compaction ofthe top 10 cm of soil as compared to conventional tillage.However, this compaction can prevent more severe com-paction at greater depths (Reeves and Tyler, 1996). Soilswith less-available moisture favor high yields in early-maturity group cultivars whereas deep soils favor highyields in late maturity group cultivars (Miller, 1994).
The objective of this research was to evaluate culturalpractices, including tillage practice, planting date and cul-tivar selection, for potential to increase soybean yield andprofitability under dryland conditions.
MATERIALS AND METHODS
Field experiments were conducted in 1995 and 1996 atthe Northeast Research and Extension Center at Keiser,Arkansas, on a Sharkey silty clay soil series. The experi-mental design was a split-split strip plot with four replica-tions. The individual plot size was 3 m wide by 7 m longwith 9-m alleys. The main plot was four planting dates:mid-April, mid-May, mid-June and mid-July. Subplots weretillage levels: no-till, fallow and conventional. Three soy-bean cultivars were stripped within each tillage level. Thetillage subplots had a 3-m fallow border between tillagesystems. The plots were not irrigated. Weather data werecollected at the location, and all production inputs wererecorded by planting date and production practice.
Tillage levels were based on practices that potentiallyconserve soil moisture. No-till plots were not disturbedfrom the fall prior to experiment establishment until theconclusion of the experiment. The fallow treatments weretilled 3 to 5 cm deep with a roto-tiller following eachrainfall event prior to planting. Conventionally tilled plotswere tilled 10 to 15 cm deep in the fall and prior tosoybean planting or when vegetation reached a height of15 to 24 cm.
Herbicide programs were designed for complete weedcontrol (Table 1). Two weeks prior to planting, the no-tillsystem received a burndown application of glyphosate(Roundup Ultra®) to desiccate winter weeds and emergingsummer annuals. The no-till and fallow systems then re-ceived applications of metolachlor (Dual II®)+ a premixof metribuzin and chlorimuron (Canopy®) applied preemer-gence. A preplant incorporated application of trifluralin(Treflan®) + metribuzin and chlorimuron (Canopy®) wasapplied to the conventional system. All tillage systemsreceived fomesafen (Reflex®) as a post-emergence over-the-top application as needed for weed control during the

ARKANSAS AGRICULTURAL EXPERIMENT STATION SPECIAL REPORT 186
34
growing season. Dates of post-emergence herbicide ap-plications varied and are presented in Table 2.
Cultivars were selected from the Arkansas Variety Se-lection Program (Dombek et al., 1995) and varied withplanting date (Table 3). Cultivars in Maturity Groups IIIand IV were selected for the mid-April planting date, andcultivars in Maturity Groups IV, V and VI were used in themid-May, mid-June and mid-July planting dates. Both in-determinate and determinate cultivars were used in thecultivar selection.
Soybean seeds were planted flat in 18-cm row spacingwith a 3-m-wide John Deere no-till drill. Seeding rate was9 to 12 seeds/m of row. Plots were harvested with a plotcombine at maturity.
Soil moisture in the tillage production systems wasmeasured gravimetrically at planting and every week dur-ing the growing season, except after rainfall when soilswere saturated. Soil samples were taken at random to adepth of 8 cm from each tillage method plot at plantingand after planting in 1995. In 1996, soil samples weretaken to a depth of 60 cm. Soil sampling was discontinuedwhen the earliest maturing cultivar in the planting datereached the R6 growth stage.
Economic analysis of the experiment was conductedusing the Mississippi State University Budget Generatorcomputer program. All economic inputs were recordedand entered. Variable and total costs were generated alongwith net returns. The average price of soybean used in theeconomic analysis to calculate net returns was $5.92/bu.
All data were subjected to analysis of variance usingthe GLM (General Linear Model) procedure of SAS. Meanswere separated using Fisher’s Protected LSD (0.05).
RESULTS AND DISCUSSION
Soybean yields, economic costs and net returns couldbe pooled over years. Environmental conditions varied littlebetween years. Rainfall levels were higher in 1996 but didnot significantly affect soil water storage or soybean yield.
Tillage level had few significant influences on soil wa-ter storage and soybean yield (data not shown). The tillagelevels implemented were expected to alter soil waterevaporation rates and soil water storage (Mwendera andFeyen, 1994). However, the shallow tillage operationscould not be conducted immediately after rainfall due totravel and labor restrictions, and some evaporation oc-curred before the implementation of the fallow tillagesystem. Consequently, soil water samples were taken af-ter evaporation losses in each production system.
Soil samples for soil water storage determination weretaken randomly by planting date each year. As a result,years could not be combined by sampling date and will bediscussed separately. Soil samples for soil water storagedetermination were taken from only a 0- to 8-cm depth in1995, and there was no influence on soil water storage or
soybean yields due to the shallow sampling depth. In 1996,the soil was sampled to a depth of 60 cm with a newsampling technique utilizing lubricants, and only these datawill be discussed.
Planting date significantly affected soil water storageand soybean yield and will be discussed by specific plant-ing date. Also, cultivar selection significantly affected soy-bean yields at the varying planting dates. Therefore, indi-vidual cultivar yields will be discussed within a plantingdate. Soil water sampling was taken at random across thethree cultivar strips for each tillage level. Therefore, cul-tivars and their effects on soil water storage and econom-ics could not be evaluated.
Soil Water StorageIn 1996, soil water storage was similar among the April,
May and June planting dates (Fig. 1). Frequent rainfallreplenished soil water levels until August. However, somevariation in soil water levels was observed in June and inthe duration of drought during each planting date.
The April planting date had the lowest soil water stor-age in mid-June to mid-July (Fig. 1). Since soil waterutilization began in April, the April-planted soybean rootshad removed soil water for the longest duration. Droughtconditions did not occur until August, allowing the April-planted soybean to reach maturity before severe waterstress. These results coincide with the findings of Bowers(1995) and Miller (1994).
The May and June planting dates maintained slightlyhigher soil water levels in June and July than the plotsplanted in April (Fig. 1). The May and June planting datesconserved soil water in April and May that could be usedin June and July. In August, the May and June plantingdates decreased dramatically in soil water. Drought condi-tions resulted in the use of all available soil water.
The July planting date maintained the highest soil waterstorage in August during the drought conditions (Fig. 1).The delayed planting date allowed soil water conservationin April, May, and June in the absence of vegetation. Pre-vious research (Hancock, 1994) showed that weed-freeareas have higher soil water storage.
Soybean YieldsThe April- and May-planted soybean had the highest
yields (Table 4). Soybean yields decreased when the plant-ing date was delayed due to drought and decreasing photo-period.
The Maturity Group III cultivar, Williams 82, yieldedthe highest of the April-planted cultivars. The early matu-rity cultivar matures during the highest soil water storagelevels, and its indeterminate growth patterns can increasevegetative growth, which can increase soybean yield. There-fore, Maturity Group III cultivars can avoid water stressand produce high yields (Bowers 1995; Heatherly, 1996;Miller, 1994). The Maturity Group IV cultivars, RA 452

PROCEEDINGS 21ST ANNUAL SOUTHERN CONSERVATION TILLAGE CONFERENCE FOR SUSTAINABLE AGRICULTURE
35
and Manokin, have a longer growing season, which ex-tended the reproductive stage into drought conditions fora longer duration (Fig. 1) and affected yield.
RA 452, a Maturity Group IV cultivar with indetermi-nate growth, had the lowest yield of the cultivars plantedin the delayed planting dates due to premature flowering(Table 4). Pioneer 9592, a Maturity Group V cultivar withdeterminate growth, had the highest yields and was thebest-suited cultivar for the May and June planting dates.Pioneer 9641, a Maturity Group VI cultivar with determi-nate growth characteristics, had the longest growing sea-son of the cultivars and the lowest yields when planted inMay and June due to dry conditions during its reproduc-tive period. However, when planted in July, Pioneer 9641had the highest soybean yields.
Economics CostsThe conventional production system had the lowest
costs (Table 5). Mechanical preplant tillage operationsfor weed control in conventional tillage resulted in lowerproduction costs than equivalent herbicide programs inno-till.
The fallow production system costs were slightly higherthan the conventional production system. The fallow-till-age system had shallow tillage after rainfall events of >2cm to destroy soil crusts. Shallow tillage was often per-formed two or three times a month during frequent rain-fall events. Thus, the high number of tillage operationsincreased costs in the fallow production system as com-pared to the conventional production system.
The no-till production system had the highest costs(Table 5), because no-till required the application of apreplant burndown herbicide for adequate weed control.The preplant burndown herbicide application was morecostly than mechanical tillage, resulting in higher variableand total costs than the conventional tillage productionsystem.
The June planting date, regardless of tillage system,had the highest variable and total costs and July the lowestof the planting dates under fallow and conventional pro-duction systems (Table 5). This was due to weed pressure,which necessitated post-emergence applications for Juneplanting dates, while July planting dates required only pre-plant or preemergence herbicide applications (Table 2).The lowest production variable and total costs in the no-till production system were in April due to low herbicidecosts (Table 5).
Net ReturnsProduction systems greatly influenced net returns (Table
6). The no-till system provided the lowest net returns dueto higher herbicide costs. The slight increase in costs ofthe fallow production system did not affect net returns,since the fallow system had slightly higher net returnsthan the conventional system for all planting dates except
June. The high cost of the no-till production system re-sulted in a decrease of approximately $80/ha and $62/hain net returns as compared to the fallow and conventionalproduction systems, respectively.
Average net returns were the highest in April and Mayplanting dates (Table 6). After May, net returns decreasedsharply, becoming the lowest in July. A relatively lowrange occurred in soybean yields between years, and theplanting dates with the highest net returns should be used.To achieve the lowest risk in soybean production and high-est average net returns, the planting dates for soybeanshould spread out among all the planting dates.
SUMMARY
Soil Water StorageThe Sharkey silty clay maintained approximately 8 to
10 cm of soil water to a 60-cm depth. Thus, April- andMay-planted soybeans on the Sharkey silty clay poten-tially avoided drought stress by maturing before soil waterwas depleted in the root zone. Cumulative water removalof early-planted soybean resulted in low soil water levelsduring July and August under drought conditions. Main-taining a vegetation-free surface conserved soil water,which could subsequently be used by late-planted (Juneand July) soybean. This would be especially important dur-ing seasons with prolonged drought periods.
Soybean YieldsSoybean yields were influenced by planting date and
cultivar selection. April- and May-planted soybean plotsyielded the highest with the Maturity Group III indetermi-nate Williams 82 being the best for April planting. ThePioneer 9592 Maturity Group V determinate cultivar wasbest suited for May planting. RA 452, a Maturity GroupIV indeterminate cultivar, also had high yields when plantedin May. Soybean yields typically declined in June and Julyplanting dates relative to April and May plantings. Pioneer9592 should be planted in May. June and July plantingdates should be avoided.
EconomicsNo-till production systems were always more expen-
sive than the fallow or conventional production systems.Tillage operations cost less than herbicide applicationsfor weed control. Planting dates influenced costs becauseof herbicide requirements with the June planting date hav-ing the highest cost. High weed pressure in June requiredrepeated applications of postemergence herbicides and re-sulted in high herbicide costs. The lowest cost occurredin the July planting date, which did not have to rely onpost-emergence herbicide applications.
A no-till production system resulted in approximatelya $80/ha and $62/ha loss in net returns as compared to thefallow and conventional production systems, respectively.
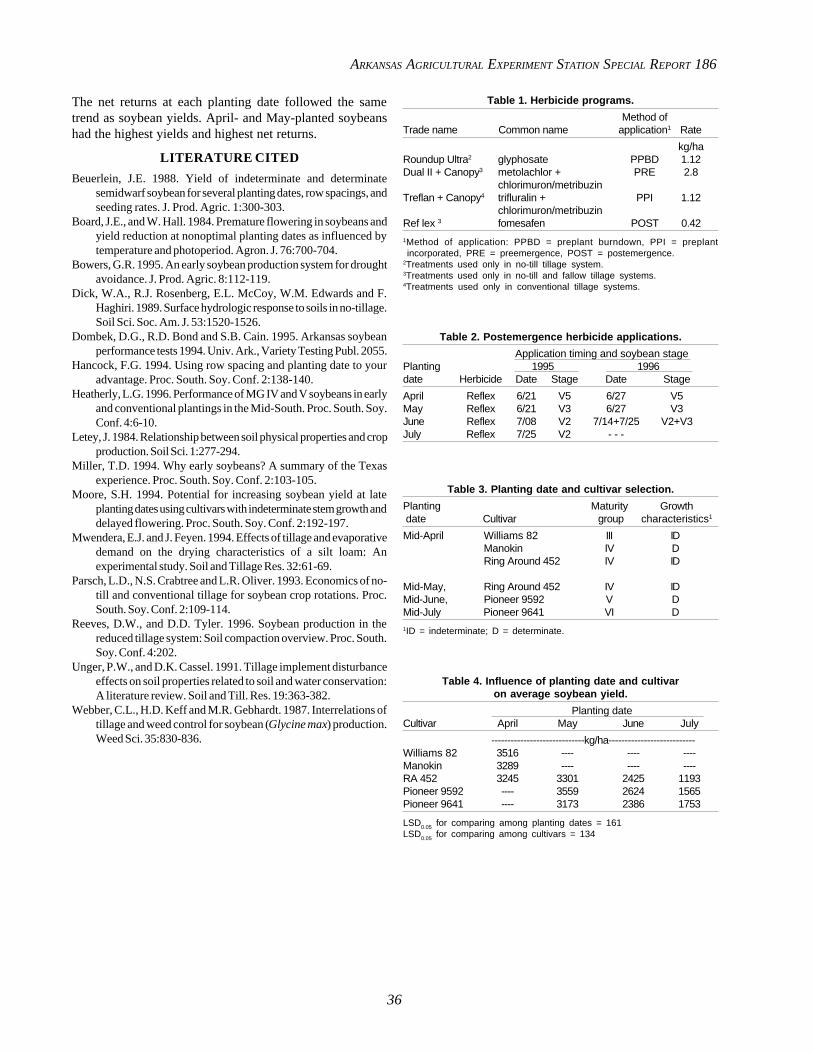
ARKANSAS AGRICULTURAL EXPERIMENT STATION SPECIAL REPORT 186
36
The net returns at each planting date followed the sametrend as soybean yields. April- and May-planted soybeanshad the highest yields and highest net returns.
LITERATURE CITED
Beuerlein, J.E. 1988. Yield of indeterminate and determinatesemidwarf soybean for several planting dates, row spacings, andseeding rates. J. Prod. Agric. 1:300-303.
Board, J.E., and W. Hall. 1984. Premature flowering in soybeans andyield reduction at nonoptimal planting dates as influenced bytemperature and photoperiod. Agron. J. 76:700-704.
Bowers, G.R. 1995. An early soybean production system for droughtavoidance. J. Prod. Agric. 8:112-119.
Dick, W.A., R.J. Rosenberg, E.L. McCoy, W.M. Edwards and F.Haghiri. 1989. Surface hydrologic response to soils in no-tillage.Soil Sci. Soc. Am. J. 53:1520-1526.
Dombek, D.G., R.D. Bond and S.B. Cain. 1995. Arkansas soybeanperformance tests 1994. Univ. Ark., Variety Testing Publ. 2055.
Hancock, F.G. 1994. Using row spacing and planting date to youradvantage. Proc. South. Soy. Conf. 2:138-140.
Heatherly, L.G. 1996. Performance of MG IV and V soybeans in earlyand conventional plantings in the Mid-South. Proc. South. Soy.Conf. 4:6-10.
Letey, J. 1984. Relationship between soil physical properties and cropproduction. Soil Sci. 1:277-294.
Miller, T.D. 1994. Why early soybeans? A summary of the Texasexperience. Proc. South. Soy. Conf. 2:103-105.
Moore, S.H. 1994. Potential for increasing soybean yield at lateplanting dates using cultivars with indeterminate stem growth anddelayed flowering. Proc. South. Soy. Conf. 2:192-197.
Mwendera, E.J. and J. Feyen. 1994. Effects of tillage and evaporativedemand on the drying characteristics of a silt loam: Anexperimental study. Soil and Tillage Res. 32:61-69.
Parsch, L.D., N.S. Crabtree and L.R. Oliver. 1993. Economics of no-till and conventional tillage for soybean crop rotations. Proc.South. Soy. Conf. 2:109-114.
Reeves, D.W., and D.D. Tyler. 1996. Soybean production in thereduced tillage system: Soil compaction overview. Proc. South.Soy. Conf. 4:202.
Unger, P.W., and D.K. Cassel. 1991. Tillage implement disturbanceeffects on soil properties related to soil and water conservation:A literature review. Soil and Till. Res. 19:363-382.
Webber, C.L., H.D. Keff and M.R. Gebhardt. 1987. Interrelations oftillage and weed control for soybean (Glycine max) production.Weed Sci. 35:830-836.
Table 1. Herbicide programs.
Method ofTrade name Common name application1 Rate
kg/haRoundup Ultra2 glyphosate PPBD 1.12Dual II + Canopy3 metolachlor + PRE 2.8
chlorimuron/metribuzinTreflan + Canopy4 trifluralin + PPI 1.12
chlorimuron/metribuzinRef lex 3 fomesafen POST 0.421Method of application: PPBD = preplant burndown, PPI = preplantincorporated, PRE = preemergence, POST = postemergence.
2Treatments used only in no-till tillage system.3Treatments used only in no-till and fallow tillage systems.4Treatments used only in conventional tillage systems.
Table 2. Postemergence herbicide applications.
Application timing and soybean stagePlanting 1995 1996date Herbicide Date Stage Date Stage
April Reflex 6/21 V5 6/27 V5May Reflex 6/21 V3 6/27 V3June Reflex 7/08 V2 7/14+7/25 V2+V3July Reflex 7/25 V2 - - -
Table 3. Planting date and cultivar selection.
Planting Maturity Growth date Cultivar group characteristics1
Mid-April Williams 82 III IDManokin IV DRing Around 452 IV ID
Mid-May, Ring Around 452 IV IDMid-June, Pioneer 9592 V DMid-July Pioneer 9641 VI D1ID = indeterminate; D = determinate.
Table 4. Influence of planting date and cultivaron average soybean yield.
Planting dateCultivar April May June July
-----------------------------kg/ha---------------------------Williams 82 3516 ---- ---- ----Manokin 3289 ---- ---- ----RA 452 3245 3301 2425 1193Pioneer 9592 ---- 3559 2624 1565Pioneer 9641 ---- 3173 2386 1753
LSD0.05 for comparing among planting dates = 161LSD0.05 for comparing among cultivars = 134

PROCEEDINGS 21ST ANNUAL SOUTHERN CONSERVATION TILLAGE CONFERENCE FOR SUSTAINABLE AGRICULTURE
37
Table 5. Influence of planting date and tillage system on average variable and total economic costs at Keiser (1995 and 1996).
Tillage Variable costs Total costssystem April May June July April May June July
---------------------------------------------------------------------------- ($/ha) -------------------------------------------------------------------------------No-till 260.98 294.40 343.70 326.93 316.14 354.03 409.25 393.20Fallow 216.67 225.19 245.05 204.22 257.67 272.86 299.54 260.81Conv. 204.07 224.62 224.62 177.96 250.61 255.25 276.91 228.08
LSD0.05
for comparing variable cost means among planting dates = 2.47LSD
0.05 for comparing variable cost means among tillage systems = 2.47
LSD0.05
for comparing total cost means among planting dates = 2.47LSD
0.05 for comparing total cost means among tillage systems = 2.47
Table 6. Influence of planting date and tillage system onaverage net returns.
Tillage Planting datesystem April May June July
-----------------------------$/ha-----------------------------No-till 412.27 358.67 164.55 -25.34Fallow 464.28 490.91 218.37 56.71Conv. 453.93 449.52 240.31 13.81
LSD0.05
for comparing among planting dates 11.65LSD
0.05 for comparing among tillage systems 12.71
Fig 1. Influence of planting date and rainfall on soil water storage to a depth of 60 cmat Keiser in 1996. LSD (a) for comparing between planting dates. LSD (b) for
comparing between sample dates.
!
!
!! !'
'
''
'
'
'
&
&
& && &
&
&
&
&&
,
,
, , ,,
,
,
15
30
15
30
15
30
15
30
15
30
0
2
4
6
8
10
12
Soil
Wate
r, c
m
0
2
4
6
8
10
12
Rain
fall, cm
April May June July Rainfall, & ' !
April May June July August
LSD =a
LSD =b

ARKANSAS AGRICULTURAL EXPERIMENT STATION SPECIAL REPORT 186
38
INTRODUCTION
necessary situation that occurs in the cotton gin-ning process is the accumulation of about 200 lbof waste per ginned bale. This waste, called gin
trash, has to be disposed of at some point in time. Muchof the gin trash was incinerated for many years, but cer-tain regulations, such as the Clean Air Act of 1970, haveremoved burning as an option. Using gin trash as a live-stock feed is done to an extent, but there is some concernregarding chemical residues.
Another option in the disposal of gin trash is to spreadit directly on the fields. Returning the organic materialand nutrients can be beneficial, but certain problems mightoccur when spreading raw gin trash onto fields. Weedseed and disease, particularly Verticillium wilt, may beintroduced to or increased in fields when spreading rawgin trash. The removal of these two potential problemsmakes the spreading of gin trash much more attractive.
An effective method of handling gin trash and reducingthe problems associated with weed seed and disease or-ganisms is to compost the material. With adequate mois-ture, approximately 70%, the heat generated in thecomposting process can be sufficient to kill weed seed(140 F for 10 days) and disease organisms (145 F for twodays) (Alberson and Hurst, 1964; Griffis and Mote, 1978b;Parnell et al., 1980). Commercial contained-composting-systems have demonstrated this. However, the high costof commercial contained-composting-systems tends to beprohibitive, so alternative composting methods have beeninvestigated.
Windrow-composting-systems can generate the neces-sary heat if there is adequate volume, moisture and aera-tion. The aeration is usually provided by turning thecomposting material with some type of implement. In thehumid Southern region, rainfall could conceivably supplysufficient water for initial wetting of the gin trash as wellas keeping it moist for the duration of the compostingprocess. This would eliminate a wetting step and make theoverall process cheaper.
Recently, new gin trash handling methods have beendeveloped. The Lipsey®-gin-trash-composting-system re-
quires the compost to stay in place. The compost pile isformed in a circular pattern by rotating back and fortharound a pivot point (Fig 1. top view). The rotation motionis at a constant speed so the thickness of gin trash depos-ited on top of the compost pile is a function of 1) amountof trash in un-ginned cotton, 2) rate of ginning and 3)current depth of compost pile (as the sides are slanted asshown in Fig. 1 side view). Uniform wetting throughoutthe pile is facilitated by wetting the gin trash as it is deliv-ered to the top of the compost pile. The resulting com-post pile has layers of various thicknesses that are appliedat varying rates. Thus, the zone of aeration is controlledby the depth from an outside surface and the duration ofthe compost at this depth.
Experiments were conducted to evaluate certain aspectsof windrow-composting-systems and the Lipsey® system.
MATERIAL AND METHODS
Experiment 1In March 1977 gin trash from Mann’s Gin in Lee
County, Arkansas, was placed in windrows for composting.A typical windrow is approximately 40 ft long, 4.5 ft atthe base, 2 ft across the top and 1.33 ft tall. The experi-mental design was a randomized complete block with fivereplications. The treatment design was a split-split plot.The main plots were timing of turning of the windrow witha root rake. Main plot treatments included 1) turned weeklyor 2) turned when the temperature 6 in. below the surfacereached 80 F. Main plots were split with half receiving4.2 lb of nitrogen (N) per plot as a commercial fertilizerand the other receiving no N. The N-treated plots werethen split and one-half of each plot inoculated withRoebicTM aerobic inoculum. Temperatures at 6 in. fromthe windrow top surface were taken daily until mid-Aprilwhen composting was complete and were used to evaluatethe benefit of additives in the composting process. Rain-fall was the only water received by the compost piles.
Composite samples were collected before and aftercomposting and analyzed for nutrients and selected chemi-cals.
Experiment 2Composting plots were established in Lee County, Ar-
kansas, during November 1978 to evaluate aeration meth-ods. Two implements were compared for effectiveness ofturning a windrow–a root rake and a modified combine
TWO METHODS OF COMPOSTING GIN TRASH
E.C. Gordon, T.C. Keisling, L.R. Oliver and Carl Harris 1
A
1Research Associate, NEREC, Keiser, AR; Professor , NEREC, Keiser, AR;University Professor, Dept. Of Agron, Univ. Of Ark., Fayetteville, AR; andCounty Ext. Agt. Deceased.

PROCEEDINGS 21ST ANNUAL SOUTHERN CONSERVATION TILLAGE CONFERENCE FOR SUSTAINABLE AGRICULTURE
39
(Lalor et al., 1978). The experimental design was a ran-domized complete block with four replications. Treat-ments consisted of turning the compost weekly and everytwo weeks by each machine. Moisture was monitored.Those plots turned with the combine had water added tothe compost pile to adjust moisture to circa 70%. Theplots turned with the root rake received only rainfall forwetting the compost pile. Effectiveness was determinedby measuring internal temperatures as in Experiment 1.
Experiment 3In February 1995 three gin trash compost piles that
were formed during the fall of 1994, using the Lipsey®
gin trash composting system, were selected for samplingand evaluating weed seed germination. Two compost pileswere located in Phillips County, Arkansas, and one inCrittenden County, Arkansas. In Phillips County sampleswere taken from both piles to a depth of 30 in. in 6-in.increments from the surface using a bucket. Approximately2.5 gallons of compost was removed from each depthincrement in each pile for subsequent analysis for chemi-cals and organisms.
The compost pile in Crittenden County was sampledusing a front-end bucket loader to cut into the pile 10 to15 ft. Again, approximately 2.5 gallons of compost wascollected at 5-in. increments from the compost surface toa depth of 48 in. for subsequent analysis by grabbing ma-terial from an 8-ft-long vertical face.
All samples from each location were stored in plasticbags and kept at room temperature until they were takento the University of Arkansas at Fayetteville within one totwo weeks after collection. The samples were divided intotwo sub-samples of approximately 1 gallon each. The sub-samples were placed in containers measuring 16 in. longby 12 in. wide by 2 in. tall. The containers were placed ina greenhouse for 10 weeks. The compost in each con-tainer was kept moist and stirred every two weeks. Obser-vations were made two to three times weekly on the num-ber and weed species that germinated. Chemical composi-tion was determined for N, C, P, K, Ca and Mg. The pHwas also measured.
RESULTS AND DISCUSSION
Experiment 1Neither use of a starter aerobic inoculum (Fig. 2) nor
addition of N (Fig. 3) was needed to initiate the compostingprocess. Regardless of treatment, temperatures were simi-lar over the composting period. This indicated that no ad-dition of inoculum or N was needed for proper compostingto occur. These findings agree with those of Griffis andMote (1978a). Heating criteria for turning the pile gaveslightly higher internal temperature than just turning weekly(Fig. 4). Neither method resulted in temperatures highenough or long enough to kill Verticillium wilt fungi or
weed seeds. Weeds observed growing on top of the wind-rows after composting was complete were annual blue-grass (Poa annua), large crabgrass (Digitariasanguinalis), purple nutsedge (Cyperus rotundas), yel-low nutsedge (Cyperus esculentus), pigweed (Amaranthusspp.), morningglory (Ipomoea spp.), horsenettle (Solanumcarolinense) and prickly sida (Sida spinosa). Reproduc-tive characteristics of certain weeds listed above make itobvious that the seed were mixed with the compost duringthe turning process rather than being delivered in the gintrash.
The nutrient analysis of gin trash samples is shown inTable 1 as total analysis and soil test analysis. The pHlevels remained below 7, indicating aerobic compostingconditions. Higher pH levels would indicate anaerobiccomposting that favors the conversion of N to ammonia.High temperatures enhance the volatility of ammonia(Golueke, 1972).
We observed that using natural rainfall for wetting re-sulted in channeling of water through selective pathwaysin the compost pile. As a result, some of the material wasvery slow in wetting and did not necessarily go through aheat. These pockets of dry material were mechanicallyincorporated with wetter compost during the turning pro-cess.
Experiment 2Due to the non-uniform wetting, a modified combine
(Lalor et al., 1978) that would mix and wet a windrowuniformly was built. The modified combine acceleratedthe composting process, as evidenced by increased earlycomposting temperatures (Fig. 5). The temperatures werestill not high enough or long enough to kill weed seedsand wilt organisms 6 in. below the compost pile surface.
Weekly mixing moves materials from the outside ofthe compost pile to the inside where heat can be accumu-lated. This should result in temperatures high enough andlong enough in duration (140 F for 48 hr) to kill Verticil-lium wilt organisms and weed seeds between weekly turn-ings. Assuming that 50% of the pile is wet enough togenerate sufficient heat, complete weekly mixing providessufficient aeration and carbon supply for the compostingorganisms to function. After each mixing, the reduction inthe compost volume containing viable diseases and weedseeds should be halved. Therefore, 15 mixes or weekswould be required to produce a 99.99% compost withessentially no weeds or diseases, which is about twice aslong as it took our composting operation to be completed.Hence, a different method other than windrow-compostingwith mechanical mixing will be necessary.
Experiment 3No viable weed seeds were detected from the compost
samples obtained from the compost piles made by theLipsey® composting system. Two months after the gin-

ARKANSAS AGRICULTURAL EXPERIMENT STATION SPECIAL REPORT 186
40
ning season, temperature within the pile was too hot formore than 10 to 15 seconds contact with the bare hands.Since no weed seeds germinated in our greenhouse test, itappears that the weed seed viability was destroyed fromthe heat of composting. The outside of the pile, which hadnot gone through a heating process, had several weedsgrowing on it. This might be easily sterilized using a solartechnique, such as covering the entire pile with a sheet ofblack plastic for a few days.
The carbon/nitrogen ratio (C/N) tends to increase atthe deeper sampling depths, indicating an anaerobiccomposting process with a possible loss of N as ammonia(Table 2). The pH levels being greater than 7 at depthsgreater than 6 in. confirm anaerobic conditions. Theanaerobic composting process appears to generate suffi-cient heat for sterilization but will result in a compost ofa fibrous consistency with a bad odor.
CONCLUSIONS
The results presented here indicate that the windrowcomposting system does not solve the two problems ofVerticillium wilt or weeds associated with gin trash. Oth-erwise, the compost obtained is quite satisfactory as a
product. The Lipsey® composting system produced a com-post pile whose outer layer had problems with weed seedand Verticillium wilt survival. These problems could beeasily eliminated by using a solar sterilization processconsisting of covering the pile with a continuous sheet ofplastic. Otherwise, the composting process turns anaero-bic within a couple of feet of the surface, resulting inincomplete composting and in offensive odors.
LITERATURE CITED
Alberson, D.M., and W.M. Hurst. 1964. Composting cotton gin waste.USDA-ARS, Publication ARS 42-102.
Golueke, C.G. 1972. Composting: A study of the process and itsprinciples. Rodale Press, Inc.
Griffis, C.L., and C.R. Mote. 1978a. Cotton gin trash compostingstudies. Arkansas Farm Research 27(4):3.
Griffis, C.L., and C.R. Mote. 1978b. Weed seed viability as affectedby the composting of cotton gin trash. Arkansas Farm Research27(5):8.
Lalor, W.F., D. Berry, C. Harris and J.K. Jones. 1978. Compost-making equipment for cotton gins. ASAE paper no. 78-3545.
Parnell, P.E., E.R. Emino and E.K. Grubaugh. 1980. Cotton gin trash:can it be safely utilized? Agricultural Engineering 61:21-22.
Table 1. Analysis of gin trash used in 1977 experiments.
Total Analysis N P K Ca Mg Na Zn Fe Mn As pH
-----------------------------------------%--------------------------------------- ----------------------ppm---------------------Before Composting 1.66 0.29 0.78 1.90 0.34 0.05 41.0 2218 343 2.0 6.9After Composting 1.04 0.14 0.52 0.51 0.21 0.02 - 1280 313 - 6.2
Soil Test Analysis Nitrate-N P K Ca Mg Na EC pH
------------------------------------lb/acre---------------------------------- µmhosx103
1620 160+ 2740 1699 710 193 1.4 6.2
Table 2. Chemical analysis of compost from a Lipsey ® system for handling gin trashin Phillips County (PC) and Crittenden County (CC), Arkansas.
Depth from N C C/N P K Ca Mg pHcompost surface PC CC PC CC PC CC PC CC PC CC PC CC PC CC PC CC
in. -------------------------------------------------------------------------%----------------------------------------------------------------------------0-6 4.0 4.0 26.70 30.2 6.8 7.5 0.6 0.4 0.6 0.5 2.6 2.2 0.6 0.4 6.2 5.66-12 4.5 4.0 29.20 13.7 6.4 6.2 0.7 0.6 2.1 2.4 2.5 2.2 0.8 0.6 7.0 7.812-18 3.9 3.9 29.70 31.1 7.7 8.0 0.8 0.6 1.6 1.9 2.8 2.2 0.7 0.6 7.4 7.518-24 4.0 3.9 32.40 27.1 8.0 6.9 0.6 0.6 1.6 2.3 2.9 2.3 0.6 0.6 8.0 7.724-30 4.0 4.1 31.50 29.7 8.0 7.2 0.6 0.5 2.3 1.7 2.7 1.7 0.7 0.5 7.3 6.930-36 3.9 3.5 36.50 28.7 9.4 8.3 0.6 0.6 2.8 1.9 2.5 2.9 0.7 0.6 7.0 7.736-42 - 3.3 - 34.1 - 10.5 - 0.6 - 1.8 - 2.9 - 0.6 - 7.342-48 - 2.7 - 36.1 - 13.1 - 0.5 - 1.9 - 2.7 - 0.5 - 7.6
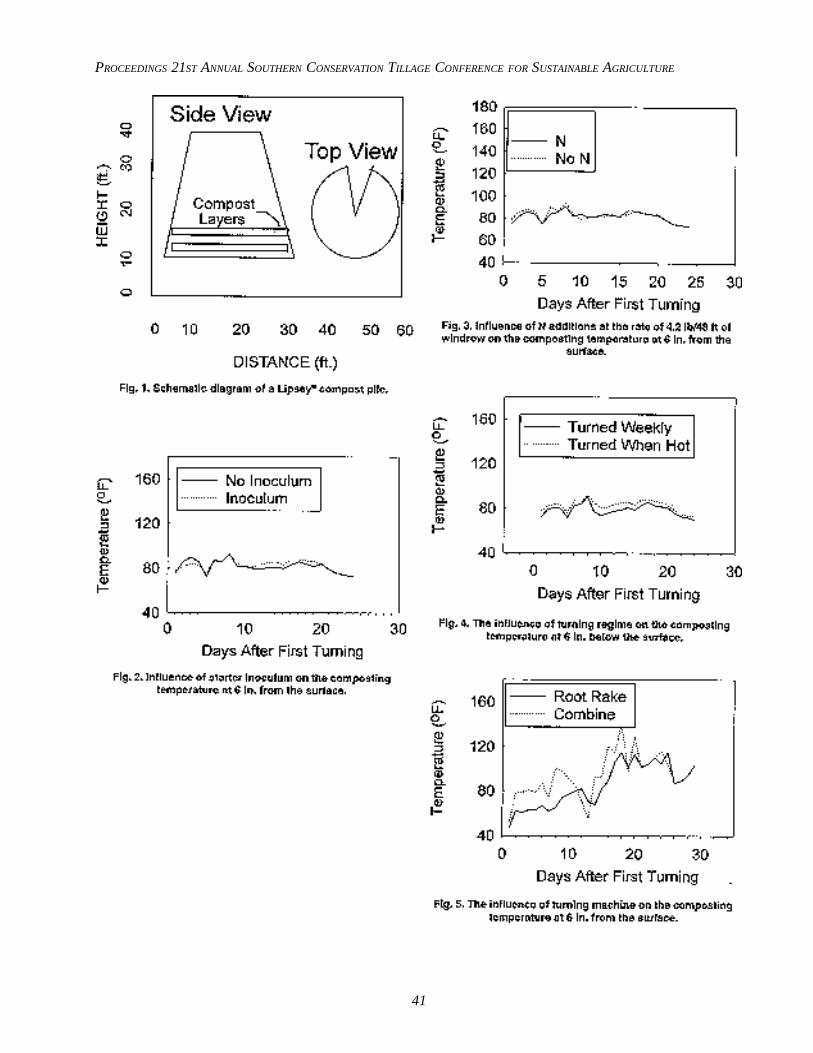
PROCEEDINGS 21ST ANNUAL SOUTHERN CONSERVATION TILLAGE CONFERENCE FOR SUSTAINABLE AGRICULTURE
41

ARKANSAS AGRICULTURAL EXPERIMENT STATION SPECIAL REPORT 186
42
INTRODUCTION
dvances in equipment and herbicide technologyhave contributed greatly to the increase in pro-ducer acceptance of reduced tillage practices in
northeastern Louisiana. Reduced soil erosion (Hutchinsonet al., 1991), increased soil organic matter (Boquet andCoco, 1993) and reduced soil moisture evaporation(Wilhelm et al., 1986) are just some of the documentedbenefits from no-tillage. Reduced tillage, in many instances,has also led to lower equipment and fuel costs and savingsin time and labor (Laws, 1993). In addition, cover cropshave been found to be an important component of conser-vation tillage systems (Hutchinson et al., 1991; Ebelhar etal., 1984).
Although erosion is not a serious problem on many ofthe clay soils in the Mississippi River Delta, cotton(Gossypium hirsutum L.) production has still benefittedfrom reduced tillage practices primarily by allowing pro-ducers to plant in a more timely fashion (Boquet and Coco,1993). Spring tillage on clay soils often results in a cloddy,dry seedbed in which it is difficult to obtain a uniformplant stand.
On clay soils, deep tillage to relieve compaction hastraditionally been considered unnecessary due to the natu-ral shrinking and swelling that these soils undergo as themoisture content cycles from wet to dry. It has been specu-lated (Smith and Whitten, 1992) that while clays do notdevelop compaction pans typical of lighter-textured soils,they may develop compacted blocks of soil beneath theplow layer. The effect of this soil condition is to confineplant roots to the soil volume near the block surfaces. Thedensity of the blocks prevents or severely restricts rootgrowth into the clay block, and roots that do grow fromone block surface to another are often broken when theblocks dry and shrink. Results from previous tillage stud-ies failed to demonstrate crop response to deep tillage onclay soil (Raney et al., 1954; Saveson et al., 1958; Tupper,1978; Heatherly, 1981). However in these studies, thetillage operations were performed in the spring when thesubsoil was most likely wet from winter rainfall. Recently,Smith (1995) indicated that deep tillage in the fall, whenthe soil profile was dry, was beneficial for cotton growthand yield on a Tunica clay. There is a lack of information
on the interaction between deep tillage in the fall andvarious conservation tillage practices on clay soils in Loui-siana.
On the medium- and coarse-textured alluvial soils innortheastern Louisiana, compaction is a yield-limiting fac-tor unless some form of deep tillage is performed(Crawford, 1979; Saveson et al., 1958). In northeasternLouisiana, these soils have typically been under a mono-crop production system that utilizes extensive surface till-age to control weeds, prepare seedbeds and incorporateherbicides. Although these soils are highly productive, thecombination of extensive tillage and mono-crop culturehave contributed to low organic matter levels (< 1.0%) inmany fields. As the use of conservation tillage practicesand winter cover crops has been shown to result in in-creases in soil organic matter levels (Hutchinson et al.,1991; Millhollon and Melville, 1991), some combinationof these practices might lead to improved growth and yieldof cotton on these soil types. Therefore, the objectives ofthis study were to: 1) determine the optimum combina-tion of cover crop and tillage necessary to maximize cot-ton production while maintaining or increasing soil pro-ductivity and 2) examine the effect of deep tillage in con-junction with cover crops and reduced tillage practices oncotton production.
METHODS
A field study was initiated in the fall of 1996 on aCommerce silt loam (fine-silty, mixed, nonacid, thermicAeric Fluvaquent) and on a Sharkey clay (very-fine, mont-morillonitic, nonacid, thermic, Vertic Haplaquepts) at theNortheast Research Station near St. Joseph, Louisiana. Atotal of 16 treatments were established with combinationsof tillage systems {no-till (NT), conventional till (CT),reduced-till (RT)), winter cover crops [winter wheat (Triti-cum aestivum L.), hairy vetch (Vicia villosa L.), and na-tive vegetation], in-season cultivation, and fall sub-soil-ing} summarized in Table 1. Treatments were only slightlydifferent on the two soil types with CT on the silt loamincluding disking in the fall and spring prior to seedbedpreparation, while on the clay CT involved only hipping inthe fall and spring. The RT treatments on the silt loamwere hipped in the fall and spring, while on the clay theRT treatment involved hipping and rolling in the fall andno additional tillage in the spring. Experiment design forboth tests was a randomized complete block with four1Assistant Prof., Louisiana State University Agricultural Center, Northeast
Research Station, St. Joseph, LA.
COMPARISON OF TILLAGE PRACTICES FOR COTTON PRODUCTIONON ALLUVIAL SOILS IN NORTHEASTERN LOUISIANA
E.M. Holman, A.B. Coco and R.L. Hutchinson1
A

PROCEEDINGS 21ST ANNUAL SOUTHERN CONSERVATION TILLAGE CONFERENCE FOR SUSTAINABLE AGRICULTURE
43
replications. Plot size was four rows (40-in. row spacing)by 65 ft.
Deep tillage operations on the appropriate plots wereconducted with a Paratill following cover crop planting inOctober 1996. Cotton cultivar ‘Suregrow 501’ was planted5 May 1997 using ripple coulters mounted on the planter.Management of the cover crops prior to planting (4 weeksbefore planting) in the no-till plots consisted of 1) anapplication of glyphosate (1.0 lb ai/acre) followed byparaquat (0.75 lb ai/acre) on the wheat plots; 2) an appli-cation of paraquat (1.0 lb ai/acre) and cyanazine (0.75 lbai/acre) followed by paraquat (0.75 lb ai/acre) on the vetchplots; 3) an application of paraquat (0.75 lb ai/acre) andcyanazine (0.75 lb ai/acre) on the native plots. Preemer-gence weed control in all plots consisted of a broadcastapplication of pendimethalin (1.0 lb ai/acre) plusfluometuron (1.2 lb ai/acre). All appropriate NT, CT andRT treatments were cultivated twice. Additional herbicideapplications included broadcast application of pyrithiobac(0.079 lb ai/acre), post-directed application (banded) ofprometryn plus MSMA (0.31 and 1.0 lb ai/acre) and alayby application (broadcast) of cyanazine and MSMA (1.1and 1.65 lb ai/acre).
Based on past work with these cover crops, nitrogenfertilization of the cotton was adjusted to 60 lb N/acrefollowing vetch, 120 lb N/acre following wheat with theother plots receiving 90 lb N/acre. The middle two rowswere harvested from each plot 17 October with a spindlepicker. On 22 October 1997, following cotton stalk de-struction, the wheat and vetch cover crops were planted inthe respective plots. The next day, treatments were splitfor deep tillage using a Paratill, and the appropriate treat-ments were disked or hipped.
All data were analyzed using the ANOVA or GLM pro-cedures of SAS (SAS Institute, 1989). In order to assessindividual treatment factor effects, contrast statementswere used following the GLM procedure.
RESULTS
Two days after planting, soil temperature was lower (3to 5 F) in the furrow (2-in. depth) in the vetch plots com-pared to the conventional or reduced tillage treatments onboth soil types (data not shown). Although the wheat plotswere numerically lower than the conventional plots, thedifferences were not significant. The differences in soiltemperature could help to explain some of the observeddifferences in early growth.
Commerce Silt LoamNodes above white flower (NAWF) was affected by
some of the treatment factors. With regard to NAWF val-ues recorded on 30 July, the no-till plots had a highervalue than conventional or reduced tillage treatments (5.2vs 4.6 or 4.7), indicating a slight delay in maturity. On the
same date there were no differences in NAWF betweenno-till plots with respect to cultivation (5.2 vs 5.2). Withinthe no-till plots at this date, cotton in vetch treatmentswas later maturing than cotton in the plots with a wheatcover crop or native cover (5.4 vs 5.1 or 5.1). This couldbe partially explained by the lower early soil tempera-tures, which could have reduced early plant vigor. Therewas also a difference in NAWF at this date between theplots that were sub-soiled and the plots that were not (5.2vs 4.9).
Cotton yield was also affected by some treatment fac-tors; contrast statements were again used in order to ex-amine the influence of individual treatment variables. Therewas no difference in yield between the no-till treatmentsand the conventional or the reduced till treatments. Therewas also no difference in yield between the no-till plotsthat were cultivated and those that were not. With respectto the cover crops, there was no difference between thewheat and the native treatments. However, both the wheatand the native were higher than the vetch treatments (2641and 2651 vs 2470 lb seedcotton/acre). This could be re-lated to the soil temperature differences seen followingplanting, which might result in poor early-season plantvigor in the vetch plots. Within the conventional and thereduced till plots, there was no yield difference betweenthe plots that were sub-soiled and those that were not.This is in contrast to the data from 1996, where sub-soiled plots yielded more than non sub-soiled plots. Thismay indicate that sub-soiling is not necessary every yearon this soil type. Within the no-till treatments, sub-soil-ing actually resulted in a significant decrease in seedcottonyield of 192 lb/acre. As the mechanical action of the sub-soiling results in a reduced and uneven planting bed, someof the decrease in yield may be due to stand establish-ment. Although there were no statistical differences instand density, the decrease in yield could be related tostand uniformity, which was much more variable in theno-till plots than were sub-soiled. Overall, the no-till treat-ment that was not cultivated or sub-soiled and had onlynative winter cover was numerically the highest yieldingtreatment in the test at 2880 lb seedcotton/acre (Table 1).
Sharkey ClayThere were no treatment differences in NAWF on this
soil type. The lack of a difference in NAWF is most likelyrelated to the lack of plant available water in late July andAugust (circa 1 in. rainfall). With respect to seedcottonyield, the conventional and the reduced-till treatments re-sulted in higher yields than the no-till treatments (1935lb/acre vs 1703 lb/acre). The reduced till plots also re-sulted in more seedcotton than in the conventional till by287 lb/acre (Table 2). This confirms previous researchand is very similar to what many farmers are already doingon this soil type (stale-seedbed).

ARKANSAS AGRICULTURAL EXPERIMENT STATION SPECIAL REPORT 186
44
ACKNOWLEDGMENT
The authors express their appreciation to Cotton Incor-porated and the Louisiana State Support Committee forproviding financial support for this project.
LITERATURE CITED
Boquet, D.J., and A.B. Coco. 1993. Cotton yield and growthresponses to tillage and cover crops on Sharkey clay. Proc. S.Cons. Till. Conf. Sust. Agric., Monroe, LA. 15-17 June. LAES.Baton Rouge, Louisiana. pp. 100-105.
Crawford, S.H. 1979. Evaluation of tillage systems for cottonproduction. Northeast Research Station Annual ProgressReport. Louisiana Agricultural Experiment Station. BatonRouge, Louisiana. pp. 43-44.
Ebelhar, S.A., W.W. Frye and R.L. Blevins. 1984. Nitrogen fromlegume cover crops for no-till corn. Agron. J. 76:51-55.
Heatherly, L.G. 1981. Soybean response to tillage of Sharkey clay soil.Bulletin 892. Mississippi Agricultural and Forestry ExperimentStation, Mississippi State.
Hutchinson, R.L., R.C. Aycock, C.P. Boquet, S.M. Cruse, P.A.Mitello, C.L. Pinnel-Alison, R.L. Rogers and W.W. Russell.1991. An evaluation of conservation tillage systems for cotton onthe Macon Ridge. LA. Coop. Ext. Serv. Pub. 2460.
Laws, F. 1993. Economics of reduced tillage. In: Reduced tillage forsouthern soils. F. Laws (ed.). Pub. Argus Agronomics.Clarksdale, Mississippi. pp. 93-96.
Millhollon, E.P., and D.R. Melville. 1991. The long-term effects ofwinter cover crops on cotton production in northwest Louisiana.Louisiana Agricultural Experiment Station Bulletin 830.
Raney, W.A., P.H. Grissom, E.B. Williamson, O.B. Wooten and T.N.Jones. 1954. The effects of deep breaking on Mississippi soils.Information Sheet 492. Mississippi State College AgriculturalExperiment Station. Mississippi State.
SAS Institute, Inc. 1989. SAS/STAT Users Guide. Version 6, Fourthed., Vol. I. SAS Institute Inc., Cary, North Carolina.
Saveson, I.L., Z.F. Lund and L.W. Sloane. 1958. Deep tillageinvestigations on alluvial soils at the Northeast LouisianaExperiment Station, St. Joseph, Louisiana. Louisiana StateUniversity and Agricultural and Mechanical College.Agricultural Experiment Station. Circular No. 53.
Smith, L.A. 1995. Cotton response to deep tillage with controlledtraffic on clay. Trans. A.S.A.E. 38(1):45-50.
Smith, L.A. and J. Whitten. 1992. Response of cotton to deep tillageon Tunica clay. Proc. Belt. Cot. Conf. 10-14 Jan. New Orleans,Louisiana. National Cotton Council. Memphis, Tennessee. pp.505-506.
Tupper, G.R. 1978. Soybean response to deep tillage method and dateon a silty clay soil. Research Report 4(4): June. MississippiAgricultural and Forestry Experiment Station, Mississippi State.
Wilhelm, W.W., J.W. Doran and J.F. Power. 1986. Corn and sorghumyield response to crop residue management under no-tillageproduction systems. Agron. J. 78:184-189.
Table 1. Treatments used to investigate the effect of conservation tillage practices and winter cover crops on cotton growth an dyield on Sharkey clay and Commerce silt loam at the Northeast Research Station near St. Joseph, Louisiana.
Seedbed Preparation Cultivation Sub-soiled Winter Cover CropFall Spring Hairy Native
Treatment # no-Till Bedded Bedded Yes No Yes No Wheat Vetch Species
1 x x x x2 x x x x3 x x x x4 x x x x5 x x x x6 x x x x7 x x x x8 x x x x9 x x x x10 x x x x11 x x x x12 x x x x13 x x x14 x x x15 x x x16 x x x

PROCEEDINGS 21ST ANNUAL SOUTHERN CONSERVATION TILLAGE CONFERENCE FOR SUSTAINABLE AGRICULTURE
45
Table 2. Yield of cotton plants grown in various cover crop and tillage systems on a Commerce silt loam at the NortheastResearch Station near St. Joseph, Louisiana, 1997.
Tillage Cover Crop Cultivation Sub-Soil Seedcotton
lb/acreConventional None Yes Yes 2727Fall bedded None Yes Yes 2636No-Till None Yes Yes 2570No-Till None No Yes 2575No-Till Wheat No Yes 2560No-Till Wheat Yes Yes 2520No-Till Vetch No Yes 2381No-Till Vetch Yes Yes 2354Conventional None Yes No 2674Fall bedded None Yes No 2623
No-Till None Yes No 2580No-Till None No No 2880No-Till Wheat No No 2850No-Till Wheat Yes No 2638No-Till Vetch No No 2482No-Till Vetch Yes No 2673LSD (0.05) 362
Table 3. Yield of cotton plants grown in various conservation tillage systems on a Sharkey clayat the Northeast Research Station near St. Joseph, Louisiana, 1997.
Tillage Cover Crop Cultivation Sub-Soiled Seedcotton
lb/acreFall bedded None Yes Yes 2097No-Till None No Yes 1759No-Till None Yes Yes 1796Conventional None Yes Yes 1882No-Till Vetch No Yes 1826No-Till Wheat Yes Yes 1680No-Till Vetch Yes Yes 1804No-Till Wheat No Yes 1698Fall bedded None Yes No 2053No-Till None No No 1413No-Till None Yes No 1615Conventional None Yes No 1695No-Till Vetch No No 1836No-Till Wheat Yes No 1539No-Till Vetch Yes No 1751No-Till Wheat No No 1703LSD (0.05) 413
.

ARKANSAS AGRICULTURAL EXPERIMENT STATION SPECIAL REPORT 186
46
INTRODUCTION
oil testing is a tool to evaluate the fertility status ofa soil. The soil samples collected for this evaluationmust represent the field. In most instances, repre-
sentative soil sample within a production field can be col-lected based on slope and soil type. However, producersoften utilize production practices that create a challengefor obtaining a representative soil sample. Production prac-tices that promote nutrient stratification within a field in-crease the difficulty of collecting a representative sample.
Banding fertilizers stratifies nutrients in a systematicpattern across the field. Collecting a sample that adequatelyaccounts for banded nutrients without either over- or un-der-estimating nutrient status presents a challenge. Tylerand Howard (1991) reported random sampling should beutilized on soils having banded fertilizers. Nutrient strati-fication is also promoted in conservation tillage systemsfrom surface applications of non-mobile nutrients (Howardand Tyler, 1987; Tyler and Howard, 1991; Mullen andHoward, 1992). Conservation tillage promotes nutrientstratification when rows are oriented close to the previ-ous years’ rows, allowing nutrient recycling from decay-ing root biomass (Tyler and Howard, 1991; Mullen andHoward, 1992). After seven years, in-row (IR) nutrientstratification as well as nutrient stratification with depthwas evident in a no-till corn soil (Mullen and Howard,1992). Howard et al. (1997) reported higher extractableK levels for the IR sample position than the BR positionon three long-term no-till cotton soils. The objectives ofthis study were to evaluate the differences in nutrient strati-fication over time in a long-term no-till corn soil fertil-ized with several surface broadcast P and K rates. An addi-tional objective was to evaluate residual effects of sevenyears of in-furrow banding P.
MATERIALS AND METHODS
A field experiment was established at the Milan Ex-periment Station, Milan, Tennessee, in 1983 and contin-ued through 1996 on a Loring silt loam soil (fine-silty,mixed, thermic, Typic Fragiudalf). A wheat (Triticumaestivum L.) cover crop was established in October ofeach year except in 1988 for the 1989 crop. Corn was
planted early to mid April each year in 30-in. rows. Indi-vidual plots were four rows wide and 30 ft long.
The experimental design was a randomized completeblock with a split-plot arrangement of treatments repli-cated five times. Main plot treatments were surface broad-cast P and K rates with N-P
2O
5-K
2O fertilizer starter com-
binations as the sub-plots. Main plot P and K rates were:unfertilized check, 50-25, 100-50 and 150-75 lb P
2O
5-
K2O/acre. The two starter treatments selected for sam-
pling were an in-furrow application of 15-30-0 lb N-P2O
5-
K2O/acre and an unfertilized check. Application of the
starter treatments was terminated in 1989. Plots weresampled following the 1989 growing season. Main-plottreatments were terminated following production in 1996,and the same plots were sampled in 1997. Treatment ef-fects on the yield of no-tillage corn from these plots havebeen reported by Howard and Mullen (1991) and Howardand Tyler (1987).
Nitrogen, applied as UAN (32% N), was injected ap-proximately 2 to 3 in. deep and 4 to 6 in. to the side of therow immediately after planting. The total N rate (UAN +starter) applied per plot was 150 lb/acre. Broadcast P+Ktreatments were applied mid to late March using concen-trated super-phosphate and potassium chloride.
The soil sampling protocol consisted of collecting andcombining seven sub-samples from within the row (IR)and between the row (BR) positions in the center of eachplot. The IR sample was collected by sampling directly inexisting stubble while the BR sample was collected ap-proximately 15 in. from the row. Samples were collectedto a 12-in. depth and divided into 0 to 3-, 3 to 6- and 6 to12-in. depth increments. Mehlich-I-extractable P and K(Mehlich, 1953) were evaluated on the 0 to 3- and 3 to 6-in. depth and averaged for statistical evaluations. Statisti-cal analysis was performed to evaluate the effect of yearon extractable P and K by sample position (IR vs BR)from the two original starter treatments (15-30-0 andcheck) within each main plot. These analyses were con-ducted utilizing Proc Mixed procedures of the StatisticalAnalysis System (SAS, 1997). Mean separation was evalu-ated through a series of pairwise contrasts among all treat-ments. Probability levels greater than 0.05 were catego-rized as non-significant.
ASSESSING NUTRIENT STRATIFICATION WITHIN A LONG-TERMNO-TILLAGE CORN SOIL
D.D. Howard, M.D. Mullen and M.E. Essington1
S
12 Prof. and Associate Profs., Plant and Soil Sci. Dept., Univ. of Tenn.

PROCEEDINGS 21ST ANNUAL SOUTHERN CONSERVATION TILLAGE CONFERENCE FOR SUSTAINABLE AGRICULTURE
47
RESULTS
Extractable PhosphorusThe level of Mehlich-I-P varied with year of sampling,
sampling position (IR vs BR) and starter treatment (Table1). Extractable P within the 0-P
2O
5 main plot was over
twice as high in 1989 as in 1996 (Table 2). Mehlich-I-Pwas also higher in 1989 than in 1996 for samples col-lected from the 50-lb P
2O
5 main plot. However, Mehlich-
I-P differences between years were not significant for thetwo higher P
2O
5 fertilizer treatments. In-furrow applica-
tion of 30 lb P2O
5/acre to the starter plot resulted in higher
Mehlich-I-P from the 0-, 50- and 100-lb P2O
5 main plots
compared with Mehlich-I-P from the check plot. Broad-casting 150 P
2O
5/acre eliminated Mehlich-I-P differences
due to starter applications. Extractable P was higher in theIR position relative to the BR position in the 0- and 50-lbP
2O
5/acre main plots, but the reverse occurred in the 100-
and 150-lb P2O
5 main plots. The year-by-starter-by-posi-
tion interaction affected extractable P within each P2O
5
main plot (Table 1). Mehlich-I-extractable P within theunfertilized main plot (0-lb P
2O
5 rate) was greater in the
1989 IR position of the starter plot compared with theother treatments (Table 3). In-furrow applications of 30 lbP
2O
5/acre clearly impacted extractable P. In 1996, differ-
ences in Mehlich-I-P due to sampling position were notdetected. Seven years after terminating the in-furrow starterapplications, extractable P in the IR position had decreasedfrom 30 to 7 lb/acre, a change from a high (H) to a low(L) soil test level. There is a possibility that the in-fur-row-applied P
2O
5 was not intersected in 1996 sampling,
but planting within the same 10-ft plot should have al-lowed sampling of one of the seven in-furrow P
2O
5 appli-
cations. This observation suggests that the soil has high Pbuffering capacity.
As expected, broadcasting 50 lb P2O
5/acre resulted in
greater Mehlich-I-P relative to the unfertilized main plot(Table 2). Application of the 50 lb P
2O
5 rate to a main plot
changed the pattern of Mehlich-I-P based on sampling pro-tocol (Table 3). As was observed for the 0-lb P
2O
5 main
plot, extractable P from the 1989 IR starter sample wasgreater than that extracted from the other treatments. By1996, Mehlich-I-P in the BR starter position was greaterthan that of either sampling positions within the check.Extractable P within this main plot ranged from a high of68 lb/acre to a low of 15 lb/acre.
Once again, the extractable P pattern changed when sam-pling a higher P
2O
5 rate (100 lb). The in-furrow applica-
tion of 30 lb P2O
5 was detected in the 1989 IR starter
sample (Table 3). The extractable P in the IR position hadnot changed by 1996 (74 and 63 lb). However, extractableP in the BR position had increased by 1996. Extractable Pfrom the starter BR position was higher in 1996 than theextractable P from either sample position within the check
plot. Broadcasting 100 lb P2O
5/acre for 14 years increased
Mehlich-I-P levels well into the H soil test rating.Broadcasting 150 lb P
2O
5/acre over the 14 years once
again changed the pattern of extractable P in this soil whencompared with the other main plot fertilization rates (Table3). The 1989 IR starter position was higher in extractableP than the BR position but the reverse was observed in thecheck sample. By 1996, extractable P was unaffected bysampling position of the starter. As was observed in 1989,extractable P from the 1996 BR position in the check washigher than the IR position. Differences in extractable Pbetween the 1989 and 1996 samples due to sample posi-tions (IR vs BR) were similar, 29 and 31 lb P/acre, re-spectively.
These data indicate that Mehlich-I-P was verticallystratified within a long-term no-tillage corn soil. Stratifi-cation was dependent on fertilization applied either as sur-face broadcast rates or in-furrow starter treatments. Nu-trient stratification would affect fertilizer recommenda-tions on those soils having low fertilizer applications forM or L Mehlich-I-P soil test levels.
Extractable PotassiumMehlich-I-extractable K was affected by sampling time,
position (IR vs BR) and starters within the 0 and 50 lbK
2O/A main plots (Table 1). Extractable K within the 0
and 25 lb K2O fertilized main plots was lower in 1996,
indicating depletion by crop removal (Table 2). The checkplot had higher extractable K than the starter within the 0-lb K
2O main plot, but the reverse was observed for the 50-
lb K2O/acre main plot. This is interesting since K was not
in-furrow applied as a starter fertilizer. Sampling the IRposition resulted in higher extractable K relative to BRsampling of main plots.
Mehlich-I-extractable K within the 50- and 75-lb K2O
main plots was affected by a year-by-starter-by-sampleposition interaction (Table 1). Extractable K of the 1989starter plot within the 50-lb K
2O main plot was unaffected
by sample position (Table 3). But extractable K was greaterin the check IR position compared with the BR sample.The level of extractable K in the 1989 IR or BR positionswas the same for both starter plots. The levels were thesame for the BR position within the starter and checkplots. By 1996, IR-extractable K was greater in both startertreatments compared with the BR position sample, but1996 extractable K in the starter IR position was higherthan the check IR position. In 1996, extractable K fromthe IR starter position (197 lb K/acre) would be classifiedas high while the BR sampling would be medium (113 lbK/acre). Soil samples collected from either IR or BR po-sitions would be assigned a soil test rating of M. How-ever, stratification within the starter plot had reduced ex-tractable K in the BR position from 142 to 107 lb/acre,which is approaching a L soil test rating.

ARKANSAS AGRICULTURAL EXPERIMENT STATION SPECIAL REPORT 186
48
Broadcasting 75 lb K2O resulted in significant differ-
ences in extractable K with sampling position, but differ-ences between starter plots and years were not detected(Table 2). Extractable K from the IR sampled position wasgreater than the extractable K from the BR positions (Table3). Vertical stratification of K was occurring in the long-term no-tillage corn soil. Stratification was greater as therate surface-applied fertilizer increased. The soil K testlevel from the IR position would be classified as H or Mfor the BR position. Soil test fertilizer recommendationswould vary depending on the position sampled.
CONCLUSIONS
Vertical stratification of Mehlich-I-extractable P andK has occurred in a long-term no-tillage corn soil. Theamount of stratification was dependent on the broadcastrates of P
2O
5 and K
2O as well as previous starter applica-
tions. The effect of P starters was not detected in samplescollected seven years after starter termination. Extract-able P tended to be higher in the BR sample positionrelative to the IR sample position while the reverse wastrue for extractable K. A sampling protocol other than arandom sampling may affect the extracted levels of bothnutrients, which may affect fertilizer recommendations.
LITERATURE CITED
Howard, D.D., M.E. Essington and D.D. Tyler. 1997. Assessing thefertility status of long-term no-tillage cotton soils: In-row versesbetween-row sampling. p. 295. Agron. Abs.
Howard, D.D., and M.D. Mullen. 1991. Evaluation of in-furrow andbanded starter N-P-K nutrient combinations for no-tillage cornproduction on soil fertilized with four rates of phosphate andpotash. J. Fert. Issues 8:34-39.
Howard, D.D., and D.D. Tyler. 1987. Comparison of surface appliedrates of phosphorus and potassium and in-furrow fertilizersolution combinations for no-till corn production. J. of Fert. Issues4:48-52.
Mehlich, A. 1953. Determination of P, Ca, Mg, K, Na and NH4. North
Carolina Soil Testing Div. Mimeo, Raleigh.Mullen, M.B., and D.D. Howard. 1992. Vertical and horizontal
distribution of soil C, N, P, K, and pH in continuous no-tillage cornproduction. In: M.D. Mullen and B.N. Duck (eds.). Proceedingsof the 1992 Southern Conservation Tillage Conference, SpecialPublication 92-01. p. 6-10.
SAS Institute, Inc. 1997. SAS/STAT Software; Changes inenhancements through release 6.12. Cary, North Carolina.
Tyler, D.D., and D.D. Howard. 1991. Soil sampling patterns forassessing no-tillage fertilizationtechniques. J. Fert. Issues 8:52-56.
Table 1. Type III F-values from statistical analysis of Mehlich-I-extractable phosphorus and potassiumfrom a long-term no-tillage soil in corn production.
Extractable P Extractable KBroadcast P rates Broadcast K rates
Item df 0 50 100 150 0 25 50 75
Year (Y) 1 22.7** 79.6** 0.8 2.9 29.6** 8.4* 6.4 1.2Error a 4Starter (S) 1 19.3** 106.7** 25.5** 3.4 13.9** 1.1 7.7* 0.2S*Y 1 10.5* 39.1*** 0.0 1.5 1.8 0.2 4.3 0.3Error b 8Position (P) 1 14.6** 45.5*** 7.4* 9.4** 89.3*** 49.0*** 83.2*** 116.5***
P*Y 1 18.6*** 94.0*** 7.5** 5.8* 0.0 11.1** 29.3*** 3.2S*P 1 17.2** 68.7*** 0.2 15.3*** 3.0 0.0 1.2 0.0S*P*Y 1 23.1*** 78.4*** 5.0* 4.6* 1.1 1.0 6.1* 4.5*
Error c 16
*, **, *** Significant at the 0.05, 0.01 and 0.001 probability level, respectively.
Table 2. Mehlich-I-extractable phosphorus (P) and potassium (K) from a long-term corn experiment as affectedby year, starter applications and sampling position.
Broadcast P2O5 rates (lb/acre) Broadcast K2O rates (lb/acre)0 50 100 150 0 25 50 75
YEAR ---------------------------lb extractable P-------------------------- --------------------------lb extractable K----------------------------1989 14 A1 33 A 62 A 94 A 130 A 147 A 156 A 181 A1996 6 B 20 B 58 A 102 A 103 B 129 B 144 A 170 ASTARTERStarter 14 A 34 A 72 A 103 A 109 B 140 A 156 A 174 ACheck 7 B 19 B 49 B 93 A 123 A 136 B 143 B 177 APOSITIONIn-Row 13 A 31 A 56 B 92 B 128 A 151 A 171 A 208 ABetween-Row 8 B 22 B 65 A 105 A 105 B 125 B 129 B 143 B1Within a column of each P or K rate, means followed by the same letter are not significantly different at α = 0.05.

PROCEEDINGS 21ST ANNUAL SOUTHERN CONSERVATION TILLAGE CONFERENCE FOR SUSTAINABLE AGRICULTURE
49
Table 3. Effect of broadcast phosphorus and potassium rates, starter applications, year of sampling and sampling positionon Mehlich-I-extractable phosphorus and potassium.
In-furrow Sample Broadcast P2O5 and K2O ratestreatment Position Year 0-0 50-25 100-50 150-75
---------------------------------lb extractable P/acre------------------------------------Starter IR 1989 30 A* 68 A 74 AB 113 AB
BR 1989 9 B 21 BC 65 BC 90 CDCheck IR 1989 7 B 20 BC 43 D 72 D
BR 1989 8 B 21 BC 51 CD 101 ABCStarter IR 1996 7 B 20 BC 63 BC 96 BC
BR 1996 8 B 25 B 85 A 112 ABCheck IR 1996 6 B 15 C 45 D 85 CD
BR 1996 5 B 19 C 56 CD 116 A---------------------------------lb extractable K/acre------------------------------------
Starter IR 1989 136 A 154 A 163 B 198 ABR 1989 115 A 144 A 152 BC 157 B
Check IR 1989 146 A 155 A 166 B 219 ABR 1989 122 A 138 A 142 C 151 B
Starter IR 1996 102 A 153 A 197 A 214 ABR 1996 86 A 110 A 113 D 127 B
Check IR 1996 127 A 143 A 158 BC 201 ABR 1996 98 A 108 A 107 D 138 B
* Within a column for each K rate, means of each extractable nutrient followed by the same letter are not significantly different at α = 0.05.

ARKANSAS AGRICULTURAL EXPERIMENT STATION SPECIAL REPORT 186
50
ABSTRACT
ow residue-producing crops such as cotton(Gossypium hirsutum L.), especially when grownin monoculture, are detrimental to soil quality.
Cover crops, crop rotations with legumes and high-resi-due crops can improve soil quality. The ‘Old Rotation’(1896) is the oldest continuous cotton experiment in theworld and includes rotations and winter legume cover cropsin cotton production systems. There are six treatments inthe ‘Old Rotation’: a three-year rotation of cotton andgrain crops plus a winter legume cover crop; two fertilizertreatments (with and without N fertilizer) imposed on atwo-year rotation of cotton and a grain crop plus a winterlegume cover crop; and three continuous cotton croppingsystems (with N fertilizer, without N or N supplied from awinter legume cover crop). Because of the uniqueness of‘Old Rotation’ and the current interest in soil quality, thespecific objectives of this study were: 1) to determine theeffects of rotations on soil quality after 100 years; 2) toevaluate the USDA Soil Quality Kit and compare resultswith standard procedures for selected indicators; and 3) todevelop a baseline of soil quality indicators to monitorchange. After 100 years, soil quality was better for thethree-year rotation and the two-year rotation plus N dueto higher soil C (1.3 and 1.1%, respectively, compared toa mean of 0.8% for others). The three-year rotation hadhigher percentage water stable aggregates (64% comparedto a range of 34 to 53% for other treatments). Cationexchange capacity was highest for the three-year rotationand the two-year rotation (5.5 and 5.4 cmol
c/kg, respec-
tively, compared to a mean of 4.4 cmolc /kg for other
treatments). Soil strength was lowest (six bars) for thethree-year rotation while continuous cotton without a covercrop or N had the highest soil strength in the top 4 in. ofthe plow layer. Kit measurements had higher variabilityrelative to standard procedures. Soil moisture was greaterat the time Kit measurements were taken and fewer sampleswere used, which may explain increased variability. TheKit can be used to evaluate trends and comparisons butshould not be used in place of standard procedures forresearch. Information from this study will set a baselinefor soil quality indicators for the ‘Old Rotation’, and fu-
ture studies will measure the differences in soil quality asa result of the conversion to conservation tillage in 1997.
INTRODUCTION
The ‘Old Rotation’ experiment at Auburn Universityhas been in continuous production since 1896 (Mitchellet al., 1996), and the purpose of this study was to showthat the use of crop rotations and legume cover cropscould sustain cotton and corn yields. In the spring of 1997,after 100 year of conventional tillage, the ‘Old Rotation’was converted to conservation tillage. We were interestedin the effects of long-term legume cover crops, crop rota-tions and N fertilizer on soil quality. We also needed abaseline value for soil quality in order to monitor changeas the ‘Old Rotation’ was converted to conservation till-age.
Soil quality is “the capacity of a specific kind of soil tofunction, within natural or managed ecosystem boundaries,to sustain plant and animal productivity, maintain or en-hance water and air quality, and support human health andhabitation” (Karlen et al., 1997). Soil quality cannot bemeasured directly but must be inferred by its attributes orindicators (Seybold et al., 1998). Karlen et al. (1997)suggested using indicators such as organic matter, infil-tration, aggregation, pH, bulk density, electrical conduc-tivity and available nutrients to monitor soil quality.
Because of the uniqueness of the long-term rotationsin the ‘Old Rotation’ and because of the current interest insoil quality, we wanted to measure the effects of theselong-term treatments on soil quality. The specific objec-tives of this study were: 1) to determine the effects ofrotations on soil quality indicators after 100 years; 2) toevaluate the USDA Soil Quality Kit (Liebig et al., 1996)and compare results with standard procedures for selectedindicators; and 3) to develop a baseline of soil qualityindicators in order to compare future effects of conserva-tion tillage, cover crops and crop rotations on soil quality.
MATERIALS AND METHODS
The ‘Old Rotation’ consists of 13 plots (Mitchell etal., 1996). Each plot is 21.5 ft by 136.1 ft and is separatedby 3-ft alleys. Treatments in the ‘Old Rotation’ have evolvedinto six rotations (Table 1). The soil at the site of therotation is currently identified as Pacolet fine sandy loam(clayey, kaolinitic, thermic Typic Hapludults), a typicalPiedmont soil. The soil has a Coastal Plain cap similar to
MEASURING SOIL QUALITY ON THE ‘OLD ROTATION’
Michael D. Hubbs, D.W. Reeves and Charles C. Mitchell Jr.1
L
1USDA-NRCS Soil Quality Institute; USDA-ARS-National Soil DynamicsLaboratory; Auburn University.
PROCEEDINGS 21ST ANNUAL SOUTHERN CONSERVATION TILLAGE CONFERENCE FOR SUSTAINABLE AGRICULTURE
51
a Marvyn loamy sand (fine-loamy, siliceous, thermic TypicKanhapludults). The site is on a gently rolling slope (~3%). Confusion for the soil identification is due to Auburnbeing located at the junction of the two physiographicregions with the upper part of the site (plot #1) morecharacteristic of a Coastal Plain soil and the lower por-tion (plot #13) more characteristic of a Piedmont soil(Mitchell et al., 1996).
Standard ProceduresNine standard tests were used to measure selected soil
quality indicators. Soil strength was measured using a re-cording cone penetrometer with 10 insertions per plot,beginning at 0.6 in. and recording a reading every 0.6 in.to 24 in. deep. Bulk density was determined from fiveundisturbed cores per plot at zero to 3 in. using the methodof Blake and Hartge (1986). Gravimetric soil water con-tent was measured by taking five undisturbed cores fromeach plot at the 0- to 3-in. depth (Gardner, 1986). Hydrau-lic conductivity (K
sat) was determined (Klute and Dirkson,
1986) from five undisturbed cores per plot at three dif-ferent depths (0 to 3, 3 to 6 and 6 to 8 in.) for a total of15 samples per plot. Soil samples for nutrient determina-tion were taken at three depths (0 to 1.5, 1.5 to 6 and 6 to10 in.) with composite samples from 10 random sites perplot. Soil nutrients were extracted using Mehlich-I andanalyzed (Odom and Kone, 1997) using an inductively-coupled-plasma (ICP) analyzer. Elements determined wereCa, K, Mg, P, Cu, Fe, Mn, Zn, B, Mo, Al, Co and Na.Cation exchange capacity (CEC) (Rhoades, 1986) and pHwere also determined (Tan, 1996). Samples for soil C andN were taken from five locations per plot to form threecomposite samples by depth (0 to 1.5, 1.5 to 6 and 6 to10 in.) The samples were prepared by fine grinding on aconveyor-belt apparatus to reduce sample variability(Kelley, 1994). Duplicate samples were analyzed for car-bon and nitrogen by a combustion technique. Percent wa-ter stable aggregates were determined (Kemper andRosenau, 1986) from samples taken from five locationsper plot forming three composite samples for depths of 0to 1.5, 1.5 to 6 and 6 to 10 in. During wet sieving, twosub-samples were analyzed from each sample for a totalof six samples per plot.
The Soil Quality Kit ProceduresThe USDA Soil Quality Kit (Kit) was used to measure
seven soil quality indicators. Samples for all indicatorswere taken at three random positions per plot to the 3-in.depth. Infiltration rate was measured using an aluminumring 6 in. in diameter and 5 in. in length. The ring wasdriven into the ground to a depth of 3 in. Water (1 in.) waspoured in the ring; the time it takes to infiltrate is thedetermined infiltration rate (in./min). A lid with a rubbersepta was placed on top of the ring for 30 min to accumu-late CO
2 respired by soil organisms and plant roots. Air in
the covered ring was sampled with a syringe and passedthrough a Drager 0.1 % CO
2 tube and CO
2 determined
colorimetrically. Bulk density and soil water content weremeasured by inserting a 3-in.-diameter cylinder into theground. Calculations are similar to standard tests. Soilwater content samples for the standard method were col-lected during a period of dry weather prior to planting(April 1997) while the USDA Soil Quality Kit’s samplingwas done in July after several rains. Soil pH and electricalconductivity (EC) were measured using pocket meters ina 1:1 soil to water ratio. Soil nitrate content was deter-mined by dipping nitrate test strips in a filtered extract.The test strip color was compared to a standard colorchart, indicating concentrations of nitrate.
Statistical AnalysisData were analyzed using the General Linear Model
(GLM) procedure of the Statistical Analysis System (SASInstitute, 1988). Least-squares means statements were usedfor means separation. Pearson product-moment correla-tion among measured variables and methods were calcu-lated using the CORR procedure of SAS (SAS Institute,1988).
RESULTS AND DISCUSSION
The standard method for determining soil water con-tent showed significant differences among treatments. Thethree-year rotation plus legume cover crop (treatment 1)had the highest average water content while the continu-ous cotton treatments (treatments 2 and 3) had the lowestsoil water content (Table 2). Sampling for soil water withthe Kit at a later date showed no significant differencesamong treatments due to a higher variance in the data.Also, we took five sub-samples during sampling for thestandard procedures and only three sub-samples with theKit. Fewer samples taken with the Kit likely contributedto more variability. There was good correlation betweenthe two methods (r = 0.77), but the Kit’s method had amuch higher coefficient of variation (c.v.), 32% comparedto 8% for the standard method.
There were significant differences in Ksat
(standard pro-cedure) among treatments but not by depth. The c.v. washigh (62%). Infiltration measurements taken with the Kitshowed a trend for differences between the three-yearrotation and other treatments (P < 0.14); however, the c.v.was 95%.
Soil C was highest for the three-year rotation (treat-ment 1) and lowest for continuous cotton without a le-gume cover crop or N (treatment 2) (Table 3). Respira-tion measurements (Kit) showed no differences amongtreatments. However, there was good correlation betweenlaboratory determination of total C and respiration as mea-sured by the Kit (r = 0.75). The Kit’s method showedmore variation with a c.v. of 33% for respiration com-

ARKANSAS AGRICULTURAL EXPERIMENT STATION SPECIAL REPORT 186
52
pared to 10% for soil C determination using standard pro-cedures. Generally, soil respiration was commensurate withsoil C concentrations. The continuous cotton plus N (treat-ment 3) and two-year rotation (treatment 4) were excep-tions.
Electrical conductivity measured by the Kit showed sig-nificant differences among treatments. Treatment 3, con-tinuous cotton with 120 lb of N (plot #13) had a higherEC (0.67 dS/m) than other treatments (range from 0.10 to0.20 dS/m). This may be the result of accumulation of Nafrom fertilizer treatments of sodium nitrate prior to WordWar II. Plot # 13 is at the slope end of the site and has ahigher clay content (25%) (Mitchell et al., 1996) thanmost of the other plots (< 20%), which may contribute togreater retention of salts. There were no differences amongother treatments in EC.
Cation exchange ranged from 3.1 cmolc/kg for continu-
ous cotton without legume or N (treatment 2) to 5.5 cmolc/
kg for the three-year rotation (Table 4). Increases in CECwere due to more intense rotations, the use of legumecover crops and N fertilization. These results are similarto those for soil carbon (Table 4). Treatment 3 was rela-tively higher (5.6 cmol
c/kg) due to higher clay content
compared to other plots.The percentage water stable aggregates ranged from
35% in cotton without legume but N fertilizer (treatment3) to 64% in the three-year rotation with legume covercrop (treatment 1). Aggregate stability was increased byrotation, cover crop use and N fertilizer but was also af-fected by clay content (data not shown).
The ICP analysis showed significant differences bytreatment and depth for extractable P and by depth onlyfor extractable K. Phosphorus levels were lowest for thetwo-year rotation without N (treatment 6) and three-yearrotation (41 and 45 mg/kg, respectively) while continuouscotton without a cover crop and N was highest (99 mg/kg). Rotation treatments have had little effect on othernutrients due to the use of conventional tillage for thepast 100 years, which has evenly distributed nutrientsthrough the plow layer. Differences in P and K were lim-ited to the upper 6 in. of the plow layer and were due tofertilizer applications, reduced plant removal of nutrientsin less productive rotations and mixing of soil in the plowlayer due to tillage. The elemental analysis data will serveas a baseline to monitor changes in nutrient stratificationcaused by conservation tillage in the future.
There were significant differences in soil strengthamong treatments to the 4-in. depth (Fig. 1). The two con-tinuous cotton treatments without cover crops (treatment2 and 3) had the highest mean ranges. There was a strongtrend for differences to the 10-in. depth (P < 0.25). Withthe exception of continuous cotton (treatment 2), therewas considerable compaction below the 10-in. depth. Con-tinuous cotton (treatment 2) shows reduced soil strength
at the 10-in. depth, possibly due to high variability in thedata (~55 % c.v.) or inherent differences in the soil pro-file between it and other plots. The variability could be theresult of the ‘Old Rotation’ plots being located in a transi-tion zone, including both Piedmont and Coastal Plain soiltypes.
CONCLUSIONS
After 100 year of using a legume cover crop and croprotations with high residue crops like corn and small grains,soil quality is better for the three-year rotation plus awinter legume cover crop (treatment 1) due to higher soilcarbon, more water stable aggregates, higher CEC, reducedsoil strength at the surface and higher soil water retention.In contrast, continuous cotton without a legume cover crophad lower soil carbon, lower water stable aggregates, lowersoil water retention and greater soil strength down to 5 in.Nitrogen fertilizer and/or a legume cover crop within con-tinuous cotton rotations contributed to more residues andgreater soil carbon accumulation over past 100 years. Thesame can be said for the two-year rotations that included ahigh-residue crop (corn) plus a legume cover crop with orwithout nitrogen. With the exception of P, rotation treat-ments had little effect on extractable plant nutrients dueto the use of conventional tillage for the past 100 years.However, these data will be used as a baseline to monitorfuture changes in nutrient stratification caused by conser-vation tillage.
The USDA Soil Quality Kit is designed for semi-quan-titative assessments and for education on soil quality. TheKit can be useful for a conservationist or farmer to com-pare management practices to assess trends in soil qualitybut should not be used for research. Soil carbon data willbe beneficial to interpret Kit respiration readings. The Kithad higher variation (c.v.) than comparable standard pro-cedures. This may have been due to use of fewer samplesfor kit measurements than for standard procedures. Moreintensive sampling and incorporating data from standardtests can improve the reliability and usefulness of the Kit.
The benefits of crop rotations and cover crops shouldbe enhanced by the addition of conservation tillage as amanagement practice in the ‘Old Rotation’. The impact ofconservation tillage on soil quality in the ‘Old Rotation’can be monitored in the future using these establishedbaseline values.
LITERATURE CITED
Blake, G.R., and K.H. Hartge. 1986. Bulk density. pp. 364-367. In: A.Klute (ed.). Methods of soil analysis Part 1: Physical andmineralogical methods. 2nd ed. ASA and SSSA, Madison,Wisconsin.
Gardner, W. 1986. Water content. pp. 493-509. In: A. Klute (ed.).Method of soil analysis Part 1: Physical and mineralogicalmethods. 2nd ed. ASA and SSSA, Madison, Wisconsin.
Karlen, D.L., Mausbach, J.W. Doran, R.G. Cline, R.F. Harris and

PROCEEDINGS 21ST ANNUAL SOUTHERN CONSERVATION TILLAGE CONFERENCE FOR SUSTAINABLE AGRICULTURE
53
G.E. Schuman. 1997. Soil quality: A concept, definition, andframework for evaluation. Soil Sci. Soc. Am. J. 61:4-10.
Kelley, K.R. 1994. Conveyor-belt apparatus for fine grinding of soiland plant materials. Soil Sci. Soc. Am. J. 58:144-146.
Kemper, W.D., and R.C. Rosenau. 1986. Aggregate stability and sizedistribution. pp. 428-432. In: A. Klute (ed.). Method of soilanalysis Part 1: Physical and mineralogical methods. 2nd ed.ASA and SSSA, Madison, Wisconsin.
Klute, A., and C. Dirkson. 1986. Hydraulic conductivity anddiffusivity: Laboratory methods. pp. 694-700. In: A. Klute (ed.)Method of soil analysis Part 1: Physical and mineralogicalmethods. 2nd ed. ASA and SSSA, Madison, Wisconsin.
Liebig, M.A., J.D. Doran and J.C. Gardner. 1996. Evaluation of fieldtest kit for measuring selected soil quality indicators. Agron. J.88:683-686.
Mitchell, C.C., F.J. Arriaga, J.A. Entry, J.L. Novak, W.R. Goodman,D.W. Reeves, M.W. Runge and G.J. Traxler. 1996. 26 pp. The‘Old Rotation’, 1896-1996, 100 years of sustainable croppingresearch. Ala. Agric. Exp. Sta., Auburn Univ., Ala.
Odom, J.W., and M.B. Kone. 1997. Elemental analysis proceduresused by the Auburn University Department of Agronomy andSoils. pp. 10-15. In: Agronomy and Soils Departmental SeriesNo. 203. Alabama Agricultural Experiment Station, AuburnUniversity, Alabama.
Rhoades, J. D. 1986. Cation exchange capacity. pp. 154-157. In: A.Klute (ed.). Method of soil analysis Part 1: Physical andmineralogical methods. 2nd ed. ASA and SSSA, Madison,Wisconsin.
SAS Institute. 1988. SAS/STAT user’s guide. SAS Institute, Inc.Cary, NC.
Seybold, C.A., Mausbach, D.L. Karlen and H.H. Rogers. 1998.Quantification of soil quality. pp. 387-404. In: R. Lal, J.M.Kimble, R.F. Follett and B.A. Stewart (eds.). Soil Processes andthe Carbon Cycle. CRC Press, Boca Raton, Florida.
Tan, K.H. 1996. Soil sampling, preparation, and analysis. pp. 274-277.Marcel Dekker, Inc. New York, New York.
Table 1. The ‘Old Rotation’ treatments.
Treatment Plots Rotations N management
1 10, 11 and 12 Three-year rotation of cotton fb1 legume cover crop 60 lb/acre applied to(Trifolium incarnatum L.) fb corn (Zea mays L.) fb wheat or ryewheat (Triticum aestivum L.) or rye (Secale cereale L.)for grain fb soybean [Glycine max (L.) Merr.]
2 1 and 6 Continuous cotton without a cover crop No N3 13 Continuous cotton + N without a cover crop 120 lb/acre applied to cotton4 2, 3 and 8 Continuous cotton + legume cover crop No N5 4 and 7 Two-year rotation of cotton-corn +legume cover crop No N6 5 and 9 Two-year rotation of cotton-corn + legume cover crop 120 lb/acre applied to cotton
1fb = followed by.
Table 2. Comparisons of some soil quality indicators determined from standard tests vs. the USDA Soil Quality Kit .Means followed by the same letter are not significantly different at P < 0.10.
Bulk Density Soil Water Ksat
Treatments Standard Kit Standard Kit Kit Standard
-----------g/cm3----------- -------------%-------------- ----------in./min----------Three-year rot. + legume cover crop 1.65 1.38 11.47a 19.75a 1.22 0.09bcCont. cotton with no legume 1.66 1.44 7.69c 9.98b 0.37 0.15aCont. cotton + 120 lb N/acre 1.73 1.45 9.40bc 12.27ab 0.04 0.03cCont. cotton + legume cover crop 1.66 1.49 9.47b 15.12ab 0.43 0.09bcTwo-year rot. + legume cover crop 1.68 1.42 10.11ab 14.87ab 0.57 0.08cTwo-year rot. + legume cover crop + 120 lb N/acre 1.62 1.40 11.67a 14.11ab 0.33 0.15a
Table 3. Comparisons of some soil quality indicators determined from standard tests vs. the USDA Soil Quality Kit . Meansfollowed by the same letter are not significantly different at P < 0.10.
pH pH Respiration Total C Total N NitratesTreatments (standard) (Kit) (Kit) (standard) (standard) (Kit)
lb/C/day % % ppmThree-year rot. + legume cover crop 5.92c 5.83b 60.16a 1.27a 0.05ab 4.78bContinuous cotton with no legume 7.16a 7.10a 22.07b 0.50d 0.02c 1.67bContinuous cotton + 120 lb N/acre 6.07bc 4.67c 36.28ab 0.87c 0.04abc 50.00aContinuous cotton + legume cover crop 6.22b 5.93b 43.91ab 0.84c 0.04ab 6.11bTwo-year rotation + legume cover crop 6.32b 5.84b 60.42a 0.85c 0.05ab 2.83bTwo-year rotation + legume cover crop + 120 lb N/acre 5.52d 5.05c 44.73ab 1.09b 0.06a 10.34b

ARKANSAS AGRICULTURAL EXPERIMENT STATION SPECIAL REPORT 186
54
Table 4. Comparisons of CEC and water stable aggregates %(WSA) determined from standard tests. Means followed by the
same letter are not significantly different at P < 0.10.
Treatments CEC WSA
cmolc/kg %Three-year rotation + legume cover crop 5.5a 64.1aContinuous cotton /no legume 3.1c 49.8bContinuous cotton + 120 lb N/acre 5.6a 34.7cContinuous cotton + legume cover crop 4.3b 52.2bTwo-year rotation + legume cover crop 4.6b 53.2bTwo-year rotation + legume cover crop + 120 lb N/acre 5.4a 48.9b
Fig. 1. Soil strength as influenced by treatment.

PROCEEDINGS 21ST ANNUAL SOUTHERN CONSERVATION TILLAGE CONFERENCE FOR SUSTAINABLE AGRICULTURE
55
INTRODUCTION
soil resource area east of the Mississippi Deltathat runs the entire length of the state and variesin width from 50 to 125 miles is referred to as
the Brown Loam soils area of Mississippi. Soils of thisarea are some of the most erosive soils in the nation.Soils of the Brown Loam are loess soils and have little orno cohesion. When wet the soil particles appear to dis-perse in water as soils having no structure, making foreasy soil erosion. Low organic matter makes these soilssusceptible to crusting and sealing following spring rains,which creates conditions conducive to water erosion. Inaddition, many of the soils have slopes exceeding 10%,which further contributes to erosion. In order to meet therequirements of the 1985 Farm Bill, no-till and minimumtilled practices had to be adopted with the use of covercrops and buffer strips if row crops were to be grown onthe Brown Loam. Reducing tillage and growing a covercrop increased surface residue, which helped decrease ero-sion along with supplying or depleting nitrogen from thesoil, depending on type of cover crop.
Wheat, native weeds and grasses deplete nitrogen fromthe soil whereas clover and vetch add nitrogen to the soil.It was estimated by Stevens et al. (1993) that a wheatcover crop will require 30 additional units of nitrogenduring the growing season to compensate for the nitrogenthe microbes need to decompose the wheat residue. Brownet al. (1985) estimated that a clover cover crop will addbetween 30 and 45 lb of nitrogen to the soil and a vetchcover crop will add between 45 and 60 lb of nitrogen tothe soil.
A study was started at the North Mississippi BranchExperiment Station in Holly Springs, Mississippi, to de-termine the nitrogen requirements of no-till grown cottonusing wheat, native cover and vetch as the winter covercrops. This information would be useful in helping pro-ducers select cover crops and managing no-till grown cot-ton.
MATERIALS AND METHODS
In 1996 and 1997 nitrogen studies were conducted onfields that were in cotton production the previous year.After cotton harvest the stalks were cut 19 October 1995
using a rotary cutter leaving a plant stubble of approxi-mately 8 in. After stalk shredding, wheat and vetch wereplanted no-till in the cotton stubble 20 October with a Tyegrain and small seed drill in a randomized compete block.Wheat was seeded at 90 lb of seed/acre and vetch wasseeded at 45 lb/acre. In the spring of 1996 the wheat,vetch and native cover had Roundup (glyphosate) sprayedover the top at a rate of 2.0 lb ai/acre 8 April l996. Asecond burndown was made using Gramoxone (paraquat)at 0.5 lb ai/acre 27 April 1996.
The same cover crop management techniques were usedin the 1996-97 cover crops except for dates of plantingand burndown. In 1996 the cotton stalks were cut 4 No-vember, and cover crops were seeded 5 November. Firstburndown treatment was sprayed 24 April 1997, and sec-ond burndown was sprayed 19 May 1997. A split blockdesign was used with cover crops planted in a randomizedcomplete block and nitrogen levels as subplots random-ized within each block. Each plot consisted of eight rows38 in. wide and 50 ft long. All treatments were replicatedfour times.
A blend of dry phosphorus and potassium fertilizer wasbroadcast according to soil test recommendations 27 April1996 and 7 April 1997 across the entire plot area. Allcotton planting was done using a John Deere Max-EmergeModel 7100 planter equipped with bubble coulters to cutthrough the residue in the no-till systems. Cotton wasplanted 27 April 1996 and 19 May 1997. At planting Temik(aldicarb) was applied in the drill at 0.75 lb ai/acre.Terrachlor Super X (pentachloronitrobenzene) was appliedat planting in the seed drill at the rate of 2.0 lb ai/acre. Cotoran (fluometuron) and Dual (metolachlor) weresprayed broadcast at a rate of 0.75 and 1.0 lb ai/acre.Spray solution was applied at the rate of 18 gallons/acre. Staple (pyrithiobac sodium) was sprayed broadcast overthe entire study when the cotton had reached the three-and four-leaf stage. Select (clethodim) at 0.3 lb ai/acrewas broadcast over the entire study when the cotton wasnear first bloom. A lay-by herbicide mixture of Bladex(cyanazine) at 1.0 lb ai/acre and MSMA at 0.75 ai/acrewas directed under the cotton and in the middles at ap-proximately eight weeks after planting. Insect control wasaccording to standard recommended practices and thresh-olds.
Nitrogen fertilizer rates of 0, 30, 60, 90, 120 and 150lb/acre were evaluated to determine the optimum nitrogen
NITROGEN RATES AND COVER CROPS FOR NO-TILL COTTONIN THE MISSISSIPPI BROWN LOAM
J.R. Johnson and J.R. Saunders1
1Mississippi State University.
A

ARKANSAS AGRICULTURAL EXPERIMENT STATION SPECIAL REPORT 186
56
rates for each cover crop. Nitrogen was applied using atractor-mounted Gandy calibrated for each N rate. Ammo-nium nitrate (34% N) was the source of nitrogen. Nitro-gen was placed approximately 1 ft from the drill and 2 in.below the surface. All nitrogen was applied after emer-gence and before matchhead-sized squares were present.
Chlorophyll fluorescence measurements were made us-ing a Minolta Spad 502 hand-held fluorescent meter onthe leaves of 20 plants selected at random within eachplot and averaged across the plants for a single plot read-ing. Leaf readings were taken on the fifth expanded leafbelow the terminal of the plant. Chlorophyll fluorescencemeasurements were made at first bloom, two weeks afterfirst bloom and four weeks after first bloom.
Twenty petioles were collected from the same leaf fromwhich the chlorophyll fluorescence reading was taken, ofeach plant, of each plot, of each treatment and each repli-cate for evaluation of nitrate-N status using a Minoltahand-held nitrogen meter. Sampling of petioles was madeat first bloom and four weeks after first bloom. Petioleswere collected from the fifth fully expanded leaf on themain stem below the plant terminal. Petioles were frozenimmediately after collection. Analysis was conducted inan air-conditioned laboratory 24 hours after collection. Itwas hoped that this would eliminate a variation in the meterreading from exposure to sunlight or temperature varia-tion. Petioles were processed by thawing them under aninfrared light for 5 min before the stems were cut intolengths of approximately 1 in. Petiole sap was extractedby placing the cut petiole stems into a garlic press andsqueezing out the petiole sap. Approximately 1 ml of sapwas squeezed into a test tube from a composite of the 20petioles of each plot. Two or three drops of sap of eachtest tube were placed on the calibrated meters. Meter cali-bration was checked by running a standard at the start ofeach test period and after every 20 samples.
A defoliant was sprayed over the crop when more than75% of the bolls were open. Yields were determined byharvesting the two center rows of each eight-row plot.Yields are reported in pounds of seedcotton per acre.
RESULTS AND DISCUSSION
Cotton stands were excellent for both years in all plots.Rainfall was above average in early season of both years.However, the plants suffered severe drought in mid andlate season of 1996. Heat units in DD 60’s were nearnormal for northern Mississippi in both years. In 1997,the DD 60’s accumulation was extremely slow during thefirst of the growing season but gained momentum as theseason progressed to end with normal DD 60’s.
Chlorophyll fluorescence measurements and petiole ni-trate-N sap analyses for 1996 are not reported since thetechniques that were used varied in accumulating averagesfor fluorescense and extracting sap from petioles. It was
not until the 1997 growing season that a uniform processof collecting, processing and analyzing the petiole sap andchlorophyll fluorescence was worked out.
Chlorophyll fluorescence measurements made in thisstudy in 1997 were not very sensitive to levels of fertil-izer nitrogen above 30 lb/acre at the second and fourthweek of bloom (Table 1). This was in agreement withstudies by Radin et al. (1985) conducted in Arizona onirrigated cotton where leaf conductance was not affectedby nitrogen level except in severe N deficits. Only the 90-lb level fluorescence at the first week of bloom had alower reading than any level above 30 lb, and no logicalexplanation exists for this low reading. Chlorophyll fluo-rescence tended to be higher at two weeks and four weeksafter bloom for all N levels than at the onset of fruiting.Chlorophyll measurements for cover crops were non-sig-nificant at each blooming period (Table 2).
Average petiole nitrate-N sap measurements were sig-nificantly lower at first and fourth week of bloom for the0 N level across all cover crops (Table 3). At first weekof bloom, the petiole sap measurement was higher for the90-lb level than any of the other levels above 30 lb con-trasted to fluorescence measurements where the 90-lblevel was lower than other levels above 30 lb. Fourth weekof bloom, petiole nitrate-N sap levels were non-signifi-cant for the N levels of 30 to 150 lb/acre. Petiole sapmeasurements dropped 53%, 18%, 20%, 31%, 18% and18% between the first week of bloom and the fourth weekof bloom for the 0-, 30-, 60-, 90-, 120- and 150-lb/acrelevel, respectively. Petiole sap measurements for the wheatand vetch were higher than the native cover crop at firstweek and fourth week of bloom (Table 4). Petiole sapmeasurements dropped 12%, 16% and 20% between thefirst and fourth week of bloom for the wheat, native andvetch cover crops, respectively.
The 1996 yield data were extremely hard to interpretbecause no pattern was established for nitrogen rates (Table5). Yields followed the same pattern as the first, secondand fourth week of bloom in fluorescence readings in1997; no difference was noted between cover crop yields.Soil samples were taken after the growing season, andanalysis, incomplete at this time, should reflect residualN levels. The 150-lb N/acre level was the only level thatyielded higher than the 0-lb N/acre level in 1997. Theresults presented here are disappointing when expecting ayield response from N levels between the 0 and 150 lb N/acre. Yet this is why the Brown Loam area was an impor-tant cotton growing region before commercial fertilizerand has always been an important growing region of Mis-sissippi. The area appears to have a natural fertility of Nfor cotton. Arnold et al. (unpublished data), working withcotton fertility and N levels for many years at the NorthMississippi Branch Station, were able to produce 200 lb

PROCEEDINGS 21ST ANNUAL SOUTHERN CONSERVATION TILLAGE CONFERENCE FOR SUSTAINABLE AGRICULTURE
57
lint/acre without the addition of N, P and K for 15 con-secutive years.
LITERATURE CITED
Brown, S.M., T. Whitwell, J.T. Touchton and C.H. Burmester. 1985.Conservation tillage systems for cotton production. Soil Sci. Soc.Am. J. 49:1256-1280.
Radin, J.W., J.R. Mauney and G. Guinn. 1985. Effects of N fertilityon plant water relations and stomatal responses to water stressin irrigated cotton. Crop Sci. 25:110-114.
Stevens, W.E., J.R. Johnson, J.J. Varco and J. Parkman. 1993. Tillageand winter cover managements effects on fruiting and yield ofcotton. J. Prod. Agric. 5:570-575.
Table 1. Chlorophyll fluorescence reading for nitrogen ratesaveraged across cover crops taken with a hand-held Minolta
Spad 502 meter, 1997.
Blooming Period lb N/acre 1st week 2nd week 4th week
0 43.65 42.26 42.6930 48.81 49.32 52.0060 49.62 50.90 54.3390 44.94 49.74 52.70
120 45.98 48.71 54.35150 51.41 50.35 54.44
LSD (0.05) 1.58 1.85 1.67CV 3.7 4.2 3.6
Table 2. Chlorophyll fluorescence reading for cover cropsaveraged across nitrogen rates taken with a hand-held
Minolta Spad-502 meter, 1997.
Blooming PeriodCover Crop 1st week 2nd week 4th week
Wheat 47.95 48.79 52.42Native 47.64 49.34 51.48Vetch 46.60 47.50 51.35LSD (0.05) ns ns nsCV 4.1 4.1 5.1
Table 3. Petiole sap analysis of N rates averaged across covercrops using a Minolta hand-held nitrate-N meter
(data in ppm x 100), 1997.
Blooming PeriodN rates (lb N/acre) 1st week 4th week
0 55.00 25.7530 73.25 59.6760 77.33 61.8390 85.42 59.33
120 74.42 60.50150 74.00 60.59
LSD (0.05) 10.10 11.72CV 17.10 23.60
Table 4. Petiole sap analysis of cover crops averaged acrossnitrogen rates using a Minolta hand-held nitrate-N meter (data
in ppm x 100), 1997.
Blooming PeriodCover Crops 1st week 4th week
Wheat 71.33 62.50Native 57.33 48.13Vetch 66.33 53.21LSD (0.05) 5.45 5.65CV 11.60 14.70
Table 5. Seed cotton yields of wheat, native cover and vetchcover crops using 0, 30, 60, 90, 120, 150 lb nitrogen/acre,
1996 and 1997.
YearN rates ( lb N/acre) 1996 1997 Average
Wheat0 620 2822 1721
30 881 2500 169060 641 2824 173290 1069 3935 2502
120 708 3564 2163150 968 3390 2179
Native0 628 2860 1724
30 814 2697 175660 908 3934 242190 1215 3465 2340
120 767 3663 2215150 1301 3762 2531
Vetch0 795 2994 1894
30 1014 3118 189460 802 3120 196190 1088 2275 1681
120 924 2673 1798150 939 3560 2249
LSD (0.05) 158 304CV 16 15

ARKANSAS AGRICULTURAL EXPERIMENT STATION SPECIAL REPORT 186
58
INTRODUCTION
eep tillage with implements that have new de-signs continues to be of interest. This is espe-cially true with the increasing weights of farm
machinery and equipment that have sufficient weight toseverely compact soil. Soil compaction can limit waterinfiltration, water storage and/or root penetration of thesoil. Although many deep tillage experiments have beenconducted in the past, they were conducted in late winteror early spring when soil was wet and gave no yield in-creases. Recent work suggested that with clays, fall tillagewhen the soil was dry would give yield responses to soy-beans. Experiments were initiated to investigate the influ-ence of the new equipment designs on deep fall tillagewhen the soil was dry.
The continued loss of soil organic matter also is con-tributing to compaction of soil. This compaction can beshallow and in the form of crusts that retard emergenceand growth. An experiment was started in 1997 to assessthe importance of these shallow crusts on end-of-the-sea-son lint yield.
MATERIALS AND METHODS
Experiments were begun at the Northeast Research andExtension Center (NEREC), Keiser, Arkansas, on a Sharkeysilty clay in 1993 and at Delta Branch, Clarkedale, Arkan-sas, on Dubbs-Dundee silt loam in 1996. Tillage experi-ments consisted of eight treatments arranged in a random-ized complete block with eight replications at the twolocations. The treatments were 1) check, 2) subsoil in fallwith parabolic subsoiler in the seedling row, 3) subsoil infall with parabolic subsoiler at a 45 degree angle to seed-ling row, 4) subsoil in spring with parabolic subsoiler inthe seedling row, 5) subsoiling shallow in the fall withparabolic subsoiler in the seedling row, 6) para-till in fallwith seedling row, 7) DMI winged tip straight shank runjust beneath the plow pan in fall and 8) DMI winged tipstraight shank run with tip 12 to 14 in. deep in fall.
Crusting experiments were begun in 1997 at DeltaBranch on Dubbs-Dundee silt loam. The crusting durationwas simulated by placing a 10-ft board over the seedlingrow at cracking and removing it at 2, 3, 5, 7 and 10 dayslater.
RESULTS AND DISCUSSION
Results from the deep tillage experiments are shown inTable 1. Note that at NEREC there is a year effect. Theyear effect was due primarily to treatments giving differ-ent yield responses from one year to the next. Other deeptillage treatments were somewhat intermediate betweenthe check and the parabolic subsoiler in the fall. Of par-ticular interest was the lack of response of the imple-ments that did not disturb the soil surface significantly.Results from one year’s data at Delta Branch indicate thatdifferent implements than those used at NEREC resultedin higher yields. This indicates that farmers may want touse different deep tillage implements on different soiltypes.
Shallow crusts that delayed plant emergence for morethan two days reduced lint yields substantially (Fig. 1).Yield reductions of as much as 50% resulted from seed-lings being trapped in a crust at the cracking stage forabout four days. Seedings were observed to exhibit “bigshank,” broken hypocotyls and small cotylendary leaves.
Table 1. Lint yields at Northeast Research and ExtensionCenter (NEREC), Keiser, Arkansas, and Delta Branch,
Clarkedale, Arkansas.
Treatment NEREC Delta Year 95 96 97 97
------------------lb lint /acre-------------------1. Conventional 681a 555a 915a 830ab2. Parabolic in fall 709a 589a 747a 836ab3. Parabolic in fall 45 --- --- --- 827ab4. Parabolic in spring 733a 605a 848a 830ab5. Parabolic shallow in fall --- --- --- 788b6. Para-till in fall 700a 604a 816a 874a7. DMI winged tip 12 to 14" 709a 555a 749a 871a8. DMI winged tip just beneath plow pan in fall --- --- --- 809b
TILLAGE STUDIES ON COTTON
T.C. Keisling, E.C. Gordon, G.M. Palmer and A.D. Cox1
1First author is Prof. of Agron. and others are Res. Assoc. All are located atthe Univ. of Ark., Northeast Res. and Ext. Ctr., PO Box 48, Keiser, AR 72351.
D
Fig. 1. Effect of length of time crust is in placefrom beginning cracking.

PROCEEDINGS 21ST ANNUAL SOUTHERN CONSERVATION TILLAGE CONFERENCE FOR SUSTAINABLE AGRICULTURE
59
INTRODUCTION
he Arkansas Soybean Research Verification Pro-gram (SRVP) was established 14 years ago to im-prove soybean production and profitability in Ar-
kansas. In this program, the SRVP coordinator and countyExtension agent prescribe Extension recommendations ina very timely manner, resulting in more profitable com-mercial soybean production. Essential to the program isparticipation from the individual soybean producer, coop-eration from soybean researchers and Extension special-ists and continued funding from the Arkansas SoybeanCheckoff Program.
Research continues to indicate that no-till or reduced-tillage methods can produce yields comparable to thosewith conventional tillage and that certain inputs are oftenreduced (Mayhew et al., 1995). Therefore, 28 out of 102,or 27.5%, of the commercial soybean fields enrolled inthe SRVP from 1993 to 1997 were planted no-till (Ashlocket al., 1993 through 1997). Twelve different soybean pro-duction systems are utilized in the SRVP. These includeearly-season, full-season, doublecrop (soybean followingwheat) planting dates, with and without irrigation. Thesesix systems are further divided into conventional and no-till practices. The early-season and doublecrop systemshave the highest percentage of no-till entries. Agronomicand economic comparison of the doublecrop irrigated pro-duction system are presented since this system comprisesthe largest number of both no-till and conventional tillagefields (13 fields apiece) (Table 1).
MATERIALS AND METHODS
Twenty-six commercial soybean fields enrolled in SRVPwere planted in a doublecrop irrigated production systembetween 1993 and 1997. Thirteen of these fields wereplanted no-till with the other thirteen planted using con-ventional tillage practices. The field size, planting date,row spacing, number of cultivations and yield are listedfor these fields in Table 2.
Weed control was achieved with a variety of herbi-cides. Only one of the no-till planted fields received cul-
tivation for weed control with eight of the conventionalplanted fields receiving at least one cultivation (Table 2).
Yields on the SRVP fields were calculated from weightickets and field size where possible. In some fields weighwagons were used to determine yields. The yields reportedare based on 13% moisture.
All operations and inputs into a field were compiledfor economic evaluation. The budgets for each field weregenerated with the Mississippi State Budget Generator(MSBG) developed by Spurlock and Laughlin (1992). TheMSBG is a computer-based budgeting program that esti-mates costs and returns for specified crop or livestockenterprises (Windham and Brown, 1998). The programcontains data regarding the input quantities and prices aswell as output levels and prices. Operating costs (seed,fertilizer, chemicals, fuel, labor and repairs) and owner-ship costs (depreciation, interest, taxes and insurance) wereestimated for all SRVP fields on a per acre basis. Produc-tion costs for all the fields were recalculated using a con-stant set of equipment and input prices. This procedureeliminates many of the market influences that affect pro-duction costs but were unrelated to the production tech-nology being evaluated.
RESULTS AND DISCUSSION
No-till represents another viable management tool forsoybean producers in Arkansas to increase net returns fromsoybean. No-till practices have been used in a higher per-centage of fields planted in the early-season or doublecropproduction system. The average no-till doublecrop irri-gated soybean yield during the period from 1993 to 1997was 43.6 bu/acre. The conventionally tilled fields averag-ing 41.9 bu/acre (Table 2).
Comparisons between the no-till and conventionallytilled fields indicate that the no-till fields on average weresmaller in size, 54 verses 65 acres, respectively, while theplanting date for the no-till fields averaged four days ear-lier. The rows were also narrower in the no-till fieldscompared to the conventionally tilled fields, averaging 9.9in. verses 23.5 in., respectively. The more narrow rowspacing in the no-till fields undoubtedly was responsiblefor the fewer cultivations when compared to the conven-tionally tilled fields.
Table 3 indicates that the no-till SRVP fields had anaverage operating cost of $115.02/acre while the aver-aged operating costs for the conventionally tilled fields
NO-TILL PRODUCTION IN THE ARKANSASSOYBEAN RESEARCH VERIFICATION PROGRAM
R.A. Klerk, J.D. Beaty, L.O. Ashlock, C.D. Brown and T.E. Windham1
1First and third authors are with Agron. Sec., Coop. Ext. Ser., Univ. of Ark.,located at Little Rock, AR., second author is with Agron. Sec., Coop. Ext. Ser.,Univ. of Ark., located at Monticello, AR., and other authors are with Agric.Econ. Sec., Coop. Ext. Ser., Univ. of Ark., located at Little Rock, AR.
T

ARKANSAS AGRICULTURAL EXPERIMENT STATION SPECIAL REPORT 186
60
were $124.42/acre. No-till fields reflected a higher oper-ating cost in both seed and custom work, while conven-tionally tilled fields reflected higher operating costs forfertilizer, operating labor, irrigation labor and repair andmaintenance (Table 4). Similar costs between the two meth-ods were obtained with seed treatment, herbicide, dieseland interest. Herbicide costs were the highest operatingcost for both systems.
Additionally, Table 3 depicts that ownership costs weresimilar with no-till fields having a $50.17/acre chargeverses a $51.46/acre charge for conventionally tilled fields.The total costs (operating plus ownership) averaged$165.18/acre for the no-till fields and $175.88/acre forthe conventional fields.
A ten-year average soybean price of $6.29/bu was usedplus a 25% cropshare land rent for economic evaluation.Net returns for no-till were higher, with an average returnof $40.61/acre while net returns for conventional tillabove total costs and land rent averaged $21.78/acre.
In addition, no-till offers many advantages to manage-ment in soybean production. These include planting ear-lier than would have been possible with tillage and theability to save soil moisture at planting (especially benefi-cial in a doublecrop situation). This conservation of mois-ture will increase the chance of the crop obtaining a standand even producing acceptable height prior to the firstirrigation. A no-till cropping system also reduces soil lossfrom the field and protects the quality of area surfacewater.
CONCLUSIONS
The SRVP no-till fields were successful in loweringspecified operating and ownership cost without losing yieldpotential. Operating and ownership costs were lower inno-till SRVP fields than in tilled fields. Yields of the no-till fields were slightly higher than those of the conven-tionally tilled fields. A quicker turn around in plantingsoybeans after wheat was achieved when planting no-tillwhich can aid in establishing an adequate plant stand.
No-till also offers soybean producers an additionalmanagement tool. The use of no-till does allow quickerplanting and better use of soil moisture when moisture islimited. Preservation of top soil and surface water arealso gained from no-till soybean production.
LITERATURE CITED
Ashlock, L.O., R.A. Klerk, J.D. Beaty and T.E. Windham. 1997.Arkansas Soybean Research Verification Program. CooperativeExtension Serv., Univ. of Arkansas, Little Rock, Arkansas.
Ashlock, L.O., R.A. Klerk, W.L. Mayhew and T.E. Windham. 1996.Arkansas Soybean Research Verification Program. CooperativeExtension Serv., Univ. of Arkansas, Little Rock, Arkansas.
Ashlock, L.O., R.A. Klerk, W.L. Mayhew and T.E. Windham. 1995.Arkansas Soybean Research Verification Program. CooperativeExtension Serv., Univ. of Arkansas, Little Rock, Arkansas.
Ashlock, L.O., R.A. Klerk, W.L. Mayhew and T.E. Windham. 1994.Arkansas Soybean Research Verification Program. CooperativeExtension Serv., Univ. of Arkansas, Little Rock, Arkanss.
Ashlock, L.O., R A. Klerk, W.L. Mayhew and T.E. Windham. 1993.Arkansas Soybean Research Verification Program. CooperativeExtension Serv., Univ. of Arkansas, Little Rock, Arkansas.
Mayhew, W.L., R.A. Klerk, N.V. McKinney and T.E. Windham.1995. No-till production in the Soybean Research VerificationProgram. Conservation Technology in Arkansas Agriculture1993. Research Series 442:25-29.
Spurlock, S.R., and D.H. Laughlin. 1992. Mississippi State budgetgenerator user’s guide version 3.0. Agricultural EconomicsTechnical Publication No. 20 Mississippi Agr. and Forestry Exp.Sta., Mississippi State, Mississippi.
Windham, T.E., and C.D. Brown. 1998. Estimating 1998 ProductionCosts in Arkansas: Soybeans. Extension Technical Bulletins491- 498. Cooperative Extension Serv., Univ. of Arkansas, LittleRock, Arkansas.
Table 1. Number of Soybean Research Verification Programfields under different production systems with no-till and
conventional tillage practices. 1993-1997.
Dryland IrrigatedNo-Till Conventional No-Till Conventional
Early Season 3 1 1 0Full Season 1 15 3 43Double-crop 7 2 13 13
Table 2 is on the following page.
Table 3. Number of doublecrop irrigated Soybean ResearchVerification Program fields from 1993 to 1997 with average
yield, operating cost, ownership, total cost, net return and netreturn with 25% land rent charge.
Item No-Till Conventionally Tilled
Number of Fields 13 13Yield (bu/acre) 43.6 41.9Operating Cost ($/acre) $115.02 $124.42Ownership Cost ($/acre) $ 50.17 $ 51.46Total Cost ($/acre) $165.18 $175.88Net Return ($/acre) $109.21 $ 87.67Net Return +25%Land Rent Charge ($/acre) $ 40.61 $ 21.78
Table 4. Inputs of operating cost for doublecrop irrigatedSoybean Research Verification Program fields from 1993-1997.
Item No-Till Conventionally Tilled
---------------$/acre-------------Seed $16.40 $14.48Custom Work $17.14 $13.72Fertilizer $ 8.69 $11.53Seed Treatment $ 1.33 $ 1.23Herbicide $34.21 $31.91Operating Labor $ 4.15 $ 7.33Irrigation Labor $ 4.24 $ 5.56Diesel $12.17 $13.33Repair and Maintenance $12.95 $16.27Interest $ 3.11 $ 3.58Total $114.39 $118.94

PROCEEDINGS 21ST ANNUAL SOUTHERN CONSERVATION TILLAGE CONFERENCE FOR SUSTAINABLE AGRICULTURE
61
Table 2. County, field size, planting date, row spacing, number of cultivations and yields of SRVP fields in doublecrop irrigat edproduction systems. 1993-1997.
No-TillCounty (Year) Field Size Plant Date Row Space Number of Cultiv. Yield
acre in. bu/acreJefferson (93) 90 6-21 19 1 39.5Lonoke (93) 50 6-14 19 0 36.6Prairie (93) 60 6-14 7.5 0 54.6Jackson (94) 35 6-18 13 0 46.0Jackson (95) 35 6-24 8 0 41.5Lonoke (95) 40 6-12 7.5 0 49.1Pulaski (95) 31 6-8 7 0 37.6Lonoke (96) 50 6-17 7.5 0 42.0Poinsett (96) 56 6-24 7.5 0 32.1Pope (96) 37 6-15 7.5 0 54.0Pulaski (96) 50 6-14 7.5 0 35.1Craighead (97) 38 6-25 10 0 46.5Lee (97) 125 6-23 7.5 0 52.8Average 54 6-18 9.9 0.1 43.6
Conventional TillageCounty (Year) Field Size Plant Date Row Space Number of Cultiv. Yield
acre in. bu/acreArkansas (93) 49 6-30 14 0 41.5Lincoln (93) 30 6-22 15 2 23.3Poinsett (93) 135 6-21 30 1 35.2Randolph (93) 55 6-22 30 2 52.8Arkansas (94) 53 6-17 30 3 39.3Jefferson (94) 45 6-19 19 0 35.2Lincoln (94) 30 6-27 30 1 36.7Prairie (94) 109 6-25 30 2 52.4Lincoln (95) 40 6-13 38 3 42.4St. Francis (95) 130 6-19 7 0 45.8Cross (96) 53 6-24 15 0 43.2Independence (96) 34 6-18 15 0 51.6Arkansas (97) 80 6-24 32 2 45.4Average 65 6-22 23.5 1.2 41.0

ARKANSAS AGRICULTURAL EXPERIMENT STATION SPECIAL REPORT 186
62
INTRODUCTION
inter cover crops have become very popular,not only for erosion control, but also for soilnitrogen (N) contributed by leguminous covers.
Research has indicated that cover crop growth should beterminated about three weeks prior to planting (Torrey,1992), minimizing soil insect problems and also enhanc-ing soil moisture status for the following crop. Addition-ally, winter cover crops may increase soil organic matter.This is very important for soils of northeastern Louisiana,particularly loessial soils of the Macon Ridge area andalluvial soils of the Mississippi River. Organic matter inthese soils is extremely low due to intensive croppingover the years.
Optimal planting dates for corn in northern Louisianarange from mid-March to early April (Mascagni andBoquet, 1996). Thus, the ideal time for cover crop termi-nation would be mid-February to mid-March. Biomass pro-duced between planting and termination determines a covercrop’s effectiveness. The more dry matter produced, thegreater the benefits from soil erosion control, improvedsoil properties and N contribution from leguminous-typecover crops. The objective of this study was to determinethe influence of cover crop planting date and terminationdate (harvest date) on dry weight for several winter covercrops that may be used in a corn production system.
MATERIALS AND METHODS
Field experiments were conducted in 1995/1996 and1996/1997 on a Sharkey clay (very-fine, montmorillo-nitic, nonacid, thermic Vertic Haplaquepts) at the North-east Research Station near St. Joseph, Louisiana, and on aGigger silt loam (fine-silty, mixed, thermic TypicFragiudalf) at the Macon Ridge Research Station atWinnsboro, Louisiana, to evaluate the influence of plant-ing date and termination date (harvest date) on dry weightand N content of several winter cover crops that may beused in a corn production system. Cover crops evaluatedwere crimson clover (‘Robin’ and ‘Dixie’) (Trifoliumincarnatum L.), berseem clover (‘Bigbee’) (Trifoliumalexandrinum L.), Austrian winter pea (Dolichos lignosusL.), winter wheat (‘Buckshot 2368’) (Triticum aestivumL.) and native vegetation (only in 1997). Cover crop plant-
ing dates at St. Joseph were 18 October and 15 Novemberin 1995 and 7 October, 4 November and 11 December in1996. Planting dates at Winnsboro were 20 October and15 November in 1995 and 3 0ctober, 1 November and 21November in 1996.
Experimental design was a randomized complete blockwith four replications. Cover crop treatments were har-vested 4 March and 1 April at both locations in 1996 and18 March and 9 April at St. Joseph and 18 March and 10April at Winnsboro in 1997. Total above-ground plant mat-ter was collected from separate areas within each plot foreach harvest date. Sampling area was 1 m2 for each harvestdate. Plant tissue was dried at 70 C, ground, and analyzedfor total N. Analyses of variance of dry weight data wereconducted using GLM procedures of SAS. The LSD (P <0.05) was calculated for mean separation.
RESULTS AND DISCUSSION
St. JosephEach year, only the October planting date survived the
winter with adequate stands on the Sharkey clay soil. In1996, cover crop dry weight for the 4 March harvest dateranged from 537 lb/acre for Dixie crimson clover to 2497lb/acre for Austrian winter peas (Table 1). Total N in har-vested plant parts ranged from 15 lb N/acre for Dixiecrimson clover to 118 lb N/acre for Austrian winter peas.Dry weight increased for each cover crop, except winterwheat, as planting date was delayed.
There were fewer differences for dry weight amongcover crops in 1997. Dry weight ranged from 641 lb/acrefor native vegetation to 2227 lb/acre for Austrian winterpeas (Table 2). Dixie crimson clover, berseem clover, Aus-trian winter peas and winter wheat had similar dry weights.Dry weight at the 10 April harvest date increased for eachcover crop, except Austrian winter peas.
WinnsboroIn 1996, only the 20 October planting date survived the
winter with an adequate stand. Dry weight for the 4 Marchharvest date ranged from 854 lb/acre for berseem cloverto 1818 lb/acre for Austrian winter peas (Table 3). TotalN in harvested plant parts ranged from 30 lb N/acre forwinter wheat to 67 lb N/acre for Austrian winter pea. Dryweight at the second harvest date increased for each covercrop, except for winter wheat.
INFLUENCE OF PLANTING DATE AND HARVEST DATE ON COVER CROPPERFORMANCE IN A CORN PRODUCTION SYSTEM
H.J. Mascagni, Jr. and D.R. Burns1
1Louisiana State University Agricultural Center, Northeast Louisiana Station,St. Joseph, LA.
W

PROCEEDINGS 21ST ANNUAL SOUTHERN CONSERVATION TILLAGE CONFERENCE FOR SUSTAINABLE AGRICULTURE
63
The 3 October and 1 November planting dates in 1997had adequate stands; however, the 21 November plantingdate did not survive the winter in 1997. Highest covercrop dry weight occurred at the 3 October planting date(Table 4). Both crimson clovers, Austrian winter peas andwinter wheat had similar dry weights for each plantingdate. Each crimson clover doubled in dry weight as har-vest date was delayed, probably accounting for the signifi-cant cover crop x harvest date interaction.
SUMMARY
In summary, cover crops should be planted in northLouisiana no later than October, particularly on the poorlydrained clay soils, for maximum biomass production. Onthe clay soil at St. Joseph, Austrian winter peas had the
most consistent performance for biomass production.Crimson clover, Austrian winter peas and winter wheathad the highest dry weight on the loessial silt loam of theMacon Ridge. Austrian winter peas had the highest N con-tent of the four legume cover crops evaluated. Total N inharvested plant parts indicates that Austrain winter peas >crimson clover > berseem clover > wheat in providing Nfor subsequent crops.
LITERATURE CITED
Mascagni, H.J., Jr., and D.R. Boquet. 1996. Starter fertilizer andplanting date effects on corn rotated with cotton. Agron. J.88:975-982.
Torrey, K.D. 1992. Influence of conservation tillage and winter covercrops on cutworm management strategies in corn. M.S. thesis,Louisiana Tech University, Ruston.
Table 1. Influence of two harvest dates on dry weight, nitrogen (N) content and N in harvested plant parts of five cover crops(planted 18 October 1995) on Sharkey clay at St. Joseph, Louisiana in 1996.
March 4 April 1Cover Crop Dry wt. N N content Dry wt. N N content
lb/acre % lb N/acre lb/acre % lb N/acreCrimson Clover (‘Robin’) 544 3.43 18.8 2331 2.19 50.0Crimson Clover (‘Dixie’) 537 2.49 14.7 1771 2.52 47.3Berseem Clover 806 4.17 33.6 2181 3.20 69.5Austrian Winter Peas 2497 4.68 117.9 3300 2.79 89.4Wheat 1305 1.78 23.2 1232 1.34 16.4LSD (0.05) 229 0.74 21.4 1108 0.69 25.7
Table 2. Influence of two harvest dates on dry weight of sixcover crops (planted 7 October 1996)
on Sharkey clay at St. Joseph, Louisiana in 1997.
Cover Crop March 18 April 10
---dry weight, lb/acre---Crimson Clover (‘Robin’) 1434 4393Crimson Clover (‘Dixie’) 1850 3901Berseem Clover 2226 4140Austrian Winter Peas 2227 2202Wheat 2004 2509Native Vegetation 641 1534LSD (0.05) 521 1106
Table 3. Influence of two harvest dates on dry weight, nitrogen (N) concentration, and N in harvested plant parts of five covercrops (planted 20 October 1995) on Gigger silt loam at Winnsboro, Louisiana, in 1996.
4 March 1 AprilCover Crop Dry wt. N N content Dry wt. N N content
lb/acre % lb N/acre lb/acre % lb N/acreCrimson Clover (‘Robin’) 1596 3.71 59.0 2199 3.50 77.5Crimson Clover (‘Dixie’) 1489 3.44 51.2 2619 3.67 95.7Berseem Clover 854 2.98 25.7 1284 3.32 42.2Austrian Winter Peas 1816 3.75 66.8 2444 3.59 87.7Wheat 1382 2.19 30.2 1215 2.29 26.9LSD (0.05) 307 0.68 10.2 562 0.79 18.7

ARKANSAS AGRICULTURAL EXPERIMENT STATION SPECIAL REPORT 186
64
Table 4. Influence of two planting dates and harvest dates ondry weight of six cover crops (planted 1996) on Gigger silt
loam at Winnsboro, Louisiana, in 1997.
Harvest DateCover Crop 18 March 10 April Average
----------dry weight, lb/acre----------Planting Date - October 3Crimson Clover (‘Robin’) 3004 6608 4806Crimson Clover (‘Dixie’) 2819 7885 5352Berseem Clover 1640 3071 2356Austrian Winter Peas 2771 4382 3577Wheat 2841 3585 3213Native Vegetation 734 961 848Average 2302 4415 3359
Planting Date - November 1Crimson Clover (‘Robin’) 1861 6474 4168Crimson Clover (‘Dixie’) 2118 3605 2862Berseem Clover 861 3231 2046Austrian Winter Peas 1818 3439 2629Wheat 1914 2155 2035Native Vegetation 296 1489 893Average 1478 3399 2439
Planting Date - AverageCrimson Clover (‘Robin’) 2433 6541 4487Crimson Clover (‘Dixie’) 2469 5745 4107Berseem Clover 1251 3151 2201Austrian Winter Peas 2295 3911 3103Wheat 2378 2870 2624Native Vegetation 515 1225 870
LSD (0.05):Planting Date (PD) 492Cover Crop (CC) 852Harvest Date (HD) 492CC X HD 1206

PROCEEDINGS 21ST ANNUAL SOUTHERN CONSERVATION TILLAGE CONFERENCE FOR SUSTAINABLE AGRICULTURE
65
INTRODUCTION
onservation-tillage cotton production is becomingmore common in Arkansas and throughout the Cot-ton Belt because of increased production efficiency
and for soil conservation under federal compliance guide-lines. The term “conservation tillage” encompasses sev-eral practices of reduced tillage, including stale seedbed,minimum or reduced tillage, ridge tillage, strip tillage,mulch tillage and no-till. Several of these terms are brieflydescribed as methods of residue management in a reviewarticle by Locke and Bryson (1997). In most of thesesystems, however, no tillage is performed for several weeksor months before planting (Locke and Bryson, 1997;Hydrick and Shaw, 1995; Webster and Shaw, 1997). Weedcontrol at planting, therefore, is a major concern(McWhorter and Jordan, 1985; Worsham and Lewis,1985). Cotton is a poor competitor early in the season,and it is important that vegetation be controlled during theseedling stage of growth.
Postemergence herbicides, such as Roundup, that canbe used over-the-top of transgenic cotton cultivars andcontrol a wide spectrum of winter and early-spring annualweeds are becoming an option for producers who chooseto use this emerging technology. However, heavy infesta-tions of green vegetation can interfere with planting, inwhich case it is advisable to achieve weed-free conditionsprior to cotton emergence to successfully produce a con-servation-tillage cotton crop.
The burndown herbicides Gramoxone Extra and Roundupare currently the foundation of most burndown programsin conservation-tillage cotton. However, these herbicidesoften do not control all emerged weeds, and neitherRoundup nor Gramoxone Extra provides residual weed con-trol to suppress new weed emergence (Baughman et al.,1995; Frans et al., 1994; Guy, 1995a; Reynolds et al.,1994).
Some winter weeds, such as horseweed [Conyzacanadensis (L.) Cronq.], Pennsylvania smartweed(Polygonum pensylvanicum L.), cutleaf eveningprimroseand Italian ryegrass (Lolium multiflorum Lam.), may per-sist into the cotton growing season and are difficult tocontrol with a single, burndown herbicide (Fairbanks etal., 1995; Guy, 1995a; Guy and Ashcraft, 1995). Roundup
has been good for controlling small horseweed, but con-trol of cutleaf eveningprimrose has been erratic (Guy andAshcraft, 1995). Tank-mixing a residual herbicide withRoundup or Gramoxone Extra can increase control of manyweeds over control with either of the herbicides alone(Baughman et al., 1995; Frans et al., 1994), although an-tagonism of these mixtures on some weeds has been re-ported (Hydrick and Shaw, 1995; Webster and Shaw, 1997).Residual herbicides can also extend control into the earlyseason. If weeds are not controlled prior to or soon aftercotton emergence, they have the potential to interfere withcrop production and decrease cotton yields. The objectiveof these experiments was to evaluate several herbicidecombinations for preplant weed control in reduced-tillagecotton.
MATERIALS AND METHODS
Field experiments were conducted in 1994 through1996 at the Cotton Branch Experiment Station, Marianna,Arkansas, on a Calloway silt loam to evaluate activity ofburndown herbicides on natural winter weed infestations.Plot areas were fallow the year prior to establishment ofeach experiment and were not disturbed by tillage beforespraying preplant treatments. Plot size was 6 by 25 ft, andeach treatment was replicated four times.
Herbicides were applied 18 March 1994, 21 March1995 and 17 March 1996, with a backpack sprayer in 20gal/acre at 20 to 40 psi. All herbicide rates are expressedas lb of active ingredient per acre (lb ai/acre). Non-ionicsurfactant (Induce) at 0.5% by volume was added to eachtreatment.
Average weed sizes and densities of prevalent weeds atthe time of planting are presented in Table 1. Because ofthe different growth habits of winter weeds, size informa-tion is very general. Weeds were rated visually by speciesfor percent control (0 = no control and 100 = death orabsence of plants) compared to an untreated check plot. Arating of “total burndown,” which was percentage controlof total vegetation in the plots, was also evaluated. Mis-cellaneous species, including pineappleweed, shepherds–purse, sibara, white clover, wild garlic, henbit, annual blue-grass, horseweed, common chickweed, mouseear chick-weed, paleseed plantain and various grass (Graminaea)species, present at low infestations or controlled with alltreatments or rated individually only one year, are reportedas part of the total burndown. At 6 weeks after treatment
PREPLANT HERBICIDES FOR WEED CONTROL IN CONSERVATION-TILLAGECOTTON (GOSSYPIUM HIRSUTUM L.)
Marilyn R. McClelland, M. Cade Smith and Preston C. Carter1
1Research Associate and former Research Specialists, Agronomy Department,University of Arkansas, Fayetteville, AR 72701.
C

ARKANSAS AGRICULTURAL EXPERIMENT STATION SPECIAL REPORT 186
66
(WAT), summer annual weeds such as morningglory, pig-weed and goosegrass were emerging, but little biomasshad accumulated. Gramoxone Extra was applied at cottonplanting to control emerging weeds, so these species wererated only as part of the total burndown rating. Plots wererated 2 and 4 WAT in 1994 and 2, 4 and 6 WAT in 1995and 1996. Because the 2 WAT rating of cutleafeveningprimrose is representative of total control at thattime, only 4 and 6 WAT ratings are presented for totalcontrol.
Four rows of cotton ‘DPL 51’ were planted across allplots 20 May 1994, 17 May 1995 and 9 May 1996 toevaluate cotton tolerance to the preplant burndown herbi-cide treatments. Gramoxone Extra was applied over theentire area at planting to control emerged summer annualweeds and vegetation not controlled by the burndown treat-ments. Cotton was rated visually for percent injury ap-proximately three weeks after planting. Data were ana-lyzed by analysis of variance, and means were separatedby protected LSD at the 0.05 level of significance.
RESULTS AND DISCUSSION
Because cutleaf eveningprimrose was the predominantspecies each year, discussion will center around its con-trol and total burndown. Tank mixtures containing Roundupand Gramoxone Extra generally controlled winter weedspecies such as chickweed species, shepherdspurse, henbitand annual bluegrass (data not shown). Control of thesespecies was usually less with Roundup or Gramoxone Ex-tra alone than with a tank mixture containing a residualherbicide.
Cutleaf Eveningprimrose ControlA heavy, uniform population of cutleaf eveningprimrose
was present at Marianna all years (Table 1). Activity ofGramoxone Extra on cutleaf eveningprimrose was fasterthan activity of Roundup (Table 2). At the 2 WAT rating,control with Roundup was 10% to 38% compared with61% to 100% control with Gramoxone Extra. However,control with Roundup had increased by 4 WAT.
In 1994 at 4 WAT, all tank mixtures with Roundupcontrolled primrose better than Roundup alone. Of theGramoxone Extra mixtures, those that equalled control ofRoundup mixtures were Staple, Bladex, Karmex, Caparoland Lorox. These Gramoxone Extra treatments also gavefair to good primrose control (75 to 88%) at 4 WAT in1995. By 6 WAT in 1995, treatments that controlled prim-rose better than Roundup alone (75%) were Banvel, 2,4-D, Staple, Karmex plus Roundup, 2,4-D plus GramoxoneExtra and the three-way mixtures (2,4-D plus GramoxoneExtra plus Bladex, Karmex or Caparol). The large decreasein cutleaf eveningprimrose control at 6 WAT withGramoxone Extra alone and in some mixtures was theresult of regrowth from plants that were not completely
controlled with this contact herbicide. Activity of Roundupwas much slower than that of Gramoxone Extra, but be-cause Roundup is readily translocated, regrowth was less.
In 1996, primrose control tended to be better withGramoxone Extra than with Roundup treatments (Table 2).The only tank-mix herbicides that added to Roundup activ-ity by 4 WAT in 1996 were Bladex, Karmex and Goal. By6 WAT, control with Goal had declined dramatically, butcontrol with 2,4-D and Caparol had increased to 85 and73%, respectively. Although antagonism has been reportedfor several herbicides in tank mixture with Roundup(Webster and Shaw, 1997), that is probably not the expla-nation for low control in 1996 since control with Roundupalone was extremely low. Climatological conditions, in-cluding frost after treatment in 1996, probably resulted inactivity differences among years.
Roundup or Gramoxone Extra plus 2,4-D gave at least85% control of cutleaf eveningprimrose at 6 WAT (2,4-Dwas not mixed with Gramoxone Extra in 1994). Activityof 2,4-D plus Roundup appeared to be slower in 1996than in 1994 and 1995. Control of primrose with 2,4-Dplus Gramoxone Extra was not significantly enhanced bythe addition of Bladex, Karmex or Caparol, although therewas a numerical trend for higher control with the three-way mixture in 1996. Guy (1995b) also reported that 2,4-D, either alone or mixed with Roundup, controlled cutleafeveningprimrose. There is, however, a question of safetyto the cotton crop with 2,4-D. 2,4-D can injure cottonsignificantly if applied 2 weeks or less before cotton plant-ing, but cotton was tolerant to applications made 4 weeksor more before planting (Guy 1995b).
Fairbanks et al. (1995) reported that 0.012 or 0.024 lb/acre of the package mixture of Harmony Extra withGramoxone Extra increased control of cutleaf evening-primrose over that of Gramoxone Extra alone, but controlwith Roundup was not enhanced. In our study, however,control with Gramoxone Extra was not enhanced by theaddition of Harmony Extra except for a slight increase incontrol at 4 WAT in 1996 (Table 2). Control fromRoundup, however, was increased from 78% when appliedalone to 99% with the addition of Harmony Extra in 1994and from 25 to 60% in 1996. In 1995, the addition ofHarmony Extra did not significantly increase primrose con-trol over that with Roundup alone.
Goal, Reflex, Cobra and Blazer (diphenylether herbi-cides) increased Roundup control of cutleaf eveningprim-rose to at least 95% in 1994 and 82% in 1995 at 4 WAT(Table 2). In 1995, however, primrose control with theRoundup plus diphenylether treatments was generally poorby 6 WAT. In general, these herbicides did not increasecontrol with Gramoxone Extra.

PROCEEDINGS 21ST ANNUAL SOUTHERN CONSERVATION TILLAGE CONFERENCE FOR SUSTAINABLE AGRICULTURE
67
Total BurndownAs with cutleaf eveningprimrose control, total burndown
ratings were generally better with Gramoxone Extra thanwith Roundup at 2 WAT (data not shown), primarily be-cause of rapid activity of Gramoxone Extra. In 1994, tank-mix herbicides that enhanced total control over that withRoundup alone were Banvel, Harmony Extra, Bladex,Karmex, Caparol, Reflex, Cobra and Blazer. Total controlwith Roundup mixtures tended to be lower than control ofcutleaf eveningprimrose, perhaps because wild garlic con-trol with most Roundup treatments was low at 4 WAT (10to 65%). Total control with Gramoxone Extra treatmentsin 1994 ranged from 61 to 89%. Gramoxone Extra plusBladex gave higher control (89%) than Gramoxone Extraplus Karmex, Caparol and the diphenylethers.
Although total control with Roundup was enhancedslightly by diphenylether herbicides in 1994, there was noenhancement in 1995. Gramoxone Extra activity was notincreased with addition of those herbicides either year.However, other studies have shown improved control ofsome species with the addition of Goal to Roundup orGramoxone Extra (Baughman et al., 1995; McClelland etal., 1995). In 1995, herbicides that added to Roundup con-trol at 4 WAT were 2,4-D, Karmex and Cobra. GramoxoneExtra mixtures that performed well in 1995 wereGramoxone Extra with Banvel, 2,4-D, Bladex, Karmex andCaparol. Horseweed was present in the 1995 experiment.Although most Roundup mixtures controlled horseweed,only Bladex and Banvel aided in horseweed control withGramoxone Extra (data not shown). Gramoxone Extra plusBladex, however, does not always control horseweed, andRoundup is a better burndown choice than GramoxoneExtra for horseweed (Guy, 1995b). Horseweed was notpresent in 1994 or 1996.
Gramoxone Extra mixtures generally gave better totalweed control than Roundup mixtures in 1996. The pres-ence of wild garlic, which was controlled better withGramoxone Extra than with Roundup mixtures (data notshown), probably influenced total control, as did the poorercontrol of cutleaf eveningprimrose with Roundup that year.
Herbicides that gave greater than 70% total control for4 to 6 WAT in all three years of experiments were Bladexand Karmex plus either Roundup or Gramoxone Extra(Table 2). Other treatments that controlled most weedsconsistently included 2,4-D plus Roundup, Harmony Ex-tra plus Roundup, Caparol plus Gramoxone Extra andBanvel plus Gramoxone Extra or Roundup.
Total burndown control was greater than 90% with thethree-way mixtures of 2,4-D plus Gramoxone Extra plusBladex, Karmex or Caparol (Table 2). Total burndown con-trol was at least 91% at 6 WAT with the three-way mix-tures compared to 70 to 80% with 2,4-D plus GramoxoneExtra. Increased total control with the three-way mixtures
is probably due to control by the residual herbicides ofsummer annuals, especially grass species, that were emerg-ing by 6 WAT. However, Gramoxone Extra was alwaysapplied at cotton planting because all plots had at least afew emerging weeds.
Cotton ToleranceCotton was not significantly injured by any of the
burndown treatments at the 5% level of significance (datanot shown). Injury was generally higher in 1996 (4 to30%) than in 1994 and 1995 (0 to 5%), probably becauseof difficulty planting into a rougher seedbed in 1996. Guy(1995a) reported cotton injury only from 2,4-D, Banveland Harmony Extra if application was made within twoweeks of planting. The residual herbicides such as Bladex,Karmex, Lorox and Caparol could be used safely evenwhen applied within one week of planting. Generally, her-bicides can be used safely if applied at least four weeksbefore planting and if rainfall occurred after application,but before planting (Guy, 1995a).
In summary, there were a number of options for pre-plant weed control in no-till cotton. Bladex and Karmexwith Gramoxone Extra or Roundup gave the most consis-tent control for all three years of experiments. Banvel,2,4-D, Harmony Extra, Staple and Caparol were also gen-erally good tank-mix partners with Gramoxone Extra andRoundup for control of winter weeds, including cutleafeveningprimrose. Three-way mixtures of Gramoxone Ex-tra plus 2,4-D plus Bladex, Karmex or Caparol gave ex-cellent broad-spectrum control. Even with a residual her-bicide, all plots were sprayed with Gramoxone Extra atplanting to control regrowth of winter weeds and emerg-ing weeds that would otherwise interfere with emergingcotton.
ACKNOWLEDGMENTS
This study was supported by Cotton Incorporated, theFiber Company of American Cotton Producers, in coop-eration with the Arkansas State Support Committee. Theassistance of Bob Turner, Director of the Cotton BranchStation at Marianna, Arkansas, is appreciated.
LITERATURE CITED
Baughman, T.A., C.E. Snipes, D.R. Shaw and E.P. Webster. 1995.Growth stage response of winter weeds to herbicides appliedfallow-bed. In: M. McClelland, T. Valco and R. Frans (eds.).Conservation-tillage systems for cotton: A review of researchand demonstration results from across the cotton belt. Ark.Agric. Exp. Stn. Spec. Rep. 169:82-85.
Fairbanks, D.E., D.B. Reynolds, J.L. Griffin, P.R. Vidrine and D.L.Jordan. 1995. Preplant weed control with Gramoxone Extra andRoundup D-pak mixed with Harmony Extra. In: M. McClelland,T. Valco and R. Frans (eds.). Conservation-tillage systems forcotton: A review of research and demonstration results fromacross the cotton belt. Ark. Agric. Exp. Stn. Spec. Rep. 169:90-93.

ARKANSAS AGRICULTURAL EXPERIMENT STATION SPECIAL REPORT 186
68
Frans, R.E., M.R. McClelland and M.C. Smith. 1994. Weed controlsystems for conservation-tillage cotton. Proc. Belt. Cotton Conf.18(3):1696.
Guy, C.B. 1995a. Preplant weed management in Arkansas no-till andstale-seedbed cotton. In: M. McClelland, T. Valco and R. Frans(eds.). Conservation-tillage systems for cotton: A review ofresearch and demonstration results from across the cotton belt.Ark. Agric. Exp. Stn. Spec. Rep. 169:86-89.
Guy, C.B. 1995b. What you should know about preplant weed controlfor no-till and stalebed cotton. Mid-South Farmer. Jan.:8-9.
Guy, C.B., and R.W. Ashcraft. 1995. Preplant weed control in no-tilland stalebed cotton. Proc. South. Weed Sci. Soc. 48:76.
Hydrick D.E., and D.R. Shaw. 1995. Non-selective and selectiveherbicide combinations in staleseedbed (Glycine max). WeedTechnol. 9:158-165.
Locke, M.A., and C.T. Bryson. 1997. Herbicide-soil interactions inreduced tillage and plant residue management systems. WeedSci. 45:307-320.
McClelland, M.R., M.C. Smith and R.E. Frans. 1995. Weed controlin conservation-tillage cotton in Arkansas. In: M. McClelland, R.Frans and T. Keisling (eds.). Conservation technology inArkansas agriculture, 1993. Ark. Agric. Exp. Stn. Res. Ser.442:49-55.
McWhorter, C.G., and T.H. Jordan. 1985. Limited tillage in cottonproduction. Chpt. 6 In: A.G. Wiese (ed.). Weed control inlimited-tillage systems. Monograph Series No. 2 of Weed Sci.Soc. Am.
Reynolds, D.B., P.R. Vidrine, D.E. Fairbanks and J.L. Griffin. 1994.Preplant weed control with Harmony Extra mixtures. Proc. Belt.Cotton Conf. 18(3):1700.
Webster, E.P. and D.R. Shaw. 1997. Potential stale seedbed herbicidecombinations for cotton. MAFES Tech. Bull. 216.
Worsham, A.D. and W.M. Lewis. 1985. pp. 177-188 in: Weedmanagement: Key to no-tillage crop production. Proc. So. Reg.No-till Conf., Griffin, Georgia.
Table 1. Size and density of prevalent weeds in March at Marianna, Arkansas.
Year1994 1995 1996
Weed species Size Density Size Density Size Density
cm no/m2 cm no/m2 cm no/m2
Cutleaf eveningprimrose 15 10-22 10 24 20 8Henbit 10 <10 15 16 15 50Mouseear chickweed 5 <10 4 12 3 20Annual bluegrass 7 15 4 48 3 70Common chickweed -- -- 4 24 4 60
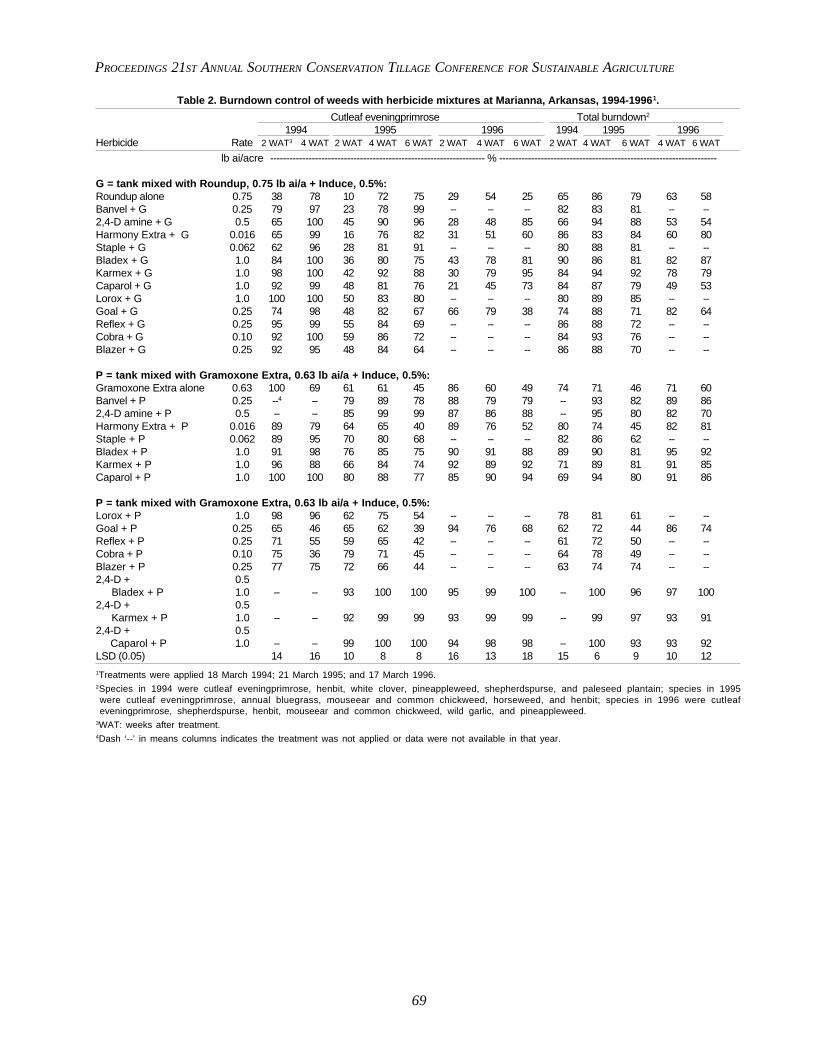
PROCEEDINGS 21ST ANNUAL SOUTHERN CONSERVATION TILLAGE CONFERENCE FOR SUSTAINABLE AGRICULTURE
69
Table 2. Burndown control of weeds with herbicide mixtures at Marianna, Arkansas, 1994-1996 1.
Cutleaf eveningprimrose Total burndown2
1994 1995 1996 1994 1995 1996Herbicide Rate 2 WAT3 4 WAT 2 WAT 4 WAT 6 WAT 2 WAT 4 WAT 6 WAT 2 WAT 4 WAT 6 WAT 4 WAT 6 WAT
lb ai/acre ------------------------------------------------------------------- % --------------------------------------------------------------------
G = tank mixed with Roundup, 0.75 lb ai/a + Induce, 0.5%:Roundup alone 0.75 38 78 10 72 75 29 54 25 65 86 79 63 58Banvel + G 0.25 79 97 23 78 99 -- -- -- 82 83 81 -- --2,4-D amine + G 0.5 65 100 45 90 96 28 48 85 66 94 88 53 54Harmony Extra + G 0.016 65 99 16 76 82 31 51 60 86 83 84 60 80Staple + G 0.062 62 96 28 81 91 -- -- -- 80 88 81 -- --Bladex + G 1.0 84 100 36 80 75 43 78 81 90 86 81 82 87Karmex + G 1.0 98 100 42 92 88 30 79 95 84 94 92 78 79Caparol + G 1.0 92 99 48 81 76 21 45 73 84 87 79 49 53Lorox + G 1.0 100 100 50 83 80 -- -- -- 80 89 85 -- --Goal + G 0.25 74 98 48 82 67 66 79 38 74 88 71 82 64Reflex + G 0.25 95 99 55 84 69 -- -- -- 86 88 72 -- --Cobra + G 0.10 92 100 59 86 72 -- -- -- 84 93 76 -- --Blazer + G 0.25 92 95 48 84 64 -- -- -- 86 88 70 -- --
P = tank mixed with Gramoxone Extra, 0.63 lb ai/a + Induce, 0.5%:Gramoxone Extra alone 0.63 100 69 61 61 45 86 60 49 74 71 46 71 60Banvel + P 0.25 --4 -- 79 89 78 88 79 79 -- 93 82 89 862,4-D amine + P 0.5 -- -- 85 99 99 87 86 88 -- 95 80 82 70Harmony Extra + P 0.016 89 79 64 65 40 89 76 52 80 74 45 82 81Staple + P 0.062 89 95 70 80 68 -- -- -- 82 86 62 -- --Bladex + P 1.0 91 98 76 85 75 90 91 88 89 90 81 95 92Karmex + P 1.0 96 88 66 84 74 92 89 92 71 89 81 91 85Caparol + P 1.0 100 100 80 88 77 85 90 94 69 94 80 91 86
P = tank mixed with Gramoxone Extra, 0.63 lb ai/a + Induce, 0.5%:Lorox + P 1.0 98 96 62 75 54 -- -- -- 78 81 61 -- --Goal + P 0.25 65 46 65 62 39 94 76 68 62 72 44 86 74Reflex + P 0.25 71 55 59 65 42 -- -- -- 61 72 50 -- --Cobra + P 0.10 75 36 79 71 45 -- -- -- 64 78 49 -- --Blazer + P 0.25 77 75 72 66 44 -- -- -- 63 74 74 -- --2,4-D + 0.5 Bladex + P 1.0 -- -- 93 100 100 95 99 100 -- 100 96 97 1002,4-D + 0.5 Karmex + P 1.0 -- -- 92 99 99 93 99 99 -- 99 97 93 912,4-D + 0.5 Caparol + P 1.0 -- -- 99 100 100 94 98 98 -- 100 93 93 92LSD (0.05) 14 16 10 8 8 16 13 18 15 6 9 10 121Treatments were applied 18 March 1994; 21 March 1995; and 17 March 1996.2Species in 1994 were cutleaf eveningprimrose, henbit, white clover, pineappleweed, shepherdspurse, and paleseed plantain; species in 1995were cutleaf eveningprimrose, annual bluegrass, mouseear and common chickweed, horseweed, and henbit; species in 1996 were cutleafeveningprimrose, shepherdspurse, henbit, mouseear and common chickweed, wild garlic, and pineappleweed.
3WAT: weeks after treatment.4Dash ‘--’ in means columns indicates the treatment was not applied or data were not available in that year.
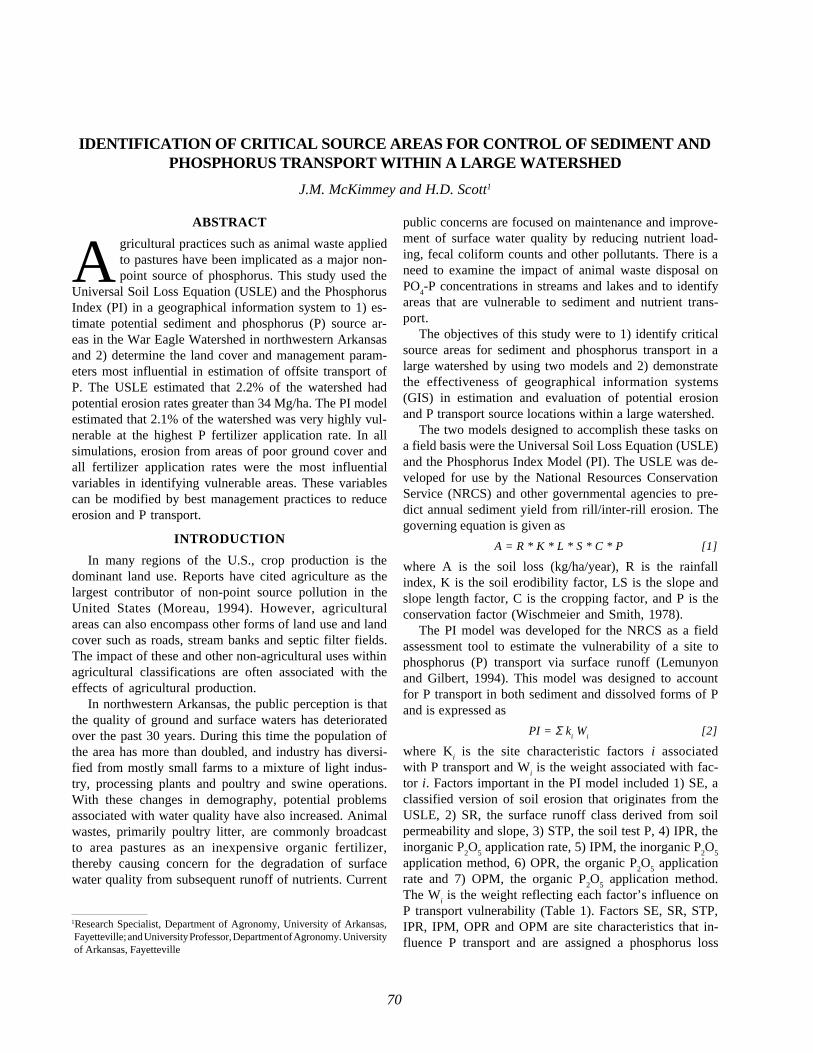
ARKANSAS AGRICULTURAL EXPERIMENT STATION SPECIAL REPORT 186
70
ABSTRACT
gricultural practices such as animal waste appliedto pastures have been implicated as a major non-point source of phosphorus. This study used the
Universal Soil Loss Equation (USLE) and the PhosphorusIndex (PI) in a geographical information system to 1) es-timate potential sediment and phosphorus (P) source ar-eas in the War Eagle Watershed in northwestern Arkansasand 2) determine the land cover and management param-eters most influential in estimation of offsite transport ofP. The USLE estimated that 2.2% of the watershed hadpotential erosion rates greater than 34 Mg/ha. The PI modelestimated that 2.1% of the watershed was very highly vul-nerable at the highest P fertilizer application rate. In allsimulations, erosion from areas of poor ground cover andall fertilizer application rates were the most influentialvariables in identifying vulnerable areas. These variablescan be modified by best management practices to reduceerosion and P transport.
INTRODUCTION
In many regions of the U.S., crop production is thedominant land use. Reports have cited agriculture as thelargest contributor of non-point source pollution in theUnited States (Moreau, 1994). However, agriculturalareas can also encompass other forms of land use and landcover such as roads, stream banks and septic filter fields.The impact of these and other non-agricultural uses withinagricultural classifications are often associated with theeffects of agricultural production.
In northwestern Arkansas, the public perception is thatthe quality of ground and surface waters has deterioratedover the past 30 years. During this time the population ofthe area has more than doubled, and industry has diversi-fied from mostly small farms to a mixture of light indus-try, processing plants and poultry and swine operations.With these changes in demography, potential problemsassociated with water quality have also increased. Animalwastes, primarily poultry litter, are commonly broadcastto area pastures as an inexpensive organic fertilizer,thereby causing concern for the degradation of surfacewater quality from subsequent runoff of nutrients. Current
public concerns are focused on maintenance and improve-ment of surface water quality by reducing nutrient load-ing, fecal coliform counts and other pollutants. There is aneed to examine the impact of animal waste disposal onPO
4-P concentrations in streams and lakes and to identify
areas that are vulnerable to sediment and nutrient trans-port.
The objectives of this study were to 1) identify criticalsource areas for sediment and phosphorus transport in alarge watershed by using two models and 2) demonstratethe effectiveness of geographical information systems(GIS) in estimation and evaluation of potential erosionand P transport source locations within a large watershed.
The two models designed to accomplish these tasks ona field basis were the Universal Soil Loss Equation (USLE)and the Phosphorus Index Model (PI). The USLE was de-veloped for use by the National Resources ConservationService (NRCS) and other governmental agencies to pre-dict annual sediment yield from rill/inter-rill erosion. Thegoverning equation is given as
A = R * K * L * S * C * P [1]
where A is the soil loss (kg/ha/year), R is the rainfallindex, K is the soil erodibility factor, LS is the slope andslope length factor, C is the cropping factor, and P is theconservation factor (Wischmeier and Smith, 1978).
The PI model was developed for the NRCS as a fieldassessment tool to estimate the vulnerability of a site tophosphorus (P) transport via surface runoff (Lemunyonand Gilbert, 1994). This model was designed to accountfor P transport in both sediment and dissolved forms of Pand is expressed as
PI = Σ ki W
i[2]
where Ki is the site characteristic factors i associated
with P transport and Wi is the weight associated with fac-
tor i. Factors important in the PI model included 1) SE, aclassified version of soil erosion that originates from theUSLE, 2) SR, the surface runoff class derived from soilpermeability and slope, 3) STP, the soil test P, 4) IPR, theinorganic P
2O
5 application rate, 5) IPM, the inorganic P
2O
5
application method, 6) OPR, the organic P2O
5 application
rate and 7) OPM, the organic P2O
5 application method.
The Wi is the weight reflecting each factor’s influence on
P transport vulnerability (Table 1). Factors SE, SR, STP,IPR, IPM, OPR and OPM are site characteristics that in-fluence P transport and are assigned a phosphorus loss
1Research Specialist, Department of Agronomy, University of Arkansas,Fayetteville; and University Professor, Department of Agronomy. Universityof Arkansas, Fayetteville
IDENTIFICATION OF CRITICAL SOURCE AREAS FOR CONTROL OF SEDIMENT ANDPHOSPHORUS TRANSPORT WITHIN A LARGE WATERSHED
J.M. McKimmey and H.D. Scott1
A

PROCEEDINGS 21ST ANNUAL SOUTHERN CONSERVATION TILLAGE CONFERENCE FOR SUSTAINABLE AGRICULTURE
71
rating value (PLR) according to a site’s condition in thefield. Each PLR is multiplied by the associated weight,and the products are summed over all site characteristics,yielding a PI. Indices are classified according to qualita-tive descriptions of P vulnerability to transport. The fourdescriptions are low, medium, high and very high and cor-respond to PI indices of < 8, 8 to 14, 15 to 32 and > 32,respectively (Table 1).
Both models were intended to be used with data col-lected in the field. From these models, best managementpractices can be recommended for a particular field. Nei-ther of these models, however, attempts to quantify trans-port processes, nor do they suggest movement from asite. Rather, they report a relative potential for movement.
The fact that both the USLE and the PI are field-basedmodels suggests that assessment of sediment and P trans-port potential using these models on a watershed basis isinappropriate. However, the use of raster-based GIS al-lows such a task to be achieved by applying a grid over astudy area where actual ground area, as represented byeach cell (pixel), is determined by the user. Simple math-ematical operations such as the USLE and the PI are ex-ecuted by inputting different data themes (attributes) asequation parameters. Calculations and equation results aremade on a pixel-by-pixel basis until all of the pixels in thegrid have been examined and combined to produce a com-posite map of the study area. Thus, model calculations arepossible on a watershed basis using a raster-based GISbecause model calculations are performed on each indi-vidual pixel. Although the pixel can be set to any size,pixel size (resolution) is a function of several factors.One of these factors is the scale of the original data usedto compile the database. If the source data scale is largeenough, i.e., a large map of a small area, it is possible tohave a resolution equal to or often smaller than the actualfields within a study area.
METHODSStudy Location and Characteristics
The War Eagle Watershed (WEW) is the largest sub-basin in the Beaver Lake Watershed in northwestern Ar-kansas and consists of about 86,440 ha in Madison andCarroll Counties (Fig. 1). The War Eagle Watershed islocated between two physiographic regions, the BostonMountains and the Springfield Plateau, which are sepa-rated by the Boston Mountain Escarpment. Predominantagricultural practices in the watershed are poultry and cattleproduction, often run in conjunction on the same farm.Poultry litter is applied to area pastures as a fertilizer atvarying application rates ranging between 734 and 1,468kg/ha/year, with application frequencies between one andtwo times per year.
This study included the application of the USLE andthe PI models using GIS techniques and primary attributes
in a digital spatial database. The WEW database was devel-oped from various source materials and methods detailedby McKimmey (1994). Sources used to compile the spa-tial database included NRCS Order II soil surveys, DigitalElevation Models (DEM) generated by the U.S. Geologi-cal Survey and land use/land cover (LULC) generated bythe Tennessee Valley Authority from black and white aswell as color infrared aerial photography. All source datawere generated at a scale of 1:24,000. Raster data gener-ated from these sources were created with a 30-m resolu-tion. The GIS software used in the study was GeographicResource Analysis Support System (GRASS) (CERL,1992).
Elevations for the WEW range from 341 to 763 mabove sea level. Topography is mostly steep hill slopeswith narrow valleys and ridges. A majority of these slopesrange from 3 to 12 degrees. Geology and soils of theWEW reflect the physiographic regions with a greaterproportion of sandstone, shale bedrock and clayey soilsfound in the Boston Mountains. This region also had thehighest proportion of slow to moderately permeable soils.Dominant soil taxonomic units are the Nella-Steprock-Mountainburg complex and the Enders-Leesburg complex.Dominant soils in the Springfield Plateau are Nixa,Clarksville and Noark series. Nearly 57% of the water-shed is in forest with pastures composing slightly over38% and scrub brush and rangeland nearly 2%. The spatialdistribution of urban areas in the WEW was insignificant.
Model ImplementationsMost parameters of the USLE were simple classifica-
tions of primary attributes (McKimmey 1994). Briefly,the rainfall index was 616 Mg/ha/year and was obtainedfrom an isoerodent map (Wischmeier and Smith, 1978).Soil erodibility was created by classifying soil mappingunits to K factor values based upon county soil surveydata (USDA-SCS, 1984; USDA-SCS, 1986). Cover fac-tors were produced by classifying LULC according to theUSLE publication guidelines (USDA-SCS, 1983). Coverfactors of each LULC category were chosen based upongeneral characteristics observed within the watershed. In-frared aerial photography was used to determine vigor ofvegetative growth for each pasture in the watershed. Fromthese data unique C factors were assigned to each pasturecategory. Prevention factors were not used in this studydue to the minimal coverage of row crops in the water-shed.
The LS parameter in equation [1] is defined as the ratioof the estimated soil loss for a particular slope and slopelength to the soil loss from a standard slope of 9% and alength of 22.1 m. Slope length is the distance from whererunoff begins to where deposition begins at a decrease inslope or where runoff enters a well-defined channel(Wischmeier and Smith, 1978). We found that it was easierto use the original equation given as

ARKANSAS AGRICULTURAL EXPERIMENT STATION SPECIAL REPORT 186
72
LS = * (19.94 + sin2 θ + 1.39 sin θ + 0.02) [3]
where LS is slope and slope length factor, λ is a slopelength map, m is a slope correction coefficient map, and Tis a slope map in degrees from horizontal. Slope mapswere calculated from the DEMs within GRASS. Variablem was constructed by classifying a percent slope map ac-cording to criteria given by Wischmeier and Smith (1978).A map representing λ was generated on a cell basis byevaluating all eight surrounding cells for changes in slope,slope aspect, elevation and blocking factors such as roadsand streams (McKimmey, 1994). Values on the final λmap represented a cell’s position in a slope. The final LSfactor map was generated by inserting values from mapsλ, m and T into equation [3] for each cell in the watershed.
These procedures created raster maps for factors K,LS and C for the whole watershed. Annual soil loss wasdetermined by multiplying the single value for R and allthree maps together for each 30-m cell in the watershed.
The parameters for the PI model were obtained frommaps and experimental data. Soil erosion (SE) was a clas-sification of the USLE map based upon the P loss rating(PLR) in Table 1. Surface runoff class (SR) was a combi-nation of the slope and soil permeability. Areas with slightslopes and rapid soil permeability were classed as havingnegligible influence on P transport, and steep slopes andlow soil permeability were most influential in P transport.This map was created by combining a soil permeabilitymap, classified from the soil mapping unit map, with thepercent slope map according to the previous logic. Soiltest P (STP) data were derived from field data collectedby county extension and NRCS offices. Since exact loca-tions of the soil samplings were not available, median STPvalues were taken as representative of the soil mappingunit from which they were taken. These STP values wereclassified into PLR values of low, medium, high or exces-sive (Table 1). The STP map was created by classifyingsoil maps according to these PLR values. Areal distribu-tion of each parameter is given in Table 2.
The PI model was run within GRASS using the com-piled spatial database. The PI model calculations were re-stricted to pastures, scrub brush and poultry operations,which are potential locations that could receive poultrylitter. The PI model was initially calculated to evaluate thecurrent status of areas vulnerable to P transport withoutthe addition of any fertilizer or poultry litter. Next, the PImodel was run to simulate the effects of the addition oftwo types of P
2O
5 fertilizer applied at four rates of appli-
cation. All simulated P2O
5 fertilizer applications, applied
broadcast more than three months before the growing sea-son, corresponded to a PLR of 8.0 in the very high cat-egory (Table 1). For simulations of the addition of inor-
ganic P2O
5 fertilizer (IPR), the PLR was set to 1 (low), 2
(medium), 4 (high) or 8 (very high). Table 1 shows thecorresponding inorganic P
2O
5 fertilizer application rates.
Values of OPR and OPM in equation [3] were set to zero.For simulations of the addition of organic P
2O
5 (OPR),
PLR were the same as the inorganic form, but applica-tions rates were based on rates of poultry litter having anaverage of 20.2 kg/Mg P
2O
5. In these simulations OPR
was set at either 1.0 (1.12 Mg/ha of poultry litter), 2(2.24 Mg/ha), 4 (4.5 Mg/ha) or 8 (9.0 Mg/ha), and valuesof IPR and IPM in equation [3] were set to zero. There-fore, organic P
2O
5 sources were considered to contribute
more to P transport vulnerability than inorganic sources,as reflected by the differences between IPR and OPR sitecharacteristic weights and category ranges allocated tofertilizer application rates for the P loss ratings (Table 1).
RESULTS AND DISCUSSIONErosion in the Watershed
Estimated annual total rill/inter-rill erosion for theWEW was 430,558 Mg/year, which equates to an averageof 4.98 Mg/ha/year (Fig. 1; Table 3). This estimated po-tential erosion does not include soil loss from paved orunpaved roads and ditch banks. Nearly 58% of the water-shed had estimated erosion rates of less than 2.3 Mg/ha/year, and over 85% of the watershed had estimated ero-sion rates less than 4.5 Mg/ha/year. These results indicatethat there is not a severe erosion problem within the WEWwatershed as a whole. However, 2.2% of the watershedhad severe annual erosion rates greater than 33.6 Mg/ha/year.
Distributions of the input parameters across erosionclasses were investigated to determine the most influen-tial parameters for both low and high erosion classes. Foreach class of attributes, the distribution was divided by thetotal distribution for the WEW. The bold values in Table 4indicate percent coverages that were more than 1.5 timesthe total WEW coverage. These values were considered tobe more influential in erosion despite the fact that theymay not have had the largest distribution within erosionclasses. The zero class for the K factors was water bodiesand reflected by the water class in the LULC. Spatial dis-tribution of K factors both within and between erosionclasses was not significantly different from distributionswithin the total WEW. This similarity was most likely dueto the relatively limited range of K in the database, 0.15to 0.43, when compared with other factor ranges (Table4). A varying relationship was noted between slope lengthand erosion classes. Greatest slope length influence oc-curred in the 6.2-9.0 Mg/ha erosion class with slopelengths >120 m. Slope length influence decreased in highererosion classes. Slope also influenced erosion. The low-est erosion class was influenced by the two lower slopeclasses while higher slope classes dominated middle ero-
λ22.1( )
m

PROCEEDINGS 21ST ANNUAL SOUTHERN CONSERVATION TILLAGE CONFERENCE FOR SUSTAINABLE AGRICULTURE
73
sion classes. Slope influence also decreased with highererosion classes. These factors did not significantly affectthe higher erosion classes. Higher erosion classes weremainly affected by LULC. The highest erosion class (>33.6 Mg/ha) was dominated by lesser quality pastures,transitional areas, cropping areas, scrub brush and poultryoperations. In the highest erosion class, these areas haddistributions 20 to 50 times greater than total watersheddistributions.
These highly erodible areas in the WEW mostly corre-spond to soil taxonomic units of Clarksville, Cleora, Moko,Noark, Peridge, Razort, Secesh and Summit. Of these soils,Clarksville, Cleora, Noark and Peridge soils cover 20%of the watershed, although not all of these soils occurredin the highest erosion class. Soils that occur in low ero-sion areas include Arkana, Captina, Johnsburg, Sogn,Linker, Pickwick and Savannah and comprise over 3% ofthe total watershed. The physical properties and topographiclocation of these soils are not homogeneous within ero-sion classes, nor are they unique between erosion classes.The lack of uniformity of the soil properties within theseerosion classes suggests that estimated erosion is due tosome other parameter, most likely C factors. The spatialdistributions of the remaining 75% of the soils in theerosion classes were not significantly different from thatof the total watershed.
With the exception of C factors (LULC), all other fac-tors represent natural features of the watershed, whichcannot be modified to any extent to reduce erosion poten-tial. However, factor C is a changeable parameter. Throughbest management practices, erosion can be controlled byencouraging good vegetative growth in poor pasture areasand erosion control methods in bare ground transitionalareas.
Phosphorus Index ModelThe first PI model simulation on the WEW was made
to assess the overall vulnerability of the watershed to Ptransport without any applied fertilizer. Input parameterswere erosion, runoff and soil test P (Fig. 2; Table 5).Nearly 72% of pasture in the WEW was in the low PIvulnerability category, 25.5% was in the medium categoryand only 2.5% was in the high vulnerability category (Fig.2; Table 5). These results may reflect the lack of signifi-cant influence of STP when no fertilizer P
2O
5 was applied.
Although there were input parameters classified as veryhigh PLR, there were no very highly vulnerable areas to Ptransport according to model simulations. This was possi-bly due to the relatively low erosion estimates from theUSLE, which were subsequently reflected in large spatialdistribution of low erosion PLR values. Virtually all areasthat had erosion PLR values in the high or very high cat-egories were also estimated to be highly vulnerable to Ptransport without any fertilizer additions (Fig. 1 and 2).
The distributions of P transport vulnerability for inor-ganic and organic P
2O
5 fertilizers applied to pastures are
presented in Tables 6 and 7, respectively. With a simu-lated broadcast application of less than 34 kg of inorganicP
2O
5/ha to the pastures, there was a shift in the percentage
of the WEW in a PI classification (for example, a 57.4%reduction in spatial coverage in the low PI category, a53.4% increase in the spatial coverage in the medium PIcategory and a 4% increase in the high category (Fig. 3;Table 5)). As inorganic P
2O
5 application rate increased,
the extent of the pastures in the higher PI category in-creased dramatically with a particularly large reduction inthe low category. A similar response was found with thesimulations of organic fertilizer P
2O
5 broadcast to the pas-
tures; i.e., as the application rate of organic P2O
5 increased,
the extent of the more vulnerable areas to P transportincreased (Fig. 4; Table 6). This increase was expecteddue to the log 2 increase between PLR values.
The highest simulated P2O
5 application rates were in-
tended to overload the pastures with P2O
5 fertilizer. As a
result, the extent in the high PI category of the organicP
2O
5 was almost twice that of the inorganic P
2O
5 fertil-
izer. This response was mainly due to the difference inweights given in the PI model to inorganic (0.75) andorganic (1.00) fertilizers. Not only were the assignedmodel weights different between the two fertilizer types,but the inorganic fertilizer covered a wider range of appli-cation rates than the organic fertilizer, suggesting that ad-ditions of organic fertilizer were considered to be moreinfluential on P transport. There was an increase in spatialdistribution of the very highly vulnerable category as theP
2O
5 fertilizer application rates increased; however, the
change may not be significant when related to the totalWEW area. This lack of significant increase was due to athreshold limit within PI classification where the valuerange assigned to the highly vulnerability category had amuch larger range, 16, than ranges of the low and mediumvulnerability categories, 8 and 6, respectively (Table 1).
In the areas with high PI indices, invariably the erosionclass was greater than 34 Mg/ha/year, the runoff class wasvery high, and the STP was above 336 kg/ha. As P
2O
5
application rate increased, lower PLR values of erosion,runoff and STP classes were included in the most vulner-able areas. Under conditions of high fertilizer applicationrates to pastures, numerous combinations of these factorsmay result in a high PI index for any given area.
CONCLUSIONS
There were areas in the WEW with high erosion ratesand areas highly vulnerable to P transport; however, thespatial distribution of these areas was minimal when re-lated to the total watershed area. Calculations indicatedthat the WEW was not experiencing severe soil erosion.The areas of estimated high sediment losses were only a
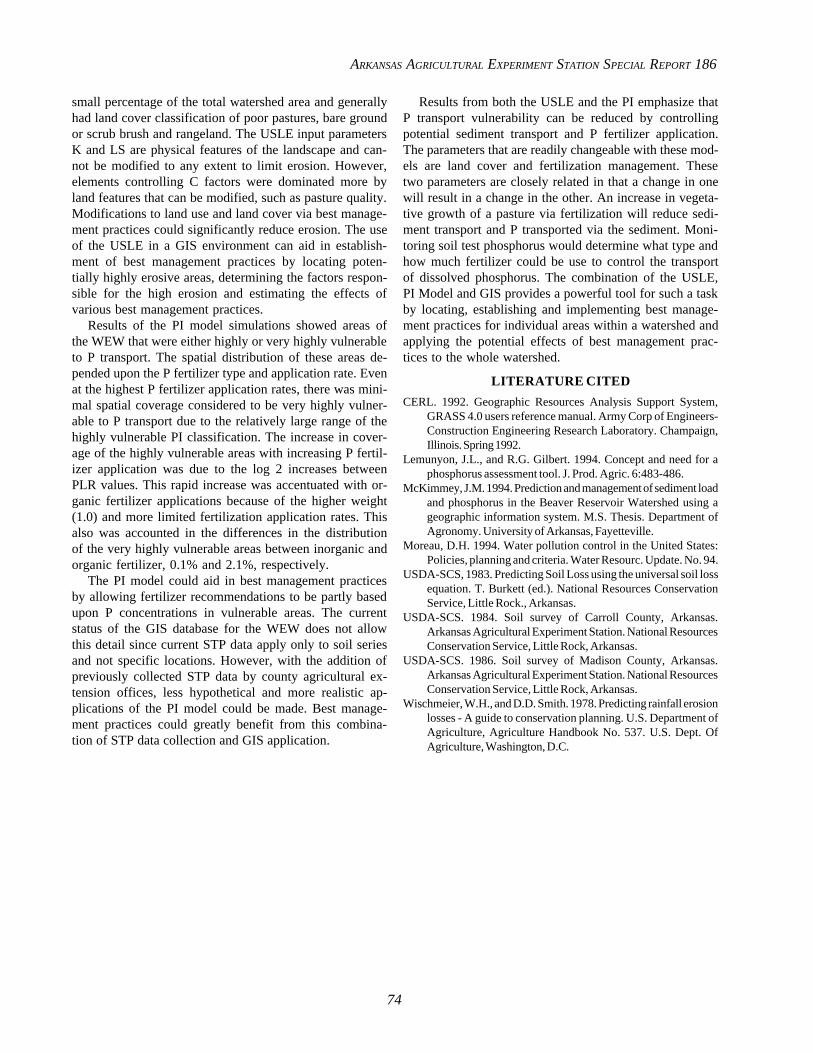
ARKANSAS AGRICULTURAL EXPERIMENT STATION SPECIAL REPORT 186
74
small percentage of the total watershed area and generallyhad land cover classification of poor pastures, bare groundor scrub brush and rangeland. The USLE input parametersK and LS are physical features of the landscape and can-not be modified to any extent to limit erosion. However,elements controlling C factors were dominated more byland features that can be modified, such as pasture quality.Modifications to land use and land cover via best manage-ment practices could significantly reduce erosion. The useof the USLE in a GIS environment can aid in establish-ment of best management practices by locating poten-tially highly erosive areas, determining the factors respon-sible for the high erosion and estimating the effects ofvarious best management practices.
Results of the PI model simulations showed areas ofthe WEW that were either highly or very highly vulnerableto P transport. The spatial distribution of these areas de-pended upon the P fertilizer type and application rate. Evenat the highest P fertilizer application rates, there was mini-mal spatial coverage considered to be very highly vulner-able to P transport due to the relatively large range of thehighly vulnerable PI classification. The increase in cover-age of the highly vulnerable areas with increasing P fertil-izer application was due to the log 2 increases betweenPLR values. This rapid increase was accentuated with or-ganic fertilizer applications because of the higher weight(1.0) and more limited fertilization application rates. Thisalso was accounted in the differences in the distributionof the very highly vulnerable areas between inorganic andorganic fertilizer, 0.1% and 2.1%, respectively.
The PI model could aid in best management practicesby allowing fertilizer recommendations to be partly basedupon P concentrations in vulnerable areas. The currentstatus of the GIS database for the WEW does not allowthis detail since current STP data apply only to soil seriesand not specific locations. However, with the addition ofpreviously collected STP data by county agricultural ex-tension offices, less hypothetical and more realistic ap-plications of the PI model could be made. Best manage-ment practices could greatly benefit from this combina-tion of STP data collection and GIS application.
Results from both the USLE and the PI emphasize thatP transport vulnerability can be reduced by controllingpotential sediment transport and P fertilizer application.The parameters that are readily changeable with these mod-els are land cover and fertilization management. Thesetwo parameters are closely related in that a change in onewill result in a change in the other. An increase in vegeta-tive growth of a pasture via fertilization will reduce sedi-ment transport and P transported via the sediment. Moni-toring soil test phosphorus would determine what type andhow much fertilizer could be use to control the transportof dissolved phosphorus. The combination of the USLE,PI Model and GIS provides a powerful tool for such a taskby locating, establishing and implementing best manage-ment practices for individual areas within a watershed andapplying the potential effects of best management prac-tices to the whole watershed.
LITERATURE CITED
CERL. 1992. Geographic Resources Analysis Support System,GRASS 4.0 users reference manual. Army Corp of Engineers-Construction Engineering Research Laboratory. Champaign,Illinois. Spring 1992.
Lemunyon, J.L., and R.G. Gilbert. 1994. Concept and need for aphosphorus assessment tool. J. Prod. Agric. 6:483-486.
McKimmey, J.M. 1994. Prediction and management of sediment loadand phosphorus in the Beaver Reservoir Watershed using ageographic information system. M.S. Thesis. Department ofAgronomy. University of Arkansas, Fayetteville.
Moreau, D.H. 1994. Water pollution control in the United States:Policies, planning and criteria. Water Resourc. Update. No. 94.
USDA-SCS, 1983. Predicting Soil Loss using the universal soil lossequation. T. Burkett (ed.). National Resources ConservationService, Little Rock., Arkansas.
USDA-SCS. 1984. Soil survey of Carroll County, Arkansas.Arkansas Agricultural Experiment Station. National ResourcesConservation Service, Little Rock, Arkansas.
USDA-SCS. 1986. Soil survey of Madison County, Arkansas.Arkansas Agricultural Experiment Station. National ResourcesConservation Service, Little Rock, Arkansas.
Wischmeier, W.H., and D.D. Smith. 1978. Predicting rainfall erosionlosses - A guide to conservation planning. U.S. Department ofAgriculture, Agriculture Handbook No. 537. U.S. Dept. OfAgriculture, Washington, D.C.

PROCEEDINGS 21ST ANNUAL SOUTHERN CONSERVATION TILLAGE CONFERENCE FOR SUSTAINABLE AGRICULTURE
75
Table 1. Site characteristics, weights and phosphorus (P) loss ratings used in the Phosphorus Index model.
Phosphorus loss rating (value)Site Characteristic None Low Medium High Very High (weight) (0) (1) (2) (4) (8)
Soil erosion Mg/ha (1.5) N/A < 11.2 11.2 - 22.5 22.5-33.7 > 33.7
Runoff class (0.5) Negligible Very Low or low Medium High Very high
Soil P test (1.0) N/A Low Medium High Excessive
Fertilizer Application Rate kg/haInorganic P2O5 (0.75) None Applied 1 - 34 35-100 100-168 > 168
Organic P2O5 (1.0) None applied 1 - 34 35 - 67 68 - 100 > 100
Application method (1.0) N/A N/A N/A N/A Surface applied
Phosphorus Index ClassificationPhosphorus indices < 8 8 - 14 15 - 32 > 32
Qualitative Rating Low Medium High Very High
Table 2. Spatial distribution of Phosphorus Index modelinput map type parameters.
Category -------------------Area-------------------
ha %Erosion classLow 29,702 89.1Medium 2,492 7.5High 337 1.0Very High 770 2.4
Runoff ClassNegligible 3,116 9.3Low or Very Low 8,205 24.6Medium 9,588 28.8High 8,441 25.4Very High 3,951 11.9
Soil Test P ClassLow 1,614 4.9Medium 3,968 11.9High 22,654 68.0Excessive 5,065 15.2
Table 3. Potential erosion in the War Eagle Watershedgenerated by the USLE from a GIS spatial database.
Potential Erosion -------------------Area------------------
Mg/ha ha %< 2.24 50,005 57.92.24 - 4.48 16,338 18.94.48 - 6.72 8,261 9.66.72 - 8.96 3,977 4.68.96 - 11.2 3,095 3.611.2 - 33.6 2,818 3.2> 33.6 1,946 2.2Total 86,440 100.0

ARKANSAS AGRICULTURAL EXPERIMENT STATION SPECIAL REPORT 186
76
Table 4. Summation of the USLE input parameters by estimated erosion classes.Bold values are one and one half times more than the total watershed distributions.
Potential Erosion (Mg/ha) WEWAttribute < 2.2 2.2 - 4.5 4.5 - 6.2 6.2 - 9.0 9.0 - 11.2 11.2 - 33.6 > 33.6 Total
k factor (%)0 1.2 0.0 0.0 0.0 0.0 0.0 0.0 0.70.15 6.1 7.8 8.0 9.0 7.0 4.7 2.7 6.70.17 0.0 0.0 0.0 0.0 0.0 0.0 0.0 0.00.2 20.8 28.9 31.3 28.0 26.3 19.6 14.9 23.70.24 15.4 21.5 19.1 18.2 14.9 15.4 18.2 17.10.28 21.5 21.3 23.6 24.4 35.5 36.2 30.3 23.00.32 23.9 16.9 15.4 16.8 13.3 18.0 23.2 20.80.37 6.3 2.1 1.7 2.3 1.8 3.7 6.3 4.60.43 4.9 1.5 1.0 1.4 1.2 2.4 4.4 3.5Slope Length (m)30 73.6 44.9 27.0 20.4 21.4 25.9 38.5 57.160 19.6 32.8 28.8 23.3 22.4 24.7 28.4 23.690 5.1 14.8 22.8 24.0 21.1 20.4 17.2 10.9120 1.2 5.1 12.4 15.6 14.8 12.8 8.8 4.7> 120 0.5 2.4 8.8 16.6 20.2 16.2 7.1 3.7Slope (%)0-3 11.9 0.4 0.6 1.1 0.7 1.4 0.6 6.04-8 32.9 4.5 2.0 2.5 3.9 9.2 12.4 20.99-13 31.1 15.4 10.2 8.3 4.9 10.3 22.4 24.514-20 22.6 49.3 36.0 22.4 22.2 22.7 33.5 29.2> 20 1.5 30.4 51.2 65.6 68.4 56.5 31.1 19.5LULCPasture Good 38.3 9.3 3.7 1.7 0.7 0.3 0.1 24.4 Fair 7.5 14.8 20.4 24.7 30.9 35.4 9.4 12.7 Woodland 0.0 0.1 0.2 0.2 0.7 2.8 12.0 0.4 Over Grazed 0.0 0.1 0.1 0.4 0.9 2.5 8.5 0.4 Poor 0.0 0.0 0.0 0.4 0.1 0.5 18.5 0.5Crop 0.1 0.1 0.4 0.7 1.2 4.9 13.8 0.6Poultry 0.0 0.0 0.1 0.1 0.5 1.5 6.0 0.2Scrub Brush 0.3 0.8 1.2 2.9 4.2 15.6 25.2 1.8Transitional 0.0 0.0 0.0 0.0 0.0 0.0 1.9 0.0Forest 52.1 74.3 73.3 68.5 60.6 36.2 4.5 57.8Urban 0.5 0.6 0.4 0.4 0.3 0.2 0.0 0.5Water 1.2 0.0 0.0 0.0 0.0 0.0 0.0 0.7
Table. 5. Distribution of phosphorus (P) transport vulernabilitycalculated by P application rate for inorganic P fertilizer
applied to pastures only. Areas do not includewater bodies (30 ha).
P2O5 PApplication Transport AreaRate Vulnerability ha %
Kg/ha0 Low 23,973 71.9
Medium 8,507 25.6High 821 2.5
1-34 Low 4,807 14.5Medium 26,329 79.0High 2,165 6.5
35-101 Low 2,102 6.4Medium 28,335 85.0High 2,864 8.6
102-168 Low 51 0.2Medium 28,170 84.5High 5,080 15.3
> 168 Medium 17,059 51.2High 16,215 48.7Very High 27 0.1
Table. 6. Distribution of phosphorus (P) transport vulnerabilitycalculated by P application rate for organic P fertilizer
applied to pastures only. Areas do not includewater bodies (30 ha).
P2O5 PApplication Transport AreaRate Vulnerability ha %
Kg/ha0 Low 23,973 71.9
Medium 8,507 25.6High 821 2.5
1-34 Medium 9,269 18.9High 27,005 81.0Very High 27 0.1
35-67 Medium 4,787 14.4High 28,481 85.5Very High 33 0.1
67-101 Medium 51 0.2High 33,088 99.3Very High 162 0.5
>101 High 32,632 97.9Very High 669 2.1
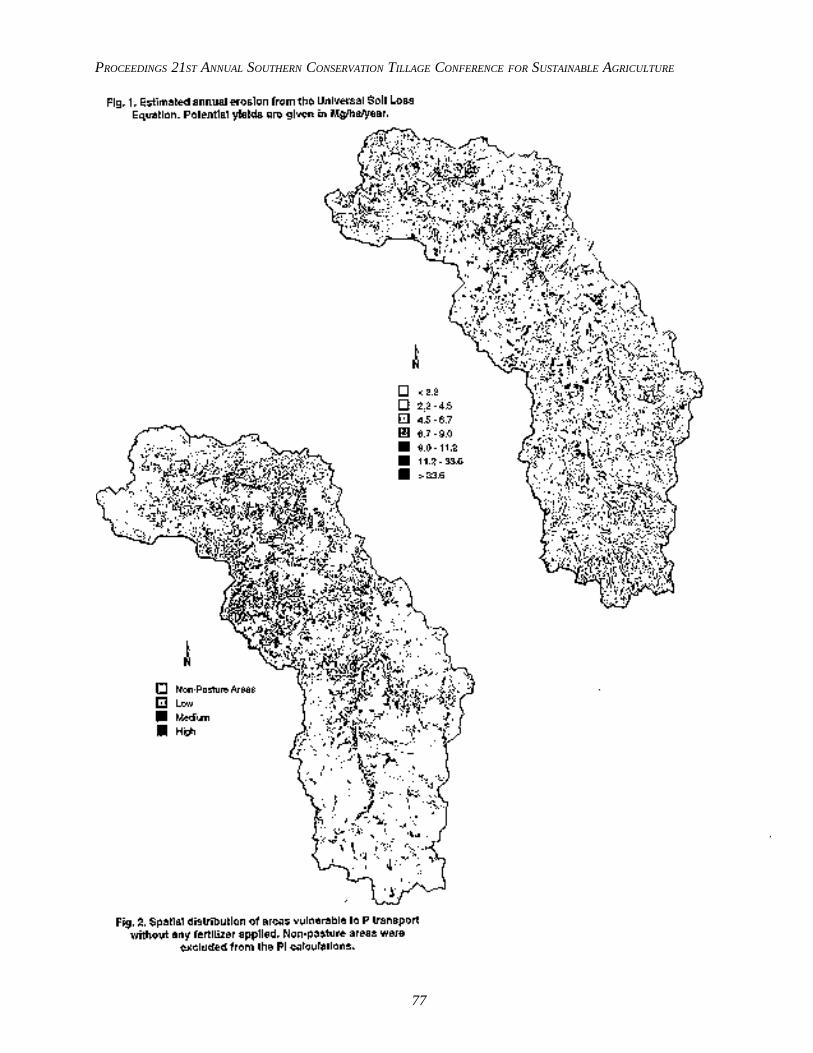
PROCEEDINGS 21ST ANNUAL SOUTHERN CONSERVATION TILLAGE CONFERENCE FOR SUSTAINABLE AGRICULTURE
77

ARKANSAS AGRICULTURAL EXPERIMENT STATION SPECIAL REPORT 186
78

PROCEEDINGS 21ST ANNUAL SOUTHERN CONSERVATION TILLAGE CONFERENCE FOR SUSTAINABLE AGRICULTURE
79
INTRODUCTION
The Relationship Between Tillage and Soil Qualityeducing or minimizing tillage (particularly inver-sion of the soil, using the moldboard plow, disk,etc.) increases soil organic matter content, which
in turn increases soil quality (Ismail et al., 1994; Doranand Jones, 1996). From the perspective of both the farmerand the soil scientist, in-situ production and retaining highlevels of crop residues (high-residue farming) on untilledsoil (no-tillage) is the most cost- and time-efficient wayof increasing soil organic matter (Crovetto, 1996). In-deed, high-residue/no-till (HR/NT) farming systems canplay a major role in achieving a sustainable agricultureworldwide (Lal et al., 1990).
The Advantage of Using Transplants in HR/NTSystems
High-residue covers can interfere with seed germina-tion and seedling growth, lowering the chance of achiev-ing adequate plant survival and stand with direct-seededcrops. Conversely, proper establishment of large, vigor-ous transplants minimizes crop interference and dramati-cally increases the chance of plant survival in high-residuecovers. In addition, using transplants favors rapid canopyclosure and weed suppression, reducing the need forchemical weed control (Morse, 1995).
No-till Equipment: A Limiting FactorFor many decades, home gardeners and small-scale
farmers have applied organic mulches to conserve theirsoil and water resources, improve weed and pest control,and increase yield and quality of vegetable crops (Dutton,1957). No-tillage systems (using in-situ mulches) haveall the advantages of using applied mulch, without disturb-ing the soil and requiring the time-consuming and oftenuneconomical practice of purchasing, hauling and apply-ing straw and organic waste materials.
If organic mulches are such a valuable resource, whyare HR/NT systems not widely practiced in the UnitedStates and other areas of the world? Until recently, a ma-jor problem slowing adoption of no-till systems has beenlack of available equipment. However, during the past fiveyears, equipment and associated technology have been de-veloped and are commercially available for small-scalefarm production of transplanted crops in HR/NT systems
(Morse et al., 1993). This paper will attempt to brieflyoutline and summarize key components of HR/NT sys-tems that have been tested and used successfully by farm-ers in many areas of the United States in the 1990s.
NO-TILL TRANSPLANTED CROPS IN THE1990S–KEYS TO SUCCESS
High, profitable yields are achievable using HR/NT pro-duction systems. Growers should use a year-round sys-tems approach in HR/NT farming. Success depends on 1)selecting the most sustainable or appropriate crops, culti-vars, soils and micro climatic conditions and 2) identify-ing and applying yield-enhancing practices inherent or spe-cific for HR/NT systems. This paper will focus on thelatter: yield-enhancing practices specific for HR/NT sys-tems. In the sections that follow, four production strate-gies (objectives) are briefly presented, emphasizing properuse of available equipment and associated technology.These four objectives are explained more extensively inMorse et al., 1998.
Objective I: Produce a dense, uniformly distributedcover crop prior to transplanting
Sparse, unevenly distributed surface coverage is a ma-jor cause of poor results in NT transplanted crops. In con-trast, establishing a dense, uniformly distributed cover cropprior to transplanting provides the greatest chance for suc-cess. Benefits from heavy, evenly distributed residues in-clude weed suppression, reducing or even eliminating theneed for preemergent herbicides; greater conservation ofboth soil and water; and greater trafficability resulting inimproved flexibility in timing field operations.
With NT production systems, investing in cover cropresidues prior to transplanting is like establishing a sav-ings account: you receive the input (deposit) back plusinterest later. Every effort and expense to establish a rela-tively weed-free, dense cover crop will be rewarded laterin the form of improved crop yields and quality. Recom-mended cultural practices include selecting the most adap-tive and compatible cover crops, obtaining a uniform densestand by drilling high seed rates at close between-rowspacing and providing adequate growth inputs (water, limeand fertilizer) and growing time to maximize cover cropbiomass.
1Department of Horticulture, Virginia Tech.
KEYS TO SUCCESSFUL PRODUCTION OF TRANSPLANTED CROPSIN HIGH-RESIDUE, NO-TILL FARMING SYSTEMS
Ronald Morse1
R
ARKANSAS AGRICULTURAL EXPERIMENT STATION SPECIAL REPORT 186
80
Objective II: Kill cover crops prior to transplanting,leaving a heavy, uniformly distributed mulch coverover the soil surface
Weeds reduce crop yields predominantly by interspe-cific (weed-crop) competition for water, nutrients and light.To minimize interspecific competition, the cover crop mustbe killed and subsequently managed in such a manner thatthe in situ mulch effectively covers and shades the soilsurface but does not excessively shade or compete withtransplanted crops for light, nutrients and water. Eitherchemical and/or mechanical methods can be used to killand generate a dense mulch (Dabney et al., 1991; Morse,1995).
Chemical methods. Contact herbicides such asglyphosate (Roundup) and paraquat (Gramoxone Extra) areneeded to desiccate perennial and immature annual weedand cover crop species. Desiccation should be done twoto five weeks prior to transplanting to ensure completevegetative kill. Glyphosate should be applied at least fourweeks prior to transplanting to avoid any potential stunt-ing of the transplanted crops from root-to-root transfer ofactive glyphosate exuded from roots of the treated covercrop to the roots of the transplanted crops. Often two ormore sprays are required to completely desiccate all veg-etation.
Mechanical methods. Many species of mature annualgrass and legume cover crops can be effectively killedusing mechanical methods (Morse, 1995). To be success-ful, however, mechanical treatments must occur after theannual species have developed beyond their vegetative stageand ideally after flowering. When attempting to kill mix-tures of annual species (both cover crops and/or weeds)mechanically, all species should be mature and incapableof regrowth following mechanical treatments. Mechani-cally killing cover crops has two distinct advantages overusing contact herbicides: 1) because herbicides are notused, negative environmental impacts are reduced; and 2)cover crops can be killed just before planting, which maxi-mizes the growth potential and maturation of the residues.Since a relatively high percentage of transplanted cropsare irrigated, potential soil moisture depletion problemsfrom drought prior to planting are negated.
Flail mowing and rolling have been used effectively tokill black oat (Avena strigosa Schreb.), cereal rye (Secalecereale L.), wheat (Triticum aestivum L.), foxtail millet(Setaria italica L.), buckwheat (Fagopyrum saggitatumGrlib.), crimson clover (Trifolium incarnatum L.) and soy-bean (Glycine max L.). Flail mowing effectively kills mostmature annual cover crops and distributes a uniform layerof organic mulch over the soil surface. Rotary mowersare not recommended because they tend to windrow thechopped residues. Flail mowers contain many small double-
edged knives affixed to a parallel rotor that uniformlydistribute the finely cut residues over the soil surface.
Rolling can effectively kill many cereal grain cropsand some legumes. Cover crop kill is often less completewhen rolled than when mowed. However, the NT trans-planters function better, and after transplanting cover croppersistence and weed suppression are better in rolled thanin mowed plots.
When rolled effectively, dense stands of mature annualcover crops are laid prostrate uniformly over the groundand remain lodged. Complete kill takes from a few days toseveral weeks, and in some cases partial greening mayremain throughout the growing season of the transplantedcrop. With most crops, however, any interspecific com-petition between the transplanted crop and the living coveris not a serious yield-limiting factor and is more thancompensated by the many growth-promoting benefits ofrolled, heavy crop residue mulch. Planting the transplantedcrops in multiple rows often helps considerably to mini-mize greening of the rolled cover crops and thus reducesinterspecific competition effects.
Many types of equipment have been used to roll matureannual cover crops, including:
1. Disengaged flail mower. When disengaged andpulled over the ground, the roller gauge wheel ofthe flail mower can effectively flatten mature cropresidues.
2. Grain drills. Modified grain drills equipped withcoulters and cast-iron press wheels spaced 5 in.apart have been effectively used to roll somecover crops.
3. Turf or construction rollers. Commerciallyavailable water-filled rollers used for compactingand rolling turf and roadways could be used toroll crop residues.
4. Roller-crimper drum. Water-filled drum rollersmodified with horizontal welded blunt steel bladesor metal strips have been used in Brazil and otherlocations to roll-crimp cover crops, thusfacilitating killing yet leaving plant stems intact.
5. Undercutter-roller. A modified blade plow (V-plow sweep) has been used as an undercutter,designed to sever the cover crop roots, followedby a rolling harrow which rolls the residues flatover the ground. This undercutter-roller functionswell on raised beds under dry, non-rockyconditions.
6. Rolling stalk chopper. When properly adjustedor modified, stalk choppers can effectively rolland evenly distribute high-residue cover crops.
Rolling appears to have considerable merit for mechani-cally killing cover crops. Ongoing crop residue manage-ment research and field testing in several states (Virginia,

PROCEEDINGS 21ST ANNUAL SOUTHERN CONSERVATION TILLAGE CONFERENCE FOR SUSTAINABLE AGRICULTURE
81
North Carolina, Pennsylvania, Alabama, Maryland and Cali-fornia) should help clarify the relative advantages and spe-cific uses of different rolling methods for mechanicallykilling cover crops in HR/NT vegetable production sys-tems.
Chemical/mechanical methods. In some situationswhere contact herbicides are required to achieve an ad-equate kill, mowing or rolling may be used to minimizeshading of the transplanted crop. For example, contactherbicides combined with or without pre-emergent herbi-cides can be used to desiccate tall-standing, dense resi-dues, followed by mowing or rolling prior to transplantingor mowing (with mower blades held above the establishedtransplants) after transplanting. With sparse, low-growingcover crops, mechanical methods would not be needed.
The Subsurface Tiller-Transplanter (SST-T - ObjectiveIII) functions best in upright standing (intact) residues,regardless of the height of the cover crops. In contrast, insome situations the SST-T functions poorly in lodged des-iccated residues or coarsely chopped, unevenly distrib-uted residues such as derived from rotary mowers.
Recently, several cover crops have been effectivelykilled by rolling first followed by applying paraquat. Thismethod looks very promising since rolling can optimallyorient and distribute flattened residues, which facilitatestransplanting effectiveness with the SST-T.
Objective III: Establish transplants into cover cropswith minimum disturbance of surface residues andsurface soil
Lack of reliable NT transplanters and inconsistent standestablishment have been major factors limiting the adop-tion of NT systems for transplanted crops. Generally, lowyields occur when no-tillage is practiced in poorly drained,compacted soils. In NT systems, when a device (chiselplow, coulter, rototiller, undercutter, etc.) is used to loosenor fracture a strip of in-row soil prior to transplanting,both stand establishment and subsequent plant growth areimproved, approaching or even surpassing that achieved intilled soils. With the recent development of the Subsur-face Tiller-Transplanter (SST-T), no-tillage with in-rowsoil loosening and transplanting are combined in one passacross the field. The SST-T is a “hybrid,” combining sub-surface soil loosening to alleviate soil compaction andeffective setting transplants–in one operation with mini-mum disturbance of surface residues or surface soil.
The SST-T has an upright, high-clearance design with adouble-disk shoe similar to that of earlier custom-mademodels used in the 1970s. However, in addition, the SST-T has a unique subsurface tiller (SST) aligned in front ofthe double-disk shoe of the transplanter. The conceptualdesign and functioning of the SST-T is uniquely differentfrom that of earlier and present-day NT transplanters. Withsome NT models, the cultivator-type shoe performs both
the tilling and the planting functions. Under compacted,rocky conditions, the rigid-mounted shoe is easily bent orbroken, which seriously reduces its usefulness for NT sys-tems. In contrast, the spring-loaded soil-loosening com-ponent of the SST has heavy-duty construction and subsur-face tills a narrow strip of soil ahead of the double diskshoe of the transplanter. The double-disk shoe movesthrough the residues and tilled strip with relatively littleresistance and with minimal surface soil and surface resi-due disturbance. The SST-T is an efficient (less equipmentbreakdown) and effective (less transplant resetting needed)NT transplanter that, when used in heavy residues, maxi-mizes soil and water conservation and early field reentrypermitting planting, spraying and harvesting operations tobe done within a few hours following irrigation or rainfall.
The single coulter and/or double-disk shoe of other NTmodels often do not loosen enough in-row soil for opti-mum root-soil contact, resulting in reduced plant survivaland slow early growth of the improperly set transplants.Fluted or ripple coulters can loosen more in-row soil thanthe smooth coulters; however, they do not cut the resi-dues as effectively as the smooth coulter and may causehair pinning (pressing of the residues into the soil withoutcutting).
The SST-T is also equipped for precision placement of1) liquid starter fertilizer-pesticide solutions around theroot system of the transplant, 2) liquid or granular fertil-izers underneath the transplant and 3) granular fertilizerssurface applied in bands on both or either side of thetransplant row. A combination of these treatments is ex-pected to eventually give the most efficient use of soilamendments. Also, a drip layer attachment became avail-able in 1997. This attachment places drip tubing at varyingdepths below the crop residues and in close proximity ofthe crop row.
Objective IV: Practice year-round weed controlThe old adage “an ounce of prevention is worth a pound
of cure” is particularly valid in HR/NT farming. Weedcontrol can be achieved two ways--directly using bothchemical and mechanical means and indirectly by usingcultural practices that promote rapid plant growth andcanopy closure. Preemergence and post-emergence her-bicides can be applied and, in conjunction with physicaland allelopathic effects associated with high-residue cov-ers, often provide adequate weed control. However, thebest direct method is to lower weed and seed populationsprior to transplanting (i.e., apply aggressive weed-controlmeasures prior to and/or during production of the covercrop).
Of critical importance, NT fields should not have aserious perennial weed problem such as nutsedge,quackgrass, Johnsongrass or morning glory. Weedy fieldsshould be cleaned up prior to seeding the cover crop; and/

ARKANSAS AGRICULTURAL EXPERIMENT STATION SPECIAL REPORT 186
82
or, if necessary, herbicides should be used in conjunctionwith production of the cover to minimize weed populationprior to transplanting. Appropriate use and timing ofpretransplant herbicides to achieve a “stale seedbed” (re-duced weed seed population) and a dense weed-free covercrop are generally an inexpensive, more environmentallyfriendly use of herbicides than if applied later in conjunc-tion with production of the transplanted crop.
The term “stale seedbed” (more appropriately stale trans-plant bed) refers to techniques allowing weed seeds in thesoil surface to germinate and be killed without redisturbingthe soil other than the seeding operation. Fallowing theNT field prior to seeding the cover crop and eradicatingemerged weeds, either by mowing or with herbicides, fol-lowed by NT drilling cover crops is an excellent way ofobtaining both a stale seedbed and a weed-free cover cropprior to transplanting.
Using cultural practices that promote rapid plant growthand canopy closure will result in improved weed suppres-sion and higher crop yields. Recommended cultural prac-tices include 1) using large, vigorous transplants; 2) ar-rangement of plants in multiple rows; and 3) precisionplacement and timing of fertilizer and water.
FUTURE NEEDS–2000 AND BEYOND
Strengthen competitive position of small farms inAmerican agriculture
A recent report from the USDA National Commissionon Small Farms emphasized adoption of sustainable agri-culture as a profitable, ecological and socially sound strat-egy for small farms (USDA, 1998). Availability of afford-able and effective small-scale, no-till equipment is essen-tial to expedite adoption of no-tillage, especially HR/NTfarming systems. Farmers and researchers must continueto refine and develop no-till equipment for mechanicallykilling high-residue cover crops, plant establishment (bothdirect seeding and transplanting) and harvesting.
Develop HR/NT systems for organic farmersHistorically organic farmers have avoided NR/NT sys-
tems because mechanical weed control is generally com-plicated by surface residues. Paradoxically, primary till-age and weed implements used by organic farmers incor-
porate surface residue, excessively aerate the soil and re-duce soil organic matter content and soil quality. Researchis urgently needed to evaluate utilization of legume-grassmixtures and injectable (liquid, granular, pelleted, etc.)organic fertilizers in HR/NT systems for production oforganic vegetables.
LITERATURE CITED
Crovetto, C.L. 1996. Stubble over the soil: The vital role of plantresidue in soil management to improve soil quality. Amer. Soc.Agron., Madison, Wisconsin.
Dabney, S.M., N.W. Buehring and D.B. Reginelli. 1991. Mechanicalcontrol of legume cover crops. pp. 146-147. In: W.L. Hargrove(ed.). Cover crops for clean water. Soil and Water Cons. Soc.,Ankeny, Iowa.
Doran, J.W., and A.J. Jones. 1996. Methods of assessing soil quality.SSSA Special Publ. No. 49. Soil Sci. Soc. Amer., Madison,Wisconsin.
Dutton, P.R. 1957. The mulching of vegetables. TechnicalCommunications No. 24, CAB, London.
Ismail, I., R.L. Blevins and W.W. Frye. 1994. Long-term no-tillageeffects on soil properties and continuous corn yields. Soil Sci.Soc. Amer. J. 58:193-198.
Lal, R., D.J. Eckert, N.R. Fansey and W.W. Edwards. 1990.Conservation tillage in sustainable agriculture. pp. 203-225. In:L.L. Edwards, R. Lal, P. Madden, R.H. Miller and G. House(eds.). Sustainable agricultural systems. Soil and Water Cons.Soc., Ankeny, Iowa.
Morse, R.D. 1995. No-till, no-herbicide systems for production oftransplanted broccoli. pp. 113-116. In: W.L. Kingery and N.Buehring (eds.). Conservation farming: A focus on water quality.Proc. Southern Region Conservation Tillage for SustainableAgriculture. Jackson, Mississippi, 26-28 June 1995.
Morse, R.D., G. Larrowe and L. Belcher. 1998. No-tillage productionof transplanted crops: A sustainable and profitable alternative (inpress).
Morse, R.D., D.H. Vaughan and L.W. Belcher. 1993. Evaluation ofconservation tillage systems for transplanting crops-–Potentialrole of the subsurface tillage transplanter. pp. 145-151. In: P.K.Bollich (ed.). The Evolution of conservation tillage systems.Proc. Southern Conservation Tillage Conference for SustainableAgriculture. Monroe, Louisiana, 15-17 June.
USDA. 1998. A time to act. USDA National Commission on SmallFarms Report, Washington, DC.
PROCEEDINGS 21ST ANNUAL SOUTHERN CONSERVATION TILLAGE CONFERENCE FOR SUSTAINABLE AGRICULTURE
83
SUMMARY
Two of the most troublesome weeds in the southernUnited States are Senna obtusifolia and Xanthiumstrumarium. A field experiment was conducted to deter-mine the influence of tillage practice and interferencelevel on seed production potential, emergence pattern andsoil seed bank of S. obtusifolia and X. strumarium and todetermine the dominant species after introduction into aweed-free field. Interference level did not influence thesoil seed bank except for S. obtusifolia under tilled con-ditions. Under tilled conditions, X. strumarium was thedominant species, and S. obtusifolia was dominant underno-till conditions. Soil seed bank loss was greater forboth species with tillage. Three years after initial seeddeposition, the remaining S. obtusifolia seeds were 100%viable while X. strumarium burs were not viable. Thus,under no-till conditions, the X. strumarium soil seed bankwas depleted while S. obtusifolia was not.
INTRODUCTION
Senna obtusifolia L. and Xanthium strumarium L. areamong the most troublesome weeds in many fields of thesouthern United States (Elmore, 1986). Once the weedsare introduced and established, a producer is confrontedwith the potential for a severe weed problem for manyyears. X. strumarium is more competitive than S.obtusifolia (Monks and Oliver, 1988); however, other fac-tors may regulate the population and determine the domi-nant weed species when both species are established on anequal basis.
The lifespan of weed seed in soil is important sincepotential weed problems exist as long as weed seed re-main viable (Egley and Chandler, 1978). An understandingof seed bank function requires knowledge of the numbersof seed present at a given time and knowledge of the soilseed bank dynamics. Seed bank dynamics are affected byboth rate of input (direct deposit by the plant and by dis-persal from humans, wind, rain, birds and other animals)and rate of output (loss through germination, deep burial,predation, disease and death) (Fenner, 1985). Understand-ing emergence patterns and extent of seedling emergencefrom the seed bank aids in weed control and estimation ofcrop yield loss.
Soil tillage reduces the number of weeds but may in-crease germination of weed seed in the soil seed bank(Roberts and Neilson, 1981). In contrast, no-till systemstypically have high populations of small-seeded annualweeds. The objectives of the present work were 1) todetermine the influence of tillage practice and interfer-ence level on seed production potential, emergence pat-tern and soil seed bank of X. strumarium and S. obtusifoliaand 2) to determine the dominant species after initial in-troduction into a previously weed-free field.
Materials and MethodsA field study was conducted at the Main Agricultural
Experiment Station, Fayetteville, Arkansas, from 1991through 1994. The experimental design was a split-plotwith a three by two factorial of subplots and four replica-tions. Main plots were no-till and tilled. Tilled plots weretilled 10 to 12 cm deep each year following actual oranticipated seed production in mid-November and in earlyApril prior to weed emergence with a Triple-K seedbedcultivator with rear rolling baskets. The factorial subplotswere three weed populations: S. obtusifolia alone, X.strumarium alone and S. obtusifolia plus X. strumarium;and two seed deposition levels: harvested in the year ofestablishment (1991) for initial seed production determi-nations or allowed to produce seed and deposit to the soilfor one year (1991). Each plot was 5 m2 with a 1-m bor-der between plots. The soil was a Taloka silt loam (fine,mixed, thermic Mollic albaqualfs) with 25% sand, 62%silt, 13% clay, 1% organic matter and a pH of 6.7.
Initial Seed Production Determination.In the year of establishment (1991), each plot con-
sisted of four single-seed-source weed seedlings trans-planted 2 May 1991 and allowed to grow to maturity anddeposit seed. The distance between plants was 2 m. Plotswith S. obtusifolia plus X. strumarium had two seedlingsof each species planted alternately in the plot. All plantsreceived the same cultural practices and were protectedfrom wind breakage by staking, allowing plants to growand produce seed as uniformly as possible.
At the end of the growing season, plants were harvestedfor seed or bur production. X. strumarium burs werecounted for each plant. S. obtusifolia pod length was mea-sured, and number of seeds per pod was determined by thefollowing linear equation:
Y = - 0.0329 + 1.766 X, r2 = 95
EFFECT OF TILLAGE ON SENNA OBTUSIFOLIA AND XANTHIUM STRUMARIUMPOPULATION, INTERFERENCE AND SEED BANK
L.R. Oliver and M.T. Barapour1
1Department of Agronomy, University of Arkansas, Fayetteville, Arkansas.Previously published, Second Annual Weed Control Congress, Copenhagen1996. pp. 241-246.

ARKANSAS AGRICULTURAL EXPERIMENT STATION SPECIAL REPORT 186
84
where Y = number of S. obtusifolia seed in each pod, andX = pod length in cm. Bur or pod counts and lengths weredetermined in the field in all plots not harvested the firstyear.
Seed Production for One YearIn 1992, all seedlings were allowed to grow to matu-
rity. Two 0.5- by 0.5-m permanently positioned sub-samplemarkers were placed in each plot. From the subsamples,the number of emerged seedlings and seedling mortalitywere recorded every two weeks during the growing sea-son. At the end of the season, entire plot seed productionwas determined for one set of seed deposition plots whilethe other set was left undisturbed. For S. obtusifolia, num-ber of pods per plot was counted. For both weed species,all plants were cut at the soil line for shoot fresh and dryweights (data not shown). Four 1,000-g subsamples foreach species were air dried at 45 C for eight days. S.obtusifolia pods were separated from the plants andcounted, and average pod length was determined. The num-ber of seeds per pod was calculated from the equationdeveloped in 1991 and was multiplied by the actual podcount to estimate total S. obtusifolia seed production perplot. Plants in each plot were harvested at the end of theseason for fresh weights (data not shown). X. strumariumburs were separated from the subsample before drying.The total bur production per plot was calculated by count-ing the burs per subsample and multiplying by the total dryweight. In 1993 and 1994, all emerged seedlings werecounted and removed every two weeks during the growingseason.
Soil Seed Bank SamplingIn November 1994, three years after initial seed depo-
sition, soil samples were taken to estimate S. obtusifoliaand X. strumarium soil seed bank numbers. Each 5-m2
plot was divided into 25 1-m grids, and 25 soil sampleswere taken from the upper right corner of each grid with a10.5-cm-diameter soil probe at a 20-cm depth. Each soilsample was passed through a descending series of sieveswith screen sizes of 4.75 mm to collect X. strumariumburs, 2.0 mm for S. obtusifolia seed and 1.0 mm forescaped S. obtusifolia seeds. Water was run through thescreens to enhance sample movement. Seeds or burs wereseparated and counted according to species as an estimateof number remaining in the soil.
General ProceduresDuring the experiment, unwanted weeds were removed
by spraying sethoxydim (Poast-PlusTM, 120 g ai/L, BASF)at 0.22 kg ai/ha plus 1% v/v crop oil for grass control.Hand hoeing in tilled plots and hand clipping in no-tillplots were used for broadleaf weed control. Glyphosate(RoundupTM, 360g ae/L, Monsanto) at 0.84 kg ae/ha was
sprayed after each seedling count in 1993 and 1994 tocontrol existing vegetation.
Data were subjected to analysis of variance. Means wereseparated by Least Significant Differences (LSD) at the5% level of probability.
RESULTS
S. obtusifolia and X. strumarium initiated flowering 1July and 3 September, respectively, in 1991. At the end ofthe first season, S. obtusifolia produced an average of11,420 seeds/plant, and X. strumarium produced an aver-age of 4,469 burs or 8,938 seeds (achenes)/plant. For theremainder of the paper, X. strumarium reproductive po-tential will be presented as achene number.
Seed production data were similar for intraspecific andinterspecific interference levels except for the number ofseeds deposited to the seed bank. With intraspecific inter-ference, 1,827 and 1,430 seeds/m2 were deposited for S.obtusifolia and X. strumarium, respectively, and only halfthat amount with interspecific interference. Thus, inter-ference data were combined and averaged in order topresent seed production potential.
In 1992 X. strumarium seedlings began emerging bythe end of May and ceased at the end of June, eight weeksafter emergence (WAE) while S. obtusifolia seedlingemergence began at the same time but continued untilAugust (16 WAE). Similar emergence was noted in 1993and 1994. X. strumarium was larger than S. obtusifoliaunder both tilled and no-tilled conditions (data not shown).
During the growing season, seedling mortality was 9.3%of the population for X. strumarium under tilled condi-tions (data not shown). S. obtusifolia seedling mortalityvaried with interference level. Seedling mortality was 5.6%with intraspecific interference and 17% with interspecificinterference. The increase was due to the dominance of X.strumarium in interspecific plots because of initial rapidemergence and plant size under tilled conditions. S.obtusifolia and X. strumarium seedling mortality was notobserved in no-till plots due to low plant populations andlack of interference.
By the end of the growing season, 165 and 202 seed-lings/m2 emerged for X. strumarium and S. obtusifolia,respectively, under tilled conditions, while under no-tillconditions only 10 and 29 seedlings/m2 emerged for X.strumarium and S. obtusifolia, respectively (Table 1). Forboth species, approximately 15% of the initial soil seedbank emerged under tilled conditions. Under no-till con-ditions only 0.2 and 0.08% of the S. obtusifolia and X.strumarium had emerged, respectively.
In 1992, X. strumarium bur production was reduced42%, and S. obtusifolia seed production was reduced 78%under no-till intraspecific conditions compared to tilledconditions (Table 2). Under interspecific, no-till condi-tions, X. strumarium bur production was reduced 46%,

PROCEEDINGS 21ST ANNUAL SOUTHERN CONSERVATION TILLAGE CONFERENCE FOR SUSTAINABLE AGRICULTURE
85
but S. obtusifolia seed production increased 40%. Thereduction in X. strumarium interference allowed the re-maining S. obtusifolia plants to grow larger and producemore seeds than in tilled plots, where S. obtusifolia seedproduction was decreased by X. strumarium interference.Thus, no-till significantly reduced X. strumarium emer-gence and seed production potential while increasing po-tential of S. obtusifolia.
In 1993 S. obtusifolia seedling emergence was similarunder both tillage conditions while X. strumarium seed-ling emergence continued to decline under no-till condi-tions (Table 1). Percent emergence from the seed bankincreased the second year after initial seed deposition toapproximately 19% for both species under tilled condi-tions. However, under no-till conditions X. strumariumemergence declined to only 0.03% while S. obtusifoliaemergence increased to 14%, from 0.2% the previousyear. The equivalent seedling emergence for S. obtusifoliaunder both tillage conditions indicates that once a soilseed bank reaches a certain level, only a given number ofseeds will emerge due to the number of safe sites (Harper,1977).
In 1994, the loss of S. obtusifolia seed through emer-gence under no-till was two times greater than under tilledconditions (Table 1). Thus, the initial delay in seed emer-gence under no-till conditions was being corrected by seedsgetting better soil-seed contact, allowing germination ofreadily germinable seeds. Emergence of X. strumariumwas negligible regardless of tillage. Not allowing X.strumarium to reseed following initial seed productionresulted in 29% emergence over a three-year period un-der tilled conditions; however, only 1% germinated underno-till conditions. S. obtusifolia emergence (34%) overthe three years was similar to that of X. strumarium undertilled conditions; however, under no-till conditions, 24%of the S. obtusifolia seed emerged. S. obtusifolia seedswere still showing a strong emergence pattern in 1994,indicating that S. obtusifolia has a harder seed coat thanX. strumarium.
The estimated S. obtusifolia seed remaining in the soilafter three years was 906 and 1,042 seeds per m2 undertilled and no-tilled conditions, respectively (Table 1), orby soil sampling 54 and 72% of the estimated seed bankunder tilled and no-tilled conditions, respectively. Germi-nation tests indicated that 100% of these seeds were vi-able and would germinate. Seed loss averaged 46 and 28%under tilled and no-tilled conditions, respectively. The es-timated number of X. strumarium achenes remaining inthe soil averaged 756 and 1,058 achenes per m2 undertilled and no-tilled conditions, respectively (Table 1). Un-der intraspecific conditions, seed reserve in the soil esti-mated by soil sampling was 65 and 93% of the achenesremaining under tilled or no-tilled conditions, or a 35 and7% loss, respectively. Under interspecific interference,
there was only a 10 and 5% bur loss under tilled and no-tilled conditions, respectively (data not shown). The in-creased loss under intraspecific conditions was probablydue to more immature seeds being produced under highdensities in tilled plots and greater moisture stress in no-till. None of the remaining achenes were viable.
DISCUSSION
The loss of seeds and burs was due to decay, predation,dispersal, immature seed, mechanical destruction and sam-pling error (Ball and Miller, 1989; Fenner, 1985; Kremerand Spencer, 1989). The higher loss under tilled condi-tions indicates that microbial decay and insect predationincrease with greater soil seed contact.
Emergence potential is critical in terms of competi-tiveness because the species emerging first has the poten-tial to dominate throughout the season. A high percentemergence early in the season is also an advantage in termsof colonizing an area ahead of other competitors. Thedominance of X. strumarium over S. obtusifolia underconventional tillage is due to the following: 1) tillage cre-ates an adequate seedbed for both species, but X.strumarium grows faster than S. obtusifolia and shades S.obtusifolia plants earlier, reducing S. obtusifolia growthand emergence; 2) the dispersal ability of X. strumariumis much greater than that of S. obtusifolia, so X.strumarium can invade the S. obtusifolia area; 3) X.strumarium has a longer vegetative growth period than S.obtusifolia, allowing a longer competitive period; and 4)X. strumarium seedling emergence is greater than that ofS. obtusifolia during the first emergence flush. However,a large number of S. obtusifolia seed remained in the soilfrom initial seed production. So, if X. strumarium is con-trolled, S. obtusifolia seeds that remain in the soil profilewill have a chance to emerge and cause a new weed prob-lem for the producer.
S. obtusifolia was as competitive as X. strumariumunder no-till conditions. In 1992, it was expected that S.obtusifolia would be the dominant species within the nextone or two years under no-till conditions, and 1993 and1994 results verified that observation. In fact, S.obtusifolia became the dominant species because X.strumarium burs needed adequate soil-seed contact forgermination. The bur prickles prevented soil-seed contactunder no-till conditions. In contrast, S. obtusifolia seed issmaller and has a smooth, waxy surface for better soilcontact and can penetrate soil cracks for improved germi-nation. Thus, the S. obtusifolia plant population increasedover the years, while the X. strumarium plant populationwas reduced under no-till.
Seed viability and germination tests indicated that theX. strumarium soil seed bank was reduced tremendouslyone to three years after initial seed deposition and re-maining X. strumarium achenes were very sensitive to

ARKANSAS AGRICULTURAL EXPERIMENT STATION SPECIAL REPORT 186
86
decay in or on the soil surface. The loss of viability re-sults in a quick depletion of the X. strumarium soil seedbank. The S. obtusifolia soil seed bank was not depletedafter three years. S. obtusifolia seeds have hard seed coatsand are more resistant to decay than X. strumarium bursin or on the soil surface. Thus, S. obtusifolia can pose amore serious problem than X. strumarium, especially asno-till practices are adopted.
LITERATURE CITED
Ball, D.A., and S.D. Miller. 1989. A comparison of techniques forestimation of arable soil seed banks and their relationshp to weedflora. Weed Research 29:365-372.
Egley, G.H., and J.M. Chandler. 1978. Germination and visability ofweed seeds after 2.5 years in a 50-year buried seed study. Weed
Science 26:230-239.Elmore, C.D. 1986. Weed survey. Southern Weed Science Society
Research Report 39:136-158.Fenner, M. 1985. Seed ecology. Chapman and Hall Ltd, London New
York.Harper, J.L. 1977. The population biology of plants. Academic Press,
London.Kremer, R.J., and N.R. Spencer. 1989. Impact of a seed-eating insect
and microorganisms on velvetleaf seed viability. Weed Science37: 211-216.
Monks, D.W. and L.R. Oliver. 1988. Interactions between soybean(Glycine max) and selected weeds. Weed Science. 36:770-774.
Roberts, H.A., and J.E. Neilson. 1981. Changes in the soil seed bankof four long-term crop/herbicide experiments. Journal of AppliedEcology 18:661-668.
Table 1. Effect of tillage on X. strumarium and S. obtusifolia seed bank potentialafter four years averaged over interference level.
Tillage Initial Plants Seedlings SeedsSpecies level seed deposition 1992 1993 1994 remaining
-------------------------------------------------------------------no/m2-------------------------------------------------------------X. strumarium 1,072
Till 165 150 1 756No-till 10 4 1 1,058
S. obtusifolia 1,370Till 202 219 44 906
No-till 29 194 105 1,042LSD(5%) 100 120 50 250
Table 2. Effect of tillage on X. strumarium and S. obtusifoliaseed production in 1992 (LSD1-to compare species orinterference levels at same tillage level and LSD2-to
compare same species or interference at different tillagelevels).
Tillage Interference levelSpecies level Intraspecific Interspecific
---------no./m2--------X. strumarium Till 880 780
No-till 510 420S. obtusifolia Till 8,940 920
No-till 1,930 1,290LSD 1 (5%) 1,800 and LSD 2 (5%) 2,000
PROCEEDINGS 21ST ANNUAL SOUTHERN CONSERVATION TILLAGE CONFERENCE FOR SUSTAINABLE AGRICULTURE
87
INTRODUCTION
hange in the agricultural arena–as in electronics,computers, etc.–has been rampant the past fewyears. Change has closed many doors and opened
numerous others, especially in the past 10 years. Publicsector budgets have been scrutinized and have gone underthe knife (in some cases, maybe we should say the ax).Support for traditional programs such as the CooperativeExtension Service and applied research has dwindled.
Industry in now picking up many of the responsibilitiesonce filled by university extension. Pioneer Hi-Bred, Inc.,has had an Agronomy Service group for about 30 years inthe Corn Belt. Here in the South we have had an AgronomyService group for less than 10 years. Farmers and dealerscall on our agronomists at an increasing frequency as theyseek answers to all kinds of crop production questions.I’m sure that other industries have seen the same increasein demand on their technical service staff.
What does all this mean? To agriculture? To farmers?To consumers? To all of us? I don’t have all the answers tothese questions. However, I may have some of the an-swers.
As we look at the role of industry in conservation till-age and sustainable agriculture, I will highlight only a fewkey points. Long-term soil productivity is dependent to alarge extent on soil conservation. Soil conservation, inturn, is dependent upon various kinds of conservation till-age, including no-tillage. Conservation tillage is here tostay, and sustainable agriculture is what we are all about.We are told the world population will reach about 8 bil-lion around the middle of the 21st century. That is roughly60% more people requiring food, fiber and other resources.The standard of living is improving for many of the devel-oping nations around the world, and the demand for food,fiber and services will increase faster than the populationgrowth. Agriculture is the foundation for sustaining thatgrowth, and American agriculture can and should be lead-ing the charge.
Now, let’s focus a little more and look at some keypoints I will cover. 1) We should all work for the bestinterest of farmers–and ultimately for the consumer. 2)Industry is where the rubber meets the road. We are the
force in contact with the farmer and at the same time havethe ability to communicate with the public. 3) In industrywe can promote, educate and support conservation tillageand sustainable agriculture. 4) We are international in scopeand infrastructure and can influence attitudes and prac-tices around the world. Now, let’s consider each of thesepoints in more detail.
FARMERS AND CONSUMER INTEREST
We in agriculture all work for the farmer and ultimatelythe consumer. If we don’t work in the best interest of ourcustomer, the farmer, we will not have a customer. This istrue for industry, and it is true for university extension,university research and other public sector providers ofinformation and services.
Too frequently, industry is portrayed as the “big badmonster” out to take advantage of the consumer. Profit isdepicted as bad. Profit is what supports the research tobring new technologies and better crops on line. Thesenew technologies and better crops enhance the farmer’sposition in the marketplace and also provide a more reli-able food and fiber supply forthe world. Practices andpolicies that ensure a continuing productive agricultureare essential to meeting the demands of a growing andmore prosperous world citizenry.
We have a responsibility to keep our food supply safeand our environment healthy, through wise and proper useof all crop inputs and management practices. The con-sumer–the public–ultimately determines how well we aredoing in maintaining a safe food supply and how well wecommunicate that fact to the public. We have a majorresponsibility to educate the public about the real issuesand the facts, as we know them, related to safe and effec-tive food and fiber production.
We in industry must do an even better job than we aredoing to counter the negative press leveled at agriculturein general and, more specifically, at farmers and industry.Much of the negative comment comes from individuals orgroups with little knowledge of crop production. Theirknowledge of fertilizer nutrients, chemical and other in-puts is limited. We can work to change that through ourpublic relations efforts. We must, however, be carefulthat we present truth and fact. We cannot hide the dangerswhere they exist. Honesty is essential if we are to impactthe attitudes of those with negative opinions about agri-culture.
1Field Sales Agronomy Manager, Pioneer Hi-Bred, Inc., Huntsville, AL.Presented at the 1997 Conservation Tillage Convention, Gainesville, Florida,but arrived too late for inclusion in the 1997 Proceedings.
THE ROLE OF INDUSTRY IN CONSERVATION TILLAGEAND SUSTAINABLE AGRICULTURE
Robert G. Palmer1
C
ARKANSAS AGRICULTURAL EXPERIMENT STATION SPECIAL REPORT 186
88
INDUSTRY COMMUNICATES
Industry is where the rubber meets the road. We havemore direct contact with the farmers than any other group.We deliver to them the products, services and informationthey want and need. We have the infrastructure to reachvirtually every farmer in the country. We also have theability to provide the equipment, chemicals, fertilizers,seeds, services and information they need to be success-ful. We have an excellent opportunity to promote and as-sist in the adaption of responsible stewardship through theuse of proper conservation practices. Our people are trainedand experienced to help growers understand the need forand the economic value of using best management prac-tices in most situations.
Chemical and equipment companies develop and pro-duce products designed for conservation tillage systems.New products are continually coming to the market, prod-ucts designed to do a better job conserving residues whileproviding an ideal seedbed for proper seed-to-soil con-tact. Precision farming and global positioning are nowproviding more information about soil variability, weedinfestations, variability in yields and other factors affect-ing crop production. Along with this information, thesetechnologies provide increased management opportunitieswithin individual fields and across farming operations. Seedcompanies are using new technologies in plant breedingto develop crops that reduce the reliance on insecticidesand are providing herbicide alternatives that are less threat-ening to the environment and to our water supplies. Re-search expenditures on all these new products and tech-nologies are tremendous.
Because of reductions in appropriations, many univer-sities have had to reduce their support for extension andtheir emphasis on applied research. Farmers therefore aremore frequently looking to industry for information andassistance in crop management.
INDUSTRY PROMOTES, EDUCATESAND SUPPORTS
Industry plays an important role in promoting soil andwater conservation. Many companies promote conserva-tion tillage and sustainable agriculture through the prod-ucts they develop, produce and market. Improved productsenable farmers to better manage their cropping systems,including the use of conservation tillage to protect soiland water. Other companies promote conservation in con-junction with products they sell, even though those prod-ucts may not be directly involved in soil conservation orsoil productivity. Seed companies are an example of thistype of industry. Seed is not directly related to conserva-tion tillage, unless one considers emergence and seedlingvigor. However, we promote soil and water conservation
as a part of crop management training and information weprovide to dealers and to farmers.
Industry personnel conduct hundreds of meetings eachyear and visit thousands of farmers on their farm. Themeetings may be crop management meetings for farmersor they may be information meetings for dealers. Industrytechnical representatives or agronomists are contacts serv-ing as sources of information for agricultural publicationsand other media types. These contacts provide numerousopportunities for companies to promote responsible stew-ardship of land and water. Within Pioneer Hi-Bred, Inc.,each year we present an “Agronomist of the Year” awardto an outstanding agronomist in our company. One crite-rion for earning this award is evidence that the agronomisthas worked to foster environmental and conservation edu-cation.
We can support individual farmers, farm groups, com-munity groups, state agencies, universities, governmentagencies and other groups as they promote and/or practicesoil and water conservation and responsible stewardshipof our nation’s resources. One great example is the Con-servation Tillage Information Center (CTIC), spawned byindependent companies with a vision, including ICI, DOW,Tye, Pioneer and others, along with government agencies.These private companies and government agencies coop-erated to establish a clearinghouse for conservation infor-mation in the early to mid-1980s. The CTIC is flourishingand continues to provide conservation tillage informationand support to individuals and groups nationwide.
As recently as the spring of 1997, a cooperative ar-rangement was announced between USDA and six nationalagricultural companies. One of these companies was Pio-neer Hi-Bred, Inc. The others include Cargill, ConAgra,Farmland Industries, Monsanto and Terra Industries. Theyare providing financial support to the USDA for promot-ing landowners’ installation of conservation buffers to pro-tect waterways.
John Deere supported publication of a ConservationTillage Handbook several years ago. I served as an editorfor this project when I was on staff at Western IllinoisUniversity. ICI a few years ago cooperated with the CTICin promoting conservation tillage with videos and TV com-mercials. Many other companies have supported similarprojects through the years. These few I have named serveonly as examples of the role industry has played and isplaying in the support and promotion of conservation till-age.
INDUSTRY PLAYS AN INTERNATIONAL ROLE
Agriculture has become increasingly more global overthe past 10 or so years. That trend is continuing. Mostmajor agricultural companies are international in scopeand infrastructure. Because of this international presence,they have the opportunity to influence attitudes, practices

PROCEEDINGS 21ST ANNUAL SOUTHERN CONSERVATION TILLAGE CONFERENCE FOR SUSTAINABLE AGRICULTURE
89
and policies around the world as they conduct business. Itis an opportunity to promote wise resource use and con-servation to maintain a productive agriculture around theworld. In the mid-70s I spent 18 months in Brazil workingwith the Federal University of Santa Maria in Rio Grandedo Sul. I was there to help them strengthen their soil con-servation program. At that same time, ICI was workingclosely with local farmers in that part of Brazil, providingtechnical assistance in the field as those farmers began toadopt no-till practices in soybean (Glycine max L. Merr.)production.
Loren Kruse of Successful Farming, has said that “Ifthe entire world ate as well as we do in the top eightexporting countries, we’d increase exports by four times!Those of us in agriculture want to see those countriesdevelop and earn money....and spend it for our food prod-ucts.” We can help ourselves if we help those countriesdevelop and maintain their ability to produce food andfiber.
SUMMARY
Industry has a role in conservation tillage. We havebeen seriously taking responsibility for that role for manyyears and continue doing so today. You may ask why we,in industry, are interested in supporting conservation till-age and other such endeavors. There are two major rea-sons. 1) Profit or business. We want to stay in businessand that requires a long look. It requires us to focus onwhat is best for our customers–farmers–in the long haul.We must help keep farmers profitable to maintain a mar-ket for our products and services. 2) A benevolent spirit.We want to be good community citizens. Industry or com-panies are made up of people. As people, we too are inter-ested in creating a better world. We live in this world. Ourchildren live in this world. Many of us have grandchildrenwho live in this world. We want the generations descend-ing from us to have at least as good a world as we have inwhich to live and raise families.

ARKANSAS AGRICULTURAL EXPERIMENT STATION SPECIAL REPORT 186
90
INTRODUCTION
arly planting of corn in Mississippi has the poten-tial for higher yields because corn matures in awindow of ideal temperature and rainfall. With the
opportunity to forward contract corn above $2.50/bu, moreacres are being planted in Mississippi. The window forcorn planting becomes narrow considering the days avail-able for field work. Pendleton and Grogan (1966) recom-mend planting corn in Mississippi from late March toearly April. Since Mississippi is over 300 miles north tosouth, the dates for all parts of the state have to be ad-justed accordingly. Soil temperature at corn planting timeapproximates 50 degrees (Genter and Jones, 1970). Wefind that we get not only higher yields, but less lodging,disease and insect damage when corn is planted early. Cornplanting dates for the 1990’s may have earlier plantingdates due to new hybrids and herbicides. However, therule of thumb for corn planting is late March to earlyApril.
The primary reason for early planting is better yields.Other advantages can be enumerated and are as follows: 1)less lodging due to shorter plants and lower ears, 2) earlyplant growth before seasonal evapo-transpiration rates arehigh, 3) early pollination allows corn to pollinate beforethe hot, dry days of July and August and during the longestdays of the year (around 21 June), 4) more available mois-ture in early summer than late summer, and 5) grain driessooner allowing earlier harvest (Pendleton and Grogan1966).
Weather data show an average of eight days in March inwhich field conditions are suitable for work in northernMississippi. This narrows the window for corn plantingbetween late March and early April. The objective of thisstudy was to determine if corn planted during mid-Febru-ary and early March would have yields comparative tothose of corn planted during late March and early April.
METHODS AND MATERIALS
Five planting dates were established in 1995 to deter-mine the optimum date to achieve maximum grain yield.Planting dates began 15 February and ended 15 April intwo-week intervals, although dates varied slightly becauseof field conditions. A corn hybrid of Pioneer 31652 was
chosen from past results in variety trials for Mississippi.The seeding rate for each date was 27,500 seed/acre in38-in. rows. The site selected for this study was at theNorth Mississippi Branch Experiment Station in HollySprings, Mississippi, on a Grenada silt loam soil with 0-2% slope. Crop residue in 1995 for the test site was lessthan 5%. Experimental design of the study is randomizedcomplete block (RCB) with four replications. Each plotconsisted of four rows on 38-in. spacing planted no-till(NT). A pre-plant burn-down herbicide of Gramoxone(paraquat) and nonionic surfactant was broadcast appliedat 0.9375 lb ai /acre and 0.5% by volume, respectively. Agranular blend fertilizer was surface applied according tosoil test for 15-bu yield. Preemergence herbicides Aatrex(atrazine) and Dual (metolachlor) were broadcast appliedafter planting at 2.0 and 1.0 lb ai/acre, respectively. Apost-emergence application of Accent (nicosulfuron) wasapplied at 0.67 oz/acre as needed for control ofjohnsongrass. Liquid nitrogen in the form of UAN was cutin at 150 lb with a ground rig when the corn plant wasapproximately 20 in. tall. All plots were harvested with acombine modified for plot harvest. The two center rowsof the four-row plots were harvested, and grain yields wereconverted to bu/acre.
RESULTS AND DISCUSSION
It should be noted that these planting dates were estab-lished for northern Mississippi. Planting dates should beconsidered depending upon region and climatic conditions.All yields were based on small plots, not large-farm dem-onstrations.
Preliminary results of five planting dates (PD) of cornindicate that maximum grain yields were achieved for thefirst week of April when averaged over three years (Table1). Average yield from 1995-1997 was 125 bu/acre. Therewas, however, an average decrease of 20% in yield or 25bu/acre after the first week in April. Three-year yield av-erages for mid-February and early March were 56 and28% lower than for the 1 April planting date. All plantingdate yields for 1997 were reduced significantly.
Data indicated that yields were lower after two years ofcontinuous no-tilling regardless of planting date of corn;however, no visible signs were noted of insects or diseasepresent from the practice of continuous no-till corn pro-duction on these plots. A significant yield reduction wasnoted between 1 April and 15 April planting dates in 1995
EVALUATION OF CORN PLANTING DATES FOR NORTHERN MISSISSIPPI
J.R. Saunders and J.R. Johnson1
E
1Mississippi State University.2The mention of a trademark or proprietary product does not imply endorsementby MSU or MAFES.
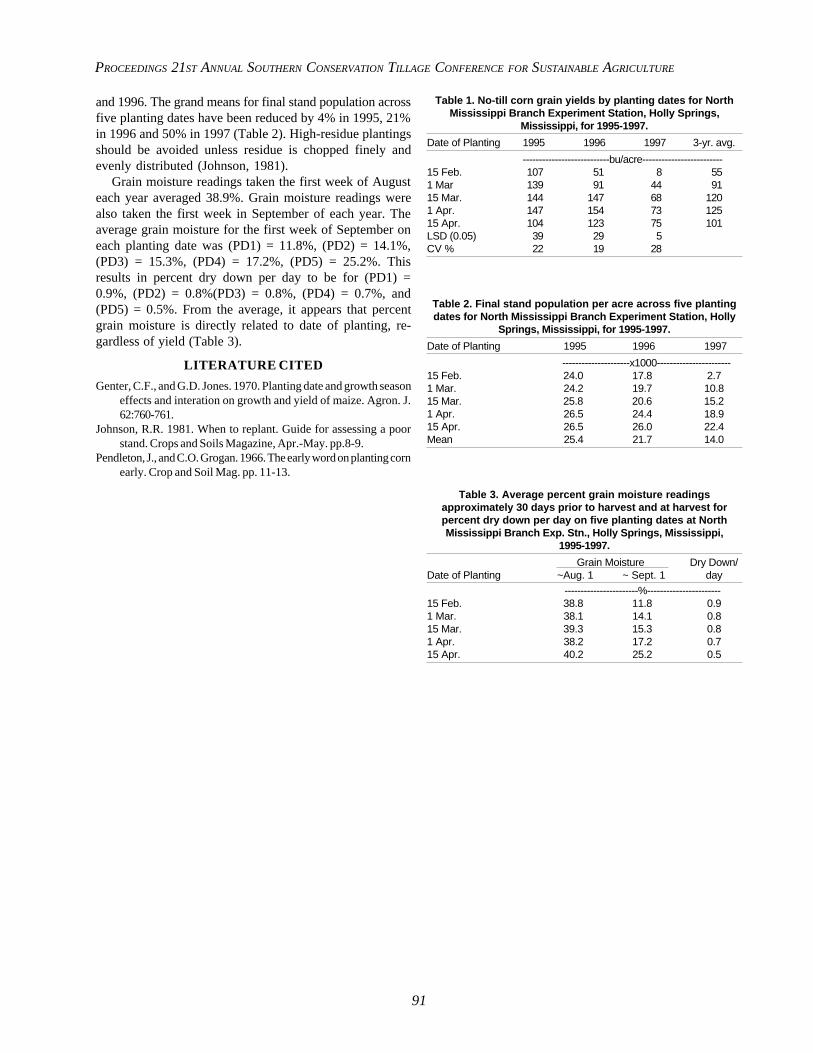
PROCEEDINGS 21ST ANNUAL SOUTHERN CONSERVATION TILLAGE CONFERENCE FOR SUSTAINABLE AGRICULTURE
91
and 1996. The grand means for final stand population acrossfive planting dates have been reduced by 4% in 1995, 21%in 1996 and 50% in 1997 (Table 2). High-residue plantingsshould be avoided unless residue is chopped finely andevenly distributed (Johnson, 1981).
Grain moisture readings taken the first week of Augusteach year averaged 38.9%. Grain moisture readings werealso taken the first week in September of each year. Theaverage grain moisture for the first week of September oneach planting date was (PD1) = 11.8%, (PD2) = 14.1%,(PD3) = 15.3%, (PD4) = 17.2%, (PD5) = 25.2%. Thisresults in percent dry down per day to be for (PD1) =0.9%, (PD2) = 0.8%(PD3) = 0.8%, (PD4) = 0.7%, and(PD5) = 0.5%. From the average, it appears that percentgrain moisture is directly related to date of planting, re-gardless of yield (Table 3).
LITERATURE CITED
Genter, C.F., and G.D. Jones. 1970. Planting date and growth seasoneffects and interation on growth and yield of maize. Agron. J.62:760-761.
Johnson, R.R. 1981. When to replant. Guide for assessing a poorstand. Crops and Soils Magazine, Apr.-May. pp.8-9.
Pendleton, J., and C.O. Grogan. 1966. The early word on planting cornearly. Crop and Soil Mag. pp. 11-13.
Table 1. No-till corn grain yields by planting dates for NorthMississippi Branch Experiment Station, Holly Springs,
Mississippi, for 1995-1997.
Date of Planting 1995 1996 1997 3-yr. avg.
---------------------------bu/acre-------------------------15 Feb. 107 51 8 551 Mar 139 91 44 9115 Mar. 144 147 68 1201 Apr. 147 154 73 12515 Apr. 104 123 75 101LSD (0.05) 39 29 5CV % 22 19 28
Table 2. Final stand population per acre across five plantingdates for North Mississippi Branch Experiment Station, Holly
Springs, Mississippi, for 1995-1997.
Date of Planting 1995 1996 1997
---------------------x1000-----------------------15 Feb. 24.0 17.8 2.71 Mar. 24.2 19.7 10.815 Mar. 25.8 20.6 15.21 Apr. 26.5 24.4 18.915 Apr. 26.5 26.0 22.4Mean 25.4 21.7 14.0
Table 3. Average percent grain moisture readingsapproximately 30 days prior to harvest and at harvest forpercent dry down per day on five planting dates at NorthMississippi Branch Exp. Stn., Holly Springs, Mississippi,
1995-1997.
Grain Moisture Dry Down/Date of Planting ~Aug. 1 ~ Sept. 1 day
-----------------------%-----------------------15 Feb. 38.8 11.8 0.91 Mar. 38.1 14.1 0.815 Mar. 39.3 15.3 0.81 Apr. 38.2 17.2 0.715 Apr. 40.2 25.2 0.5

ARKANSAS AGRICULTURAL EXPERIMENT STATION SPECIAL REPORT 186
92
ABSTRACT
his research was conducted in 1996 and 1997 on aDothan sandy loam (fine, loamy siliceous, thermicPlinthic Kandiudults) located at the North Florida
Research and Education Center (NFREC), Quincy, Florida.The objective was to compare 36-in. row-spaced cottonplanted with a Ro-till planter vs ultra-narrow row cotton(UNR) with 7-in. row width planted with the Great Plainsno-till drill (both planted in minimum and conventionaltillage). Four nitrogen treatments (0, 60, 120 and 180 lbN/acre) were applied in 1996 and three N rates (0, 60,120 lb N/acre) in 1997. Higher cotton emergence wasobtained on conventional row width in strip till than UNR.Increased N rates generally increased number of bolls/plant for both row treatments with higher increase of bollnumber in conventional row width when compared to UNR.Significantly higher yields of cotton were obtained forUNR when compared to conventional rows with the high-est lint cotton yield on UNR at 120 lb N/acre.
INTRODUCTION
Cotton production has increased rapidly in Florida, from49,000 acres in 1991 to 98,000 acres in 1996 with theproduction of 73,000 bales (1 bale = 480 lb) in 1991 to130,000 bales in 1996. According to Touchton and Reeves(1988), conservation tillage systems have a beneficial ef-fect on cotton production in the sandy coastal plain soilsof the southeastern states, but the formation of tillagepans due to soil compaction has also been recognized as apossible limitation in these soils. Torbert and Reeves(1991) showed that, in years of below-normal rainfall dur-ing the growing season, strip tillage (no-till plus in-rowsubsoiling) was found to maintain the highest seed cottonyield. Fertilizer-N application had no effect on cottonyields in an extremely dry growing season, suggesting thatthe beneficial effect of N fertilizer may be limited undersuch conditions.
Studies conducted near Stoneville, Mississippi, on theUNR cotton showed no effect of row spacing on seedcotton yields (Heitholt et al., 1993). The results suggestthat some agronomic traits of cotton might be expected tobe similar regardless of row spacing; therefore, manage-ment practices, such as recommendations for the rate and
timing of defoliation chemicals, do not necessarily needmodification in narrow row systems.
According to the study conducted by Torbert and Reeves(1994) increasing N application increased cotton biomassand decreased lint percentage. In a dry year, 1990, non-traffic decreased seed cotton yield from 1500 to 1360kg/ha (1335 to 1210 lb/acre, respectively) while tillagehad no significant effects on cotton yield components.Above-normal rainfall and the strip-till with non-traffictreatment gave the highest seed cotton yield of 2749 kg/ha (2445 lb/acre) and the greatest fertilizer N uptake effi-ciency (35%). Results indicate that the detrimental ef-fects of traffic on N uptake efficiency may be reducedwith conservation tillage systems and that higher fertilizerN application rates may not be needed for conservationtillage practices such as strip-till in Coastal Plain soils.
The objective of this research was to compare mini-mum and conventional tillage for cotton planted in 36-in.and 7-in. row spacings with different N rates on cotton.
MATERIALS AND METHODS
These studies were conducted on a Dothan sandy loam(fine, loamy siliceous, thermic Plinthic Kandiudults) lo-cated on the NFREC, Quincy, Florida, in 1996 and 1997.The experimental design was a randomized complete blockwith four replications. Plot size was 40 by 12 ft for con-ventionally planted cotton and 40 by 20 ft for UNR cottonin 1996 and 20 by 6 ft for all plots in 1997.
Experiment Conducted in 1996Paymaster 1244 Roundup Ready/Bt (RR/Bt) cotton was
planted in UNR following wheat in no-till with the GreatPlains no-till drill at 2 seeds/ft of row (7-in. row spacing)and with a Brown Row-till implement and KMC plantersat 3 to 4 seeds/ft of row (36-in. row spacing) 12 July1996. On 9 August cotton was side-dressed with 60 and120 lb N/acre (treatments with the rate of 180 lb N/acregot only 120 lb N/acre) using a Gandy Fertilizer spreaderon UNR cotton and an FP Fertilizer spreader on 36-in.rows. An additional rate of 60 lb N/acre was applied onthe treatment with 180 lb N/acre 4 September. Cotton wasbroadcast sprayed with Roundup at 1 pt/acre + Induce at 1pt/25 gal H
2O 20 August. On 16 September cotton was
broadcast sprayed with Dipel ES at 1 pt/acre + Lannate at1 pt/acre to control the fall armyworms on cotton. Cottonwas defoliated with Prep at 2 pt/acre + Harvade at 0.5 pt/acre + Roundup at 0.5 pt/acre + crop oil at 1 pt/acre 30
CONVENTIONAL VS. ULTRA-NARROW ROW (UNR) COTTONIN DIFFERENT TILLAGE SYSTEMS
P.J. Wiatrak, D.L. Wright, J.A. Pudelko, B. Kidd and W. Koziara1
1 Wiatrak, Wright and Kidd, North Florida Res. and Educ. Center, Quincy,FL 32351-9529. Pudelko and Koziara, Agric. Univ. Inst. of Soil Cult. andPlant Prod., Mazowiecka 45/46, 60-623 Poznan, Poland.
T
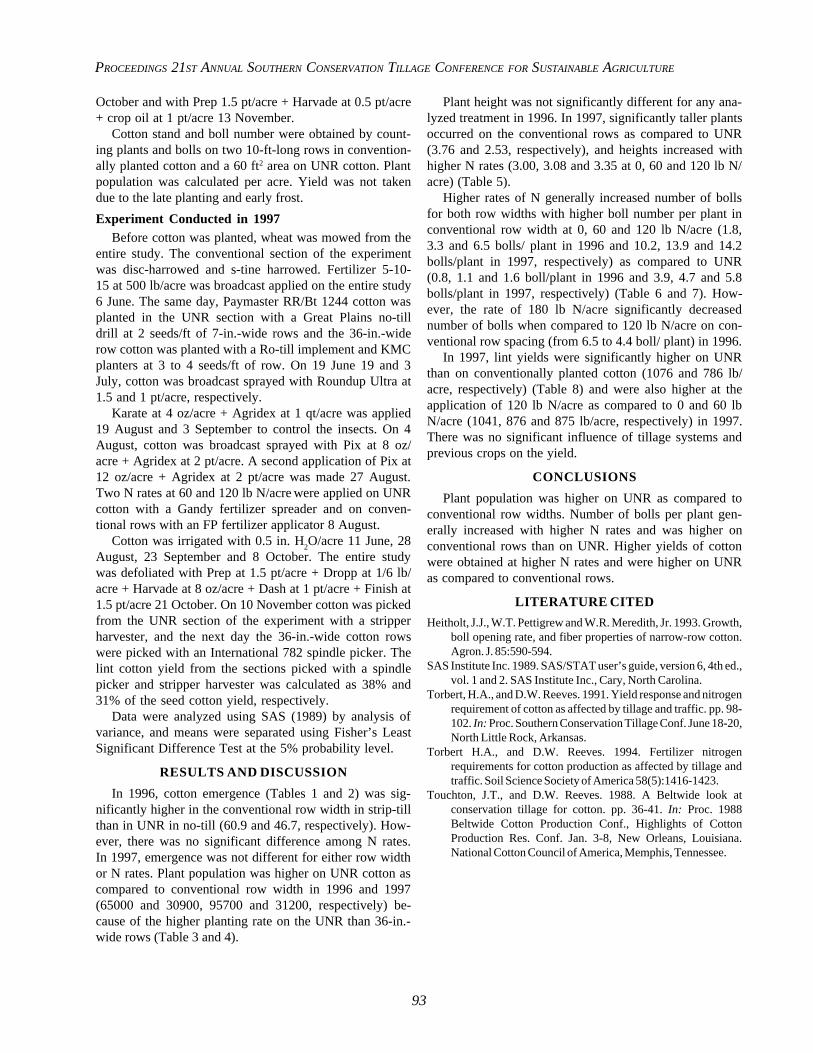
PROCEEDINGS 21ST ANNUAL SOUTHERN CONSERVATION TILLAGE CONFERENCE FOR SUSTAINABLE AGRICULTURE
93
October and with Prep 1.5 pt/acre + Harvade at 0.5 pt/acre+ crop oil at 1 pt/acre 13 November.
Cotton stand and boll number were obtained by count-ing plants and bolls on two 10-ft-long rows in convention-ally planted cotton and a 60 ft2 area on UNR cotton. Plantpopulation was calculated per acre. Yield was not takendue to the late planting and early frost.
Experiment Conducted in 1997Before cotton was planted, wheat was mowed from the
entire study. The conventional section of the experimentwas disc-harrowed and s-tine harrowed. Fertilizer 5-10-15 at 500 lb/acre was broadcast applied on the entire study6 June. The same day, Paymaster RR/Bt 1244 cotton wasplanted in the UNR section with a Great Plains no-tilldrill at 2 seeds/ft of 7-in.-wide rows and the 36-in.-widerow cotton was planted with a Ro-till implement and KMCplanters at 3 to 4 seeds/ft of row. On 19 June 19 and 3July, cotton was broadcast sprayed with Roundup Ultra at1.5 and 1 pt/acre, respectively.
Karate at 4 oz/acre + Agridex at 1 qt/acre was applied19 August and 3 September to control the insects. On 4August, cotton was broadcast sprayed with Pix at 8 oz/acre + Agridex at 2 pt/acre. A second application of Pix at12 oz/acre + Agridex at 2 pt/acre was made 27 August.Two N rates at 60 and 120 lb N/acre were applied on UNRcotton with a Gandy fertilizer spreader and on conven-tional rows with an FP fertilizer applicator 8 August.
Cotton was irrigated with 0.5 in. H2O/acre 11 June, 28
August, 23 September and 8 October. The entire studywas defoliated with Prep at 1.5 pt/acre + Dropp at 1/6 lb/acre + Harvade at 8 oz/acre + Dash at 1 pt/acre + Finish at1.5 pt/acre 21 October. On 10 November cotton was pickedfrom the UNR section of the experiment with a stripperharvester, and the next day the 36-in.-wide cotton rowswere picked with an International 782 spindle picker. Thelint cotton yield from the sections picked with a spindlepicker and stripper harvester was calculated as 38% and31% of the seed cotton yield, respectively.
Data were analyzed using SAS (1989) by analysis ofvariance, and means were separated using Fisher’s LeastSignificant Difference Test at the 5% probability level.
RESULTS AND DISCUSSION
In 1996, cotton emergence (Tables 1 and 2) was sig-nificantly higher in the conventional row width in strip-tillthan in UNR in no-till (60.9 and 46.7, respectively). How-ever, there was no significant difference among N rates.In 1997, emergence was not different for either row widthor N rates. Plant population was higher on UNR cotton ascompared to conventional row width in 1996 and 1997(65000 and 30900, 95700 and 31200, respectively) be-cause of the higher planting rate on the UNR than 36-in.-wide rows (Table 3 and 4).
Plant height was not significantly different for any ana-lyzed treatment in 1996. In 1997, significantly taller plantsoccurred on the conventional rows as compared to UNR(3.76 and 2.53, respectively), and heights increased withhigher N rates (3.00, 3.08 and 3.35 at 0, 60 and 120 lb N/acre) (Table 5).
Higher rates of N generally increased number of bollsfor both row widths with higher boll number per plant inconventional row width at 0, 60 and 120 lb N/acre (1.8,3.3 and 6.5 bolls/ plant in 1996 and 10.2, 13.9 and 14.2bolls/plant in 1997, respectively) as compared to UNR(0.8, 1.1 and 1.6 boll/plant in 1996 and 3.9, 4.7 and 5.8bolls/plant in 1997, respectively) (Table 6 and 7). How-ever, the rate of 180 lb N/acre significantly decreasednumber of bolls when compared to 120 lb N/acre on con-ventional row spacing (from 6.5 to 4.4 boll/ plant) in 1996.
In 1997, lint yields were significantly higher on UNRthan on conventionally planted cotton (1076 and 786 lb/acre, respectively) (Table 8) and were also higher at theapplication of 120 lb N/acre as compared to 0 and 60 lbN/acre (1041, 876 and 875 lb/acre, respectively) in 1997.There was no significant influence of tillage systems andprevious crops on the yield.
CONCLUSIONS
Plant population was higher on UNR as compared toconventional row widths. Number of bolls per plant gen-erally increased with higher N rates and was higher onconventional rows than on UNR. Higher yields of cottonwere obtained at higher N rates and were higher on UNRas compared to conventional rows.
LITERATURE CITED
Heitholt, J.J., W.T. Pettigrew and W.R. Meredith, Jr. 1993. Growth,boll opening rate, and fiber properties of narrow-row cotton.Agron. J. 85:590-594.
SAS Institute Inc. 1989. SAS/STAT user’s guide, version 6, 4th ed.,vol. 1 and 2. SAS Institute Inc., Cary, North Carolina.
Torbert, H.A., and D.W. Reeves. 1991. Yield response and nitrogenrequirement of cotton as affected by tillage and traffic. pp. 98-102. In: Proc. Southern Conservation Tillage Conf. June 18-20,North Little Rock, Arkansas.
Torbert H.A., and D.W. Reeves. 1994. Fertilizer nitrogenrequirements for cotton production as affected by tillage andtraffic. Soil Science Society of America 58(5):1416-1423.
Touchton, J.T., and D.W. Reeves. 1988. A Beltwide look atconservation tillage for cotton. pp. 36-41. In: Proc. 1988Beltwide Cotton Production Conf., Highlights of CottonProduction Res. Conf. Jan. 3-8, New Orleans, Louisiana.National Cotton Council of America, Memphis, Tennessee.

ARKANSAS AGRICULTURAL EXPERIMENT STATION SPECIAL REPORT 186
94
Table 1. Emergence of cotton at NFREC,Quincy, Florida, in 1996.
Nitrogen rate (lb N/acre)Row width 0 60 120 180 Avg.
in. ----------------------- % emergence -----------------------36 63.9 58.6 57.5 63.6 60.97 47.1 46.5 46.2 47.0 46.7
Avg. 55.5 52.5 51.9 55.3 53.8
LSD(0.05) for row width 6.69LSD(0.05) for nitrogen rate NSLSD(0.05) for row width x nitrogen rate NS
Table 2 Emergence of cotton at NFREC,Quincy, Florida, in 1997.
Nitrogen rate (lb N/acre)Row width 0 60 120 Avg
in. ----------------------- % emergence -----------------------36 57.1 66.7 60.3 61.47 67.1 74.1 64.8 68.7
Avg. 62.1 70.4 62.6 65.0
LSD(0.05) for row width NSLSD(0.05) for nitrogen rate NSLSD(0.05) for row width x nitrogen rate NS
Table 3. Plant population of cotton at NFREC,Quincy, Florida, in 1996.
Nitrogen rate (lb N/acre)Row width 0 60 120 180 Avg.
in. ----------------thousands/acre----------------36 32.5 29.8 29.2 32.3 30.97 65.7 64.8 64.4 65.5 65.1
Avg. 49.1 47.3 46.8 48.9 48.0
LSD(0.05) for row width 7.75LSD(0.05) for nitrogen rate NSLSD(0.05) for row width x nitrogen rate NS
Table 4. Plant population of cotton at NFREC,Quincy, Florida, in 1997.
Nitrogen rate (lb N/acre)Row width 0 60 120 Avg
in. ------------thousands/acre------------36 29.0 33.9 30.7 31.27 93.6 103.3 90.3 95.7
Avg. 61.3 68.6 60.5 63.5
LSD(0.05) for row width 14.6LSD(0.05) for nitrogen rate NSLSD(0.05) for row width x nitrogen rate NS
Table 5. Plant height of cotton at NFREC, Quincy, Florida,in 1997 (No significant differences in 1996).
Nitrogen rate (lb N/acre)Row width 0 60 120 Avg
in. --------------------- ft -----------------------36 3.53 3.77 3.97 3.767 2.47 2.40 2.73 2.53
Avg. 3.00 3.08 3.35 3.14
LSD(0.05) for row width 0.197LSD(0.05) for nitrogen rate 0.241LSD(0.05) for row width x nitrogen rate NS
Table 6. Number bolls on cotton at NFREC,Quincy, Florida, in 1996.
Nitrogen rate (lb N/acre)Row width 0 60 120 180 Avg
in. --------------- bolls/plant----------------36 1.8 3.3 6.5 4.4 4.07 0.8 1.1 1.6 1.3 1.2
Avg. 1.3 2.2 4.0 2.8 2.6
LSD(0.05) for row width 0.70LSD(0.05) for nitrogen rate 0.99LSD(0.05) for row width x nitrogen rate 1.40
Table 7. Number bolls on cotton at NFREC,Quincy, Florida, in 1997.
Nitrogen rate (lb N/acre)Row width 0 60 120 Avg
in. ---------------bolls/plant-----------------36 10.2 13.9 14.2 12.87 3.9 4.7 5.8 4.8
Avg. 7.0 9.3 10.0LSD(0.05) for row width 1.02LSD(0.05) for nitrogen rate 1.25LSD(0.05) for row width x nitrogen rate ns
Table 8. The lint yields (lb) of UNR vs. conventionally plantedcotton at NFREC, Quincy, Florida, in 1997.
Row spacing - 7 in. Row spacing - 36 in.Strip-
N rate No-till Conv. Avg. till Conv. Avg. Avg
lb/acre N rate N rate0 827 1176 1001 826 677 751 87660 983 1046 1014 772 698 735 875120 1196 1227 1212 788 953 871 1041Avg. 1002 1150 1076 795 776 786 931
LSD(0.05)
for row spacing 97.7 LSD(0.05)
for tillage nsLSD
(0.05) for N 119.6 LSD
(0.05) for row spacing x tillage ns
LSD(0.05)
for row spacing x N ns LSD(0.05)
for tillage x N nsLSD
(0.05) for row spacing x
tillage x N 293.3

PROCEEDINGS 21ST ANNUAL SOUTHERN CONSERVATION TILLAGE CONFERENCE FOR SUSTAINABLE AGRICULTURE
95
ABSTRACT
his research was conducted in 1997 on a Dothansandy loam (fine, loamy siliceous, thermic PlinthicKandiudults) located at the North Florida Research
and Education Center (NFREC), Quincy, Florida. The ob-jectives of the study were to determine if Bt corn offersan advantage over temperate and tropical corn in late plant-ing, to compare silage and grain yields of corn over plant-ing dates and to monitor insect pressure of corn at eachplanting date. Tropical corn gave satisfactory grain andsilage yield, but grain yield dropped significantly after 15May. Temperate corn was devastated by insects in Juneand July planting as compared to Bt and tropical corn.Yields of Bt corn silage and grain were lower at laterplanting probably due to diseases rather than insects, butthis hybrid showed potential for late planting as comparedto temperate corn. Tropical corn had more insect damagethan Bt corn did but less disease, which allowed the tropi-cal to grow to maturity.
INTRODUCTION
The Southeast imports more than 50% of grain used bylivestock from the Midwest. Farmers need corn varietiesthat could be planted until 15 June to take advantage ofweather, to allow double cropping after wheat, winter graz-ing and winter vegetables and to have resistance to insectsand diseases. Corn is planted in Florida from 15 Februaryto 15 April, at which time it is discontinued due to fallarmyworms, corn earworm and diseases (rust, leaf blight).Having a wide planting window would allow better use ofsilage and grain storage, better utilization of planting andharvest equipment, spreading of labor to slower periods,better utilization of land and irrigation by multi-croppingand longer use of winter forages. Tropical corn has someinsect tolerance, generally good shuck coverage and gooddisease resistance. Hybrids that are full season (125 days)usually yield better and have better disease resistance andbetter shuck coverage as is found in tropical corn. Bt cornwould be useful for insect control for late plantings.
Corn is recognized as the “queen” of silage crops be-cause it is energy-rich for cattle and has high tonnage andhigh proportions of digestible nutrients and structural car-
bohydrates needed to maintain desired rumen function inhigh producing dairy animals (Johnson, 1991). It can beconsistently harvested and stored with only minimal lossof nutrients and dry matter. Corn is an outstanding, de-pendable crop when grown under irrigation when plantedearly in the deep South and is very adaptable to harvestingby mechanical systems.
Wright et al. (1991) showed that temperate corn plantedin early spring yielded more than tropical hybrids in bothgrain and silage. As planting dates were delayed, morereliable silage and grain yield were obtained from tropicalhybrids because of better tolerance to insects and disease(Wright et al., 1991). Corn developed in the tropics isnaturally more resistant to insect and disease (Martin,1991) than corn developed in temperate regions.
Fall armyworm [Spodoptera frugiperda (J. E. Smith)](Sprenkel, 1991) and corn earworm [Helicoverpa zea](Anderson and Linker, 1991) are among the most com-mon insects in corn and have the potential to adverselyaffect yields (especially late-planted crops). High non-economical rates of insecticides are needed to controlfall armyworms because the larvae feed in the whorl or inthe ear. Research has shown that it is possible to avoid fallarmyworm damage by early planting (Teare et al., 1991).
The objectives of the study were 1) to determine if Btcorn offers an advantage over temperate and tropical cornin late planting and 2) to compare silage and grain yieldsof corn over planting dates and to monitor insect pressureof corn at each planting date.
MATERIALS AND METHODS
The experiment was conducted in 1997 on a Dothansandy loam (fine, loamy siliceous, thermic PlinthicKandiudults) at the North Florida Research and EducationCenter, Quincy, Florida. Three varieties of Pioneer cornwere used to plant in the strip tillage: 3098 (tropical corn),31B13 (Bt corn) and 3223 (temperate corn). Corn wasplanted 21 April, 15 May, 16 June and 7 July. Prior toplanting, rows were ripped with a Ro-till implement, andthe entire study was broadcast sprayed with Roundup Ultraat 1 qt/acre + Induce at 2 qt/100 gal of water. Fertilizerwas broadcast applied at 500 lb/acre of 5-10-15 beforeplanting. All three varieties were planted with a cone planterat 24,000 plants/acre with the application of Thimet 15 G.Corn was broadcast sprayed with atrazine at 1 qt/acre whenit was 5 in. tall and side-dressed with 450 lb/acre of 34-0-
COMPARISON OF BT CORN TO NON BT USING STRIP TILLAGEAT FOUR PLANTING DATES
D.L. Wright, P.J. Wiatrak, D. Herzog, J.A. Pudelko and B. Kidd1
1D. L. Wright, P. J. Wiatrak, D. Herzog, and B. Kidd, North Florida Res. andEduc. Center, Quincy, FL 32351-9529; J. A. Pudelko, Agric. Univ. Inst. of SoilCult. and Plant Prod., Mazowiecka 45/46, 60-623 Poznan, Poland.
T
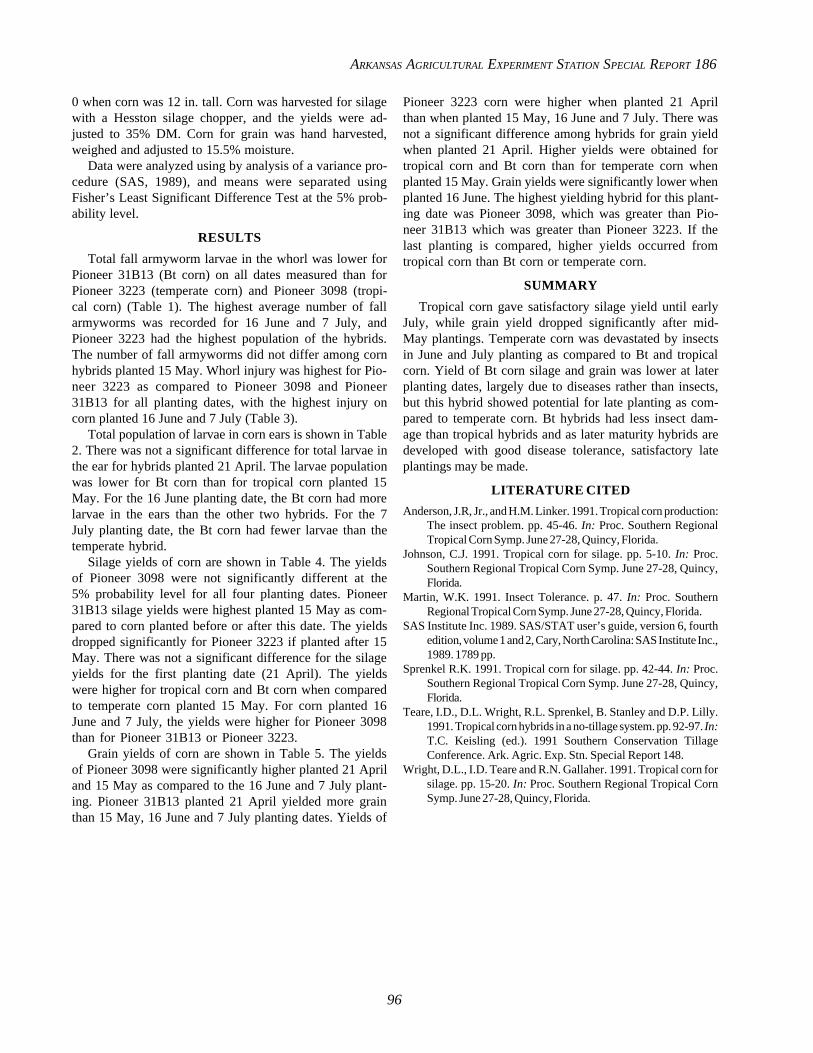
ARKANSAS AGRICULTURAL EXPERIMENT STATION SPECIAL REPORT 186
96
0 when corn was 12 in. tall. Corn was harvested for silagewith a Hesston silage chopper, and the yields were ad-justed to 35% DM. Corn for grain was hand harvested,weighed and adjusted to 15.5% moisture.
Data were analyzed using by analysis of a variance pro-cedure (SAS, 1989), and means were separated usingFisher’s Least Significant Difference Test at the 5% prob-ability level.
RESULTS
Total fall armyworm larvae in the whorl was lower forPioneer 31B13 (Bt corn) on all dates measured than forPioneer 3223 (temperate corn) and Pioneer 3098 (tropi-cal corn) (Table 1). The highest average number of fallarmyworms was recorded for 16 June and 7 July, andPioneer 3223 had the highest population of the hybrids.The number of fall armyworms did not differ among cornhybrids planted 15 May. Whorl injury was highest for Pio-neer 3223 as compared to Pioneer 3098 and Pioneer31B13 for all planting dates, with the highest injury oncorn planted 16 June and 7 July (Table 3).
Total population of larvae in corn ears is shown in Table2. There was not a significant difference for total larvae inthe ear for hybrids planted 21 April. The larvae populationwas lower for Bt corn than for tropical corn planted 15May. For the 16 June planting date, the Bt corn had morelarvae in the ears than the other two hybrids. For the 7July planting date, the Bt corn had fewer larvae than thetemperate hybrid.
Silage yields of corn are shown in Table 4. The yieldsof Pioneer 3098 were not significantly different at the5% probability level for all four planting dates. Pioneer31B13 silage yields were highest planted 15 May as com-pared to corn planted before or after this date. The yieldsdropped significantly for Pioneer 3223 if planted after 15May. There was not a significant difference for the silageyields for the first planting date (21 April). The yieldswere higher for tropical corn and Bt corn when comparedto temperate corn planted 15 May. For corn planted 16June and 7 July, the yields were higher for Pioneer 3098than for Pioneer 31B13 or Pioneer 3223.
Grain yields of corn are shown in Table 5. The yieldsof Pioneer 3098 were significantly higher planted 21 Apriland 15 May as compared to the 16 June and 7 July plant-ing. Pioneer 31B13 planted 21 April yielded more grainthan 15 May, 16 June and 7 July planting dates. Yields of
Pioneer 3223 corn were higher when planted 21 Aprilthan when planted 15 May, 16 June and 7 July. There wasnot a significant difference among hybrids for grain yieldwhen planted 21 April. Higher yields were obtained fortropical corn and Bt corn than for temperate corn whenplanted 15 May. Grain yields were significantly lower whenplanted 16 June. The highest yielding hybrid for this plant-ing date was Pioneer 3098, which was greater than Pio-neer 31B13 which was greater than Pioneer 3223. If thelast planting is compared, higher yields occurred fromtropical corn than Bt corn or temperate corn.
SUMMARY
Tropical corn gave satisfactory silage yield until earlyJuly, while grain yield dropped significantly after mid-May plantings. Temperate corn was devastated by insectsin June and July planting as compared to Bt and tropicalcorn. Yield of Bt corn silage and grain was lower at laterplanting dates, largely due to diseases rather than insects,but this hybrid showed potential for late planting as com-pared to temperate corn. Bt hybrids had less insect dam-age than tropical hybrids and as later maturity hybrids aredeveloped with good disease tolerance, satisfactory lateplantings may be made.
LITERATURE CITED
Anderson, J.R, Jr., and H.M. Linker. 1991. Tropical corn production:The insect problem. pp. 45-46. In: Proc. Southern RegionalTropical Corn Symp. June 27-28, Quincy, Florida.
Johnson, C.J. 1991. Tropical corn for silage. pp. 5-10. In: Proc.Southern Regional Tropical Corn Symp. June 27-28, Quincy,Florida.
Martin, W.K. 1991. Insect Tolerance. p. 47. In: Proc. SouthernRegional Tropical Corn Symp. June 27-28, Quincy, Florida.
SAS Institute Inc. 1989. SAS/STAT user’s guide, version 6, fourthedition, volume 1 and 2, Cary, North Carolina: SAS Institute Inc.,1989. 1789 pp.
Sprenkel R.K. 1991. Tropical corn for silage. pp. 42-44. In: Proc.Southern Regional Tropical Corn Symp. June 27-28, Quincy,Florida.
Teare, I.D., D.L. Wright, R.L. Sprenkel, B. Stanley and D.P. Lilly.1991. Tropical corn hybrids in a no-tillage system. pp. 92-97. In:T.C. Keisling (ed.). 1991 Southern Conservation TillageConference. Ark. Agric. Exp. Stn. Special Report 148.
Wright, D.L., I.D. Teare and R.N. Gallaher. 1991. Tropical corn forsilage. pp. 15-20. In: Proc. Southern Regional Tropical CornSymp. June 27-28, Quincy, Florida.
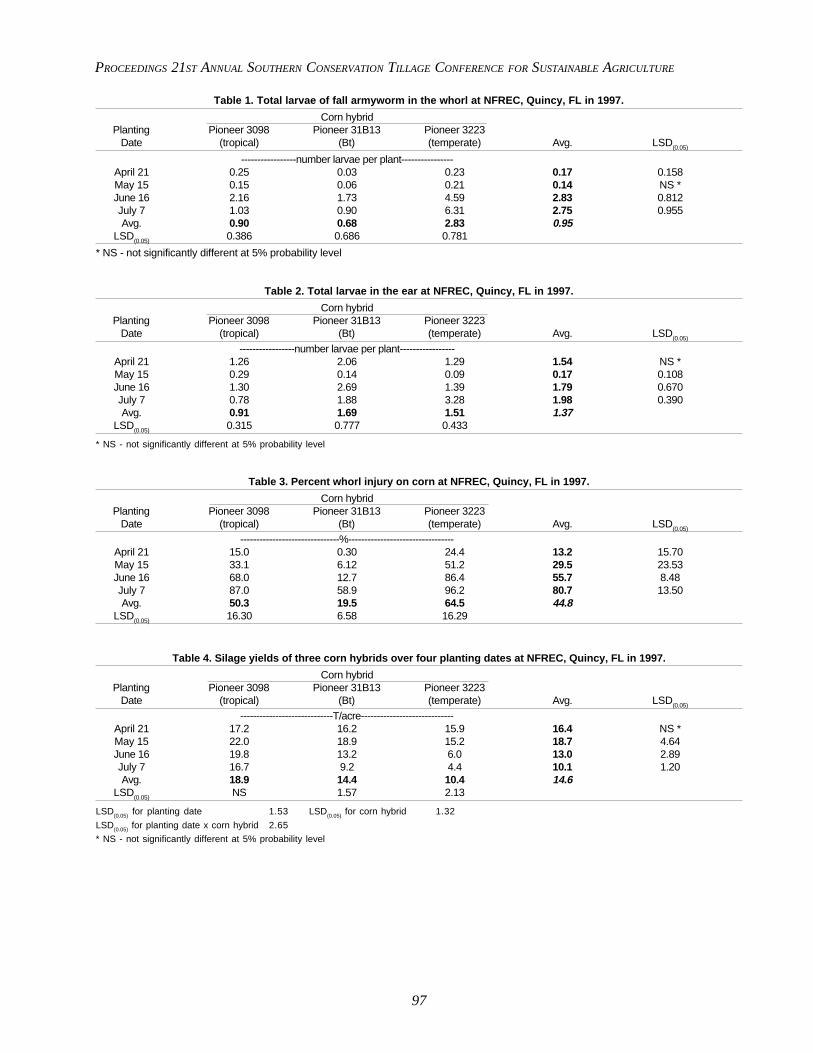
PROCEEDINGS 21ST ANNUAL SOUTHERN CONSERVATION TILLAGE CONFERENCE FOR SUSTAINABLE AGRICULTURE
97
Table 1. Total larvae of fall armyworm in the whorl at NFREC, Quincy, FL in 1997.
Corn hybridPlanting Pioneer 3098 Pioneer 31B13 Pioneer 3223
Date (tropical) (Bt) (temperate) Avg. LSD(0.05)
-----------------number larvae per plant----------------April 21 0.25 0.03 0.23 0.17 0.158May 15 0.15 0.06 0.21 0.14 NS *June 16 2.16 1.73 4.59 2.83 0.812July 7 1.03 0.90 6.31 2.75 0.955Avg. 0.90 0.68 2.83 0.95
LSD(0.05) 0.386 0.686 0.781
* NS - not significantly different at 5% probability level
Table 2. Total larvae in the ear at NFREC, Quincy, FL in 1997.
Corn hybridPlanting Pioneer 3098 Pioneer 31B13 Pioneer 3223
Date (tropical) (Bt) (temperate) Avg. LSD(0.05)
-----------------number larvae per plant-----------------April 21 1.26 2.06 1.29 1.54 NS *May 15 0.29 0.14 0.09 0.17 0.108June 16 1.30 2.69 1.39 1.79 0.670July 7 0.78 1.88 3.28 1.98 0.390Avg. 0.91 1.69 1.51 1.37
LSD(0.05) 0.315 0.777 0.433
* NS - not significantly different at 5% probability level
Table 3. Percent whorl injury on corn at NFREC, Quincy, FL in 1997.
Corn hybridPlanting Pioneer 3098 Pioneer 31B13 Pioneer 3223
Date (tropical) (Bt) (temperate) Avg. LSD(0.05)
-------------------------------%---------------------------------April 21 15.0 0.30 24.4 13.2 15.70May 15 33.1 6.12 51.2 29.5 23.53June 16 68.0 12.7 86.4 55.7 8.48July 7 87.0 58.9 96.2 80.7 13.50Avg. 50.3 19.5 64.5 44.8
LSD(0.05) 16.30 6.58 16.29
Table 4. Silage yields of three corn hybrids over four planting dates at NFREC, Quincy, FL in 1997.
Corn hybridPlanting Pioneer 3098 Pioneer 31B13 Pioneer 3223
Date (tropical) (Bt) (temperate) Avg. LSD(0.05)
-----------------------------T/acre-----------------------------April 21 17.2 16.2 15.9 16.4 NS *May 15 22.0 18.9 15.2 18.7 4.64June 16 19.8 13.2 6.0 13.0 2.89July 7 16.7 9.2 4.4 10.1 1.20Avg. 18.9 14.4 10.4 14.6
LSD(0.05) NS 1.57 2.13
LSD(0.05)
for planting date 1.53 LSD(0.05)
for corn hybrid 1.32
LSD(0.05) for planting date x corn hybrid 2.65
* NS - not significantly different at 5% probability level

ARKANSAS AGRICULTURAL EXPERIMENT STATION SPECIAL REPORT 186
98
Table 5. Grain yields of three corn hybrids over four planting dates at NFREC, Quincy, FL in 1997.
Corn hybridPlanting Pioneer 3098 Pioneer 31B13 Pioneer 3223
Date (tropical) (Bt) (temperate) Avg. LSD(0.05)
-----------------------------bu/acre----------------------------April 21 133.3 129.9 122.2 128.5 NS *May 15 127.3 107.8 82.5 105.9 4.64June 16 83.5 46.1 7.9 45.9 2.89July 7 87.5 42.7 3.6 44.6 1.20Avg. 107.9 81.6 54.1 81.2
LSD(0.05) 14.9 16.8 15.0
LSD(0.05)
for planting date 8.00 LSD(0.05)
for corn hybrid 6.93
LSD(0.05) for planting date x corn hybrid 13.85
* NS - not significantly different at 5% probability level