Embed Size (px)
Citation preview
ARIZONA SUPREME COURT ADMINISTRATIVE OFFICE OF THE COURTS COMMISSION ON MINORITIES
Equitable Treatment
of Minority Youth
Fourth Statewide Report Card-2010
COMMISSION ON MINORITIES – EQUITABLE TREATMENT REPORT CY 2008
ii
Table of Contents:
Letter from the Commission
Executive Summary
History of DMC in Arizona
Statewide DMC Data
Discussion
Glossary
COMMI SSI ON ON MINORI T I ES – EQUI TABLE TREATM ENT REPORT CY 2008
1
MEMBERS
Honorable Roxanne K. Song Ong, Chair City of Phoenix Municipal Court Jesus Diaz, Chair-Vice* Pima County Juvenile Court Center Honorable Maria Avilez Sahuarita Municipal Court Mike Baumstark Administrative Office of the Courts Diandra D. Benally, Esq. Fort McDowell Yavapai Nation Honorable Peter J. Eckerstrom Arizona Court of Appeals – Division II Joi Hollis. M.Ed. Superior Court in Pima County Karin S. Humiston** Cochise County Juvenile Court Services Honorable Mitchell D.K. Kalauli Justice of the Peace – Moccasin Niccole L. King, Esq. Salt River Pima-Maricopa Indian Community Lisa S. Loo, Esq. Arizona State University Honorable Marie “Toni” Lorona** Eloy Justice Court Honorable Leslie Miller Superior Court in Pima County Honorable Monyette Nyquist Phoenix Municipal Court Kendall Rhyne Gila County Probation Department Patricia Seguin Superior Court in Maricopa County Margarita Silva, Esq. Navidad, Leal & Silva, PLC Arthur L. Wilkerson Arizona Department of Juvenile Corrections Honorable Penny L. Willrich (Ret.)** Phoenix School of Law *Over Representation Workgroup Chair **Over Representation Workgroup Member
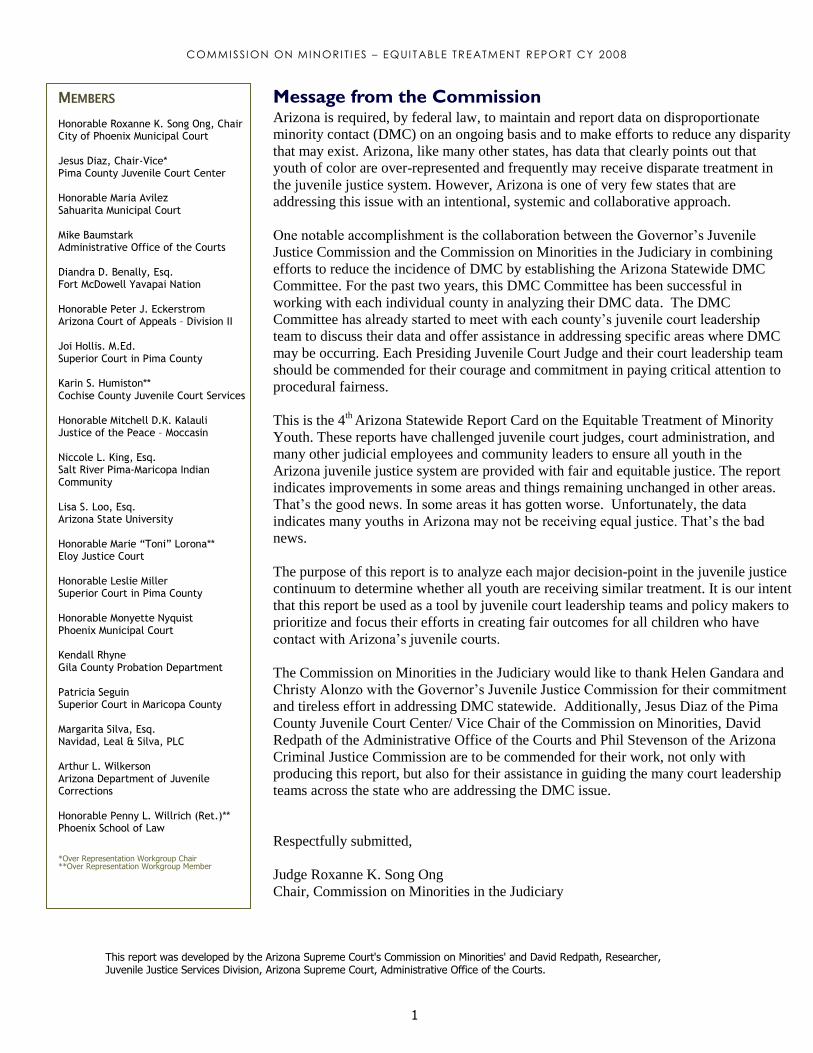
Message from the Commission Arizona is required, by federal law, to maintain and report data on disproportionate
minority contact (DMC) on an ongoing basis and to make efforts to reduce any disparity
that may exist. Arizona, like many other states, has data that clearly points out that
youth of color are over-represented and frequently may receive disparate treatment in
the juvenile justice system. However, Arizona is one of very few states that are
addressing this issue with an intentional, systemic and collaborative approach.
One notable accomplishment is the collaboration between the Governor’s Juvenile
Justice Commission and the Commission on Minorities in the Judiciary in combining
efforts to reduce the incidence of DMC by establishing the Arizona Statewide DMC
Committee. For the past two years, this DMC Committee has been successful in
working with each individual county in analyzing their DMC data. The DMC
Committee has already started to meet with each county’s juvenile court leadership
team to discuss their data and offer assistance in addressing specific areas where DMC
may be occurring. Each Presiding Juvenile Court Judge and their court leadership team
should be commended for their courage and commitment in paying critical attention to
procedural fairness.
This is the 4th
Arizona Statewide Report Card on the Equitable Treatment of Minority
Youth. These reports have challenged juvenile court judges, court administration, and
many other judicial employees and community leaders to ensure all youth in the
Arizona juvenile justice system are provided with fair and equitable justice. The report
indicates improvements in some areas and things remaining unchanged in other areas.
That’s the good news. In some areas it has gotten worse. Unfortunately, the data
indicates many youths in Arizona may not be receiving equal justice. That’s the bad
news.
The purpose of this report is to analyze each major decision-point in the juvenile justice
continuum to determine whether all youth are receiving similar treatment. It is our intent
that this report be used as a tool by juvenile court leadership teams and policy makers to
prioritize and focus their efforts in creating fair outcomes for all children who have
contact with Arizona’s juvenile courts.
The Commission on Minorities in the Judiciary would like to thank Helen Gandara and
Christy Alonzo with the Governor’s Juvenile Justice Commission for their commitment
and tireless effort in addressing DMC statewide. Additionally, Jesus Diaz of the Pima
County Juvenile Court Center/ Vice Chair of the Commission on Minorities, David
Redpath of the Administrative Office of the Courts and Phil Stevenson of the Arizona
Criminal Justice Commission are to be commended for their work, not only with
producing this report, but also for their assistance in guiding the many court leadership
teams across the state who are addressing the DMC issue.
Respectfully submitted,
Judge Roxanne K. Song Ong
Chair, Commission on Minorities in the Judiciary
This report was developed by the Arizona Supreme Court's Commission on Minorities' and David Redpath, Researcher, Juvenile Justice Services Division, Arizona Supreme Court, Administrative Office of the Courts.
COMMI SSI ON ON MINORI T I ES – EQUI TABLE TREATM ENT REPORT CY 2008
2
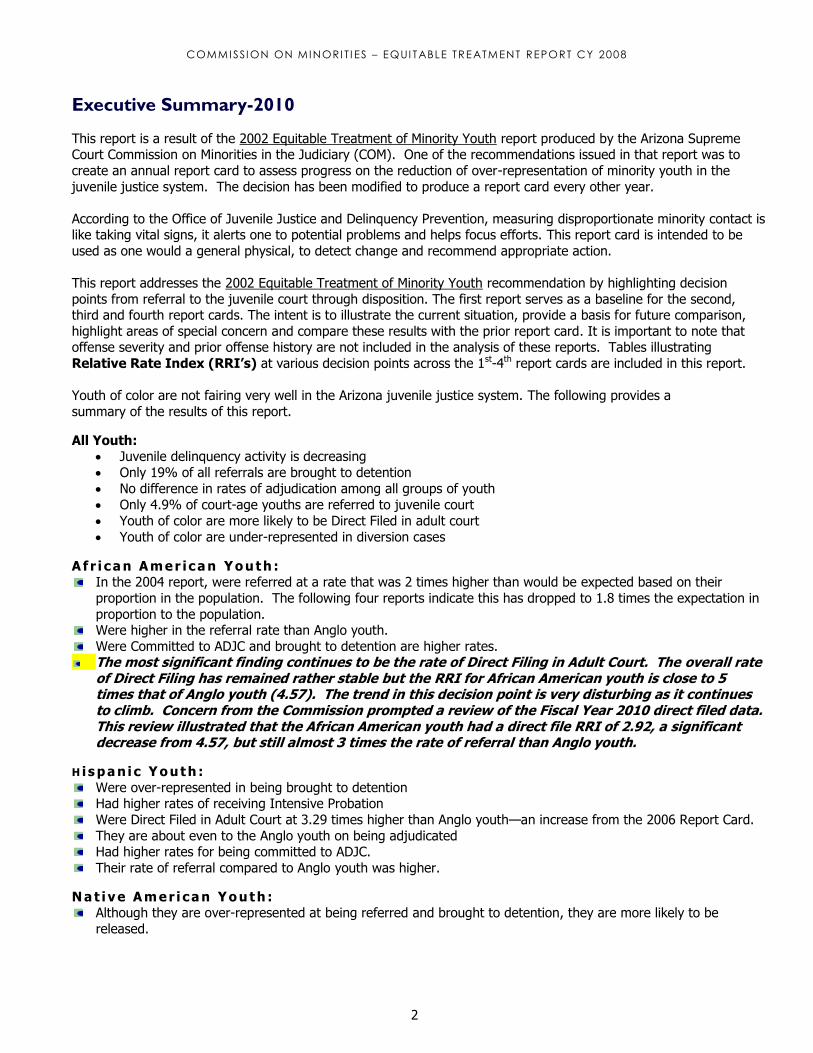
Executive Summary-2010
This report is a result of the 2002 Equitable Treatment of Minority Youth report produced by the Arizona Supreme Court Commission on Minorities in the Judiciary (COM). One of the recommendations issued in that report was to
create an annual report card to assess progress on the reduction of over-representation of minority youth in the
juvenile justice system. The decision has been modified to produce a report card every other year.
According to the Office of Juvenile Justice and Delinquency Prevention, measuring disproportionate minority contact is like taking vital signs, it alerts one to potential problems and helps focus efforts. This report card is intended to be
used as one would a general physical, to detect change and recommend appropriate action.
This report addresses the 2002 Equitable Treatment of Minority Youth recommendation by highlighting decision
points from referral to the juvenile court through disposition. The first report serves as a baseline for the second, third and fourth report cards. The intent is to illustrate the current situation, provide a basis for future comparison,
highlight areas of special concern and compare these results with the prior report card. It is important to note that offense severity and prior offense history are not included in the analysis of these reports. Tables illustrating
Relative Rate Index (RRI’s) at various decision points across the 1st-4th report cards are included in this report.
Youth of color are not fairing very well in the Arizona juvenile justice system. The following provides a
summary of the results of this report.
All Youth: Juvenile delinquency activity is decreasing
Only 19% of all referrals are brought to detention
No difference in rates of adjudication among all groups of youth
Only 4.9% of court-age youths are referred to juvenile court
Youth of color are more likely to be Direct Filed in adult court
Youth of color are under-represented in diversion cases
A f r i c a n A m e r ic a n Y o u t h : In the 2004 report, were referred at a rate that was 2 times higher than would be expected based on their
proportion in the population. The following four reports indicate this has dropped to 1.8 times the expectation in
proportion to the population. Were higher in the referral rate than Anglo youth.
Were Committed to ADJC and brought to detention are higher rates. The most significant finding continues to be the rate of Direct Filing in Adult Court. The overall rate
of Direct Filing has remained rather stable but the RRI for African American youth is close to 5 times that of Anglo youth (4.57). The trend in this decision point is very disturbing as it continues to climb. Concern from the Commission prompted a review of the Fiscal Year 2010 direct filed data. This review illustrated that the African American youth had a direct file RRI of 2.92, a significant decrease from 4.57, but still almost 3 times the rate of referral than Anglo youth.
H i s p a n i c Y o u t h :
Were over-represented in being brought to detention Had higher rates of receiving Intensive Probation
Were Direct Filed in Adult Court at 3.29 times higher than Anglo youth—an increase from the 2006 Report Card.
They are about even to the Anglo youth on being adjudicated Had higher rates for being committed to ADJC.
Their rate of referral compared to Anglo youth was higher.
N a t i v e A m e r i c a n Y o u t h : Although they are over-represented at being referred and brought to detention, they are more likely to be
released.

COMMI SSI ON ON MINORI T I ES – EQUI TABLE TREATM ENT REPORT CY 2008
3
The Direct Filed data shows a decrease from the 2006 Report card with an RRI to 1.56. Transferred youth show
under-representation for the Native American youth, but this rate involves an extremely small number. They are under-represented on Diversion, ADJC and Penalty Only.
COMMISSION ON MINORITIES – EQUITABLE TREATM ENT REPORT CY 2008
3
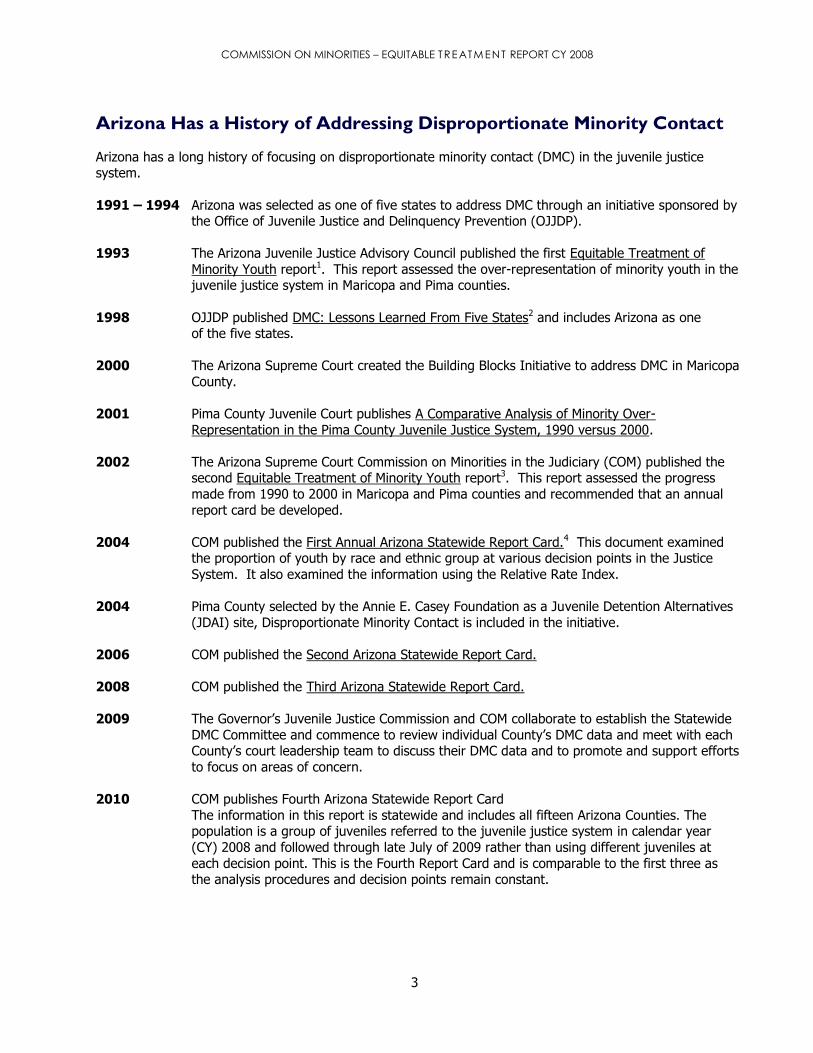
Arizona Has a History of Addressing Disproportionate Minority Contact
Arizona has a long history of focusing on disproportionate minority contact (DMC) in the juvenile justice system.
1991 – 1994 Arizona was selected as one of five states to address DMC through an initiative sponsored by the Office of Juvenile Justice and Delinquency Prevention (OJJDP).
1993 The Arizona Juvenile Justice Advisory Council published the first Equitable Treatment of
Minority Youth report1. This report assessed the over-representation of minority youth in the juvenile justice system in Maricopa and Pima counties.
1998 OJJDP published DMC: Lessons Learned From Five States2 and includes Arizona as one of the five states.
2000 The Arizona Supreme Court created the Building Blocks Initiative to address DMC in Maricopa
County.
2001 Pima County Juvenile Court publishes A Comparative Analysis of Minority Over-
Representation in the Pima County Juvenile Justice System, 1990 versus 2000.
2002 The Arizona Supreme Court Commission on Minorities in the Judiciary (COM) published the second Equitable Treatment of Minority Youth report3. This report assessed the progress
made from 1990 to 2000 in Maricopa and Pima counties and recommended that an annual
report card be developed.
2004 COM published the First Annual Arizona Statewide Report Card.4 This document examined the proportion of youth by race and ethnic group at various decision points in the Justice
System. It also examined the information using the Relative Rate Index.
2004 Pima County selected by the Annie E. Casey Foundation as a Juvenile Detention Alternatives
(JDAI) site, Disproportionate Minority Contact is included in the initiative.
2006 COM published the Second Arizona Statewide Report Card.
2008 COM published the Third Arizona Statewide Report Card.
2009 The Governor’s Juvenile Justice Commission and COM collaborate to establish the Statewide
DMC Committee and commence to review individual County’s DMC data and meet with each County’s court leadership team to discuss their DMC data and to promote and support efforts
to focus on areas of concern.
2010 COM publishes Fourth Arizona Statewide Report Card
The information in this report is statewide and includes all fifteen Arizona Counties. The population is a group of juveniles referred to the juvenile justice system in calendar year
(CY) 2008 and followed through late July of 2009 rather than using different juveniles at
each decision point. This is the Fourth Report Card and is comparable to the first three as the analysis procedures and decision points remain constant.
COMMISSION ON MINORITIES – EQUITABLE TREATM ENT REPORT CY 2008
4
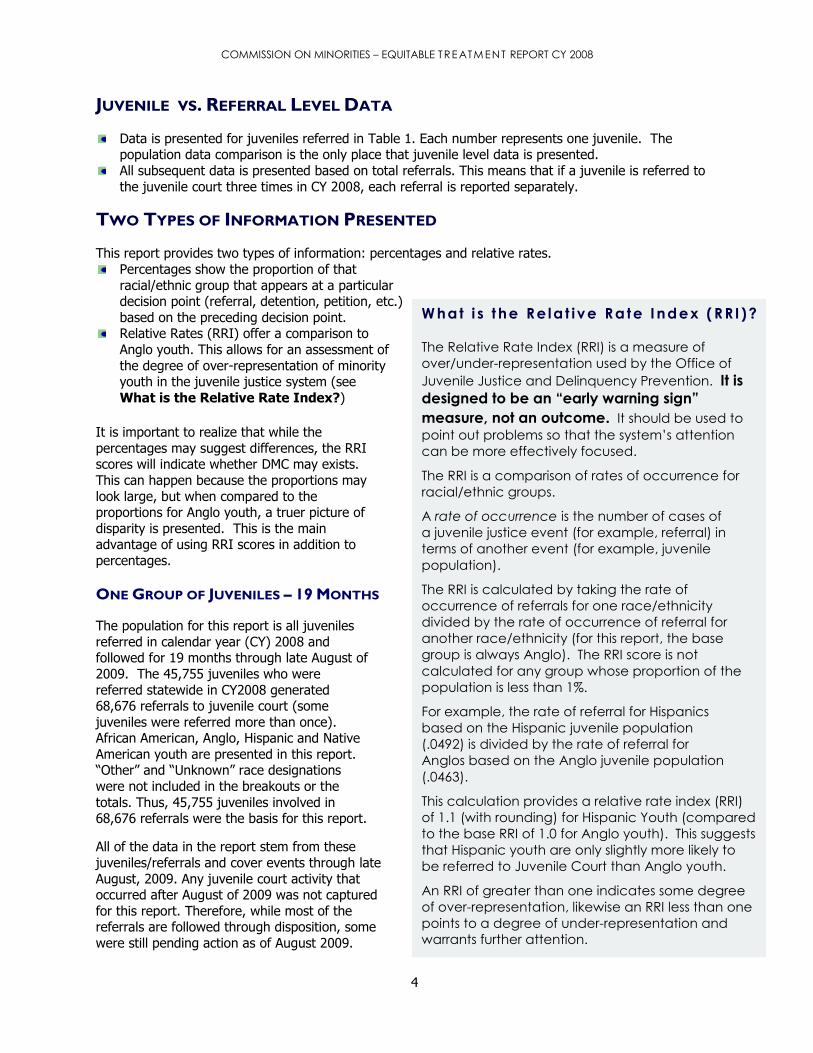
W hat i s t he Re la t ive Ra te I ndex ( RR I )?
The Relative Rate Index (RRI) is a measure of
over/under-representation used by the Office of
Juvenile Justice and Delinquency Prevention. It is
designed to be an “early warning sign”
measure, not an outcome. It should be used to
point out problems so that the system’s attention
can be more effectively focused.
The RRI is a comparison of rates of occurrence for
racial/ethnic groups.
A rate of occurrence is the number of cases of
a juvenile justice event (for example, referral) in
terms of another event (for example, juvenile
population).
The RRI is calculated by taking the rate of
occurrence of referrals for one race/ethnicity
divided by the rate of occurrence of referral for
another race/ethnicity (for this report, the base
group is always Anglo). The RRI score is not
calculated for any group whose proportion of the
population is less than 1%.
For example, the rate of referral for Hispanics
based on the Hispanic juvenile population
(.0492) is divided by the rate of referral for
Anglos based on the Anglo juvenile population
(.0463).
This calculation provides a relative rate index (RRI)
of 1.1 (with rounding) for Hispanic Youth (compared
to the base RRI of 1.0 for Anglo youth). This suggests
that Hispanic youth are only slightly more likely to
be referred to Juvenile Court than Anglo youth.
An RRI of greater than one indicates some degree
of over-representation, likewise an RRI less than one
points to a degree of under-representation and
warrants further attention.
JUVENILE VS. REFERRAL LEVEL DATA
Data is presented for juveniles referred in Table 1. Each number represents one juvenile. The population data comparison is the only place that juvenile level data is presented.
All subsequent data is presented based on total referrals. This means that if a juvenile is referred to
the juvenile court three times in CY 2008, each referral is reported separately.
TWO TYPES OF INFORMATION PRESENTED
This report provides two types of information: percentages and relative rates.
Percentages show the proportion of that
racial/ethnic group that appears at a particular decision point (referral, detention, petition, etc.)
based on the preceding decision point. Relative Rates (RRI) offer a comparison to
Anglo youth. This allows for an assessment of
the degree of over-representation of minority youth in the juvenile justice system (see
What is the Relative Rate Index?)
It is important to realize that while the
percentages may suggest differences, the RRI scores will indicate whether DMC may exists.
This can happen because the proportions may
look large, but when compared to the proportions for Anglo youth, a truer picture of
disparity is presented. This is the main advantage of using RRI scores in addition to
percentages. ONE GROUP OF JUVENILES – 19 MONTHS
The population for this report is all juveniles
referred in calendar year (CY) 2008 and followed for 19 months through late August of
2009. The 45,755 juveniles who were
referred statewide in CY2008 generated 68,676 referrals to juvenile court (some
juveniles were referred more than once). African American, Anglo, Hispanic and Native
American youth are presented in this report. ―Other‖ and ―Unknown‖ race designations
were not included in the breakouts or the
totals. Thus, 45,755 juveniles involved in 68,676 referrals were the basis for this report.
All of the data in the report stem from these
juveniles/referrals and cover events through late
August, 2009. Any juvenile court activity that occurred after August of 2009 was not captured
for this report. Therefore, while most of the referrals are followed through disposition, some
were still pending action as of August 2009.
COMMISSION ON MINORITIES – EQUITABLE TREATM ENT REPORT CY 2008
5
Asian youth were included in the analysis but are not presented in this report. This is done for two
reasons. First, in general, the results indicated that there was no over-representation of Asian youth at
the statewide level. Second, the numbers were small enough, at certain decision points, to make analysis less meaningful.
DECISION POINTS REVIEWED
A decision point is one step in the juvenile justice process. This report reviews the following decision
points (see the Glossary for further explanation):
Referral (Paper or Physical/Detention) Diversion, Petition Filed, No Petition Filed,
Direct Filed in Adult Court Adjudicated, Transferred to Adult Court, or Non Adjudication
Dispositions (Penalty Only, Department of Juvenile Corrections, or Probation (Standard or Intensive))
All of the data on the decision points are collected either in the Juvenile On-Line Tracking System
(JOLTS) or on the Integrated Court Information System (iCIS) for Maricopa County.
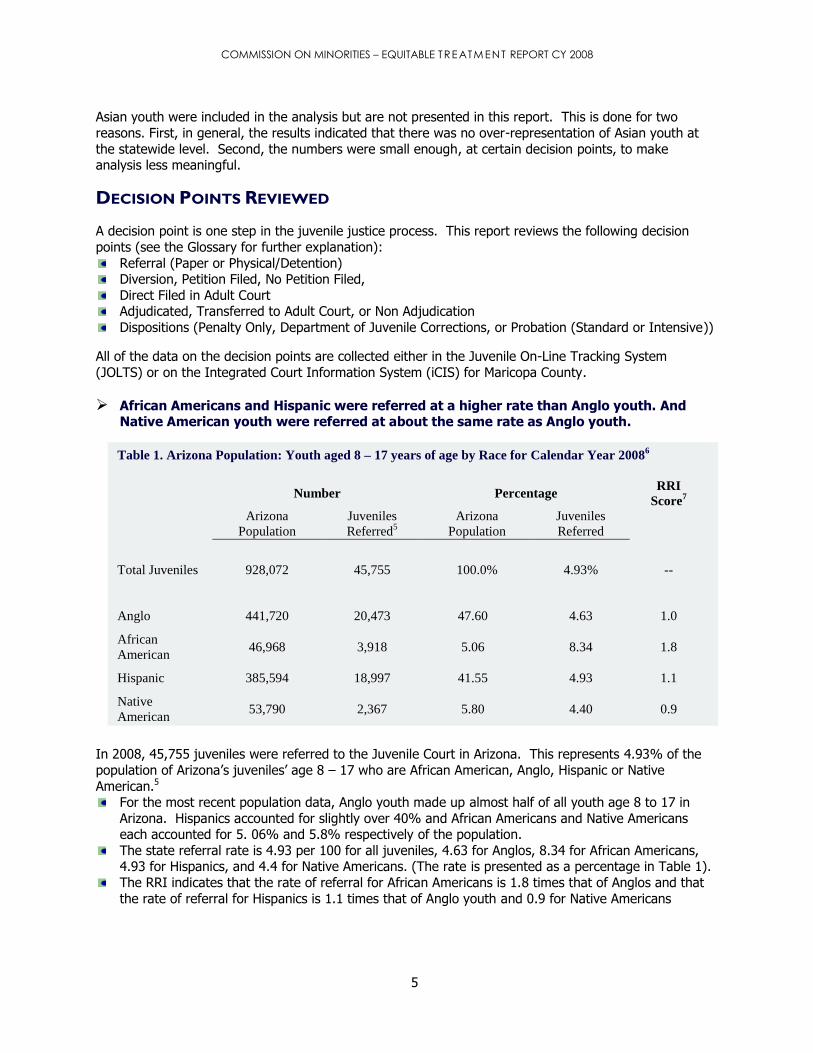
African Americans and Hispanic were referred at a higher rate than Anglo youth. And Native American youth were referred at about the same rate as Anglo youth.
In 2008, 45,755 juveniles were referred to the Juvenile Court in Arizona. This represents 4.93% of the
population of Arizona’s juveniles’ age 8 – 17 who are African American, Anglo, Hispanic or Native
American.5 For the most recent population data, Anglo youth made up almost half of all youth age 8 to 17 in
Arizona. Hispanics accounted for slightly over 40% and African Americans and Native Americans each accounted for 5. 06% and 5.8% respectively of the population.
The state referral rate is 4.93 per 100 for all juveniles, 4.63 for Anglos, 8.34 for African Americans, 4.93 for Hispanics, and 4.4 for Native Americans. (The rate is presented as a percentage in Table 1).
The RRI indicates that the rate of referral for African Americans is 1.8 times that of Anglos and that
the rate of referral for Hispanics is 1.1 times that of Anglo youth and 0.9 for Native Americans
Table 1. Arizona Population: Youth aged 8 – 17 years of age by Race for Calendar Year 20086
Number Percentage RRI
Score7
Arizona
Population
Juveniles
Referred5
Arizona
Population
Juveniles
Referred
Total Juveniles 928,072 45,755 100.0% 4.93% --
Anglo 441,720 20,473 47.60 4.63 1.0
African
American 46,968 3,918 5.06 8.34 1.8
Hispanic 385,594 18,997 41.55 4.93 1.1
Native
American 53,790 2,367 5.80 4.40 0.9
COMMISSION ON MINORITIES – EQUITABLE TREATM ENT REPORT CY 2008
6
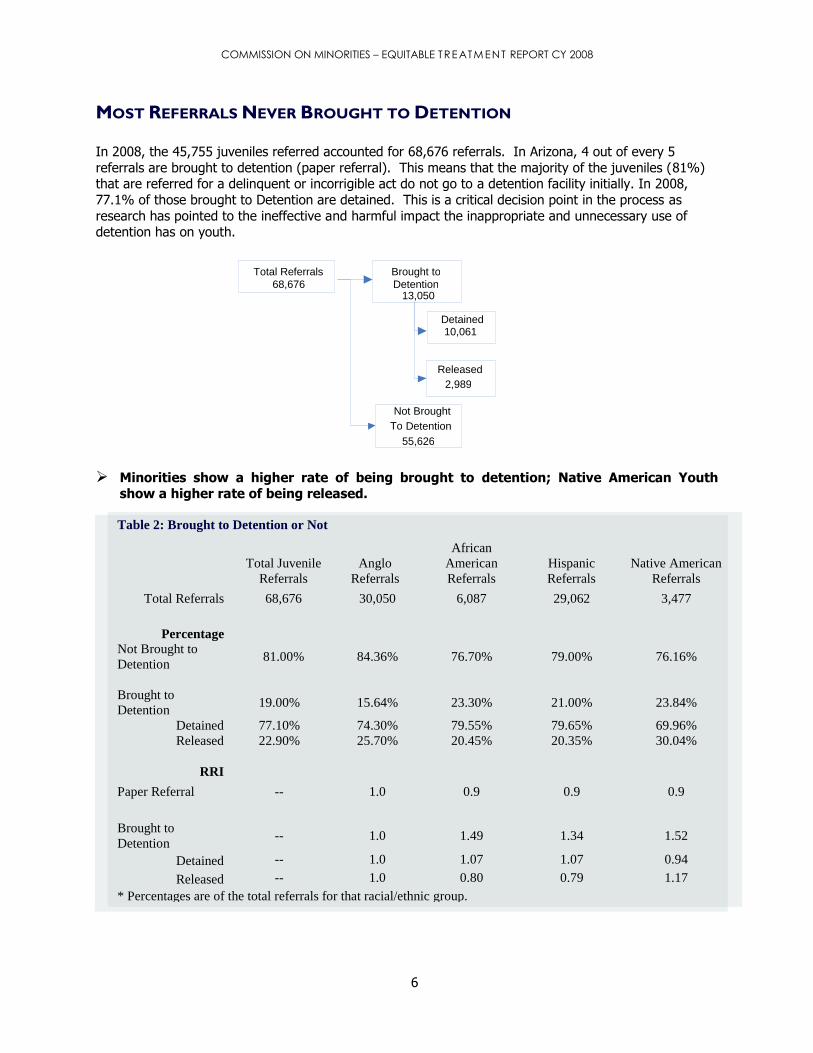
MOST REFERRALS NEVER BROUGHT TO DETENTION In 2008, the 45,755 juveniles referred accounted for 68,676 referrals. In Arizona, 4 out of every 5
referrals are brought to detention (paper referral). This means that the majority of the juveniles (81%) that are referred for a delinquent or incorrigible act do not go to a detention facility initially. In 2008,
77.1% of those brought to Detention are detained. This is a critical decision point in the process as
research has pointed to the ineffective and harmful impact the inappropriate and unnecessary use of detention has on youth.
Minorities show a higher rate of being brought to detention; Native American Youth
show a higher rate of being released.
Detained 10,061
Brought to Detention
13,050
Total Referrals
68,676
Released 2,989
Not Brought
To Detention 55,626
Table 2: Brought to Detention or Not
Total Juvenile
Referrals
Anglo
Referrals
African
American
Referrals
Hispanic
Referrals
Native American
Referrals
Total Referrals 68,676 30,050 6,087 29,062 3,477
Percentage
Not Brought to
Detention 81.00% 84.36% 76.70% 79.00% 76.16%
Brought to
Detention 19.00% 15.64% 23.30% 21.00% 23.84%
Detained 77.10% 74.30% 79.55% 79.65% 69.96%
Released 22.90% 25.70% 20.45% 20.35% 30.04%
RRI
Paper Referral -- 1.0 0.9 0.9 0.9
Brought to
Detention -- 1.0 1.49 1.34 1.52
Detained -- 1.0 1.07 1.07 0.94
Released -- 1.0 0.80 0.79 1.17
* Percentages are of the total referrals for that racial/ethnic group.
COMMISSION ON MINORITIES – EQUITABLE TREATM ENT REPORT CY 2008
7
Of the 19 % of referrals that resulted in a juvenile going to detention (physical referral): In 2008, almost 8 out of every 10 juveniles brought to a detention facility due to a referral were
detained at the initial screening. The RRI scores (1.5-1.3) indicate that minority youth were over-represented in the group brought to detention.
Once brought to detention, the RRI scores indicate that all groups of juveniles had similar rates of
detention at the initial screening except for Native American youth, who had a higher rate of release (RRI=1.17). Hispanics and African Americans had lower rates of release (RRI=0.79 & 0.80), respectively.
TO FORMALLY PROCESS IN COURT OR NOT?
Referrals may result in formal court processing (Petitions or Direct File to Adult Court) or informal court
processing (Diversion or No Petition Filed). It is possible for a referral to be diverted and then be filed as a petition if the consequence (sanction) is not completed. A petition may not be filed for a variety of reasons; it
does not necessarily mean that no action was taken by the juvenile court. This category does not include
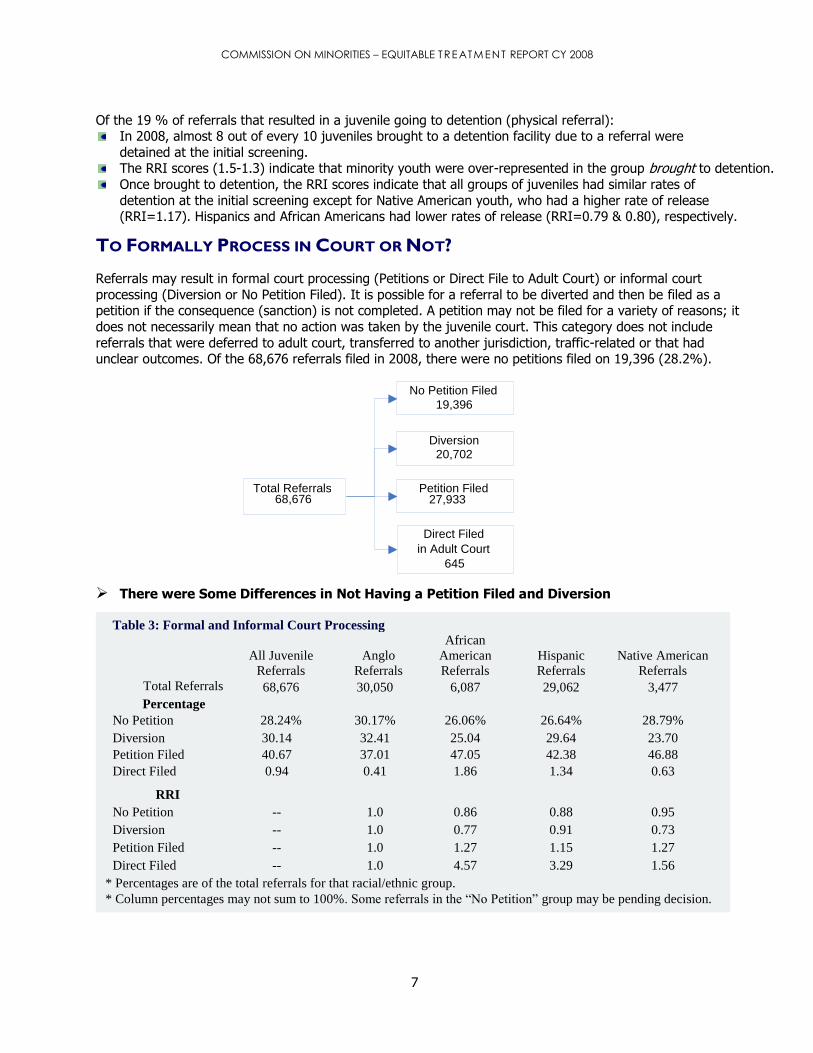
referrals that were deferred to adult court, transferred to another jurisdiction, traffic-related or that had unclear outcomes. Of the 68,676 referrals filed in 2008, there were no petitions filed on 19,396 (28.2%).
There were Some Differences in Not Having a Petition Filed and Diversion
Diversion 20,702
No Petition Filed 19,396
Petition Filed 27,933
Direct Filed in Adult Court
645
Total Referrals 68,676
Table 3: Formal and Informal Court Processing
All Juvenile
Referrals
Anglo
Referrals
African
American
Referrals
Hispanic
Referrals
Native American
Referrals
Total Referrals 68,676 30,050 6,087 29,062 3,477
Percentage
No Petition 28.24% 30.17% 26.06% 26.64% 28.79%
Diversion 30.14 32.41 25.04 29.64 23.70
Petition Filed 40.67 37.01 47.05 42.38 46.88
Direct Filed 0.94 0.41 1.86 1.34 0.63
RRI
No Petition -- 1.0 0.86 0.88 0.95
Diversion -- 1.0 0.77 0.91 0.73
Petition Filed -- 1.0 1.27 1.15 1.27
Direct Filed -- 1.0 4.57 3.29 1.56
* Percentages are of the total referrals for that racial/ethnic group.
* Column percentages may not sum to 100%. Some referrals in the “No Petition” group may be pending decision.
COMMISSION ON MINORITIES – EQUITABLE TREATM ENT REPORT CY 2008
8
Diversion is a process that allows juveniles to avoid formal court processing if one or more conditions are
completed and the juveniles accept responsibility for the offenses. Conditions may include community restitution, participation in counseling or education, or payment of a fine or restitution. Of the 68,676
referrals filed in 2008, 20,702 (30.1%) were diverted. In general, African American, Hispanic and Native American youth referrals were under-represented at the Diversion decision point with RRIs ranging from
0.73 to 0.91. African American, Hispanic and Native American youth are also under-represented at the
No Petition point. The converse of this is, they are over-represented on the Petition Filed decision point. The Direct Filed over-representation is significant.
Referrals for Minority Youth were More Likely to be Filed as Petitions.
A petition is filed when a juvenile is alleged to be delinquent or incorrigible and formal court processing
is warranted. Of the 68,676 referrals filed in 2008, 27,933 (40.67%) resulted in petitions that were filed in juvenile court. The actual number of petitions is less than this because multiple referrals may be
contained in a single petition.
Nearly half (47.1%) of the African American referrals filed in 2008 resulted in a petition. This compares to 42.4% for Hispanic youth, 46.9% for Native American youth, and 37.0% for Anglo youth.
The RRI score paints a picture that suggests that the referrals of minority youth are more likely to be
filed as petitions than Anglo youth (1.15 to 1.27).
Minority Youth Referrals were More Likely to be Direct Filed in Adult Court
A juvenile aged 15 or older must be directly filed into adult court if accused of murder, forcible sexual
assault, armed robbery, or other specified violent offenses. A juvenile will also be directly filed if previously
convicted in adult court or if the juvenile has two prior felony adjudications and is arrested for a third felony. Finally, a juvenile who is 14 and a chronic offender or who is 14 or older and has committed one of
a specified set of offenses may be directly filed in adult court at the discretion of the county attorney.
The Direct filings reported in 2004 calendar year were later found to be an undercount due to data entry errors. Direct filings in Arizona have been somewhat stable for the last few years. Less than one percent
(645 or 0.94%) of the total referrals in 2008 resulted in a direct file to adult court. Nonetheless,
significant over-representation exists at this decision point.
The rates of Direct Filing for Hispanic and Native American youth referrals was higher (3.29 and 1.56, respectively) than for Anglo youth. African American youth referrals had a Direct Filing rate 4.57 times
higher than Anglo youth. These findings are especially alarming as the trend of disproportionate contact at this decision point is increasing over the last 6 years.
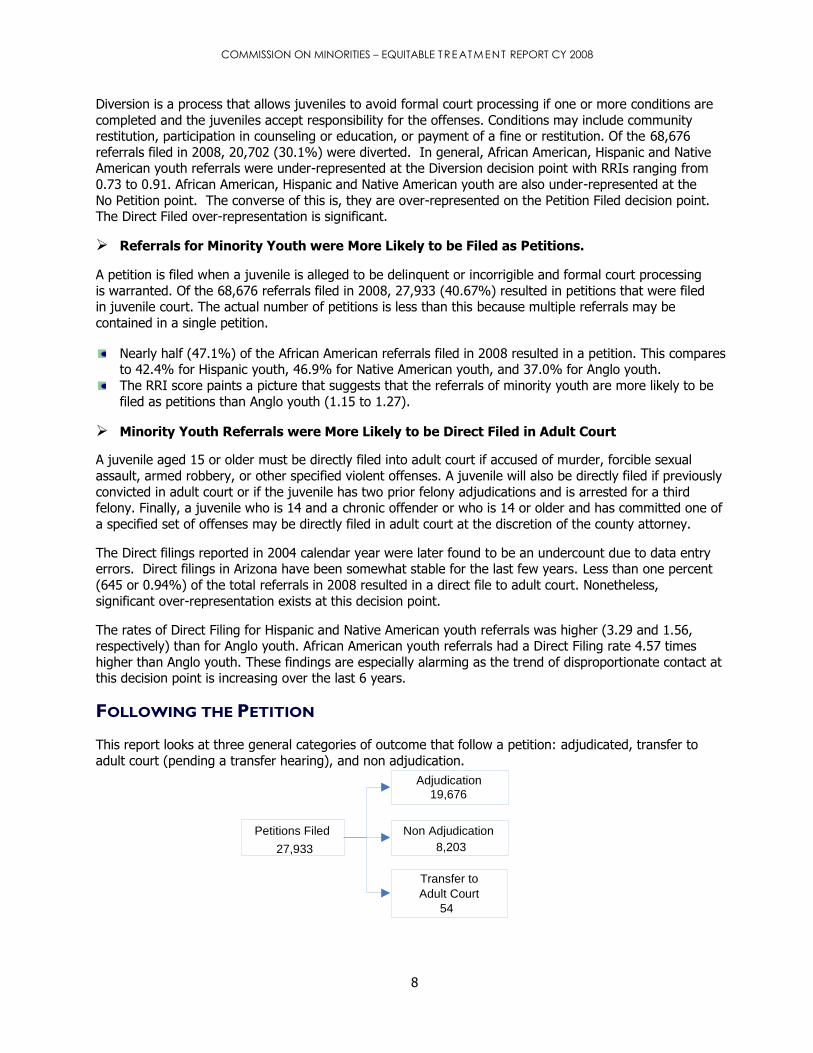
FOLLOWING THE PETITION
This report looks at three general categories of outcome that follow a petition: adjudicated, transfer to
adult court (pending a transfer hearing), and non adjudication.
Non Adjudication 8,203
Adjudication 19,676
Transfer to Adult Court
54
Petitions Filed
27,933
COMMISSION ON MINORITIES – EQUITABLE TREATM ENT REPORT CY 2008
9
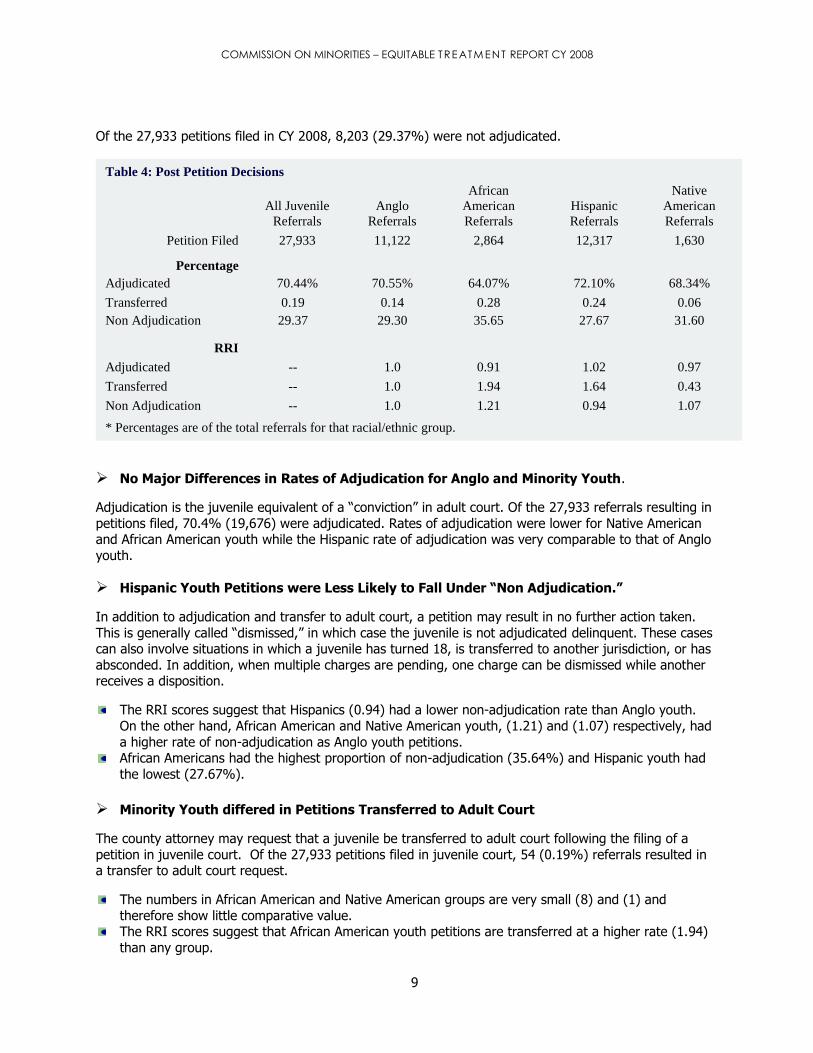
Of the 27,933 petitions filed in CY 2008, 8,203 (29.37%) were not adjudicated.
No Major Differences in Rates of Adjudication for Anglo and Minority Youth.
Adjudication is the juvenile equivalent of a ―conviction‖ in adult court. Of the 27,933 referrals resulting in
petitions filed, 70.4% (19,676) were adjudicated. Rates of adjudication were lower for Native American and African American youth while the Hispanic rate of adjudication was very comparable to that of Anglo
youth.
Hispanic Youth Petitions were Less Likely to Fall Under “Non Adjudication.”
In addition to adjudication and transfer to adult court, a petition may result in no further action taken.
This is generally called ―dismissed,‖ in which case the juvenile is not adjudicated delinquent. These cases can also involve situations in which a juvenile has turned 18, is transferred to another jurisdiction, or has
absconded. In addition, when multiple charges are pending, one charge can be dismissed while another receives a disposition.
The RRI scores suggest that Hispanics (0.94) had a lower non-adjudication rate than Anglo youth.
On the other hand, African American and Native American youth, (1.21) and (1.07) respectively, had
a higher rate of non-adjudication as Anglo youth petitions. African Americans had the highest proportion of non-adjudication (35.64%) and Hispanic youth had
the lowest (27.67%).
Minority Youth differed in Petitions Transferred to Adult Court
The county attorney may request that a juvenile be transferred to adult court following the filing of a
petition in juvenile court. Of the 27,933 petitions filed in juvenile court, 54 (0.19%) referrals resulted in a transfer to adult court request.
The numbers in African American and Native American groups are very small (8) and (1) and
therefore show little comparative value. The RRI scores suggest that African American youth petitions are transferred at a higher rate (1.94)
than any group.
Table 4: Post Petition Decisions
All Juvenile
Referrals
Anglo
Referrals
African
American
Referrals
Hispanic
Referrals
Native
American
Referrals
Petition Filed 27,933 11,122 2,864 12,317 1,630
Percentage
Adjudicated 70.44% 70.55% 64.07% 72.10% 68.34%
Transferred 0.19 0.14 0.28 0.24 0.06
Non Adjudication 29.37 29.30 35.65 27.67 31.60
RRI
Adjudicated -- 1.0 0.91 1.02 0.97
Transferred -- 1.0 1.94 1.64 0.43
Non Adjudication -- 1.0 1.21 0.94 1.07
* Percentages are of the total referrals for that racial/ethnic group.
COMMISSION ON MINORITIES – EQUITABLE TREATM ENT REPORT CY 2008
10
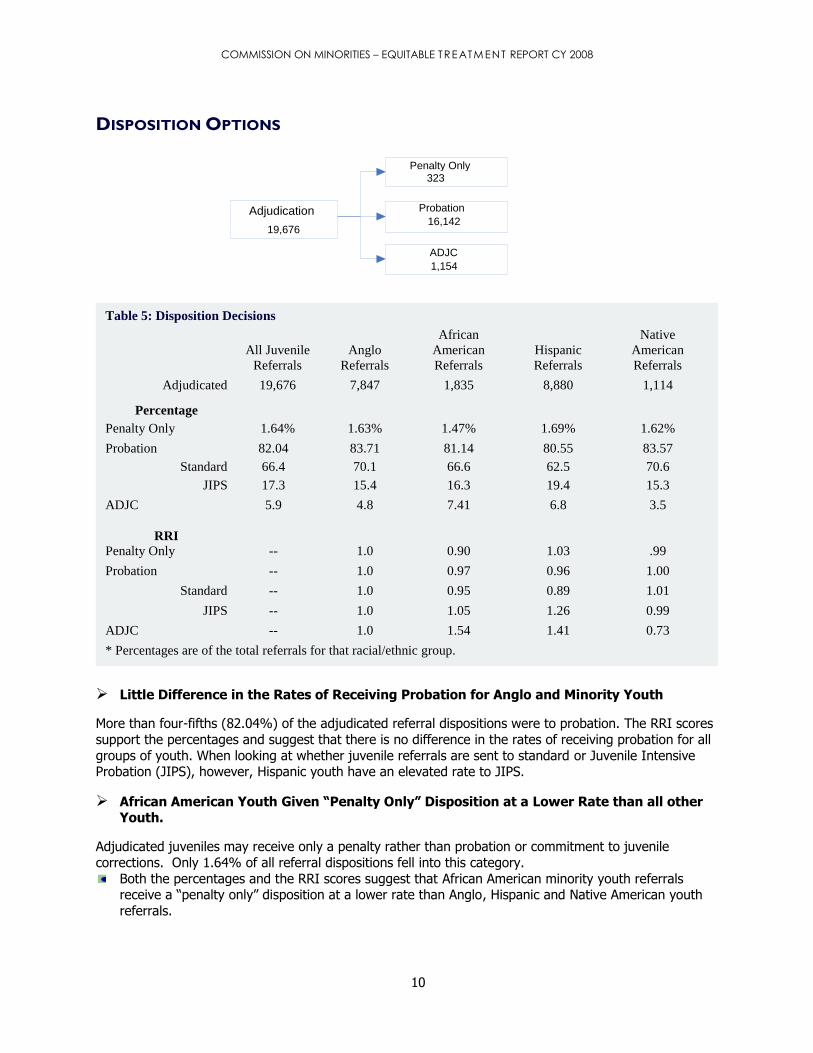
DISPOSITION OPTIONS
Little Difference in the Rates of Receiving Probation for Anglo and Minority Youth
More than four-fifths (82.04%) of the adjudicated referral dispositions were to probation. The RRI scores
support the percentages and suggest that there is no difference in the rates of receiving probation for all
groups of youth. When looking at whether juvenile referrals are sent to standard or Juvenile Intensive Probation (JIPS), however, Hispanic youth have an elevated rate to JIPS.
African American Youth Given “Penalty Only” Disposition at a Lower Rate than all other Youth.
Adjudicated juveniles may receive only a penalty rather than probation or commitment to juvenile
corrections. Only 1.64% of all referral dispositions fell into this category.
Both the percentages and the RRI scores suggest that African American minority youth referrals receive a ―penalty only‖ disposition at a lower rate than Anglo, Hispanic and Native American youth
referrals.
Probation
16,142
Penalty Only 323
ADJC 1,154
Adjudication 19,67620,417
Table 5: Disposition Decisions
All Juvenile
Referrals
Anglo
Referrals
African
American
Referrals
Hispanic
Referrals
Native
American
Referrals
Adjudicated 19,676 7,847 1,835 8,880 1,114
Percentage
Penalty Only 1.64% 1.63% 1.47% 1.69% 1.62%
Probation 82.04 83.71 81.14 80.55 83.57
Standard 66.4 70.1 66.6 62.5 70.6
JIPS 17.3 15.4 16.3 19.4 15.3
ADJC 5.9 4.8 7.41 6.8 3.5
RRI
Penalty Only -- 1.0 0.90 1.03 .99
Probation -- 1.0 0.97 0.96 1.00
Standard -- 1.0 0.95 0.89 1.01
JIPS -- 1.0 1.05 1.26 0.99
ADJC -- 1.0 1.54 1.41 0.73
* Percentages are of the total referrals for that racial/ethnic group.

COMMISSION ON MINORITIES – EQUITABLE TREATM ENT REPORT CY 2008
11
African American and Hispanic Youth Referrals Committed to ADJC at a Higher Rate than Anglo and Native American Youth Referrals.
Disposition to the Arizona Department of Juvenile Corrections (ADJC) is governed by statute and the Arizona Code of Judicial Administration. Only 5.9% of the adjudicated referrals from CY2006 involved
commitments to ADJC. African American (RRI=1.54) and Hispanic (RRI=1.41) youth referrals had a higher rate of
commitment to ADJC than Anglo youth referrals. The percentages support this as well (7.4%, 6.8%
and 4.8% respectively).
Native American had a lower rate 3.5% and an RRI of 0.73.
COMMISSION ON MINORITIES – EQUITABLE TREATM ENT REPORT CY 2008
12
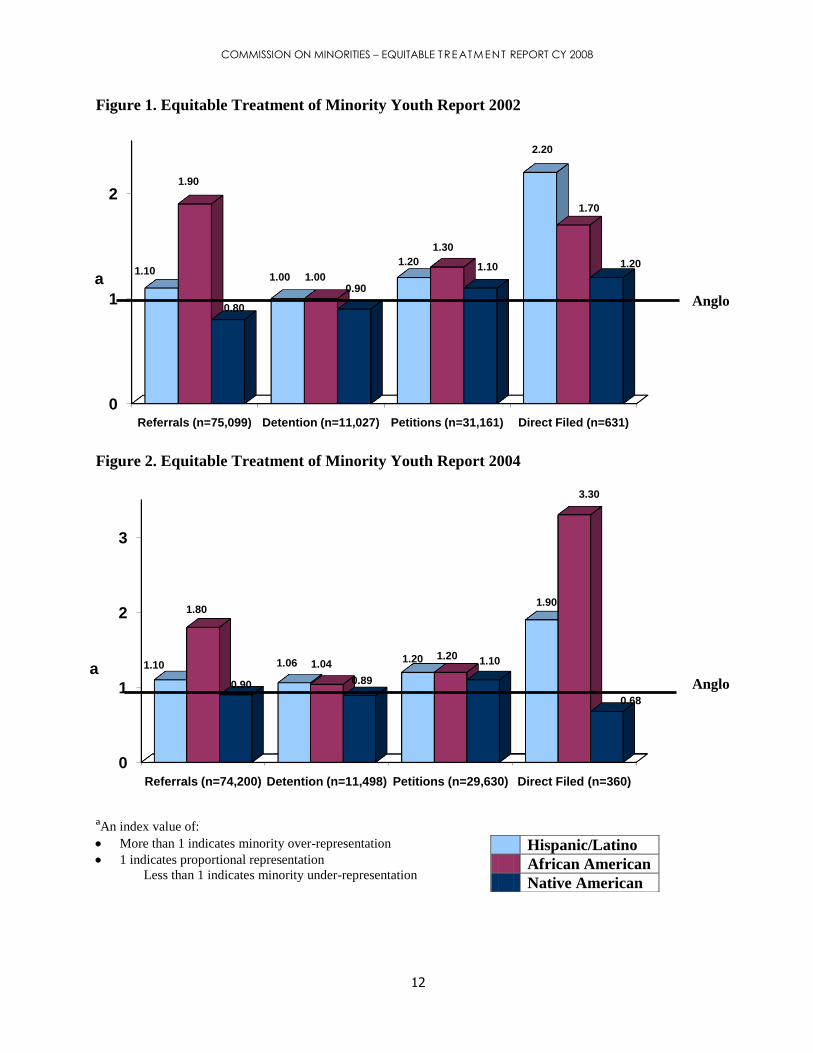
Figure 1. Equitable Treatment of Minority Youth Report 2002
Figure 2. Equitable Treatment of Minority Youth Report 2004
ªAn index value of:
More than 1 indicates minority over-representation
1 indicates proportional representation
Less than 1 indicates minority under-representation
Hispanic/Latino
African American
Native American
0
1
2
Referrals (n=75,099) Detention (n=11,027) Petitions (n=31,161) Direct Filed (n=631)
1.101.00
1.20
2.20
1.90
1.00
1.30
1.70
0.80
0.90
1.10 1.20
a
Anglo
0
1
2
3
Referrals (n=74,200) Detention (n=11,498) Petitions (n=29,630) Direct Filed (n=360)
1.10 1.06 1.20
1.901.80
1.041.20
3.30
0.90 0.89
1.10
0.68
aAnglo
COMMISSION ON MINORITIES – EQUITABLE TREATM ENT REPORT CY 2008
13
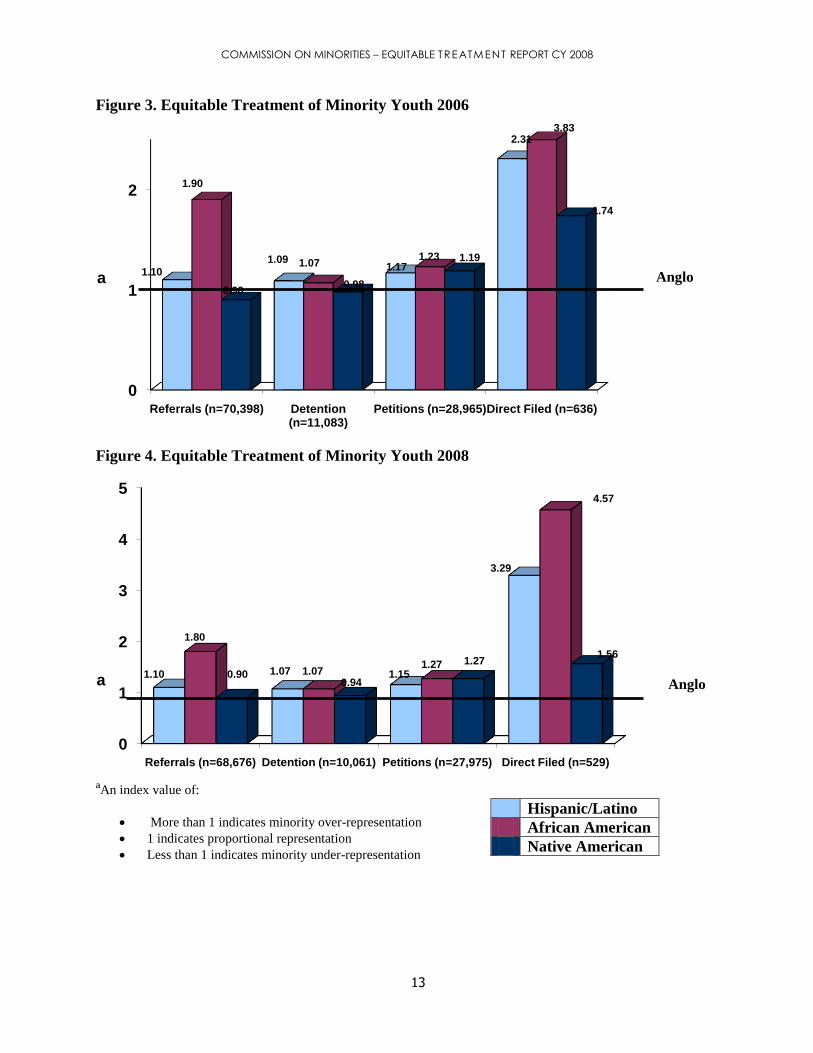
Figure 3. Equitable Treatment of Minority Youth 2006
Figure 4. Equitable Treatment of Minority Youth 2008
ªAn index value of:
More than 1 indicates minority over-representation
1 indicates proportional representation
Less than 1 indicates minority under-representation
Hispanic/Latino
African American
Native American
Anglo
0
1
2
Referrals (n=70,398) Detention (n=11,083)
Petitions (n=28,965)Direct Filed (n=636)
1.10
1.091.17
2.31
1.90
1.071.23
3.83
0.900.98
1.19
1.74
a
0
1
2
3
4
5
Referrals (n=68,676) Detention (n=10,061) Petitions (n=27,975) Direct Filed (n=529)
1.10 1.07 1.15
3.29
1.80
1.071.27
4.57
0.900.94
1.271.56
a Anglo
COMMISSION ON MINORITIES – EQUITABLE TREATM ENT REPORT CY 2008
14
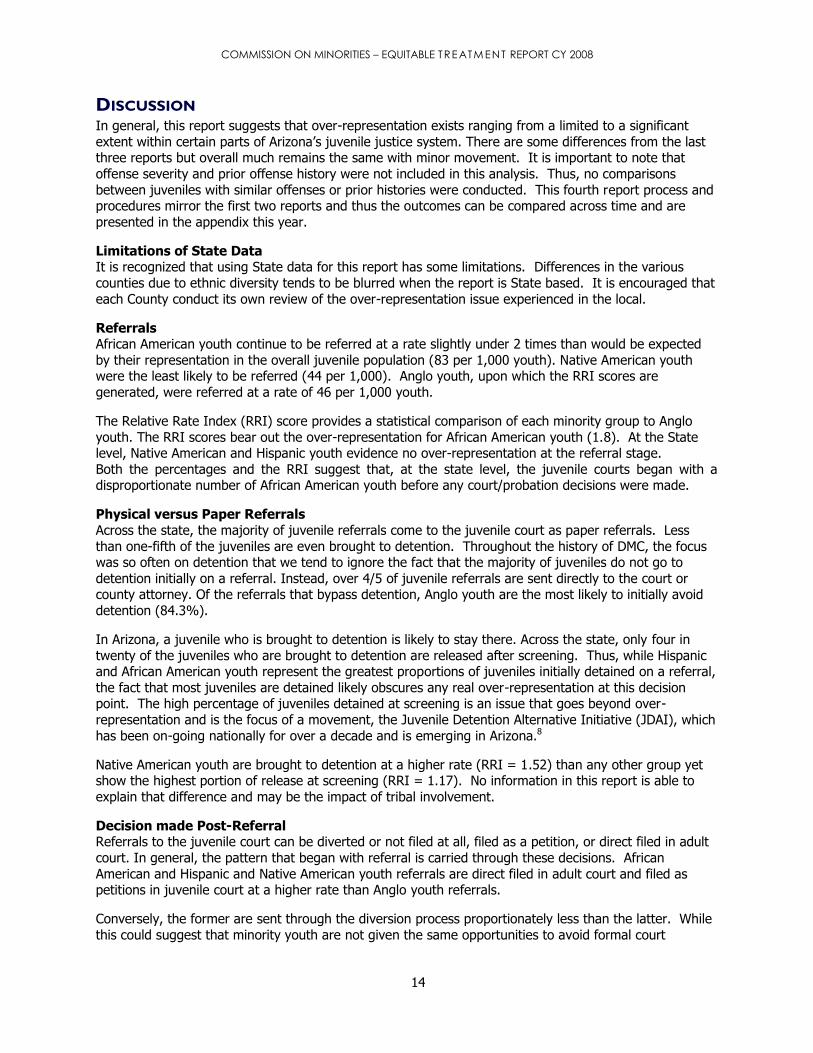
DISCUSSION In general, this report suggests that over-representation exists ranging from a limited to a significant
extent within certain parts of Arizona’s juvenile justice system. There are some differences from the last three reports but overall much remains the same with minor movement. It is important to note that
offense severity and prior offense history were not included in this analysis. Thus, no comparisons
between juveniles with similar offenses or prior histories were conducted. This fourth report process and procedures mirror the first two reports and thus the outcomes can be compared across time and are
presented in the appendix this year.
Limitations of State Data It is recognized that using State data for this report has some limitations. Differences in the various
counties due to ethnic diversity tends to be blurred when the report is State based. It is encouraged that
each County conduct its own review of the over-representation issue experienced in the local.
Referrals African American youth continue to be referred at a rate slightly under 2 times than would be expected
by their representation in the overall juvenile population (83 per 1,000 youth). Native American youth were the least likely to be referred (44 per 1,000). Anglo youth, upon which the RRI scores are
generated, were referred at a rate of 46 per 1,000 youth.
The Relative Rate Index (RRI) score provides a statistical comparison of each minority group to Anglo
youth. The RRI scores bear out the over-representation for African American youth (1.8). At the State level, Native American and Hispanic youth evidence no over-representation at the referral stage.
Both the percentages and the RRI suggest that, at the state level, the juvenile courts began with a disproportionate number of African American youth before any court/probation decisions were made.
Physical versus Paper Referrals
Across the state, the majority of juvenile referrals come to the juvenile court as paper referrals. Less
than one-fifth of the juveniles are even brought to detention. Throughout the history of DMC, the focus was so often on detention that we tend to ignore the fact that the majority of juveniles do not go to
detention initially on a referral. Instead, over 4/5 of juvenile referrals are sent directly to the court or county attorney. Of the referrals that bypass detention, Anglo youth are the most likely to initially avoid
detention (84.3%).
In Arizona, a juvenile who is brought to detention is likely to stay there. Across the state, only four in
twenty of the juveniles who are brought to detention are released after screening. Thus, while Hispanic and African American youth represent the greatest proportions of juveniles initially detained on a referral,
the fact that most juveniles are detained likely obscures any real over-representation at this decision point. The high percentage of juveniles detained at screening is an issue that goes beyond over-
representation and is the focus of a movement, the Juvenile Detention Alternative Initiative (JDAI), which
has been on-going nationally for over a decade and is emerging in Arizona.8
Native American youth are brought to detention at a higher rate (RRI = 1.52) than any other group yet show the highest portion of release at screening (RRI = 1.17). No information in this report is able to
explain that difference and may be the impact of tribal involvement.
Decision made Post-Referral Referrals to the juvenile court can be diverted or not filed at all, filed as a petition, or direct filed in adult
court. In general, the pattern that began with referral is carried through these decisions. African
American and Hispanic and Native American youth referrals are direct filed in adult court and filed as petitions in juvenile court at a higher rate than Anglo youth referrals.
Conversely, the former are sent through the diversion process proportionately less than the latter. While
this could suggest that minority youth are not given the same opportunities to avoid formal court
COMMISSION ON MINORITIES – EQUITABLE TREATM ENT REPORT CY 2008
15
processing, there are certain criteria that juveniles must meet in order to be eligible for diversion.9 The
lack of review of offense severity further limits any conclusion.
The Direct Filing process gives one cause for major concern. African American and Hispanic youth are direct filed at a much higher rate than Anglo youth. RRI of 4.57 and 3.29 indicate concern in this area.
Transfers to adult court do not have the same degree of over-representation as direct filings, but there is
evidence of over-representation at this decision point, particularly for African American and Hispanic youth referrals. The number of youth currently processed in this manner is rather small, 54 referrals in
this study. The direct file process is the main pathway to the Adult Court for juveniles. The Native
American representation here is too small to award significance. This decision point has the greatest mix of mandatory and discretionary decisions.
Dispositions
In general, juveniles in Arizona are overwhelmingly placed on probation following adjudication. More than four-fifths of all adjudicated juvenile referrals are dispositioned to either standard or intensive
probation (JIPS). All groups cluster around the same rate of being placed on probation. Intensive is
higher for Hispanic and lower for Native American youth. Juveniles in all groups were more likely to receive dispositions of standard probation with under one in five referral dispositions being to JIPS.
Alternatively, African American and Hispanic youth referrals were proportionately more represented in
commitments to the Arizona Department of Juvenile Corrections (ADJC). RRI = 1.54 and 1.41 for these groups. With Hispanics increasing while the African American decision point has decreased since the last
report.
Population Estimates
A note must be made regarding the population estimates used as the basis for the Relative Rate Index. It is a very difficult task to confirm consistency in the population estimates in Arizona for the racial/ethnic
characteristics and 8 to 17 age group. The newest census numbers for the State do not support this break out of the data and other sources are relied on for this purpose.
This is critical information for the purposes of all juvenile information be it health care, education or
juvenile justice. Without consistent information from the census department, it is difficult to review the
racial characteristics of the population.
Relative Rate Index One of the advantages of the RRI analysis is that the comparison of youth is based on a previous
decision point and not always on base population rates. Some discussion can take place as to which previous decision point should be used as the basis for the ratio. For instance, if one examines
Probation, what is the basis used for the comparison, referrals, petitions or adjudications. This document
uses adjudications as that is the decision point that allows sentencing and thus a choice for probation or some other disposition. Listed is the ratio information used to compute the RRI scores:
Referrals (Juveniles Referred : Population), Detention (Paper or Brought : All Referrals), (Detained or
Released : Brought to Detention), Court Processing (No Petition, Petition or Diversion : All Referrals)
(Direct Filed : Referrals), Post Petition (Adjudicated, Transferred or Non Adjudicated : Petitioned), Disposition (Penalty Only, Probation, ADJC : Adjudicated), (Standard or JIPS : Probation).
COMMISSION ON MINORITIES – EQUITABLE TREATM ENT REPORT CY 2008
16
GLOSSARY OF JUVENILE JUSTICE TERMS Adjudication: The proceeding in which the juvenile is found to be delinquent. In some respects, an
―adjudication‖ for a delinquent offense is the juvenile court’s equivalent of a ―criminal conviction‖ in adult court.
Arizona Department of Juvenile Corrections (ADJC): The ADJC is operated by the executive branch and is the juvenile counterpart of the Department of Corrections. ADJC operates facilitates and
programs primarily aimed at more serious juvenile offenders committed to their care and custody by the juvenile courts. ADJC operates secure correctional facilities, community-based after care programs, and
juvenile parole.
Delinquent Juvenile: A delinquent juvenile is a juvenile who commits an illegal offense. If the same offense had been committed by an adult, the offense would be a criminal act.
Detention: Juvenile detention is defined as the temporary confinement of a juvenile in a physically restricting facility. Juveniles are typically held in detention pending court hearings for purposes of public
safety, their own protection, or as a consequence for misbehavior. This report is concerned with detention as a result of a referral and not as a consequence.
Disposition: Disposition refers to the process by which the juvenile court judge decides the best court
action for the juvenile. It is comparable to ―sentencing‖ in the adult system.
Direct Filed in Adult Court: A.R.S. §13-501 mandates that the ―county attorney shall bring criminal
prosecution against a juvenile in the same manner as an adult if the juvenile is 15, 16, or 17 years of age and is accused of any of the following offenses‖: first degree murder; second degree murder;
forcible sexual assault; armed robbery; any other violent offenses defined as aggravated assault, aggravated assault with a deadly weapon, drive by shooting, and discharging a firearm at a structure; a
felony offense committed by a juvenile who has two prior and separate adjudications; and any offense
joined to the other offenses. The county attorney also has statutorily defined discretion for direct filing.
Diversion: Diversion is a process by which formal court action (prosecution) is averted. The diversion process is an opportunity for youth to admit their misdeeds and to accept the consequences without
going through a formal adjudication and disposition process. By statute, the county attorney has sole discretion to divert prosecution for juveniles accused of committing any incorrigible or delinquent offense.
Juvenile Intensive Probation (JIPS): Arizona Revised Statutes (A.R.S. §8-351) defines JIPS as ―a
program … of highly structured and closely supervised juvenile probation…which emphasizes
surveillance, treatment, work, education and home detention.‖ A primary purpose of JIPS is to reduce the commitments to the Arizona Department of Juvenile Corrections (ADJC) and other institutional or
out-of-home placements. Statute requires that all juveniles adjudicated for a second felony offense must be placed on JIPS, committed to ADJC, or sent to adult court.
Non Adjudication: Includes cases where the petition is filed but the case may be dismissed or the
juvenile turns 18 or is transferred to another jurisdiction or absconds.
No Petition Filed: Includes judicially adjusted complaints (typically juveniles assigned a consequence),
absconders, complaints where there is insufficient evidence to continue, victim refusals to prosecute, and other reasons a petition might not be filed.
Penalty Only: A disposition involving only fines, fees, restitution, and/or community work service.
Petition: A ―petition‖ is a legal document filed in the juvenile court alleging that a juvenile is a
delinquent, incorrigible, or a dependent child and requesting that the court assume jurisdiction over the youth. The petition initiates the formal court hearing process of the juvenile court. The county attorney,
COMMISSION ON MINORITIES – EQUITABLE TREATM ENT REPORT CY 2008
17
who determines what charges to bring against the juvenile, prepares the delinquent or incorrigibility
petition.
Referral: Referral can be made by police, parents, school officials, probation officers or other agencies or individuals requesting that the juvenile court assume jurisdiction over the juvenile’s conduct. Referrals
can be ―paper referrals‖ issued as citations or police reports or ―physical referrals‖ as in an actual arrest
and custody by law enforcement. Juveniles may have multiple referrals during any given year or over an extended period of time between the ages of 8-17. Multiple referrals typically signal high risk, even when
the referrals are for numerous incorrigible or relatively minor offenses.
Standard Probation: A program for the supervision of juveniles placed on probation by the court.
These juveniles are under the care and control of the court and are supervised by probation officers.
Transfer to Adult Court: Adult court has been defined in statute as the appropriate justice court, municipal court or criminal division of Superior Court with jurisdiction to hear offenses committed by
juveniles. Statute specifies that juveniles who commit certain offenses, are chronic felony offenders, or have historical prior convictions, must be prosecuted in the adult court and if convicted, are subject to
adult sentencing laws.
COMMISSION ON MINORITIES – EQUITABLE TREATM ENT REPORT CY 2008
18
End Notes 1 Equitable Treatment of Minority Youth: A Report on the Over-Representation of Minority Youth in
Arizona Juvenile Justice System. Published by the Arizona Juvenile Justice Advisory Council, Minority Youth Issues Committee. Dr. P. Bortner et al, July 1993.
2 Devine, Coolbaugh, and Jenkins, NCJ 173420 3 Equitable Treatment of Minority Youth in the Arizona Juvenile Justice System: A Follow-up to the 1993 Equitable Treatment Report Published by the Commission on Minorities, 2002.
4 Equitable Treatment of Minority Youth: First Annual Arizona Statewide Report Card 2004 Published by the Commission of Minorities. For information see website:
http://www.supreme.state.az.us/courtserv/ComMinorities/2004ReportCard.pdf 5The ―other‖ and ―unknown‖ race/ethnicity along with Asian categories are not included. The actual total of juveniles referred is 46,569.
6The figures for 2008 are the most recent data available for the state of Arizona. Data was obtained from the U.S Census Bureau, Arizona Department of Economic Security and National Center for Juvenile
Justice. Computations for ―at risk‖ population along with race and ethnic use population numbers of census with proportions computed from NCJJ Easy Access to Juvenile Populations.
7RRI – Relative Rate Index – a comparison of the rate of referral for each race/ethnicity to the rate of referral for Anglo youth. Over-representation occurs with scores greater than 1. Under-representation is
indicated by scores less than one. The RRI is not calculated when the race/ethnic group is less than 1% of the population.
8The Annie E. Casey Foundation launched the JDAI in December of 1992 and funds the efforts of juvenile jurisdictions around the nation. For more information, see their website: www.aecf.org
9The county attorney determines which juveniles are eligible for diversion based on statutorily established
criteria. In addition, the juvenile must admit responsibility and either pay restitution, pay a fine, or participate in community work service or some type of programming.