Embed Size (px)
Citation preview

ARIZONA SUPREME COURT ADMINISTRATIVE OFFICE OF THE COURTS COMMISSION ON MINORITIES
Equitable Treatment of Minority Youth
Fifth Statewide Report Card-2015
COMMISSION ON MINORITIES – EQUITABLE TREATMENT REPORT FY 2013
ii
Table of Contents:
Letter from the Commission
Executive Summary
History of DMC in Arizona
Statewide DMC Data
Appendix A: Selected Statewide Trend Lines
Appendix B: Selected County Specific RRI’s
Discussion
Glossary

COMMI SS ION ON MI NORI T I ES – EQUI TA BLE TREA TMENT REPORT FY 2013
1
MEMBERS Honorable Maurice Portley Court of Appeals, Division 1
Honorable Maria M. Avilez Sahuarita Municipal Court
Mr. Mike Baumstark Administrative Office of the Courts
Ms. Diandra D. Benally, Esq. Fort McDowell Yavapai Nation
Professor Paul D. Bennett University of Arizona James E. Rogers College of Law
Professor Patricia Ferguson-Bohnee ASU Sandra Day O'Connor College of Law
Honorable Gilberto Figueroa Superior Court in Pinal County
Judge Anna Huberman Maricopa County Justice Courts
Ms. Catharina M. Johnson Maricopa County Juvenile Probation Department
Ms. Frankie Y Jones Maricopa County Attorney's Office
Ms. Roxana Matiella Juvenile Justice Services
Mr. Kendall D. Rhyne Gila County Probation Department
Honorable Dan Slayton Coconino County Superior Court
Honorable Roxanne K. Song Ong Phoenix Municipal Court
Honorable Alma Vildosola Justice of the Peace City of Douglas
Mr. John Vivian Arizona Department of Juvenile Corrections
Honorable Penny L. Willrich, (Ret.) Summit Law School
Ms. Marian Zapata-Rossa Quarles & Brady, LLP
Message from the Commission Arizona is required, by federal law, to maintain and report data on disproportionate minority contact (DMC) on an ongoing basis and to make efforts to reduce any disparity that may exist. Arizona had been monitoring DMC on a statewide level for over a decade and partnered with local jurisdictions to combat DMC in our courts.
One notable accomplishment is the collaboration between the Governor’s Juvenile Justice Commission and the Commission on Minorities in the Judiciary in combining efforts to reduce the incidence of DMC by establishing the Arizona Statewide DMC Committee. As a result, Arizona partnered with Arizona State University to examine the data in detail and explore the factors that may contribute to the DMC, and the report of its findings, Arizona Juvenile Justice System: Disproportionate Minority Contact Assessment, was published in 2014. The Commission on Minorities in the Judiciary then reached out to the Presiding Juvenile Court Judge of each county, and their court leadership teams should be commended for their courage and commitment in paying critical attention to procedural fairness.
This is the 5th Arizona Statewide Report Card on the Equitable Treatment of Minority Youth. These reports have challenged juvenile court judges, court administration, county attorneys, and many other judicial employees and community leaders, to ensure all youth in the Arizona juvenile justice system are provided with fair and equitable justice. The report indicates improvements in some areas and things remaining unchanged in other areas, with a few decisions points getting worse.
The purpose of this report is to analyze each major decision-point in the juvenile justice continuum to determine whether all youth are receiving similar treatment. It is our intent that this report be used as a tool by juvenile court leadership teams and policy makers to prioritize and focus their efforts in creating fair outcomes for all children who have contact with Arizona’s juvenile courts.
The Commission on Minorities in the Judiciary would like to thank Helen Gandara and John Raeder with the Governor’s Juvenile Justice Commission for their commitment efforts in addressing DMC statewide. Additionally David Redpath of the Administrative Office of the Courts, and Commissioners Dr. John Vivian of the Arizona Department of Juvenile Corrections, the Honorable Maria Montano-Avilez and Professor Paul D. Bennett of the University of Arizona, James E. Rogers College of Law are to be commended for their work with producing this report and work presenting these findings with jurisdictions statewide.
Respectfully submitted,
Judge Maurice Portley Chair, Commission on Minorities in the Judiciary
This report was developed by the Arizona Supreme Court's Commission on Minorities' and David Redpath, Researcher, Juvenile Justice Services Division, Arizona Supreme Court, Administrative Office of the Courts.

COMMI SS ION ON MI NORI T I ES – EQUI TA BLE TREA TMENT REPORT FY 2013
2
Executive Summary-2015
This report is a result of the 2002 Equitable Treatment of Minority Youth report produced by the Arizona Supreme Court Commission on Minorities in the Judiciary (COM). One of the recommendations issued in that report was to create an annual report card to assess progress on the reduction of over-representation of minority youth in the juvenile justice system. The decision has been modified to produce a report card every third year.
According to the Office of Juvenile Justice and Delinquency Prevention, measuring disproportionate minority contact is like taking vital signs, it alerts one to potential problems and helps focus efforts. This report card is intended to be used as one would a general physical, to detect change and recommend appropriate action.
This report addresses the 2002 Equitable Treatment of Minority Youth recommendation by highlighting decision points from referral to the juvenile court through disposition. The first report serves as a baseline for the second, third, fourth and fifth report cards. The intent is to illustrate the current situation, provide a basis for future comparison, highlight areas of special concern and compare these results with prior report cards. It is important to note that offense severity and prior offense history are not included in the analysis of these reports. Tables illustrating Relative Rate Index (RRI’s) at various decision points across four years and by county are included in the appendix of this report.
While Arizona is enjoying unprecedented declines in the number of youth entering the system, minority youth are not fairing as well as White youth in the Arizona juvenile justice system. The following provides a summary of the results of this report.
All Youth: Juvenile delinquency activity is decreasing Only 3.25% of court-age youths were referred to juvenile court in FY2013 Minority youth are under-represented in diversion cases Only 17.93 % of all referrals are brought to detention, this is a downward trend over the last 4 years. Very little difference in rates of adjudication among all groups of youth Minority youth are more likely to be Direct Filed in adult court
A f r i c a n A m e r i c a n Y o u t h : In the 2004 report, were referred at a rate that was 2 times higher than would be expected based on
their proportion in the population. The following four reports indicate this has dropped to 1.8 times. Were Committed to ADJC and brought to detention are higher rates. The most significant finding continues to be the rate of Direct Filing in Adult Court. The overall rate
of Direct Filing for African American youth ranged from 2.92-5.62 over the 4 cohorts examined.H i s p a n i c Y o u t h :
Are under-represented at the referral decision point however they were over-represented in beingbrought to detention
Had higher rates of being petitioned and ending up on Juvenile Intensive Probation Services (JIPS). Were Direct Filed in Adult Court at 3.55 times higher than White youth—an increase from the 2010
Report Card. Are about even to the White youth on being adjudicated Had higher rates for being committed to ADJC.
A m e r i c a n I n d i a n Yo u t h : Although they are over-represented at being referred and brought to detention, they are more likely
to be released. The Direct Filed data shows a decrease from the 2006 Report card with an RRI of 1.56. Transferred
youth show under-representation for the American Indian youth, but this rate involves an extremelysmall number.
They are under-represented on Diversion, ADJC and Penalty Only.

COMMISSION ON MINORITIES – EQUITABLE TREA TMENT REPORT FY 2013
3
Arizona Has a History of Addressing Disproportionate Minority Contact
Arizona has a long history of focusing on DMC in the juvenile justice system.
1991 – 1994 Arizona was selected as one of five states to address DMC through an initiative sponsored by the Office of Juvenile Justice and Delinquency Prevention (OJJDP).
1993 The Arizona Juvenile Justice Advisory Council published the first Equitable Treatment of Minority Youth report.1 This report assessed the over-representation of minority youth in the juvenile justice system in Maricopa and Pima counties.
1998 OJJDP published DMC: Lessons Learned From Five States2 and includes Arizona as one of the five states.
2000 The Arizona Supreme Court created the Building Blocks Initiative to address DMC in Maricopa County.
2001 Pima County Juvenile Court publishes A Comparative Analysis of Minority Over- Representation in the Pima County Juvenile Justice System, 1990 versus 2000.
2002 The Arizona Supreme (COM published the second Equitable Treatment of Minority Youth report.3 This report assessed the progress made from 1990 to 2000 in Maricopa and Pima counties and recommended that an annual report card be developed.
2004 COM published the First Annual Arizona Statewide Report Card.4 This document examined the proportion of youth by race and ethnic group at various decision points in the Justice System. It also examined the information using the Relative Rate Index.
2004 Pima County selected by the Annie E. Casey Foundation as a Juvenile Detention Alternatives (JDAI) site, Disproportionate Minority Contact is included in the initiative.
2006 COM published the Second Arizona Statewide Report Card.
2008 COM published the Third Arizona Statewide Report Card.
2009 The Governor’s Juvenile Justice Commission and COM collaborate to establish the Statewide DMC Committee and commence to review individual county’s DMC data and meet with each county’s court leadership team to discuss their DMC data and to promote and support efforts to focus on areas of concern.
2010 COM publishes the Fourth Arizona Statewide Report Card. The information in this report is statewide and includes all fifteen Arizona counties. The population is a group of juveniles referred to the juvenile justice system in calendar year (CY) 2008 and followed through late July of 2009 rather than using different juveniles at each decision point. This is the Fourth Report Card and is comparable to the first three as the analysis procedures and decision points remain constant.
2013 Arizona partner’s with Arizona State University to produce “Arizona’s Juvenile Justice System: Disproportionate Minority Contact Assessment” which was a five year analysis and file review to systematically assess what might be causing DMC in Arizona.
2015 COM publishes the Fifth Arizona Statewide Report Card.

COMMISSION ON MINORITIES – EQUITABLE TREA TMENT REPORT FY 2013
4
The information in this report is statewide and includes all fifteen Arizona Counties. The population is a group of juveniles referred to the juvenile justice system in calendar years (CY) 2010 and 2011 and Fiscal Years (FY) 2012 and 2013. These youth are followed through the entire court process to accurately represent outcomes for each cohort. This is the Fifth Report Card and is comparable to the first four as the analysis procedures and decision points remain constant. New this year is the appendix in which trend data is presented as well as county specific data.

COMMISSION ON MINORITIES – EQUITABLE TR EA TMENT REPORT FY 2013
5
What i s t he Re la t i ve Ra te Index (RR I )?
The Relative Rate Index (RRI) is a measure of over/under-representation used by the Office of Juvenile Justice and Delinquency Prevention. It is designed to be an “early warning sign” measure, not an outcome. It should be used topoint out problems so that the systems attention can be more effectively focused.
The RRI is a comparison of rates of occurrence for racial/ethnic groups.
A rate of occurrence is the number of cases of a juvenile justice event (for example, referral) in terms of another event (for example, juvenile population).
The RRI is calculated by taking the rate of occurrence of referrals for one race/ethnicity divided by the rate of occurrence of referral for another race/ethnicity (for this report, the base group is always White). The RRI score is not calculated for any group whose proportion of the population is less than 1%.
For example, the rate of referral for Hispanics based on the Hispanic juvenile population (.0492) is divided by the rate of referral for Whites based on the White juvenile population (.0463).
This calculation provides a relative rate index (RRI) of 1.1 (with rounding) for Hispanic Youth (compared to the base RRI of 1.0 for White youth). This suggests that Hispanic youth are only slightly more likely to be referred to Juvenile Court than White youth.
An RRI of greater than one indicates some degree of over-representation, likewise an RRI less than one points to a degree of under-representation and warrants further attention.
JUVENILE VS. REFERRAL LEVEL DATA
Data is presented for juveniles referred in Table 1. Each number represents one juvenile. The population data comparison is the only place that juvenile level data is presented. All subsequent data is presented based on total referrals. This means that if a juvenile is referred to the juvenile court three times in a given year, each referral is reported separately.
TWO TYPES OF INFORMATION PRESENTED
This report provides two types of information: percentages and relative rates. Percentages show the proportion of that racial/ethnic group that appears at a particular decision point (referral, detention, petition, etc.) based on the preceding decision point. Relative Rates (RRI) offer a comparison to White youth. This allows for an assessment of the degree of over-representation of minority youth in the juvenile justice system (see What is the Relative Rate Index?)
It is important to realize that while the percentages may suggest differences, the RRI scores will indicate whether DMC may exist. This can happen because the proportions may look large, but when compared to the proportions for White youth, a truer picture of disparity is presented. This is the main advantage of using RRI scores in addition to percentages.
FOUR GROUPS OF JUVENILES – 19 MONTHS
The population for this report is all juveniles referred in Fiscal Year (FY) 2013. Additionally the appendix will display the same data for the preceding three years with four cohorts in and trend lines. The four years examined will be calendar years (CY) 2010 and 2011 and fiscal years FY 2012 and 2013. The juveniles referred in each of those years represent a cohort that was followed for up to 19 months until their referrals were disposed of. African American, White, Hispanic and American Indian youth are presented in this report. “Other” and “Unknown” race designations were not included in the breakouts or the totals.
Any juvenile court activity that occurred after August of 2014 was not captured for this report. Therefore, while most of the referrals are followed through disposition, some were still pending action as of August 2014.

COMMISSION ON MINORITIES – EQUITABLE TR EA TMENT REPORT FY 2013
6
DECISION POINTS REVIEWED
A decision point is one step in the juvenile justice process. This report reviews the following decision points (see the Glossary for further explanation):
Referral (paper or physical/detention) Diversion, Petition Filed, No Petition Filed, Direct filed in adult court Adjudicated, transferred to adult court, or non-adjudication Dispositions (penalty only, Department of Juvenile Corrections, or probation (standard or intensive))
All of the data on the decision points are collected either in the Juvenile On-Line Tracking System (JOLTS) or on the Integrated Court Information System (ICIS) for Maricopa County.
In 2013, 28,837 juveniles were referred to the Juvenile Court in Arizona. This represents 3.25% of the population of Arizona’s juveniles age 8 – 17 who are African American, White, Hispanic, Asian or American Indian.5
For the most recent population data, White youth made up 43% of all youth age 8 to 17 in Arizona. Hispanics accounted for slightly over 42% and African Americans, American Indians and Asians each accounted for 5. 32%, 5.17% and 3.12% respectively of the population. The RRI indicates that the rate of referral for African Americans is 1.8 times than that of Whites and that the rates of referral for Asians (0.3) and Hispanics are (0.8) are less than that that of White youth and while American Indians (1.0) were referred at the same rate as Whites.
MOST REFERRALS NEVER BROUGHT TO DETENTION In 2013, the 28,837 juveniles referred accounted for 43,066 referrals. In Arizona, about 4 out of every 5 referrals are not brought to detention (paper referral). In 2013, 58.1% of those brought to Detention were detained. This is a lower percentage than in previous year and is indicative that the Juvenile Detention Alternatives Initiative (JDAI) the Arizona Court System has implemented in many of its counties
Table 1. Arizona Population and Referrals: Youth aged 8 – 17 years of age by Race for Calendar Year 20136
Number Percentage RRI Score7
Arizona Population
Juveniles Referred5
Arizona Population
Juveniles Referred
Total Juveniles 906,445 28,837 100.00% 100% --
White 394,628 13,176 43.6 46.7 1
African American
48,254 2,834 5.3 9.8 1.8
Asian 28,269 232 3.12 0.8 0.3
Hispanic 388,453 10,960 42.9 38.0 0.8
American Indian
46,841 1,635 5.2 5.6 1

COMMISSION ON MINORITIES – EQUITABLE TR EA TMENT REPORT FY 2013
7
has been successful in ensuring only the appropriate kids are being detained for the right reasons. This is a positive outcome as one of the goals of this initiative is to reduce the inappropriate and unnecessary use of detention. In Arizona, great strides have been made to reduce this percentage over the last 4 years as Arizona has actively sought alternatives to detention while maintaining public safety.
Minorities show a higher rate of being brought to detention. However of those brought todetention centers White youth are actually detained at a higher rate than minorities; AsianAmerican Youth show the highest rate of being released.
Detained4,489
Brought toDetention
7,720
Total Referrals43,066
Released
3,231
Not Brought
To Detention35,346
Table 2: Brought to Detention or Not
Total Juvenile Referrals
White Referrals
Asian Referrals
African American Referrals
Hispanic Referrals
American Indian
Referrals
Total Referrals 43,066 19,007 322 4,486 16,761 2,490
Percentage
Not Brought to Detention
82.07% 85.17% 84.47% 79.45% 79.37% 81.08%
Brought to Detention
17.93% 14.83% 15.53% 20.55% 20.63% 18.92%
Detained 58.15% 59.77% 42.00% 46.64% 59.57% 62.21% Released 41.85% 40.23% 58.00% 53.56% 40.43% 37.79%
RRI Paper Referral
-- 1 0.9 0.9 0.9 0.9
Brought to Detention
-- 1 1.05 1.39 1.39 1.28
Detained -- 1 0.7 0.78 1 0.97 Released -- 1 1.44 1.33 1 0.94
* Percentages are of the total referrals for that racial/ethnic group

COMMISSION ON MINORITIES – EQUITABLE TR EA TMENT REPORT FY 2013
8
Of the 18% of referrals that resulted in a juvenile going to detention (physical referral): In 2013, almost 6 out of every 10 juveniles brought to a detention facility due to a referral were detained at the initial screening. The RRI scores (1.05-1.39)indicate that minority youth were over-represented in the group brought to detention. Once brought to detention, the RRI scores (.7-.97) indicate that minority groups of juveniles were less likely to be detained. This positive outcome was not seen in previous report cards this may be attributed to the increased utilization of objective detention screening tools implemented across the state to assist in the detention decision.
TO FORMALLY PROCESS IN COURT OR NOT?
Referrals may result in formal court processing (Petitions or Direct File to Adult Court) or informal court processing (Diversion or No Petition Filed). It is possible for a referral to be diverted and then be filed as a petition if the consequence (sanction) is not completed. Of the 43,066 referrals filed in 2013, there were only petitions filed on 16,368 (28.2%).
Minority Youth were more likely to petitioned and Direct Filed on than White youth.
Diversion is a process that allows juveniles to avoid formal court processing if one or more conditionsare completed and the juveniles accept responsibility for the offenses. Of the 43,066 referrals filed in
Diversion13,471
No Petition Filed13,002
Petition Filed16,332
Direct Filed In Adult Court
261
Total Referrals43,066
Table 3: Formal and Informal Court Processing
All Juvenile Referrals
White Referrals
Asian Referrals
African American Referrals
Hispanic Referrals
American Indian Referrals
Total Referrals 43,066 19,007 322 4,486 16,761 2,490 Percentage No Petition 30.19% 30.30% 23.29% 29.22% 26.97% 28.79% Diversion 31.28 32.91 45.34 27.6 31.35 23.17 Petition Filed 37.92 33.54 31.06 41.82 40.83 45.7 Direct Filed 0.6 0.24 0.31 1.36 0.86 0.36
RRI No Petition -- 1 0.7 0.88 0.81 0.92 Diversion -- 1 1.38 0.84 0.95 0.7 Petition Filed -- 1 0.93 1.25 1.22 1.36 Direct Filed -- 1 1.28 5.62 3.55 1.49
* Percentages are of the total referrals for that racial/ethnic group.* Column percentages may not sum to 100%. Some referrals in the “No Petition” group may be pending decision.
COMMISSION ON MINORITIES – EQUITABLE TREA TMENT REPORT FY 2013
9
2013, 13,471 (31.3%) were diverted. In general, African American, Hispanic and American Indian youth referrals were under-represented at the Diversion decision point with RRIs ranging from 0.7 to 0.95, while Asian youth were afforded the opportunity more often than white youth with an RRI of 1.38. African American, Asian, Hispanic and American Indian youth are also under-represented at the No Petition point. The converse of this is all minority groups other than Asians were over-represented on the Petition Filed decision point (RRI Range 1.22-1.36). All minority youth were more likely to be direct filed in adult court than White youth with African American youth most likely to be direct filed on with a rate that is over 5 times that of White youth. This is a future challenge for Arizona and an area to target moving forward.
Referrals for Minority Youth were More Likely to be Filed as Petitions.
A petition is filed when a juvenile is alleged to be delinquent or incorrigible and formal court processing is warranted. Of the 43,066 referrals filed in 2013, 16,332 (37.92%) resulted in petitions filed in juvenile court. The actual number of petitions is less than this because multiple referrals may be contained in a single petition.
41.82% of African American referrals filed in 2013 resulted in a petition. This compares to 40.83% for Hispanic youth, 45.70% for American Indian youth, 31.06% for Asian youth and 33.54% for White youth. The RRI score paints a picture that suggests that the referrals of minority youth are more likely to be filed as petitions than White youth (.93-1.36).
Minority Youth Referrals were More Likely to be Direct Filed in Adult Court
A juvenile aged 15 or older must be directly filed into adult court if accused of murder, forcible sexual assault, armed robbery, or other specified violent offenses. A juvenile will also be directly filed if previously convicted in adult court or if the juvenile has two prior felony adjudications and is arrested for a third felony. Finally, a juvenile who is 14 and a chronic offender or who is 14 or older and has committed one of a specified set of offenses may be directly filed in adult court at the discretion of the county attorney.
The direct filings in Arizona having been decreasing dramatically in number of the last five years, close to a 50% decline. Less than one percent (261 or 0.61%) of the total referrals in 2013 resulted in a direct file to adult court. Nonetheless, the decline in total numbers of youth effected hasn’t stemmed the significant over-representation exists at this decision point.
The rates of Direct Filing for Asian, Hispanic and American Indian youth referrals was higher (1.28, 3.55 and 1.49, respectively) than for White youth. African American youth referrals had a Direct Filing rate 5.62 times higher than White youth. These findings are the most serious DMC findings in the state and invite an further examination. While the number of youth involved is smaller than most decision points, making the relative rates across races more easily impacted by a small number of cases, adult charging is likely to have the greatest impact on the youth’s future.
FOLLOWING THE PETITION
This section of the report looks at three general categories of outcome that follow a petition: adjudicated, transfer to adult court (pending a transfer hearing), and non-adjudication.

COMMISSION ON MINORITIES – EQUITABLE TR EA TMENT REPORT FY 2013
10
Of the 16,332 petitions filed in FY 2013, 5,697 (34.88%) were not adjudicated. Adjudication is the juvenile equivalent of a “conviction” in adult court. Of the 16,332 referrals resulting in petitions filed, 65.03% (10,621) were adjudicated. There were no major differences in the rates of adjudication between White and Minority youth. Rates of adjudication were lower for Asian, American Indian and African American youth while the Hispanic rate of adjudication was very comparable to that of White youth (1.01). This finding is a positive one for Arizona’s courts as it demonstrates in the court room, where there rules of evidence and representation for the youth exists, minority youth can expect similar outcomes to White youth. American Indian Youth Petitions were less likely to Fall Under “Non Adjudication.” In addition to adjudication and transfer to adult court, a petition may result in no further action taken. This is generally called “dismissed,” in which case the juvenile is not adjudicated delinquent. These cases can also involve situations in which a juvenile has turned 18, is transferred to another jurisdiction, has absconded, plead to another charge or the court rules there is insufficient evidence to merit an adjudication. In addition, when multiple charges are pending, one charge can be dismissed while another receives a disposition.
The RRI scores suggest that American Indians (0.92) and Hispanics (0.99)had a slightly lower non-adjudication rate than White youth. On the other hand, African American (1.24) and Asian youth (1.14),, had a higher rate of non-adjudication as White youth, which is positive outcome for these youth.
Non Adjudication 5,697
Adjudication 10,621
Transfer to Adult Court
14
Petitions Filed 16,332
Table 4: Post Petition Decisions
All Juvenile Referrals
White
Referrals Asian
Referrals
African American Referrals
Hispanic Referrals
American Indian Referrals
Petition Filed 16,332 6,375 100 1,876 6,843 1,138
Percentage Adjudicated 65.03% 65.65% 61 57.52% 68.04% 68.28% Transferred 0.08 0.08 0 0.11 0.07 0.18
RRI Adjudicated -- 1 0.93 0.88 1.01 1.04 Transferred -- 1 0 1.36 0.92 2.24
* Percentages are of the total referrals for that racial/ethnic group.

COMMISSION ON MINORITIES – EQUITABLE TREA TMENT REPORT FY 2013
11
African Americans had the highest proportion of non-adjudication (42.38%) and Native America youth had the lowest (31.6%).
The county attorney may request that a juvenile be transferred to adult court following the filing of a petition in juvenile court. Of the 16,322 petitions filed in juvenile court, 14 (0.08%) referrals resulted in a transfer to adult court request. As the total number of youth transferred is less than 1% of the petitions filed the comparison of the rates provides little value.
DISPOSITION OPTIONS
Probation 8,501
Penalty Only323
ADJC603
Adjudication 10,621

COMMISSION ON MINORITIES – EQUITABLE TR EA TMENT REPORT FY 2013
12
Little Difference in the Rates of Receiving Probation for White and Minority Youth Four-fifths (80 %) of the adjudicated referral dispositions were to probation. The RRI scores indicate that all minority are less likely to receive a disposition of probation than white youth. Hispanics and American Indian youth are less likely to receive Standard Probation and are more likely to be placed on JIPS than their white counterparts.
African American and Hispanic Youth Referrals Committed to ADJC at a Higher Rate than
White and American Indian Youth Referrals. Disposition to the Arizona Department of Juvenile Corrections (ADJC) is governed by statute and the Arizona Code of Judicial Administration. Only 5.6% of the adjudicated referrals from FY2013 involved commitments to ADJC.
African American (RRI=1.72) and Hispanic (RRI=1.19) youth referrals had a higher rate of commitment to ADJC than White youth referrals. The percentages support this as well (8.7%, 6.0% and 5.1% respectively).
Asian youth (4.9% and an RRI of 0.91) and American Indians (2.8% and an RRI of 0.56) had a lower rates of referral to ADJC.
Table 5: Disposition Decisions
All Juvenile White Asian African American
Hispanic American Indian
Adjudications Adjudications Adjudications Adjudications Adjudications Adjudications
Adjudicated 10,621 4,185 61 1,079 4,519 777
Percentage
Probation 80.04 81.51 72.13 73.49 78.54 82.37
Standard 61.12 64.87 65.57 62.19 56.83 64.09
JIPS 19.53 17.54 6.56 18.07 22.04 18.66
ADJC 5.68 5.07 4.92 8.71 6.02 2.83
RRI
Probation -- 1 0.88 0.97 0.96 1.01
Standard -- 1 1.01 0.96 0.88 0.99
JIPS -- 1 0.37 1.03 1.26 1.06
ADJC -- 1 0.97 1.72 1.19 0.56
* Percentages are of the total referrals for that racial/ethnic group.
A
COMMISSION ON MINORITIES – EQUITABLE TR EA TMENT REPORT FY 2013
13
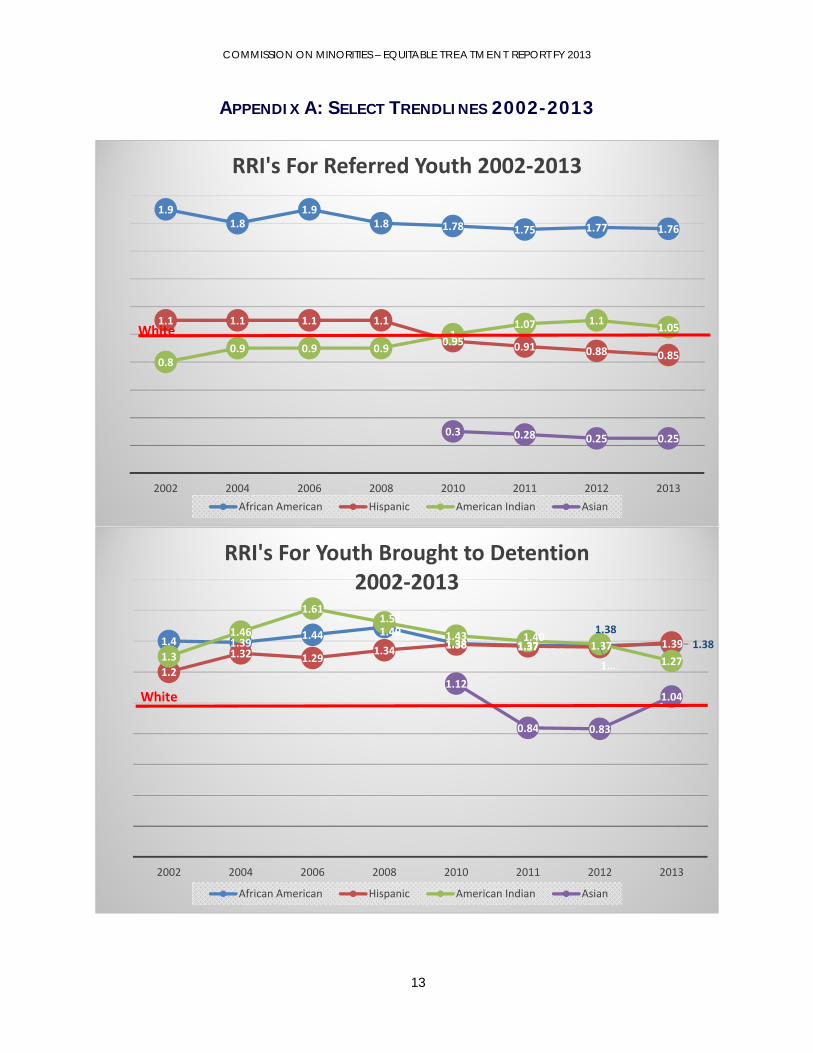
APPENDIX A: SELECT TRENDLINES 2002-2013
1.91.8
1.91.8 1.78 1.75 1.77 1.76
1.1 1.1 1.1 1.1
0.95 0.91 0.88 0.850.8
0.9 0.9 0.91
1.07 1.11.05
0.3 0.28 0.25 0.25
2002 2004 2006 2008 2010 2011 2012 2013
RRI's For Referred Youth 2002‐2013
African American Hispanic American Indian Asian
White
1.4 1.391.44 1.49
1.38 1.37 1.37 1.38
1.2
1.32 1.291.34 1.38 1.37
1…
1.391.3
1.46
1.611.52
1.43 1.401.38
1.27
1.12
0.84 0.83
1.04
2002 2004 2006 2008 2010 2011 2012 2013
RRI's For Youth Brought to Detention2002‐2013
African American Hispanic American Indian Asian
White

COMMISSION ON MINORITIES – EQUITABLE TR EA TMENT REPORT FY 2013
14
11.04
1.07 1.071.04
0.98 0.99
0.78
11.06
1.09 1.071.04 1.04 1.06
1
0.9 0.89
0.980.94
0.980.92
0.95
1.04
0.68
0.75 0.740.7
2002 2004 2006 2008 2010 2011 2012 2013
RRI's For Detained Youth 2002‐2013
African American Hispanic American Indian Asian
White
1.3
1.21.23 1.27 1.29
1.22 1.211.25
1.2 1.21.17 1.15
1.211.25 1.24 1.22
1.1 1.1
1.191.27
1.37 1.371.40
1.36
0.86
0.75 0.76
0.93
2002 2004 2006 2008 2010 2011 2012 2013
RRI's For PetitionedYouth2002‐2013
African American Hispanic American Indian Asian
White

COMMISSION ON MINORITIES – EQUITABLE TR EA TMENT REPORT FY 2013
15
1.61.49
2
1.54
1.841.77
2.01
1.721.6
1.31 1.36 1.41 1.411.33 1.28
1.19
10.9 0.86
0.73
1.1
0.76 0.81
0.56
0.79
0.35 0.37 0.37
2002 2004 2006 2008 2010 2011 2012 2103
RRI's For ADJC Committed Youth2002‐2013
African American Hispanic American Indian Asian
Anglo
1.7
3.3
3.83
4.58 4.55
4.07
4.64
5.62
2.21.9
2.31
3.29
4.00
3.62 3.61 3.55
1.2
0.68
1.741.56
1.07
2.21 2.15
1.49
3.49
0.00
2.95
1.28
2002 2004 2006 2008 2010 2011 2012 2013
RRI's For Direct Filed Youth2002‐2013
African American Hispanic American Indian Asian
White

COMMISSION ON MINORITIES – EQUITABLE TREA TMENT REPORT FY 2013
16
APPENDIX B: SELECT COUNTY SPECIFIC RRI’S
TABLE 1:
RRI's of Juveniles Referred FY2013 by County
Asian African
American Hispanic American
Indian White
Arizona 0.25 1.76 0.85 1.05 1.00
Apache 4.17 0.20 0.52 0.06 1.00
Cochise 0.34 1.11 0.62 1.50 1.00
Coconino 0.25 2.00 1.04 1.21 1.00
Gila 1.58 0.97 0.55 0.37 1.00
Graham 0.00 * 0.48 0.54 1.00
Greenlee 0.00 0.00 0.28 0.52 1.00
La Paz 0.00 0.65 0.40 0.00 1.00
Maricopa 0.22 2.05 0.82 1.76 1.00
Mohave 0.13 * 0.37 0.73 1.00
Navajo 0.24 * 0.85 0.47 1.00
Pima 0.36 1.95 1.03 1.48 1.00
Pinal 0.48 2.26 0.85 1.27 1.00
Santa Cruz 0.00 * 1.83 0.00 1.00
Yavapai 0.39 1.28 0.69 1.55 1.00
Yuma 0.58 1.85 1.00 2.41 1.00 *LESS THAN 5 CASES IN THE CELL, MAKING THE RRI SPURIOUS.

COMMISSION ON MINORITIES – EQUITABLE TREA TMENT REPORT FY 2013
17
TABLE 2:
*LESS THAN 5 CASES IN THE CELL, MAKING THE RRI SPURIOUS.
RRI's Juveniles With Petitions Filed FY2013 by County
Asian African American
Hispanic American Indian
White
Arizona 0.93 1.25 1.22 1.36 1.00
Apache * * 0.65 0.93 1.00
Cochise 1.71 1.15 0.98 * 1.00
Coconino * 1.50 1.31 1.34 1.00
Gila * 1.33 1.15 1.09 1.00
Graham * 1.49 1.03 1.28 1.00
Greenlee * * 1.10 * 1.00
La Paz * * 0.71 * 1.00
Maricopa 1.00 1.50 1.45 1.46 1.00
Mohave 0.00 1.17 1.39 1.55 1.00
Navajo 0.00 0.94 1.13 1.10 1.00
Pima 1.40 1.22 1.09 1.02 1.00
Pinal 0.73 * 1.14 1.33 1.00
Santa Cruz * 1.75 0.92 * 1.00
Yavapai 0.40 1.39 1.08 1.25 1.00
Yuma 0.77 1.01 0.96 1.35 1.00

COMMISSION ON MINORITIES – EQUITABLE TREA TMENT REPORT FY 2013
18
DISCUSSION
In general, this report suggests that over-representation exists ranging from a limited to a significant extent within certain parts of Arizona’s juvenile justice system. There are some minor differences across the last 11 years presented in the Appendix, however overall much remains the same with minor movement. The most significant over-representation to of minority populations exists at the deep end involvement with the juvenile justice system, with commitments to ADJC and the Direct filing of youth in Adult Court. This fifth report card was developed using the same process and procedures that mirror the first four reports and thus the outcomes can be compared across time. Four new years of data are presented in the appendix this year. Limitations of State Data It is important to note that offense severity and prior offense history were not included in this analysis. Thus, no comparisons between juveniles with similar offenses or prior histories were conducted. It is recognized that using state data for this report has some limitations. Differences in the various counties due to ethnic diversity tends to be blurred when the report is state based. It is encouraged that each county conduct its own review of the over-representation issue experienced in their local. The Commission on Minorities has prepared County data for the counties to consume this year. Referrals African American youth continue to be referred at a rate slightly under 2 times than would be expected by their representation in the overall juvenile population (50 per 1,000 youth). Asian youth were the least likely to be referred (8 per 1,000). White youth, the baseline upon which the RRI scores are generated, were referred at a rate of 33 per 1,000 youth. The Relative Rate Index (RRI) score provides a statistical comparison of each minority group to White youth. The RRI scores bear out the over-representation for African American youth (1.8). At the State level, American Indian and Hispanic youth evidence no over-representation at the referral stage. Both the percentages and the RRI suggest that, at the state level, the juvenile courts began with a disproportionate number of African American youth before any court/probation decisions were made. Physical versus Paper Referrals Across the state, the majority of juvenile referrals come to the juvenile court as paper referrals. Less than one-fifth of the juveniles are even brought to detention. Instead, over 4/5 of juvenile referrals are sent directly to the court or county attorney. Of the referrals that bypass detention, White youth are the most likely to initially avoid detention (85.2%). In Arizona, just under four in ten juveniles who are brought to detention are released after screening. This is a significant improvement from previous years. This improvement can be attributed to the work occurring in the JDAI initiative and in the implementation of the mandatory use of and objective detention screening instrument through the Arizona Detention Standards. Eighty-five percent of the state’s juvenile population reside in JDAI participating counties which are: Cochise, Gila, Maricopa, Pima, Pinal, Santa Cruz and Yuma.8
Hispanic and African American youth are brought to detention at a higher rate (RRI = 1.38) than other groups yet show the equal likelihood or increased likelihood of release at screening (RRI’s of 1.0 and 1.33). Decision made Post-Referral Referrals to the juvenile court can be diverted or not filed at all, filed as a petition, or direct filed in adult court. In general, the pattern that began with referral is carried through these decisions. African

COMMISSION ON MINORITIES – EQUITABLE TREA TMENT REPORT FY 2013
19
American and Hispanic and American Indian youth referrals are direct filed in adult court and filed as petitions in juvenile court at a higher rate than White youth referrals. Conversely, the former are sent through the diversion process proportionately less than the latter. While this could suggest that minority youth are not given the same opportunities to avoid formal court processing, there are certain criteria that juveniles must meet in order to be eligible for diversion.9 The lack of review of offense severity further limits any conclusion about what are the forces that are causing this phenomenon. Regardless of the cause, the courts are in possession of this data have an obligation to educate others on it in an effort to mitigate and eliminate this issue for future generations. The Direct Filing process gives one cause for major concern. African American and Hispanic youth are direct filed at a much higher rate than White youth. RRI of 5.26 and 3.55 indicate concern in this area. Transfers to adult court do not have the same degree of over-representation as direct filings, but there is evidence of over-representation at this decision point, particularly for African American and Hispanic youth referrals. The number of youth currently processed in this manner is very small, 14 referrals in this study. The direct file process is the main pathway to the Adult Court for juveniles. The American Indian and Asian representation here is too small to award significance. This decision point has a mix of mandatory and discretionary decisions. Dispositions In general, juveniles in Arizona are overwhelmingly placed on probation following adjudication. More than four-fifths of all adjudicated juvenile referrals are dispositioned to either standard or intensive probation (JIPS). All groups cluster at around the same rate of being placed on probation. Intensive is higher for Hispanic and lower for American Indian youth. Juveniles in all groups were more likely to receive dispositions of standard probation with under one in five referral dispositions being to JIPS. Alternatively, African American and Hispanic youth referrals were proportionately more represented in commitments to the Arizona Department of Juvenile Corrections (ADJC), RRI = 1.72 and 1.19 for these groups. With Hispanics decreasing while the African American decision point has increased since the last report. Population Estimates A note must be made regarding the population estimates used as the basis for the Relative Rate Index. It is a very difficult task to confirm consistency in the population estimates in Arizona for the racial/ethnic characteristics and 8 to 17 age group. The baseline for the juvenile populations come from estimates compiled at the National Center for Juvenile Justice. Relative Rate Index One of the advantages of the RRI analysis is that the comparison of youth is based on a previous decision point and not always on base population rates. Some discussion can take place as to which previous decision point should be used as the basis for the ratio. For instance, if one examines Probation, what is the basis used for the comparison, referrals, petitions or adjudications. This document uses adjudications as that is the decision point that allows sentencing and thus a choice for probation or some other disposition. As you can see, we have attempted to “reset” the bar at each decision point so they can viewed independently. Listed is the ratio information used to compute the RRI scores:
Referrals (Juveniles Referred : Population), Detention (Paper or Brought : All Referrals), (Detained or Released : Brought to Detention), Court Processing (No Petition, Petition or Diversion : All Referrals) (Direct Filed : Referrals), Post-Petition (Adjudicated, Transferred or Non Adjudicated : Petitioned), Disposition (Penalty Only, Probation, ADJC : Adjudicated), (Standard or JIPS : Probation).

COMMISSION ON MINORITIES – EQUITABLE TREA TMENT REPORT FY 2013
20
GLOSSARY OF JUVENILE JUSTICE TERMS Adjudication: The proceeding in which the juvenile is found to be delinquent. In some respects, an “adjudication” for a delinquent offense is the juvenile court’s equivalent of a “criminal conviction” in adult court. Arizona Department of Juvenile Corrections (ADJC): The ADJC is operated by the executive branch and is the juvenile counterpart of the Department of Corrections. ADJC operates facilitates and programs primarily aimed at more serious juvenile offenders committed to their care and custody by the juvenile courts. ADJC operates secure correctional facilities, community-based after care programs, and juvenile parole. Delinquent Juvenile: A delinquent juvenile is a juvenile who commits an illegal offense. If the same offense had been committed by an adult, the offense would be a criminal act. Detention: Juvenile detention is defined as the temporary confinement of a juvenile in a physically restricting facility. Juveniles are typically held in detention pending court hearings for purposes of public safety, their own protection, or as a consequence for misbehavior. This report is concerned with detention as a result of a referral and not as a consequence. Disposition: Disposition refers to the process by which the juvenile court judge decides the best court action for the juvenile. It is comparable to “sentencing” in the adult system. Direct Filed in Adult Court: A.R.S. §13-501 mandates that the “county attorney shall bring criminal prosecution against a juvenile in the same manner as an adult if the juvenile is 15, 16, or 17 years of age and is accused of any of the following offenses”: first degree murder; second degree murder; forcible sexual assault; armed robbery; any other violent offenses defined as aggravated assault, aggravated assault with a deadly weapon, drive by shooting, and discharging a firearm at a structure; a felony offense committed by a juvenile who has two prior and separate adjudications; and any offense joined to the other offenses. The county attorney also has statutorily defined discretion for direct filing. Diversion: Diversion is a process by which formal court action (prosecution) is averted. The diversion process is an opportunity for youth to admit their misdeeds and to accept the consequences without going through a formal adjudication and disposition process. By statute, the county attorney has sole discretion to divert prosecution for juveniles accused of committing any incorrigible or delinquent offense. Juvenile Intensive Probation (JIPS): Arizona Revised Statutes (A.R.S. §8-351) defines JIPS as “a program … of highly structured and closely supervised juvenile probation…which emphasizes surveillance, treatment, work, education and home detention.” A primary purpose of JIPS is to reduce the commitments to the Arizona Department of Juvenile Corrections (ADJC) and other institutional or out-of-home placements. Statute requires that all juveniles adjudicated for a second felony offense must be placed on JIPS, committed to ADJC, or sent to adult court. Non Adjudication: Includes cases where the petition is filed but the case may be dismissed or the juvenile turns 18 or is transferred to another jurisdiction or absconds. No Petition Filed: Includes judicially adjusted complaints (typically juveniles assigned a consequence), absconders, complaints where there is insufficient evidence to continue, victim refusals to prosecute, and other reasons a petition might not be filed. Penalty Only: A disposition involving only fines, fees, restitution, and/or community work service. Petition: A “petition” is a legal document filed in the juvenile court alleging that a juvenile is a delinquent, incorrigible, or a dependent child and requesting that the court assume jurisdiction over the youth. The petition initiates the formal court hearing process of the juvenile court. The county attorney,
COMMISSION ON MINORITIES – EQUITABLE TREA TMENT REPORT FY 2013
21
who determines what charges to bring against the juvenile, prepares the delinquent or incorrigibility petition.
Referral: Referral can be made by police, parents, school officials, probation officers or other agencies or individuals requesting that the juvenile court assume jurisdiction over the juvenile’s conduct. Referrals can be “paper referrals” issued as citations or police reports or “physical referrals” as in an actual arrest and custody by law enforcement. Juveniles may have multiple referrals during any given year or over an extended period of time between the ages of 8-17. Multiple referrals typically signal high risk, even when the referrals are for numerous incorrigible or relatively minor offenses.
Standard Probation: A program for the supervision of juveniles placed on probation by the court. These juveniles are under the care and control of the court and are supervised by probation officers. Transfer to Adult Court: Adult court has been defined in statute as the appropriate justice court, municipal court or criminal division of Superior Court with jurisdiction to hear offenses committed by juveniles. Statute specifies that juveniles who commit certain offenses, are chronic felony offenders, or have historical prior convictions, must be prosecuted in the adult court and if convicted, are subject to adult sentencing laws.

COMMISSION ON MINORITIES – EQUITABLE TREA TMENT REPORT FY 2013
22
End Notes
1Equitable Treatment of Minority Youth: A Report on the Over-Representation of Minority Youth in Arizona Juvenile Justice System. Published by the Arizona Juvenile Justice Advisory Council, Minority Youth Issues Committee. Dr. P. Bortner et al, July 1993. 2 Devine, Coolbaugh, and Jenkins, NCJ 173420 3Equitable Treatment of Minority Youth in the Arizona Juvenile Justice System: A Follow-up to the 1993 Equitable Treatment Report Published by the Commission on Minorities, 2002. 4 Equitable Treatment of Minority Youth: First Annual Arizona Statewide Report Card 2004 Published by the Commission of Minorities. For information see website: http://www.supreme.state.az.us/courtserv/ComMinorities/2004ReportCard.pdf 5The “other” and “unknown” race/ethnicity categories are not included. The actual total of juveniles referred is 29,382.
6The figures for 2013 are the most recent data available for the state of Arizona. Data was obtained from the National Center for Juvenile Justice. Computations for the “at risk” population, (i.e., 8-17 year old youth) along with race and ethnicity come from the NCJJ’s Easy Access to Juvenile Populations. 7RRI – Relative Rate Index – a comparison of the rate of referral for each race/ethnicity to the rate of referral for White youth. Over-representation occurs with scores greater than 1. Under-representation is indicated by scores less than one. The RRI is not calculated when the race/ethnic group is less than 1% of the population. 8The Annie E. Casey Foundation launched the JDAI in December of 1992 and funds the efforts of juvenile jurisdictions around the nation. For more information, see their website: www.aecf.org 9The county attorney determines which juveniles are eligible for diversion based on statutorily established criteria. In addition, the juvenile must admit responsibility and either pay restitution, pay a fine, or participate in community work service or some type of programming.