Embed Size (px)
Citation preview

AREA AND POPULATION
1. AREA AND POPULATION
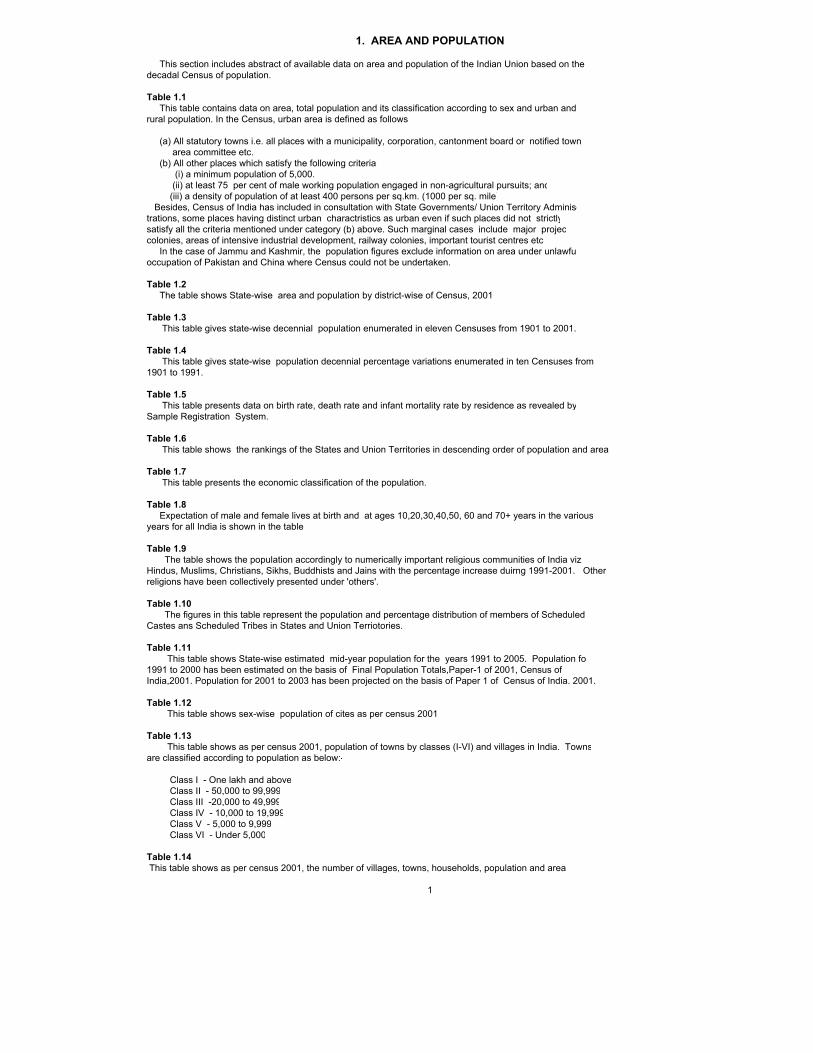
This section includes abstract of available data on area and population of the Indian Union based on thedecadal Census of population.
Table 1.1 This table contains data on area, total population and its classification according to sex and urban andrural population. In the Census, urban area is defined as follows
(a) All statutory towns i.e. all places with a municipality, corporation, cantonment board or notified town area committee etc. (b) All other places which satisfy the following criteria: (i) a minimum population of 5,000. (ii) at least 75 per cent of male working population engaged in non-agricultural pursuits; and (iii) a density of population of at least 400 persons per sq.km. (1000 per sq. mile) Besides, Census of India has included in consultation with State Governments/ Union Territory Adminis-trations, some places having distinct urban charactristics as urban even if such places did not strictlysatisfy all the criteria mentioned under category (b) above. Such marginal cases include major projeccolonies, areas of intensive industrial development, railway colonies, important tourist centres etc In the case of Jammu and Kashmir, the population figures exclude information on area under unlawfuoccupation of Pakistan and China where Census could not be undertaken.
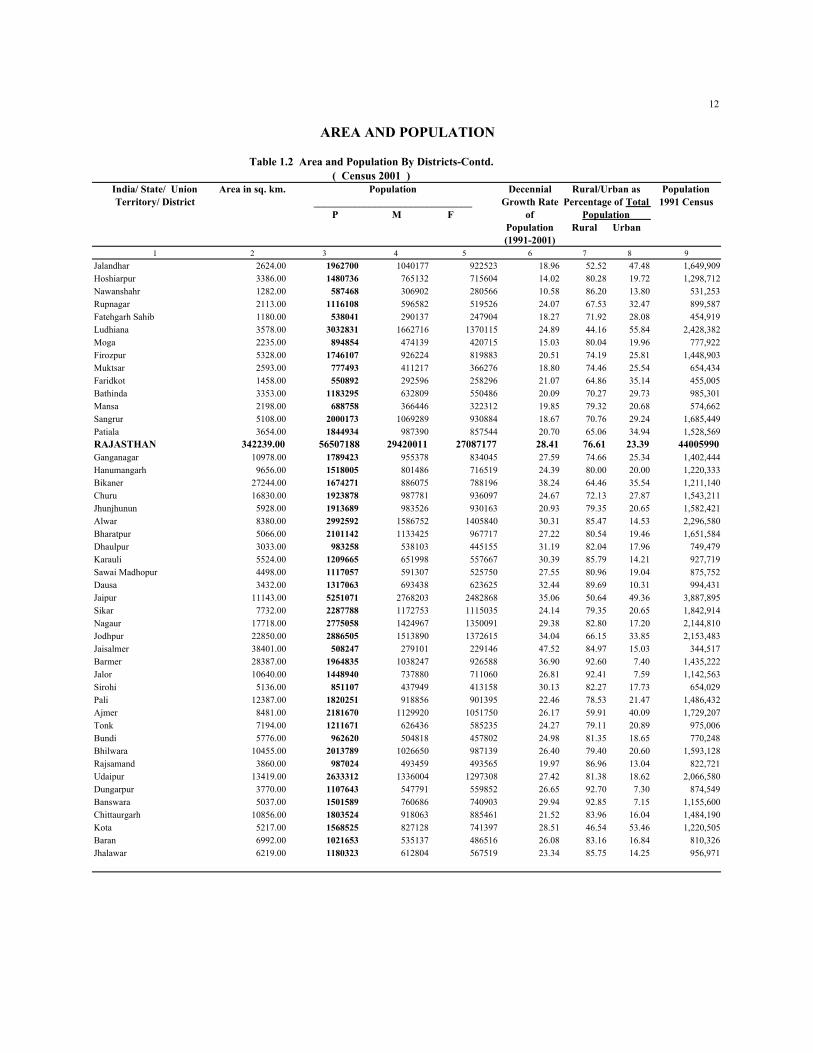
Table 1.2 The table shows State-wise area and population by district-wise of Census, 2001
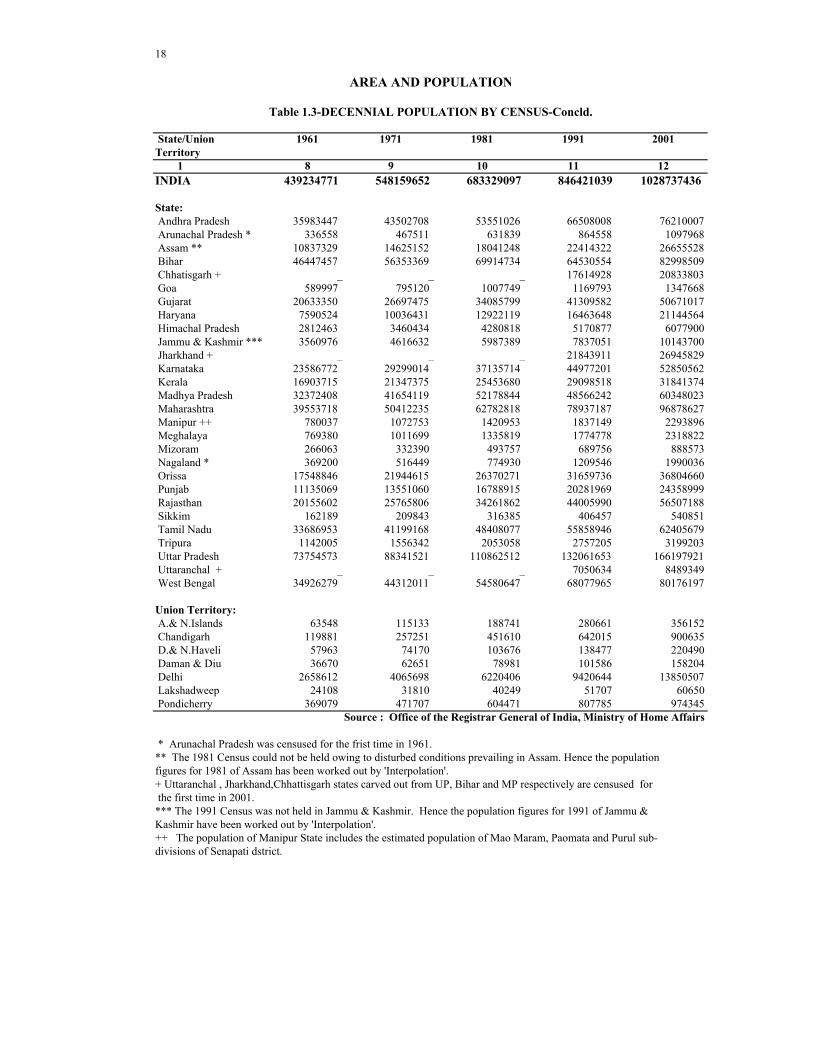
Table 1.3 This table gives state-wise decennial population enumerated in eleven Censuses from 1901 to 2001.
Table 1.4 This table gives state-wise population decennial percentage variations enumerated in ten Censuses from 1901 to 1991.
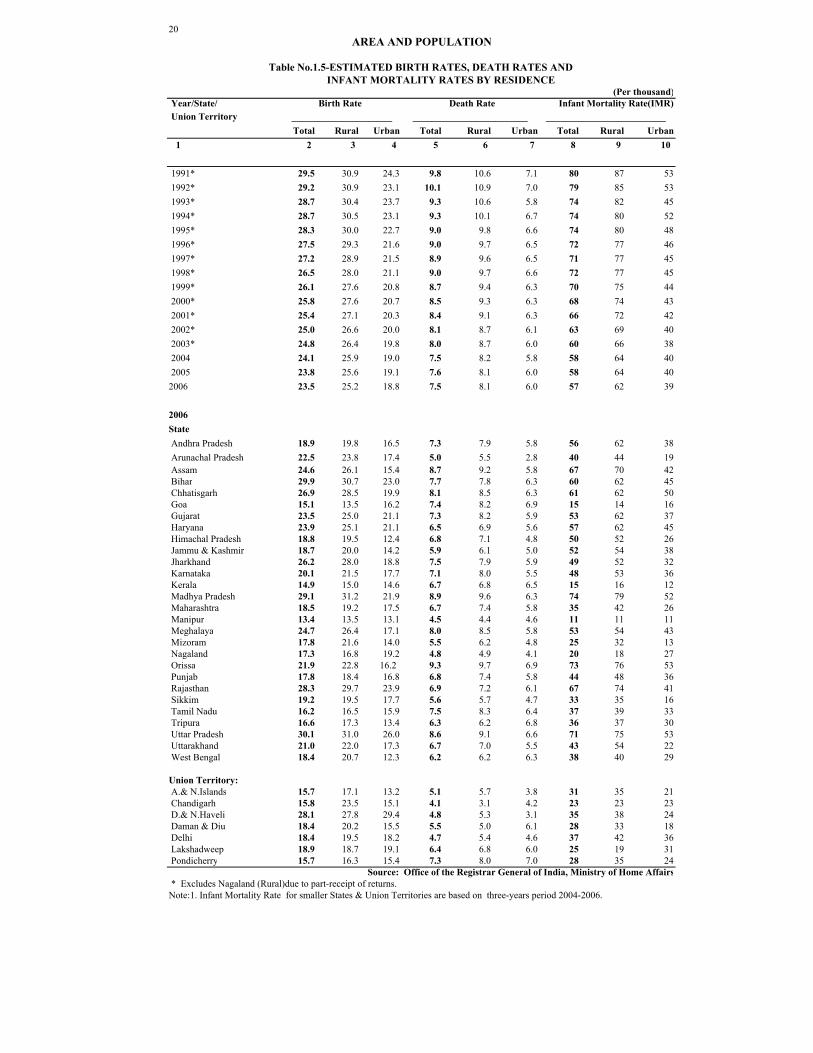
Table 1.5 This table presents data on birth rate, death rate and infant mortality rate by residence as revealed bySample Registration System.
Table 1.6 This table shows the rankings of the States and Union Territories in descending order of population and area
Table 1.7 This table presents the economic classification of the population.
Table 1.8 Expectation of male and female lives at birth and at ages 10,20,30,40,50, 60 and 70+ years in the variousyears for all India is shown in the table.
Table 1.9 The table shows the population accordingly to numerically important religious communities of India vizHindus, Muslims, Christians, Sikhs, Buddhists and Jains with the percentage increase duirng 1991-2001. Other religions have been collectively presented under 'others'.
Table 1.10 The figures in this table represent the population and percentage distribution of members of Scheduled Castes ans Scheduled Tribes in States and Union Terriotories.
Table 1.11 This table shows State-wise estimated mid-year population for the years 1991 to 2005. Population fo1991 to 2000 has been estimated on the basis of Final Population Totals,Paper-1 of 2001, Census of India,2001. Population for 2001 to 2003 has been projected on the basis of Paper 1 of Census of India. 2001. Table 1.12 This table shows sex-wise population of cites as per census 2001
Table 1.13 This table shows as per census 2001, population of towns by classes (I-VI) and villages in India. Townsare classified according to population as below:-
Class I - One lakh and above Class II - 50,000 to 99,999 Class III -20,000 to 49,999 Class IV - 10,000 to 19,999 Class V - 5,000 to 9,999 Class VI - Under 5,000
Table 1.14 This table shows as per census 2001, the number of villages, towns, households, population and area
1

2
India/ State/ Area in Union Territory sq. kms. Males Females Persons Rural Urban
(M) (F) (P) 1 2 3 4 5 6 7
INDIA (1) ++ 3287263* 532223090+ 496514346+ 1028737436+ 742617747+ 286119689+
State: Andhra Pradesh 275045 38527413 37682594 76210007 55401067 20808940 Arunachal Pradesh 83743 579941 518027 1097968 870087 227881 Assam 78438 13777037 12878491 26655528 23216288 3439240 Bihar 94163 43243795 39754714 82998509 74316709 8681800 Chhattisgarh 135191 10474218 10359585 20833803 16648056 4185747 Goa 3702 687248 660420 1347668 677091 670577 Gujarat 196024 26385577 24285440 50671017 31740767 18930250 Haryana 44212 11363953 9780611 21144564 15029260 6115304 Himachal Pradesh 55673 3087940 2989960 6077900 5482319 595581 Jammu & Kashmir (1) ++ 222236 5360926 4782774 10143700 7627062 2516638 Jharkhand 79714 13885037 13060792 26945829 20952088 5993741 Karnataka 191791 26898918 25951644 52850562 34889033 17961529 Kerala 38863 15468614 16372760 31841374 23574449 8266925 Madhya Pradesh 308245 31443652 28904371 60348023 44380878 15967145 Maharashtra 307713 50400596 46478031 96878627 55777647 41100980 Manipur + 22327 1161952 1131944 2293896 1717928 575968 Meghalaya 22429 1176087 1142735 2318822 1864711 454111 Mizoram 21081 459109 429464 888573 447567 441006 Nagaland 16579 1047141 942895 1990036 1647249 342787 Orissa 155707 18660570 18144090 36804660 31287422 5517238 Punjab 50362 12985045 11373954 24358999 16096488 8262511 Rajasthan 342239 29420011 27087177 56507188 43292813 13214375 Sikkim 7096 288484 252367 540851 480981 59870 Tamil Nadu 130058 31400909 31004770 62405679 34921681 27483998 Tripura 10486 1642225 1556978 3199203 2653453 545750 Uttar Pradesh 240928 87565369 78632552 166197921 131658339 34539582Uttarakhand 53483 4325924 4163425 8489349 6310275 2179074 West Bengal 88752 41465985 38710212 80176197 57748946 22427251
Union Territory: A.& N.Islands 8249 192972 163180 356152 239954 116198 Chandigargh 114 506938 393697 900635 92120 808515 D.& N.Haveli 491 121666 98824 220490 170027 50463 Daman & Diu 112 92512 65692 158204 100856 57348 Delhi 1483 7607234 6243273 13850507 944727 12905780 Lakshadweep 32 31131 29519 60650 33683 26967 Pondicherry 479 486961 487384 974345 325726 648619
Census could not be taken.
under illegal occupation of Pakistan, 5,180 sq. km.illegally handed over by Pakistan to China and 37,555 sq.km.
sub divsions were cancelled due to administrative and technical reasons.
* The area figures of States and U.T's do not add up to area of India because :(i) The shortfall of 7 square km. area of Madhya Pradesh and 3 square km. area of Chhattisgarh is yet to be resolved by the Survey of India.( ii ) Disputed area of 13 square km. between Pondicherry and Andhra Pradesh is neither included in Pondicherry nor in Andhra Pradesh.
the households of Mao Maram, Paomata and Purul sub divisions, as the census results for 2001 Census for these
(1) The population figures excludes population of the area under unlawful occupation of Pakistan and China where
++ Area figures includes the area under unlawaful occupation of Pakistan and China. The area includes 78,114 sq.km
+ The population of India, Manipur State and Senapati District by sex includes estimated population and excludes under illegal occupation of China.
Source: Office of Registrar General of India, Ministry of Home Affairs
AREA AND POPULATION
TABLE 1.1- AREA AND POPULATION BY STATES(Census-2001)
Population

3
India/ State/ Union Territory/ District
Area in sq. km. Decennial Growth Rate
of Population (1991-2001)
Population 1991 Census
1 2 3 4 5 6 7 8 9
INDIA ++ * 3287263.00* 1028737436+ 532223090+ 496514346+ 21.11 72.19 27.81 849,421,039
ANDHRA PRADESH 275045.00 76210007 38527413 37682594 14.59 72.70 27.30 66508008Adilabad 16105.00 2488003 1250958 1237045 19.47 73.47 26.53 2,082,479Nizamabad 7956.00 2345685 1162905 1182780 15.12 81.89 18.11 2,037,621Karimnagar 11823.00 3491822 1747968 1743854 14.96 80.56 19.44 3,037,486Medak 9700.00 2670097 1352446 1317651 17.64 85.64 14.36 2,269,800Hyderabad 217.00 3829753 1981173 1848580 21.74 0.00 100.00 3,145,939Rangareddi 7493.00 3575064 1839227 1735837 40.09 45.80 54.20 2,551,966Mahbubnagar 18432.00 3513934 1782340 1731594 14.20 89.43 10.57 3,077,050Nalgonda 14240.00 3247982 1651990 1595992 13.88 86.68 13.32 2,852,092Warangal 12846.00 3246004 1644895 1601109 15.15 80.80 19.20 2,818,832Khammam 16029.00 2578927 1305543 1273384 16.39 80.19 19.81 2,215,809Srikakulam 5837.00 2537593 1260020 1277573 9.33 89.02 10.98 2,321,126Vizianagaram 6539.00 2249254 1119541 1129713 6.55 81.67 18.33 2,110,943Visakhapatnam 11161.00 3832336 1930197 1902139 16.66 60.05 39.95 3,285,092East Godavari 10807.00 4901420 2459640 2441780 7.93 76.50 23.50 4,541,222West Godavari 7742.00 3803517 1910038 1893479 8.13 80.26 19.74 3,517,568Krishna 8727.00 4187841 2117401 2070440 13.22 67.92 32.08 3,698,833Guntur 11391.00 4465144 2250279 2214865 8.72 71.20 28.80 4,106,999Prakasam 17626.00 3059423 1552332 1507091 10.88 84.72 15.28 2,759,166Nellore 13076.00 2668564 1344935 1323629 11.55 77.55 22.45 2,392,260Cuddapah 15359.00 2601797 1318093 1283704 14.58 77.41 22.59 2,270,720Kurnool 17658.00 3529494 1796214 1733280 18.72 76.84 23.16 2,973,024Anantapur 19130.00 3640478 1859588 1780890 14.45 74.74 25.26 3,180,863Chittoor 15151.00 3745875 1889690 1856185 14.86 78.35 21.65 3,261,118ARUNACHAL PRADESH 83743.00 1097968 579941 518027 27.00 79.25 20.75 864558Tawang 2172.00 38924 21846 17078 37.60 78.48 21.52 28,287West Kameng 7422.00 74599 42542 32057 32.22 91.03 8.97 56,421East Kameng 4134.00 57179 28802 28377 13.46 73.76 26.24 50,395Papum Pare 3462.00 122003 64184 57819 67.56 49.15 50.85 72,811Lower Subansiri 9548.00 98244 49542 48702 18.13 87.39 12.61 83,167Upper Subansiri 7032.00 55346 28240 27106 10.50 71.53 28.47 50,086West Siang 8325.00 103918 54349 49569 15.55 79.68 20.32 89,936East Siang 3603.00 87397 45265 42132 21.61 74.87 25.13 71,864Upper Siang 6590.00 33363 18057 15306 20.10 100.00 0.00 27,779Dibang Valley 13029.00 57720 31442 26278 34.02 82.49 17.51 43,068Lohit 11402.00 143527 77314 66213 30.83 81.35 18.65 109,706Changlang 4662.00 125422 65821 59601 31.29 90.12 9.88 95,530Tirap 2362.00 100326 52537 47789 17.33 84.76 15.24 85,508ASSAM 78438.00 26655528 13777037 12878491 18.92 87.10 12.90 22414322Kokrajhar 3538.00 905764 466191 439573 12.00 92.94 7.06 808,730Dhubri 2798.00 1637344 841044 796300 23.63 88.25 11.75 1,324,404Goalpara 1824.00 822035 420251 401784 23.03 91.86 8.14 668,138Bongaigaon 2152.00 904835 465240 439595 12.05 87.87 12.13 807,523Barpeta 3245.00 1647201 848578 798623 18.87 92.30 7.70 1,385,659Kamrup 4345.00 2522324 1326981 1195343 26.11 63.99 36.01 2,000,071
Table 1.2 Area and Population By Districts( Census 2001 )
Population _______________________________
P M F
Rural/Urban as Percentage of Total
Population Rural Urban
AREA AND POPULATION

4
India/ State/ Union Territory/ District
Area in sq. km. Decennial Growth Rate
of Population (1991-2001)
Population 1991 Census
1 2 3 4 5 6 7 8 9Nalbari 2257.00 1148824 592375 556449 13.03 97.61 2.39 1,016,390Darrang 3481.00 1504320 773861 730459 15.82 .. .. 1,298,860Marigaon 1551.00 776256 398926 377330 21.35 95.11 4.89 639,682Nagaon 3973.00 2314629 1190950 1123679 22.26 87.98 12.02 1,893,171Sonitpur 5324.00 1681513 871568 809945 18.06 89.55 10.45 1,424,287Lakhimpur 2277.00 889010 455691 433319 18.30 92.67 7.33 751,517Dhemaji 3237.00 571944 294643 277301 19.45 93.21 6.79 478,830Tinsukia 3790.00 1150062 601099 548963 19.51 80.53 19.47 962,298Dibrugarh 3381.00 1185072 613555 571517 13.68 80.72 19.28 1,042,457Sibsagar 2668.00 1051736 545476 506260 15.83 90.76 9.24 907,983Jorhat 2851.00 999221 517015 482206 14.69 82.85 17.15 871,206Golaghat 3502.00 946279 490286 455993 14.27 91.43 8.57 828,096Karbi Anglong 10434.00 813311 422250 391061 22.72 88.70 11.30 662,723North Cachar Hills 4888.00 188079 99822 88257 24.72 68.40 31.60 150,801Cachar 3786.00 1444921 743042 701879 18.89 86.06 13.94 1,215,385Karimganj 1809.00 1007976 517680 490296 21.87 92.67 7.33 827,063Hailakandi 1327.00 542872 280513 262359 20.89 91.88 8.12 449,048BIHAR 94163.00 82998509 43243795 39754714 28.62 89.54 10.46 64530554Pashchim Champaran 5228.00 3043466 1600839 1442627 30.42 89.83 10.17 2,333,666Purba Champaran 3968.00 3939773 2077047 1862726 29.47 93.63 6.37 3,043,061Sheohar 349.00 515961 273680 242281 36.61 95.88 4.12 377,699Sitamarhi 2294.00 2682720 1417611 1265109 33.22 94.29 5.71 2,013,796Madhubani 3501.00 3575281 1840997 1734284 26.24 96.52 3.48 2,832,024Supaul 2425.00 1732578 902207 830371 29.02 94.91 5.09 1,342,841Araria 2830.00 2158608 1128105 1030503 33.94 93.87 6.13 1,611,638Kishanganj 1884.00 1296348 669552 626796 31.73 90.05 9.95 984,107Purnia 3229.00 2543942 1328417 1215525 35.40 91.26 8.74 1,878,885Katihar 3057.00 2392638 1246872 1145766 31.08 90.88 9.12 1,825,380Madhepura 1788.00 1526646 797180 729466 29.63 95.55 4.45 1,177,706Saharsa 1687.00 1508182 789432 718750 33.18 91.70 8.30 1,132,413Darbhanga 2279.00 3295789 1722189 1573600 31.26 91.89 8.11 2,510,959Muzaffarpur 3172.00 3746714 1951466 1795248 26.84 90.70 9.30 2,953,903Gopalganj 2033.00 2152638 1075710 1076928 26.31 93.93 6.07 1,704,310Siwan 2219.00 2714349 1336283 1378066 25.03 94.49 5.51 2,170,971Saran 2641.00 3248701 1652661 1596040 26.26 90.81 9.19 2,572,980Vaishali 2036.00 2718421 1415603 1302818 26.67 93.13 6.87 2,146,065Samastipur 2904.00 3394793 1760692 1634101 24.95 96.36 3.64 2,716,929Begusarai 1918.00 2349366 1228874 1120492 29.46 95.42 4.58 1,814,773Khagaria 1486.00 1280354 679267 601087 29.69 94.04 5.96 987,227Bhagalpur 2569.00 2423172 1291658 1131514 26.87 81.33 18.67 1,909,967Banka 3020.00 1608773 843293 765480 24.47 96.49 3.51 1,292,504Munger 1419.00 1137797 607730 530067 20.58 72.06 27.94 943,583Lakhisarai 1228.00 802225 417672 384553 24.11 85.32 14.68 646,395Sheikhpura 689.00 525502 273992 251510 25.04 84.53 15.47 420,260Nalanda 2355.00 2370528 1238599 1131929 18.75 85.08 14.92 1,996,257Patna 3202.00 4718592 2519942 2198650 30.41 58.43 41.57 3,618,211
AREA AND POPULATION
Table 1.2 Area and Population By Districts- Contd. ( Census 2001 )
Population _______________________________
P M F
Rural/Urban as Percentage of Total
Population Rural Urban

5
India/ State/ Union Territory/ District
Area in sq. km. Decennial Growth Rate
of Population (1991-2001)
Population 1991 Census
1 2 3 4 5 6 7 8 9Bhojpur 2395.00 2243144 1179611 1063533 25.12 86.07 13.93 1,792,771Buxar 1703.00 1402396 738354 664042 28.94 90.80 9.20 1,087,676Kaimur (Bhabua) 3362.00 1289074 677623 611451 31.10 96.76 3.24 983,269Rohtas 3851.00 2450748 1283485 1167263 27.82 86.67 13.33 1,917,416Jehanabad 1569.00 1514315 784946 729369 28.89 92.63 7.37 1,174,900Aurangabad 3305.00 2013055 1040945 972110 30.72 91.55 8.45 1,539,988Gaya 4976.00 3473428 1792163 1681265 30.34 86.30 13.70 2,664,803Nawada 2494.00 1809696 929960 879736 33.10 92.35 7.65 1,359,694Jamui 3098.00 1398796 729138 669658 33.03 92.62 7.38 1,051,527CHHATTISGARH 135191.00 20833803 10474218 10359585 18.27 79.91 20.09 17614928Koriya 6604.00 586327 301251 285076 17.09 70.19 29.81 500,758Surguja 15731.00 1972094 1000050 972044 24.67 93.04 6.96 1,581,872Jashpur 5838.00 743160 371697 371463 13.23 95.40 4.60 656,352Raigarh 7086.00 1265529 634597 630932 18.72 86.61 13.39 1,065,939Korba 6599.00 1011823 515147 496676 22.51 63.73 36.27 825,891Janjgir - Champa 3852.00 1317431 659388 658043 18.67 88.97 11.03 1,110,200Bilaspur 8270.00 1998355 1013875 984480 17.91 75.65 24.35 1,694,883Kawardha 4223.00 584552 291963 292589 13.84 92.32 7.68 513,496Rajnandgaon 8068.00 1283224 634342 648882 17.83 81.95 18.05 1,089,047Durg 8549.00 2810436 1417893 1392543 17.24 61.85 38.15 2,397,134Raipur 13083.00 3016930 1523925 1493005 19.29 69.58 30.42 2,529,166Mahasamund 4789.00 860257 426201 434056 8.73 88.65 11.35 791,197Dhamtari 3385.00 706591 352524 354067 20.23 86.76 13.24 587,679Kanker 6506.00 650934 324636 326298 18.68 95.18 4.82 548,476Bastar 14974.00 1306673 649801 656872 18.73 90.05 9.95 1,100,571Dantewada 17634.00 719487 356928 362559 15.62 92.77 7.23 622,267GOA 3702.00 1347668 687248 660420 15.21 50.24 49.76 1169793North Goa 1736.00 758573 388502 370071 14.10 54.95 45.05 664,804South Goa 1966.00 589095 298746 290349 16.66 44.18 55.82 504,989GUJARAT 196024.00 50671017 26385577 24285440 22.66 62.64 37.36 41309582Kachchh 45652.00 1583225 815152 768073 25.40 70.00 30.00 1,262,507Banas Kantha 10757.00 2504244 1297404 1206840 26.38 89.00 11.00 1,981,513Patan 5740.00 1182709 612100 570609 14.16 79.84 20.16 1,036,019Mahesana 4371.00 1837892 953842 884050 12.05 77.60 22.40 1,640,251Sabar Kantha 7390.00 2082531 1069554 1012977 18.25 89.19 10.81 1,761,086Gandhinagar 2166.00 1334455 697999 636456 23.86 64.98 35.02 1,077,406Ahmadabad 8087.00 5816519 3074556 2741963 26.79 19.82 80.18 4,587,491Surendranagar 10489.00 1515148 787650 727498 25.34 73.44 26.56 1,208,872Rajkot 11203.00 3169881 1642018 1527863 26.08 48.71 51.29 2,514,122Jamnagar 14125.00 1904278 981320 922958 21.79 56.09 43.91 1,563,558Porbandar 2298.00 536835 275821 261014 14.35 51.31 48.69 469,472Junagadh 8846.00 2448173 1252350 1195823 17.07 70.94 29.06 2,091,182
Population _______________________________
P M F
Rural/Urban as Percentage of Total
Population Rural Urban
AREA AND POPULATION
Table 1.2 Area and Population By Districts- Contd.( Census 2001 )

6
India/ State/ Union Territory/ District
Area in sq. km. Decennial Growth Rate
of Population (1991-2001)
Population 1991 Census
1 2 3 4 5 6 7 8 9Amreli 7397.00 1393918 701593 692325 6.50 77.55 22.45 1,308,867Bhavnagar 9981.00 2469630 1274920 1194710 19.31 62.14 37.86 2,069,953Anand 2941.00 1856872 972000 884872 13.04 72.64 27.36 1,642,615Kheda 4219.00 2024216 1052823 971393 13.29 79.92 20.08 1,786,794Panch Mahals 5210.00 2025277 1044937 980340 20.39 87.49 12.51 1,682,333Dohad 3655.00 1636433 824208 812225 28.44 90.45 9.55 1,274,123Vadodara 7550.00 3641802 1897368 1744434 19.87 54.80 45.20 3,038,127Narmada 2755.00 514404 263986 250418 14.47 89.87 10.13 449,376Bharuch 6527.00 1370656 713676 656980 19.37 74.28 25.72 1,148,252Surat 7657.00 4995174 2722539 2272635 47.01 40.03 59.97 3,397,900The Dangs 1764.00 186729 93974 92755 29.59 100.00 0.00 144,091Navsari 2209.00 1229463 628988 600475 13.24 72.64 27.36 1,085,692Valsad 3035.00 1410553 734799 675754 29.65 72.98 27.02 1,087,980HARYANA 44212.00 21144564 11363953 9780611 28.43 71.08 28.92 16463648Panchkula 898.00 468411 256939 211472 50.91 55.51 44.49 310,396Ambala 1574.00 1014411 542977 471434 25.78 64.80 35.20 806,482Yamunanagar 1768.00 1041630 559444 482186 29.19 62.27 37.73 806,279Kurukshetra 1530.00 825454 442328 383126 23.32 73.89 26.11 669,346Kaithal 2317.00 946131 510513 435618 21.02 80.61 19.39 781,814Karnal 2520.00 1274183 683368 590815 23.06 73.49 26.51 1,035,390Panipat 1268.00 967449 528860 438589 38.58 59.47 40.53 698,103Sonipat 2122.00 1279175 695723 583452 22.39 74.88 25.12 1,045,158Jind 2702.00 1189827 642282 547545 21.36 79.70 20.30 980,434Fatehabad 2538.00 806158 427862 378296 24.76 82.37 17.63 646,160Sirsa 4277.00 1116649 593245 523404 23.59 73.72 26.28 903,536Hisar 3983.00 1537117 830520 706597 27.11 74.10 25.90 1,209,238Bhiwani 4778.00 1425022 758253 666769 22.49 81.03 18.97 1,163,400Rohtak 1745.00 940128 509038 431090 21.00 64.94 35.06 776,966Jhajjar 1834.00 880072 476475 403597 23.06 77.83 22.17 715,136Mahendragarh 1899.00 812521 423578 388943 19.16 86.51 13.49 681,869Rewari 1594.00 765351 403034 362317 25.34 82.21 17.79 610,611Gurgaon 2714.00 1660289 886451 773838 44.87 77.77 22.23 1,146,090Faridabad 2151.00 2194586 1193063 1001523 48.56 44.35 55.65 1,477,240HIMACHAL PRADESH 55673.00 6077900 3087940 2989960 17.54 90.20 9.80 5170877Chamba 6522.00 460887 235218 225669 17.19 92.51 7.49 393,286Kangra 5739.00 1339030 661254 677776 14.05 94.60 5.40 1,174,072Lahul and Spiti 13841.00 33224 18441 14783 6.17 100.00 0.00 31,294Kullu 5503.00 381571 198016 183555 26.17 92.11 7.89 302,432Mandi 3950.00 901344 447872 453472 16.10 93.23 6.77 776,372Hamirpur 1118.00 412700 196593 216107 11.80 92.68 7.32 369,128Una 1540.00 448273 224524 223749 18.51 91.21 8.79 378,269Bilaspur 1167.00 340885 171263 169622 15.40 93.56 6.44 295,387Solan 1936.00 500557 270291 230266 30.94 81.78 18.22 382,268Sirmaur 2825.00 458593 241299 217294 20.78 89.61 10.39 379,695Shimla 5131.00 722502 380996 341506 17.02 76.85 23.15 617,404Kinnaur 6401.00 78334 42173 36161 9.91 100.00 0.00 71,270
Population _______________________________
P M F
Rural/Urban as Percentage of Total
Population Rural Urban
Table 1.2 Area and Population By Districts- Contd.( Census 2001 )
AREA AND POPULATION

7
India/ State/ Union Territory/ District
Area in sq. km. Decennial Growth Rate
of Population (1991-2001)
Population 1991 Census
1 2 3 4 5 6 7 8 9JAMMU & KASHMIR ++ 222236.00 10143700 5360926 4782774 29.43 75.19 24.81 7837051Kupwara 2379.00 650393 341303 309090 39.58 96.08 3.92 465,948Baramula 4588.00 1169780 614816 554964 31.28 83.22 16.78 891,044Srinagar 2228.00 1202447 649491 552956 29.50 21.31 78.69 928,526Badgam 1371.00 629309 326050 303259 30.10 88.78 11.22 483,698Pulwama 1398.00 652607 335544 317063 26.39 89.50 10.50 516,350Anantnag 3984.00 1172434 610007 562427 32.77 85.64 14.36 883,043Leh (Ladakh) 45110.00 117232 64306 52926 30.15 75.57 24.43 90,076Kargil 14036.00 119307 64955 54352 33.55 91.07 8.93 89,334Doda 11691.00 691929 363526 328403 26.84 93.11 6.89 545,527Udhampur 4550.00 743509 399686 343823 27.30 84.31 15.69 584,051Punch 1674.00 372613 194213 178400 28.17 93.56 6.44 290,727Rajauri 2630.00 483284 257336 225948 25.71 93.04 6.96 384,435Jammu 3097.00 1588772 850302 738470 29.01 55.86 44.14 1,231,553Kathua 2651.00 550084 289391 260693 21.50 85.69 14.31 452,739JHARKHAND 79714.00 26945829 13885037 13060792 23.36 77.76 22.24 21843911Garhwa 4044.00 1035464 535332 500132 29.21 95.88 4.12 801,350Palamu 8705.00 2098359 1084417 1013942 27.19 94.04 5.96 1,649,841Chatra 3706.00 791434 404067 387367 29.17 94.69 5.31 612,713Hazaribag 5965.00 2277475 1167793 1109682 24.04 76.77 23.23 1,836,068Kodarma 1494.00 499403 249549 249854 26.51 82.63 17.37 394,763Giridih 4919.00 1904430 960679 943751 27.29 93.57 6.43 1,496,189Deoghar 2479.00 1165390 608878 556512 24.89 86.28 13.72 933,113Godda 2110.00 1047939 544043 503896 21.69 96.47 3.53 861,182Sahibganj 1599.00 927770 477662 450108 25.91 89.42 10.58 736,835Pakaur 1806.00 701664 358545 343119 24.35 94.87 5.13 564,253Dumka 6212.00 1759602 897364 862238 17.64 93.47 6.53 1,495,709Dhanbad 2089.00 2397102 1278946 1118156 22.96 47.63 52.37 1,949,526Bokaro 2880.00 1777662 938436 839226 22.23 54.74 45.26 1,454,416Ranchi 7698.00 2785064 1436976 1348088 25.79 64.89 35.11 2,214,048Lohardaga 1491.00 364521 184507 180014 26.18 87.33 12.67 288,886Gumla 9077.00 1346767 675769 670998 16.71 94.52 5.48 1,153,976Pashchimi Singhbhum 9907.00 2082795 1054641 1028154 16.49 83.15 16.85 1,787,955Purbi Singhbhum 3533.00 1982988 1027433 955555 22.93 44.97 55.03 1,613,088KARNATAKA 191791.00 52850562 26898918 25951644 17.51 66.01 33.99 44977201Belgaum 13415.00 4214505 2150090 2064415 17.61 75.97 24.03 3,583,606Bagalkot 6575.00 1651892 834247 817645 18.82 71.03 28.97 1,390,259Bijapur 10494.00 1806918 926424 880494 17.51 78.08 21.92 1,537,731Gulbarga 16224.00 3130922 1592789 1538133 21.25 72.77 27.23 2,582,169Bidar 5448.00 1502373 771022 731351 19.63 77.04 22.96 1,255,799Raichur 8441.00 1669762 841840 827922 23.52 74.80 25.20 1,351,809Koppal 5575.00 1196089 603312 592777 24.84 83.42 16.58 958,078Gadag 4656.00 971835 493533 478302 13.13 64.79 35.21 859,042Dharwad 4260.00 1604253 823204 781049 16.68 45.03 54.97 1,374,895Uttara Kannada 10291.00 1353644 686876 666768 10.93 71.34 28.66 1,220,260Haveri 4823.00 1439116 740469 698647 13.39 79.22 20.78 1,269,213
( Census 2001 )Population
_______________________________ P M F
Rural/Urban as Percentage of Total
Population Rural Urban
Table 1.2 Area and Population By Districts- Contd.
AREA AND POPULATION

8
India/ State/ Union Territory/ District
Area in sq. km. Decennial Growth Rate
of Population (1991-2001)
Population 1991 Census
1 2 3 4 5 6 7 8 9Bellary 8450.00 2027140 1029714 997426 22.41 65.13 34.87 1,656,000Chitradurga 8440.00 1517896 776221 741675 15.63 81.93 18.07 1,312,717Davanagere 5924.00 1790952 917705 873247 14.86 69.68 30.32 1,559,222Shimoga 8477.00 1642545 830559 811986 13.10 65.24 34.76 1,452,259Udupi 3880.00 1112243 522231 590012 7.14 81.45 18.55 1,038,099Chikmagalur 7201.00 1140905 574911 565994 12.15 80.48 19.52 1,017,283Tumkur 10597.00 2584711 1313801 1270910 12.10 80.38 19.62 2,305,819Kolar 8223.00 2536069 1286193 1249876 14.40 75.33 24.67 2,216,889Bangalore 2190.00 6537124 3426599 3110525 35.09 11.89 88.11 4,839,162Bangalore Rural 5815.00 1881514 962183 919331 12.45 78.35 21.65 1,673,194Mandya 4961.00 1763705 888034 875671 7.26 83.97 16.03 1,644,374Hassan 6814.00 1721669 859086 862583 9.68 82.30 17.70 1,569,684Dakshina Kannada 4560.00 1897730 938434 959296 14.59 61.57 38.43 1,656,165Kodagu 4102.00 548561 274831 273730 12.31 86.26 13.74 488,455Mysore 6854.00 2641027 1344670 1296357 15.75 62.81 37.19 2,281,653Chamarajanagar 5101.00 965462 489940 475522 9.29 84.66 15.34 883,365KERALA 38863.00 31841374 15468614 16372760 9.43 74.04 25.96 29098518Kasaragod 1992.00 1204078 588083 615995 12.37 80.59 19.41 1,071,508Kannur 2966.00 2408956 1152817 1256139 6.98 49.65 50.35 2,251,727Wayanad 2131.00 780619 391273 389346 16.14 96.21 3.79 672,128Kozhikode 2344.00 2879131 1399358 1479773 9.89 61.75 38.25 2,619,941Malappuram 3550.00 3625471 1754576 1870895 17.09 90.18 9.82 3,096,330Palakkad 4480.00 2617482 1266985 1350497 9.88 86.38 13.62 2,382,235Thrissur 3032.00 2974232 1422052 1552180 8.66 71.78 28.22 2,737,311Ernakulam 3068.00 3105798 1538397 1567401 9.35 52.44 47.56 2,840,279Idukki 4358.00 1129221 566682 562539 7.03 94.90 5.10 1,055,023Kottayam 2208.00 1953646 964926 988720 6.86 84.65 15.35 1,828,271Alappuzha 1414.00 2109160 1014529 1094631 5.39 70.54 29.46 2,001,217Pathanamthitta 2637.00 1234016 589398 644618 3.84 89.97 10.03 1,188,332Kollam 2491.00 2585208 1249621 1335587 7.38 81.98 18.02 2,407,566Thiruvananthapuram 2192.00 3234356 1569917 1664439 9.76 66.25 33.75 2,946,650MADHYA PRADESH 308245.00 60348023 31443652 28904371 24.26 73.54 26.46 48566242Sheopur 6606.00 559495 295297 264198 29.67 84.17 15.83 431,480Morena 4989.00 1592714 874089 718625 24.52 78.45 21.55 1,279,094Bhind 4459.00 1428559 780902 647657 17.19 76.27 23.73 1,219,000Gwalior 4560.00 1632109 883317 748792 26.17 39.77 60.23 1,293,567Datia 2691.00 628240 338232 290008 21.90 78.11 21.89 515,360Shivpuri 10277.00 1441950 776190 665760 27.27 83.38 16.62 1,132,977Guna 11064.00 1666767 884020 782747 27.20 78.71 21.29 1,310,317Tikamgarh 5048.00 1202998 637913 565085 27.87 82.32 17.68 940,829Chhatarpur 8687.00 1474723 788933 685790 27.34 78.01 21.99 1,158,076Panna 7135.00 856558 450549 406009 24.51 87.37 12.63 687,945Sagar 10252.00 2021987 1073205 948782 22.71 70.78 29.22 1,647,736Damoh 7306.00 1083949 570229 513720 20.69 81.15 18.85 898,125Satna 7502.00 1870104 971396 898708 27.62 79.38 20.62 1,465,384Rewa 6314.00 1973306 1016687 956619 26.90 83.76 16.24 1,554,987
( Census 2001 )Population
_______________________________ P M F
Rural/Urban as Percentage of Total
Population Rural Urban
Table 1.2 Area and Population By Districts- Contd.
AREA AND POPULATION

9
India/ State/ Union Territory/ District
Area in sq. km. Decennial Growth Rate
of Population (1991-2001)
Population 1991 Census
1 2 3 4 5 6 7 8 9Umaria 4076.00 515963 265128 250835 22.61 83.89 16.11 420,815Shahdol 9952.00 1575303 804988 770315 19.07 74.73 25.27 1,323,054Sidhi 10526.00 1831152 947830 883322 33.33 85.74 14.26 1,373,434Neemuch 4256.00 726070 372419 353651 21.35 72.05 27.95 598,339Mandsaur 5535.00 1183724 605119 578605 23.71 81.36 18.64 956,869Ratlam 4861.00 1215393 620862 594531 25.05 69.69 30.31 971,888Ujjain 6091.00 1710982 882871 828111 23.71 61.26 38.74 1,383,086Shajapur 6195.00 1290685 669852 620833 24.92 81.46 18.54 1,033,248Dewas 7020.00 1308223 677866 630357 26.54 72.61 27.39 1,033,807Jhabua 6778.00 1394561 702053 692508 23.37 91.32 8.68 1,130,405Dhar 8153.00 1740329 890416 849913 27.27 83.44 16.56 1,367,412Indore 3898.00 2465827 1289352 1176475 34.31 29.83 70.17 1,835,915West Nimar 8030.00 1529562 784604 744958 27.92 84.61 15.39 1,195,723Barwani 5422.00 1081441 548609 532832 29.91 85.39 14.61 832,422East Nimar 10776.00 1713134 884966 828168 19.66 73.15 26.85 1,431,662Rajgarh 6153.00 1254085 649106 604979 26.32 82.67 17.33 992,764Vidisha 7371.00 1214857 647838 567019 25.19 78.57 21.43 970,388Bhopal 2772.00 1843510 972649 870861 36.41 19.57 80.43 1,351,479Sehore 6578.00 1078912 565137 513775 28.23 82.04 17.96 841,358Raisen 8466.00 1125154 598247 526907 28.37 81.62 18.38 876,461Betul 10043.00 1395175 709956 685219 18.08 81.43 18.57 1,181,501Harda 3330.00 474416 247226 227190 24.60 78.68 21.32 380,762Hoshangabad 6707.00 1084265 571774 512491 22.32 69.16 30.84 886,449Katni 4950.00 1064167 548368 515799 20.66 78.83 21.17 881,925Jabalpur 5211.00 2151203 1127304 1023899 21.67 42.95 57.05 1,768,037Narsimhapur 5133.00 957646 501645 456001 21.92 84.01 15.99 785,496Dindori 7470.00 580730 291716 289014 13.46 95.37 4.63 511,849Mandla 5800.00 894236 447956 446280 14.73 89.72 10.28 779,414Chhindwara 11815.00 1849283 947337 901946 17.89 75.55 24.45 1,568,702Seoni 8758.00 1166608 588750 577858 16.56 89.65 10.35 1,000,831Balaghat 9229.00 1497968 740749 757219 9.67 87.05 12.95 1,365,870MAHARASHTRA 307713.00 96878627 50400596 46478031 22.73 57.57 42.43 78937187Nandurbar 5955.00 1311709 663511 648198 23.45 84.55 15.45 1,062,545Dhule 7195.00 1707947 878372 829575 15.94 73.89 26.11 1,473,170Jalgaon 11765.00 3682690 1905493 1777197 15.53 71.41 28.59 3,187,634Buldana 9661.00 2232480 1147403 1085077 18.35 78.80 21.20 1,886,299Akola 5676.00 1630239 841253 788986 20.58 61.51 38.49 1,351,959Washim 4898.00 1020216 526094 494122 18.31 82.51 17.49 862,312Amravati 12210.00 2607160 1345614 1261546 18.50 65.50 34.50 2,200,057Wardha 6309.00 1236736 638990 597746 15.87 73.72 26.28 1,067,357Nagpur 9892.00 4067637 2105314 1962323 23.74 35.74 64.26 3,287,139Bhandara 4087.00 1136146 573445 562701 11.23 84.53 15.47 1,021,408Gondiya 5234.00 1200707 598834 601873 10.54 88.05 11.95 1,086,221Gadchiroli 14412.00 970294 491101 479193 23.29 93.07 6.93 787,010Chandrapur 11443.00 2071101 1062993 1008108 16.88 67.89 32.11 1,771,994Yavatmal 13582.00 2458271 1265681 1192590 18.35 81.40 18.60 2,077,144
( Census 2001 )Population
_______________________________ P M F
Rural/Urban as Percentage of Total
Population Rural Urban
Table 1.2 Area and Population By Districts- Contd.
AREA AND POPULATION

10
India/ State/ Union Territory/ District
Area in sq. km. Decennial Growth Rate
of Population (1991-2001)
Population 1991 Census
1 2 3 4 5 6 7 8 9Nanded 10528.00 2876259 1481358 1394901 23.42 76.04 23.96 2,330,374Hingoli 4827.00 987160 505373 481787 19.81 84.40 15.60 823,931Parbhani 6214.00 1527715 780191 747524 18.14 68.24 31.76 1,293,104Jalna 7718.00 1612980 826903 786077 18.22 80.91 19.09 1,364,425Aurangabad 10107.00 2897013 1505363 1391650 30.86 62.47 37.53 2,213,779Nashik 15530.00 4993796 2590912 2402884 29.66 61.20 38.80 3,851,352Thane 9558.00 8131849 4377747 3754102 54.92 27.42 72.58 5,249,126Mumbai (Suburban) 446.00 8640419 4741720 3898699 27.99 0.00 100.00 6,751,002Mumbai 157.00 3338031 1878246 1459785 5.14 0.00 100.00 3,174,889Raigarh 7152.00 2207929 1117628 1090301 20.99 75.78 24.22 1,824,816Pune 15643.00 7232555 3769128 3463427 30.73 41.92 58.08 5,532,532Ahmadnagar 17048.00 4040642 2083053 1957589 19.80 80.11 19.89 3,372,935Bid 10693.00 2161250 1116356 1044894 18.61 82.09 17.91 1,822,072Latur 7157.00 2080285 1075257 1005028 24.07 76.43 23.57 1,676,641Osmanabad 7569.00 1486586 769368 717218 16.47 84.31 15.69 1,276,327Solapur 14895.00 3849543 1989623 1859920 19.14 68.17 31.83 3,231,057Satara 10480.00 2808994 1408326 1400668 14.59 85.83 14.17 2,451,372Ratnagiri 8208.00 1696777 794498 902279 9.89 88.67 11.33 1,544,057Sindhudurg 5207.00 868825 417890 450935 4.41 90.53 9.47 832,152Kolhapur 7685.00 3523162 1807470 1715692 17.85 70.19 29.81 2,989,507Sangli 8572.00 2583524 1320088 1263436 16.93 75.49 24.51 2,209,488MANIPUR + 22327.00 2293896 1161952 1131944 24.86 74.89 25.11 1837149Senapati 3271.00 283621 146548 137073 36.09 100.00 0.00 208,406Tamenglong 4391.00 111499 58014 53485 29.23 100.00 0.00 86,278Churachandpur 4570.00 227905 117232 110673 29.36 100.00 0.00 176,184Bishnupur 496.00 208368 104550 103818 15.27 64.13 35.87 180,773Thoubal 514.00 364140 182250 181890 23.87 63.95 36.05 293,958Imphal West 519.00 444382 221781 222601 16.70 44.49 55.51 380,801Imphal East 709.00 394876 198371 196505 19.49 72.57 27.43 330,460Ukhrul 4544.00 140778 73465 67313 28.83 100.00 0.00 109,275Chandel 3313.00 118327 59741 58586 66.62 87.36 12.64 71,014MEGHALAYA 22429.00 2318822 1176087 1142735 30.65 80.42 19.58 1774778West Garo Hills 3715.00 518390 263424 254966 28.62 88.62 11.38 403,027East Garo Hills 2603.00 250582 127474 123108 32.70 85.67 14.33 188,830South Garo Hills 1849.00 100980 52007 48973 31.02 91.44 8.56 77,073West Khasi Hills 5247.00 296049 150419 145630 33.05 88.31 11.69 222,508Ri Bhoi 2376.00 192790 99319 93471 51.43 93.16 6.84 127,312East Khasi Hills 2820.00 660923 333553 327370 23.41 57.98 42.02 535,555Jaintia Hills 3819.00 299108 149891 149217 35.67 91.62 8.38 220,473MIZORAM 21081.00 888573 459109 429464 28.82 50.37 49.63 689756Mamit 3025.00 62785 33114 29671 -2.77 83.03 16.97 64,572Kolasib 1382.00 65960 34562 31398 35.25 44.66 55.34 48,769Aizawl 3576.00 325676 166877 158799 38.07 23.81 76.19 235,879
( Census 2001 )Population
_______________________________ P M F
Rural/Urban as Percentage of Total
Population Rural Urban
Table 1.2 Area and Population By Districts- Contd.
AREA AND POPULATION

11
India/ State/ Union Territory/ District
Area in sq. km. Decennial Growth Rate
of Population (1991-2001)
Population 1991 Census
1 2 3 4 5 6 7 8 9Champhai 3185.00 108392 55756 52636 29.88 61.21 38.79 83,456Serchhip 1421.00 53861 27380 26481 17.63 51.95 48.05 45,789Lunglei 4536.00 137223 71402 65821 23.16 57.77 42.23 111,415Lawngtlai 2557.00 73620 38776 34844 35.83 100.00 0.00 54,200Saiha 1399.00 61056 31242 29814 33.67 67.53 32.47 45,676NAGALAND 16579.00 1990036 1047141 942895 64.53 82.77 17.23 1209546Mon 1786.00 260652 138753 121899 74.12 93.64 6.36 149,699Tuensang 4228.00 414818 218678 196140 78.11 92.82 7.18 232,906Mokokchung 1615.00 232085 120929 111156 46.54 86.55 13.45 158,374Zunheboto 1255.00 153955 79056 74899 60.01 85.01 14.99 96,218Wokha 1628.00 161223 83670 77553 95.16 76.66 23.34 82,612Dimapur 927.00 309024 166663 142361 73.66 62.92 37.08 177,951Kohima 3114.00 310084 162251 147833 47.92 75.16 24.84 209,630Phek 2026.00 148195 77141 71054 45.07 91.32 8.68 102,156ORISSA 155707.00 36804660 18660570 18144090 16.25 85.01 14.99 31659736Bargarh 5837.00 1346336 681500 664836 11.53 92.31 7.69 1,207,172Jharsuguda 2081.00 509716 261941 247775 15.28 63.53 36.47 442,154Sambalpur 6657.00 935613 475122 460491 15.00 72.88 27.12 813,589Debagarh 2940.00 274108 138408 135700 17.02 92.67 7.33 234,238Sundargarh 9712.00 1830673 935601 895072 16.34 65.63 34.37 1,573,617Kendujhar 8303.00 1561990 790036 771954 16.83 86.36 13.64 1,337,026Mayurbhanj 10418.00 2223456 1123200 1100256 17.98 93.00 7.00 1,884,580Baleshwar 3806.00 2024508 1036511 987997 19.33 89.11 10.89 1,696,583Bhadrak 2505.00 1333749 675642 658107 20.61 89.42 10.58 1,105,834Kendrapara 2644.00 1302005 646438 655567 13.27 94.31 5.69 1,149,501Jagatsinghapur 1668.00 1057629 538881 518748 13.26 90.12 9.88 933,789Cuttack 3932.00 2341094 1207781 1133313 14.02 72.61 27.39 2,053,192Jajapur 2899.00 1624341 823747 800594 17.18 95.51 4.49 1,386,177Dhenkanal 4452.00 1066878 544001 522877 12.56 91.29 8.71 947,870Anugul 6375.00 1140003 587234 552769 18.62 86.10 13.90 961,037Nayagarh 3890.00 864516 446177 418339 10.46 95.71 4.29 782,647Khordha 2813.00 1877395 986886 890509 24.99 57.08 42.92 1,502,014Puri 3479.00 1502682 763389 739293 15.12 86.42 13.58 1,305,365Ganjam 8206.00 3160635 1581986 1578649 16.88 82.40 17.60 2,704,056Gajapati 4325.00 518837 255423 263414 14.10 89.81 10.19 454,708Kandhamal 8021.00 648201 322799 325402 18.66 93.20 6.80 546,281Baudh 3098.00 373372 188155 185217 17.55 95.17 4.83 317,622Sonapur 2337.00 541835 275601 266234 13.64 92.61 7.39 476,815Balangir 6575.00 1337194 673985 663209 8.63 88.46 11.54 1,230,938Nuapada 3852.00 530690 264396 266294 13.04 94.34 5.66 469,482Kalahandi 7920.00 1335494 667526 667968 18.09 92.50 7.50 1,130,903Rayagada 7073.00 831109 409792 421317 16.40 86.11 13.89 713,984Nabarangapur 5291.00 1025766 515162 510604 21.15 94.22 5.78 846,659Koraput 8807.00 1180637 590743 589894 14.67 83.19 16.81 1,029,577Malkangiri 5791.00 504198 252507 251691 19.39 93.13 6.87 422,326PUNJAB 50362.00 24358999 12985045 11373954 20.10 66.08 33.92 20281969Gurdaspur 3551.00 2104011 1113077 990934 19.73 74.56 25.44 1,757,281Amritsar 5088.00 3096077 1650589 1445488 23.59 60.49 39.51 2,505,034Kapurthala 1633.00 754521 399623 354898 16.68 67.33 32.67 646,647
( Census 2001 )Population
_______________________________ P M F
Rural/Urban as Percentage of Total
Population Rural Urban
Table 1.2 Area and Population By Districts- Contd.
AREA AND POPULATION
12
India/ State/ Union Territory/ District
Area in sq. km. Decennial Growth Rate
of Population (1991-2001)
Population 1991 Census
1 2 3 4 5 6 7 8 9Jalandhar 2624.00 1962700 1040177 922523 18.96 52.52 47.48 1,649,909Hoshiarpur 3386.00 1480736 765132 715604 14.02 80.28 19.72 1,298,712Nawanshahr 1282.00 587468 306902 280566 10.58 86.20 13.80 531,253Rupnagar 2113.00 1116108 596582 519526 24.07 67.53 32.47 899,587Fatehgarh Sahib 1180.00 538041 290137 247904 18.27 71.92 28.08 454,919Ludhiana 3578.00 3032831 1662716 1370115 24.89 44.16 55.84 2,428,382Moga 2235.00 894854 474139 420715 15.03 80.04 19.96 777,922Firozpur 5328.00 1746107 926224 819883 20.51 74.19 25.81 1,448,903Muktsar 2593.00 777493 411217 366276 18.80 74.46 25.54 654,434Faridkot 1458.00 550892 292596 258296 21.07 64.86 35.14 455,005Bathinda 3353.00 1183295 632809 550486 20.09 70.27 29.73 985,301Mansa 2198.00 688758 366446 322312 19.85 79.32 20.68 574,662Sangrur 5108.00 2000173 1069289 930884 18.67 70.76 29.24 1,685,449Patiala 3654.00 1844934 987390 857544 20.70 65.06 34.94 1,528,569RAJASTHAN 342239.00 56507188 29420011 27087177 28.41 76.61 23.39 44005990Ganganagar 10978.00 1789423 955378 834045 27.59 74.66 25.34 1,402,444Hanumangarh 9656.00 1518005 801486 716519 24.39 80.00 20.00 1,220,333Bikaner 27244.00 1674271 886075 788196 38.24 64.46 35.54 1,211,140Churu 16830.00 1923878 987781 936097 24.67 72.13 27.87 1,543,211Jhunjhunun 5928.00 1913689 983526 930163 20.93 79.35 20.65 1,582,421Alwar 8380.00 2992592 1586752 1405840 30.31 85.47 14.53 2,296,580Bharatpur 5066.00 2101142 1133425 967717 27.22 80.54 19.46 1,651,584Dhaulpur 3033.00 983258 538103 445155 31.19 82.04 17.96 749,479Karauli 5524.00 1209665 651998 557667 30.39 85.79 14.21 927,719Sawai Madhopur 4498.00 1117057 591307 525750 27.55 80.96 19.04 875,752Dausa 3432.00 1317063 693438 623625 32.44 89.69 10.31 994,431Jaipur 11143.00 5251071 2768203 2482868 35.06 50.64 49.36 3,887,895Sikar 7732.00 2287788 1172753 1115035 24.14 79.35 20.65 1,842,914Nagaur 17718.00 2775058 1424967 1350091 29.38 82.80 17.20 2,144,810Jodhpur 22850.00 2886505 1513890 1372615 34.04 66.15 33.85 2,153,483Jaisalmer 38401.00 508247 279101 229146 47.52 84.97 15.03 344,517Barmer 28387.00 1964835 1038247 926588 36.90 92.60 7.40 1,435,222Jalor 10640.00 1448940 737880 711060 26.81 92.41 7.59 1,142,563Sirohi 5136.00 851107 437949 413158 30.13 82.27 17.73 654,029Pali 12387.00 1820251 918856 901395 22.46 78.53 21.47 1,486,432Ajmer 8481.00 2181670 1129920 1051750 26.17 59.91 40.09 1,729,207Tonk 7194.00 1211671 626436 585235 24.27 79.11 20.89 975,006Bundi 5776.00 962620 504818 457802 24.98 81.35 18.65 770,248Bhilwara 10455.00 2013789 1026650 987139 26.40 79.40 20.60 1,593,128Rajsamand 3860.00 987024 493459 493565 19.97 86.96 13.04 822,721Udaipur 13419.00 2633312 1336004 1297308 27.42 81.38 18.62 2,066,580Dungarpur 3770.00 1107643 547791 559852 26.65 92.70 7.30 874,549Banswara 5037.00 1501589 760686 740903 29.94 92.85 7.15 1,155,600Chittaurgarh 10856.00 1803524 918063 885461 21.52 83.96 16.04 1,484,190Kota 5217.00 1568525 827128 741397 28.51 46.54 53.46 1,220,505Baran 6992.00 1021653 535137 486516 26.08 83.16 16.84 810,326Jhalawar 6219.00 1180323 612804 567519 23.34 85.75 14.25 956,971
( Census 2001 )Population
_______________________________ P M F
Rural/Urban as Percentage of Total
Population Rural Urban
Table 1.2 Area and Population By Districts-Contd.
AREA AND POPULATION

13
India/ State/ Union Territory/ District
Area in sq. km. Decennial Growth Rate
of Population (1991-2001)
Population 1991 Census
1 2 3 4 5 6 7 8 9SIKKIM 7096.00 540851 288484 252367 33.06 88.93 11.07 406457North 4226.00 41030 23414 17616 31.34 96.96 3.04 31,240West 1166.00 123256 63912 59344 25.57 98.52 1.48 98,161South 750.00 131525 68241 63284 33.39 97.00 3.00 98,604East 954.00 245040 132917 112123 37.31 78.43 21.57 178,452TAMIL NADU 130058.00 62405679 31400909 31004770 11.72 55.96 44.04 55858946Thiruvallur 3550.00 2754756 1397407 1357349 23.06 45.55 54.45 2,238,583Chennai 174.00 4343645 2219539 2124106 13.07 0.00 100.00 3,841,396Kancheepuram 4307.00 2877468 1457242 1420226 19.15 46.66 53.34 2,415,010Vellore 6077.00 3477317 1741083 1736234 14.90 62.38 37.62 3,026,432Dharmapuri 9622.00 2856300 1473597 1382703 17.61 84.04 15.96 2,428,596Tiruvannamalai 6190.00 2186125 1095859 1090266 7.01 81.67 18.33 2,042,979Viluppuram 7190.00 2960373 1492442 1467931 7.43 85.58 14.42 2,755,674Salem 5245.00 3016346 1563633 1452713 17.20 53.91 46.09 2,573,667Namakkal 3404.00 1493462 759551 733911 12.91 63.49 36.51 1,322,715Erode 8209.00 2581500 1309278 1272222 11.26 53.75 46.25 2,320,263The Nilgiris 2549.00 762141 378351 383790 7.31 40.35 59.65 710,214Coimbatore 7469.00 4271856 2176031 2095825 21.76 33.98 66.02 3,508,374Dindigul 6058.00 1923014 968137 954877 9.22 64.99 35.01 1,760,601Karur 2901.00 935686 465538 470148 9.54 66.73 33.27 854,162Tiruchirappalli 4511.00 2418366 1208534 1209832 10.10 52.90 47.10 2,196,473Perambalur 1750.00 493646 246141 247505 9.45 83.95 16.05 451,032Ariyalur 1944.00 695524 346763 348761 9.29 88.64 11.36 636,381Cuddalore 3706.00 2285395 1150908 1134487 7.66 66.99 33.01 2,122,759Nagapattinam 2417.00 1488839 739074 749765 8.07 77.82 22.18 1,377,601Thiruvarur 2377.00 1169474 580784 588690 6.31 79.71 20.29 1,100,096Thanjavur 3476.00 2216138 1096638 1119500 7.91 66.22 33.78 2,053,760Pudukkottai 4651.00 1459601 724300 735301 9.98 82.98 17.02 1,327,148Sivaganga 4143.00 1155356 566947 588409 4.74 71.78 28.22 1,103,077Madurai 3696.00 2578201 1303363 1274838 7.41 43.99 56.01 2,400,339Theni 2869.00 1093950 552986 540964 4.25 45.90 54.10 1,049,323Virudhunagar 4283.00 1751301 870376 880925 11.90 55.61 44.39 1,565,037Ramanathapuram 4175.00 1187604 583376 604228 6.12 74.54 25.46 1,119,153Thoothukkudi 4621.00 1572273 766823 805450 7.99 57.72 42.28 1,455,920Tirunelveli 6810.00 2723988 1333939 1390049 8.88 51.97 48.03 2,501,832Kanniyakumari 1684.00 1676034 832269 843765 4.73 34.73 65.27 1,600,349TRIPURA 10486.00 3199203 1642225 1556978 16.03 82.94 17.06 2757205West Tripura 2993.00 1532982 785579 747403 18.48 73.25 26.75 1,293,861South Tripura 3057.00 767440 394605 372835 6.78 92.94 7.06 718,732Dhalai 2400.00 307868 159095 148773 10.96 93.87 6.13 277,465North Tripura 2036.00 590913 302946 287967 26.49 89.39 10.61 467,147UTTAR PRADESH 240928.00 166197921 87565369 78632552 25.85 79.22 20.78 132061653Saharanpur 3689.00 2896863 1553322 1343541 25.46 74.19 25.81 2,309,029Muzaffarnagar 4008.00 3543362 1893832 1649530 24.65 74.49 25.51 2,842,543Bijnor 4561.00 3131619 1651908 1479711 27.59 75.69 24.31 2,454,521
AREA AND POPULATION
Table 1.2 Area and Population By Districts- Contd.( Census 2001 )
Population _______________________________
P M F
Rural/Urban as Percentage of Total
Population Rural Urban

14
India/ State/ Union Territory/ District
Area in sq. km. Decennial Growth Rate
of Population (1991-2001)
Population 1991 Census
1 2 3 4 5 6 7 8 9Moradabad 3718.00 3810983 2032302 1778681 28.52 69.46 30.54 2,965,293Rampur 2367.00 1923739 1023775 899964 28.07 75.03 24.97 1,502,141Jyotiba Phule Nagar 2249.00 1499068 795228 703840 29.71 75.44 24.56 1,155,742Meerut 2590.00 2997361 1601578 1395783 23.99 51.56 48.44 2,417,513Baghpat 1321.00 1163991 630077 533914 12.97 80.29 19.71 1,030,399Ghaziabad 1148.00 3290586 1769042 1521544 47.19 44.80 55.20 2,235,675Gautam Buddha Nagar 1442.00 1202030 652819 549211 41.46 62.61 37.39 849,742Bulandshahr 4352.00 2913122 1550326 1362796 18.02 76.85 23.15 2,468,375Aligarh 3650.00 2992286 1607402 1384884 22.15 71.10 28.90 2,449,597Hathras 1840.00 1336031 718930 617101 18.56 80.20 19.80 1,126,918Mathura 3340.00 2074516 1127512 947004 25.68 71.70 28.30 1,650,653Agra 4027.00 3620436 1961282 1659154 31.60 56.70 43.30 2,751,021Firozabad 2361.00 2052958 1108668 944290 33.91 69.68 30.32 1,533,054Etah 4446.00 2790410 1509199 1281211 24.29 82.67 17.33 2,244,998Mainpuri 2760.00 1596718 859934 736784 21.79 85.40 14.60 1,311,026Budaun 5168.00 3069426 1666669 1402757 25.37 81.85 18.15 2,448,338Bareilly 4120.00 3618589 1934119 1684470 27.66 67.07 32.93 2,834,616Pilibhit 3499.00 1645183 876368 768815 28.22 82.12 17.88 1,283,103Shahjahanpur 4575.00 2547855 1383408 1164447 28.20 79.37 20.63 1,987,395Kheri 7680.00 3207232 1713908 1493324 32.57 89.23 10.77 2,419,234Sitapur 5743.00 3619661 1941374 1678287 26.69 88.05 11.95 2,857,009Hardoi 5986.00 3398306 1842698 1555608 23.71 88.01 11.99 2,747,082Unnao 4558.00 2700324 1422509 1277815 22.72 84.76 15.24 2,200,397Lucknow 2528.00 3647834 1932317 1715517 32.03 36.37 63.63 2,762,801Rae Bareli 4609.00 2872335 1472230 1400105 24.35 90.46 9.54 2,309,928Farrukhabad 2181.00 1570408 849800 720608 22.27 78.25 21.75 1,284,419Kannauj 2093.00 1388923 744170 644753 20.16 83.30 16.70 1,155,847Etawah 2311.00 1338871 720749 618122 18.45 76.99 23.01 1,130,340Auraiya 2015.00 1179993 635762 544231 18.00 85.68 14.32 1,000,035Kanpur Dehat 3021.00 1563336 844339 718997 19.96 93.11 6.89 1,303,232Kanpur Nagar 3155.00 4167999 2247216 1920783 28.11 32.88 67.12 3,253,572Jalaun 4565.00 1454452 786641 667811 19.28 76.59 23.41 1,219,377Jhansi 5024.00 1744931 932818 812113 22.05 59.21 40.79 1,429,698Lalitpur 5039.00 977734 519413 458321 30.01 85.48 14.52 752,043Hamirpur 4282.00 1043724 563801 479923 18.00 83.35 16.65 884,512Mahoba 2884.00 708447 379691 328756 21.73 78.14 21.86 581,979Banda 4460.00 1537334 826544 710790 21.42 84.13 15.87 1,266,143Chitrakoot 3164.00 766225 409178 357047 28.56 90.01 9.99 595,996Fatehpur 4152.00 2308384 1219602 1088782 21.53 89.70 10.30 1,899,387Pratapgarh 3717.00 2731174 1362948 1368226 23.54 94.71 5.29 2,210,700Kaushambi 1780.00 1293154 682290 610864 26.46 92.90 7.10 1,022,548Allahabad 5482.00 4936105 2626448 2309657 26.61 75.55 24.45 3,898,765Barabanki 4402.00 2673581 1416921 1256660 26.54 90.70 9.30 2,112,782Faizabad 2341.00 2088928 1077472 1011456 23.99 86.54 13.46 1,684,747Ambedkar Nagar 2350.00 2026876 1024953 1001923 24.40 91.07 8.93 1,629,353Sultanpur 4436.00 3214832 1623819 1591013 25.01 95.26 4.74 2,571,706Bahraich 4420.00 2381072 1275351 1105721 29.38 90.00 10.00 1,840,373Shrawasti 2458.00 1176391 631916 544475 27.40 97.16 2.84 923,377Balrampur 3349.00 1682350 887939 794411 22.92 91.94 8.06 1,368,630Gonda 4003.00 2765586 1451101 1314485 25.45 92.97 7.03 2,204,445
Population _______________________________
P M F
Rural/Urban as Percentage of Total
Population Rural Urban
AREA AND POPULATION
Table 1.2 Area and Population By Districts- Contd.( Census 2001 )

15
India/ State/ Union Territory/ District
Area in sq. km. Decennial Growth Rate
of Population (1991-2001)
Population 1991 Census
1 2 3 4 5 6 7 8 9Siddharthnagar 2895.00 2040085 1047165 992920 26.87 96.19 3.81 1,607,964Basti 2688.00 2084814 1075765 1009049 23.63 94.44 5.56 1,686,327Sant Kabir Nagar 1646.00 1420226 719465 700761 23.27 92.92 7.08 1,152,116Mahrajganj 2952.00 2173878 1124290 1049588 29.68 94.91 5.09 1,676,378Gorakhpur 3321.00 3769456 1923197 1846259 22.94 80.41 19.59 3,066,002Kushinagar 2906.00 2893196 1473637 1419559 28.23 95.42 4.58 2,256,334Deoria 2538.00 2712650 1355023 1357627 24.22 90.11 9.89 2,183,690Azamgarh 4054.00 3939916 1950415 1989501 25.93 92.45 7.55 3,128,623Mau 1713.00 1853997 933523 920474 28.23 80.56 19.44 1,445,782Ballia 2981.00 2761620 1413774 1347846 22.07 90.23 9.77 2,262,273Jaunpur 4038.00 3911679 1941903 1969776 21.68 92.60 7.40 3,214,636Ghazipur 3377.00 3037582 1537141 1500441 25.70 92.32 7.68 2,416,617Chandauli 2541.00 1643251 855123 788128 28.90 89.44 10.56 1,274,839Varanasi 1535.00 3138671 1649187 1489484 25.14 59.84 40.16 2,508,110Sant Ravidas Nagar Bhadohi 1015.00 1353705 705997 647708 25.62 87.18 12.82 1,077,633Mirzapur 4521.00 2116042 1115249 1000793 27.69 86.46 13.54 1,657,139Sonbhadra 6788.00 1463519 770897 692622 36.14 81.18 18.82 1,075,041UTTARANCHAL 53483.00 8489349 4325924 4163425 20.41 74.33 25.67 7050634Uttarkashi 8016.00 295013 152016 142997 23.07 92.23 7.77 239,709Chamoli 8030.00 370359 183745 186614 13.87 86.31 13.69 325,247Rudraprayag 1984.00 227439 107535 119904 13.43 98.80 1.20 200,515Tehri Garhwal 3642.00 604747 295168 309579 16.24 90.10 9.90 520,256Dehradun 3088.00 1282143 679583 602560 25.00 47.06 52.94 1,025,679Garhwal 5329.00 697078 331061 366017 3.91 87.11 12.89 670,859Pithoragarh 7090.00 462289 227615 234674 10.95 87.06 12.94 416,647Bageshwar 2246.00 249462 118510 130952 9.22 96.87 3.13 228,407Almora 3139.00 630567 293848 336719 3.68 91.36 8.64 608,210Champawat 1766.00 224542 111084 113458 17.60 84.96 15.04 190,929Nainital 4251.00 762909 400254 362655 32.72 64.73 35.27 574,832Udham Singh Nagar 2542.00 1235614 649484 586130 33.60 67.38 32.62 924,856Hardwar 2360.00 1447187 776021 671166 28.70 69.16 30.84 1,124,488WEST BENGAL 88752.00 80176197 41465985 38710212 17.77 72.03 27.97 68077965Darjiling 3149.00 1609172 830644 778528 23.79 67.66 32.34 1,299,919Jalpaiguri 6227.00 3401173 1751145 1650028 21.45 82.16 17.84 2,800,543Koch Bihar 3387.00 2479155 1272094 1207061 14.19 90.90 9.10 2,171,145Uttar Dinajpur 3140.00 2441794 1259737 1182057 28.72 87.94 12.06 1,897,045Dakshin Dinajpur 2219.00 1503178 770335 732843 22.15 86.90 13.10 1,230,608Maldah 3733.00 3290468 1689406 1601062 24.78 92.68 7.32 2,637,032Murshidabad 5324.00 5866569 3005000 2861569 23.76 87.51 12.49 4,740,149Birbhum 4545.00 3015422 1546633 1468789 17.99 91.43 8.57 2,555,664Barddhaman 7024.00 6895514 3588376 3307138 13.96 63.06 36.94 6,050,605Nadia 3927.00 4604827 2366853 2237974 19.54 78.73 21.27 3,852,097North Twenty Four Parganas 4094.00 8934286 4638756 4295530 22.69 45.70 54.30 7,281,881Hugli 3149.00 5041976 2589625 2452351 15.77 66.53 33.47 4,355,230Bankura 6882.00 3192695 1636002 1556693 13.82 92.63 7.37 2,805,065
( Census 2001 )Population
_______________________________ P M F
Rural/Urban as Percentage of Total
Population Rural Urban
Table 1.2 Area and Population By Districts- Contd.
AREA AND POPULATION

16
India/ State/ Union Territory/ District
Area in sq. km. Decennial Growth Rate
of Population (1991-2001)
Population 1991 Census
1 2 3 4 5 6 7 8 9Puruliya 6259.00 2536516 1298078 1238438 14.02 89.93 10.07 2,224,577Medinipur 14081.00 9610788 4916370 4694418 15.35 89.76 10.24 8,331,912Haora 1467.00 4273099 2241898 2031201 14.57 49.64 50.36 3,729,644Kolkata 185.00 4572876 2500040 2072836 3.93 0.00 100.00 4,399,819South Twenty Four Parganas 9960.00 6906689 3564993 3341696 20.85 84.27 15.73 5,715,030Union Territory :A and N ISLANDS 8249.00 356152 192972 163180 26.90 67.37 32.63 280661Andamans 6408.00 314084 170319 143765 30.08 63.00 37.00 241,453Nicobars 1841.00 42068 22653 19415 7.29 100.00 0.00 39,208CHANDIGARH 114.00 900635 506938 393697 40.28 10.23 89.77 642,015Chandigarh 114.00 900635 506938 393697 40.28 10.23 89.77 642,015DADRA and NAGAR HAVE 491.00 220490 121666 98824 59.22 77.11 22.89 138,477Dadra and Nagar Haveli 491.00 220490 121666 98824 59.22 77.11 22.89 138,477DAMAN and DIU 112.00 158204 92512 65692 55.73 63.75 36.25 101586Diu 40.00 44215 20878 23337 11.98 51.20 48.80 39,485Daman 72.00 113989 71634 42355 83.55 68.62 31.38 62,101DELHI 1483.00 13850507 7607234 6243273 47.02 6.82 93.18 9,420,644North West 440.00 2860869 1571689 1289180 60.91 9.28 90.72 1,777,968North 59.00 781525 427882 353643 13.82 5.96 94.04 686,654North East 60.00 1768061 956078 811983 62.92 8.01 91.99 1,085,250East 64.00 1463583 794074 669509 43.06 1.25 98.75 1,023,078New Delhi 35.00 179112 99956 79156 6.19 0.00 100.00 168,669Central 25.00 646385 350831 295554 -1.55 0.00 100.00 656,533West 129.00 2128908 1163084 965824 48.56 4.08 95.92 1,433,038South West 421.00 1755041 983615 771426 61.37 12.85 87.15 1,087,573South 250.00 2267023 1260025 1006998 50.95 7.09 92.91 1,501,881LAKSHADWEEP 32.00 60650 31131 29519 17.30 55.54 44.46 51,707Lakshadweep 32.00 60650 31131 29519 17.30 55.54 44.46 51,707PONDICHERRY 479.00 974345 486961 487384 20.62 33.43 66.57 807785Yanam 17.00 31394 15893 15501 54.67 0.00 100.00 20,297Pondicherry 293.00 735332 369428 365904 20.88 31.19 68.81 608,338Mahe 9.00 36828 17153 19675 10.11 0.00 100.00 33,447Karaikal 160.00 170791 84487 86304 17.22 56.42 43.58 145,703
For footnotes, please see footnotes of table no.1.1 P : PersonM : MaleF : Female
Population _______________________________
P M F
Rural/Urban as Percentage of Total
Population Rural Urban
Table 1.2 Area and Population By Districts- Concld.( Census 2001 )
Source: Office of Registrar General of India, Ministry of Home Affairs
AREA AND POPULATION

17
State/Union 1901 1911 1921 1931 1941Territory 1 2 3 4 5 6
INDIA 238396327 252093390 251321213 278977238 318660580
State: Andhra Pradesh 19065921 21447412 21420448 24203573 27289340 Arunachal Pradesh * - - - - - Assam ** 3289680 3848617 4636980 5560371 6694790 Bihar 27311865 28314281 28126675 31347108 35170840 Chhatisgarh + - - - - - Goa 475513 486752 469494 505281 540925 Gujarat 9094748 9803587 10174989 11489828 13701551 Haryana 4623064 4174677 4255892 4559917 5272829 Himachal Pradesh 1920294 1896944 1928206 2029113 2263245 Jammu & Kashmir *** 2139362 2292535 2424359 2670208 2946728 Jharkhand + - - - - - Karnataka 13054754 13525251 13377599 14632992 16255368 Kerala 6396262 7147673 7802127 9507050 11031541 Madhya Pradesh 16860768 19440965 19171750 21355657 23990608 Maharashtra 19391643 21474523 20849666 23959300 26832758 Manipur ++ 284465 346,222 384016 445606 512069 Meghalaya 340524 394005 422403 480837 555820 Mizoram 82434 91204 98406 124404 152786 Nagaland * 101550 149038 158801 178844 189641 Orissa 10302917 11378875 11158586 12491056 13767988 Punjab 7544790 6731510 7152811 8012325 9600236 Rajasthan 10294090 10983509 10292648 11747974 13863859 Sikkim 59014 87920 81721 109808 121520 Tamil Nadu 19252630 20902616 21628518 23472099 26267507 Tripura 173325 229613 304437 382450 513010 Uttaranchal + - - - - - Uttar Pradesh 48627670 48154921 46672411 49779552 56535170 West Bengal 16940088 17998769 17474348 18897036 23229552
Union Territory: A.& N.Islands 24649 26459 27086 29463 33768 Chandigarh 21967 18437 18133 19783 22574 D.& N.Haveli 24280 29020 31048 38260 40441 Daman & Diu 32005 32470 31410 36429 42811 Delhi 405819 413851 488452 636246 917939 Lakshadweep 13882 14555 13637 16040 18355 Pondicherry 246354 257179 244156 258628 285011 For footnotes, please see next page
AREA AND POPULATION
Table 1.3-DECENNIAL POPULATION BY CENSUS
18
State/Union 1961 1971 1981 1991 2001Territory 1 8 9 10 11 12INDIA 439234771 548159652 683329097 846421039 1028737436
State: Andhra Pradesh 35983447 43502708 53551026 66508008 76210007 Arunachal Pradesh * 336558 467511 631839 864558 1097968 Assam ** 10837329 14625152 18041248 22414322 26655528 Bihar 46447457 56353369 69914734 64530554 82998509 Chhatisgarh + _ _ _ 17614928 20833803 Goa 589997 795120 1007749 1169793 1347668 Gujarat 20633350 26697475 34085799 41309582 50671017 Haryana 7590524 10036431 12922119 16463648 21144564 Himachal Pradesh 2812463 3460434 4280818 5170877 6077900 Jammu & Kashmir *** 3560976 4616632 5987389 7837051 10143700 Jharkhand + _ _ _ 21843911 26945829 Karnataka 23586772 29299014 37135714 44977201 52850562 Kerala 16903715 21347375 25453680 29098518 31841374 Madhya Pradesh 32372408 41654119 52178844 48566242 60348023 Maharashtra 39553718 50412235 62782818 78937187 96878627 Manipur ++ 780037 1072753 1420953 1837149 2293896 Meghalaya 769380 1011699 1335819 1774778 2318822 Mizoram 266063 332390 493757 689756 888573 Nagaland * 369200 516449 774930 1209546 1990036 Orissa 17548846 21944615 26370271 31659736 36804660 Punjab 11135069 13551060 16788915 20281969 24358999 Rajasthan 20155602 25765806 34261862 44005990 56507188 Sikkim 162189 209843 316385 406457 540851 Tamil Nadu 33686953 41199168 48408077 55858946 62405679 Tripura 1142005 1556342 2053058 2757205 3199203 Uttar Pradesh 73754573 88341521 110862512 132061653 166197921 Uttaranchal + _ _ _ 7050634 8489349 West Bengal 34926279 44312011 54580647 68077965 80176197
Union Territory: A.& N.Islands 63548 115133 188741 280661 356152 Chandigarh 119881 257251 451610 642015 900635 D.& N.Haveli 57963 74170 103676 138477 220490 Daman & Diu 36670 62651 78981 101586 158204 Delhi 2658612 4065698 6220406 9420644 13850507 Lakshadweep 24108 31810 40249 51707 60650 Pondicherry 369079 471707 604471 807785 974345
Kashmir have been worked out by 'Interpolation'.++ The population of Manipur State includes the estimated population of Mao Maram, Paomata and Purul sub- divisions of Senapati dstrict.
the first time in 2001.*** The 1991 Census was not held in Jammu & Kashmir. Hence the population figures for 1991 of Jammu &
* Arunachal Pradesh was censused for the frist time in 1961.** The 1981 Census could not be held owing to disturbed conditions prevailing in Assam. Hence the population figures for 1981 of Assam has been worked out by 'Interpolation'.+ Uttaranchal , Jharkhand,Chhattisgarh states carved out from UP, Bihar and MP respectively are censused for
Source : Office of the Registrar General of India, Ministry of Home Affairs
AREA AND POPULATION
Table 1.3-DECENNIAL POPULATION BY CENSUS-Concld.

19
State/ 1901-11 1911-21 1921-31 1931-41 1941-51 1951-61 1961-71 1971-81 1981-91 1991-01 Union Territory
1 2 3 4 5 6 7 8 9 10 11
INDIA 5.75 -0.31 11.00 14.22 13.31 21.51 +24.80 +24.66 +23.87 +21.54
State: Andhra Pradesh+ 12.49 -0.13 12.99 12.75 14.02 15.65 20.90 23.10 24.20 14.59 Arunachal Pradesh* -- -- -- -- -- -- 38.91 35.15 36.83 27.00 Assam ++ 16.99 20.48 19.91 20.40 19.93 34.98 34.95 23.36 24.24 18.92 Bihar 1.52 -0.97 9.74 12.22 10.58 19.79 20.91 24.16 23.38 28.62 Chhatisgarh 24.15 1.41 14.51 13.04 9.42 22.77 27.12 20.39 25.73 18.27 Goa 2.36 -3.55 7.62 7.05 1.21 7.77 34.77 26.74 16.08 15.21 Gujarat 7.79 3.79 12.92 19.25 18.69 26.88 29.39 27.67 21.19 22.66 Haryana -9.70 1.95 7.14 15.63 7.60 33.79 32.22 28.75 27.41 28.43 Himachal Pradesh -1.22 1.65 5.23 11.54 5.42 17.87 23.04 23.71 20.79 17.54 Jammu & Kashmir ** 7.16 5.75 10.14 10.36 10.42 9.44 29.65 29.69 30.89 29.43Jharkhand 11.19 0.31 16.86 12.13 9.35 19.69 22.58 23.79 24.03 23.36 Karnataka 3.60 -1.09 9.38 11.09 19.36 21.57 24.22 26.75 21.12 17.51 Kerala 11.75 9.16 21.85 16.04 22.82 24.76 26.29 19.24 14.32 9.43 Madhya Pradesh 12.38 -2.40 10.21 12.06 8.38 24.73 29.28 27.16 27.24 24.26 Maharashtra 10.74 -2.91 14.91 11.99 19.27 23.60 27.45 24.54 25.73 22.73 Manipur+++ 21.71 10.92 16.04 14.92 12.80 35.04 37.53 32.46 29.29 24.86 Meghalaya 15.71 7.21 13.83 15.59 8.97 27.03 31.50 32.04 32.86 30.65 Mizoram 10.64 7.90 26.42 22.81 28.42 35.61 24.93 48.55 39.70 28.82 Nagaland*** c 46.76 6.55 12.62 6.04 8.60 14.07 39.88 50.05 56.08 64.53 Orissa 10.44 -1.94 11.94 10.22 6.38 19.82 25.05 20.17 20.06 16.25 Punjab -10.78 6.26 12.02 19.82 -4.58 21.56 21.70 23.89 20.81 20.10 Rajasthan 6.70 -6.29 14.14 18.01 15.20 26.20 27.83 32.97 28.44 28.41 Sikkim 48.98 -7.05 34.37 10.67 13.34 17.76 29.38 50.77 28.47 33.06 Tamil Nadu 8.57 3.47 8.52 11.91 14.66 11.85 22.30 17.50 15.39 11.72 Tripura 32.48 32.59 25.63 34.14 24.56 78.71 36.28 31.92 34.30 16.03 Uttar Pradesh -1.36 -3.16 6.56 13.57 11.78 16.38 19.54 25.39 25.61 25.85 Uttaranchal 8.20 -1.23 8.74 13.63 12.67 22.57 24.42 27.45 23.13 20.41 West Bengal 6.25 -2.91 8.14 22.93 13.22 32.80 26.87 23.17 24.73 17.77
Union Territory: A.& N.Islands 7.34 2.37 8.78 14.61 -8.28 105.19 81.17 63.93 48.70 26.90 Chandigarh -16.07 -1.65 9.10 14.11 7.47 394.13 114.59 75.55 42.16 40.28 D.& N.Haveli 19.52 6.99 23.23 5.70 2.70 39.56 27.96 39.78 33.57 59.22 Daman & Diu 1.45 -3.26 15.98 17.52 13.55 -24.56 70.85 26.07 28.62 55.73 Delhi 1.98 18.03 30.26 44.27 90.00 52.44 52.93 53.00 51.45 47.02 Lakshadweep 4.85 -6.31 17.62 14.43 14.60 14.61 31.95 26.53 28.47 17.30 Pondicherry a 4.39 -5.06 5.93 10.20 11.31 16.34 27.81 28.15 33.64 20.62
a The distribution of population of Pondicherry by sex for 1901 (246, 354) and 1931 (258,628) and 1941 (285,011) is not available.
state. The differences between the figures for the state total and the totals of all districts are 21599 for 1901, (-) 70, 744 for 1911, (+) 16,456 for 1921 and (+) 8,240 for 1931. The difference is due to an error that has occurred in Table A-2 of 1941, when the population data of Medakand Nizamabad districts were recast in accordance with certain inter district transfers that had taken place between Medak and Nizamabaddistricts of the earstwhile Hyderabad state during the decade 1931-1941
Tuensang district for 1951 ( 7,025) and the population of Tuensang (83,501) & Mon (50,774) distri cts for 1961 Census have not been taken into account as the area was censused for the first time in 1951 and the same are not comparable.
* Arunachal Pradesh was censused for the first time in 1961
3. In working out 'decade variation' and 'percentage decade variation' for 1941-1951 & 1951-1961 of Nagaland state, the population ofto 1961.
+ One village Ramtapur (code No.217 and 101 in 1951 and 1961 respectively) of Jukkal circle of Degulur taluka which was transferred undethe State Reorgnsiation Act, 1956 from Maharashtra to Andhra Pradesh , still continues in Nanded district of Maharashtra. The population ofthis village has , however, been adjusted in Nizamabad district for the year 1901-1951. (ii) The total population of all districts of Andhra Pradesh for 1901,1911, 1921 and 1931 Censuses do not tally with the total population of the
** The 1991 Census was not held in Jammu & Kashmir. Hence the population figures for 1991 of Jammu & Kashmir have been worked out b
+++ The population of Manipur State by sex includes the estimated population of Mao Maram, Paomata and Purul sub-divisions of Senapatdistrict for Cesnsus 2001.*** In working out 'decade variation' and 'percentage decade variation' for 1941-1951 & 1951-1961 of Nagaland state, the population ofTuensang district for 1951 ( 7,025) & the population of Tuensang (83,501) & Mon (50,774) distri cts for 1961 Census have not been taken into
c In 1951, Tuensang was censused for the first time for 129.5 sq.kms. of areas only in 1961 censused areas of Tuensang district of Nagalanaccount as the area was censused for the first time in 1951 and the same are not comparable.
Phek, Wokha, Zunheboto and Mokokchung. Estimation however could not be done for Tuensang and Mon as they were not fully censused prio
intrepolation'.
AREA AND POPULATION
TABLE 1.4-DECENNIAL GROWTH OF POPULATION BY CENSUS
Source: Office of Registrar General of India, Ministry of Home Affairs
was increased to 5356.1 sq. kms. 2. Due to non-availability of census data the figures for the back decades, from 1901 to 1951 have been estimated for the districts of Kohima
++ The 1981 Census could not be held owing to distrubed conditions prevailing in Assam. Hence the population figures for 1981 of Assam havebeen worked out by 'Interpolation'
20
Year/State/ Union Territory _____________________ ________________________ _________________________
Total Rural Urban Total Rural Urban Total Rural Urban 1 2 3 4 5 6 7 8 9 10
1991* 29.5 30.9 24.3 9.8 10.6 7.1 80 87 53 1992* 29.2 30.9 23.1 10.1 10.9 7.0 79 85 53 1993* 28.7 30.4 23.7 9.3 10.6 5.8 74 82 45 1994* 28.7 30.5 23.1 9.3 10.1 6.7 74 80 52 1995* 28.3 30.0 22.7 9.0 9.8 6.6 74 80 48 1996* 27.5 29.3 21.6 9.0 9.7 6.5 72 77 46 1997* 27.2 28.9 21.5 8.9 9.6 6.5 71 77 45 1998* 26.5 28.0 21.1 9.0 9.7 6.6 72 77 45 1999* 26.1 27.6 20.8 8.7 9.4 6.3 70 75 44 2000* 25.8 27.6 20.7 8.5 9.3 6.3 68 74 43 2001* 25.4 27.1 20.3 8.4 9.1 6.3 66 72 42 2002* 25.0 26.6 20.0 8.1 8.7 6.1 63 69 40 2003* 24.8 26.4 19.8 8.0 8.7 6.0 60 66 38 2004 24.1 25.9 19.0 7.5 8.2 5.8 58 64 40 2005 23.8 25.6 19.1 7.6 8.1 6.0 58 64 402006 23.5 25.2 18.8 7.5 8.1 6.0 57 62 39
2006State Andhra Pradesh 18.9 19.8 16.5 7.3 7.9 5.8 56 62 38 Arunachal Pradesh 22.5 23.8 17.4 5.0 5.5 2.8 40 44 19 Assam 24.6 26.1 15.4 8.7 9.2 5.8 67 70 42 Bihar 29.9 30.7 23.0 7.7 7.8 6.3 60 62 45 Chhatisgarh 26.9 28.5 19.9 8.1 8.5 6.3 61 62 50 Goa 15.1 13.5 16.2 7.4 8.2 6.9 15 14 16 Gujarat 23.5 25.0 21.1 7.3 8.2 5.9 53 62 37 Haryana 23.9 25.1 21.1 6.5 6.9 5.6 57 62 45 Himachal Pradesh 18.8 19.5 12.4 6.8 7.1 4.8 50 52 26 Jammu & Kashmir 18.7 20.0 14.2 5.9 6.1 5.0 52 54 38 Jharkhand 26.2 28.0 18.8 7.5 7.9 5.9 49 52 32 Karnataka 20.1 21.5 17.7 7.1 8.0 5.5 48 53 36 Kerala 14.9 15.0 14.6 6.7 6.8 6.5 15 16 12 Madhya Pradesh 29.1 31.2 21.9 8.9 9.6 6.3 74 79 52 Maharashtra 18.5 19.2 17.5 6.7 7.4 5.8 35 42 26 Manipur 13.4 13.5 13.1 4.5 4.4 4.6 11 11 11 Meghalaya 24.7 26.4 17.1 8.0 8.5 5.8 53 54 43 Mizoram 17.8 21.6 14.0 5.5 6.2 4.8 25 32 13 Nagaland 17.3 16.8 19.2 4.8 4.9 4.1 20 18 27 Orissa 21.9 22.8 16.2 9.3 9.7 6.9 73 76 53 Punjab 17.8 18.4 16.8 6.8 7.4 5.8 44 48 36 Rajasthan 28.3 29.7 23.9 6.9 7.2 6.1 67 74 41 Sikkim 19.2 19.5 17.7 5.6 5.7 4.7 33 35 16 Tamil Nadu 16.2 16.5 15.9 7.5 8.3 6.4 37 39 33 Tripura 16.6 17.3 13.4 6.3 6.2 6.8 36 37 30 Uttar Pradesh 30.1 31.0 26.0 8.6 9.1 6.6 71 75 53 Uttarakhand 21.0 22.0 17.3 6.7 7.0 5.5 43 54 22 West Bengal 18.4 20.7 12.3 6.2 6.2 6.3 38 40 29
Union Territory: A.& N.Islands 15.7 17.1 13.2 5.1 5.7 3.8 31 35 21 Chandigarh 15.8 23.5 15.1 4.1 3.1 4.2 23 23 23 D.& N.Haveli 28.1 27.8 29.4 4.8 5.3 3.1 35 38 24 Daman & Diu 18.4 20.2 15.5 5.5 5.0 6.1 28 33 18 Delhi 18.4 19.5 18.2 4.7 5.4 4.6 37 42 36 Lakshadweep 18.9 18.7 19.1 6.4 6.8 6.0 25 19 31 Pondicherry 15.7 16.3 15.4 7.3 8.0 7.0 28 35 24
* Excludes Nagaland (Rural)due to part-receipt of returns.Note:1. Infant Mortality Rate for smaller States & Union Territories are based on three-years period 2004-2006.
Source: Office of the Registrar General of India, Ministry of Home Affairs
Birth Rate Death Rate Infant Mortality Rate(IMR)
AREA AND POPULATION
Table No.1.5-ESTIMATED BIRTH RATES, DEATH RATES AND INFANT MORTALITY RATES BY RESIDENCE
(Per thousand)

21
State/ Union Territory Rank % Rank % 1 2 3 4 5
State: Andhra Pradesh 5 7.41 4 8.37 Arunachal Pradesh 27 0.11 14 2.55 Assam 14 2.59 16 2.39 Bihar 3 8.07 12 2.86 Chhattisgarh 17 2.03 10 4.11 Goa 26 0.13 29 0.11 Gujarat 10 4.93 7 5.96 Haryana 16 2.06 20 1.35 Himachal Pradesh 21 0.59 17 1.69 Jammu & Kashmir 19 0.98 6 6.76 Jharkhand 13 2.62 15 2.43 Karnataka 9 5.14 8 5.83 Kerala 12 3.09 21 1.18 Madhya Pradesh 7 5.87 2 9.38 Maharashtra 2 9.42 3 9.36 Manipur + 24 0.22 23 0.68 Meghalaya 23 0.23 22 0.68 Mizoram 30 0.09 24 0.64 Nagaland 25 0.19 25 0.50 Orissa 11 3.58 9 4.74 Punjab 15 2.37 19 1.53 Rajasthan 8 5.49 1 10.41 Sikkim 31 0.05 28 0.22 Tamil Nadu 6 6.06 11 3.96 Tripura 22 0.31 26 0.32 Uttar Pradesh 1 16.15 5 7.33Uttaranchal 20 0.82 18 1.63 West Bengal 4 7.79 13 2.70
Union Territory: A.& N.Islands 32 0.03 27 0.25 Chandigargh 29 0.09 33 _ D.& N.Haveli 33 0.02 32 0.01 Daman & Diu 34 0.02 34 _ Delhi 18 1.35 30 0.05 Lakshadweep 35 0.01 35 _ Pondicherry 28 0.09 31 0.02
37555 sq. km. under illegal occupation of China.2. The area figures of States and UT's do not add upto area of India because :-( i )The shortfall of 7 sq. km. area of Madhya Pradesh and 3 sq. km. area of Chattisgarh is yet to be resolved by he Survey of India.( ii) Disputed area of 13 sq.km. between Pondicherry and Andhra Pradesh is neither include in Pondicherry nor in Andhra Pradesh.+ Includes estimated Population of Paomata, Mao Maram and Purul sub-divisions of Senapati Districts of Manipur for 2001.
Source : Office of the Registrar General of India, Ministry of Home Affairs
* Area figure include the area under unlawful occupation of Pakistan & China. The area incudes 78114 sq. km.under illegal occupation of Pakistans, 5180 sq. km. illegally handed over by Pakistan to China and
AREA AND POPULATION
TABLE 1.6- RANKS OF STATES AND UNION TERRITORIES BY POPULATION AND AREA (Census-2001)
Population Area*

22
State/
Union Territory Persons Males Females Males Females Males Females
1 2 3 4 5 6 7 8
INDIA 313004983 240147813 72857170 78258978 25367090 41119069 22378045
State: Andhra Pradesh 29040873 19455492 9585381 5040681 2357007 5141014 4682250 Arunachal Pradesh 415007 267384 147623 121349 113498 7081 3568 Assam 7114097 5849032 1265065 2238423 441669 540769 95582 Bihar 21052875 17511018 3541857 5949328 820745 6881169 2138982 Chhatisgarh 7054595 4742935 2311660 2246705 1241967 826688 725395 Goa 425305 326993 98312 18365 11313 6858 4984 Gujarat 17025074 13480566 3544508 3730923 980171 2004136 1044577 Haryana 6241324 4933004 1308320 1647163 577479 462454 145417 Himachal Pradesh 1963882 1333361 630521 578807 510317 26499 9657 Jammu & Kashmir 2608668 2226958 381710 792387 156147 93313 9776 Jharkhand 6446782 5134067 1312715 1988551 667272 758101 294224 Karnataka 19364759 13896845 5467914 4668070 1518862 1961368 1822484 Kerala 8236973 6460693 1776280 515371 70989 714772 306787 Madhya Pradesh 19102572 14056279 5046293 6389368 2522473 2393898 1487007 Maharashtra 34748053 24416295 10331758 6180984 4000724 3941652 3699567 Manipur 659364 430227 229137 174869 110940 25387 16432 Meghalaya 757011 485694 271317 224551 155770 60188 34750 Mizoram 362450 225428 137022 113014 89861 6710 4130 Nagaland 703977 424811 279166 232652 226025 7330 4729 Orissa 9589269 8004740 1584529 3004654 430516 1570444 527714 Punjab 7835732 6426028 1409704 1713256 180768 892869 164753 Rajasthan 17436888 12841318 4595570 6210884 3371145 654162 354255 Sikkim 212904 146541 66363 59846 41354 5977 3104 Tamil Nadu 23757783 16303310 7454473 3107543 1631276 3273642 2789144 Tripura 912292 742054 170238 203826 48517 127177 41342 Uttar Pradesh 39337649 34338260 4999389 16326802 2153063 4816377 1140170Uttaranchal 2322347 1639242 683105 531003 536644 122799 19825 West Bengal 23023583 19494971 3528612 4182888 373138 3744905 778029
Union Territory: A.& N.Islands 113607 97349 16258 12905 2600 2470 213 Chandigargh 328989 277050 51939 1521 278 377 68 D.& N.Haveli 96184 71156 25028 16591 15696 3514 3431 Daman & Diu 67522 58874 8648 1821 922 263 182 Delhi 4317516 3794345 523171 24468 6842 8075 2554 Lakshadweep 11710 10288 1422 - - - - Pondicherry 317367 245205 72162 9409 1102 36631 22963
Main Workers
AREA AND POPULATION
TABLE 1.7- ECONOMIC CLASSIFICATION OF THE POPULATION (Census-2001)
Total Cultivators Agricultural Labourers __________________________________ ________________ ___________________

23
State/ ________________
Union Territory Males Females Males Females Persons Males Females
1 9 10 11 12 13 14 15
INDIA 7509013 4697071 113260753 20414964 89229741 34866663 54363078
State: Andhra Pradesh 637209 715496 8636588 1830628 5852986 2206700 3646286 Arunachal Pradesh 2628 1524 136326 29033 67895 26228 41667 Assam 106681 74439 2963159 653375 2424494 1021928 1402566 Bihar 550521 198827 4130000 383303 6921731 2971985 3949746 Chhatisgarh 103059 55632 1566483 288666 2625276 788924 1836352 Goa 7243 2996 294527 79019 97550 48225 49325 Gujarat 223544 82595 7521963 1437165 4230447 996720 3233727 Haryana 115120 37901 2708267 547523 2136142 782522 1353620 Himachal Pradesh 27671 7246 700384 103301 1028579 353297 675282 Jammu & Kashmir 98647 37043 1242611 178744 1145147 452983 692164 Jharkhand 192433 90060 2194982 261159 3662248 1525789 2136459 Karnataka 368699 426513 6898708 1700055 4170032 1338510 2831522 Kerala 161019 114635 5069531 1283869 2046914 1304952 741962 Madhya Pradesh 446037 284979 4826976 751834 6690947 2138089 4552858 Maharashtra 493886 316200 13799773 2315267 6425298 2435800 3989498 Manipur 14337 28826 215634 72939 285849 96989 188860 Meghalaya 7476 6441 193479 74356 213135 82797 130338 Mizoram 2747 1625 102957 41406 104709 37580 67129 Nagaland 5933 5627 178896 42785 143819 64157 79662 Orissa 258151 146057 3171491 480242 4687219 1797266 2889953 Punjab 162519 82322 3657384 981861 1291742 534185 757557 Rajasthan 373083 128229 5603189 741941 6329767 1854484 4475283 Sikkim 2433 735 78285 21170 50139 19175 30964 Tamil Nadu 594025 667034 9328100 2367019 4120499 1797087 2323412 Tripura 12201 7695 398850 72684 247269 89292 157977 Uttar Pradesh 1611880 480076 11583201 1226080 14646175 6643298 8002877Uttaranchal 34905 14122 950535 112514 811689 356935 454754 West Bengal 778046 658332 10789132 1719113 6458107 2893073 3565034
Union Territory: A.& N.Islands 3966 826 78008 12619 22647 11813 10834 Chandigargh 2296 871 272856 50722 11433 7369 4064 D.& N.Haveli 447 244 50604 5657 17938 4679 13259 Daman & Diu 366 228 56424 7316 5269 1695 3574 Delhi 106718 19259 3655084 494516 227718 165756 61962 Lakshadweep 99 56 10189 1366 3644 2916 728 Pondicherry 2988 2380 196177 45717 25288 13465 11823
Main Workers
_______________________________________Other Workers Marginal Workers
________________
TABLE 1.7- ECONOMIC CLASSIFICATION OF THE POPULATION -Contd.(Census-2001)
Household Industry
AREA AND POPULATION

24
State/ Union Territory Persons Males Females
1 16 17 18
INDIA 626375604 257142296 369233308
State: Andhra Pradesh 41316148 16865221 24450927 Arunachal Pradesh 615066 286329 328737 Assam 17116937 6906077 10210860 Bihar 55023903 22760792 32263111 Chhatisgarh 11153932 4942359 6211573 Goa 824813 312030 512783 Gujarat 29415496 11908291 17507205 Haryana 12767098 5648427 7118671 Himachal Pradesh 3085439 1401282 1684157 Jammu & Kashmir 6389885 2680985 3708900 Jharkhand 16836799 7225181 9611618 Karnataka 29315771 11663563 17652208 Kerala 21557487 7702969 13854518 Madhya Pradesh 34554504 15249284 19305220 Maharashtra 55705276 23548501 32156775 Manipur 1221575 568418 653157 Meghalaya 1348676 607596 741080 Mizoram 421414 196101 225313 Nagaland 1142240 558173 584067 Orissa 22528172 8858564 13669608 Punjab 15231525 6024832 9206693 Rajasthan 32740533 14724209 18016324 Sikkim 277808 122768 155040 Tamil Nadu 34527397 13300512 21226885 Tripura 2039642 810879 1228763 Uttar Pradesh 112214097 46583811 65630286Uttaranchal 5355313 2329747 3025566 West Bengal 50694507 19077941 31616566
Union Territory: A.& N.Islands 219898 83810 136088 Chandigargh 560213 222519 337694 D.& N.Haveli 106368 45831 60537 Daman & Diu 85413 31943 53470 Delhi 9305273 3647133 5658140 Lakshadweep 45296 17927 27369 Pondicherry 631690 228291 403399
Notes:-
Purul sub-division of Senapati district of Manipur state was cancelled due to administrative reasons.
(Census-2001)
Non Workers
Source : Office of the Registrar General of India, Ministry of Home Affairs
Total of column no.2, 13 and 16 does not tally with total population as population of Mao Maram, Pao Mata and
AREA AND POPULATION
TABLE 1.7- ECONOMIC CLASSIFICATION OF THE POPULATION -Concld.

25
Year/States
Male Female Male Female Male Female Male Female
1 2 3 4 5 6 7 8 9
1990(1) 57.7 58.1 56.7 58.5 47.5 49.7 38.6 41.1 1991(1) 58.1 58.6 56.8 58.8 47.6 49.9 38.6 41.2 1992(1) 58.6 58.7 57.2 57.8 48.0 48.7 39.0 39.9 1993(1) 59.0 59.7 57.1 59.0 47.9 50.0 38.9 41.4 1994-98 60.6 62.2 57.8 60.6 48.5 51.5 39.5 42.8 1995-99 60.8 62.5 57.9 60.8 48.6 51.7 39.6 42.9 1996-00 61.0 62.7 57.9 60.9 48.6 51.9 39.7 43.0 1997-01 61.3 63.0 58.0 61.3 48.7 52.2 39.8 43.3 1998-02 61.6 63.3 58.2 61.5 48.9 52.4 40.0 43.6 1999-03 61.8 63.5 58.4 61.8 49.1 52.7 40.2 43.9 2000-04 62.1 63.7 58.8 62.2 49.5 53.1 40.5 44.2
2000-04 Andhra Pradesh 62.4 65.0 57.7 62.0 48.4 52.7 39.7 43.6 Assam 58.0 58.6 55.7 57.4 46.6 48.6 37.9 40.2 Bihar 61.8 59.9 60.5 60.9 51.3 51.8 42.3 43.0 Gujarat 62.7 64.8 58.7 62.5 49.4 53.1 40.4 43.9 Haryana 65.3 65.8 61.0 65.0 51.5 55.7 42.7 46.6 Himachal Pradesh 66.1 66.8 61.8 62.9 52.2 53.4 43.0 44.1 Karnataka 63.1 66.7 58.3 63.3 48.8 53.8 39.9 44.7 Kerala 71.0 76.1 63.2 67.2 53.5 57.4 44.2 47.9 Madhya Pradesh 57.5 57.2 57.1 58.7 47.9 49.9 39.1 41.3 Maharashtra 65.5 67.8 59.9 62.5 50.5 53.2 41.4 44.1 Orissa 58.9 58.9 57.4 58.7 48.2 49.9 39.5 41.3 Punjab 67.8 69.8 62.5 66.1 53.1 56.6 44.4 47.4 Rajasthan 60.9 62.0 59.6 62.7 50.2 53.4 41.2 44.4 Tamil Nadu 64.6 66.8 59.2 61.3 49.7 52.0 40.8 43.0 Uttar Pradesh 59.9 59.0 57.8 58.9 48.6 49.9 39.7 41.5 West Bengal 63.7 65.2 60.3 62.6 50.9 53.2 41.7 44.0
AREA AND POPULATION
Table 1.8-EXPECTATION OF LIFE
___________________ At birth Age 10 Age 20
___________________ ___________________Age 30
___________________

26
Year/State
Male Female Male Female Male Female Male Female
1 10 11 12 13 14 15 16 17
1990(1) 29.8 32.3 21.7 23.7 14.7 16.1 9.4 10.1 1991(1) 29.9 32.4 21.8 23.9 14.8 16.2 9.5 10.2 1992(1) 30.3 31.1 22.2 22.7 15.3 15.7 10.1 9.8 1993(1) 30.1 32.6 21.9 23.9 14.9 16.2 9.6 10.1 1994-98 30.8 34.0 22.6 25.3 15.5 17.7 10.2 11.6 1995-99 30.9 34.0 22.7 25.3 15.7 17.7 10.3 11.6 1996-00 31.0 34.1 22.8 25.5 15.8 17.8 10.4 11.7 1997-01 31.2 34.4 23.0 25.7 16.0 18.1 10.6 11.9 1998-02 31.4 34.7 23.2 26.0 16.1 18.3 10.6 12.0 1999-03 31.5 35.0 23.4 26.3 16.3 18.5 10.7 12.1 2000-04 31.8 35.3 23.6 26.5 16.5 18.6 10.8 12.2
2000-04 Andhra Pradesh 31.4 34.5 23.5 25.6 16.9 17.7 11.7 11.0 Assam 29.5 31.7 21.6 23.5 15.1 16.4 10.2 10.6 Bihar 33.5 34.1 25.0 25.3 17.6 17.4 11.7 11.6 Gujarat 31.6 34.9 23.3 26.0 15.9 17.5 9.9 10.5 Haryana 34.0 37.5 26.1 28.4 19.4 20.2 13.4 13.0 Himachal Pradesh 34.2 34.8 25.6 26.1 18.1 17.9 12.2 10.9 Karnataka 31.4 35.7 23.4 26.7 16.4 18.6 10.7 11.7 Kerala 35.1 38.5 26.6 29.2 19.1 20.5 13.5 13.3 Madhya Pradesh 30.7 32.6 22.3 24.0 15.5 16.0 10.2 9.4 Maharashtra 33.0 35.0 24.9 26.2 17.4 18.1 11.5 11.3 Orissa 31.0 32.6 22.9 23.9 16.1 16.2 10.6 9.9 Punjab 36.0 38.3 27.8 29.5 20.7 21.5 14.6 14.7 Rajasthan 32.3 35.4 23.8 26.4 16.3 17.9 10.3 10.7 Tamil Nadu 32.1 33.9 23.9 25.1 16.6 17.1 10.8 10.5 Uttar Pradesh 31.1 33.0 23.0 24.6 15.7 16.7 10.0 10.4 West Bengal 32.6 34.8 24.0 25.8 16.6 17.6 10.9 11.1
(1) Data for 1991, 1992 and 1993 relate to the period 1987-91, 1988-92 and 1989-93 respectively.Note: Estimates upto 1994 at the national level exclude Mizoram as SRS came into existance in the state from 1995. Estimates from 1991 excludes Jammu & Kashmir also due to non-receipt of returns
AREA AND POPULATION
Table 1.8-EXPECTATION OF LIFE-Concld.
___________________
Source: Office of the Registrar General of India, Ministry of Home Affairs
___________________ ___________________ ___________________Age 70 +Age 40 Age 50 Age 60

27
State/Union Territory __________________
Population % increase Population % increase Population % increase Population % increase1991-2001 1991-2001 1991-2001 1991-2001
1 2 3 4 5 6 7 8 9
INDIA 827578868 20.0* 138188240 29.3* 24080016 22.1* 19215730 16.9*
State: Andhra Pradesh 67836651 14.43 6986856 17.94 1181917 -2.83 30998 41.47 Arunachal Pradesh 379935 18.65 20675 73.41 205548 130.91 1865 54.77 Assam 17296455 14.94 8240611 29.30 986589 32.54 22519 36.54 Bihar 69076919 27.11 13722048 35.48 53137 71.57 20780 66.85 Chhattisgarh 19729670 17.31 409615 36.68 401035 32.51 69621 37.57 Goa 886551 17.17 92210 50.04 359568 2.96 970 -10.76 Gujarat 45143074 22.12 4592854 27.33 284092 56.30 45587 37.95 Haryana 18655925 27.02 1222916 60.11 27185 73.16 1170662 22.34 Himachal Pradesh 5800222 16.97 119512 34.08 7687 73.32 72355 39.01 Jammu & Kashmir 3005349 .. 6793240 .. 20299 .. 207154 .. Jharkhand 18475681 9.62 3731308 40.28 1093382 34.52 83358 26.76 Karnataka 44321279 15.32 6463127 23.48 1009164 17.41 15326 51.72 Kerala 17883449 7.28 7863842 15.84 6057427 7.75 2762 24.19 Madhya Pradesh 55004675 23.34 3841449 28.77 170381 37.44 150772 36.43 Maharashtra 77859385 21.59 10270485 34.62 1058313 19.57 215337 33.59 Manipur ** 996894 -5.9 190939 42.98 737578 17.69 1653 27.05 Meghalaya 307822 18.25 99169 61.35 1628986 42.13 3110 19.06 Mizoram 31562 -9.27 10099 122.54 772809 30.68 326 9.03 Nagaland 153162 25.05 35005 69.58 1790349 69.22 1152 57.37 Orissa 34726129 15.86 761985 31.88 897861 34.76 17492 1.13 Punjab 8997942 28.74 382045 59.58 292800 30.03 14592387 14.29 Rajasthan 50151452 27.93 4788227 35.82 72660 51.40 818420 26.07 Sikkim 329548 18.59 7693 99.87 36115 169.25 1176 213.60 Tamil Nadu 54985079 11.00 3470647 13.69 3785060 19.04 9545 75.16 Tripura 2739310 14.85 254442 29.49 102489 120.53 1182 59.72 Uttar Pradesh 133979263 24.52 30740158 31.34 212578 19.37 678059 35.87 Uttarakhand 7212260 17.76 1012141 43.50 27116 26.09 212025 19.95 West Bengal 58104835 14.22 20240543 25.90 515150 34.33 66391 19.85
Union Territory: A.& N.Islands 246589 30.11 29265 37.04 77178 14.82 1587 17.55 Chandigarh 707978 45.40 35548 103.30 7627 51.63 145175 11.42 D.& N.Haveli 206203 55.96 6524 95.27 6058 189.57 123 515.00 Daman & Diu 141901 59.16 12281 35.73 3362 15.77 145 43.56 Delhi 11358049 44.09 1623520 82.49 130319 56.72 555602 21.93 Lakshadweep 2221 -4.96 57903 18.73 509 -14.88 6 500.00 Pondicherry 845449 21.47 59358 12.27 67688 15.97 108 272.41 For footnotes, please see next page
Sikhs _______________ _________________ __________________
Hindu Muslims Christians
Table 1.9-POPULATION BY RELIGION CENSUS 2001
AREA AND POPULATION
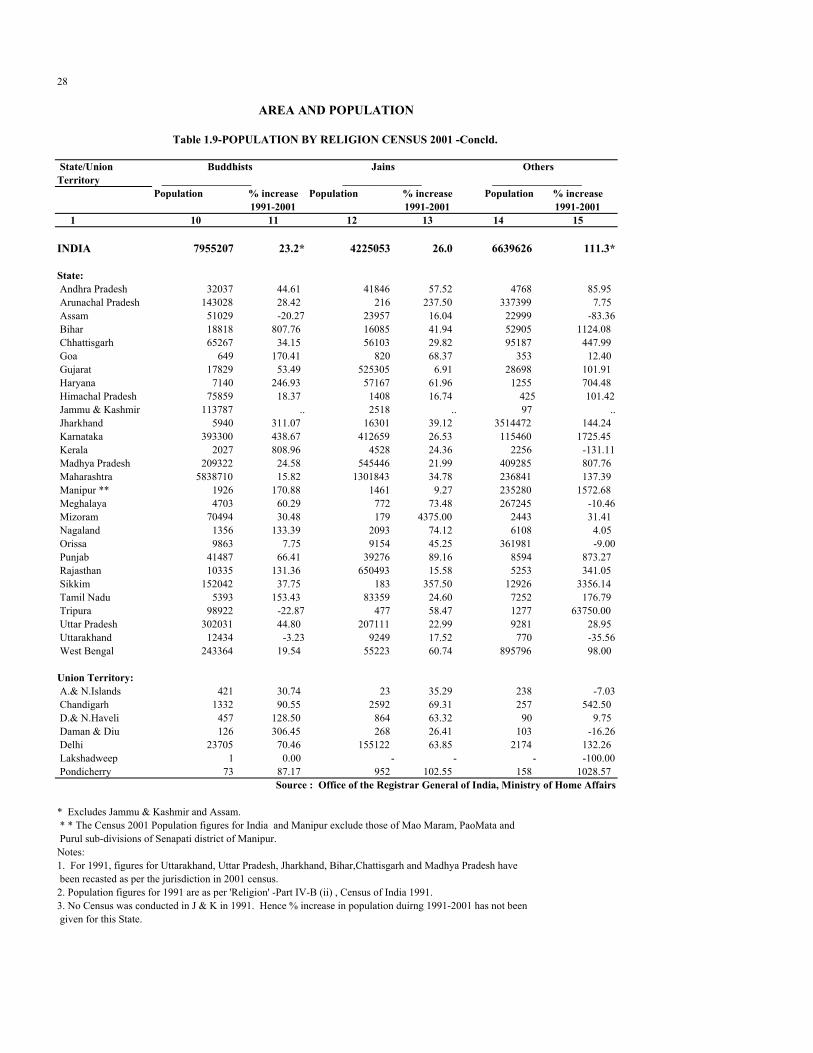
28
State/Union Territory
Population % increase Population % increase Population % increase1991-2001 1991-2001 1991-2001
1 10 11 12 13 14 15
INDIA 7955207 23.2* 4225053 26.0 6639626 111.3*
State: Andhra Pradesh 32037 44.61 41846 57.52 4768 85.95 Arunachal Pradesh 143028 28.42 216 237.50 337399 7.75 Assam 51029 -20.27 23957 16.04 22999 -83.36 Bihar 18818 807.76 16085 41.94 52905 1124.08 Chhattisgarh 65267 34.15 56103 29.82 95187 447.99 Goa 649 170.41 820 68.37 353 12.40 Gujarat 17829 53.49 525305 6.91 28698 101.91 Haryana 7140 246.93 57167 61.96 1255 704.48 Himachal Pradesh 75859 18.37 1408 16.74 425 101.42 Jammu & Kashmir 113787 .. 2518 .. 97 .. Jharkhand 5940 311.07 16301 39.12 3514472 144.24 Karnataka 393300 438.67 412659 26.53 115460 1725.45 Kerala 2027 808.96 4528 24.36 2256 -131.11 Madhya Pradesh 209322 24.58 545446 21.99 409285 807.76 Maharashtra 5838710 15.82 1301843 34.78 236841 137.39 Manipur ** 1926 170.88 1461 9.27 235280 1572.68 Meghalaya 4703 60.29 772 73.48 267245 -10.46 Mizoram 70494 30.48 179 4375.00 2443 31.41 Nagaland 1356 133.39 2093 74.12 6108 4.05 Orissa 9863 7.75 9154 45.25 361981 -9.00 Punjab 41487 66.41 39276 89.16 8594 873.27 Rajasthan 10335 131.36 650493 15.58 5253 341.05 Sikkim 152042 37.75 183 357.50 12926 3356.14 Tamil Nadu 5393 153.43 83359 24.60 7252 176.79 Tripura 98922 -22.87 477 58.47 1277 63750.00 Uttar Pradesh 302031 44.80 207111 22.99 9281 28.95 Uttarakhand 12434 -3.23 9249 17.52 770 -35.56 West Bengal 243364 19.54 55223 60.74 895796 98.00
Union Territory: A.& N.Islands 421 30.74 23 35.29 238 -7.03 Chandigarh 1332 90.55 2592 69.31 257 542.50 D.& N.Haveli 457 128.50 864 63.32 90 9.75 Daman & Diu 126 306.45 268 26.41 103 -16.26 Delhi 23705 70.46 155122 63.85 2174 132.26 Lakshadweep 1 0.00 - - - -100.00 Pondicherry 73 87.17 952 102.55 158 1028.57
Notes:
2. Population figures for 1991 are as per 'Religion' -Part IV-B (ii) , Census of India 1991.3. No Census was conducted in J & K in 1991. Hence % increase in population duirng 1991-2001 has not been given for this State.
AREA AND POPULATION
OthersBuddhists Jains
Table 1.9-POPULATION BY RELIGION CENSUS 2001 -Concld.
been recasted as per the jurisdiction in 2001 census.
Source : Office of the Registrar General of India, Ministry of Home Affairs
* * The Census 2001 Population figures for India and Manipur exclude those of Mao Maram, PaoMata and Purul sub-divisions of Senapati district of Manipur.
* Excludes Jammu & Kashmir and Assam.
_________________ _______________ _________________
1. For 1991, figures for Uttarakhand, Uttar Pradesh, Jharkhand, Bihar,Chattisgarh and Madhya Pradesh have

29
State/ Males Females Persons Rural Urban % to total Union Territory population
1 2 3 4 5 6 7
INDIA 86088760 80546940 166635700 133010878 33624822 16.2
State: Andhra Pradesh 6228011 6111485 12339496 10219409 2120087 16.2 Arunachal Pradesh 3590 2598 6188 3062 3126 0.6 Assam 943674 882275 1825949 1553691 272258 6.9 Bihar 6784676 6263932 13048608 12178555 870053 15.7 Chhatisgarh 1213194 1205528 2418722 1899055 519667 11.6 Goa 12047 11744 23791 10720 13071 1.8 Gujarat 1866283 1726432 3592715 2180441 1412274 7.1 Haryana 2188585 1902525 4091110 3210917 880193 19.3 Himachal Pradesh 763333 738837 1502170 1403050 99120 24.7 Jammu & Kashmir 403256 366899 770155 636016 134139 7.6 Jharkhand 1640583 1548737 3189320 2588094 601226 11.8 Karnataka 4339745 4224185 8563930 6417243 2146687 16.2 Kerala 1525114 1598827 3123941 2553725 570216 9.8 Madhya Pradesh 4804881 4350296 9155177 6914726 2240451 15.2 Maharashtra 5063062 4818594 9881656 6093829 3787827 10.2 Manipur 29934 30103 60037 20802 39235 2.8 Meghalaya 5920 5219 11139 7065 4074 0.5 Mizoram 212 60 272 65 207 N Nagaland _ _ _ _ _ NSC Orissa 3073278 3008785 6082063 5378788 703275 16.5 Punjab 3714350 3314373 7028723 5318254 1710469 28.9 Rajasthan 5067679 4626783 9694462 7739926 1954536 17.2 Sikkim 13807 13358 27165 23872 3293 5.0 Tamil Nadu 5932925 5924579 11857504 8308890 3548614 19.0 Tripura 283186 272538 555724 455623 100101 17.4 Uttar Pradesh 18502838 16645539 35148377 30816596 4331781 21.1 Uttarakhand 780772 736414 1517186 1256122 261064 17.9 West Bengal 9469659 8982896 18452555 15524925 2927630 23.0
Union Territory: A.& N.Islands _ _ _ _ _ NSC Chandigarh 86187 71410 157597 14740 142857 17.5 D.& N.Haveli 2159 1945 4104 2834 1270 1.9 Daman & Diu 2498 2340 4838 2920 1918 3.1 Delhi 1265182 1078073 2343255 188378 2154877 16.9 Lakshadweep _ _ _ _ _ NSC Pondicherry 78140 79631 157771 88545 69226 16.2Notes :-1. Figures for India and Manipur exclude figures of Paomata, Mao Maram and Purul sub-divisions of Senapati district of Manipur for 2001.2. India and Jammu & Kashmir exclude population and households of those portions of Jammu & Kashmir which are under illegal occupations of Pakistan & China.NSC - No Scheduled Castes Notified. N - Negligible
AREA AND POPULATION
TABLE 1.10- POPULATION OF SCHEDULED CASTES AND SCHEDULED TRIBES(Census-2001)
Scheduled Castes

30
State/ Males Females Persons Rural Urban % to total % of SC & ST Union Territory population population to
total population 1 2 3 4 5 6 7 8
INDIA 42640829 41685411 84326240 77338597 6987643 8.2 24.4
State: Andhra Pradesh 2548295 2475809 5024104 4646923 377181 6.6 22.8 Arunachal Pradesh 352017 353141 705158 606278 98880 64.2 64.8 Assam 1678117 1630453 3308570 3154546 154024 12.4 19.3 Bihar 393114 365237 758351 717702 40649 0.9 16.6 Chhatisgarh 3287334 3329262 6616596 6264835 351761 31.8 43.4 Goa 299 267 566 190 376 N 1.8 Gujarat 3790117 3691043 7481160 6866637 614523 14.8 21.9 Haryana _ _ _ _ _ NST 19.3 Himachal Pradesh 122549 122038 244587 237060 7527 4.0 28.7 Jammu & Kashmir 578949 527030 1105979 1054488 51491 10.9 18.5 Jharkhand 3565960 3521108 7087068 6500014 587054 26.3 38.1 Karnataka 1756238 1707748 3463986 2934530 529456 6.6 22.8 Kerala 180169 184020 364189 350019 14170 1.1 10.9 Madhya Pradesh 6195240 6038234 12233474 11446448 787026 20.3 35.5 Maharashtra 4347754 4229522 8577276 7486537 1090739 8.9 19.1 Manipur 374319 366822 741141 705912 35229 34.2 37.0 Meghalaya 996567 996295 1992862 1682670 310192 85.9 86.4 Mizoram 422963 416347 839310 430883 408427 94.5 94.5 Nagaland 913203 860823 1774026 1544022 230004 89.1 89.1 Orissa 4066783 4078298 8145081 7698358 446723 22.1 38.6 Punjab _ _ _ _ _ NST 28.9 Rajasthan 3650982 3446724 7097706 6717830 379876 12.6 29.8 Sikkim 56940 54465 111405 101909 9496 20.6 25.6 Tamil Nadu 328917 322404 651321 551143 100178 1.0 20.0 Tripura 504320 489106 993426 967997 25429 31.1 48.5 Uttar Pradesh 55834 52129 107963 95828 12135 0.1 21.2 Uttarakhand 131334 124795 256129 240209 15920 3.0 20.9 West Bengal 2223924 2182870 4406794 4136366 270428 5.5 28.5
Union Territory: A.& N.Islands 15127 14342 29469 28456 1013 8.3 8.3 Chandigarh _ _ _ _ _ NST 17.5 D.& N.Haveli 67663 69562 137225 127410 9815 62.2 64.1 Daman & Diu 7190 6807 13997 11188 2809 8.8 11.9 Delhi _ _ _ _ _ NST 16.9 Lakshadweep 28611 28710 57321 32209 25112 94.5 94.5 Pondicherry _ _ _ _ _ NST 16.2
Note :- NST - No Scheduled Tribe notified N - Negligible
Source : Office of the Registrar General of India, Ministry of Home Affairs
TABLE 1.10- POPULATION OF SCHEDULED CASTES AND SCHEDULED TRIBES(Census-2001)-Concld.
Scheduled Tribes
AREA AND POPULATION

8
('000 Nos.)
State/ 1991 2001 2002 2003 2004 2005 2006 2007 Union Territory
1 2 3 4 5 6 7 8 9
INDIA 852297 1034931 1051258 1068065 1084757 1101318 1117734 1134023
State: Andhra Pradesh 66942 76399 77471 78384 79275 80147 81001 81836 Arunachal Pradesh 873 1105 1117 1131 1146 1160 1174 1188 Assam 22569 26779 27212 27615 28013 28406 28797 29183 Bihar 65007 83788 85157 86728 88268 89776 91253 92699 Chhatisgarh 17744 20911 21319 21673 22022 22367 22710 23048 Goa 1175 1355 1356 1383 1421 1463 1506 1556 Gujarat 41568 51058 51855 52723 53580 54426 55262 56088 Haryana 16597 21328 21726 22162 22597 23029 23460 23888 Himachal Pradesh 5202 6108 6183 6260 6335 6408 6479 6550 Jammu & Kashmir 7907 10228 10355 10515 10676 10837 10995 11152Jharkhand 22000 27131 27611 28084 28545 29000 29452 29895 Karnataka 45241 53119 53791 54479 55155 55822 56480 57128 Kerala 29210 31916 32230 32518 32803 33083 33357 33626 Madhya Pradesh 48947 60751 61998 63211 64413 65605 66791 67967 Maharashtra 79528 97476 98973 100564 102161 103755 105338 106919 Manipur 1851 2174 2205 2233 2261 2289 2317 2346 Meghalaya 1791 2338 2359 2389 2420 2450 2480 2510 Mizoram 697 895 904 916 927 939 950 962 Nagaland 1229 2025 2025 2051 2076 2102 2128 2154 Orissa 31843 36961 37392 37814 38224 38626 39021 39407 Punjab 20406 24511 24813 25157 25499 25839 26172 26503 Rajasthan 44366 56999 58055 59217 60375 61525 62661 63789 Sikkim 410 547 550 557 564 571 578 586 Tamil Nadu 56103 62598 63185 63741 64279 64800 65306 65795 Tripura 2781 3203 3255 3297 3338 3380 3421 3463 Uttar Pradesh 133073 167481 170679 174091 177532 180990 184449 187928 Uttaranchal 7097 8540 8683 8829 8976 9123 9268 9414 West Bengal 68549 80492 81649 82671 83650 84599 85531 86430
Union Territory: A.& N.Islands 284 358 369 382 395 410 424 438 Chandigargh 649 912 930 968 1015 1067 1121 1182 D.& N.Haveli 140 225 223 231 243 257 271 286 Daman & Diu 103 161 175 187 198 209 220 231 Delhi 9549 14021 14417 14843 15275 15718 16175 16641 Lakshadweep 52 61 65 68 69 71 73 74 Pondicherry 815 978 974 996 1029 1070 1112 1162
AREA AND POPULATION
TABLE 1.11-ESTIMATED MID YEAR POPULATION
Source : Office of the Registrar General of India, Ministry of Home Affairs
(As on 1st July)

32
Sl. States/Inion Territories Persons Males FemalesNo. City1 2 3 4 5
Andhra Pradesh 15,731,221 8,024,809 7,706,412 1 Hyderabad U.A. 5,742,036 2,973,472 2,768,564 2 Visakhapatnam (UA) 1,345,938 687,985 657,9533 Vijayawada (UA) 1,039,518 527,307 512,2114 Warangal (UA) 579,216 293,709 285,5075 Guntur (M.Corp) 514,461 257,775 256,6866 Rajahmundry (UA) 413,616 207,869 205,7477 Nellore (UA) 404,775 203,823 200,9528 Kakinada (UA) 376,861 187,064 189,7979 Kurnool (UA) 342,973 174,190 168,783
10 Tirupati (UA) 303,521 155,468 148,05311 Nizamabad (M) 288,722 146,198 142,52412 Cuddapah (UA) 262,506 133,224 129,28213 Anantapur (UA) 243,143 123,713 119,43014 Ramagundam (UA) 237,686 121,250 116,43615 Karimnagar (UA) 218,302 111,875 106,42716 Eluru (UA) 215,804 105,476 110,32817 Khammam (UA) 198,620 100,930 97,69018 Vizianagaram (UA) 195,801 97,032 98,76919 Machilipatnam (M) 179,353 89,100 90,25320 Chirala (UA) 166,294 82,954 83,34021 Adoni (UA) 162,458 82,345 80,11322 Nandyal (UA) 157,120 79,500 77,62023 Ongole (UA) 153,829 78,242 75,58724 Tenali (M) 153,756 77,404 76,35225 Chittoor (M) 152,654 76,879 75,77526 Proddatur (M) 150,309 75,372 74,93727 Bhimavaram (UA) 142,064 71,929 70,13528 Mahbubnagar (UA) 139,662 71,516 68,14629 Adilabad (UA) 129,403 65,501 63,90230 Hindupur (M) 125,074 64,132 60,94231 Mancherial (UA) 118,195 60,371 57,82432 Srikakulam (UA) 117,320 58,753 58,56733 Guntakal (M) 117,103 59,211 57,89234 Gudivada (M) 113,054 55,867 57,18735 Nalgonda (UA) 111,380 56,848 54,53236 Madanapalle (UA) 107,449 54,497 52,95237 Kothagudem (UA) 105,266 52,318 52,94838 Dharmavaram (M) 103,357 52,785 50,57239 Tadepalligudem (M) 102,622 50,925 51,697
Arunachal Pradesh _
Table 1.12 Population Cities (1) Census 2001

33
Sl. States/Inion Territories Persons Males FemalesNo. City1 2 3 4 5
Assam 1,615,154 871,462 743,692 1 Guwahati U.A. 818,809 446,311 372,498 2 Silchar U.A. 184,105 94,306 89,799 3 Jorhat U.A. 137,814 73,213 64,601 4 Dibrugarh U.A. 137,661 73,307 64,354 5 Nagaon U.A. 123,265 64,895 58,370 6 Tinsukia U.A. 108,123 59,561 48,562 7 Tezpur U.A. 105,377 59,869 45,508
Bihar 5,144,150 2,766,081 2,378,069 1 Patna UA 1,697,976 922,971 775,005 2 Gaya UA 394,945 210,410 184,535 3 Bhagalpur UA 350,133 187,723 162,410 4 Muzaffarpur (M.Corp.) 305,525 164,000 141,525 5 Darbhanga (M.Corp.) 267,348 142,377 124,971 6 Bihar (M) 232,071 122,019 110,052 7 Arrah (M) 203,380 109,867 93,513 8 Purnia UA 197,211 106,313 90,898 9 Katihar UA 190,873 102,161 88,712
10 Munger (M) 188,050 101,264 86,786 11 Chapra (M) 179,190 95,494 83,696 12 Sasaram (M) 131,172 69,682 61,490 13 Saharsa (M) 125,167 67,718 57,449 14 Hajipur (M) 119,412 63,838 55,574 15 Dehri (M) 119,057 63,540 55,517 16 Bettiah (M) 116,670 61,753 54,917 17 Siwan (M) 109,919 58,262 51,657 18 Motihari UA 108,428 59,148 49,280 19 Begusarai UA 107,623 57,541 50,082
Chhattisgarh 2,641,761 1,371,818 1,269,9431 Durg-Bhilainagar U.A. 927,864 482,304 445,5602 Raipur U.A. 700,113 364,436 335,6773 Bilaspur U.A. 335,293 174,351 160,9424 Korba (M.Corp.) 315,690 164,768 150,9225 Rajnandgaon (M.Corp.) 143,770 72,949 70,8216 Raigarh U.A. 115,908 60,101 55,8077 Jagdalpur U.A. 103,123 52,909 50,214
Goa 104,758 55,954 48,8041 Mormugao U.A. 104,758 55,954 48,804
Table 1.12 Population Cities (1) -CONTD.Census 2001

34
Sl. States/Inion Territories Persons Males FemalesNo. City1 2 3 4 5
Gujrat 14414128 7701987 67121411 AhmadabadU.A. 4525013 2401422 21235912 Surat U. A. 2811614 1597156 12144583 VadodaraU.A. 1491045 782251 7087944 Rajkot U.A. 1003015 525898 4771175 Jamnagar U.A. 556956 292168 2647886 Bhavnagar U.A. 517708 270278 2474307 Junagadh U.A. 252108 130461 1216478 Nvsari U.A. 232411 122282 1101299 Wadhwan U.A. 219585 114175 105410
10 Anand U.A. 218486 115295 10319111 Porbandar U.A. 197382 101824 9555812 Nadiad U.A. 196793 102336 9445713 Gandhinagar. N.A.C. 195985 103876 9210914 Morvi U.A. 178055 92639 8541615 Bharuch U.A. 176364 91281 8508316 Veraval U.A. 158032 80889 7714317 Gandhidham.U.A. 151693 79379 7231418 Valsad U.A. 145592 75216 7037619 Mahesana U.A. 141453 74866 6658720 Bhuj U.A. 136429 71056 6537321 GodhraU.A. 131172 67969 6320322 Palanpur U.A. 122300 64365 5793523 Patan U.A. 113749 59955 5379424 Anklesvar U.A. 112643 60249 5239425 Dahod U.A. 112026 57642 5438426 Kalol U.A. 112013 59539 5247427 Jetpur Navagadh.U.A. 104312 54768 4954428 Botad.U.A. 100194 52752 47442
Haryana 4,437,295 2,412,389 2,024,906 1 Faridabad (M.Corp.) 1,055,938 581,069 474,869 2 Panipat U.A. 354,148 194,850 159,298 3 Yamunanagar U.A. 306,740 166,137 140,603 4 Rohtak U.A. 294,577 158,287 136,290 5 Hisar U.A. 263,186 143,795 119,391 6 Sonipat U.A. 225,074 122,480 102,594 7 Karnal U.A. 221,236 117,875 103,361 8 Gurgaon U.A. 228,820 123,377 105,443 9 Bhiwani (M.Cl.) 169,531 91,697 77,834
10 Ambala U.A. 168,316 92,977 75,339 11 Sirsa (M.Cl.) 160,735 85,993 74,742 12 Panchkula (E.O.) 140,925 75,897 65,028 13 Ambala (M.Cl.) 139,279 74,016 65,263 14 Jind (M.Cl.) 135,855 73,407 62,448 15 Bahadurgarh U.A. 131,925 72,873 59,052 16 Thanesar U.A. 122,319 66,978 55,341 17 Kaithal (M.Cl.) 117,285 63,098 54,187 18 Palwal (M.Cl.) 100,722 53,648 47,074 19 Rewari (M.Cl.) 100,684 53,935 46,749
Table 1.12 Population Cities (1) -CONTD.Census 2001
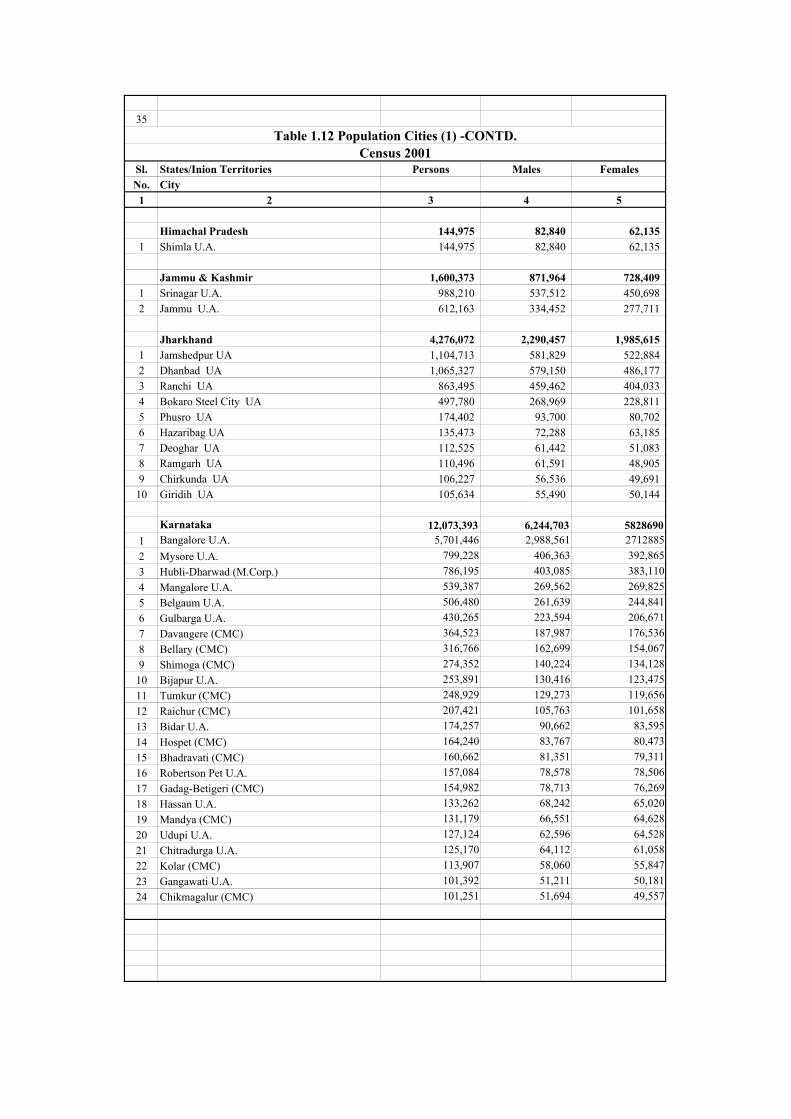
35
Sl. States/Inion Territories Persons Males FemalesNo. City1 2 3 4 5
Himachal Pradesh 144,975 82,840 62,135 1 Shimla U.A. 144,975 82,840 62,135
Jammu & Kashmir 1,600,373 871,964 728,409 1 Srinagar U.A. 988,210 537,512 450,698 2 Jammu U.A. 612,163 334,452 277,711
Jharkhand 4,276,072 2,290,457 1,985,615 1 Jamshedpur UA 1,104,713 581,829 522,884 2 Dhanbad UA 1,065,327 579,150 486,177 3 Ranchi UA 863,495 459,462 404,033 4 Bokaro Steel City UA 497,780 268,969 228,811 5 Phusro UA 174,402 93,700 80,702 6 Hazaribag UA 135,473 72,288 63,185 7 Deoghar UA 112,525 61,442 51,083 8 Ramgarh UA 110,496 61,591 48,905 9 Chirkunda UA 106,227 56,536 49,691
10 Giridih UA 105,634 55,490 50,144
Karnataka 12,073,393 6,244,703 58286901 Bangalore U.A. 5,701,446 2,988,561 27128852 Mysore U.A. 799,228 406,363 392,8653 Hubli-Dharwad (M.Corp.) 786,195 403,085 383,1104 Mangalore U.A. 539,387 269,562 269,8255 Belgaum U.A. 506,480 261,639 244,8416 Gulbarga U.A. 430,265 223,594 206,6717 Davangere (CMC) 364,523 187,987 176,5368 Bellary (CMC) 316,766 162,699 154,0679 Shimoga (CMC) 274,352 140,224 134,128
10 Bijapur U.A. 253,891 130,416 123,47511 Tumkur (CMC) 248,929 129,273 119,65612 Raichur (CMC) 207,421 105,763 101,65813 Bidar U.A. 174,257 90,662 83,59514 Hospet (CMC) 164,240 83,767 80,47315 Bhadravati (CMC) 160,662 81,351 79,31116 Robertson Pet U.A. 157,084 78,578 78,50617 Gadag-Betigeri (CMC) 154,982 78,713 76,26918 Hassan U.A. 133,262 68,242 65,02019 Mandya (CMC) 131,179 66,551 64,62820 Udupi U.A. 127,124 62,596 64,52821 Chitradurga U.A. 125,170 64,112 61,05822 Kolar (CMC) 113,907 58,060 55,84723 Gangawati U.A. 101,392 51,211 50,18124 Chikmagalur (CMC) 101,251 51,694 49,557
Table 1.12 Population Cities (1) -CONTD.Census 2001

36
Sl. States/Inion Territories Persons Males FemalesNo. City1 2 3 4 5
Kerala 5691294 2779341 29119531 Kochi U.A. 1355972 670340 6856322 Thiruvanantpuram UA 889635 437407 4522283 Kozhikode U.A. 880247 429163 4510844 Kannur UA 498207 237108 2610995 Kollam U.A. 380091 186924 1931676 Thrissur U.A. 330122 160443 1696797 Alappuzha U.A. 282675 137244 1454318 Palakkad U.A. 197369 96928 1004419 Kottayam U.A. 172878 84960 87918
10 Malappuram U.A. 170409 83709 8670011 Cherthala U.A. 141558 68756 7280212 Guruvayoor U.A. 138681 64554 7412713 Kanhangad U.A. 129367 62002 6736514 Vadakara U.A. 124083 59803 64280
Madhya Pradesh 8,842,338 4,666,260 4,176,0781 Indore U.A. 1,516,918 796,673 720,2452 Bhopal U.A. 1,458,416 768,391 690,0253 Jabalpur U.A. 1,098,000 580,038 517,9624 Gwalior U.A. 865,548 465,057 400,4915 Ujjain U.A. 431,162 224,475 206,6876 Sagar U.A. 308,922 162,919 146,0037 Ratlam U.A. 234,419 120,874 113,5458 Dewas (M.Corp.) 231,672 121,075 110,5979 Satna U.A. 229,307 122,401 106,906
10 Burhanpur (M.Corp.) 193,725 99,751 93,97411 Murwara (Katni) (M.Corp.) 187,029 97,843 89,18612 Singrauli (M.Corp.) 185,190 100,149 85,04113 Rewa (M.Corp.) 183,274 98,793 84,48114 Khandwa (M.Corp.) 172,242 88,950 83,29215 Bhind (M) 153,752 82,945 70,80716 Chhindwara U.A. 153,552 79,889 73,66317 Morena (M) 150,959 82,305 68,65418 Shivpuri (M) 146,892 78,433 68,45919 Guna (M) 137,175 72,538 64,63720 Damoh U.A. 127,967 67,321 60,64621 Vidisha (M) 125,453 66,572 58,88122 Mandsaur U.A. 117,555 60,859 56,69623 Neemuch U.A. 112,852 59,320 53,53224 Chhatarpur U.A. 109,078 58,421 50,65725 Itarsi U.A. 107,831 56,347 51,48426 Khargone U.A. 103,448 53,921 49,527
Table 1.12 Population Cities (1) -CONTD.Census 2001

37
Sl. States/Inion Territories Persons Males FemalesNo. City1 2 3 4 5
Maharastra 32771233 17609326 151619071 Greater Mumbai U.A. 16434386 9021789 74125972 Pune U. A. 3760636 1980621 17800153 Nagpur U. A. 2129500 1102009 10274914 Nasik U.A. 1152326 616088 5362385 Aurangabad U.A. 892483 469237 4232466 Solapur M. Corp. 872478 444734 4277447 Bhiwandi U.A. 621427 382184 2392438 Amarawati M.Corp. 549510 284247 2652639 Kolhapur U.A. 505541 262258 243283
10 Sangli U.A. 447774 229958 21781611 NandedWaghala M.Corp. 430733 224843 20589012 Malegaon MCl 409403 208864 20053913 Akola MCl 400520 206649 19387114 JalgaonMCl 368618 193496 17512215 Ahmadnagar U.A. 347549 184765 16278416 Dhule MCl 341755 177772 16398317 Latur MCl 299985 156547 14343818 Chandrapur MCl 289450 151202 13824819 Ichalkaranji U.A. 285860 150977 13488320 Parbhani MCl 259329 133959 12537021 Jalna MCl 235795 121922 11387322 Bhusawal U.A. 187564 97243 9032123 Nalasopara MCl 184538 98870 8566824 Vasai U.A. 174396 91030 8336625 Yavatmal U.A. 139835 71908 6792726 Bid MCl 138196 71827 6636927 Kamptee U.A. 136491 71270 6522128 Gondiya MCl 120902 61418 5948429 Virar MCl 118928 63704 5522430 Wardha MCl 111118 57499 5361931 Satara MCl 108048 55938 5211032 Achalpur MCl 107316 55687 5162933 Barshi MCl 104785 53848 5093734 Panvel MCl 104058 54963 49095
Manipur 250,234 123,859 126,375 1 Imphal U.A. 250,234 123,859 126,375
Meghalaya 267,662 134,497 133,165 1 Shillong U.A. 267,662 134,497 133,165
Mizoram 228,280 115,986 112,294 1 Aizawl (N.T.) 228,280 115,986 112,294
Nagaland _
Table 1.12 Population Cities (1) -CONTD.Census 2001

38
Sl. States/Inion Territories Persons Males FemalesNo. City1 2 3 4 5
Orissa 2,679,455 1,435,046 1,244,4091 Bhubaneswar U.A. 658,220 366,134 292,0862 Cuttack U.A. 587,182 314,101 273,0813 Raurkela U.A. 484,874 258,731 226,1434 Brahmapur (M) 307,792 160,354 147,4385 Sambalpur U.A. 226,469 117,745 108,7246 Puri (M) 157,837 82,269 75,5687 Baleshwar U.A. 156,430 82,106 74,3248 Baripada U.A. 100,651 53,606 47,045
Punjab 4,819,089 2,627,496 2,191,593 1 Ludhiana (M.Corp.) 1,398,467 793,142 605,325 2 Amritsar U.A. 1,003,917 538,744 465,173 3 Jalandhar U.A. 714,077 383,624 330,453 4 Patiala U.A. 323,884 173,682 150,202 5 Bathinda (M.Cl.) 217,256 116,946 100,310 6 Pathankot U.A. 168,485 92,003 76,482 7 Hoshiarpur (M.Cl.) 149,668 79,454 70,214 8 Batala U.A. 147,872 78,393 69,479 9 Moga U.A. 135,279 72,043 63,236
10 Abohar (M.Cl.) 124,339 66,445 57,894 11 S.A.S.Nagar (Mohali) (M.Cl.) 123,484 65,642 57,842 12 Malerkotla (M.Cl.) 107,009 56,767 50,242 13 Khanna (M.Cl.) 103,099 55,276 47,823 14 Phagwara U.A. 102,253 55,335 46,918
Rajasthan 7,561,381 4,018,093 3,543,288 1 Jaipur (M.Corp.) 2,322,575 1,237,765 1,084,810 2 Jodhpur UA 860,818 459,198 401,620 3 Kota UA 703,150 373,094 330,056 4 Bikaner (M.Cl.) 529,690 283,067 246,623 5 Ajmer UA 490,520 256,695 233,825 6 Udaipur (M.Cl.) 389,438 205,335 184,103 7 Bhilwara (M.Cl.) 280,128 148,794 131,334 8 Alwar UA 266,203 143,699 122,504 9 Ganganagar UA 222,858 121,865 100,993
10 Bharatpur UA 205,235 110,397 94,838 11 Pali (M.Cl.) 187,641 99,267 88,374 12 Sikar UA 185,925 96,697 89,228 13 Tonk (M.Cl.) 135,689 70,255 65,434 14 Hanumangarh (M) 129,556 69,532 60,024 15 Beawar UA 125,981 65,586 60,395 16 Kishangarh (M) 116,222 61,075 55,147 17 Gangapur City UA 105,396 56,009 49,387 18 Sawai Madhopur UA 101,997 53,903 48,094 19 Churu UA 101,874 53,079 48,795 20 Jhunjhunun (M) 100,485 52,781 47,704
Table 1.12 Population Cities (1) -CONTD.Census 2001
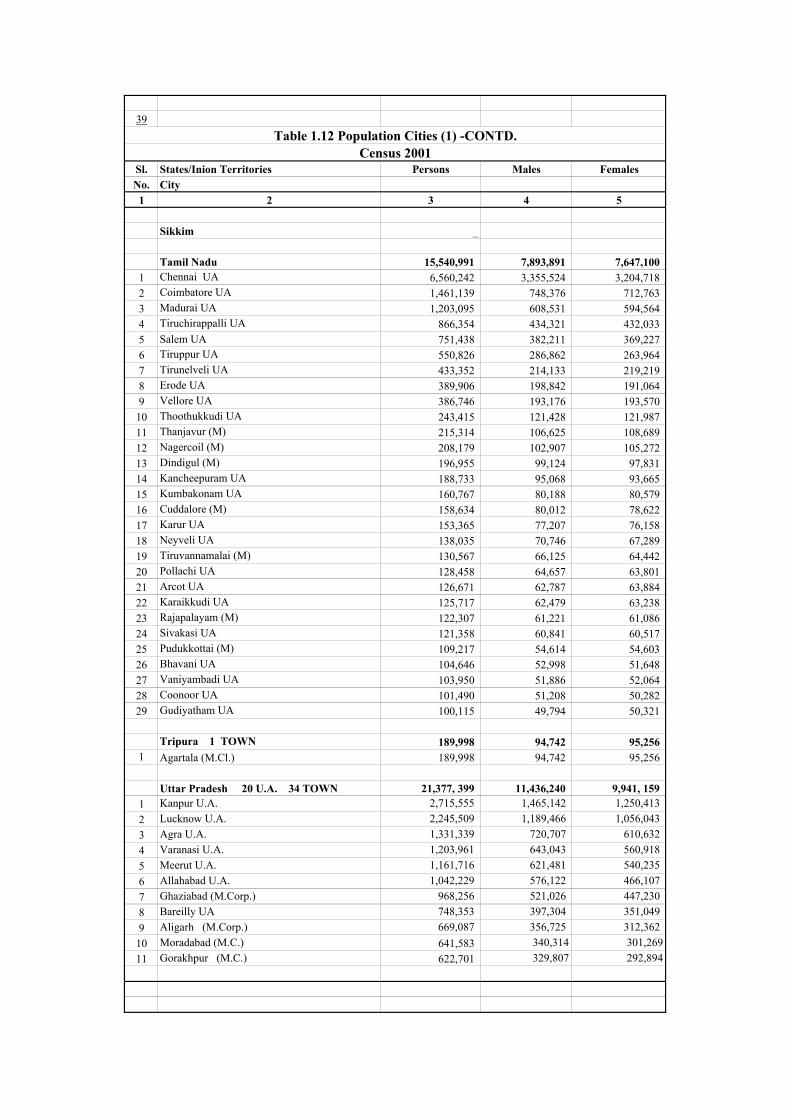
39
Sl. States/Inion Territories Persons Males FemalesNo. City1 2 3 4 5
Sikkim _
Tamil Nadu 15,540,991 7,893,891 7,647,100 1 Chennai UA 6,560,242 3,355,524 3,204,718 2 Coimbatore UA 1,461,139 748,376 712,763 3 Madurai UA 1,203,095 608,531 594,564 4 Tiruchirappalli UA 866,354 434,321 432,033 5 Salem UA 751,438 382,211 369,227 6 Tiruppur UA 550,826 286,862 263,964 7 Tirunelveli UA 433,352 214,133 219,219 8 Erode UA 389,906 198,842 191,064 9 Vellore UA 386,746 193,176 193,570
10 Thoothukkudi UA 243,415 121,428 121,987 11 Thanjavur (M) 215,314 106,625 108,689 12 Nagercoil (M) 208,179 102,907 105,272 13 Dindigul (M) 196,955 99,124 97,831 14 Kancheepuram UA 188,733 95,068 93,665 15 Kumbakonam UA 160,767 80,188 80,579 16 Cuddalore (M) 158,634 80,012 78,622 17 Karur UA 153,365 77,207 76,158 18 Neyveli UA 138,035 70,746 67,289 19 Tiruvannamalai (M) 130,567 66,125 64,442 20 Pollachi UA 128,458 64,657 63,801 21 Arcot UA 126,671 62,787 63,884 22 Karaikkudi UA 125,717 62,479 63,238 23 Rajapalayam (M) 122,307 61,221 61,086 24 Sivakasi UA 121,358 60,841 60,517 25 Pudukkottai (M) 109,217 54,614 54,603 26 Bhavani UA 104,646 52,998 51,648 27 Vaniyambadi UA 103,950 51,886 52,064 28 Coonoor UA 101,490 51,208 50,282 29 Gudiyatham UA 100,115 49,794 50,321
Tripura 1 TOWN 189,998 94,742 95,256 1 Agartala (M.Cl.) 189,998 94,742 95,256
Uttar Pradesh 20 U.A. 34 TOWN 21,377, 399 11,436,240 9,941, 1591 Kanpur U.A. 2,715,555 1,465,142 1,250,413 2 Lucknow U.A. 2,245,509 1,189,466 1,056,043 3 Agra U.A. 1,331,339 720,707 610,632 4 Varanasi U.A. 1,203,961 643,043 560,918 5 Meerut U.A. 1,161,716 621,481 540,235 6 Allahabad U.A. 1,042,229 576,122 466,107 7 Ghaziabad (M.Corp.) 968,256 521,026 447,230 8 Bareilly UA 748,353 397,304 351,049 9 Aligarh (M.Corp.) 669,087 356,725 312,362
10 Moradabad (M.C.) 641,583 340,314 301,269 11 Gorakhpur (M.C.) 622,701 329,807 292,894
Table 1.12 Population Cities (1) -CONTD.Census 2001

40
Sl. States/Inion Territories Persons Males FemalesNo. City1 2 3 4 5
Uttar Pradesh -Contd.
12 Jhansi UA 460,278 244,169 216,109 13 Saharanpur (M.B.) 455,754 241,508 214,246 14 Firozabad UA 432,866 230,802 202,064 15 Muzaffarnagar UA 331,668 175,283 156,385 16 Mathura UA 323,315 174,335 148,980 17 Shahjahanpur UA 321,885 174,276 147,609 18 Noida (C.T.) 305,058 168,958 136,100 19 Rampur (M.B.) 281,494 146,652 134,842 20 Farrukhabad-cum-Fatehgarh UA 242,997 129,643 113,354 21 Maunath Bhanjan (M.B.) 212,657 109,958 102,699 22 Hapur (M.B.) 211,983 113,175 98,808 23 Etawah (M.B.) 210,453 111,749 98,704 24 Faizabad UA 208,162 114,330 93,832 25 Mirzapur-cum-Vindhyachal (M.B.) 205,053 109,647 95,406 26 Sambhal (M.B.) 182,478 97,011 85,467 27 Bulandshahr (M.B.) 176,425 93,531 82,894 28 Rae Bareli (M.B.) 169,333 88,911 80,422 29 Bahraich (M.B.) 168,323 89,581 78,742 30 Amroha (M.B.) 165,129 86,943 78,186 31 Jaunpur (M.B.) 160,055 84,203 75,852 32 Fatehpur (M.B.) 152,078 80,011 72,067 33 Sitapur (M.B.) 151,908 79,767 72,141 34 Budaun (M.B.) 148,029 78,141 69,888 35 Unnao (M.B.) 144,662 76,254 68,408 36 Modinagar UA 139,929 74,788 65,141 37 Banda UA 139,436 75,174 64,262 38 Orai (M.B.) 139,318 74,703 64,615 39 Hathras UA 126,355 67,436 58,919 40 Pilibhit (M.B.) 124,245 65,853 58,392 41 Lakhimpur (M.B.) 121,486 65,236 56,250 42 Loni (N.P.) 120,945 65,278 55,667 43 Gonda (M.B.) 120,301 66,207 54,094 44 Mughalsarai UA 116,308 61,579 54,729 45 Hardoi (M.B.) 112,486 59,876 52,610 46 Lalitpur (M.B.) 111,892 58,993 52,899 47 Basti (M.B.) 107,601 57,053 50,548 48 Etah (M.B.) 107,110 56,763 50,347 49 Mainpuri U.A. 104,851 55,462 49,389 50 Deoria (M.B.) 104,227 54,681 49,546 51 Chandausi (M.B.) 103,749 55,127 48,622 52 Ballia (M.B.) 101,465 54,496 46,969 53 Sultanpur (M.B.) 100,065 53,189 46,876 54 Gazipur U.A. 103,298 54,371 48,927
Table 1.12 Population Cities (1) -CONTD..Census 2001

41
Sl. States/Inion Territories Persons Males FemalesNo. City1 2 3 4 5
Uttaranchal 1,025,204 551,079 474,125 1 Dehradun U.A. 530,263 283,064 247,199 2 Hardwar U.A. 220,767 119,234 101,533 3 Haldwani-Cum-Kathgodam U.A. 158,896 84,541 74,355 4 Roorkee U.A. 115,278 64,240 51,038
West Bengal 18,728,215 9,936,459 8,791,756 1 Kolkata U.A 13,205,697 7,064,138 6,141,559 2 Asansol U.A. 1,067,369 564,837 502,532 3 Durgapur (M.Corp.) 493,405 263,721 229,684 4 Siliguri (M.Corp.) 472,374 250,645 221,729 5 Barddhaman (M) 285,602 148,562 137,040 6 Kharagpur U.A. 272,865 140,730 132,135 7 Habra U.A. 239,209 121,631 117,578 8 English Bazar U.A. 224,415 115,356 109,059 9 Raiganj U.A. 175,047 92,703 82,344 10 Haldia (M) 170,673 89,893 80,780 11 Baharampur U.A. 170,322 86,969 83,353 12 Medinipur (M) 149,769 76,503 73,266 13 Krishnanagar U.A. 148,709 75,495 73,214 14 Ranaghat U.A. 145,285 73,933 71,352 15 Balurghat U.A. 143,321 72,764 70,557 16 Santipur (M) 138,235 70,089 68,146 17 Bankura (M) 128,781 66,429 62,352 18 Nabadwip U.A. 125,341 63,574 61,767 19 Birnagar U.A. 115,127 59,232 55,895 20 Alipurduar U.A. 114,035 58,503 55,532 21 Puruliya (M) 113,806 59,092 54,714 22 Basirhat (M) 113,159 57,965 55,194 23 Darjiling U.A. 108,830 56,769 52,061 24 Koch Bihar U.A 103,008 52,275 50,733 25 Bangaon (M) 102,163 52,537 49,626 26 Chakdaha U.A 101,320 51,485 49,835 27 Jalpaiguri (M) 100,348 50,629 49,719
Table 1.12 Population Cities (1) -CONTD.Census 2001

42
Sl. States/Inion Territories Persons Males FemalesNo. City1 2 3 4 5
Andaman & Nicobar Islands Nil
Chandigarh 1 TOWN 808,515 450,122 358,393 1 Chandigarh (M.Corp.) 808,515 450,122 358,393
N.C.T. Delhi 1 U.A. 12,877,470 7,069,371 5,808,099 1 Delhi U.A. 12,877,470 7,069,371 5,808,099
Pondicherry 505,959 253,375 252,584 1 Pondicherry U.A. 505,959 253,375 252,584
Lakshadweep Nil
C.M.C. - City Municipal Council
M.Cl. - Municipal Council
M - Municipality
M.C. - Municipal Committee
C.T. - Census Town
E.O. - Estate Office N.A.C. - Notified Area Committee
2. Data regarding rate of growth in population in various cities over the period 1991-2001 is not yet availbable with source agency.
U.A. - Urban Agglomeratons
M.corp. - Municipal Corporations
Source : Office of the Registrar General India, Ministry of Home Affairs
(1) Relates to Class- 1 Towns which include the population of out-growths also. U.A. has been treated as a single Urban unit inspite of having more constituent towns and outgrowth.
Note : 1. Data is based on Final Population Totals Uran Agglomerations and Towns.
Table 1.12 Population Cities (1) -CONCLD.Census 2001
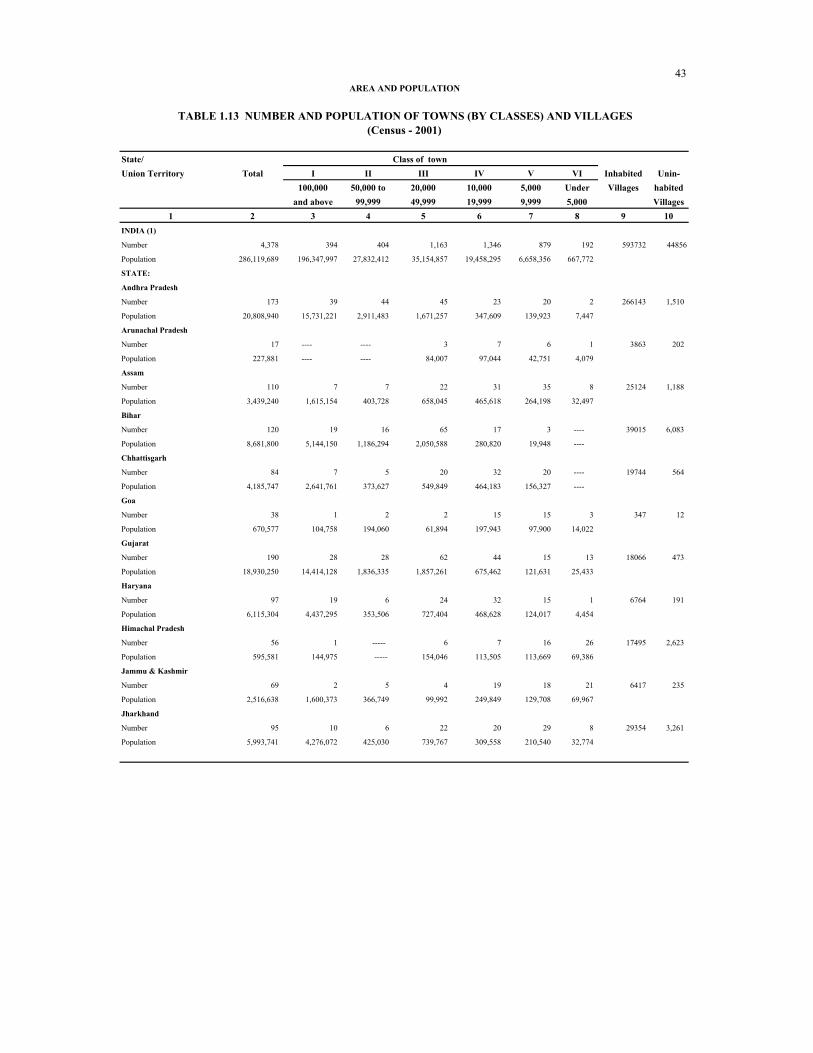
43
State/Union Territory Total I II III IV V VI Inhabited Unin-
100,000 50,000 to 20,000 10,000 5,000 Under Villages habitedand above 99,999 49,999 19,999 9,999 5,000 Villages
1 2 3 4 5 6 7 8 9 10INDIA (1)
Number 4,378 394 404 1,163 1,346 879 192 593732 44856
Population 286,119,689 196,347,997 27,832,412 35,154,857 19,458,295 6,658,356 667,772
STATE:
Andhra Pradesh
Number 173 39 44 45 23 20 2 266143 1,510
Population 20,808,940 15,731,221 2,911,483 1,671,257 347,609 139,923 7,447
Arunachal Pradesh
Number 17 ---- ---- 3 7 6 1 3863 202
Population 227,881 ---- ---- 84,007 97,044 42,751 4,079
Assam
Number 110 7 7 22 31 35 8 25124 1,188
Population 3,439,240 1,615,154 403,728 658,045 465,618 264,198 32,497
Bihar
Number 120 19 16 65 17 3 ---- 39015 6,083
Population 8,681,800 5,144,150 1,186,294 2,050,588 280,820 19,948 ----
Chhattisgarh
Number 84 7 5 20 32 20 ---- 19744 564
Population 4,185,747 2,641,761 373,627 549,849 464,183 156,327 ----
Goa
Number 38 1 2 2 15 15 3 347 12
Population 670,577 104,758 194,060 61,894 197,943 97,900 14,022
Gujarat
Number 190 28 28 62 44 15 13 18066 473
Population 18,930,250 14,414,128 1,836,335 1,857,261 675,462 121,631 25,433
Haryana
Number 97 19 6 24 32 15 1 6764 191
Population 6,115,304 4,437,295 353,506 727,404 468,628 124,017 4,454
Himachal Pradesh
Number 56 1 ----- 6 7 16 26 17495 2,623
Population 595,581 144,975 ----- 154,046 113,505 113,669 69,386
Jammu & Kashmir
Number 69 2 5 4 19 18 21 6417 235
Population 2,516,638 1,600,373 366,749 99,992 249,849 129,708 69,967
Jharkhand
Number 95 10 6 22 20 29 8 29354 3,261
Population 5,993,741 4,276,072 425,030 739,767 309,558 210,540 32,774
AREA AND POPULATION
Class of town
TABLE 1.13 NUMBER AND POPULATION OF TOWNS (BY CLASSES) AND VILLAGES(Census - 2001)
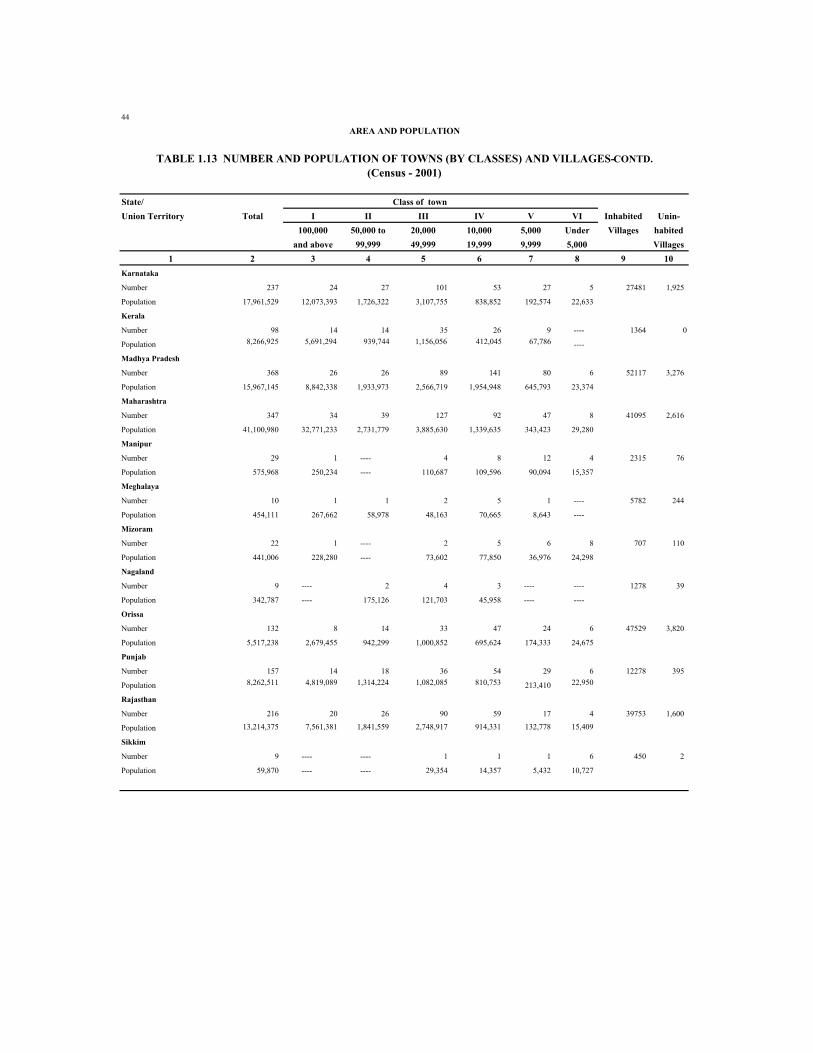
44
State/Union Territory Total I II III IV V VI Inhabited Unin-
100,000 50,000 to 20,000 10,000 5,000 Under Villages habitedand above 99,999 49,999 19,999 9,999 5,000 Villages
1 2 3 4 5 6 7 8 9 10Karnataka
Number 237 24 27 101 53 27 5 27481 1,925
Population 17,961,529 12,073,393 1,726,322 3,107,755 838,852 192,574 22,633
Kerala
Number 98 14 14 35 26 9 ---- 1364 0
Population 8,266,925 5,691,294 939,744 1,156,056 412,045 67,786 ----
Madhya Pradesh
Number 368 26 26 89 141 80 6 52117 3,276
Population 15,967,145 8,842,338 1,933,973 2,566,719 1,954,948 645,793 23,374
Maharashtra
Number 347 34 39 127 92 47 8 41095 2,616
Population 41,100,980 32,771,233 2,731,779 3,885,630 1,339,635 343,423 29,280
Manipur
Number 29 1 ---- 4 8 12 4 2315 76
Population 575,968 250,234 ---- 110,687 109,596 90,094 15,357
Meghalaya
Number 10 1 1 2 5 1 ---- 5782 244
Population 454,111 267,662 58,978 48,163 70,665 8,643 ----
Mizoram
Number 22 1 ---- 2 5 6 8 707 110
Population 441,006 228,280 ---- 73,602 77,850 36,976 24,298
Nagaland
Number 9 ---- 2 4 3 ---- ---- 1278 39
Population 342,787 ---- 175,126 121,703 45,958 ---- ----
Orissa
Number 132 8 14 33 47 24 6 47529 3,820
Population 5,517,238 2,679,455 942,299 1,000,852 695,624 174,333 24,675
Punjab
Number 157 14 18 36 54 29 6 12278 395
Population 8,262,511 4,819,089 1,314,224 1,082,085 810,753 213,410 22,950
Rajasthan
Number 216 20 26 90 59 17 4 39753 1,600
Population 13,214,375 7,561,381 1,841,559 2,748,917 914,331 132,778 15,409
Sikkim
Number 9 ---- ---- 1 1 1 6 450 2
Population 59,870 ---- ---- 29,354 14,357 5,432 10,727
AREA AND POPULATION
TABLE 1.13 NUMBER AND POPULATION OF TOWNS (BY CLASSES) AND VILLAGES-CONTD.(Census - 2001)
Class of town
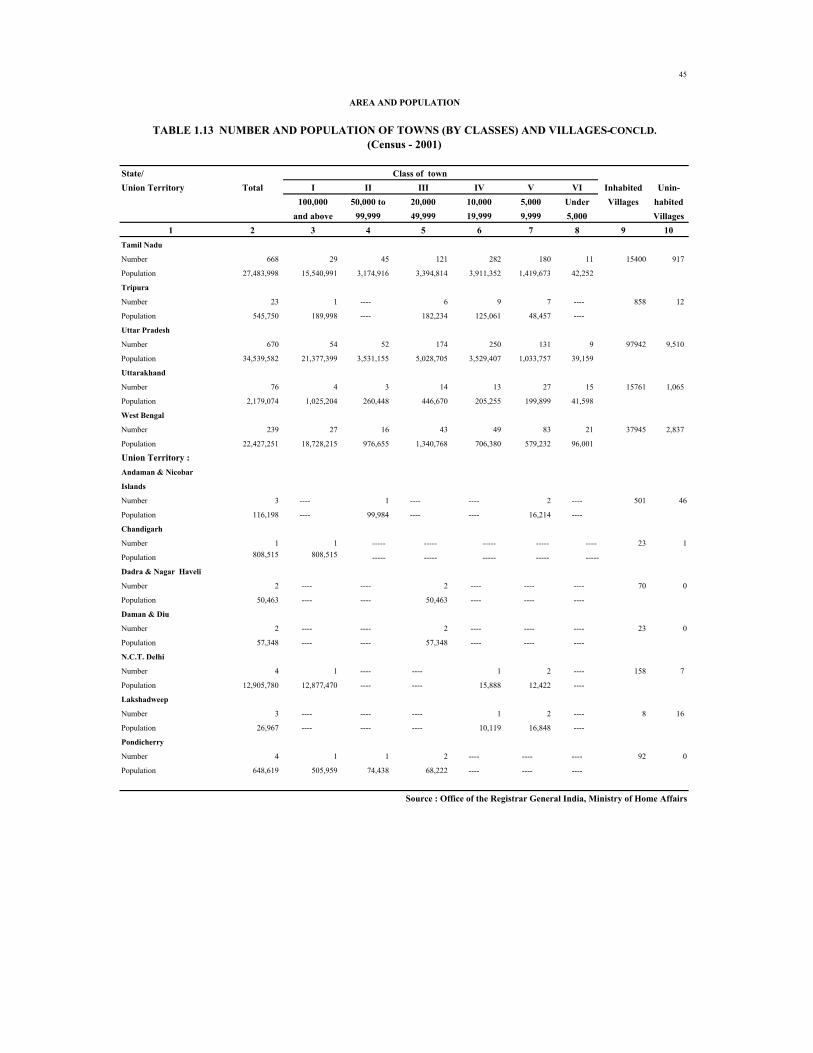
45
State/Union Territory Total I II III IV V VI Inhabited Unin-
100,000 50,000 to 20,000 10,000 5,000 Under Villages habitedand above 99,999 49,999 19,999 9,999 5,000 Villages
1 2 3 4 5 6 7 8 9 10Tamil Nadu
Number 668 29 45 121 282 180 11 15400 917
Population 27,483,998 15,540,991 3,174,916 3,394,814 3,911,352 1,419,673 42,252
Tripura
Number 23 1 ---- 6 9 7 ---- 858 12
Population 545,750 189,998 ---- 182,234 125,061 48,457 ----
Uttar Pradesh
Number 670 54 52 174 250 131 9 97942 9,510
Population 34,539,582 21,377,399 3,531,155 5,028,705 3,529,407 1,033,757 39,159
Uttarakhand
Number 76 4 3 14 13 27 15 15761 1,065
Population 2,179,074 1,025,204 260,448 446,670 205,255 199,899 41,598
West Bengal
Number 239 27 16 43 49 83 21 37945 2,837
Population 22,427,251 18,728,215 976,655 1,340,768 706,380 579,232 96,001
Union Territory :Andaman & Nicobar
Islands
Number 3 ---- 1 ---- ---- 2 ---- 501 46
Population 116,198 ---- 99,984 ---- ---- 16,214 ----
Chandigarh
Number 1 1 ----- ----- ----- ----- ----- 23 1
Population 808,515 808,515 ----- ----- ----- ----- -----
Dadra & Nagar Haveli
Number 2 ---- ---- 2 ---- ---- ---- 70 0
Population 50,463 ---- ---- 50,463 ---- ---- ----
Daman & Diu
Number 2 ---- ---- 2 ---- ---- ---- 23 0
Population 57,348 ---- ---- 57,348 ---- ---- ----
N.C.T. Delhi
Number 4 1 ---- ---- 1 2 ---- 158 7
Population 12,905,780 12,877,470 ---- ---- 15,888 12,422 ----
Lakshadweep
Number 3 ---- ---- ---- 1 2 ---- 8 16
Population 26,967 ---- ---- ---- 10,119 16,848 ----
Pondicherry
Number 4 1 1 2 ---- ---- ---- 92 0
Population 648,619 505,959 74,438 68,222 ---- ---- ----
AREA AND POPULATION
Class of town
Source : Office of the Registrar General India, Ministry of Home Affairs
TABLE 1.13 NUMBER AND POPULATION OF TOWNS (BY CLASSES) AND VILLAGES-CONCLD.(Census - 2001)

46
India/ State/ Union Territory/ District
Total/ Rural/Urban
Number of
Towns
Number of
households
Area in sq. km.
Population per sq.
km1 2 3 4 5 6 7 8 9 10 11
INDIA @ & Total 593732 44856 5161 193579954 1028737436 532223090 496514346 * 3287263.00 325Rural 593732 44856 --- 137747384 742617747 381668992 360948755 $ 3118237.74 247Urban --- --- 5161 55832570 286119689 150554098 135565591 $ 78163.26* 3657
JAMMU & Total 6417 235 75 1568519 10143700 5360926 4782774 222236.00 100KASHMIR @ & Rural 6417 235 --- 1167108 7627062 3977652 3649410 221272.69 76
Urban --- --- 75 401411 2516638 1383274 1133364 963.31 2612
HIMACHAL Total 17495 2623 57 1221589 6077900 3087940 2989960 55673.00 109PRADESH Rural 17495 2623 --- 1079797 5482319 2756073 2726246 55431.29 99
Urban --- --- 57 141792 595581 331867 263714 241.71 2464
PUNJAB Total 12278 395 157 4348580 24358999 12985045 11373954 50362.00 484Rural 12278 395 --- 2796284 16096488 8516596 7579892 48265.38 334Urban --- --- 157 1552296 8262511 4468449 3794062 2096.62 3941
CHANDIGARH Total 23 1 1 206465 900635 506938 393697 114.00 7900Rural 23 1 --- 22580 92120 56816 35304 34.66 2658Urban --- --- 1 183885 808515 450122 358393 79.34 10191
UTTARAKHAND Total 15761 1065 86 1603242 8489349 4325924 4163425 53483.00 159Rural 15761 1065 --- 1185737 6310275 3144590 3165685 52686.23 120Urban --- --- 86 417505 2179074 1181334 997740 796.77 2735
HARYANA Total 6764 191 106 3712319 21144564 11363953 9780611 44212.00 478Rural 6764 191 --- 2541980 15029260 8052988 6976272 42931.63 350Urban --- --- 106 1170339 6115304 3310965 2804339 1280.37 4776
N.C.T. DELHI Total 158 7 62 2733383 13850507 7607234 6243273 1483.00 9340Rural 158 7 --- 179804 944727 522087 422640 558.32 1692Urban --- --- 62 2553579 12905780 7085147 5820633 924.68 13957
RAJASTHAN Total 39753 1600 222 9317675 56507188 29420011 27087177 342239.00 165Rural 39753 1600 --- 7054434 43292813 22426640 20866173 336807.81 129Urban --- --- 222 2263241 13214375 6993371 6221004 5431.19 2433
UTTAR PRADESH Total 97942 9510 704 25757640 166197921 87565369 78632552 240928.00 690Rural 97942 9510 --- 20373081 131658339 69157470 62500869 234369.81 562Urban --- --- 704 5384559 34539582 18407899 16131683 6558.19 5267
BIHAR Total 39015 6083 130 13744130 82998509 43243795 39754714 94163.00 881Rural 39015 6083 --- 12407132 74316709 38594996 35721713 92358.40 805Urban --- --- 130 1336998 8681800 4648799 4033001 1804.60 4811
SIKKIM Total 450 2 9 114223 540851 288484 252367 7096.00 76Rural 450 2 --- 101225 480981 255774 225207 NA NAUrban --- --- 9 12998 59870 32710 27160 NA NA
ARUNACHAL Total 3863 202 17 215574 1097968 579941 518027 83743.00 13PRADESH Rural 3863 202 --- 166468 870087 454680 415407 NA NA
Urban --- --- 17 49106 227881 125261 102620 NA NA
AREA AND POPULATION
Number of Villages _________________
Population ______________________________
TABLE 1.14 NUMBER OF VILLAGES,TOWNS, HOUSEHOLDS, POPULATION AND AREA

47
India/ State/ Union Territory/ District
Total/ Rural/Urban
Number of
Towns
Number of
households
Area in sq. km.
Population per sq.
km1 2 3 4 5 6 7 8 9 10 11
NAGALAND Total 1278 39 9 328057 1990036 1047141 942895 16579.00 120Rural 1278 39 --- 263129 1647249 859716 787533 16431.76 100Urban --- --- 9 64928 342787 187425 155362 147.24 2328
MANIPUR + Total 2315 76 33 375095 2293896 1161952 1131944 22327.00 103Rural 2315 76 --- 273098 1717928 875271 842657 22176.81 77Urban --- --- 33 101997 575968 286681 289287 150.19 3835
MIZORAM Total 707 110 22 176134 888573 459109 429464 21081.00 42Rural 707 110 --- 86951 447567 232726 214841 20494.08 22Urban --- --- 22 89183 441006 226383 214623 586.92 751
TRIPURA Total 858 12 23 664334 3199203 1642225 1556978 10486.00 305Rural 858 12 --- 539713 2653453 1363638 1289815 10345.60 256Urban --- --- 23 124621 545750 278587 267163 140.40 3887
MEGHALAYA Total 5782 244 16 418850 2318822 1176087 1142735 22429.00 103Rural 5782 244 --- 333119 1864711 946999 917712 22199.28 84Urban --- --- 16 85731 454111 229088 225023 229.72 1977
ASSAM Total 25124 1188 125 4914823 26655528 13777037 12878491 78438.00 340Rural 25124 1188 --- 4203976 23216288 11939945 11276343 77476.23 300Urban --- --- 125 710847 3439240 1837092 1602148 961.77 3576
WEST BENGAL Total 37945 2837 375 15872083 80176197 41465985 38710212 88752.00 903Rural 37945 2837 --- 11270822 57748946 29616009 28132937 85427.26 676Urban --- --- 375 4601261 22427251 11849976 10577275 3324.74 6746
JHARKHAND Total 29354 3261 152 4799081 26945829 13885037 13060792 79714.00 338Rural 29354 3261 --- 3736524 20952088 10679596 10272492 77921.57 269Urban --- --- 152 1062557 5993741 3205441 2788300 1792.43 3344
ORISSA Total 47529 3820 138 7738065 36804660 18660570 18144090 155707.00 236Rural 47529 3820 --- 6618547 31287422 15748970 15538452 152912.87 205Urban --- --- 138 1119518 5517238 2911600 2605638 2794.13 1975
CHHATTISGARH Total 19744 564 97 4091551 20833803 10474218 10359585 135191.00 154Rural 19744 564 --- 3273647 16648056 8307443 8340613 133325.25 125Urban --- --- 97 817904 4185747 2166775 2018972 1865.75 2243
MADHYA PRADES Total 52117 3276 394 10912025 60348023 31443652 28904371 308245.00 196Rural 52117 3276 --- 7996300 44380878 23031093 21349785 301283.24 147Urban --- --- 394 2915725 15967145 8412559 7554586 6961.76 2294
GUJARAT Total 18066 473 242 9691362 50671017 26385577 24285440 196024.00 258Rural 18066 473 --- 5941858 31740767 16317771 15422996 190796.50 166Urban --- --- 242 3749504 18930250 10067806 8862444 5227.50 3621
DAMAN & DIU Total 23 0 2 35686 158204 92512 65692 112.00 1413Rural 23 0 --- 23204 100856 63606 37250 88.64 1138Urban --- --- 2 12482 57348 28906 28442 23.36 2455
AREA AND POPULATION
TABLE 1.14 NUMBER OF VILLAGES,TOWNS, HOUSEHOLDS, POPULATION AND AREA-Contd.
Number of Villages _________________
Population ______________________________

48
India/ State/ Union Territory/ District
Total/ Rural/Urban
Number of
Towns
Number of
households
Area in sq. km.
Population per sq.
km1 2 3 4 5 6 7 8 9 10 11
DADRA & Total 70 0 2 45586 220490 121666 98824 491.00 449NAGAR HAVELI Rural 70 0 --- 33938 170027 91832 78195 473.83 359
Urban --- --- 2 11648 50463 29834 20629 17.17 2939
MAHARASHTRA Total 41095 2616 378 19576736 96878627 50400596 46478031 307713.00 315Rural 41095 2616 --- 11173512 55777647 28458677 27318970 300357.20 186Urban --- --- 378 8403224 41100980 21941919 19159061 7355.80 5588
ANDHRA PRADES Total 26613 1510 210 17004305 76210007 38527413 37682594 275045.00 277Rural 26613 1510 --- 12607167 55401067 27937204 27463863 270297.50 205Urban --- --- 210 4397138 20808940 10590209 10218731 4747.50 4383
KARNATAKA Total 27481 1925 270 10401918 52850562 26898918 25951644 191791.00 276Rural 27481 1925 --- 6725882 34889033 17648958 17240075 186590.02 187Urban --- --- 270 3676036 17961529 9249960 8711569 5200.98 3453
GOA Total 347 12 44 294812 1347668 687248 660420 3702.00 364Rural 347 12 --- 145229 677091 340545 336546 3190.33 212Urban --- --- 44 149583 670577 346703 323874 511.67 1311
LAKSHADWEEP Total 8 16 3 9993 60650 31131 29519 32.00 1895Rural 8 16 --- 5664 33683 17191 16492 21.41 1573Urban --- --- 3 4329 26967 13940 13027 10.59 2546
KERALA Total 1364 0 159 6726356 31841374 15468614 16372760 38863.00 819Rural 1364 0 --- 5010259 23574449 11451282 12123167 35611.14 662Urban --- --- 159 1716097 8266925 4017332 4249593 3251.86 2542
TAMIL NADU Total 15400 917 832 14665983 62405679 31400909 31004770 130058.00 480Rural 15400 917 --- 8284383 34921681 17531494 17390187 117532.75 297Urban --- --- 832 6381600 27483998 13869415 13614583 12525.25 2194
PONDICHERRY Total 92 0 6 215538 974345 486961 487384 479.00 2034Rural 92 0 --- 72966 325726 163703 162023 345.59 943Urban --- --- 6 142572 648619 323258 325361 133.41 4862
ANDAMAN & Total 501 46 3 78242 356152 192972 163180 8249.00 43NICOBAR ISLAND Rural 501 46 --- 51866 239954 128961 110993 8222.66 29
Urban --- --- 3 26376 116198 64011 52187 26.34 4411
AREA AND POPULATION
Number of Villages _________________
Population ______________________________
TABLE 1.14 NUMBER OF VILLAGES,TOWNS, HOUSEHOLDS, POPULATION AND AREA-Concld.
Source : Office of the Registrar General India, Ministry of Home Affairs
* The area figures of States and U.T's do not add up to area of India because :(i) The shortfall of 7 square km. area of Madhya Pradesh and 3 square km. area of Chattisgarh is yet to be resolved by the Survey of India (ii) Disputed area of 13 square km. between Pondicherry and Andhra Pradesh is neither included in Pondicherry and Andhra Pradesh.$ Excludes Sikkim and Arunachal Pradesh.@ The population figures exclude population of the area under lawful occupation of Pakistan and China where Census could not be taken.Area figures include the area under lawful occupation of Pakistan and China. The area includes 78,114 sq. km. under illegal occupation of Pakistan, 5,180 sq. km.illegally handed over by Pakistan to China and 37,555 sq.km.

TABLE NUMBER 1.4
DECENNIAL GROWTH OF POPULATION BY CENSUS
(PERCENTAGE)
-10123456789101112131415161718192021222324252627
1901-11 1911-21 1921-31 1931-41 1941-51 1951-61 1961-71 1971-81 1981-91 1991-01

TABLE NUMBER 1.9PERCENTAGE DISTRIBUTION OF POPULATION
BY RELIGIONCENSUS-2001
SIKHS1.87%
JAINS0.41% BUDDHISTS
0.77%
OTHERS0.65%
CHRISTIANS2.34%
MUSLIMS13.44%
HINDU80.51%
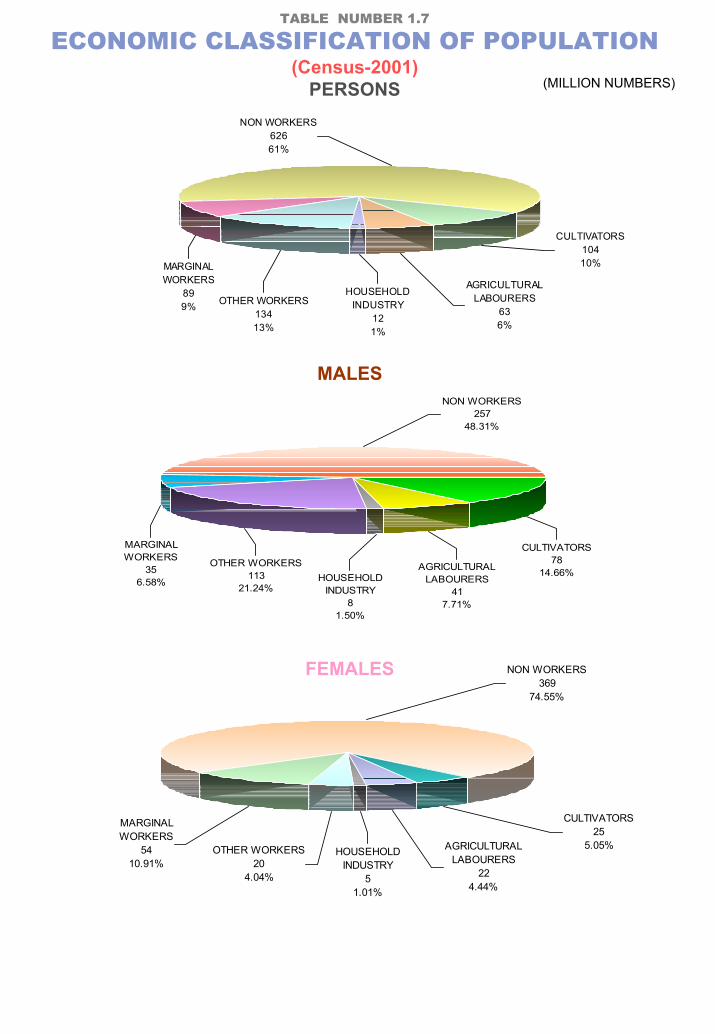
TABLE NUMBER 1.7
ECONOMIC CLASSIFICATION OF POPULATION(Census-2001)PERSONS (MILLION NUMBERS)
HOUSEHOLD INDUSTRY
121%
OTHER WORKERS13413%
NON WORKERS 62661%
MARGINAL WORKERS
899%
AGRICULTURAL LABOURERS
636%
CULTIVATORS10410%
CULTIVATORS78
14.66%AGRICULTURAL LABOURERS
417.71%
HOUSEHOLD INDUSTRY
81.50%
MARGINAL WORKERS
356.58%
NON WORKERS257
48.31%
OTHER WORKERS113
21.24%
MALES
OTHER WORKERS20
4.04%
NON WORKERS369
74.55%
MARGINAL WORKERS
5410.91%
HOUSEHOLD INDUSTRY
51.01%
AGRICULTURAL LABOURERS
224.44%
CULTIVATORS25
5.05%
FEMALES

10
20
30
40
1991 1993 1994 1995 1996 1997 1998 1999 2000 2001 2002 2003 2004 2005 2006
Total Rural Urban
TABLE NUMBER 1.5BIRTH RATE
(PER THOUSAND)
3
6
9
12
1991 1993 1994 1995 1996 1997 1998 1999 2000 2001 2002 2003 2004 2005 2006
Total Rural Urban
TABLE NUMBER 1.5DEATH RATE
(PER THOUSAND)
20
40
60
80
100
1991 1993 1994 1995 1996 1997 1998 1999 2000 2001 2002 2003 2004 2005 2006
Total Rural Urban
(PER THOUSAND)
TABLE NUMBER 1.5
INFANT MORTALITY RATE (IMR)