Embed Size (px)
Citation preview

Are high-frequency traders anticipating the order flow? Cross-venue evidence from the UK market
Occasional Paper 16
Financial Conduct Authoritywww.fca.org.uk
Encouraging debate among academics, practitioners and policymakers in all aspects of financial regulation.

Occasional Paper Are high-frequency traders anticipating the order flow? Cross-venue evidence from the
UK market
April 2016 1
FCA occasional papers in financial regulation
The FCA Occasional Papers
The FCA is committed to encouraging debate on all aspects of financial regulation and to creating rigorous evidence to support its decision-making. To facilitate this, we publish a series of Occasional Papers, extending across economics and other disciplines.
The main factor in accepting papers is that they should make substantial contributions to knowledge and understanding of financial regulation. If you want to contribute to this series or comment on these papers, please contact Peter Andrews or Kevin James at [email protected] and [email protected]
Disclaimer
Occasional Papers contribute to the work of the FCA by providing rigorous research results and stimulating debate. While they may not necessarily represent the position of the FCA, they are one source of evidence that the FCA may use while discharging its functions and to inform its views. The FCA endeavours to ensure that research outputs are correct, through checks including independent referee reports, but the nature of such research and choice of research methods is a matter for the authors using their expert judgement. To the extent that Occasional Papers contain any errors or omissions, they should be attributed to the individual authors, rather than to the FCA.
Authors
The authors work in the Chief Economist’s Department of the Financial Conduct Authority.
Matteo Aquilina and Carla Ysusi
Acknowledgements
We would like to thank Jonathan Brogaard for providing advice and reviewing the paper. We also thank Peter Andrews, Gaber Burnik, Godsway Cudjoe, Brian Eyles, Fabian Garavito, Stefan Hunt, Peter Lukacs, Barry Munson, Peter O’Neill, Edwin Schooling Latter, Makoto Seta, Felix Suntheim, Martin Taylor, Jia Shao, and many other FCA colleagues. We are also grateful to participants of the FCA/LSE conference on financial regulation for their comments.
Any errors and omissions are our own.

Occasional Paper Are high-frequency traders anticipating the order flow? Cross-venue evidence from the
UK market
April 2016 2
Contents
1 Overview 5 Purpose 5 Key findings 5
2 Research context 7 Do HFTs prey on other market participants? 7
3 Method and approach 9 Data 9 Defining HFTs 9 Statistical approach 10 Near-simultaneous orders methodology 11 Methodologies for longer timeframes: Brogaard 2010 13 Methodologies for longer timeframes: Hirschey 2013 13
4 Results 15 HFT and pure non-HFT activity summary statistics 15 Anticipating non-HFTs’ near-simultaneous orders 18 Anticipating non-HFTs’ order flow over longer time periods 22
5 Conclusions 26
Annex 1: Data 27 Annex 2: Graphs and tables 28 Annex 3: Technical annex 31 Annex 4: References 36

Occasional Paper Are high-frequency traders anticipating the order flow? Cross-venue evidence from the
UK market
April 2016 3
Summary
Since they started participating in financial markets, High Frequency Traders (HFTs) have received a mixed reaction from academics and practitioners, with some underlining their role as liquidity providers and others highlighting the problems that they could bring to the market. A specific allegation that has been made is that HFTs prey on other market participants and only intermediate trades that would have taken place without their involvement. There are claims that HFTs can predict when orders are going to arrive at different trading venues and trade in advance of slower traders by exploiting their speed advantage. These claims infer that HFTs can make profits without taking risks due to their latency advantages.
In this paper, we investigate whether there is evidence that this behaviour is taking place on a systematic basis. We use a novel dataset with full order-book data on 120 stocks traded on lit venues in the UK for the year 2013.
We investigate two closely related questions. Firstly, whether HFTs exploit their small (milliseconds) latency advantages to anticipate orders arriving in very quick succession at different trading venues from other market participants. Secondly, whether HFTs can anticipate the order flow over longer timeframes (seconds or tens of seconds). We do not find evidence that the first behaviour is occurring systematically: there is no evidence in our sample that HFTs can “see the true market” and trade in front of other participants at a millisecond frequency. This could be due to the physical characteristics of the UK market. As all the trading venues are within a few miles of each other, in the vicinity of London, it takes a very short time for messages to go from one venue to the other (microseconds). Further, the regulatory set-up makes it more difficult to predict where orders will be routed, compared to the US market.
We do find patterns consistent with HFTs being able to anticipate the order flow over longer time periods (seconds and tens of seconds). This is particularly true for those market participants that adopt “pure” non-HFT strategies (i.e. those participants that do not use low-latency technology). However, we cannot say whether this is due to HFTs reacting more rapidly to new information, or to order-flow anticipation. Furthermore, when looking at specific non-HFTs (something that market participants themselves cannot do as the orders they see are anonymous), we find evidence that a number of them send some of their orders in a somewhat predictable way, by sending them a few milliseconds apart on a regular basis.
It is not simple to assess the implications of anticipatory behaviour for society as a whole: this behaviour may or may not be detrimental depending on very specific characteristics of the order flow. Also, although it is often attributed to HFTs, other market participants, such as investment banks (if they use the appropriate technology and/or manage to sufficiently reduce their latency), may also engage in these behaviours.
The results of this paper are only valid for the specific HFT strategies that we investigate. We do not draw any conclusions on whether strategies different from those analysed in this study are employed by HFTs and other market participants in

Occasional Paper Are high-frequency traders anticipating the order flow? Cross-venue evidence from the
UK market
April 2016 4
the UK market and whether or not they are detrimental for the quality and integrity of UK markets.

Occasional Paper Are high-frequency traders anticipating the order flow? Cross-venue evidence from the
UK market
April 2016 5
1 Overview
Purpose In the last 20 years or so, stock markets around the world have changed from being physical venues, where people met to trade in open outcry pits to electronic venues, where traders interact on their computer screens. Among other things, this change gave rise to the advent of traders that submit a very large number of orders in very short time periods using computer algorithms, commonly named High Frequency Traders (HFTs).
HFTs have received a mixed reaction from academics and practitioners with some people underlining their role as liquidity providers and others highlighting the problems that they could bring to the market. A specific allegation that has been made is that HFTs prey on other market participants and only intermediate trades that would have taken place without their involvement. There are claims that by exploiting their speed advantage HFTs can predict when orders are going to arrive at different trading venues and trade in advance of slower traders, making profits without taking risks. This would imply that, in effect, they would be a tax on trading paid by other market participants.
In this study, we focus on this specific allegation and look for patterns in the data that are consistent with this behaviour in the UK stock market. We do not investigate other potential HFTs strategies that may be problematic.
We use a proprietary dataset that contains information on orders and trades. The trading venues captured represent approximately 85% of on-exchange traded stock volume in the UK.
We divide our analysis into two separate strands. The first looks for evidence of HFTs being able to exploit very small speed advantages (milliseconds or even microseconds 1 ) by predicting how “near-simultaneous” orders will be routed to different venues.2 The second strand assesses whether HFTs can anticipate the order flow over longer timeframes (seconds and tens of seconds).
Key findings
HFTs appear not to anticipate near-simultaneous orders…
Our key result is that we do not find evidence that HFTs are able to systematically anticipate near-simultaneous orders sent by non-HFTs to different trading venues. That is, we do not find evidence that HFTs are systematically observing a marketable order on one venue, predicting that a similar order will appear at another venue a few milliseconds (or microseconds) later, and trading in advance of the order in the
1 A millisecond is a unit of time equivalent to one thousandth of a second. A microsecond is a unit of time equivalent to one millionth of a second.
2 In this paper, we refer to near-simultaneous orders to those marketable orders sent by the same participant, for the same instrument, with the same direction and that arrive to different trading venues within a few milliseconds or even within a millisecond.

Occasional Paper Are high-frequency traders anticipating the order flow? Cross-venue evidence from the
UK market
April 2016 6
latter venue.3 We speculate that this is likely due to the regulatory set-up in the UK, as well as the fact that UK venues are physically close together so the speed advantage may not be as important as in other jurisdictions. In the UK, in contrast to the US where allegations originally emerged, there is no requirement for an order to be routed according to the best available price on every venue (the “order protection rule” in the US), and brokers are free to use routing strategies that cannot easily be predicted. Furthermore, the short distance that separates the UK trading venues (which are all located within a few miles of each other in the vicinity of London), makes being faster than other participants less advantageous than in the US.
…but they could be predicting the flow over longer time periods
When moving from very short periods (milliseconds) to longer durations (seconds or tens of seconds), we find patterns consistent with HFTs anticipating the order flow.
HFTs increase their activity before non-HFT-initiated large trades; they also increase their activity when non-HFT buying and selling pressure increases. HFTs buy shares whose price increases and sell shares whose price declines in the following 30 seconds.
However, we cannot conclude that HFTs are anticipating the order flow. Our results are also consistent with HFTs reacting more quickly to news and other public information. Additional research will be needed to eliminate this possibility.
The welfare implications of order anticipation are unclear
If HFTs could “see the true market” while others could not, and used this advantage to systematically trade in advance of slower participants without taking risks, this would be problematic for the fairness of markets and call into question the rules under which HFTs can secure this advantage. We find no evidence that this is happening in our dataset.
The broader social implications of the activity for which we do find consistent patterns (order anticipation at longer time intervals) are unclear. If HFTs anticipate the order flow, this may impact the price at which non-HFTs can trade, independently of whether such trades are welfare-improving or not. HFTs’ anticipation of the order flow may therefore deter welfare-improving and welfare-reducing transactions and the overall effect of HFTs’ activity would depend on their relative weight. Whether or not transactions are welfare-improving depends on their information content. If the orders are “informed” in the sense that they forecast information that will be revealed soon anyway, then order anticipation is not detrimental as it simply reduces the incentive to carry out redundant research. Alternatively, if the orders are informed because they uniquely contribute new information, then anticipatory activity harms society, as it reduces the incentive to carry out this useful research.
We do not draw any conclusions on whether strategies different from those analysed in this study are employed by HFTs and other market participants in the UK market and whether or not they are detrimental.
3 A marketable order is either an order to execute at the current market price, a buy order with a price at or above the lowest offer in the market, or a sell order with a price at or below the highest bid in the market. In essence, it is an order that crosses the spread.

Occasional Paper Are high-frequency traders anticipating the order flow? Cross-venue evidence from the
UK market
April 2016 7
2 Research context
Do HFTs prey on other market participants? HFTs are characterised by high speed, low latency, high order-to-trade ratios, and the use of financial data to spot profit opportunities that it would not be possible for human traders to exploit.
HFTs have received a mixed reaction from academics and practitioners. For instance, Stiglitz (2014) argues that slowing down markets would be beneficial for society. Others emphasise the positive impact that HFTs have on market outcomes (Jones, 2013; Brogaard, Hendershott & Riordan, 2014).
A specific allegation made by Arnuk and Saluzzi (2009), and popularised in the bestselling book Flash Boys by Michael Lewis, is that HFTs prey on other market participants and only intermediate trades that would take place anyway. These authors claim that by exploiting their speed advantage, HFTs can predict when orders are going to arrive at different trading venues and trade in advance of slower traders; in effect, they view them as a tax on trading paid by other participants.
In this study, we look for patterns in the data that are consistent with the behaviour described in the previous paragraph. We use a proprietary dataset that contains information on order and trades in three trading venues, which represent approximately 85% of UK on-exchange stock trades.
A complex issue
When addressing this problem, there are a number of complex issues that should be kept in mind. First, it is difficult to disentangle predatory activity by HFTs from lack of awareness or concern by other market participants. If other investors favour certainty of execution over price and the costs of this specific HFT activity are sufficiently small, it may be reasonable for investors to trade with HFTs in any case. Harris (2003) presents a number of examples in which investors may well favour certainty of execution over price. If this is what happens in markets, there would be little cause for concern.
Second, it is our view that there would be different implications if it could be proved that HFTs have an unfair advantage over other market participants (e.g. because co-location services are restricted to a small number of firms that are willing to pay a very high cost) and can predict with near certainty how orders are routed, rather than HFTs simply being skilled at predicting how the market will evolve in the next few seconds.
Third, even if HFTs do anticipate the order flow, assessing the overall economic implications would not be a straightforward task. If HFTs anticipate the order flow, this may impact the price at which non-HFTs can trade, but this is independent of whether such trades would have been genuinely welfare-improving or not. A lot will depend on whether HFTs’ anticipation of the order flow deters transactions that would have been welfare-improving or welfare-reducing and their relative weight and

Occasional Paper Are high-frequency traders anticipating the order flow? Cross-venue evidence from the
UK market
April 2016 8
volume. The point can be explained with the following example. Let us assume that HFTs only intermediate between trades that have been initiated by informed traders. Based on her internal research department recommendation, a fund manager wants to increase her holdings of company ABC because its earnings are likely to be higher than the market’s estimates. Because HFTs anticipate the order flow and move the market against the fund manager, she has to transact at higher prices than would otherwise be the case. Predicting whether this has a positive or negative economic effect ex ante is incredibly difficult to do as Hirshleifer (1971) shows. So much depends on context. In this case the fund manager could have lost an advantage (gained through significantly better research or the development of better risk management tools) and HFT is discouraging economically beneficial activity. On the other hand the price revealed by the HFT could well be one that becomes public knowledge shortly thereafter (e.g. through the publication of new results for ABC), the research costs were not really justified by the benefit gained from them and so the activity of the HFT in this case is at least neutral and could even be socially useful in the context of the wider market.
In this paper, we abstract from these complications and focus on examining whether or not the alleged behaviour of HFTs is taking place in the UK market.

Occasional Paper Are high-frequency traders anticipating the order flow? Cross-venue evidence from the
UK market
April 2016 9
3 Method and approach
Data For this study, we use detailed order book data from 2013; the data have been collected by the FCA directly from trading venues for market monitoring and research purposes so that we can enhance our understanding of what is happening in markets. They are considerably more extensive and detailed than the data used in previous research on the behaviour of HFTs in the UK. 4 They include all the information recorded by the matching engine of three UK trading venues at the millisecond level. The trading venues covered are the London Stock Exchange (LSE), BATS, and Chi-X.5 These venues account for approximately 85% of all FTSE on-exchange traded volume in the UK, so we can observe a very high percentage of the overall market.6 The one major UK venue that is not part of our dataset is Turquoise, which accounts for most of the remaining 15% of traded volume. For the analysis, we use the consolidated lit order books from these venues.
Sample composition
The sample is made up of 60 stocks from the FTSE 100 and 60 stocks from the FTSE 250 index. As such, there are stocks with considerably different levels of liquidity. For these stocks, we observe all order submissions, amendments and cancellations, as well as executions. The data include information on the date, time (at the millisecond level), direction, price, quantity and information on the order type. Furthermore, our data have a major advantage compared to most other datasets used for research purposes: we can observe the identity of the member of the trading venues behind the event, i.e. the order book is not anonymised.7 Our data include information on the opening and closing auctions, but we exclude them from our analysis as they are not relevant for our research question. Our data cover the entire 2013 calendar year; however, in some cases (mainly when we analyse orders rather than trades), we restrict our analysis to a subset of these dates for computational reasons. Annex 1 gives further detail of the data.
Defining HFTs In the literature, there are two different approaches used to categorise firms as HFTs (Bouveret, Guillaume, Aparicio Roqueiro, Winkler & Nauhaus, 2014). The first is to rely on judgement and assess whether the business model adopted by specific firms fits a given definition or not. The second is to rely on the data and categorise firms into HFTs and non-HFTs on the basis of indicators such as the number of messages sent in a given time period, the lifetime of orders, the order-to-trade ratio, or others.
4 Previous UK studies mostly include trade data. Bouveret et al (2014) use one month of order book data but only for 16 UK stocks and Alampieski and Lepone (2013) use anonymised order book data for 30 trading days in 2010.
5 BATS and Chi-X are part of the same legal entity, having merged in 2012 but they maintain separate order books. 6 Estimates were calculated using information from Fidessa, fragmentation.fidessa.com/. 7 However, we do not know the underlying client if an order has been executed on an agency basis.
Occasional Paper Are high-frequency traders anticipating the order flow? Cross-venue evidence from the
UK market
April 2016 10
The definition we use
Our view is that, given our data and our research question, the former approach is more appropriate. The concern of practitioners and regulators focused on firms that entered the market in the last 20 years or so and developed innovative business models. The concern was not with the technology per se, but rather with a specific way in which the technology could be used. Ideally, we would like a clean proxy of the pure HFT activity. As our data only identify members of trading venues at the firm level and not at the trading desk level, we get a cleaner proxy of pure HFT activity if we use the business model approach.8
We have therefore updated a list of HFT firms, which was originally developed for a Financial Services Authority (FSA) study, on the basis of internal supervisory knowledge.9 The primary defining criterion is that HFTs are a subset of algorithmic trading participants that use proprietary capital to generate returns using computer algorithms and low-latency infrastructure. The original list was put together by the FSA, along with the three major trading venues for UK stocks based on the platforms’ understanding of the participants. Since then, firms have entered or left the markets and there have been some takeovers and mergers. We have therefore updated this list. In our sample, we observe 26 direct members of the trading venues that are classified as HFTs.
Defining pure non-HFTs
Many investment banks use a similar technology (and in some cases also similar strategies) as HFTs or provide direct market access (DMA) or sponsored access (SA) to HFTs, but are not included in our definition of HFTs. If we compare the behaviour of HFTs with the behaviour of all other participants, including investment banks, we could be misled in our conclusions. Therefore, we constructed a group of pure non-HFT firms.
This group is a subset of all other firms that do not fit our definition of HFTs. It excludes any non-HFT firm that is involved in low-latency proprietary trading, even if it is not their main function, and those providing DMA/SA (mainly investment banks).
Our pure non-HFT classification will give us an incomplete but cleaner proxy of trades done on behalf of institutional investors. If predatory behaviour is taking place, it is most likely to be at the expense of pure non-HFT firms rather than investment banks that may have access to similar technology as HFTs.10
Statistical approach We have adopted a number of different statistical methodologies to look for patterns consistent with HFTs anticipating the order flow. We focus on two different ways (and time horizons) in which HFTs could be anticipating the order flow: Given the fragmentation of liquidity, non-HFTs may send near-simultaneous
orders to different trading venues and HFTs could profit from their cross-
8 If a participant has several accounts on the same venue or is a member of several trading venues, we consider all the activity of these accounts together as the activity of the firm. The accounts are likely to include the activity of many trading desks and we are unable to separate the activity of each desk.
9 The FSA is the predecessor of the FCA. The FSA published a report on HFTs and the execution cost of institutional investors (see Brogaard et al 2013).
10 Given the characteristics of our dataset, we can only study if pure HFTs anticipate the order flow of pure non-HFTs. We are unable to identify the low-latency prop activity of other non-HFTs (e.g. investment banks) and study its impact on pure non-HFTs.

Occasional Paper Are high-frequency traders anticipating the order flow? Cross-venue evidence from the
UK market
April 2016 11
exchange latency advantages. When a non-HFT order executes in one trading venue, HFTs could react to it in another venue before the correspondent near-simultaneous non-HFT order reaches it thereby impacting the price at which non-HFTs trade. Today’s cross-exchange latency means this could be happening even within a millisecond.11
The second case can be understood as the generalisation of the previous one, but one where small speed advantages are considerably less important. Informed traders try to reduce their footprint by splitting up their large orders into a series of smaller orders, but their initial trades could reveal information about their future flow. In this case, orders could be sent to the same or different trading venues and at short or longer time horizons. If other participants anticipate these sequences, the execution costs of informed traders may increase.
We are not aware of previous studies that attempt to answer the question on anticipating near-simultaneous orders, so we develop our own methodology using the orders and trades information available in our data.
For the second case, we implement two methodologies from the academic literature (Brogaard, 2010; Hirschey, 2013), which rely exclusively on information on trades. We describe these methodologies below.
Given the characteristics of the data, we are able to implement the methodologies using a consolidated dataset using information from all the lit order books in our sample.12 We do not consider strategies that involve the dark order books of the trading venues in the sample.
By definition, information on orders in the dark books is not available to other participants. Even if HFTs could be anticipating the order flow by being active in these books, dark trading in the UK as a percentage of the overall trading volumes is low.13 Furthermore, in the dark books, the trades happen at the mid-point so other participants are unable to know whether the order that initiated the trade was a “buy” or a “sell”, and not all the HFTs in our sample are active in dark books. HFTs will need to utilise very specific tactics (e.g. pinging14) to benefit from this behaviour. The use of these tactics by HFTs in the dark books is an issue on its own and is beyond the scope of our study.
Near-simultaneous orders methodology Today’s trading landscape is characterised by liquidity fragmentation. Therefore, to access all available liquidity and execute at the best possible price, non-HFTs may need to send their marketable15 orders to different trading venues in very quick succession. We define near-simultaneous orders as marketable orders sent by the same participant, for the same instrument, with the same direction, and that arrive to different trading venues within a few milliseconds or even within a millisecond.
11 Our data show that most of the marketable orders sent by pure non-HFTs in quick succession (less than a second apart) to multiple venues arrive within a few milliseconds of each other. Thus, we have focused on this timeframe in our study.
12 In this paper we refer to lit order books as those with pre-trade transparency, where prices at which there are intentions to trade (the current bid and offer prices and the depth of trading interest) are publicly available. Dark order books are those where the transactions take place with no pre-trade transparency using a MiFID I pre-trade transparency waiver (see ESMA, 2015). Both lit and dark books are subject to post-trade transparency, i.e. there is a requirement to make public the time, price and volume of each trade after it has been executed.
13 Volumes traded in dark pools represent, on average, less than 10% of the total volume traded in 2013. These estimates were calculated using information from Fidessa, fragmentation.fidessa.com/.
14 Pinging is a practice of entering small marketable orders in order to learn about large orders in dark pools or hidden orders on lit exchanges.
15 See footnote 2.
Occasional Paper Are high-frequency traders anticipating the order flow? Cross-venue evidence from the
UK market
April 2016 12
When a first non-HFT order executes in one trading venue, HFTs may react in the other trading venues before the associated orders arrive. Here, we develop a simple methodology to study whether there is evidence of this happening on a systematic basis.
HFTs’ behaviour if they anticipate near-simultaneous orders
If non-HFTs send near-simultaneous marketable buy (sell) orders and HFTs anticipate them, we would expect HFTs to cancel or amend their sell (buy) orders at the top-of-the-book of the other trading venues or to buy (sell) aggressively.16 This will happen after the first non-HFT execution and ahead of the arrival of the other non-HFTs’ orders, increasing (decreasing) the best ask (best bid).
We therefore need to calculate the probability of HFTs cancelling or amending their orders or trading in the ‘right’ direction between non-HFTs’ near-simultaneous marketable orders. We estimate these probabilities in two different but related ways:
1) We study HFT activity between two non-HFT near-simultaneous orders executed at the same millisecond and with one, two and three milliseconds difference (we label this “Case 1”).
2) We study HFT activity between the first and last orders of a string of non-HFT near-simultaneous orders that occurs within a time window (for windows of one, two, three and four milliseconds). Each string will include at least two near-simultaneous orders (we label this “Case 2”).
To illustrate the difference between these analyses, imagine that a pure non-HFT sends three marketable orders to three different trading venues – TV1, TV2 and TV3 in that order and near simultaneously. An HFT detects this string only after the second order is executed and reacts between the second and third order. In the first case, we study separately the HFT behaviour between the orders sent to TV1 and TV2 and the HFT behaviour between the orders sent to TV2 and TV3. We observe that the HFT anticipates the orders in half of the instances (between TV2 and TV3). In the second case, we study the three marketable orders as a single string of orders; therefore, our methodology would imply that the entire sample is anticipated by an HFT. This is explained in more detail in Annex 3.
Clock synchronisation issues complicate matters further
Ideally, we would identify when the first order executes and then examine whether HFTs react before the subsequent order executes in another trading venue. Given that our consolidated dataset is stamped at the millisecond level, it is not possible to establish with certainty the sequence of the orders across trading venues whether these orders are executed during the same millisecond or even in adjacent milliseconds.17 Within this very short timeframe, the sequence of the orders in our consolidated dataset is reliable within a trading venue but not across venues. This means that when orders arrive to different trading venues with up to one millisecond difference, it is impossible for us to say which order arrived first. We take this issue into account in our estimations and avoid excluding HFT activity that we may be interested in (see Annex 3 for more details).
16 An aggressive trade results from an order executing against an order that is already present on the order book. 17 The clocks of the electronic systems of the different trading venues diverge from the reference time (UTC) during the
day. Even if the trading venues synchronise their clocks almost continuously to correct this drift, the accuracy of the timestamps could differ from the reference time by up to a millisecond in our sample. This implies that a trade that happens at exactly the same time in two different trading venues can be reported with different timestamps.

Occasional Paper Are high-frequency traders anticipating the order flow? Cross-venue evidence from the
UK market
April 2016 13
Developing the appropriate benchmark
HFTs employ a variety of strategies that require trading aggressively or constantly amending their positions. Therefore, there is a chance that we observe the HFT behaviour described above even if they are not anticipating non-HFTs’ orders. In order to answer our research question, we need to construct benchmarks to which our estimates can be compared. We therefore estimate the proportion of times we observe the described HFTs’ behaviour at any point in time and not necessarily when non-HFTs are sending cross-exchange near-simultaneous marketable orders. As such, we calculate the proportion of times HFTs show the described behaviour between any same-direction marketable orders (i.e. not necessarily those of the same non-HFT).
We then assess whether the estimated frequencies are statistically different from the benchmarks. If HFTs are anticipating non-HFTs’ orders, we would expect the former frequency to be statistically and economically higher than the latter.
Methodologies for longer timeframes: Brogaard 2010 Brogaard (2010) suggests that there would be little point in trying to anticipate small orders, as they are less likely to be driven by fundamental information, have limited price impact, and it would be difficult for HFTs to turn a profit. He proposes that if order anticipation is taking place, the observation would be most likely to occur ahead of orders that are large in size. He therefore suggests dividing all trades in subsets based on the size of the trade for every stock in the sample considering all non-HFT initiated trades.18 He then proposes to look at the average fraction of trades that were initiated by an HFT for the 10 trades prior to the non-HFT initiated trade.
The intuition is simple: the larger the trade initiated by a non-HFT, the larger the incentives for HFTs to anticipate it and profit from the price movement that it would generate. If the percentage of HFTs’ initiated trades before non-HFTs’ initiated trades is considerably higher for larger non-HFT initiated trades, then HFTs’ behaviour is consistent with them anticipating the order flow.
Brogaard could not observe the identity of the firm trading as he only had information on whether an HFT firm was involved in a trade or not. We do not have this limitation in our data. In our analysis, we modify Brogaard’s methodology by controlling for the identity of the HFT firm that is trading against the non-HFT initiated trade. In this way, we can remove some of the noise created by the fact that different HFTs may be engaged in different strategies.
Methodologies for longer timeframes: Hirschey 2013
The methodology developed by Hirschey (2013) is similar in spirit to the one described above. It focuses on instances in which HFTs are aggressively buying or selling stocks and compares their behaviour to those of non-HFTs. If HFTs are anticipating the order flow, they should buy before non-HFTs buy, and sell before non-HFTs sell. This methodology is based on the assumption that HFTs aggressive buying (selling) should forecast future non-HFTs aggressive buying (selling) impacting the price.
18 We create 10 size ‘bins’, each one including 10% of the trades of each stock by volume of trades.
Occasional Paper Are high-frequency traders anticipating the order flow? Cross-venue evidence from the
UK market
April 2016 14
Calculating net marketable buying
Hirschey (2013) proposes to use net marketable buying imbalances, defined as the shares in buyer-initiated trades minus the shares in seller-initiated trades. This is a widely used measure of buying and selling pressure (e.g. Chorida, Roll & Subrahmanyan, 2002). To put imbalances on similar scales across different stocks, which can be subject to considerably different levels of activity, Hirschey normalises the measures by the average traded volume of each stock of the previous 20 days.
Every second, all the stocks in the sample are sorted into deciles based on HFTs’ net marketable imbalances for that second. This allows the author to identify the stocks that are being aggressively bought or sold by HFTs. He creates one portfolio with the stocks in the top decile (those that HFTs mostly bought) and another with the stocks in the bottom decile (those that HFTs mostly sold) in every second. It is then possible to compare the HFTs’ average imbalance with that of non-HFTs for the portfolios around the time of the buying and selling pressure. If HFTs are anticipating non-HFTs’ order flow, the increase of the average HFTs’ imbalances should precede that of non-HFTs as HFTs should buy (sell) aggressively before non-HFTs do.
Checking that the price moves in favour of HFTs
If the order flow is being anticipated by HFTs and this is a profitable activity, the price of those stocks that HFTs bought should increase subsequently, and the price of those stocks that HFTs sold should decrease. Therefore, the methodology also studies the future price returns of the stocks that HFTs are most aggressively buying (or selling).19 Price returns are studied up to 30 seconds after the intensive buying (selling) time.
19 We calculate the returns using the mid-point prices for the relevant stocks at every second.

Occasional Paper Are high-frequency traders anticipating the order flow? Cross-venue evidence from the
UK market
April 2016 15
4 Results
HFT and pure non-HFT activity summary statistics
HFT activity
The uniqueness of our data provides us with the opportunity to better understand HFT and pure non-HFT activity in UK stocks. To establish the context, before studying whether HFTs anticipate the order flow of non-HFTs, we discuss some characteristics of trading activity. Not all HFTs are equal; they may follow very different strategies and may exhibit very different behaviours, but there are common features that are useful to characterise before studying specific behaviours.
In our sample – in line with previous studies – HFTs account on average for 27% of the traded volume and 39% of the volume of orders in the lit (as shown in Table 1). Although daily HFT participation varies throughout 2013, there is no clear upward trend (Annex 2). Their order-to-trade ratio increased during the end of the year and is higher than that of non-HFTs (Annex 2).
Pure non-HFT activity
As our aim is to identify whether HFTs are anticipating the order flow of other participants, we try to clean our non-HFT classification of any potential HFT activity. For this reason, as explained in the methodology section, we define a pure non-HFT category. This group excludes any non-HFT firm that is involved in low-latency proprietary trading, even if it is not their main function, and those providing DMA/SA. The excluded firms (referred here as “other” non-HFTs) are mainly large investment banks.
Following these definitions, 14% of the total number of firms in our sample are HFTs and account for approximately one third of the traded volume. Pure non-HFTs represent 74% of the number of firms in our sample but only account for around 7% of the traded volume (Table 1).
While HFTs tend to be active in all or most securities in our sample, pure non-HFTs tend to limit their trading to a smaller subset of stocks. Another important difference is that, while most HFTs are active in all lit venues in our sample, more than 70% of pure non-HFTs only trade directly in one of them. However, those pure non-HFTs that trade in more than one venue account for more than 80% of the traded volume done by this group. Annex 2 shows these results in more detail.
Finally, Table 2 shows that pure non-HFT do not trade much with each other. Overall, they mainly trade with other non-HFTs (two-thirds of their trades), but they also trade with HFTs (one-third of their trades).

Occasional Paper Are high-frequency traders anticipating the order flow? Cross-venue evidence from the
UK market
April 2016 16
Table 1: HFTs and pure non-HFTs participation in the lit
% volume
traded % executed
orders % volume of orders
% number of orders
HFTs 27% 30% 39% 45%
Pure non-HFTs 6.5% 5.1% 0.7% 0.4%
Weighted-average fraction of traded volume, number of executed orders, and volume and number of entered orders for our complete sample.
Table 2: Percentage of trading between types of participants in the lit
% trades HFT vs HFT
% trades HFT vs pure non-HFT
% trades HFT vs other non-HFT
% trades pure non-HFT vs pure non-HFT
% trades pure non-HFT vs other non-HFT
% trades other non-HFT vs other non-HFT
7% 3% 43% 0.2% 7% 40% Percentages are computed for our complete sample; they may not add up to 100% due to rounding.
Periodicity in HFT and pure non-HFT trading
All participants – especially institutional investors (or the brokers trading on their behalf) – try to minimise their market impact and information leakage by using different strategies.20 When trading large orders, these are broken up into smaller ones. These orders are then sent to one or multiple trading venues in such a way to reduce their impact and prevent detection of the remaining flow. Even if these participants try to reduce their footprint, others may be trading on similar information and this concentration or synchronisation of trading may create patterns. Also, the use of algorithmic trading may create clock-time periodicities. Here, we try to identify any such patterns and periodicities in our consolidated dataset that could facilitate the anticipation of the order flow.
First, we analyse whether there are visible trading patterns over the course of a day. For both HFTs and pure non-HFTs, we investigate whether there are seconds during the day in which there is an increase in aggressive trading. Figure 1 plots the medians of the number of aggressive trades per second as a fraction of the total number of daily aggressive trades.21
Both HFTs and pure non HFTs increase their aggressive trading at the beginning and end of the day, and particularly on and after the opening of the US market. Interestingly, there are several spikes during the day at the hour or half hours; this could be related to news releases, but it could also be a result of the way certain algorithms are designed.22
20 Norges Bank (2013) explains the lifecycle of a trade from the view of institutional investors. 21 We use medians to avoid the effects of extreme values; when using averages, a similar pattern can be observed
although more noisy. 22 Heston, Korajczyk and Sadka (2010) already documented the presence of intraday periodicity in trading volumes and
order imbalances in the US in the period from January 2001 to December 2005.

Occasional Paper Are high-frequency traders anticipating the order flow? Cross-venue evidence from the
UK market
April 2016 17
Figure 1: Patterns of aggressive trading in the lit within a day.Median frequencies per second.
Figure 1 shows the median of the sample distribution of the number of aggressive trades (as a fraction of the total number of daily aggressive trades) per second for HFTs and pure non-HFTs. Calculations are done using all 2013 data.
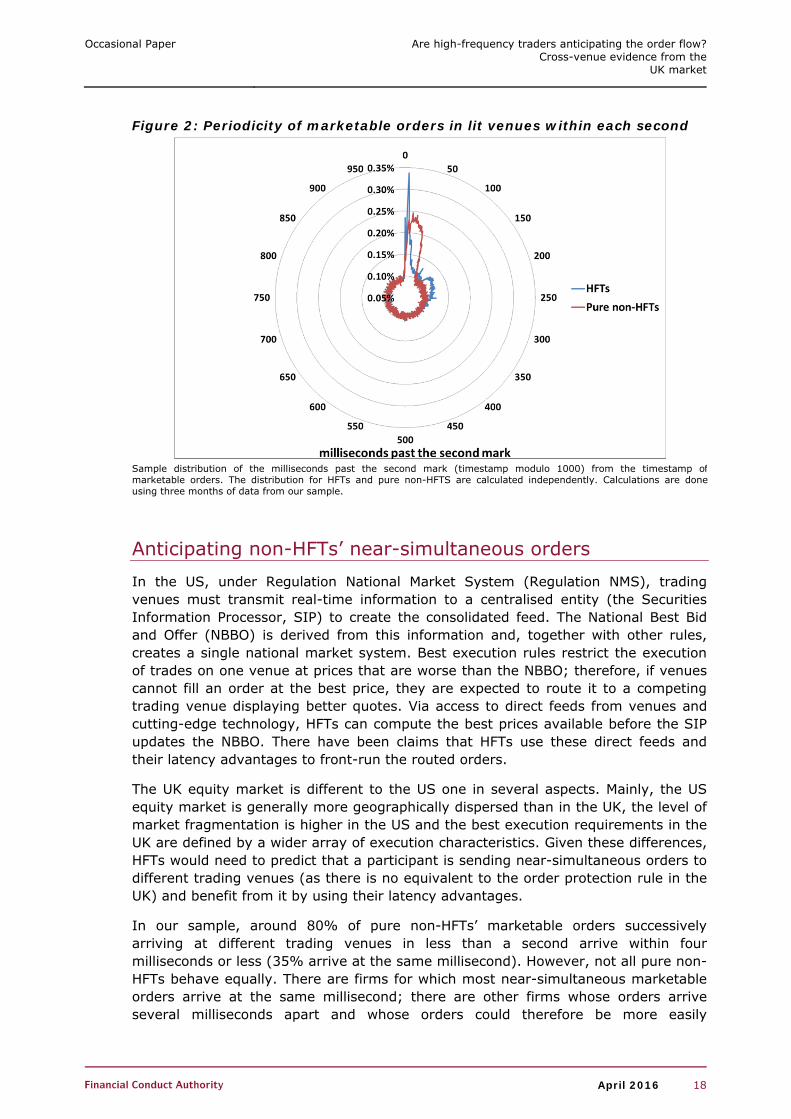
Given the importance of relative speed in response to information, the trading environment can also be characterised by the periodicity at the millisecond (or even microsecond) level. As such, in addition to the daily trading patterns documented above, intra-second periodicities also characterise market activity, as shown in Hasbrouck and Saar (2013). Therefore, we investigate the differences between HFTs’ and pure non-HFTs’ patterns of aggressive trading within each second.
Figure 2 can be interpreted as a chronometer showing the probability of observing a marketable order for each kind of participant at every millisecond during a second. If market participants were sending their marketable orders randomly within a second, we would observe a constant circle at 0.10%. This is not the case. Consistent with Hasbrouck and Saar (2013) and Muravyev and Picard (2014), we observe an increased activity of both HFTs and pure non-HFTs immediately past the second mark.23 Interestingly, the HFTs’ activity spike precedes that of the pure non-HFTs. This could be explained by the different speeds at which these two types of participants react to information or liquidity made available at the second mark. The pattern could also be consistent with HFTs anticipating the order flow of pure non-HFTs, but we should be cautious at this stage. As we calculate the distributions independently for each type of participant, the increased activity of HFTs may not happen consistently during the same second as the increased activity of pure non-HFTs.
23 To ensure the pattern is not a result of only a handful of extreme events (e.g. unexpected news releases), we exclude extreme values by using different percentiles – and obtain similar results.
Occasional Paper Are high-frequency traders anticipating the order flow? Cross-venue evidence from the
UK market
April 2016 18
Figure 2: Periodicity of marketable orders in lit venues within each second
Sample distribution of the milliseconds past the second mark (timestamp modulo 1000) from the timestamp of marketable orders. The distribution for HFTs and pure non-HFTS are calculated independently. Calculations are done using three months of data from our sample.
Anticipating non-HFTs’ near-simultaneous orders In the US, under Regulation National Market System (Regulation NMS), trading venues must transmit real-time information to a centralised entity (the Securities Information Processor, SIP) to create the consolidated feed. The National Best Bid and Offer (NBBO) is derived from this information and, together with other rules, creates a single national market system. Best execution rules restrict the execution of trades on one venue at prices that are worse than the NBBO; therefore, if venues cannot fill an order at the best price, they are expected to route it to a competing trading venue displaying better quotes. Via access to direct feeds from venues and cutting-edge technology, HFTs can compute the best prices available before the SIP updates the NBBO. There have been claims that HFTs use these direct feeds and their latency advantages to front-run the routed orders.
The UK equity market is different to the US one in several aspects. Mainly, the US equity market is generally more geographically dispersed than in the UK, the level of market fragmentation is higher in the US and the best execution requirements in the UK are defined by a wider array of execution characteristics. Given these differences, HFTs would need to predict that a participant is sending near-simultaneous orders to different trading venues (as there is no equivalent to the order protection rule in the UK) and benefit from it by using their latency advantages.
In our sample, around 80% of pure non-HFTs’ marketable orders successively arriving at different trading venues in less than a second arrive within four milliseconds or less (35% arrive at the same millisecond). However, not all pure non-HFTs behave equally. There are firms for which most near-simultaneous marketable orders arrive at the same millisecond; there are other firms whose orders arrive several milliseconds apart and whose orders could therefore be more easily

Occasional Paper Are high-frequency traders anticipating the order flow? Cross-venue evidence from the
UK market
April 2016 19
anticipated; and there are firms that do not send near-simultaneous orders at all or do not do it recurrently.24
Are HFTs anticipating near-simultaneous orders?
We use the methodology described in the previous section (and in more detail in Annex 3) to identify whether HFTs are anticipating near-simultaneous orders. We first look at pairs of pure non-HFTs’ near-simultaneous orders separately (Case 1) and then at strings of pure non-HFTs’ near-simultaneous orders (Case 2).
Case 1
Figure 3 shows that the proportion of instances where HFTs cancel or amend their orders at the top of the book or trade aggressively between pure non-HFTs’ near-simultaneous orders is quite low, independent of the time span between these orders. On average, this happens in less than 2% of the instances where orders sent by the same pure non-HFT arrive at the same millisecond. We do not have information at the microsecond level, but pure non-HFTs may be sending these orders so that they arrive simultaneously at the different trading venues (or with a small enough difference in microseconds) such that HFTs cannot anticipate them. Even when increasing the time span between the two pure non-HFTs’ orders, we observe, on average, such HFT behaviour in less than 6.5% of the instances when the orders arrive one millisecond apart, and in less than 4% of the instances when the orders arrive two or three milliseconds apart.
Although we find more evidence of the expected HFTs’ behaviour between orders arriving one millisecond apart than when there is more time between them, this is mainly due to our methodology. Ideally, we would only look at HFTs’ behaviour after the first order is executed and before the second orders executes. However, as explained in the methodology section (and in more detail in Annex 3), for these orders we cannot know with certainty which order executed first (due to potential clock synchronisation issues). Therefore, we analyse HFT activity in both trading venues and before both marketable orders are executed. This overestimates the frequencies for these time windows (left part of Figure 3). When looking at orders that arrive with two or three milliseconds difference, the sequence is reliable, so we only look at the HFT activity before the second order and in the trading venue where this second order is executed (right part of Figure 3).
Figure 3 also shows the figures for the benchmark as described in the methodology section. The proportions are not statistically significantly different (at the 5% level), as shown by the 95% confidence interval in the figure and a t-test on the difference of these means in Table A2.1 in the Annex.
Therefore, our results are not consistent with HFTs systematically behaving differently when pure non-HFTs send near-simultaneous orders compared with other times of the day.
24 Therefore, the anticipation of near-simultaneous orders by only observing an execution would be difficult unless HFTs have a way of ‘seeing the true market’. Alternatively, the non-HFTs could have been trading for a longer time period, potentially causing information leakage. This case will be captured in our analysis of longer timeframes.

Occasional Paper Are high-frequency traders anticipating the order flow? Cross-venue evidence from the
UK market
April 2016 20
Figure 3: HFTs activity in-between pairs of near-simultaneous pure non-HFTs’ marketable orders sent to different trading venues
Calculations are done using four weeks of data.
Case 2
Our previous analysis will underestimate the instances where HFTs anticipate a string of near-simultaneous orders if HFTs require more than one trade to detect future orders. Therefore, we study the behaviour of HFTs between strings of pure non-HFT near-simultaneous marketable orders executed inside a given time window and compare it to our benchmark. The results are presented in Figure 4.
Even if the frequencies are marginally higher than in Figure 3, they are still quite low in absolute terms (lower than 7% for all time windows). Furthermore, they are not statistically different (at a 5% level) from our benchmark. Figure 4 shows the 95% confidence intervals and Table A2.1 in the Annex shows the results of the t-test on the difference of these means. As such, independently of how we analyse the pure non-HFTs’ near-simultaneous order (i.e. one by one or as part of a string), we do not find evidence that HFTs are systematically anticipating them within these very short timeframes.
An explanation of our results
Even if there have been claims that HFTs can anticipate other participants’ near-simultaneous orders due to their latency advantages and the complexity of US equity markets, we think this is less likely to happen in the UK given the different market structures. In the UK, there is no consolidated tape and the best execution obligation is defined not only by price, but by a wider array of execution characteristics (there is no order protection rule). Therefore, after an execution, HFTs cannot know with certainty whether the participant will route further liquidity to other venues immediately; the order flow at the millisecond level is less predictable in the UK than in the US.

Occasional Paper Are high-frequency traders anticipating the order flow? Cross-venue evidence from the
UK market
April 2016 21
In addition, given that the UK equity market is less fragmented than the US equity market, and that the physical distances between the different UK trading venues are shorter than in US, it may be less difficult for non-HFTs to adapt in the UK.
Figure 4: HFTs activity in-between strings of near-simultaneous pure non-HFTs’ marketable orders sent to different trading venues
Calculations are done using four weeks of data.
A recent report from the Australian Securities and Investment Commission (ASIC, 2015) also notes that Australian market participants appear to be “better informed and equipped to operate in an electronic and high-speed environment” and that some institutional investors have “become more sophisticated, increasingly managing their own order flow and execution decisions so they can limit ‘information leakage’ and interaction with ‘predatory’ traders”.
The characteristics of the UK market structure and the adaptive behaviour and strategies of pure non-HFTs may explain why we do not find evidence of HFTs systematically anticipating the pure non-HFTs’ near-simultaneous orders.25
However, we cannot exclude that there could be some participants that given cost-benefit considerations have not adapted to the current dynamics. They could potentially be trading with HFTs in instances that, for an external observer, appear detrimental but, in practice, are the results of these participants having decided not to adapt to the new market structure. Given our results, if that is the case, these would be a few specific events and would not be representative of the whole market.
25 We should mention that our dataset does not include information from all UK trading venues. We could not only be missing potential anticipatory trading in those venues, but we could also be missing instances where HFTs see the initial activity in those venues and anticipate the order flow in one of the venues in our sample. However, it is unlikely that our main results would change as the trading venues in our sample represent approximately 85% of the on-exchange volume traded in stocks in the UK.

Occasional Paper Are high-frequency traders anticipating the order flow? Cross-venue evidence from the
UK market
April 2016 22
Anticipating non-HFTs’ order flow over longer time periods We now study a more general case where informed traders could try to reduce their footprint by splitting up their large orders into a series of smaller ones. Orders could be sent to the same or different trading venues and at short or long time horizons. If the initial trades reveal information about future flow, HFTs could anticipate the flow impacting the price at which non-HFTs could trade. We implement the methodologies put forward by Brogaard (2010) and Hirschey (2013) to assess whether this is a widespread strategy from HFTs.
Brogaard’s methodology
Using the consolidated order book, Figure 5 graphs the fraction of trades initiated by the HFT firm, which is the counterparty of a large pure non-HFT’s trade. This fraction is shown for different pure non-HFTs’ trade sizes (10 size bins) and for 10 prior executions (the 10 trades immediately before). The x-axis shows the different non-HFT’s initiated trade size bins (from small to large) and the z-axis shows the prior trade episodes (from the most recent to the most dated).
The figure shows that HFTs trade more when the non-HFT initiated trade is large than when it is small. It appears that before smaller and medium-sized trades HFTs were active, approximately 4% of the time in the previous ten trades. This percentage increases to approximately 8% for the largest trades.
Figure 5: HFTs’ initiated trades before pure non-HFTs’ initiated trades
Calculations are done using all 2013 data.
Hirschey’s methodology
Using Hirschey’s methodology, we focus on the stocks that HFTs aggressively sell or buy most at each second (as measured by the net marketable buying). We also look at how HFTs and pure non-HFTs trade these stocks before and after each of these seconds (Figure 6) and at the future returns of these same stocks (Figure 7).

Occasional Paper Are high-frequency traders anticipating the order flow? Cross-venue evidence from the
UK market
April 2016 23
In Figure 6, positive net marketable buying indicates buying pressures and a negative value indicates selling pressure. The figure plots the buying (selling) pressure 10 seconds before and 30 seconds after the second when HFTs bought (sold) the identified stocks (the sorting point or time zero). We can see from the graph that there is some pressure building up before the sorting point. At time zero, the buying and selling pressures show a large spike for both HFTs and pure non-HFTs, although it is much higher for HFTs (note that the scales for HFT and non-HFT are very different).
In the following 30 seconds, HFTs’ buying (selling) pressure remains practically constant: the lines representing their net marketable buying remain flat. At the same time, pure non-HFTs keep buying (or selling) aggressively. This pattern is consistent with HFTs detecting future strong buying or selling pressure from pure non-HFTs and trading aggressively in advance.
If HFTs are successfully anticipating non-HFTs’ order flows, the future returns of the stocks that are bought (sold) most intensively by HFTs should be positive (negative). Figure 7 confirms this: the stocks that HFTs buy aggressively have positive returns, while those that they sell aggressively have negative returns. Additionally, the returns keep increasing (decreasing) after time zero, consistent with the buying (selling) pressure showed by pure non-HFT in Figure 6.
Looking carefully at Figure 6, HFTs’ most aggressive trading appears to precede relatively small increases of pure non-HFTs’ imbalances. A potential explanation is that HFTs are trading ahead of those non-HFTs excluded in our definition of pure non-HFTs (e.g. investment banks). To confirm this, we implement the same methodology on the complete sample of non-HFTs (Figure 8), i.e. including all firms that are not HFTs.
Figure 6: HFTs (left axis) vs pure non-HFTs (right axis) cumulative net marketable buying
Calculations are done using all 2013 data from all lit venues. Note that HFTs and non-HFTs net marketable buying have different scales.

Occasional Paper Are high-frequency traders anticipating the order flow? Cross-venue evidence from the
UK market
April 2016 24
Figure 7: Returns of stocks bought and sold by HFTs
Calculations are done using all 2013 data from all lit venues.
Figure 8: HFTs (left axis) vs non-HFTs (right axis) net marketable buying
Figure 9: HFTs (left axis) vs pure non-HFTs (right axis) net marketable buying – restricted sample
Calculations are done using all 2013 data from all lit venues. Scales for HFTs and non-HFTs are different.
The sample is restricted to those securities which pure non-HFTs trade and at times they are active. Calculations are done using all 2013 data from all lit venues. Scales for HFTs and non-HFTs are different.
Figure 8 appears to confirm that HFTs are also trading aggressively ahead of other non-HFTs’ trading pressure. The figure also shows that non-HFTs are buying (selling) at time zero and that this buying is relatively more important for other non-HFTs than for pure non-HFTs (compared to Figure 6). This is probably because we cannot separate the low-latency prop activity (and DMA/SA trading) from the agency trading of the other non-HFTs (e.g. investment banks), so we cannot discard that these other non-HFTs also trade ahead of pure non-HFTs. As Fishe, Haynes and Onur (2015) and Yang and Zhu (2015) note, order anticipation strategies are not restricted to HFTs.
Occasional Paper Are high-frequency traders anticipating the order flow? Cross-venue evidence from the
UK market
April 2016 25
HFTs may be trading aggressively in stocks where investment banks are active but pure non-HFTs are not. In Figure 9, we focus on the relationship between HFTs and pure non-HFTs by restricting the sample to those stocks/times where pure non-HFTs are active.
Figure 9 shows that HFTs tend to react relatively more to pure non-HFTs’ pressure than to that of other non-HFTs, potentially because pure non-HFTs’ order flow is more likely to be anticipated by HFTs than that of the other non-HFTs.
Comparing our results to Hirschey’s
Hirschey (2013) also finds patterns consistent with HFTs anticipating non-HFTs buying and selling pressure, but the relative reaction of HFTs seems to be higher in Hirschey’s study than in our data. It is possible that HFTs in the US can anticipate the order flow more easily than in the UK. The differences in the market structure and the type of participants in these markets might explain this result. Hirschey (2013) uses data from 2009 and only covers one trading venue (NASDAQ). This might also explain part of the difference, as non-HFTs could have changed their trading strategies between 2009 and 2013 (avoiding the anticipation of their order flow) and, as the author acknowledges, net buying imbalances only reflect the transactions occurring in NASDAQ.
Discussing alternative explanations
From both Brogaard’s (2010) and Hirschey’s (2013) methodologies, we find patterns consistent with HFTs anticipating the order flow. However, these patterns may arise for other reasons.
For example, HFTs and pure non-HFTs may be trading in response to the same signals. At times, when information is available to different participants (e.g. news), they may all react to it simultaneously. The observed pattern may be explained by HFTs simply reacting faster to information, given their speed advantage.
Even if all our patterns could be explained by HFTs anticipating the order flow and our results are consistent with recent studies (Hirschey (2013) for US equity and Kwan and Philip (2015) with Australian equity), further work would be advisable to confirm that non-HFTs’ flow is causing the observed HFTs’ behaviour and not some other exogenous factor.

Occasional Paper Are high-frequency traders anticipating the order flow? Cross-venue evidence from the
UK market
April 2016 26
5 Conclusions
HFTs have received a mixed reaction from academics and practitioners, with some people underlining their role as liquidity providers and others highlighting the problems that they could bring to the market. There have been claims that, by exploiting their speed advantage, HFTs can predict when orders are going to arrive at different trading venues and trade in advance of slower traders. Using a unique dataset, we investigated this specific allegation by looking for patterns compatible with HFTs anticipating the order flow of other participants.
HFTs appear not to anticipate near-simultaneous orders…
We do not find evidence that HFTs systematically anticipate near-simultaneous marketable orders sent to different trading venues by pure non-HFTs. HFTs are not systematically observing an order on one venue, predicting that a similar order will be arriving at another venue a few milliseconds (or microseconds) later, and trading in advance of the order in the latter venue.
We speculate that this is likely to be due to the regulatory set-up in the UK, as well as to the fact that UK venues are physically close together, and hence the speed advantage is not as important as in other jurisdictions. In the UK, in contrast to the US where allegations originally emerged, there is no requirement for an order to be routed according to the best available price on every venue (the order protection rule in the US), and brokers are free to use routing strategies that cannot easily be predicted. Furthermore, the short distance that separates the UK trading venues (which are all located within a few miles of each other in the vicinity of London) makes being faster than other participants less advantageous.
…but they could be predicting the flow over longer time periods
When analysing longer time periods (measured in seconds or tens of seconds), we do find patterns consistent with HFTs anticipating the order flow of pure non-HFTs.
However, we stress the fact that there could be alternative explanations for the patterns we find. Namely, HFTs may be reacting more quickly to news and other public information. Additional research will be needed to eliminate the possibility that the driver of such patterns is a faster reaction to public information.We do not draw any conclusions on whether strategies different from those analysed in this study are employed by HFTs and other market participants in the UK market and whether or not they are detrimental.

Occasional Paper Are high-frequency traders anticipating the order flow? Cross-venue evidence from the
UK market
April 2016 27
Annex 1: Data
Description of the dataset Our dataset consists of detailed order book data from LSE, BATS and Chi-X and covers the entire 2013 calendar year. These venues account for approximately 85% of all FTSE on-exchange traded volume in the UK. The sample is made up of 60 stocks from the FTSE 100 and 60 stocks from the FTSE 250 index. We observe all order submissions, amendments and cancellations, as well as trades for these instruments. The data include information on the instrument, date, time (at the millisecond level), side (buy or sell), price, total quantity, disclosed quantity, undisclosed quantity and consideration. Our data also include some further information on the order: type (e.g. limit, market, pegged, iceberg), time validity (e.g. IOC, Day), and if it derives from a sweep order (we cannot see if an order is a sweep order unless the sweep actually takes place). There is also information on the opening and closing auctions, but we exclude them from our analysis, as they are not relevant to our research question. Given that the timestamps are available at the millisecond level, we are unable to know the exact sequence of messages in the consolidated dataset within the millisecond.
Importantly, our data is not anonymised; we can observe the member of the trading venue who submits the order.26 This allows us to classify the participants as HFTs or non-HFTs. However, we do not know in which capacity the order is entered – as a principal or as an agency (on behalf of a client). If entered on behalf of a client, we do not know who the client is. As such, our classifications are based on supervisory knowledge of the business model of firms.
26 Each message includes the IDs of the member of the trading venue that submits the order. If a participant has several accounts on the same venue, or is a member of several trading venues, we consider all the activity of these accounts together as the activity of the firm.

Occasional Paper Are high-frequency traders anticipating the order flow? Cross-venue evidence from the
UK market
April 2016 28
Annex 2: Graphs and tables
HFT and non-HFTs activity
Figure A2.1 shows the daily HFT participation (% volume traded by HFTs) for our 60 stocks from the FTSE 100 and for our 60 stocks from the FTSE 250. Although daily HFT participation varies throughout 2013, there is no clear upward trend. Figure A2.1 shows that the more liquid stocks (FTSE 100) have higher levels of HFT participation compared to the less liquid ones (FTSE 250).
Figure A2.1: HFTs participation in the lit
Calculations are done using our complete sample.
Figure A2.2 shows the daily weighted averages of the order-to-trade ratios for HFTs and non-HFTs. Only the submissions of new orders were used for the calculations. HFTs’ order-to-trade ratios are considerably higher than that of non-HFTs, and they gradually increased during 2013.

Occasional Paper Are high-frequency traders anticipating the order flow? Cross-venue evidence from the
UK market
April 2016 29
Figure A2.2: Order-to-trade ratios
Calculations are done using our complete sample.
Figure A2.3 shows the percentage of pure non-HFT firms that trade in a given number of stocks. Most pure non-HFTs only trade in a limited amount of stocks in our sample; around 55% of them trade in less than 40 of them. Only 15% of these firms trade in more than 100 of the stocks in our sample. Figure A2.4 shows the percentage of pure non-HFT that trade directly in a given number of the trading venues in our sample. More than 70% of pure non-HFTs only trade directly in one venue. However, those pure non-HFTs that trade in more than one venue account for more than 80% of the traded volume done by this group.
Figure A2.3: % of pure non-HFT firms that trade in a given number of stocks
Figure A2.4: % of pure non-HFTs firms that trade in a given number of venues
Calculations are done using our complete sample.
Table A2.1 shows our estimated mean frequencies, the estimated benchmarks and the p-values of the t-tests on the differences in means between these. We test the difference between the mean proportions of instances when HFTs cancel or amend their top-of-the-book orders or trade in the “right” direction between pure non-HFTs

Occasional Paper Are high-frequency traders anticipating the order flow? Cross-venue evidence from the
UK market
April 2016 30
near-simultaneous marketable orders, affecting the best available quote with the mean proportion of instances, when HFTs show the same behaviour between any same-direction marketable orders (see Annex 3). The null hypothesis is that the means are equal. In all cases, we fail to reject the null hypothesis (of equal means) at a 5% significance level.
Table A2.1: Estimated frequencies and p-values of t-tests
Case 1: pairs of near-simultaneous marketable orders
Case 2: strings of near-simultaneous marketable orders
Estimated
mean frequency
Benchmark p-value
Estimated mean
frequency Benchmark p-
value
Same millisecond
1.6% 1.5% 0.33 Within the same
millisecond
2.5% 2.4% 0.89
Difference of one
millisecond
6.3% 6.0% 0.23 Within two millisecond timestamps
6.4% 6.7% 0.12
Difference of two
milliseconds
4.0% 4.8% 0.06 Within three millisecond timestamps
6.7% 7.9% 0.16
Difference of three
milliseconds
3.9% 4.9% 0.06 Within four millisecond timestamps
5.1% 7.0% 0.09
Calculations are done using four weeks of data from all lit venues.

Occasional Paper Are high-frequency traders anticipating the order flow? Cross-venue evidence from the
UK market
April 2016 31
Annex 3: Technical annex
In this annex, we will give the definitions of the different statistics used in this paper and explain in more detail the methodologies we implemented.
Definitions Measures of HFTs’ participation:
% volume traded by HFTs
is the weighted average of the day-stock HFTs’ trade activity ( ), measured by their degree of daily volume participation for each stock:
where is the daily volume traded by HFTs in stock j on day t and is twice the total daily volume traded (once for the buyer and once for the seller) in that same stock j on day t.
% executed orders entered by HFTs
is the weighted average of the day-stock HFTs’ trade activity ( ) measured by their daily number of trades for each stock:
where is the daily number of trades done by HFTs in stock j on day t and is twice the daily total number of trades (once for the buyer and once for the seller) in that same stock j on day t.
% volume of orders entered by HFTs
is the weighted average of the day-stock HFTs’ order activity ( ) measured by their daily volume of order submissions for each stock:
where is the daily volume of the orders entered by HFTs in stock j on day t and is the total daily volume of orders submitted in that same stock j on day t.

Occasional Paper Are high-frequency traders anticipating the order flow? Cross-venue evidence from the
UK market
April 2016 32
% number of orders entered by HFTs
is the weighted average of the day-stock HFTs’ order activity ( ) measured by their daily number of order submissions for each stock:
where is the daily volume of the orders entered by HFTs in stock j on day t and is the total daily volume of orders submitted in that same stock j on day t.
Equivalent definitions were used for non-HFTs’ measures of participation.
Methodologies Here, we only describe in detail the methodology that we use to study whether HFTs are anticipating pure non-HFTs’ near-simultaneous orders. A detailed description of Brogaard’s methodology is given in Brogaard (2010) and of Hirschey’s methodology in Hirschey (2013).
Near-simultaneous orders methodology
In this paper, we describe near-simultaneous orders as marketable orders sent by the same participant, for the same instrument and with the same direction (buy or sell), and that reach different trading venues within a few milliseconds or even within a millisecond. This implies that the time difference in milliseconds between the execution of these orders for participant j and instrument i is:
∆ ′ ′
where is the time when a marketable order from firm j for instrument i with a given direction d executes in venue v and is the time of execution of the preceding marketable order from the same firm j for the same instrument i with the same direction d, but in a different venue v’.Here, we study two cases:
Case 1: pairs of near-simultaneous orders sent by pure non-HFTs executing at the same millisecond (∆ 0), and with one, two and three milliseconds differences (∆ 1, ∆ 2, ∆ 3),
Case 2: strings of near-simultaneous orders sent by pure non-HFTs executing at the same millisecond ( ∑∆ 0 ), and within two, three and four millisecond timestamps (∑∆ 1, ∑∆ 2, ∑∆ 3).27
If HFTs anticipate these pure non-HFT near-simultaneous orders, we would expect HFTs to react in a specific way. If pure non-HFTs send near-simultaneous buy (sell) orders and HFTs anticipate them, we would expect HFTs to cancel their sell (buy)
27 We identify strings of near-simultaneous orders as groups of consecutive marketable orders sent sequentially to different trading venues by the same participant within a number of milliseconds (for the same instrument and with the same direction).

Occasional Paper Are high-frequency traders anticipating the order flow? Cross-venue evidence from the
UK market
April 2016 33
orders at the top of the book, amend their sell (buy) orders at the top of the book, or buy (sell) aggressively in front of the non-HFTs – such that they increase (decrease) the best ask (best bid) available. This should happen after the first order executes, but before the following order executes in another trading venue (Case 1) – or after the first order executes, but before the last order of the string executes in another trading venue (Case 2).
For Case 1, we will estimate the conditional probability of HFTs behaving in the described way between two pure non-HFTs near-simultaneous orders arriving at the different trading venues ∆ milliseconds apart, i.e.
|
|
∆ .
These probabilities are estimated separately for near-simultaneous orders that arrive to different trading venues at the same millisecond, with one, two and three milliseconds differences ∆ 0, ∆ 1, ∆ 2, ∆ 3 .
This means that we would ideally look at the time intervals depicted in the diagrams below:
However, given that our data are at the millisecond level and that there might be clock synchronisation issues, we will have to look at HFTs’ activity from the beginning of the millisecond until the order arrives. Additionally, when looking at orders that arrive at the same millisecond, or with one millisecond difference, at different trading venues, we are unable to say which order arrives first. To deal with this, we look at HFTs’ behaviour before both executed orders and not only before the second one.

Occasional Paper Are high-frequency traders anticipating the order flow? Cross-venue evidence from the
UK market
April 2016 34
This will overestimate the conditional probabilities at these timeframes, but we would miss some HFT behaviour otherwise.28 When looking at orders that arrive with two or more milliseconds difference, we will only look at the HFT activity before the second order, as the sequence in the consolidated order book is reliable. This is depicted in the diagrams below:
For Case 2, we will estimate the conditional probability of HFTs behaving in the described way between any of the near-simultaneous order in a string sent by a pure non-HFT to different trading venues within ∑∆ milliseconds, i.e.
|
|
′ ∑ ∆ .
These probabilities are estimated separately for strings of near-simultaneous orders arriving at the same millisecond and within two, three and four millisecond-timestamps (∑∆ 0, ∑∆ 1, ∑∆ 2, ∑ ∆ 3).
As described before, given that our data is at the millisecond level and that there might be clock synchronisation issues, the sequence of the orders in the consolidated order book may be unreliable if they execute with one or less millisecond difference. Therefore, we will look at how HFTs act before each order in the string, as depicted in the diagrams below:
28 This problem will also be present in our benchmarks, as we define them below, making them comparable and enabling us to carry out the statistical tests.

Occasional Paper Are high-frequency traders anticipating the order flow? Cross-venue evidence from the
UK market
April 2016 35
HFTs employ a variety of strategies that require trading aggressively or amending their positions constantly; therefore, there is a non-negligible probability that we observe the described HFT behaviour, even if they are not anticipating non-HFTs’ orders. We need to construct a benchmark to which our estimated probabilities can be compared. We therefore estimate the following benchmarks for each case.
For Case 1: the proportion of times we observe the described HFT behaviour between any two same-direction marketable orders executed ∆ milliseconds apart in different trading venues. These marketable orders do not need to be sent by the same participant, but we only consider marketable orders for the instruments and in the trading venues where pure non-HFT trade.29
For Case 2: the proportion of times we observe the described HFT behaviour between same-direction marketable orders executed within ∑∆ milliseconds in different trading venues. As before, these marketable orders do not need to be sent by the same participant, but we only consider marketable orders for the instruments and in the trading venues where pure non-HFT trade.
Finally, for both cases, we assess whether the average frequencies are statistically different when pure non-HFTs send near-simultaneous orders and when not (our benchmarks). For that, we construct 95% confidence intervals and conduct a t-test for the difference between our average frequencies and the correspondent estimated benchmark (where the null hypothesis is equal means).
29 This is to avoid biasing the results in case HFTs are more or less active in the instruments and trading venues where pure non-HFTs do not trade.

Occasional Paper Are high-frequency traders anticipating the order flow? Cross-venue evidence from the
UK market
April 2016 36
Annex 4: References
Alampieski, K., & Lepone, A. (2013). High frequency trading in U.K. equity markets: Evidence surrounding the US market open. Working paper, University of Sydney.
Arnuk, S. L., & Saluzzi, J. (2009). Latency arbitrage: the real power behind predatory high frequency trading. Themis Trading LLC White paper.
ASIC (2015). Review of high-frequency trading and dark liquidity. Report 452.
Bouveret, A., Guillaumie, C., Aparicio Roqueiro, C., Winkler, C., & Nauhaus, S. (2014). High-frequency trading activity in EU equity markets. ESMA Economic Report, 1.
Brogaard, J. (2010). High frequency trading and its impact on market quality. Working paper, Northwestern University.
Brogaard, J., Hendershott, T., Hunt, S., Latza, T., Pedace, L., & Ysusi, C. (2013). High-frequency trading and the execution costs of institutional investors. FSA Occasional Paper Series, 43.
Brogaard, J., Hendershott, T., & Riordan, R. (2014). High frequency trading and price discovery. Review of Financial Studies, 27(8), 2267–2306.
Chorida, T., Roll, R., & Subrahmanyam, A. (2002). Order imbalance, liquidity, and market returns. Journal of Financial Economics, 65, 111–130.
ESMA (2015). Waivers from Pre-trade Transparency. ESMA/2011/241g.
Fishe, R., Haynes, R., & Onur, E. (2015). Anticipatory traders and trading speed. Working paper.
Harris, L. (2003). Trading and exchanges. Market microstructure for practitioners. Oxford: Oxford University Press.
Hasbrouck, J., & Saar, G. (2013). Low-latency trading. Journal of Financial Markets, 16(4), 646–679.
Heston, S., Korajczyk, R., & Sadka, R. (2010). Intraday patterns in the cross- section of stock returns. Journal of Finance, 65(4), 1369–1407.
Hirschey, N. (2013). Do high-frequency traders anticipate buying and selling pressure? IFA Working Paper.
Hirshleifer, J. (1971). The private and social value of information and the reward to inventive activity. The American Economic Review, 61(4), 561–574.
Jones, C. (2013). What do we know about high-frequency trading? Working paper, Columbia University.
Occasional Paper Are high-frequency traders anticipating the order flow? Cross-venue evidence from the
UK market
April 2016 37
Kwan, A., & Philip, R. (2015). High frequency trading and execution cost. Working paper. Sydney: University of Sydney.
Lewis, M. (2014). Flash Boys. New York: Norton.
Muravyev, D., & Picard, J. (2014). Does trade clustering reduce trading costs? Evidence from periodicity in algorithmic trading. Working paper.
Norges Bank (2013). High frequency trading – an asset manager’s perspective. NBIM Discussion Note #1 – 2013.
Stiglitz, J. (2014). Tapping the brakes: Are less active markets safer and better for the economy?. Paper for presentation at the 2014 Financial Markets Conference at the Federal Reserve Bank of Atlanta.
Yang, L., & Zhu, H. (2015). Back-running: seeking and hiding fundamental information in order flows. Working paper.

Occasional Paper Are high-frequency traders anticipating the order flow? Cross-venue evidence from the
UK market
April 2016 38
© Financial Conduct Authority 2016 25 The North Colonnade Canary Wharf London E14 5HS Telephone: +44 (0)20 7066 1000 Website: www.fca.org.uk All rights reserved