Embed Size (px)
Citation preview
Journal of Banking & Finance 37 (2013) 875–894
Contents lists available at SciVerse ScienceDirect
Journal of Banking & Finance
journal homepage: www.elsevier .com/locate / jbf
Are banks too big to fail or too big to save? Internationalevidence from equity prices and CDS spreads
Asli Demirgüç-Kunt a, Harry Huizinga b,⇑a World Bank, Washington, DC, USAb Tilburg University, Tilburg, Netherlands
a r t i c l e i n f o a b s t r a c t
Article history:Received 12 April 2012Accepted 25 October 2012Available online 7 November 2012
JEL classification:G21G28
Keywords:BankingFinancial crisisCredit default swapToo big to failToo big to save
0378-4266/$ - see front matter � 2012 Elsevier B.V. Ahttp://dx.doi.org/10.1016/j.jbankfin.2012.10.010
⇑ Corresponding author. Tel.: +31 13 4662623; fax:E-mail addresses: [email protected] (
uvt.nl (H. Huizinga).1 The liabilities of Glitner Bank, Kaupthing Bank and
times Icelandic GDP in 2007.
Deteriorating public finances around the world raise doubts about countries’ abilities to bail out their larg-est banks. For an international sample of banks, this paper investigates the impact of bank size and gov-ernment deficits on bank stock prices and CDS spreads. We find that a bank’s market-to-book value isnegatively related to the size of its liabilities-to-GDP ratio, especially in countries running large public def-icits. CDS spreads appear to decrease with stronger public finances. These results suggest that systemicallyimportant banks can increase their value by downsizing or splitting up, especially if they are located incountries with weak public finances. We document that banks’ average liabilities-to-GDP ratio reacheda peak in 2007 before a significant drop in 2008, which could reflect these private incentives to downsize.
� 2012 Elsevier B.V. All rights reserved.
1. Introduction
In the years leading up to the 2008 financial crisis, banks aroundthe world expanded their balance sheets to increase profitability inan environment of cheap funding. Access to international fundingmade it possible for individual banks and overall banking systemsto reach enormous size relative to their countries’ GDP. The primeexample is Iceland where the liabilities of the overall banking sys-tem reached around 9 times GDP at the end of 2007, before a spec-tacular collapse of the banking system in 2008.1 By the end of 2008,the liabilities of publicly-listed banks in Switzerland and the UnitedKingdom had reached 6.3 and 5.5 times GDP, respectively. Liabilitiesof banks in Belgium, Denmark, France, Ireland, and the Netherlandssimilarly exceeded two times GDP. At the end of 2008, we identified30 publicly-listed banks worldwide with liabilities exceeding half oftheir country’s GDP. Twelve of these had total liabilities exceeding 1trillion US dollars.
ll rights reserved.
+31 13 4663042.A. Demirgüç-Kunt), huizinga@
Landsbanki together were 9.0
Huge banks may no longer experience scale economies, theyare no doubt difficult to manage effectively, and huge size mayyield few additional risk diversification benefits.2 While theremay be legitimate reasons for becoming large, banks have grownthis large in part because bank managers see their stature andpay increase with bank size.3 Alternatively, bank growth may havebeen motivated by a desire to reach too-big-to-fail status, to ben-efit from the lower funding cost this implies. Under normal busi-ness cycle conditions, perhaps banks could have increased theirimplicit claim on the financial safety net by ever increasing theirsize. The financial and economic crisis that started in 2008, how-ever, has been unexpectedly deep with a severe deterioration ofthe public. This raises doubts about countries’ ability and determi-nation to save their largest banks. At the very least, financiallystrapped governments may be forced to be more cost conscious
2 Today’s huge banks have assets well over $100 billion, far exceeding thetechnologically optimal size of around $25 billion found by Berger and Mester (1997)on the basis of US data for the 1990s.
3 In recent years, the nature of banks’ activities has changed materially. Banks, forinstance, have been more heavily originating and then securitizing assets such asmortgages and other loans. Bank size is potentially beneficial in this type of activity inways that are not captured well by traditional studies of scale economies in banking.
876 A. Demirgüç-Kunt, H. Huizinga / Journal of Banking & Finance 37 (2013) 875–894
in the way they resolve any future large-bank failures, implyinglarge losses to bank creditors.4
This paper investigates the impact of a country’s public financeson expected returns to bank shareholders as discounted in bankstock prices. We proxy for public finances by the fiscal balance rel-ative to GDP, and make a distinction between systemically impor-tant and smaller banks. In a parallel fashion, we also consider theimpact of government finances on expected losses on banks’ liabil-ities, as reflected in the 5-year credit default swap (CDS) spreads.For bank valuation we use data over the 1991–2008 period forbanks in 34 countries, and for CDS spreads data over the 2001–2008 period covering banks in 20 countries.
Our empirical results indicate that bank valuation is affected neg-atively by bank size. Specifically, we find that a bank’s market-to-book value is negatively related to its absolute size, measured asthe log of assets, as well as to its systemic size, measured as thebank’s liabilities-to-GDP ratio. These results suggest that manybanks have grown too large for their own sake, potentially becausethe largest banks have become too big to save. At the same time,these results imply that many banks currently may be able to in-crease their valuation by downsizing or splitting up.
We further find that bank valuation is positively related to thecountry’s fiscal balance, while the bank CDS spread is negativelyrelated to the fiscal variable in our benchmark specification.5 Theserelationships are consistent with the notion that large banks are toobig to save. An alternative explanation, however, is that a fiscal def-icit, reflecting prior bailouts, dilutes the value of government debt,thereby reducing bank stock valuation and increasing bank CDSspreads (see Acharya et al., 2011). The positive relationship betweenbank valuation and the fiscal balance is robust to controlling for abank’s holdings of government debt, but the relationship betweenbank CDS spreads and the fiscal balance becomes insignificant forthe much reduced sample.
In instrumental variables specifications, we control for possiblereverse causation, or common determinants of banking sector pric-ing and the fiscal balance such as the general business cycle. Asinstruments for a country’s fiscal position, we take a country’s(old age) dependency ratio and its openness to international trade.These structural economic variables proxy for spending pressuresas well as taxing opportunities, as reflected in a country’s fiscal bal-ance. Given that they are slow moving variables, we expect them toaffect bank valuation and CDS spreads only through their effect onthe fiscal variable. The negative relationship between CDS spreadsand the fiscal balance is robust to using instrumental variables inour benchmark specifications.
The too-big-to-save hypothesis entails that large banks shouldface reduced bail-out prospects especially in countries experienc-ing fiscal strains. When we include an interaction term of a bank’sliabilities-to-GDP ratio with the fiscal balance in our market-to-book specification, we obtain a positive and significant coefficient,consistent with the too-big-to-save hypothesis. The estimation im-plies that a one-standard-deviation improvement of the fiscal bal-ance by 0.034 increases the market-to-book ratio of a systemicallyimportant bank with liabilities equal to GDP by 0.247 relative to anegligibly small bank. This relative improvement in the market-to-book value of the systemically large bank amounts to about 31% of
4 At a time of severe financial crisis, countries’ ability to guarantee bank liabilitiesmay be at least as important as their formally stated guarantees. In the recent crisis,many countries provided explicit guarantees to many non-deposit liabilities, and theyhave extended deposit insurance. Explicit deposit insurance of some kind already wasalmost universal prior to the current crisis (see Demirgüç-Kunt et al., 2008).
5 In 2010, Ireland received large sums of money from other EU countries and fromthe IMF in the face of severe fiscal strains in part to prevent large losses by Irish bankliability holders. In this study, we only consider national fiscal positions, although theIrish example suggests that countries in some instances can rely on outside assistanceto prevent or postpone large losses for bank liability holders.
the standard deviation of the market-to-book variable in the over-all sample equal to 0.799. Thus, this differential impact is econom-ically significant.
In robustness checks, we replace the bank liabilities-to-GDP ra-tio as an index of systemic size by a dummy variable that equalsone if the bank’s liabilities-to-GDP ratio exceeds a certain thresh-old value and is zero otherwise. The bank market-to-book ratio isfound to rise with the fiscal balance especially for banks with lia-bilities that exceed GDP.
In further tests, we consider the primary fiscal balance (i.e., thefiscal balance excluding government interest payments) relative toGDP and government spending relative to GDP as alternative indi-ces of a country’s fiscal capacity. CDS spreads are related negativelyto the primary fiscal balance, while market-to-book ratios and CDSspreads are related negatively and positively to the governmentspending-to-GDP ratios, respectively, consistent with a too-big-to-save effect.
This paper is related to several others that have considered theimpact of bank size on bank stock returns and bank liabilities. In1984, the US Comptroller of the Currency in testimony before Con-gress argued that a group of 11 large banks were ’too big to fail’(TBTF) and that for those banks total deposit insurance would beprovided. Using an event study methodology for a sample 63 USbanks, O’Hara and Shaw (1990) find that there are positive wealtheffects accruing to these TBTF banks, while there are negativewealth effects accruing to the smaller banks.
The positive wealth effect of TBTF suggests that a bank mergerthat creates a bank that is TBTF can create wealth for bank share-holders. Considering US bank mergers over the 1991–1998 period,Kane (2000) finds that stockholders of large-bank acquirers havegained value when a deposit institution target is large and evenmore value when a deposit institution target was previously head-quartered in the same state. Benston et al. (1995) similarly findthat bank mergers and acquisitions are in part motivated byenhancing the deposit insurance put option.
Moreover, the benefits of gaining TBTF status following bankmergers are not limited to stockholders. Penas and Unal (2004)consider the returns to bond holders around US bank mergers inthe 1991–1997 period. These authors find that adjusted returnson merging banks’ bonds are positive across pre-merger andannouncement months. These positive returns are attributed togaining TBTF status, in addition to diversification gains and, to alesser extent, synergy gains.
All of these papers have aimed to identify an impact of TBTF byconsidering the differential pricing of bank shares and liabilitiesfor large and small banks. Alternatively, an impact of TBTF on bankliability pricing can be ascertained by comparing the pricing of bankliabilities over different periods, during which TBTF is supposed tohold to different extents. In this vein, Flannery and Sorescu (1996)consider the determination of spreads on bank subordinated deben-tures over different subperiods during the years 1983–1991.6 Thesespreads should reflect bank-specific risk indicators more during timesof mitigated application of TBTF policies. Flannery and Sorescu (1996)specifically find that spreads reflect bank risk indicators relativelymore during the last 3 years of the 1983–1991 period, following policychanges that increased the default risk on subordinated debentures.
Similarly, Sironi (2003) considers the sensitivity of spreads ofEuropean banks’ subordinated notes and debentures during the1991–2001 period and finds that these spreads are relativelyinsensitive to bank risk in the second part of the 1990s, consistentwith a disappearing perception of TBTF type guarantees on the part
6 Flannery and Sorescu (1996) is part of a literature that considers whether yieldson bank bonds and also stock prices adequately reflect bank risk, as reflected inaccounting data, supervisory data, or subsequent credit downgrades (see Gropp et al.(2006) for an overview).
A. Demirgüç-Kunt, H. Huizinga / Journal of Banking & Finance 37 (2013) 875–894 877
of investors. Sironi (2003) attributes the apparent diminution ofTBTF in Europe during the 1990s to the joint effect of the loss ofmonetary policy by national central banks and the public budgetconstraints imposed by the European Monetary Union.
The TBTF literature essentially investigates the authorities’ needor desire to provide more support for relatively large banks on theassumption that governments are able to do so. Brown and Dinç(2011) is the first paper to provide evidence that a country’s abilityto support its financial sector, as reflected in its public deficit, af-fects its treatment of distressed banks. These authors consider gov-ernment takeover or closure decisions of banks in 21 emergingmarket economies during the 1990s. As expected, a bank is morelikely to be taken over or closed by the government, if its own cap-ital ratio is low. However, is it less likely to be taken over, if theaverage capital ratio of other banks in the same country is low aswell. This is taken to be evidence of ‘too many to fail,’ as the statemay be unable to close many weak banks simultaneously. Interest-ingly, the ‘too many to fail’ effect is relatively weak in countrieswith high public budget balances. While Brown and Dinç (2011)find that countries with weak public finances are slow to closeweak banks, it does not follow that banks benefit from being incountries with weak public finances, since such counties may inthe end be forced to adopt cheap resolution methods, implyinglarge losses to bank creditors. Consistent with this, we find evi-dence that bank CDS spreads rise with the average leverage ratioof other banks in a country.
Differentiating between systemically important and otherbanks, we consider the impact of the public finances on bank val-uation and CDS spreads, reflecting the net effect of potentially dif-ferent timing and resolution method decisions. Our results indicatea significant effect of a country’s public finances on the valuation ofsystemically important banks, for the first time documenting howthe inability to afford large bailouts may limit net subsidies to thebanking sector. This apparent ‘too large to save’ effect is consistent
Table 1Systemically large banks in 2008.
Bank name Country
UBS AG SwitzerlandING Groep NV NetherlandsCredit Suisse Group SwitzerlandDanske Bank A/S DenmarkDexia BelgiumHSBC Holdings Plc United KingBarclays Plc United KingRoyal Bank of Scotland Plc (The) United KingBNP Paribas FranceKBC Group-KBC Groep NV/KBC Groupe SA BelgiumBank of Ireland IrelandDBS Group Holdings Ltd. SingaporeBanco Santander SA SpainAllied Irish Banks plc IrelandDeutsche Bank AG GermanyCrédit Agricole S.A. FranceSkandinaviska Enskilda Banken AB SwedenDnB Nor ASA NorwayErste Group Bank AG AustriaSvenska Handelsbanken SwedenUnited Overseas Bank Limited UOB SingaporeOversea-Chinese Banking Corporation Limited OCBC SingaporeBOC Hong Kong (Holdings) Ltd. Hong KongUniCredit SpA ItalyStandard Bank Group Limited South AfricaSociété Générale FranceNational Australia Bank AustraliaSwedbank AB SwedenMillennium bcp-Banco Comercial Português, SA PortugalAnglo Irish Bank Corporation Limited Ireland
This table lists banks with a liabilities-to-GDP ratio exceeding 0.5. Liabilities is the liabilitdollars. Absolute liabilities generally are published in national currencies and are conve
with our finding that bank valuation is negatively related to itsabsolute and systemic size, and also with the observed downsizingof banks that occurred in 2008.
The remainder of this paper is organized as follows. Section 2discusses the data. Section 3 outlines the empirical strategy andpresents the results. Section 4 concludes.
2. The data
This section describes data on the size of bank liabilities relativeto national economies as well as other variables used in this study.
2.1. The size of bank liabilities
In this study, we consider an international sample of banks overthe 1991–2008 period. Accounting data on bank liabilities andother variables are taken from Bankscope. Our sample of banks ex-cludes banks that are categorized as multi-lateral governmentalbanks or specialized government credit institutions. Also, we re-strict ourselves to banks that are publicly-listed to ensure dataquality and to enhance comparability across countries. The largestbanks in most countries tend to be publicly-traded.
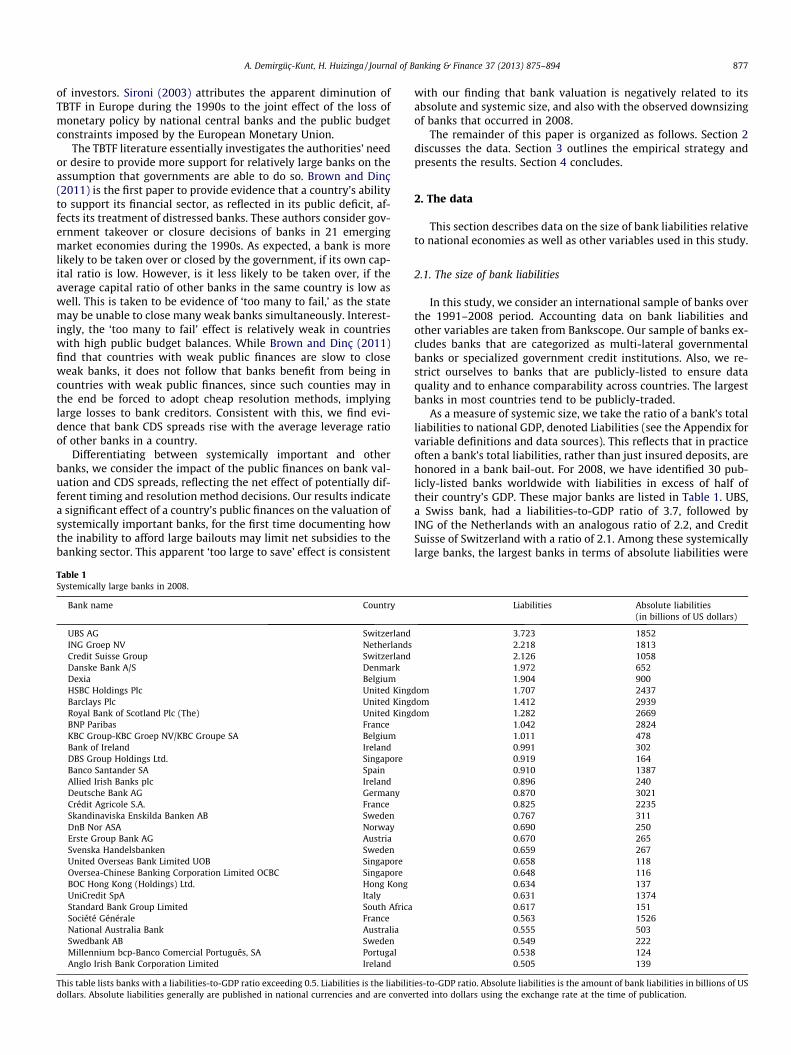
As a measure of systemic size, we take the ratio of a bank’s totalliabilities to national GDP, denoted Liabilities (see the Appendix forvariable definitions and data sources). This reflects that in practiceoften a bank’s total liabilities, rather than just insured deposits, arehonored in a bank bail-out. For 2008, we have identified 30 pub-licly-listed banks worldwide with liabilities in excess of half oftheir country’s GDP. These major banks are listed in Table 1. UBS,a Swiss bank, had a liabilities-to-GDP ratio of 3.7, followed byING of the Netherlands with an analogous ratio of 2.2, and CreditSuisse of Switzerland with a ratio of 2.1. Among these systemicallylarge banks, the largest banks in terms of absolute liabilities were
Liabilities Absolute liabilities(in billions of US dollars)
3.723 18522.218 18132.126 10581.972 6521.904 900
dom 1.707 2437dom 1.412 2939dom 1.282 2669
1.042 28241.011 4780.991 3020.919 1640.910 13870.896 2400.870 30210.825 22350.767 3110.690 2500.670 2650.659 2670.658 1180.648 1160.634 1370.631 13740.617 1510.563 15260.555 5030.549 2220.538 1240.505 139
ies-to-GDP ratio. Absolute liabilities is the amount of bank liabilities in billions of USrted into dollars using the exchange rate at the time of publication.

Table 2Top 20 countries with the largest system-wide liabilities-to-GDP ratio in 2008.
Country Sum liabilities
Switzerland 6.293United Kingdom 5.498Belgium 2.916France 2.737Netherlands 2.469Ireland 2.393Denmark 2.330Singapore 2.266Australia 2.132Sweden 1.982Canada 1.799Spain 1.749Japan 1.657South Africa 1.625Greece 1.482Italy 1.432Israel 1.377Germany 1.350Hong Kong 1.301Austria 1.251
This table contains the list of the top 20 countries with the largest sum of bankliabilities to GDP ratio, denoted Sum liabilities.
7 A government bailout that takes the form of bank share purchases or anationalization generally does not lead to a repudiation of a bank’s debt, whichwould be a credit event, or to a new entity with materially worse creditworthiness,which could trigger termination of the CDS contract.
8 This clause is part of the standard International Swaps and Derivatives Associ-ation contract since 2001, defining credit events, among them specific debtrestructurings, and limiting deliverable obligations to those with a maturity of30 days or less. Packer and Zhu (2005) show that the definitions of credit events andof deliverables significantly affect CDS spreads.
878 A. Demirgüç-Kunt, H. Huizinga / Journal of Banking & Finance 37 (2013) 875–894
Barclays, BNP Paribas, Deutsche Bank and Royal Bank of Scotland,each with liabilities exceeding 2.5 trillion US dollars.
The world’s largest banks tend to be international banks withlarge shares of assets and liabilities located in foreign branchesand subsidiaries. In these instances, the home-country fiscalauthorities tend to remain responsible wholly or in part for insur-ing the bank’s liabilities and for paying for any bail-out. In theEuropean Economic Area (including the European Union, Iceland,Liechtenstein, and Norway), bank deposits located at foreignbranches are formally covered by the deposit insurance schemeof the home country, according to the EU directive on depositinsurance adopted in 1994. Furthermore, the EU directive on thereorganization and winding-up of credit institutions adopted in2001 requires that domestic and foreign bank creditors are treatedequally in bankruptcy proceedings, preventing selective bail-outsof only domestic bank liability holders. The distinction betweenforeign branches and subsidiaries in practice is often blurred, asinternational banks formally guarantee the liabilities of their for-eign subsidiaries, or they de facto have to guarantee these liabili-ties to prevent reputational loss in case of a foreign-subsidiaryinsolvency.
As a measure of banking system size, we can compute the ratioof banking-system liabilities to national GDP. Switzerland and theUK have the largest ratios of banking system total liabilities to GDPof 6.3 and 5.5 respectively, as seen in Table 2. The table furthershows that 12 European countries are among the 20 countries withthe largest ratios of banking-system liabilities to GDP.
In the empirical work, we restrict the analysis to countries forwhich information on the fiscal balance and central governmentindebtedness is available from the IMF or the OECD. This leads toa sample of 4740 bank observations for 1349 individual banks in32 countries over the 1991–2008 period, and 689 individual banksin 2008. These countries, as listed in Table 3, are seen to be mostlyEuropean, but they include Canada, Israel, Korea, Mexico, Morocco,and the US.
For this restricted set of countries, Table 3 provides additionalinformation on the distribution of systemically important banksper country in 2008. Columns 1 and 2 of the table first provideinformation on banking-system liabilities relative to GDP and onthe largest bank’s liabilities relative to GDP for this smaller set ofcountries. Next, column 3 provides the total number of publicly-listed banks in 2008. The US stands out with a rather large number
of 462 banks. The next four columns indicate how many banks aresystemically large in that their liabilities-to-GDP ratio exceeds 0.1,0.25, 0.5 and 1.0, respectively.
Several countries are seen to have highly concentrated bankingsystems with rather few but very large banks relative to GDP.Ireland, for instance, has three publicly-listed banks that all haveliabilities exceeding half of GDP, while Belgium has three pub-licly-listed banks of which two have liabilities that exceed GDP.At the other extreme, the US has a highly dispersed banking systemwith only three banks that have a liabilities-to-GDP ratio exceeding0.1. These three banks are Bank of America, Citigroup, and JPMorgan Chase, with the latter bank having the highest liabilities-to-GDP ratio for any US bank of 0.14.
The final two columns of the table provide the country’s fiscalbalance-to-GDP ratio and its central government debt relative toGDP. Greece stands out as a country with several systemically largebanks, and fiscal balance and debt ratios of 6.5% and 108% of GDP,respectively.
The huge size of many countries’ largest banks reflects that manybanks’ liabilities have grown faster than GDP during the last decade.This is evident in Fig. 1. This figure displays the mean value of the lia-bilities variable for each year in the 2000–2008 period for thosebanks that existed during this entire period. The mean liabilities var-iable is seen to rise for 0.31 in 2000 to 0.40 in 2007, before a drop to0.33 in 2008. The decline in average systemic bank size in 2008 isconsistent with the view that banks were becoming too big to save.
2.2. Bank market valuation, CDS spreads and other variables
In the empirical work below, we relate two variables using mar-ket prices to the systemic bank size and national public financevariables. Using stock price data, we first construct a bank’s mar-ket-to-book ratio as the market value of the bank’s common equitydivided by the book value of common equity. The market value of abank’s common equity is available from Datastream. The market-to-book ratio should reflect any costs or benefits of systemic banksize to bank shareholders. The market-to-book has a sample meanof 1.510 in the overall sample, as seen in Table 4.
Our second dependent variable is a bank’s CDS spread. We con-struct a bank’s yearly CDS spread as the average of daily CDSspreads, provided that there are at least 100 daily CDS spreads.We obtain CDS information from Markit. Typically, several CDScontracts are traded for a given major bank differing in the dura-tion of the contract and in the definition of the deliverable bank lia-bilities in case of specified credit events.7 Following Jorion andZhang (2007), we consider 5-year CDS contracts as these contractsare the most liquid and constitute the majority of the entire CDSmarket. We further select on CDS contracts with a modified restruc-turing (MR) clause.8 Contracts can be denominated in dollars, eurosor another major currency, with the currency of denomination se-lected in this order in case there are contracts in multiple currencies.
The CDS spread provides a market indicator of expected creditlosses on bank liabilities, as the seller of the CDS contract takeson the obligation to purchase specified bank liabilities at par inthe event of a bank credit event, as set out in the CDS contract.CDS spreads provide direct market estimates of credit losses, as op-posed to bond yield spreads that in addition contain a liquidity

Table 3Systemically large banks and public finances in 2008.
Country Sumliabilities
Max ofliabilities
No. ofbanks
No. of banks withliabilities P0.1
No. of banks withliabilities P0.25
No. of banks withliabilities P0.5
No. of banks withliabilities P1.0
Fiscalbalance
Publicdebt
(1) (2) (3) (4) (5) (6) (7) (8) (9)
Australia 2.132 0.555 12 6 4 1 0 0.026 0.051Austria 1.251 0.670 7 3 2 1 0 �0.006 0.595Belgium 2.916 1.904 3 2 2 2 2 �0.013 0.902Canada 1.799 0.465 13 5 4 0 0 0.007 0.286Czech
Republic0.172 0.172 1 1 0 0 0 �0.022 0.270
Denmark 2.330 1.972 15 2 1 1 1 0.035 0.323Finland 0.181 0.166 4 1 0 0 0 0.047 0.292France 2.737 1.042 9 4 4 3 1 �0.027 0.542Germany 1.350 0.870 13 2 1 1 0 0.389Greece 1.482 0.390 11 5 3 0 0 �0.065 1.079Hungary 0.337 0.313 2 1 1 0 0 �0.043 0.684Ireland 2.393 0.991 3 3 3 3 0 �0.027 0.271Israel 1.377 0.408 6 5 2 0 0 �0.016Italy 1.432 0.631 16 3 2 1 0 �0.024 0.977Korea 0.548 0.271 4 2 1 0 0 0.291Lithuania 0.235 0.117 4 1 0 0 0 �0.005Luxembourg 0.023 0.023 1 0 0 0 0 0.047 0.088Mexico 0.059 0.044 2 0 0 0 0 0.245Morocco 0.184 0.131 2 1 0 0 0 0.064Netherlands 2.469 2.218 4 2 1 1 1 0.014 0.502Norway 0.866 0.690 10 1 1 1 0 0.194 0.138Poland 0.446 0.095 10 0 0 0 0 �0.009 0.450Portugal 1.217 0.538 3 3 2 1 0 �0.035 0.713Romania 0.089 0.089 1 0 0 0 0 �0.016Slovakia 0.177 0.154 2 1 0 0 0 �0.001 0.262Slovenia 0.137 0.137 1 1 0 0 0 0.011Spain 1.749 0.910 9 3 2 1 0 �0.018 0.335Sweden 1.982 0.767 5 3 3 3 0 0.032 0.360Switzerland 6.293 3.723 15 2 2 2 2 0.229Turkey 0.533 0.101 14 1 0 0 0 0.400United
Kingdom5.498 1.707 25 6 6 3 3 �0.036 0.607
USA 0.939 0.144 462 3 0 0 0 �0.055 0.404
Total 689 73 47 25 10
This table presents information on the size and number of large banks and the public finances for individual countries. Sum liabilities is the sum of bank liabilities in a countrydivided by GDP. Max of liabilities is the maximum of any bank’s liabilities divided by GDP. No. of banks with liabilities P0.1 is number of banks with a liabilities-to-GDP ratioexceeding 0.1. Fiscal balance is the ratio of central government revenues minus expenses to GDP. Public debt is central government debt divided by GDP.
.03
.032
.034
.036
.038
.04
mea
n lia
bilit
ies-
to-G
DP
ratio
s
2000 2002 2004 2006 2008
year
Fig. 1. Mean liabilities-to-GDP ratios during 2000–2008 period. This figure showsthe yearly mean liabilities-to-GDP ratios for the 423 banks that are in the data setthroughout the 2000–2008 period.
9 Recently Hart and Zingales (2011) proposed to use the CDS spread as a triggerdevice that forces banks to issue additional equity if it reaches a certain thresholdlevel.
A. Demirgüç-Kunt, H. Huizinga / Journal of Banking & Finance 37 (2013) 875–894 879
component (see, for instance, Longstaff et al. (2005)). CDS spreadsappear to reflect available information on future credit losses well,as they tend to anticipate debt downgrades (see Norden and We-ber, 2004), and may reflect insider information (see Acharaya and
Johnson, 2007), and as price discovery takes place primarily inthe CDS market (see Blanco et al., 2005).9 Knaup and Wagner(2012) have found that the correlation between bank stock returnsand an index of corporate CDS spreads provides a good indicationof bank asset risk exposure during the financial crisis of 2008.
In practice, we have CDS spreads from 2001 to 2008, with CDSspreads available for a total of 62 banks in 2008, as seen in Table 5.In this table, we further see that the mean CDS spread per year hasbeen extremely low for most years with a minimum of 0.26% in2004, reaching a peak of 1.45% in 2008.
In the empirical analysis, we include a range of bank-level andcountry-level variables. To start, assets is the logarithm of totalbank assets in millions of dollars. This variable measures a bank’sabsolute size – rather than its size relative to its national economy.Bank size may matter to bank shareholders and liability holdersbecause of technological and managerial economies (or disecono-mies) of scale. In addition, bank size can affect a bank’s expectedaccess to a country’s financial safety net on account of too-big-to-fail considerations, independently of the bank’s size relative tothe national economy.
As a measure of bank systemic size, liabilities is a bank’s liabil-ities-to-GDP ratio, with a mean of 6.2%. Sum of liabilities is the

Table 4Summary statistics on bank and country variables.
Variable Observations Mean Std.dev.
Min Max
Market-to-book 4736 1.510 0.799 0.000 4.983CDS 200 0.005 0.007 0.001 0.056Assets 4751 22.028 2.150 15.765 28.526Liabilities 4751 0.062 0.262 0.000 3.901Sum liabilities 4751 1.326 0.804 0.000 8.319Other liabilities 4751 1.263 0.721 0 6.236Liabilities sq 4751 0.072 0.568 0.000 15.218Big0.1 4751 0.097 0.296 0 1Big0.25 4751 0.057 0.232 0 1Big0.5 4751 0.034 0.180 0 1Big1 4751 0.016 0.125 0 1Fiscal balance 4751 �0.021 0.034 �0.168 0.194Primary balance 4744 0.005 0.035 �0.089 0.209Government
spending4751 0.301 0.118 0.012 1.051
Bank asset risk 4560 0.042 0.079 0.000 0.978Pre-tax profits 4743 0.013 0.033 �0.893 0.339Fee income 4490 0.307 0.218 0 1Leverage 4751 0.891 0.125 0.005 0.999GDP per capita 4749 32.884 9.011 1.693 56.189Real GDP growth 4751 2.292 1.459 �3.036 10.653Deposit market
share4528 0.057 0.170 0.000 1
Past crisis 4751 0.521 0.500 0 1Past fiscal cost 4751 0.035 0.049 0 0.3Time since crisis 4751 11.204 8.543 0 31Dependency ratio 4751 0.215 0.042 0.081 0.310Openness 4271 0.458 0.348 0.205 3.182
This table presents summary statistics of variables. Market-to-book is market valueof common equity divided by book value of common equity. CDS is annual averageof daily credit default spreads for 5-year contracts. Assets is natural logarithm oftotal assets in constant 2000 US dollars. Liabilities is bank liabilities divided by GDP.Sum liabilities is sum of bank liabilities in a country divided by GDP. Other liabilitiesis sum of the liabilities of other banks in a country divided by GDP. Liabilities sq issquare of ratio of bank liabilities to GDP. Big0.1, Big0.25, Big0.5 and Big1 are dummyvariables. They are equal to 1 if the liabilities-to-GDP ratio is greater than or equalto 0.1, 0.25, 0.5 and 1 respectively, and otherwise they equal 0. Fiscal balance iscentral government revenues minus expenses divided by GDP. Primary fiscal bal-ance is central government revenues minus expenses excluding interest expensesdivided by GDP. Government spending is central government expenses divided byGDP. Bank asset risk is annualized standard deviation of weekly dividend-inclusivebank stock returns adjusted for bank leverage. Pre-tax profits is pre-tax profitsdivided by total assets. Fee income is the share of other operating income in totaloperating income. Leverage is liabilities divided by total assets. GDP per capita isGDP per capita in constant 2000 dollars. Real GDP growth is GDP growth rate in realterms in percentage. Deposit market share is deposits of a bank divided by totaldeposits in the national banking system. Past crisis is dummy variable that is one ifcountry is not currently experiencing a banking crisis but has experienced abanking crisis before and zero otherwise. Past fiscal cost is fiscal cost of resolvingmost recent but not current banking crisis divided by GDP. Time since crisis is thenumber of years since the end of any past banking crisis. Dependency ratio thenumber of people of 65 years or older as a share of the working age population.Openness is the sum of exports and imports as a share of GDP. Sample is condi-tioned on availability of the fiscal balance variable.
Table 5Summary statistics for 5-year CDS spreads by year.
Year N Mean Standard deviation Min Max
2001 2 .00369 .00029 .00348 .003892002 9 .00631 .00323 .00302 .012572003 13 .00484 .00357 .00183 .011792004 35 .00264 .00117 .00079 .006382005 50 .00312 .00546 .00104 .029272006 60 .00277 .00622 .00078 .046862007 82 .00449 .00665 .00138 .056032008 62 .01447 .00788 .00247 .05142
This table contains summary statistics for 5-year CDS spreads by year between2001 and 2008.
880 A. Demirgüç-Kunt, H. Huizinga / Journal of Banking & Finance 37 (2013) 875–894
ratio of banking-system liabilities to GDP, with a mean of 1.326.Other Liabilities is the difference between Sum of Liabilities andan individual bank’s own Liabilities variable, while Liabilities sqis the square of Liabilities. The variables Big0.1, Big0.25, Big0.5and Big1 are dummy indicators of systemic size. For instance,Big0.1 is a dummy variable that equals 1 if a bank’s total liabilitiesexceed 10% of GDP, while it is zero otherwise. Big0.25, Big0.5 andBig1 are defined analogously. In Table 4, we see, for instance, that9.7% of banks have a liabilities-to-GDP ratio that exceeds 0.1.
The table also provides summary statistics on the overall fiscalbalance, the primary fiscal balance, and government spending, allrelative to GDP. The overall fiscal balance is equal to governmentrevenues minus government spending, while the primary fiscal bal-ance excludes interest payments. The mean fiscal balance, primaryfiscal balance, and government spending ratios in the sample are
�2.1%, �0.5%, and 30.1%, respectively. The overall fiscal balance,reflecting interest expenses on past borrowing among other things,may best capture a country’s current fiscal capacity, and it is there-fore the main fiscal variable included in the empirical work below.
To represent bank risk, we construct the bank asset risk variableas the deleveraged annualized standard deviation of weekly bankstock returns, or more precisely as the standard deviation of bankstock returns multiplied by the ratio of the market value of com-mon equity to the book value of total bank assets. Bank asset riskand leverage together determine the probability of bank distressand potential losses for bank liability holders.
Among bank-level control variables, pre-tax profits is the ratioof a bank’s pre-tax profits to assets. Banks that are more profitableare expected to have a higher market-to-book ratio. Fee income, inturn, is the share of non-interest income in total operating income.Specifically, a bank with a high fee income variable may derive alarge share of its income from fee-generating activities such asadvisory services and from trading on its own account, rather thanfrom traditional lending activities. At a time of depressed values fortraditional bank assets such as mortgage loans, this variable couldpositively affect the market-to-book ratio, while the impact on theCDS spread may be negative. An additional bank-level variable isleverage, defined as the ratio of total bank liabilities to total assets.The market-to-book ratio may be positively related to leverage dueto higher implicit subsidies from the financial safety net or alterna-tively because of the deductibility of interest from the corporatetax base, but a negative relationship may also exist since higherleverage may increase expected bankruptcy costs. Also, the CDSspread may be positively related to leverage, if high leverage im-plies relatively large expected credit losses on bank liabilities.
Macroeconomic control variables are GDP per capita, as a proxyfor overall economic development, and the rate of real GDP growth,as a proxy for bank growth opportunities. Higher growth opportu-nities are expected to increase bank valuation and to reduce CDSspreads. Further, deposit market share, which stands for a bank’smarket share in the national deposit market, also may increasebank valuation and reduce CDS spreads.
A country’s past experience with banking crises may affect thefinancial support that will be available to banks in any future finan-cial crisis. Therefore, we control for the occurrence and fiscal costof past banking crises. Specifically, past crisis is a dummy variablethat equals one if a country has emerged from a previous bankingcrisis, and it is zero otherwise. In Table 4, we see that the mean va-lue of this variable is 0.521, which implies that 52.1% of banks arelocated in a country that has emerged from a banking crisis. Inaddition, past fiscal cost represents the ratio of the fiscal cost – rel-ative to GDP – of resolving the most recent past banking crisis. Thisvariable is zero, if the country has not emerged from any pastbanking crisis. In addition, time since crisis is the number of yearssince the end of the most recent banking crisis, with a value of zeroif a country has not experienced a banking crisis. The information

Table 6Means of variables for systemically large and small banks in 2008.
Variables Total Liabilities <0.5 Liabilities P0.5 Mean comparison test
N Mean N Mean N Mean t-Statistics
Market-to-book 1045 1.532 1015 1.526 30 1.736 �1.538CDS 62 0.014 48 0.015 14 0.012 2.496Assets 1047 22.383 1017 22.250 30 26.902 �21.327Pre-tax profits 1047 0.006 1017 0.006 30 0.003 1.586Fee income 964 0.295 939 0.294 25 0.314 �0.668Leverage 1047 0.890 1017 0.888 30 0.959 �13.220GDP per capita 988 29.423 958 29.485 30 27.418 1.410Real GDP growth 1031 1.179 1001 1.196 30 0.610 1.802Deposit market share 1008 0.069 978 0.059 30 0.412 �11.167Past crisis 1047 0.320 1017 0.324 30 0.167 2.231Past fiscal cost 1047 0.047 1017 0.049 30 0.006 8.162Time since crisis 1047 12.406 1017 12.692 30 2.700 5.329Fiscal balance 643 �0.039 621 �0.040 22 0.000 �3.651Primary fiscal balance 641 �0.017 619 �0.018 22 0.023 �4.000Government spending 807 0.302 784 0.297 23 0.459 �12.176Bank asset risk 999 0.069 969 0.071 30 0.027 13.197Liabilities 988 0.061 958 0.029 30 1.083 �8.125Sum liabilities 1047 1.206 1017 1.162 30 2.692 �5.460Other liabilities 988 1.217 958 1.204 30 1.609 �1.922Liabilities sq 988 0.056 958 0.006 30 1.661 �3.401Big0.1 1047 0.109 1017 0.083 30 1 �110Big0.25 1047 0.059 1017 0.031 30 1 �180Big1 1047 0.010 1017 0 30 0.333 �3.808
This table lists the means of variables for all banks, and separately for banks with a liabilities-to-GDP ratio less than 0.5 and with a liabilities-to-GDP ratio equal to or morethan 0.5. The last column contains the t-statistics of mean comparison tests for systemically large and small banks. Market-to-book is market value of common equity dividedby book value of common equity. CDS is annual average of daily credit default spreads for 5-year contracts. Assets is natural logarithm of total assets in constant 2000 USdollars. Pre-tax profits is pre-tax profits divided by total assets. Fee income is the share of other operating income in total operating income. Leverage is liabilities divided bytotal assets. GDP per capita is GDP per capita in constant 2000 dollars. Real GDP growth is GDP growth rate in real terms in percentage. Deposit market share is deposits of abank divided by total deposits in the national banking system. Past crisis is dummy variable that is one if country is not currently experiencing a banking crisis but hasexperienced a banking crisis before and zero otherwise. Past fiscal cost is fiscal cost of resolving most recent but not current banking crisis divided by GDP. Time since crisis isthe number of years since the end of any past banking crisis. Fiscal balance is central government revenues minus expenses divided by GDP. Primary fiscal balance is centralgovernment revenues minus expenses excluding interest expenses divided by GDP. Government spending is central government expenses divided by GDP. Bank asset risk isannualized standard deviation of weekly dividend-inclusive bank stock returns adjusted for bank leverage. Liabilities is bank liabilities divided by GDP. Sum liabilities is sumof bank liabilities in a country divided by GDP. Other liabilities is sum of the liabilities of other banks in a country divided by GDP. Liabilities sq is square of ratio of bankliabilities to GDP. Big0.1, Big0.25 and Big1 are dummy variables. They are equal to 1 if the liabilities-to-GDP ratio is greater than or equal to 0.1, 0.25, and 1 respectively, andthey equal 0 otherwise.
A. Demirgüç-Kunt, H. Huizinga / Journal of Banking & Finance 37 (2013) 875–894 881
used to construct these variables is taken from Laeven and Valencia(2010).
Finally, the table provides information the old-age dependencyand openness variables. The old-age dependency variable is thenumber of people of 65 years as a share of the working age popu-lation, with a mean of 21.5% in the sample. Openness is the sum ofexports and imports relative as a share of GDP, with mean of 45.8%.
To conclude this section, it is interesting to see how systemi-cally important banks tend to differ from smaller banks. To this ef-fect, Table 6 provides the means of our set of variables in 2008separately for banks with a liabilities-to-GDP ratio exceeding 0.5and for smaller banks. The table shows that systemically importantbanks have significantly lower CDS spreads. The larger banks fur-ther have higher leverage, higher deposit market shares, but lowerbank asset risk. The larger banks in addition tend to be located incountries that experienced fewer banking crises with correspond-ingly lower past fiscal costs of banking crises, while on averagethey are located in countries with higher overall and primary fiscalbalances and government spending for the year 2008.
10 Demsets and Strahan (1997) find that large bank holding companies have adiversification advantage, as evidenced by lower idiosyncratic risk. Large bankholding companies, however, are no less risky as they tend to have lower capitalratios.
3. The empirical evidence
In this section, we will examine how bank size, in absoluteterms and relative to the national economy, affects bank valuationand CDS pricing on account of differential access to financial safetynet subsidies. We first discuss our tests of whether banks are toobig to fail and too big to save. Then we present our main empiricalresults, followed by some robustness checks.
3.1. Tests of too big to fail and too big to save
Assets, or the log of bank assets in millions of US dollars, is ourmeasure of absolute bank size. This variable can affect a bank’smarket-to-book ratio on account of any technological or manage-rial economies of scale, any diversification benefits of size, andpotentially through a TBTF effect, if the bank is so large that a bankfailure would create unacceptably high negative externalities tothe economy.10 A bank’s TBTF status affects the risk profile of its lia-bilities, and therefore is potentially priced into CDS spreads as well.Flannery and Sorescu (1996) find that subordinated debenture yieldsare negatively related to the log of total assets. These authors men-tion that this result may reflect that large banks are TBTF, that theyare better diversified or alternatively that their subordinated deben-tures trade in more liquid markets.
A bank that is large relative to its national economy stands tocreate large negative externalities relative to its economy, if it fails.Thus, systemic size, as proxied by the Liabilities variable and thevarious Big variables, also potentially bestows a bank with a TBTFstatus, leading to higher share prices and a lower CDS spread. Con-versely, systemic size can make it too expensive for a country tobail out a bank, rendering a bank ‘too big to save’ (TBTS). If so, sys-temic size leads to lower bank valuation and higher CDS spreads.Thus the relationships between systemic size on the one hand

Table 7Determinants of the market-to-book ratio and the CDS spread.
Market-to-book CDS
(1) (2) (3) (4) (5) (6) (7) (8) (9) (10)
Assets �0.199*** �0.201*** �0.194*** �0.181*** �0.177*** 0.002 0.002 0.004 0.002 0.004(0.044) (0.044) (0.044) (0.045) (0.044) (0.002) (0.002) (0.002) (0.002) (0.003)
Pre-tax profits 0.409 0.316 0.303 0.421 0.315 �0.080 �0.069 �0.060 �0.081 �0.061(0.793) (0.789) (0.789) (0.792) (0.788) (0.052) (0.053) (0.053) (0.053) (0.053)
Fee income �0.063 �0.083 �0.082 �0.068 �0.087 �0.007** �0.007** �0.006** �0.006** �0.006**
(0.129) (0.129) (0.129) (0.129) (0.129) (0.003) (0.003) (0.003) (0.003) (0.003)Leverage 10.224*** 10.442*** 10.388*** 10.233*** 10.395*** �0.113*** �0.118*** �0.125*** �0.116*** �0.126***
(0.591) (0.587) (0.589) (0.591) (0.588) (0.031) (0.031) (0.031) (0.031) (0.032)GDP per capita �0.080** �0.095*** �0.096*** �0.081** �0.097*** 0.001 0.001 0.001 0.001 0.001
(0.034) (0.034) (0.034) (0.034) (0.034) (0.001) (0.001) (0.001) (0.001) (0.001)Real GDP growth 0.011 0.016 0.015 0.011 0.015 �0.000 �0.000 �0.000 �0.000 �0.000
(0.011) (0.011) (0.011) (0.011) (0.011) (0.000) (0.000) (0.000) (0.000) (0.000)Deposit market share 0.482*** 0.042 0.083 0.462*** 0.067 �0.006 �0.003 �0.002 �0.005 �0.002
(0.141) (0.153) (0.156) (0.141) (0.156) (0.010) (0.010) (0.010) (0.010) (0.010)Past crisis 0.097 0.006 0.011 0.080 �0.005 0.003 0.002 0.001 0.003 0.001
(0.126) (0.126) (0.126) (0.126) (0.126) (0.008) (0.008) (0.008) (0.008) (0.008)Past fiscal cost �0.088 1.928* 1.822* 0.021 1.913*
(1.043) (1.085) (1.088) (1.043) (1.088)Time since crisis �0.081*** �0.105*** �0.106*** �0.086*** �0.110*** 0.000 0.000 0.000 0.000 0.000
(0.015) (0.015) (0.015) (0.015) (0.015) (0.001) (0.001) (0.001) (0.001) (0.001)Time since crisis � Past fiscal cost 0.221 0.267** 0.262* 0.248* 0.289** �0.004 �0.003 �0.001 �0.005 �0.002
(0.136) (0.135) (0.135) (0.136) (0.135) (0.011) (0.011) (0.011) (0.011) (0.011)Fiscal balance 5.808*** 5.614*** 5.775*** 5.675*** 5.646*** �0.037* �0.033* �0.031 �0.037* �0.031
(0.889) (0.874) (0.884) (0.889) (0.884) (0.020) (0.020) (0.020) (0.020) (0.020)Bank asset risk 5.959*** 5.991*** 5.980*** 6.019*** 6.038*** �0.152 �0.308 �0.393 �0.197 �0.416
(0.926) (0.921) (0.921) (0.925) (0.920) (0.585) (0.591) (0.590) (0.591) (0.595)Bank asset risk � Leverage �5.393*** �5.394*** �5.389*** �5.474*** �5.467*** 0.239 0.423 0.522 0.289 0.547
(1.301) (1.294) (1.294) (1.299) (1.292) (0.652) (0.659) (0.659) (0.658) (0.664)Liabilities �0.562*** �0.395*** �1.503*** �1.306*** �0.001 �0.003 0.003 �0.000
(0.129) (0.131) (0.355) (0.355) (0.003) (0.003) (0.007) (0.007)Sum liabilities �0.241*** 0.001
(0.034) (0.001)Other liabilities �0.220*** �0.218*** 0.002* 0.002*
(0.038) (0.038) (0.001) (0.001)Liabilities sq 0.234*** 0.226*** �0.001 �0.001
(0.082) (0.082) (0.002) (0.002)Constant �1.869 �1.076 �1.155 �2.147 �1.428 0.030 0.034 �0.005 0.041 0.002
(1.494) (1.490) (1.491) (1.495) (1.493) (0.063) (0.059) (0.065) (0.065) (0.068)
N 4276 4276 4276 4276 4276 192 192 192 192 192R-sq 0.267 0.275 0.275 0.269 0.277 0.868 0.870 0.873 0.869 0.873
The dependent variable is the market-to-book ratio in columns 1–5 and the CDS spread in columns 6–10. Market-to-book is the market value of common equity divided bythe book value of common equity. CDS is the annual average of daily credit default spreads on a 5-year contract. Assets is natural logarithm of total assets in constant 2000 USdollars. Pre-tax profits is pre-tax profits divided by total assets. Fee income is the share of non-interest income in total operating income. Leverage is liabilities divided by totalassets. GDP per capita is GDP per capita in constant 2000 dollars. Real GDP growth is GDP growth rate in real terms in percentage. Deposit market share is deposits of a bankover total deposits in the national banking system. Past crisis is dummy variable that is one if country is not currently experiencing a banking crisis but has experienced abanking crisis before and zero otherwise. Past fiscal cost is fiscal cost of resolving most recent but not current banking crisis divided by GDP. Time since crisis is the number ofyears since the end of any past banking crisis. Fiscal balance is central government revenues minus expenses divided by GDP. Bank asset risk is annualized standard deviationof weekly dividend-inclusive bank stock returns adjusted for bank leverage. Liabilities is bank liabilities divided by GDP. Sum liabilities is sum of bank liabilities in a countrydivided by GDP. Other liabilities is sum of the liabilities of other banks in a country divided by GDP. Liabilities sq is square of ratio of bank liabilities to GDP. All regressionsinclude bank and year fixed effects. Standard errors are in parentheses.* Significance at 10%.** Significance at 5%.*** Significance at 1%.
882 A. Demirgüç-Kunt, H. Huizinga / Journal of Banking & Finance 37 (2013) 875–894
and bank valuation and CDS spreads on the other are a prioriambiguous and potentially non-monotonic, depending on the rela-tive magnitude of TBTF versus TBTS effects.
A country’s ability to bail out its systemically large banks shoulddepend on the health of its public finances, as proxied, for instance,by the fiscal balance. The fiscal balance, specifically, can positivelyaffect bank valuation, as a higher fiscal balance implies lower fiscalstrains and a higher capacity to support banks through the financialsafety net. An enhanced ability on the part of governments to bail outbanks affects the risk profile of bank liabilities, and hence potentiallyis priced into lower CDS spreads. An instrumental variable approachis used to control for possible endogeneity of the fiscal balance.
A negative relationship between bank valuation and bank sys-temic size, as indicated, can reflect a TBTS effect, but it could alsoreflect diminished growth opportunities in the bank’s domestic
banking market. A positive relationship between bank valuationand the fiscal balance, in turn, is also consistent with a TBTS effect.Alternatively, an association between bank valuation and the fiscalbalance could reflect the present value of the future taxation ofbanks. To have a direct test of TBTS, we can include an interactionterm of the fiscal balance and a systemic size variable in a market-to-book specification. A positive estimated coefficient is strong evi-dence of TBTS, as a higher fiscal balance then especially enhancesthe valuation of systemically important banks. A negative coeffi-cient for such an interaction term in a CDS specification similarlyis evidence of TBTS, as it suggests lower expected losses on bankliabilities of systemically important banks in countries with highfiscal balances.
Bank valuation can increase with bank risk, if the cost to banksof access to the financial safety net does not fully reflect bank risk.

A. Demirgüç-Kunt, H. Huizinga / Journal of Banking & Finance 37 (2013) 875–894 883
The relationship between bank valuation and bank risk may bemore positive for systemically large banks if these banks are espe-cially TBTF, and it can be less positive if these banks are ratherTBTS. Thus, by including an interaction term of bank risk and banksystemic size in a market-to-book specification, we can testwhether systemically important banks are relatively TBTF or TBTScompared to smaller banks.
Similarly, higher bank risk is expected to lead to higher CDSspreads, and the relationship between the CDS spread and bankrisk may be rather muted for systemically important banks if TBTFtends to operate, while it can be more pronounced if TBTS operates.Thus, by including an interaction term of bank risk and bank sys-temic size in a CDS specification, we can potentially see whetherTBTF or TBTS impacts on systemically important banks relative toother banks.
3.2. Empirical results on too big to fail versus too big to save
In Table 7 we present results of regressions of the market-to-book ratio in columns 1–5 and of the CDS spread in columns 6–10. The market-to-book ratio and the CDS spread are related toindividual bank and banking system size variables, bank risk, thefiscal balance, and a set of bank-level and country-level controlvariables.
The assets variable enters with negative and statistically signif-icant coefficients in the market-to-book regressions, possiblyreflecting diseconomies of scale, while it obtains coefficients thatare positive but statistically insignificant in the CDS regressions.
The fiscal balance is shown to be positively and significantlyassociated with the market-to-book ratio in regressions 1–5, whileit is negatively and significantly associated with the CDS in thespread regressions 6, 7 and 9.
Bank asset risk implies a risk of bank failure only if bank leverageis sufficiently high. Accordingly, the regressions include the bankasset risk and leverage variables and an interaction term of thesetwo variables. The bank asset risk variable has a positive and signif-icant effect on bank valuation, while it has a negative and insignif-icant effect on CDS spreads. Leverage is further seen to affect themarket-to-book ratio positively and significantly, while it affectsCDS spreads negatively and significantly. The interaction term, inturn, obtains negative and significant coefficients in the market-to-book regressions, and positive and insignificant coefficients inthe CDS regressions.11 Point estimates of coefficients suggest thatbank asset risk increases bank valuation for any level of leverage. Thissuggests that banks are able to shift part of any additional bank assetrisk to the financial safety net, as the price that they pay for access tothe financial safety does not fully reflect bank asset risk. Point esti-mates further suggest that higher leverage increases the market-to-book ratio for any value of bank asset risk in the sample, while itincreases CDS spreads for high value of the bank asset risk variable.
The bank liabilities-to-GDP ratio, proxying for bank systemicsize, enters the market-to-book regression 1 with a coefficient of�0.562 that is significant at the 1% level, while it obtains an insig-nificant coefficient of in the CDS regression 6. Larger systemic sizethus appears to reduce stock market valuation, and it does not af-fect expected credit losses on bank liabilities as reflected in CDSspreads. In regressions 2 and 7, we replace the bank-level liabili-ties-to-GDP ratio by the overall system-level liabilities-to-GDP ra-tio, yielding a coefficient of �0.241 in the market-to-bookregression 2 that is significant at the 1% level, and an insignificantcoefficient in the CDS regression 6.
11 The negative coefficient on leverage in the CDS regressions becomes insignificantif we exclude observations for the crisis year 2008 from the sample, while theinteraction of leverage with bank asset risk then is positive and significant(unreported).
In the market-to-book regression 3, we include a bank’s ownand other banks’ liabilities-to-GDP ratios jointly, yielding negativecoefficient of �0.395 and �0.220 for the bank’s own liabilities-to-GDP and for other banks’ liabilities-to-GDP that are both significantat 1%. In the CDS regression 8, the other banks’ liabilities-to-GDPvariable obtains a positive and significant coefficient. These esti-mated coefficients may reflect that a distressed bank is less likelyto be bailed out if other banks in the same country collectivelyare large. Alternatively, an individual bank may be perceived tobe riskier if other banks are large, as this may imply intense bank-ing competition on both the asset and liability sides of the bankbalance sheet.
Regressions 4 and 9 include linear and quadratic terms of abank’s own liabilities-to-GDP ratio to allow for relationships be-tween bank valuation and CDS spreads with bank systemic sizethat are nonlinear. The linear and quadratic terms receive negativeand positive coefficients in the market-to-book regression 4respectively, that are both statistically significant. In the CDSregression 9, neither the linear nor the quadratic systemic size var-iable is statistically significant. Regressions 5 and 10 jointly includethe systemic variables included in regressions 3–4 and 8–9 withcomparable outcomes. Overall, the results of Table 7 suggest thatbank valuation declines both with absolute and systemic bank size.CDS spreads do not strongly reflect either absolute or systemicbank size, although there is some evidence that they increase withother banks’ systemic size.
Among the controls, the market-to-book ratio is related nega-tively and insignificantly to the fee income variable, while CDSspreads are related negatively and significantly to this variable,suggesting that a focus on non-traditional banking activities re-duces expected credit losses on bank liabilities. The market-to-book ratio is negatively and significantly related to GDP per capita,while it is positively and significantly related to the bank’s depositmarket share in regressions 1 and 4. The market-to-book ratio ispositively and significantly related to the past fiscal cost variablein regression in several market-to-book regressions, while it is neg-atively and positively related to the time since crisis variable andits interaction with past crisis cost. This suggests that a costly pastcrisis adds to bank valuation, especially if the crisis happened sometime ago.
The regressions of Table 7 are subjected to several robustnesschecks. To start, we include a lagged fiscal balance variable to cap-ture that fiscal deficits may have a ‘build-up’ effect over time onbank valuation and CDS spreads. Estimated coefficients for the con-temporaneous fiscal balance variable and their significance levelsare very similar to Table 7 (unreported). The lagged fiscal balance,in turn, obtains positive and significant coefficients in the market-to book regressions, while it is insignificant in the CDS regressions,providing some evidence that the impact of fiscal balances ‘buildsup’ (unreported).
We also considered dynamics in the bank size variables, as theimpact of larger absolute and systemic bank size may materializeover time. Specifically, we included lagged assets and liabilitiesvariables in the market-to-book and CDS regressions of Table 7.In the market-to-book regressions, the contemporaneous andlagged assets variable enter with significant negative and positivecoefficients, with the sum of the two coefficients being negative(unreported). This suggests that larger absolute size initially de-presses bank stock valuation with some stock price recovery inthe next year, as evidence of a dynamic market response tochanges in a bank’ absolute size. In the CDS regressions, the con-temporaneous assets variable obtains insignificant coefficients,while the lagged assets variable obtains positive and significantcoefficients (unreported). Thus, larger absolute size appears to re-duce perceived bank liability safety consistent with a too-big-to-save effect, but only with a lag. The contemporaneous liabilities
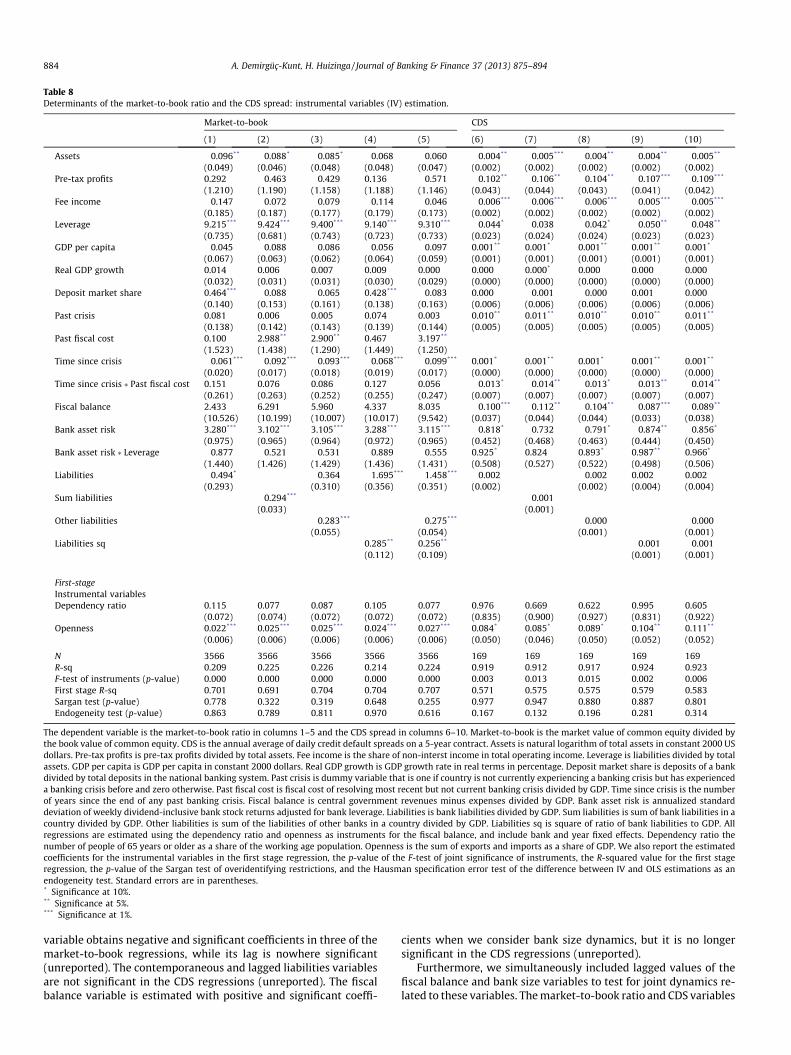
Table 8Determinants of the market-to-book ratio and the CDS spread: instrumental variables (IV) estimation.
Market-to-book CDS
(1) (2) (3) (4) (5) (6) (7) (8) (9) (10)
Assets �0.096** �0.088* �0.085* �0.068 �0.060 �0.004** �0.005*** �0.004** �0.004** �0.005**
(0.049) (0.046) (0.048) (0.048) (0.047) (0.002) (0.002) (0.002) (0.002) (0.002)Pre-tax profits 0.292 �0.463 �0.429 0.136 �0.571 �0.102** �0.106** �0.104** �0.107*** �0.109***
(1.210) (1.190) (1.158) (1.188) (1.146) (0.043) (0.044) (0.043) (0.041) (0.042)Fee income �0.147 �0.072 �0.079 �0.114 �0.046 �0.006*** �0.006*** �0.006*** �0.005*** �0.005***
(0.185) (0.187) (0.177) (0.179) (0.173) (0.002) (0.002) (0.002) (0.002) (0.002)Leverage 9.215*** 9.424*** 9.400*** 9.140*** 9.310*** �0.044* �0.038 �0.042* �0.050** �0.048**
(0.735) (0.681) (0.743) (0.723) (0.733) (0.023) (0.024) (0.024) (0.023) (0.023)GDP per capita �0.045 �0.088 �0.086 �0.056 �0.097 0.001** 0.001* 0.001** 0.001** 0.001*
(0.067) (0.063) (0.062) (0.064) (0.059) (0.001) (0.001) (0.001) (0.001) (0.001)Real GDP growth 0.014 0.006 0.007 0.009 0.000 0.000 0.000* 0.000 0.000 0.000
(0.032) (0.031) (0.031) (0.030) (0.029) (0.000) (0.000) (0.000) (0.000) (0.000)Deposit market share 0.464*** �0.088 �0.065 0.428*** �0.083 0.000 �0.001 �0.000 0.001 0.000
(0.140) (0.153) (0.161) (0.138) (0.163) (0.006) (0.006) (0.006) (0.006) (0.006)Past crisis 0.081 0.006 0.005 0.074 0.003 0.010** 0.011** 0.010** 0.010** 0.011**
(0.138) (0.142) (0.143) (0.139) (0.144) (0.005) (0.005) (0.005) (0.005) (0.005)Past fiscal cost 0.100 2.988** 2.900** 0.467 3.197**
(1.523) (1.438) (1.290) (1.449) (1.250)Time since crisis �0.061*** �0.092*** �0.093*** �0.068*** �0.099*** 0.001* 0.001** 0.001* 0.001** 0.001**
(0.020) (0.017) (0.018) (0.019) (0.017) (0.000) (0.000) (0.000) (0.000) (0.000)Time since crisis � Past fiscal cost 0.151 0.076 0.086 0.127 0.056 �0.013* �0.014** �0.013* �0.013** �0.014**
(0.261) (0.263) (0.252) (0.255) (0.247) (0.007) (0.007) (0.007) (0.007) (0.007)Fiscal balance 2.433 6.291 5.960 4.337 8.035 �0.100*** �0.112** �0.104** �0.087*** �0.089**
(10.526) (10.199) (10.007) (10.017) (9.542) (0.037) (0.044) (0.044) (0.033) (0.038)Bank asset risk 3.280*** 3.102*** 3.105*** 3.288*** 3.115*** �0.818* �0.732 �0.791* �0.874** �0.856*
(0.975) (0.965) (0.964) (0.972) (0.965) (0.452) (0.468) (0.463) (0.444) (0.450)Bank asset risk � Leverage �0.877 �0.521 �0.531 �0.889 �0.555 0.925* 0.824 0.893* 0.987** 0.966*
(1.440) (1.426) (1.429) (1.436) (1.431) (0.508) (0.527) (0.522) (0.498) (0.506)Liabilities �0.494* �0.364 �1.695*** �1.458*** �0.002 �0.002 0.002 0.002
(0.293) (0.310) (0.356) (0.351) (0.002) (0.002) (0.004) (0.004)Sum liabilities �0.294*** �0.001
(0.033) (0.001)Other liabilities �0.283*** �0.275*** �0.000 �0.000
(0.055) (0.054) (0.001) (0.001)Liabilities sq 0.285** 0.256** �0.001 �0.001
(0.112) (0.109) (0.001) (0.001)
First-stageInstrumental variablesDependency ratio 0.115 0.077 0.087 0.105 0.077 0.976 0.669 0.622 0.995 0.605
(0.072) (0.074) (0.072) (0.072) (0.072) (0.835) (0.900) (0.927) (0.831) (0.922)Openness 0.022*** 0.025*** 0.025*** 0.024*** 0.027*** 0.084* 0.085* 0.089* 0.104** 0.111**
(0.006) (0.006) (0.006) (0.006) (0.006) (0.050) (0.046) (0.050) (0.052) (0.052)
N 3566 3566 3566 3566 3566 169 169 169 169 169R-sq 0.209 0.225 0.226 0.214 0.224 0.919 0.912 0.917 0.924 0.923F-test of instruments (p-value) 0.000 0.000 0.000 0.000 0.000 0.003 0.013 0.015 0.002 0.006First stage R-sq 0.701 0.691 0.704 0.704 0.707 0.571 0.575 0.575 0.579 0.583Sargan test (p-value) 0.778 0.322 0.319 0.648 0.255 0.977 0.947 0.880 0.887 0.801Endogeneity test (p-value) 0.863 0.789 0.811 0.970 0.616 0.167 0.132 0.196 0.281 0.314
The dependent variable is the market-to-book ratio in columns 1–5 and the CDS spread in columns 6–10. Market-to-book is the market value of common equity divided bythe book value of common equity. CDS is the annual average of daily credit default spreads on a 5-year contract. Assets is natural logarithm of total assets in constant 2000 USdollars. Pre-tax profits is pre-tax profits divided by total assets. Fee income is the share of non-interst income in total operating income. Leverage is liabilities divided by totalassets. GDP per capita is GDP per capita in constant 2000 dollars. Real GDP growth is GDP growth rate in real terms in percentage. Deposit market share is deposits of a bankdivided by total deposits in the national banking system. Past crisis is dummy variable that is one if country is not currently experiencing a banking crisis but has experienceda banking crisis before and zero otherwise. Past fiscal cost is fiscal cost of resolving most recent but not current banking crisis divided by GDP. Time since crisis is the numberof years since the end of any past banking crisis. Fiscal balance is central government revenues minus expenses divided by GDP. Bank asset risk is annualized standarddeviation of weekly dividend-inclusive bank stock returns adjusted for bank leverage. Liabilities is bank liabilities divided by GDP. Sum liabilities is sum of bank liabilities in acountry divided by GDP. Other liabilities is sum of the liabilities of other banks in a country divided by GDP. Liabilities sq is square of ratio of bank liabilities to GDP. Allregressions are estimated using the dependency ratio and openness as instruments for the fiscal balance, and include bank and year fixed effects. Dependency ratio thenumber of people of 65 years or older as a share of the working age population. Openness is the sum of exports and imports as a share of GDP. We also report the estimatedcoefficients for the instrumental variables in the first stage regression, the p-value of the F-test of joint significance of instruments, the R-squared value for the first stageregression, the p-value of the Sargan test of overidentifying restrictions, and the Hausman specification error test of the difference between IV and OLS estimations as anendogeneity test. Standard errors are in parentheses.* Significance at 10%.** Significance at 5%.*** Significance at 1%.
884 A. Demirgüç-Kunt, H. Huizinga / Journal of Banking & Finance 37 (2013) 875–894
variable obtains negative and significant coefficients in three of themarket-to-book regressions, while its lag is nowhere significant(unreported). The contemporaneous and lagged liabilities variablesare not significant in the CDS regressions (unreported). The fiscalbalance variable is estimated with positive and significant coeffi-
cients when we consider bank size dynamics, but it is no longersignificant in the CDS regressions (unreported).
Furthermore, we simultaneously included lagged values of thefiscal balance and bank size variables to test for joint dynamics re-lated to these variables. The market-to-book ratio and CDS variables

Table 9Determinants of the market-to-book ratio and the CDS spread with systemic size interactions.
Market-to-book CDS
(1) (2) (3) (4) (5) (6)
Assets �0.060 �0.099** �0.058 �0.003* �0.004** �0.004**
(0.048) (0.049) (0.049) (0.002) (0.002) (0.002)Pre-tax profits �0.127 0.305 �0.129 �0.108** �0.096** �0.095**
(1.161) (1.213) (1.161) (0.044) (0.041) (0.040)Fee income �0.141 �0.154 �0.136 �0.005** �0.006*** �0.006***
(0.182) (0.188) (0.182) (0.002) (0.002) (0.002)Leverage 9.255*** 9.264*** 9.221*** �0.053** �0.073*** �0.072***
(0.737) (0.750) (0.739) (0.025) (0.023) (0.024)GDP per capita �0.039 �0.043 �0.040 0.001** 0.002*** 0.002***
(0.067) (0.067) (0.067) (0.001) (0.001) (0.001)Real GDP growth �0.003 0.015 �0.003 0.000 0.000 0.000*
(0.027) (0.032) (0.027) (0.000) (0.000) (0.000)Deposit market share 0.384*** 0.457*** 0.390*** �0.005 0.002 0.002
(0.139) (0.139) (0.139) (0.008) (0.006) (0.008)Past crisis 0.073 0.081 0.072 0.011** 0.013*** 0.013***
(0.139) (0.138) (0.139) (0.005) (0.005) (0.005)Past fiscal cost 0.387 0.024 0.432
(1.446) (1.553) (1.449)Time since crisis �0.059*** �0.061*** �0.059*** 0.001* 0.001** 0.001**
(0.021) (0.021) (0.021) (0.000) (0.000) (0.000)Time since crisis � Past fiscal cost 0.143 0.156 0.141 �0.014* �0.017** �0.017**
(0.254) (0.263) (0.254) (0.007) (0.007) (0.007)Fiscal balance 4.137 2.111 4.266 �0.074** �0.097*** �0.100***
(9.786) (10.676) (9.793) (0.033) (0.035) (0.029)Bank asset risk 3.427*** 3.387*** 3.346*** �0.948* �1.501*** �1.491***
(0.981) (0.990) (0.990) (0.500) (0.475) (0.488)Bank asset risk � Leverage �1.088 �1.052 �0.954 1.083* 1.727*** 1.714***
(1.442) (1.455) (1.458) (0.566) (0.538) (0.555)Liabilities �1.314*** �0.524* �1.282*** �0.002 0.003 0.003
(0.242) (0.281) (0.235) (0.002) (0.002) (0.002)Liabilities � Fiscal balance 7.266*** 7.205*** �0.039 0.005
(2.778) (2.783) (0.045) (0.043)Liabilities � Bank asset risk � Leverage 1.396 �1.049 �0.197*** �0.199***
(1.913) (1.859) (0.059) (0.061)
N 3566 3566 3566 169 169 169R-sq 0.206 0.209 0.206 0.913 0.927 0.927F-test of instruments for Fiscal balance (p-value) 0.000 0.000 0.000 0.002 0.004 0.001F-test of instruments for Liabilities � Fiscal balance (p-value) 0.000 0.000 0.007 0.011Sargan test (p-value) 0.604 0.801 0.551 0.607 0.574 0.840Endogeneity test (p-value) 0.066 0.843 0.073 0.082 0.172 0.124
The dependent variable is the market-to-book ratio in columns 1–3 and the CDS spread in columns 4–6. Market-to-book is the market value of common equity divided by thebook value of common equity. CDS is the annual average of daily credit default spreads on a 5-year contract. Assets is natural logarithm of total assets in constant 2000 USdollars. Pre-tax profits is pre-tax profits divided by total assets. Fee income is the share of non-interest operating income in total operating income. Leverage is liabilitiesdivided by total assets. GDP per capita is GDP per capita in constant 2000 dollars. Real GDP growth is GDP growth rate in real terms in percentage. Deposit market share isdeposits of a bank divided by total deposits in the national banking system. Real GDP growth is GDP growth rate in real terms in percentage. Deposit market share is totaldeposit of the bank divided by total deposits in the national banking system. Past crisis is dummy variable that is one if country is not currently experiencing a banking crisisbut has experienced a banking crisis before and zero otherwise. Past fiscal cost is fiscal cost of resolving most recent but not current banking crisis divided by GDP. Time sincecrisis is the number of years since the end of any past banking crisis. Fiscal balance is central government revenues minus expenses divided by GDP. Bank asset risk isannualized standard deviation of weekly dividend-inclusive bank stock returns adjusted for bank leverage. Liabilities is bank liabilities divided by GDP. All regressions areestimated using the dependency ratio and openness as instruments for the fiscal balance, and include bank and year fixed effects. Dependency ratio the number of people of65 years or older as a share of the working age population. Openness is the sum of exports and imports as a share of GDP. We also report the p-value of F-tests of jointsignificance of instruments in the first stage regression, the p-value of the Sargan test of overidentifying restrictions, and the Hausman specification error test of the differencebetween IV and OLS estimations as an endogeneity test.* Significance at 10%.** Significance at 5%.*** Significance at 1%.
A. Demirgüç-Kunt, H. Huizinga / Journal of Banking & Finance 37 (2013) 875–894 885
are now qualitatively related to the contemporaneous fiscal balancevariable as in Table 7, while the lagged value of the fiscal balance isnowhere significant – casting some doubt on a dynamic response ofthe market-to-book ratio to the fiscal balance (unreported). The dy-namic response of the market-to-book and CDS variables to the as-sets variable is unaffected by the inclusion of the lagged fiscalvariable, while now the contemporaneous and lagged liabilitiesvariables enter with negative and significant coefficients in themarket-to-book regressions 3 and 4, while both variables are insig-nificant in the CDS regressions (unreported). Overall, we find some
evidence of a dynamic response of the market-to-book ratio and theCDS spread to the fiscal balance and bank size variables.
As an additional robustness check, we included a bank’s hold-ings of government securities relative to assets in the regressionsof Table 7 to control for the possibility that the fiscal balance af-fects bank valuation and bank CDS spreads through its impact onmarket perceptions of the value of government debt on the banks’books. The inclusion of the government securities variable reducesthe number of observations in the market-to-book and CDS regres-sions to 997 and 119, respectively. The government securities

Table 10Determinants of the market-to-book ratio and the CDS spread with categorical measures of systemic size.
Market-to-book CDS
(1) (2) (3) (4) (5) (6) (7) (8)
Panel A. Big0.1 representing systemic sizeAssets �0.123*** �0.120** �0.127*** �0.126** �0.005*** �0.004** �0.004** �0.004**
(0.047) (0.049) (0.047) (0.049) (0.002) (0.002) (0.002) (0.002)Pre-tax profits 0.317 0.878 0.330 0.934 �0.103** �0.108** �0.099** �0.099**
(1.202) (1.183) (1.205) (1.192) (0.043) (0.044) (0.043) (0.042)Fee income �0.131 �0.305* �0.139 �0.318* �0.006*** �0.005*** �0.007*** �0.007***
(0.189) (0.178) (0.192) (0.181) (0.002) (0.002) (0.002) (0.002)Leverage 9.399*** 10.068*** 9.457*** 10.109*** �0.042* �0.043* �0.070*** �0.070***
(0.691) (0.781) (0.705) (0.792) (0.023) (0.023) (0.026) (0.026)GDP per capita �0.041 0.044 �0.038 0.047 0.001* 0.001* 0.002*** 0.001***
(0.064) (0.061) (0.065) (0.062) (0.001) (0.001) (0.001) (0.001)Real GDP growth 0.015 0.041* 0.016 0.046* 0.000* 0.000* 0.001** 0.001**
(0.031) (0.024) (0.031) (0.025) (0.000) (0.000) (0.000) (0.000)Deposit market share 0.452*** 0.365** 0.437*** 0.365** 0.001 �0.000 0.002 0.003
(0.141) (0.178) (0.141) (0.179) (0.006) (0.006) (0.006) (0.006)Past crisis 0.102 �0.003 0.107 0.004 0.010** 0.011** 0.013*** 0.013**
(0.143) (0.142) (0.142) (0.143) (0.005) (0.005) (0.005) (0.005)Past fiscal cost �0.150 �1.268 �0.253 �1.477
(1.404) (1.285) (1.442) (1.322)Time since crisis �0.049*** �0.029 �0.048*** �0.030 0.001** 0.001** 0.001*** 0.001***
(0.016) (0.020) (0.016) (0.020) (0.000) (0.000) (0.000) (0.000)Time since crisis � Past fiscal cost 0.131 0.406* 0.132 0.418* �0.013** �0.014** �0.017** �0.017**
(0.266) (0.224) (0.266) (0.227) (0.007) (0.007) (0.007) (0.007)Fiscal balance 2.435 �9.898 1.987 �11.044 �0.095*** �0.083** �0.112*** �0.107***
(10.292) (7.934) (10.512) (8.224) (0.036) (0.036) (0.035) (0.032)Bank asset risk 3.322*** 3.626*** 3.439*** 3.765*** �0.786* �0.744 �1.457*** �1.449***
(0.978) (1.038) (0.992) (1.056) (0.449) (0.462) (0.523) (0.507)Bank asset risk � Leverage �0.896 �1.093 �1.088 �1.334 0.892* 0.844 1.691*** 1.682***
(1.445) (1.513) (1.462) (1.540) (0.504) (0.519) (0.597) (0.580)Big0.1 �0.057 �0.046 �0.087 �0.096 �0.000 �0.001 0.002 0.002
(0.103) (0.108) (0.111) (0.115) (0.001) (0.002) (0.001) (0.001)Big0.1 � Fiscal balance 7.858 6.415 �0.015 0.009
(7.033) (6.955) (0.047) (0.042)Big0.1 � Bank asset risk � Leverage 1.728 2.705 �0.157** �0.153**
(2.263) (2.264) (0.064) (0.068)
N 3566 3566 3566 3566 169 169 169 169R-sq 0.204 0.149 0.204 0.140 0.919 0.918 0.916 0.922F-test of instruments for Fiscal balance (p-value) 0.000 0.000 0.000 0.000 0.003 0.012 0.001 0.005F-test of instruments for Big0.1 � Fiscal balance (p-value) 0.000 0.000 0.004 0.001Sargan test (p-value) 0.978 0.088 0.959 0.076 0.485 0.409 0.534 0.245Endogeneity test (p-value) 0.915 0.150 0.885 0.144 0.198 0.069 0.037 0.124
Panel B. Big0.25 representing systemic sizeFiscal balance 2.210 �2.715 �0.217 �0.621 �0.096** �0.088*** �0.123*** �0.121***
(10.270) (13.504) (10.218) (13.659) (0.038) (0.033) (0.039) (0.036)Bank asset risk 3.314*** 3.302*** 3.575*** 3.559*** �0.775* �0.774* �1.567*** �1.599***
(0.977) (0.993) (0.988) (1.000) (0.449) (0.429) (0.539) (0.570)Leverage 9.398*** 9.432*** 9.574*** 9.548*** �0.042* �0.044** �0.062** �0.062**
(0.681) (0.683) (0.684) (0.683) (0.023) (0.022) (0.025) (0.025)Bank asset risk � Leverage �0.890 �0.836 �1.281 �1.263 0.879* 0.877* 1.822*** 1.862***
(1.448) (1.472) (1.467) (1.489) (0.505) (0.481) (0.615) (0.654)Big0.25 0.016 �0.097 �0.109 �0.134 �0.000 �0.000 0.002 0.002
(0.138) (0.348) (0.147) (0.328) (0.001) (0.001) (0.001) (0.001)Big0.25 � Fiscal balance �3.889 �1.451 0.014 �0.008
(13.429) (13.695) (0.030) (0.037)Big0.25 � Bank asset risk � Leverage 4.361** 4.209 �0.177*** �0.186**
(2.217) (2.645) (0.060) (0.075)
N 3566 3566 3566 3566 169 169 169 169R-sq 0.204 0.180 0.201 0.197 0.919 0.926 0.911 0.910F-test of instruments for Fiscal balance (p-value) 0.000 0.000 0.000 0.000 0.004 0.011 0.005 0.009F-test of instruments for Big0.25 � Fiscal balance (p-value) 0.000 0.000 0.000 0.000Sargan test (p-value) 0.985 0.750 0.864 0.978 0.483 0.431 0.703 0.933Endogeneity test p-value) 0.896 0.873 0.710 0.919 0.201 0.123 0.034 0.033
Panel C. Big0.5 representing systemic sizeFiscal balance 2.964 12.830 3.289 13.044 �0.093*** �0.091** �0.092*** �0.090***
(10.243) (9.035) (10.354) (9.070) (0.036) (0.035) (0.035) (0.034)Bank asset risk 3.335*** 3.370*** 3.267*** 3.228*** �0.844* �0.844* �1.189*** �1.198***
(0.975) (1.015) (0.981) (1.023) (0.443) (0.444) (0.453) (0.457)Leverage 9.371*** 9.265*** 9.336*** 9.220*** �0.040* �0.040* �0.059** �0.059**
(0.688) (0.729) (0.695) (0.732) (0.022) (0.022) (0.023) (0.023)Bank asset risk � Leverage �0.931 �1.084 �0.822 �0.841 0.966* 0.967* 1.361*** 1.372***
(1.442) (1.495) (1.448) (1.510) (0.498) (0.499) (0.510) (0.515)
886 A. Demirgüç-Kunt, H. Huizinga / Journal of Banking & Finance 37 (2013) 875–894

Table 10 (continued)
Market-to-book CDS
(1) (2) (3) (4) (5) (6) (7) (8)
Big0.5 �0.371*** �0.326*** �0.335** �0.240* �0.001 �0.001 0.001 0.001(0.120) (0.123) (0.133) (0.137) (0.001) (0.001) (0.001) (0.001)
Big0.5 � Fiscal balance 7.385 8.525 �0.009 �0.005(5.178) (5.327) (0.031) (0.029)
Big0.5 � Bank asset risk � Leverage �2.194 �5.065 �0.130** �0.133**
(3.230) (3.424) (0.053) (0.056)
N 3566 3566 3566 3566 169 169 169 169R-sq 0.208 0.146 0.208 0.139 0.922 0.921 0.926 0.926F-test of instruments for Fiscal balance (p-value) 0.000 0.000 0.000 0.000 0.003 0.018 0.004 0.019F-test of instruments for Big0.5 � Fiscal balance (p-value) 0.000 0.000 0.000 0.000Sargan test (p-value) 0.955 0.111 0.952 0.162 0.546 0.798 0.843 0.968Endogeneity test (p-value) 0.960 0.009 0.984 0.006 0.210 0.114 0.212 0.234
Panel D. Big1 representing systemic sizeFiscal balance 2.224 �12.674* 2.338 �12.582* �0.104*** �0.093*** �0.085** �0.094***
(10.303) (6.499) (10.223) (6.538) (0.035) (0.034) (0.034) (0.030)Bank asset risk 3.338*** 3.530*** 3.318*** 3.444*** �0.742 �0.947* �0.879** �0.822*
(0.977) (1.025) (0.981) (1.027) (0.498) (0.547) (0.436) (0.465)Leverage 9.396*** 10.045*** 9.387*** 10.011*** �0.041* �0.051* �0.052** �0.049**
(0.690) (0.721) (0.688) (0.718) (0.022) (0.027) (0.022) (0.023)Bank asset risk � Leverage �0.929 �0.919 �0.897 �0.776 0.836 1.078* 0.992** 0.925*
(1.443) (1.508) (1.454) (1.518) (0.585) (0.619) (0.490) (0.525)Big1 �0.470** �0.267 �0.458** �0.229 �0.001 �0.004 0.002 0.003
(0.227) (0.246) (0.231) (0.260) (0.001) (0.004) (0.002) (0.004)Big1 � Fiscal balance 12.039** 11.732** �0.120 0.046
(5.869) (5.850) (0.145) (0.108)Big1 � Bank asset risk � Leverage �0.696 �2.945 �0.182* �0.185**
(3.508) (3.792) (0.093) (0.094)
N 3566 3566 3566 3566 169 169 169 169R-sq 0.206 0.130 0.206 0.131 0.915 0.900 0.925 0.925F-test of instruments for Fiscal balance (p-value) 0.000 0.000 0.000 0.000 0.003 0.003 0.003 0.002F-test of instruments for Big1 � Fiscal balance (p-value) 0.000 0.000 0.193 0.067Sargan test (p-value) 0.920 0.161 0.915 0.140 0.578 0.800 0.917 0.814Endogeneity test (p-value) 0.906 0.032 0.914 0.033 0.047 0.183 0.294 0.315
The dependent variable is the market-to-book ratio in columns 1–4 and the CDS spread in columns 5–8. Market-to-book is the market value of common equity divided by thebook value of common equity. CDS is the annual average of daily credit default spreads on a 5-year contract. Assets is natural logarithm of total assets in constant 2000 USdollars. Pre-tax profits is pre-tax profits divided by total assets. Fee income is the share of non-interest operating income in total operating income. Leverage is liabilitiesdivided by total assets. GDP per capita is GDP per capita in constant 2000 dollars. Real GDP growth is GDP growth rate in real terms in percentage. Deposit market share isdeposit of a bank divided by total deposits in the national banking system. Past crisis is dummy variable that is one if country is not currently experiencing a banking crisis buthas experienced a banking crisis before and zero otherwise. Past fiscal cost is fiscal cost of resolving most recent but not current banking crisis divided by GDP. Time sincecrisis is the number of years since the end of any past banking crisis. Fiscal balance is central government revenues minus expenses divided by GDP. Bank asset risk isannualized standard deviation of weekly dividend-inclusive bank stock returns adjusted for bank leverage. Big is a dummy variable that equals one if ratio of bank liabilitiesto GDP exceeds a threshold set equal to 0.1 in Panel A, to 0.25 in Panel B, to 0.5 in Panel C, and to 1.0 in Panel D. Panels B–D do not report estimated coefficients for someregressors for brevity. All regressions are estimated using the dependency ratio and openness as instruments for the fiscal balance, and include bank and year fixed effects.Dependency ratio the number of people of 65 years or older as a share of the working age population. Openness is the sum of exports and imports as a share of GDP. We alsoreport the p-value of the F-test of joint significance of instruments in the first stage regression, the p-value of the Sargan test of overidentifying restrictions, and the Hausmanspecification error test of the difference between IV and OLS estimations as an endogeneity test.* Significance at 10%.** Significance at 5%.*** Significance at 1%.
A. Demirgüç-Kunt, H. Huizinga / Journal of Banking & Finance 37 (2013) 875–894 887
variable is estimated to be insignificant in both market-to-bookand CDS regressions (unreported). The fiscal balance variable re-mains positive and significant in the market-to-book regressions,but it is insignificant in the CDS regressions (unreported). Next,we add interaction terms of the government securities variablewith the fiscal balance and bank size variables to the regressionsto find that the fiscal balance variable obtains positive and signifi-cant coefficients in the market-to-book regressions, and negativeand significant coefficients in the CDS regressions as in Table 7(unreported). In the market-to-book regression 1, the interactionterm of the government securities and liabilities variables obtainsa negative and significant coefficient to suggest that bank marketvalue declines more with systemic bank size if a bank is heavily ex-posed to government securities (unreported).
We further exclude observations for the crisis year 2008 in arobustness check to see whether the crisis of 2008 introduces astructural break in the relationships between bank valuation and
CDS spreads on the one hand and the fiscal balance on the other.The fiscal balance now obtains positive and significant coefficientsin the market-to-book regressions, and it is insignificant in the CDSregressions (unreported). Thus, the fiscal balance may not have af-fected expected losses on bank liabilities in the pre-crisis period.
Finally, we estimated specifications without bank fixed effects,but instead with country fixed effects and allowing for clusteringof the errors at the level of the bank to control for possible serialcorrelation of the errors at the level of the bank. In this setting,the fiscal balance continues to be estimated with positive and sig-nificant coefficients in the market-to-book regressions, while it isinsignificant in the CDS regressions (unreported). This insignifi-cance could reflect the presence of serial correlation in the CDSregressions of Table 7, but also the absence of bank fixed effects.
To summarize these robustness checks, the fiscal balance isestimated with positive and significant coefficients throughout,while is becomes insignificant in the CDS regression in several of
888 A. Demirgüç-Kunt, H. Huizinga / Journal of Banking & Finance 37 (2013) 875–894
these checks as additional controls are added, reducing samplesize, or bank fixed effects are taken out.12
The positive association between the fiscal balance and themarket-to-book ratio found in Table 7 could reflect that fiscallystrong nations are better able to bail out distressed banks. Reversecausality, however, is possible as well. Thus, distressed banks mayforce their fiscal authorities to support them through recapitaliza-tions or through a generally expansionary fiscal policy, giving riseto low fiscal balances.13 Alternatively, bank valuation and the fiscalbalance may jointly be affected by macroeconomic shocks that movebank valuation and the fiscal balance in the same direction.
Our aim next is to see whether an exogenous component of thefiscal balance – unrelated to the health of the financial system andthe general business cycle – can be shown to affect bank valuationand bank CDS spreads. For this purpose, we estimate instrumentalvariables (IV) specifications, using a country’s old-age dependencyratio and its openness to international trade as instruments for thefiscal balance. The dependency ratio is the number of people of65 year and older as a share of the working-age population in percent,and openness is the sum of exports and imports as s share of GDP. Bothvariables are slow-moving structural variables that affect governmentspending needs and taxing opportunities and thus the fiscal balance.14
A high old-age dependency ratio, specifically, can signal a needfor extensive government spending on health care for the elderly,worsening the fiscal balance. A high dependency ratio, on the otherhand, has been shown to lead to less generous social transfers (seeRazin et al., 2002), potentially improving the fiscal balance. Our IVresults below indicate a positive relationship between the depen-dency ratio and the fiscal balance in the first stage regressions sug-gesting that the latter effect dominates.15 The dependency ratioshould be an appropriate instrument for the fiscal balance, as it is ex-pected to be exogenous to changes in bank valuation and CDS spreads.
A country’s openness to international trade similarly can affectthe fiscal balance by several channels. First, openness has beenfound to lead to higher government consumption, defined as gov-ernment spending exclusive of interest payments (see Rodrik,1998), potentially reducing the fiscal balance. Higher governmentconsumption is a way to stabilize overall consumption in highlyopen economies that are subject to considerable macroeconomicshocks. Conversely, governments in open economies need to fi-nance their deficits primarily by borrowing in international capitalmarkets. This may be relatively difficult as international demandfor a country’s government debt may be relatively unstable, reduc-ing the scope for deficit finance.16 In the IV estimation below, we re-
12 As mentioned, our country coverage is restricted by the availability of fiscal dataat the national level. In practice, this means that our sample contains banks mainly inEuropean and several other OECD countries. These countries tend to be relativelywealthy, which could possibly bias our sampling against finding an impact of thefiscal variable on bank valuation and CDS pricing (relative to a data set that includesadditional banks from developing countries).
13 According to Cheasty and Das (2009), recorded fiscal deficits have not beenaffected much by recapitalizations during the current financial crisis, as nationalaccounting under accrual standards only requires the subsidy component ofrecapitalizations to be included in the deficit and as the subsidy component hasgenerally been small. Laeven and Valencia (2010, Table A.3) provide some informa-tion on recoveries of fiscal outlays associated with the banking crisis as of June 2010.Fiscal deficits, however, have indirectly been greatly affected by the financial crisis, asit has forced governments to implement expansionary fiscal policies to stabilize thereal economy, thereby assisting the financial sector.
14 Woo (2003) provides an empirical study of these and other determinants ofpublic deficits.
15 The correlation coefficient between the fiscal balance and the dependency ratio isestimated to be �0.055 and it is significant at the 1 percent level. All the same, firststage regressions of the fiscal balance on the dependency ratio, other independentvariables, and bank and time fixed effects shows a positive association between thesetwo variables.
16 Small open economics can be juxtaposed to a large country such as Japan thatbenefits from a strong, stable domestic demand for its government bonds.
port a positive and significant relationship between economicopenness and the fiscal balance. Openness to international tradeshould be a good instrument for the fiscal balance, as it is not likelyto respond to movements in bank valuation or CDS spreads.
Table 8 reports IV results of regressions analogous to Table 7. Inthe market-to-book regressions 1–5, the fiscal balance is estimatedwith positive coefficients that are statistically insignificant. Instru-menting for the fiscal balance thus eliminates the statistically sig-nificant co-movement of bank valuation and the fiscal balancefound in Table 7.
The CDS regressions 5–10 of Table 8 show negative and statis-tically significant coefficients for the fiscal balance, in fact morenegative than the corresponding coefficients in Table 7. This sug-gest that a structural improvement of the fiscal balance (implicitin the IV estimation) reduces CDS spreads more than is to be ex-pected on the basis of the overall co-movement of the fiscal bal-ance and CDS spreads (implicit in the estimation in Table 7).
In Table 8, the market-to-book value continues to benegatively and significantly related to the assets and liabilitiesvariables in regression 1, consistent with diseconomies of scaleas well as with the notion that large banks are too big to save.The assets variable enters the CDS regressions of Table 8 withnegative and significant coefficients, suggesting that the liabilitiesholders of large banks can expect relatively small credit losses,consistent with the view that systemically large banks are toobig to fail. The systemic size variables do not significantly affectCDS spreads in Table 8.
Table 8 reports the results of two IV specification tests. First, theHausman endogeneity test has as the null hypothesis that the IVand OLS estimators are not statistically different so that there isno need for IV estimation. Second, the Sargan test has as the nullhypothesis that the instruments are valid and that the exclusionsrestrictions hold. The null of the Hausman test is not rejectedthroughout Table 8, casting some doubt on the need for IV estima-tion. At the same time, the null hypothesis of the Sargan test is notrejected, indicating that the dependency ratio and openness areappropriate instruments for the fiscal balance.
The negative relationship between a bank’s market-to-book ra-tio and its systemic size should be especially pronounced in fiscallystrapped countries. To test this, we include an interaction term ofthe liabilities variable and the fiscal balance in regression 1 of Ta-ble 8, with the results reported as regression 1 of Table 9. The inter-action term obtains a coefficient of 7.266 that is significant at the1% level, consistent with a TBTS effect on bank valuation for sys-temically large banks. The relationship between the market-to-book ratio and the fiscal balance is thus estimated to be nonlinear,which could explain the insignificance of the fiscal balance variablein the market-to-book regressions of Table 8.
The estimated coefficient on the interaction term of the liabili-ties and fiscal balance variables of 7.266 can be used to illustratethe differential impact of an improvement of the fiscal balanceon the market-to-book value of two systemically large and smallbanks with liabilities-to-GDP ratios of 1 and 0, respectively. Animprovement in the fiscal balance by 0.034 (which is one standarddeviation from Table 4) is calculated to increase the market-to-book ratio of the larger bank by 0.247 (=7.266 � 0.034) relative tothe smaller bank. This differential improvement in the market-to-book value of the systemically large bank amounts to about31% of the standard deviation of the market-to-book variable inthe overall sample (equal to 0.799 from Table 4). At the same time,a one standard deviation increase in the liabilities variable of 0.262is estimated to change the market-to-book ratio of a bank withmean fiscal balance of �0.021 (from Table 4) by �0.384(=�(1.314 + 7.266 � 0.021) � 0.262), which is 48.1% of the standarddeviation of the market-to-book ratio of 0.799. These are econom-ically significant effects.

Table 11Determinants of the market-to-book ratio and the CDS spread with primary fiscal balance as fiscal variable.
Market-to-book CDS
(1) (2) (3) (4) (5) (6) (7) (8) (9) (10)
Assets �0.096* �0.084* �0.085* �0.065 �0.055 �0.004** �0.006*** �0.005** �0.005*** �0.005**
(0.052) (0.047) (0.051) (0.051) (0.050) (0.002) (0.002) (0.002) (0.002) (0.002)Pre-tax profits 0.365 �0.268 �0.270 0.250 �0.385 �0.100** �0.103** �0.101** �0.109*** �0.110***
(1.140) (1.135) (1.118) (1.133) (1.112) (0.046) (0.049) (0.047) (0.042) (0.042)Fee income �0.159 �0.114 �0.114 �0.133 �0.087 �0.006*** �0.007*** �0.006*** �0.005*** �0.005***
(0.170) (0.173) (0.166) (0.168) (0.165) (0.002) (0.002) (0.002) (0.002) (0.002)Leverage 9.269*** 9.558*** 9.575*** 9.236*** 9.534*** �0.044* �0.037 �0.043 �0.053** �0.053**
(0.658) (0.633) (0.656) (0.655) (0.653) (0.025) (0.027) (0.026) (0.023) (0.023)GDP per capita �0.036 �0.063 �0.063 �0.040 �0.068 0.001* 0.001* 0.001* 0.001* 0.001*
(0.043) (0.043) (0.042) (0.043) (0.041) (0.001) (0.001) (0.001) (0.001) (0.001)Real GDP growth 0.019 0.018 0.018 0.016 0.015 0.000 0.001* 0.000 0.000 0.000
(0.022) (0.022) (0.022) (0.022) (0.021) (0.000) (0.000) (0.000) (0.000) (0.000)Deposit market share 0.473*** �0.082 �0.091 0.436*** �0.122 0.002 0.001 0.001 0.002 0.002
(0.141) (0.158) (0.155) (0.140) (0.155) (0.007) (0.007) (0.007) (0.006) (0.006)Past crisis 0.069 �0.031 �0.031 0.051 �0.047 0.010* 0.011* 0.010* 0.010** 0.010**
(0.125) (0.125) (0.125) (0.125) (0.125) (0.005) (0.006) (0.006) (0.005) (0.005)Past fiscal cost �0.036 2.650** 2.664** 0.251 2.938**
(1.268) (1.306) (1.217) (1.249) (1.202)Time since crisis �0.060*** �0.092*** �0.092*** �0.068*** �0.099*** 0.001* 0.001** 0.001* 0.001** 0.001**
(0.023) (0.021) (0.022) (0.022) (0.021) (0.000) (0.000) (0.000) (0.000) (0.000)Time since crisis � Past fiscal cost 0.185 0.178 0.178 0.187 0.178 �0.013* �0.014* �0.013* �0.014** �0.014**
(0.172) (0.175) (0.169) (0.171) (0.169) (0.007) (0.008) (0.008) (0.007) (0.007)Primary fiscal balance 0.994 2.095 2.001 1.905 3.047 �0.117** �0.131** �0.119** �0.090** �0.089**
(6.233) (6.222) (6.110) (6.126) (6.005) (0.047) (0.057) (0.054) (0.035) (0.039)Real GDP growth 0.019 0.018 0.018 0.016 0.015 0.000 0.001* 0.000 0.000 0.000
(0.022) (0.022) (0.022) (0.022) (0.021) (0.000) (0.000) (0.000) (0.000) (0.000)Deposit market share 0.473*** �0.082 �0.091 0.436*** �0.122 0.002 0.001 0.001 0.002 0.002
(0.141) (0.158) (0.155) (0.140) (0.155) (0.007) (0.007) (0.007) (0.006) (0.006)Bank asset risk 3.295*** 3.127*** 3.127*** 3.313*** 3.145*** �0.934* �0.862* �0.918* �1.002** �0.994**
(0.976) (0.964) (0.964) (0.973) (0.962) (0.494) (0.518) (0.500) (0.458) (0.459)Bank asset risk � Leverage �0.872 �0.482 �0.476 �0.874 �0.483 1.041* 0.954 1.021* 1.120** 1.110**
(1.443) (1.425) (1.426) (1.438) (1.423) (0.553) (0.581) (0.562) (0.513) (0.515)Liabilities �0.465* �0.265 �1.746*** �1.527*** �0.002 �0.002 0.004 0.004
(0.238) (0.247) (0.360) (0.360) (0.002) (0.002) (0.004) (0.004)Sum liabilities �0.297*** �0.000
(0.036) (0.001)Other liabilities �0.302*** �0.299*** �0.000 �0.000
(0.041) (0.041) (0.001) (0.001)Liabilities sq 0.310*** 0.303*** �0.002 �0.002
(0.087) (0.086) (0.001) (0.001)
First-stageInstrumental variablesDependency ratio 0.284*** 0.253*** 0.266*** 0.278*** 0.260*** 0.685 0.465 0.395 0.714 0.369
(0.075) (0.077) (0.075) (0.075) (0.075) (0.895) (0.967) (0.996) (0.881) (0.979)Openness 0.032*** 0.034*** 0.034*** 0.033*** 0.035*** 0.079 0.077 0.084 0.113** 0.119**
(0.007) (0.007) (0.007) (0.007) (0.007) (0.053) (0.050) (0.054) (0.055) (0.056)
N 3562 3562 3562 3562 3562 169 169 169 169 169R-sq 0.205 0.225 0.225 0.210 0.229 0.906 0.895 0.904 0.921 0.922F-test of instruments (p-value) 0.000 0.000 0.000 0.000 0.000 0.026 0.060 0.062 0.005 0.012First stage R-sq 0.658 0.640 0.660 0.660 0.661 0.483 0.484 0.485 0.504 0.507Sargan test (p-value) 0.746 0.264 0.265 0.588 0.185 0.855 0.961 0.782 0.724 0.671Endogeneity test (p-value) 0.828 0.983 0.988 0.967 0.825 0.095 0.079 0.130 0.235 0.286
The dependent variable is the market-to-book ratio in columns 1–5 and the CDS spread in columns 6–10. Market-to-book is the market value of common equity divided bythe book value of common equity. CDS is the annual average of daily credit default spreads on a 5-year contract. Assets is natural logarithm of total assets in constant 2000 USdollars. Pre-tax profits is pre-tax profits divided by total assets. Fee income is the share of non-interest operating income in total operating income. Leverage is liabilitiesdivided by total assets. GDP per capita is GDP per capita in constant 2000 dollars. Real GDP growth is GDP growth rate in real terms in percentage. Deposit market share isdeposits of a bank divided by total deposits in the national banking system. Past crisis is dummy variable that is one if country is not currently experiencing a banking crisisbut has experienced a banking crisis before and zero otherwise. Past fiscal cost is fiscal cost of resolving most recent but not current banking crisis divided by GDP. Time sincecrisis is the number of years since the end of any past banking crisis. Primary fiscal balance is central government revenues minus expenses excluding interest expensesdivided by GDP. Bank asset risk is annualized standard deviation of weekly dividend-inclusive bank stock returns adjusted for bank leverage. Liabilities is bank liabilitiesdivided by GDP. Sum liabilities is sum of bank liabilities in a country divided by GDP. Other liabilities is sum of the liabilities of other banks in a country divided by GDP.Liabilities sq is square of ratio of bank liabilities to GDP. All regressions are estimated using the dependency ratio and openness as instruments for the fiscal balance, andinclude bank and year fixed effects. Dependency ratio the number of people of 65 years or older as a share of the working age population. Openness is the sum of exports andimports as a share of GDP. We also report the p-value of the F-test of joint significance of instruments, the R-squared value in the first stage regression, the p-value of theSargan test of overidentifying restrictions, and the Hausman specification error test of the difference between IV and OLS estimations as an endogeneity test. Standard errorsare in parentheses.* Significance at 10%.** Significance at 5%.*** Significance at 1%.
A. Demirgüç-Kunt, H. Huizinga / Journal of Banking & Finance 37 (2013) 875–894 889
Next, in regression 2 of Table 9 we include an interaction termof the liabilities and bank asset risk (multiplied by bank leverage)
variables as an additional test of whether the relationship betweenmarket-to-book and systemic size reflects the operation of the
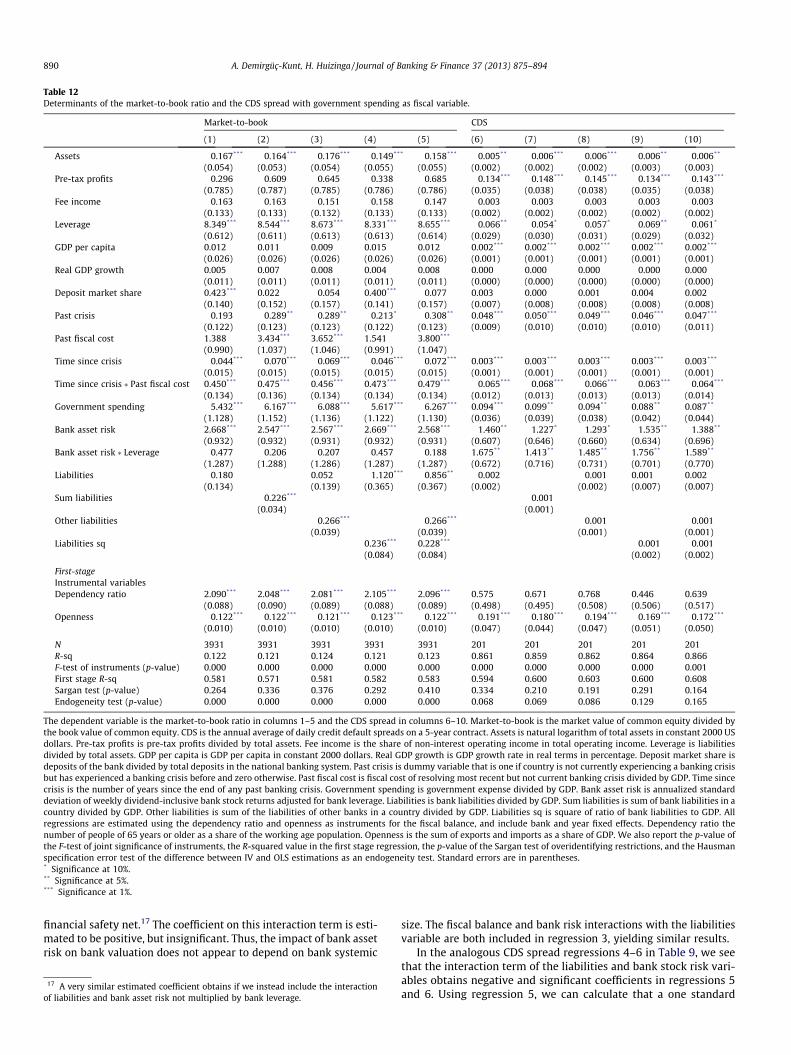
Table 12Determinants of the market-to-book ratio and the CDS spread with government spending as fiscal variable.
Market-to-book CDS
(1) (2) (3) (4) (5) (6) (7) (8) (9) (10)
Assets �0.167*** �0.164*** �0.176*** �0.149*** �0.158*** �0.005** �0.006*** �0.006*** �0.006** �0.006**
(0.054) (0.053) (0.054) (0.055) (0.055) (0.002) (0.002) (0.002) (0.003) (0.003)Pre-tax profits �0.296 �0.609 �0.645 �0.338 �0.685 �0.134*** �0.148*** �0.145*** �0.134*** �0.143***
(0.785) (0.787) (0.785) (0.786) (0.786) (0.035) (0.038) (0.038) (0.035) (0.038)Fee income �0.163 �0.163 �0.151 �0.158 �0.147 �0.003 �0.003 �0.003 �0.003 �0.003
(0.133) (0.133) (0.132) (0.133) (0.133) (0.002) (0.002) (0.002) (0.002) (0.002)Leverage 8.349*** 8.544*** 8.673*** 8.331*** 8.655*** �0.066** �0.054* �0.057* �0.069** �0.061*
(0.612) (0.611) (0.613) (0.613) (0.614) (0.029) (0.030) (0.031) (0.029) (0.032)GDP per capita 0.012 0.011 0.009 0.015 0.012 0.002*** 0.002*** 0.002*** 0.002*** 0.002***
(0.026) (0.026) (0.026) (0.026) (0.026) (0.001) (0.001) (0.001) (0.001) (0.001)Real GDP growth 0.005 0.007 0.008 0.004 0.008 0.000 0.000 0.000 �0.000 0.000
(0.011) (0.011) (0.011) (0.011) (0.011) (0.000) (0.000) (0.000) (0.000) (0.000)Deposit market share 0.423*** 0.022 �0.054 0.400*** �0.077 0.003 0.000 0.001 0.004 0.002
(0.140) (0.152) (0.157) (0.141) (0.157) (0.007) (0.008) (0.008) (0.008) (0.008)Past crisis �0.193 �0.289** �0.289** �0.213* �0.308** 0.048*** 0.050*** 0.049*** 0.046*** 0.047***
(0.122) (0.123) (0.123) (0.122) (0.123) (0.009) (0.010) (0.010) (0.010) (0.011)Past fiscal cost 1.388 3.434*** 3.652*** 1.541 3.800***
(0.990) (1.037) (1.046) (0.991) (1.047)Time since crisis �0.044*** �0.070*** �0.069*** �0.046*** �0.072*** 0.003*** 0.003*** 0.003*** 0.003*** 0.003***
(0.015) (0.015) (0.015) (0.015) (0.015) (0.001) (0.001) (0.001) (0.001) (0.001)Time since crisis � Past fiscal cost 0.450*** 0.475*** 0.456*** 0.473*** 0.479*** �0.065*** �0.068*** �0.066*** �0.063*** �0.064***
(0.134) (0.136) (0.134) (0.134) (0.134) (0.012) (0.013) (0.013) (0.013) (0.014)Government spending �5.432*** �6.167*** �6.088*** �5.617*** �6.267*** 0.094*** 0.099** 0.094** 0.088** 0.087**
(1.128) (1.152) (1.136) (1.122) (1.130) (0.036) (0.039) (0.038) (0.042) (0.044)Bank asset risk 2.668*** 2.547*** 2.567*** 2.669*** 2.568*** �1.460** �1.227* �1.293* �1.535** �1.388**
(0.932) (0.932) (0.931) (0.932) (0.931) (0.607) (0.646) (0.660) (0.634) (0.696)Bank asset risk � Leverage �0.477 �0.206 �0.207 �0.457 �0.188 1.675** 1.413** 1.485** 1.756** 1.589**
(1.287) (1.288) (1.286) (1.287) (1.287) (0.672) (0.716) (0.731) (0.701) (0.770)Liabilities �0.180 0.052 �1.120*** �0.856** �0.002 �0.001 0.001 0.002
(0.134) (0.139) (0.365) (0.367) (0.002) (0.002) (0.007) (0.007)Sum liabilities �0.226*** �0.001
(0.034) (0.001)Other liabilities �0.266*** �0.266*** �0.001 �0.001
(0.039) (0.039) (0.001) (0.001)Liabilities sq 0.236*** 0.228*** �0.001 �0.001
(0.084) (0.084) (0.002) (0.002)
First-stageInstrumental variablesDependency ratio 2.090*** 2.048*** 2.081*** 2.105*** 2.096*** 0.575 0.671 0.768 0.446 0.639
(0.088) (0.090) (0.089) (0.088) (0.089) (0.498) (0.495) (0.508) (0.506) (0.517)Openness �0.122*** �0.122*** �0.121*** �0.123*** �0.122*** �0.191*** �0.180*** �0.194*** �0.169*** �0.172***
(0.010) (0.010) (0.010) (0.010) (0.010) (0.047) (0.044) (0.047) (0.051) (0.050)
N 3931 3931 3931 3931 3931 201 201 201 201 201R-sq 0.122 0.121 0.124 0.121 0.123 0.861 0.859 0.862 0.864 0.866F-test of instruments (p-value) 0.000 0.000 0.000 0.000 0.000 0.000 0.000 0.000 0.000 0.001First stage R-sq 0.581 0.571 0.581 0.582 0.583 0.594 0.600 0.603 0.600 0.608Sargan test (p-value) 0.264 0.336 0.376 0.292 0.410 0.334 0.210 0.191 0.291 0.164Endogeneity test (p-value) 0.000 0.000 0.000 0.000 0.000 0.068 0.069 0.086 0.129 0.165
The dependent variable is the market-to-book ratio in columns 1–5 and the CDS spread in columns 6–10. Market-to-book is the market value of common equity divided bythe book value of common equity. CDS is the annual average of daily credit default spreads on a 5-year contract. Assets is natural logarithm of total assets in constant 2000 USdollars. Pre-tax profits is pre-tax profits divided by total assets. Fee income is the share of non-interest operating income in total operating income. Leverage is liabilitiesdivided by total assets. GDP per capita is GDP per capita in constant 2000 dollars. Real GDP growth is GDP growth rate in real terms in percentage. Deposit market share isdeposits of the bank divided by total deposits in the national banking system. Past crisis is dummy variable that is one if country is not currently experiencing a banking crisisbut has experienced a banking crisis before and zero otherwise. Past fiscal cost is fiscal cost of resolving most recent but not current banking crisis divided by GDP. Time sincecrisis is the number of years since the end of any past banking crisis. Government spending is government expense divided by GDP. Bank asset risk is annualized standarddeviation of weekly dividend-inclusive bank stock returns adjusted for bank leverage. Liabilities is bank liabilities divided by GDP. Sum liabilities is sum of bank liabilities in acountry divided by GDP. Other liabilities is sum of the liabilities of other banks in a country divided by GDP. Liabilities sq is square of ratio of bank liabilities to GDP. Allregressions are estimated using the dependency ratio and openness as instruments for the fiscal balance, and include bank and year fixed effects. Dependency ratio thenumber of people of 65 years or older as a share of the working age population. Openness is the sum of exports and imports as a share of GDP. We also report the p-value ofthe F-test of joint significance of instruments, the R-squared value in the first stage regression, the p-value of the Sargan test of overidentifying restrictions, and the Hausmanspecification error test of the difference between IV and OLS estimations as an endogeneity test. Standard errors are in parentheses.* Significance at 10%.** Significance at 5%.*** Significance at 1%.
890 A. Demirgüç-Kunt, H. Huizinga / Journal of Banking & Finance 37 (2013) 875–894
financial safety net.17 The coefficient on this interaction term is esti-mated to be positive, but insignificant. Thus, the impact of bank assetrisk on bank valuation does not appear to depend on bank systemic
17 A very similar estimated coefficient obtains if we instead include the interactionof liabilities and bank asset risk not multiplied by bank leverage.
size. The fiscal balance and bank risk interactions with the liabilitiesvariable are both included in regression 3, yielding similar results.
In the analogous CDS spread regressions 4–6 in Table 9, we seethat the interaction term of the liabilities and bank stock risk vari-ables obtains negative and significant coefficients in regressions 5and 6. Using regression 5, we can calculate that a one standard
A. Demirgüç-Kunt, H. Huizinga / Journal of Banking & Finance 37 (2013) 875–894 891
deviation increase in the liabilities variable of 0.262 will reduce theCDS spread of a bank with mean bank asset risk of 0.042 and meanleverage of 0.891 by 0.00193 = (0.197 � 0.042 � 0.891) � 0.262 (or27.6% of the standard deviation of the CDS spread of 0.007), rela-tive to the CDS spread of a very low-risk bank with almost no bankasset risk (or leverage). Thus, the expected credit losses on the lia-bilities of risky and highly leveraged banks rise relatively little withthe liabilities variable, suggesting that systemically large banks canexpect more extensive support from the financial safety as evi-dence of a TBTF effect.
The IV regressions indicate that bank market-to-book is nega-tively related to bank systemic size and positively to an interactionof the fiscal balance with bank systemic size, while CDS rates arenegatively related to the fiscal balance. This is consistent withthe notion that banks can be too large to save.18
3.3. Further robustness checks
This section reports several robustness checks relating to thedefinition of the bank systemic size variable, the choice of the fiscalvariable included in the regressions, and the role of other banks’leverage in explaining a bank’s stock valuation and CDS spreads.
Regressions 4 and 5 of Table 8 suggest that the relationships be-tween the market-to-book ratio and bank systemic size may benon-linear. One way to deal with this is to replace the liabilitiesvariable by one of the Big variables, as a categorical indicator ofbank systemic size. This is done in Table 10. This table includesfour panels. In each of the panels, the liabilities variable is replacedby one of the variables Big0.1, Big0.25, Big0.5 and Big1. Specifically,Panel A of Table 10 reports market-to-book and CDS regressionsthat include the Big0.1 variable, starting from regressions 1 and 5of Table 8 and the six regressions in Table 9. In analogous fashion,Panels B–D of Table 10 include the Big0.25, Big0.5 and Big1.0 var-iable, respectively.
In regression 1 of Panel A, we see that the Big0.1 variable ob-tains a coefficient of �0.057 that is not statistically significant. Inthe corresponding regression of Panel B, the Big0.25 similarly ob-tains a coefficient of 0.016 that is insignificant. In regressions 1of Panels C and D, however, the Big0.5 and Big1 variables obtaincoefficients of �0.371 and �0.470 that are significant at the 1%and 5% levels, respectively. Thus, banks with a liabilities-to-GDPratio of 0.5 appear to be large enough to have significantly lowervaluations on account of a TBTS effect.
Regressions 2 of the four panels include interaction terms of theapplicable Big variable and the fiscal balance variable. This interac-tion term obtains insignificant coefficients in Panels A–C, but theinteraction term of Big1 with the fiscal balance variable obtains acoefficient of 12.039 that is significant at the 5% level in Panel D.These results indicate that the valuations of only the largest banks,with liabilities exceeding GDP, are relatively sensitive to a coun-try’s fiscal position, as evidence of a TBTS effect.
The interaction of the Big variable with bank asset risk, includedin regressions 3 of the four panels, obtains a positive coefficient of4.361 that is significant at the 5% level in Panel B. This suggests thatespecially banks with liabilities of at least 25% of GDP can gainfrom higher bank asset risk, consistent with a TBTF effect.
In the corresponding CDS regressions in Panels A–D, the in-cluded Big variable and its interaction with the fiscal balance ob-
18 Alternatively, the valuation of systemically important banks could decline withthe fiscal balance relatively much, if these banks hold relatively large portfolios ofgovernment securities that decline in value as a country runs fiscal deficits. To checkthis, we included a government securities exposure variable in the market-to-bookregressions of Table 9, finding that the interaction term between the systemic sizeand fiscal balance variables continues to be estimated with positive and significantcoefficients in regressions 1 and 3, but in these instances the Sargan test of theoveridentifying restrictions is rejected at the 10% level (unreported).
tain insignificant coefficients throughout. In regressions 7 and 8,however, the interaction of the Big variable with bank asset riskare estimated with negative and significant coefficients, suggestingthat systemically larger banks are protected relatively much by thefinancial safety net if they take on more risk, consistent with a TBTFeffect. Overall the results of Table 10 are consistent with Table 9,even if they suggest that TBTS effects primarily apply to banks witha liabilities-to-GDP ratio of 0.5 or more.
So far, we have taken the fiscal balance to proxy for a country’sfiscal capacity. The fiscal balance may be the best index of residualfiscal strength, as among other things it takes into account theinterest cost of existing public debt. The overall fiscal balancecan be split into the primary fiscal balance, which is the overall fis-cal balance net of interest expenses, and the interest expenses.
As robustness checks, it is interesting see how each of these twocomponents of the overall fiscal balance affects bank valuation andCDS spreads. As alternative fiscal indicators, we also consider thegovernment spending ratio and the government debt ratio, asthese variables also could convey somewhat different informationabout the potential pay-outs from a country’s financial safety netto distressed banks.
To start, the regressions of Table 11 include the primary fiscalbalance and otherwise are analogous to Table 8. In the market-to-book value regressions 1–5, we see that the primary balance en-ters with positive coefficients that are statistically insignificant,while in the CDS regressions 6–10 this variable obtains negativeand statistically significant coefficients. In the market-to-bookregressions, the liabilities variable and other indices of bankingsystem systemic size also obtain coefficients that are very similarto Table 8.
Analogously, we replaced the overall fiscal balance by the ratioof government net interest payments to GDP in our market-to-book and CDS regressions. We do not report these regressions,however, as they do not pass the Sargan specification test of thevalidity of the instruments. The analogous set of regressions thatinclude the government spending ratio all are estimated with validinstrumentation according to the Sargan specification test, andthey are reported in Table 12. The government spending ratio en-ters the market-to-book regressions 1–5 with negative coefficientsthat are significant at 1%. The negative coefficients could reflectthat high-spending countries have little remaining fiscal capacityto finance bank bail-outs consistent with a TBTS effect on bank val-uation. Alternatively, high government spending may entail highpresent or future taxation of bank profits and customers (whilethe government spending itself may bring few benefits to thebanks). The liability variable is now estimated with a negativecoefficient that is statistically insignificant in regression 1 of Ta-ble 12, unlike regression 1 of Table 8. In regression 5, however,the liabilities variable, its square, and the other liabilities variableobtain coefficients that are very similar to those in regression 5of Table 8.19 The government spending variable enters the CDSregressions 6–10 with positive coefficients that are significant at1% or 5%, suggesting that governments with high expenditures havefew remaining resources to bail out their banks, consistent with aTBTS effect.
Finally, we estimated a set of regressions analogous to Table 8where the public debt ratio was the included fiscal variable. Thisvariable enters the market-to-book regressions with negative and
19 Estimated coefficients for the instruments in the first-stage regressions incolumns 1–5 indicate that government spending is positively related to thedependency ratio, and negatively to openness to international trade. A positiveimpact of the dependency ratio on both government spending and the fiscal balancecan occur if taxation rises sufficiently with a higher dependency ratio. In the politicaleconomy setting of Razin et al. (2002) a higher dependency ratio can give rise to ahigher taxation of capital income received by older people.

Table 13Determinants of the market-to-book ratio and the CDS spread controlling for leverage of other banks.
Market-to-book CDS
(1) (2) (3) (4) (5) (6) (7) (8) (9) (10)
Assets �0.084* �0.086* �0.078 �0.065 �0.059 �0.004** �0.006*** �0.005** �0.004** �0.005**
(0.050) (0.047) (0.050) (0.049) (0.049) (0.002) (0.002) (0.002) (0.002) (0.002)Pre-tax profits 0.183 �0.385 �0.354 0.120 �0.441 �0.081* �0.085* �0.080* �0.086** �0.087**
(1.236) (1.226) (1.191) (1.218) (1.179) (0.044) (0.046) (0.045) (0.042) (0.043)Fee income �0.090 �0.042 �0.049 �0.081 �0.034 �0.006*** �0.006*** �0.006*** �0.005*** �0.005***
(0.177) (0.183) (0.172) (0.173) (0.168) (0.002) (0.002) (0.002) (0.002) (0.002)Leverage 9.616*** 9.757*** 9.691*** 9.596*** 9.649*** �0.044** �0.031 �0.037 �0.049** �0.045*
(0.731) (0.687) (0.735) (0.723) (0.727) (0.022) (0.025) (0.024) (0.022) (0.023)Leverage other banks 0.474 1.515 1.396 0.403 1.269 0.061* 0.072* 0.076* 0.061* 0.074**
(1.200) (1.194) (1.319) (1.168) (1.280) (0.033) (0.040) (0.039) (0.032) (0.037)GDP per capita �0.049 �0.077 �0.077 �0.051 �0.084 0.001** 0.001* 0.001** 0.001** 0.001**
(0.077) (0.074) (0.072) (0.074) (0.069) (0.001) (0.001) (0.001) (0.001) (0.001)Real GDP growth �0.009 �0.013 �0.014 �0.010 �0.016 0.000* 0.001** 0.001* 0.000 0.000*
(0.032) (0.032) (0.031) (0.032) (0.030) (0.000) (0.000) (0.000) (0.000) (0.000)Deposit market share �0.385 �0.894*** �0.838*** �0.415* �0.863*** 0.000 �0.002 �0.001 0.001 �0.000
(0.239) (0.251) (0.237) (0.235) (0.239) (0.006) (0.007) (0.006) (0.006) (0.006)Past crisis 0.002 �0.091 �0.087 �0.012 �0.093 0.007 0.009* 0.008 0.008 0.008*
(0.145) (0.153) (0.155) (0.147) (0.156) (0.005) (0.005) (0.005) (0.005) (0.005)Past fiscal cost 1.060 3.758*** 3.608*** 1.233 3.800***
(1.492) (1.419) (1.243) (1.426) (1.209)Time since crisis �0.078*** �0.110*** �0.110*** �0.082*** �0.114*** 0.001 0.001* 0.001 0.001 0.001
(0.018) (0.016) (0.016) (0.017) (0.016) (0.000) (0.000) (0.000) (0.000) (0.000)Time since crisis � Past fiscal cost 0.171 0.150 0.153 0.179 0.144 �0.009 �0.011 �0.009 �0.009 �0.010
(0.278) (0.287) (0.272) (0.275) (0.268) (0.007) (0.007) (0.007) (0.007) (0.007)Fiscal balance 9.160 11.814 11.751 9.356 12.557 �0.092*** �0.117*** �0.105** �0.079** �0.087**
(10.286) (10.289) (9.681) (9.941) (9.316) (0.035) (0.045) (0.043) (0.032) (0.037)Bank asset risk 3.361*** 3.094*** 3.118*** 3.390*** 3.146*** �0.907** �0.751 �0.844* �0.966** �0.919**
(1.024) (1.023) (1.023) (1.023) (1.025) (0.442) (0.468) (0.458) (0.435) (0.442)Bank asset risk � Leverage �1.070 �0.582 �0.638 �1.093 �0.673 1.031** 0.848 0.956* 1.097** 1.040**
(1.523) (1.521) (1.531) (1.521) (1.532) (0.496) (0.527) (0.515) (0.489) (0.497)Liabilities �0.596** �0.456 �1.471*** �1.256*** �0.003* �0.003* 0.001 0.002
(0.290) (0.311) (0.359) (0.355) (0.002) (0.002) (0.004) (0.004)Sum liabilities �0.296*** �0.001
(0.035) (0.001)Other liabilities �0.270*** �0.267*** �0.001 �0.001
(0.063) (0.062) (0.001) (0.001)Liabilities sq 0.214* 0.191* �0.001 �0.001
(0.114) (0.111) (0.001) (0.001)
N 3518 3518 3518 3518 3518 169 169 169 169 169R-sq 0.212 0.214 0.215 0.214 0.211 0.924 0.912 0.919 0.928 0.926F-test of instruments (p-value) 0.000 0.000 0.000 0.000 0.000 0.003 0.016 0.016 0.001 0.006Sargan test (p-value) 0.386 0.748 0.784 0.516 0.935 0.797 0.796 0.955 0.890 0.860Endogeneity test (p-value) 0.642 0.424 0.391 0.597 0.310 0.245 0.120 0.201 0.413 0.357
The dependent variable is the market-to-book ratio in columns 1–5 and the CDS spread in columns 6–10. Market-to-book is the market value of common equity divided bythe book value of common equity. CDS is the annual average of daily credit default spreads on a 5-year contract. Assets is natural logarithm of total assets in constant 2000 USdollars. Pre-tax profits is pre-tax profits divided by total assets. Fee income is the share of non-interest operating income in total operating income. Leverage is liabilitiesdivided by total assets. Leverage other banks is weighted average by total assets of liabilities divided by assets of other banks in a country. GDP per capita is GDP per capita inconstant 2000 dollars. Real GDP growth is GDP growth rate in real terms in percentage. Deposit market share is deposits of the bank divided by total deposits in the nationalbanking system. Past crisis is dummy variable that is one if country is not currently experiencing a banking crisis but has experienced a banking crisis before and zerootherwise. Past fiscal cost is fiscal cost of resolving most recent but not current banking crisis divided by GDP. Time since crisis is the number of years since the end of any pastbanking crisis. Fiscal balance is central government revenues minus expenses divided by GDP. Bank asset risk is annualized standard deviation of weekly dividend-inclusivebank stock returns adjusted for bank leverage. Liabilities is bank liabilities divided by GDP. Sum liabilities is sum of bank liabilities in a country divided by GDP. Otherliabilities is sum of the liabilities of other banks in a country divided by GDP. Liabilities sq is square of ratio of bank liabilities to GDP. All regressions are estimated using thedependency ratio and openness as instruments for the fiscal balance, and include bank and year fixed effects. Dependency ratio the number of people of 65 years or older as ashare of the working age population. Openness is the sum of exports and imports as a share of GDP. We also report the p-value of the F-test of joint significance of instrumentsin the first stage regression, the p-value of the Sargan test of overidentifying restrictions, and the Hausman specification error test of the difference between IV and OLSestimations as an endogeneity test. Standard errors are in parentheses.* Significance at 10%.** Significance at 5%.*** Significance at 1%.
892 A. Demirgüç-Kunt, H. Huizinga / Journal of Banking & Finance 37 (2013) 875–894
significant coefficients consistent with a too-big-to-save effect(unreported).20
Overall, our robustness checks with alternative fiscal indicatorsconfirm that an unfavorable fiscal position leads to higher bank
20 The corresponding CDS regressions also yield negative and significant coefficientsfor the public debt ratio in several instances, but for these CDS regressions the Sargantest is not satisfied (unreported).
CDS spreads, consistent with a TBTS effect. The discounting of gov-ernment spending into lower bank valuation is also consistent witha TBTS effect, but it is also consistent with higher present or futuretaxation of banks.
To conclude this section, we consider how a bank’s market-to-book and CDS spread are affected by the health of other banks ina country. Specifically, we include the assets-weighted leverage ra-tio of other banks in a country as an additional control variable in

Table A1Variable definitions and data sources.
Variable Description Sources
Market-to-book Market value of common equity divided by book value of common equity Bankscope andDatastream
CDS Annual average of daily credit default spreads for 5-year contracts MarkitFiscal balance Central government revenues minus expenses divided by GDP IMFPrimary fiscal
balanceCentral government revenues minus expenses excluding interest expenses divided by GDP IMF
Governmentspending
Central government expenses divided by GDP IMF
Liabilities Bank liabilities divided by GDP Bankscope and WDISum liabilities Sum of bank liabilities in a country divided by GDP Bankscope and WDIOther liabilities Sum of the liabilities of other banks in a country divided by GDP Bankscope and WDILiabilities sq Square of ratio of bank liabilities to GDP Bankscope and WDIBig0.1 Dummy variable that equals one if ratio of bank liabilities to GDP exceeds 0.1 and zero otherwise Bankscope and WDIBig0.25 Dummy variable that equals one if ratio of bank liabilities to GDP exceeds 0.25 and zero otherwise Bankscope and WDIBig0.5 Dummy variable that equals one if ratio of bank liabilities to GDP exceeds 0.5 and zero otherwise Bankscope and WDIBig1 Dummy variable that equals one if ratio of bank liabilities to GDP exceeds 1.0 and zero otherwise Bankscope and WDIBank asset risk Annualized standard deviation of weekly dividend-inclusive bank stock returns times the ratio of the market value of
common equity to the book value of assetsDatastream andBankscope
Assets Log of assets in millions of constant 2000 US dollars BankscopePre-tax profits Pre-tax profits divided by assets BankscopeFee income Share of non-interest income in total operating income BankscopeLeverage Liabilities divided by assets BankscopeLeverage other
banksWeighted average by assets of liabilities divided by assets of other banks in a country Bankscope
GDP per capita GDP per capita in thousands of constant 2000 US dollars WDIReal GDP growth GDP growth rate in real terms in percentage WDIDeposit market
shareDeposits of a bank divided by total deposits in the national banking system Bankscope
Past crisis Dummy variable that is one if a country is not currently experiencing a banking crisis but has experienced a banking crisisbefore and zero
Laeven and Valencia(2010)
OtherwisePast fiscal cost Fiscal cost of resolving most recent past crisis but not current banking crisis divided by GDP Laeven and Valencia
(2010)Time since crisis Number of years since the end of most recent past banking crisis, and zero without any past crisis Laeven and Valencia
(2010)Dependency
ratioPeople of 65 years and older as a share of working age population WDI
Openness Sum of exports and imports as a share of GDP WDI
A. Demirgüç-Kunt, H. Huizinga / Journal of Banking & Finance 37 (2013) 875–894 893
the regressions of Table 8.21 The results are reported in Table 13.The leverage of other banks does not significantly affect the mar-ket-to-book ratios in regressions 1–5, but it obtains positive coeffi-cients in the CDS regressions 6–10 that are significant at the 5% or10% level. The evidence that a bank’s CDS spread rises with otherbanks’ leverage probably reflects that a bank can expect less fromthe financial safety net if other banks may need to be bailed out aswell. Previously, Brown and Dinç (2011) have shown that a bank isless likely to be taken over or closed down by the government ifother banks are highly leveraged. Taken together, these results onthe ‘too-many-to-fail’ phenomenon suggest that distressed banksin weak banking systems may benefit from postponement of theday of government takeover or closure, but when it occurs there isless money left for bank liability holders.
4. Conclusion
This paper presents evidence which suggests that a country’spublic finances impose limits on the generosity of the financialsafety net, and that these limits are reflected in bank valuationand CDS spreads. First, a bank’s market-to-book ratio is found tobe related negatively to its absolute size (measured by the log ofits total assets), and to its systemic size (measured by its liabili-ties-to-GDP ratio). This suggests that many banks have growntoo large, potentially because they have become too big to save.
21 This weighted leverage ratio equals 1 minus the weighted equity ratio consideredby Brown and Dinç (2011).
Second, CDS spreads are negatively related to a country’s fiscal bal-ance in our benchmark estimation with bank fixed effects. This isconsistent with the view that countries with strained public fi-nances can spend less on bailing out distressed bank, entailing lar-ger losses for investors in the liabilities of failing banks. Asignificant relationship between CDS spreads and the fiscal bal-ance, however, is not found in several robustness checks perhapsdue to the small sample size, and thus this evidence is inconclu-sive. Third, the valuation of systemically large banks is found tobe reduced relatively more, if they are located in countries withweak public finances.
The problem of ‘too big to save’ facing systemically large banksin fiscally strapped countries is likely to change the structure of theinternational banking system in the years to come. Banks in allbanking systems will face pressure to deleverage in order to reducerisks for themselves and for the financial safety net. However,especially systemically large banks in fiscally constrained countrieshave incentives to downsize in order to be able to rely on the finan-cial safety net in the future. Our evidence suggests that this shouldincrease bank valuation. Indeed, in 2008 we see that banks are del-everaging relative to their economy’s size. The downsizing relativeto economic size that occurred in 2008 may thus in part be drivenby a desire to increase stock market valuation in the face of a ‘toobig to save’ effect, even if downsizing no doubt has also been forcedby reduced capital on account of losses and difficulties to raiseequity as well as other capital at a time of financial crisis.
There is an obvious policy interest in reducing bank size at leastbelow the point where banks’ contingent claims on the financialsafety net are so large that there are doubts about countries’

894 A. Demirgüç-Kunt, H. Huizinga / Journal of Banking & Finance 37 (2013) 875–894
abilities to stabilize their banking system. In 2009, the EuropeanCommission ordered the downsizing of some of the largest Euro-pean banks that have received public assistance during the finan-cial crisis, such as Lloyds and Royal Bank of Scotland in the UK,Commerzbank in Germany and ING in the Netherlands, on theargument that public assistance has disturbed bank competition.Thus, although the Commission’s motivation has been to preventa future occurrence of public assistance that would bring unfaircompetitive advantages to the recipients, the effect will be to re-duce the size of some of Europe’s largest banks.
In the US, the Wall Street Reform and Consumer Protection Act(or Dodd–Frank Act) passed in July 2010 prohibits bank mergersthat result in a bank with total liabilities exceeding 10% of theaggregate consolidated liabilities of all financial companies, butan earlier proposal by the Obama administration to institute a levyon the liabilities of large bank failed to be enacted. In 2011, Swit-zerland approved legislation to adopt a regime of higher capitalrequirements for its largest banks, i.e. UBS and Credit Suisse, whichprovides an incentive to these banks to downsize. Policy steps todownsize very large banks that have not received assistance duringthe financial crisis have so far not been undertaken in the EU, eventhough politicians in countries such as the UK and the Netherlandshave at times voiced their desire to reduce their countries’ contin-gent liabilities on account of large banks and large bankingsystems.
Even in the absence of additional regulation and taxation, theaverage systemic size of banks declined in 2008, after reaching apeak in 2007. Our paper shows that this trend may reflect privateincentives to downsize in the face of a too-big-to-save effect in fis-cally constrained countries. Additional regulation or taxationaimed at very large banks could serve to strengthen this trend.
Acknowledgements
We thank an anonymous referee and seminar participants atthe Bank of England and the European Business School for com-ments and suggestions, and Ata Can Bertay and Mi Wu for researchassistance. Financial support from DFID is gratefully acknowl-edged. This paper’s findings, interpretations, and conclusions areentirely those of the authors and do not necessarily represent theviews of the World Bank, its Executive Directors, or the countriesthey represent.
Appendix A. Variable definitions and data sources
See Table A1.
References
Acharaya, V., Johnson, T., 2007. Insider trading in credit derivatives. Journal ofFinancial Economics 84, 110–141.
Acharya, V., Drechsler, I., Schnabl, P., 2011. A Phyrric victory? Bank Bailouts andSovereign Credit Risk. NBER WP 17136.
Benston, G., Hunter, W., Wall, L., 1995. Motivations for bank mergers andacquisitions: enhancing the deposit insurance put option versus earningsdiversification. Journal of Money, Credit, and Banking 27, 777–788.
Berger, A., Mester, L., 1997. Inside the box: what explains differences in theefficiencies of financial institutions? Journal of Banking and Finance 21, 895–947.
Blanco, R., Brennan, S., Marsh, I., 2005. An empirical analysis of the dynamicrelationship between investment-grade bonds and credit default swaps. Journalof Finance 60, 2255–2281.
Brown, C., Dinç, I., 2011. Too many to fail? Evidence of regulatory forbearance whenthe banking sector is weak. Review of Financial Studies 24, 1378–1405.
Cheasty, A., Das, U., 2009. Crisis-related Measures in the Financial System andSovereign Balance Sheet Risks. IMF Policy Paper SM/09/91, Washington, DC.
Demirgüç-Kunt, A., Kane, E., Laeven, L. (Eds.), 2008. Deposit Insurance Around theWorld: Issues of Design and Implementation. MIT Press, Cambridge, MA.
Demsets, R., Strahan, P., 1997. Diversification, size, and risk at bank holdingcompanies. Journal of Money, Credit, and Banking 29, 300–313.
Flannery, M., Sorescu, S., 1996. Evidence of bank market discipline in subordinateddebenture yields: 1983–1991. Journal of Finance 51, 1347–1377.
Gropp, R., Vesala, J., Vulpes, G., 2006. Equity and bond market signals as leadingindicators of bank fragility. Journal of Money, Credit and Banking 38, 399–428.
Hart, O., Zingales, L., 2011. A new capital regulation for large financial institutions.American Law and Economics Review 13, 453–490.
Jorion, P., Zhang, G., 2007. Good and bad credit contagion: evidence from creditdefault swaps. Journal of Banking and Finance 84, 860–883.
Kane, E., 2000. Incentives for banking megamergers: what motives might regulatorsinfer from event-study evidence? Journal of Money, Credit, and Banking 32,671–701.
Knaup, M., Wagner, W., 2012. A market-based measure of credit quality and banks’performance during the subprime crisis. Management Science 58, 1423–1437.
Laeven, L., Valencia, F., 2010. Resolution of Banking Crises: The Good, the Bad, andthe Ugly. IMF WP/10/146, Washington, DC.
Longstaff, F., Mithal, S., Neis, E., 2005. Corporate yield spreads: default risk orliquidity? New evidence from the credit default swap market. Journal of Finance60, 2213–2253.
Norden, L., Weber, M., 2004. Informational efficiency of credit default swap andstock markets: the impact of credit rating announcements. Journal of Bankingand Finance 28, 2813–2843.
O’Hara, M., Shaw, W., 1990. Deposit insurance and wealth effects: the value of being‘too big to fail’. Journal of Finance 45, 1587–1600.
Packer, F., Zhu, H., 2005. Contractual terms and CDS pricing. BIS Quarterly ReviewMarch, 89–100.
Penas, M., Unal, H., 2004. Gains in bank mergers: evidence from bond markets.Journal of Financial Economics 74, 149–179.
Razin, A., Sadka, E., Swagel, P., 2002. The aging population and the size of thewelfare state. Journal of Political Economy 89, 914–927.
Rodrik, D., 1998. Why do more open economies have bigger governments? Journalof Political Economy 106, 997–1032.
Sironi, A., 2003. Testing for market discipline in the European banking industry:evidence from subordinated debt issues. Journal of Money, Credit, and Banking35, 443–472.
Woo, J., 2003. Economic, political, and institutional determinants of public deficits.Journal of Public Economics 87, 387–426.