Embed Size (px)
Citation preview
ARCTIC PAPER CAPITAL GROUP
Consolidated quarterly report
for Q3 2018

2
Table of contents
Table of contents 2
Introduction 3 Information on the report .................................................... 3 Definitions and abbreviations ............................................ 3 Forward looking statements ............................................... 8
Selected consolidated financial data 10
Selected standalone financial data 11
Description of the business of the Arctic Paper Group 13 General information ............................................................ 13 Capital Group structure ..................................................... 14 Changes in the capital structure of the Arctic Paper Group .......................................................................... 14 Shareholding structure ....................................................... 14
Summary of consolidated financial results 16 Selected items of the consolidated profit and loss statement ............................................................................... 16 Selected items of the consolidated s tatement of financial position .................................................................. 21 Selected items of the consolidated cash flow statement ............................................................................... 25
Summary of standalone financial results 26 Selected items of standalone profit and loss statement ............................................................................... 26 Selected items of the standalone statement of financial position .................................................................. 28 Selected items of the standalone cash flow statement ............................................................................... 29
Relevant information and factors affecting the financial results and the assessment of the financial standing 30 Key factors affecting the performance results ............. 30 Unusual events and factors ............................................... 31 Impact of changes in Arctic Paper Group’s structure on the financial result ....................................... 31 Other material information ............................................... 31 Information on market trends ........................................... 32 Factors influencing the financial results in the perspective of the next quarter ....................................... 33 Risk factors ............................................................................. 33
Supplementary information 34 Management Board position on the possibil ity to achieve the projected financial results published earlier ................................................................................... 34 Changes in holdings of the Issuer’s shares or rights to shares by persons managing and supervising Arctic Paper S.A. ........................................... 34 Information on sureties and guarantees ........................ 34 Material off-balance sheet items ..................................... 35
Information on court and arbitration proceedings and proceedings pending before public administrative authorities ..................................................35 Information on transactions with related parties executed on non-market terms and conditions ...........35
Interim abbreviated consolidated financial statements 38 Interim abbreviated consolidated profit and loss statement ................................................................................38 Interim abbreviated consolidated statement of comprehensive income .......................................................39 Interim abbreviated consolidated statement of f inancial position ..................................................................40 Interim abbreviated consolidated cash flow statement ................................................................................41 Interim abbreviated consolidated statement of changes in equity .................................................................42
Interim abbreviated standalone financial statements 43 Interim abbreviated standalone profit and loss statement ................................................................................43 Interim abbreviated standalone comprehensive income statement .................................................................44 Interim abbreviated standalone statement of f inancial position ..................................................................45 Interim abbreviated standalone cash flow statement ................................................................................46 Interim abbreviated standalone statement o f changes in equity .................................................................47
Additional explanatory notes 48 1. General information ...................................................48 2. Composition of the Group .........................................50 3. Management and supervisory bodies .......................51 4. Approval of the financial statements .........................52 5. Basis of preparation of the interim abbreviated consolidated financial statements .............................................52 6. Significant accounting principles (policies) ................52 7. Seasonality .................................................................57 8. Information on business segments ............................57 9. Discontinued operations ............................................62 10. Dividend paid and proposed .....................................64 11. Earnings/(loss) per share ............................................65 12. Interest-bearing loans, borrowings and bonds .........65 13. Share capital ..............................................................66 14. Financial instruments .................................................66 15. Financial risk management objectives and policies ...................................................................................72 16. Capital management .................................................72 17. Contingent liabilities and contingent assets .............73 18. Legal claims ...............................................................73 19. CO2 emission rights ..................................................73 20. Government grants and operations in the Special Economic Zone .............................................................74 21. Other material events after the end of the reporting period ........................................................................75

Arctic Paper Capital Group/ Consolidated quarterly report for Q3 2018 3 Introduction
Introduction
Information on the report
This Consolidated Quarterly Report for Q3 2018 was prepared in accordance with the Minister of Finance Regulation of 29
March 2018 on current and periodic information provided by issuers of securities and on conditions under which information
required by legal regulations of a third country may be recognised as equivalent (Journal of Laws of 2018, item 757) and a
part of the interim abbreviated consolidated financial statements in accordance with International Accounting Standard No.
34.
The abbreviated consolidated financial statements do not comprise all information and disclosures required in the annual
consolidated financial statements which are subject to mandatory audit and therefore they should be read in conjunction
with the consolidated financial statements of the Group for the year ended on 31 December 2017.
Certain selected information contained in this report comes from the Arctic Paper Group management accounting system
and statistics systems.
This consolidated quarterly report presents data in PLN, and all figures, unless otherwise indicated, are given in thousand
PLN.
Definitions and abbreviations
Unless the context requires otherwise, the following definitions and abbreviations are used in the whole document:
Abbreviations applied to business entities, institutions and authorities of the Company
Arctic Paper, Company, Issuer, Parent Company, AP Arctic Paper Spółka Akcyjna with its registered office in Poznań,
Poland
Capital Group, Group, Arctic Paper Group, AP Group Capital Group comprised of Arctic Paper Spółka Akcyjna and its
subsidiaries as well as joint ventures
Arctic Paper Kostrzyn, AP Kostrzyn, APK Arctic Paper Kostrzyn Spółka Akcyjna with its registered office in
Kostrzyn nad Odrą, Poland
Arctic Paper Munkedals, AP Munkedals, APM Arctic Paper Munkedals AB with its registered office in Munkedal
Municipality, Västra County, Sweden
Arctic Paper Mochenwangen, AP Mochenwangen, APMW Arctic Paper Mochenwangen GmbH with its registered office in
Mochenwangen, Germany
Arctic Paper Grycksbo, AP Grycksbo, APG Arctic Paper Grycksbo AB with its registered office in Kungsvagen,
Grycksbo, Sweden
Paper Mills Arctic Paper Kostrzyn, Arctic Paper Munkedals, Arctic Paper
Grycksbo, Arctic Paper Mochenwangen (by the end of December
2015)
Arctic Paper Investment AB, API AB Arctic Paper Investment AB with its registered office in Göteborg,
Sweden
Arctic Paper Investment GmbH, API GmbH Arctic Paper Investment GmbH with its registered office in
Wolpertswende, Germany
Arctic Paper Verwaltungs Arctic Paper Verwaltungs GmbH with its registered office in
Wolpertswende, Germany
Arctic Paper Capital Group/ Consolidated quarterly report for Q3 2018 4 Introduction
Arctic Paper Immobilienverwaltungs Arctic Paper Immobilienverwaltungs GmbH & Co. KG with its
registered office in Wolpertswende, Germany
Kostrzyn Group Arctic Paper Kostrzyn Spółka Akcyjna with its registered office in
Kostrzyn nad Odrą and EC Kostrzyn Sp. z o.o. with its registered
office in Kostrzyn nad Odrą
Mochenwangen Group Arctic Paper Investment GmbH, Arctic Paper Mochenwangen
GmbH, Arctic Paper Verwaltungs GmbH, Arctic Paper
Immobilienverwaltungs GmbH & Co.KG (disclosed in this report as
discontinued operations, with exclusion of retirement benefits)
Grycksbo Group Arctic Paper Grycksbo AB and Arctic Paper Investment AB
Sales Offices Arctic Paper Papierhandels GmbH with its registered office in
Vienna (Austria);
Arctic Paper Benelux SA with its registered office in Oud-Haverlee
(Belgium);
Arctic Paper Danmark A/S with its registered office in Greve
(Denmark);
Arctic Paper France SA with its registered office in Paris (France);
Arctic Paper Deutschland GmbH with its registered office in
Hamburg, (Germany);
Arctic Paper Italia Srl with its registered office in Milan (Italy);
Arctic Paper Baltic States SIA with its registered offi ce in Riga
(Latvia);
Arctic Paper Norge AS with its registered office in Oslo (Norway);
Arctic Paper Polska Sp. z o.o. with its registered office in Warsaw
(Poland);
Arctic Paper España SL with its registered office in Barcelona
(Spain);
Arctic Paper Sverige AB with its registered office in Munkedal
(Sweden);
Arctic Paper Schweiz AG with its registered office in Zurich
(Switzerland);
Arctic Paper UK Ltd with its registered office in Caterham (UK);
Arctic Paper East Sp. z o.o. with its registered office in Kostrzyn
nad Odrą (Poland);
Arctic Paper Finance AB Arctic Paper Finance AB with its registered office in Göteborg
(Sweden);
Rottneros, Rottneros AB Rottneros AB with its registered office in Sunne (Sweden);
Rottneros Group, Rottneros AB Group Rottneros AB with its registered office in Sunne, Sweden;
Rottneros Bruk AB with its registered office in Sunne, Sweden;
Utansjo Bruk AB with its registered office in Harnösand, Sweden,
Vallviks Bruk AB with its registered office in Söderhamn, Sweden;

Arctic Paper Capital Group/ Consolidated quarterly report for Q3 2018 5 Introduction
Rottneros Packaging AB with its registered office in Stockholm,
Sweden; SIA Rottneros Baltic with its registered office in Ventspils,
Latvia
Pulp Mills Rottneros Bruk AB in Sunne, Sweden; Vallviks Bruk AB with its
registered office in Söderhamn, Sweden
Rottneros Purchasing Office SIA Rottneros Baltic with its registered office in Latvia
Office Kalltorp Kalltorp Kraft Handelsbolaget with its registered office in
Trollhattan, Sweden
Nemus Holding AB Nemus Holding AB with its registered office in Göteborg, Sweden
Thomas Onstad The Issuer's core shareholder, holding directly and indirectly over
50% of shares in Arctic Paper S.A.; a member of the Issuer's
Supervisory Board
Management Board, Issuer's Management Board,
Company's Management Board, Group’s Management
Board
Management Board of Arctic Paper S.A.
Supervisory Board, Issuer’s Supervisory Board,
Company’s Supervisory Board, Group’s Supervisory
Board, SB
Supervisory Board of Arctic Paper S.A.
GM, General Meeting, Issuer’s General Meeting,
Company’s General Meeting
General Meeting of Arctic Paper S.A.
EGM, Extraordinary General Meeting, Issuer's
Extraordinary General Meeting, Company's Extraordinary
General Meeting
Extraordinary General Meeting of Arctic Paper S.A.
Articles of Association, Issuer's Articles of Association,
Company’s Articles of Association
Articles of Association of Arctic Paper S.A.
SEZ Kostrzyńsko-Słubicka Special Economic Zone
Court of Registration District Court Poznań-Nowe Miasto i Wilda in Poznań
Warsaw Stock Exchange, WSE Giełda Papierów Wartościowych w Warszawie Spółka Akcyjna
KDPW, Depository Krajowy Depozyt Papierów Wartościowych Spółka Akcyjna with its
registered office in Warsaw
PFSA Polish Financial Supervision Authority
SFSA Swedish Financial Supervisory Authority, equivalent to PFSA
NASDAQ in Stockholm, Nasdaq Stock Exchange in Stockholm, Sweden
CEPI Confederation of European Paper Industries
EURO-GRAPH The European Association of Graphic Paper Producers
Eurostat European Statistical Office
GUS Central Statistical Office of Poland
NBSK Northern Bleached Softwood Kraft
BHKP Bleached Hardwood Kraft Pulp
Arctic Paper Capital Group/ Consolidated quarterly report for Q3 2018 6 Introduction
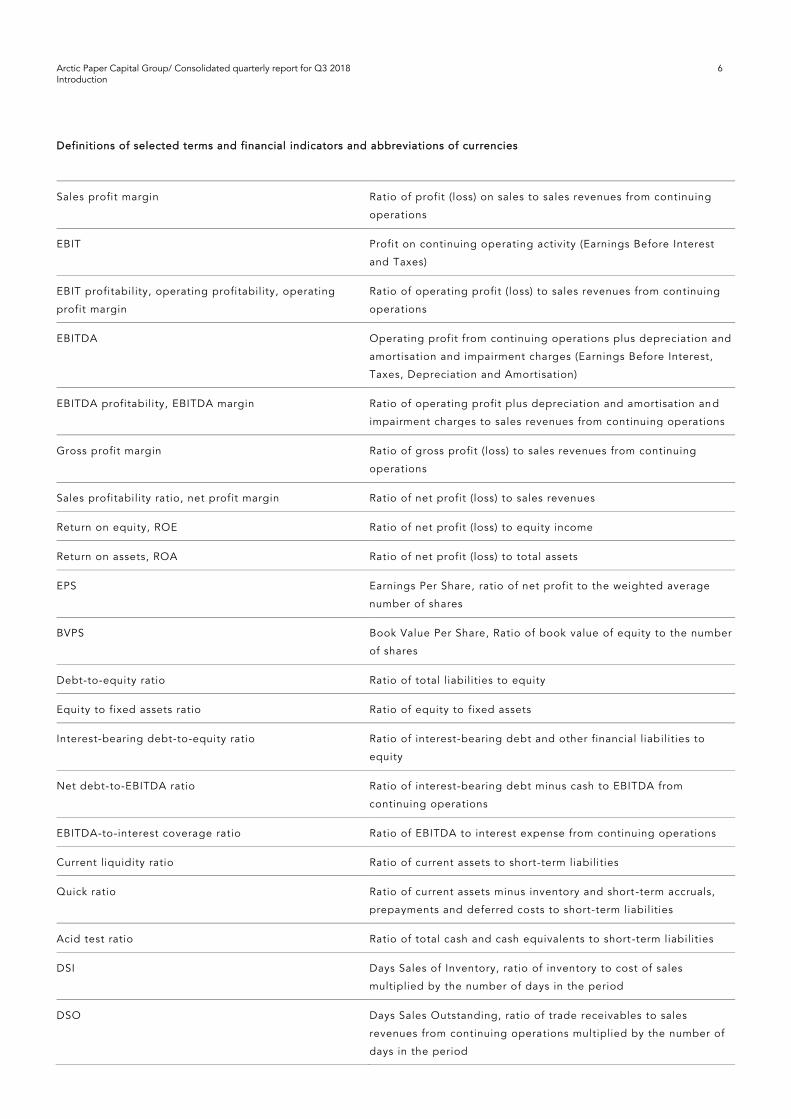
Definitions of selected terms and financial indicators and abbreviations of currencies
Sales profit margin Ratio of profit (loss) on sales to sales revenues from continuing
operations
EBIT Profit on continuing operating activity (Earnings Before Interest
and Taxes)
EBIT profitability, operating profitability, operating
profit margin
Ratio of operating profit (loss) to sales revenues from continuing
operations
EBITDA Operating profit from continuing operations plus depreciation and
amortisation and impairment charges (Earnings Before Interest,
Taxes, Depreciation and Amortisation)
EBITDA profitability, EBITDA margin Ratio of operating profit plus depreciation and amortisation and
impairment charges to sales revenues from continuing operations
Gross profit margin Ratio of gross profit (loss) to sales revenues from continuing
operations
Sales profitability ratio, net profit margin Ratio of net profit (loss) to sales revenues
Return on equity, ROE Ratio of net profit (loss) to equity income
Return on assets, ROA Ratio of net profit (loss) to total assets
EPS Earnings Per Share, ratio of net profit to the weighted average
number of shares
BVPS Book Value Per Share, Ratio of book value of equity to the number
of shares
Debt-to-equity ratio Ratio of total liabilities to equity
Equity to fixed assets ratio Ratio of equity to fixed assets
Interest-bearing debt-to-equity ratio Ratio of interest-bearing debt and other financial liabilities to
equity
Net debt-to-EBITDA ratio Ratio of interest-bearing debt minus cash to EBITDA from
continuing operations
EBITDA-to-interest coverage ratio Ratio of EBITDA to interest expense from continuing operations
Current liquidity ratio Ratio of current assets to short-term liabilities
Quick ratio Ratio of current assets minus inventory and short -term accruals,
prepayments and deferred costs to short-term liabilities
Acid test ratio Ratio of total cash and cash equivalents to short -term liabilities
DSI Days Sales of Inventory, ratio of inventory to cost of sales
multiplied by the number of days in the period
DSO Days Sales Outstanding, ratio of trade receivables to sales
revenues from continuing operations multiplied by the number of
days in the period
Arctic Paper Capital Group/ Consolidated quarterly report for Q3 2018 7 Introduction
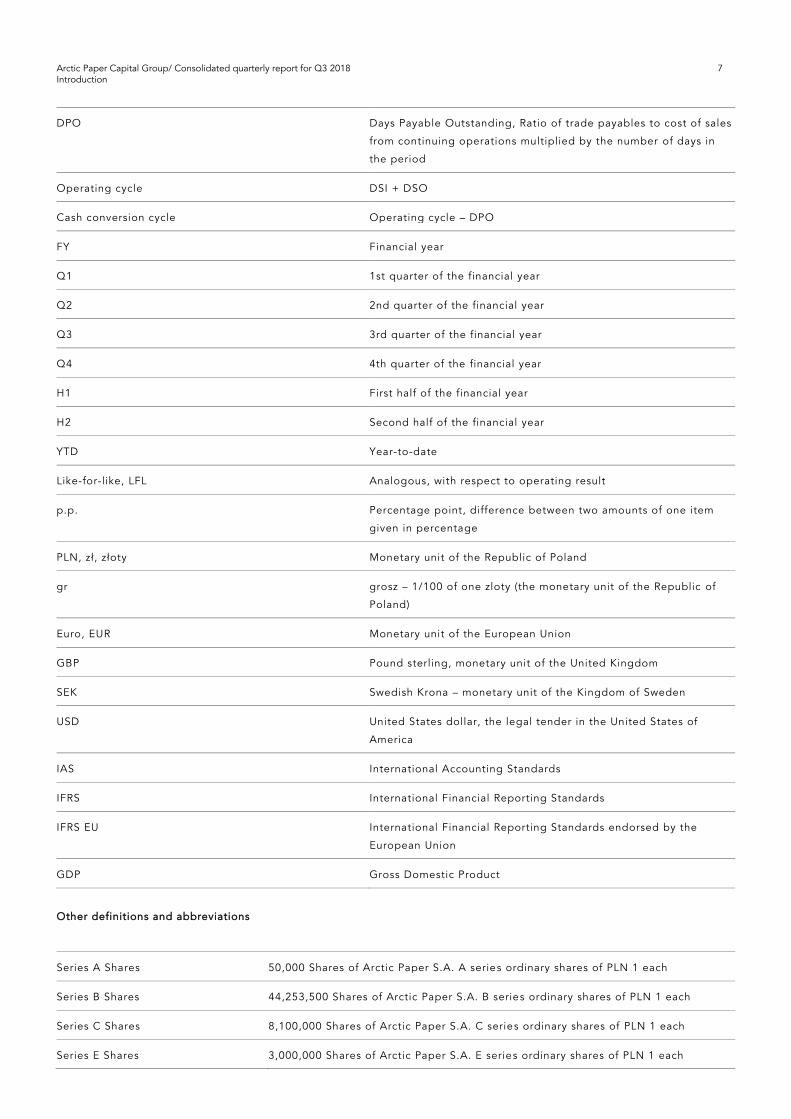
DPO Days Payable Outstanding, Ratio of trade payables to cost of sales
from continuing operations multiplied by the number of days in
the period
Operating cycle DSI + DSO
Cash conversion cycle Operating cycle – DPO
FY Financial year
Q1 1st quarter of the financial year
Q2 2nd quarter of the financial year
Q3 3rd quarter of the financial year
Q4 4th quarter of the financial year
H1 First half of the financial year
H2 Second half of the financial year
YTD Year-to-date
Like-for-like, LFL Analogous, with respect to operating result
p.p. Percentage point, difference between two amounts of one item
given in percentage
PLN, zł, złoty Monetary unit of the Republic of Poland
gr grosz – 1/100 of one zloty (the monetary unit of the Republic of
Poland)
Euro, EUR Monetary unit of the European Union
GBP Pound sterling, monetary unit of the United Kingdom
SEK Swedish Krona – monetary unit of the Kingdom of Sweden
USD United States dollar, the legal tender in the United States of
America
IAS International Accounting Standards
IFRS International Financial Reporting Standards
IFRS EU International Financial Reporting Standards endorsed by the
European Union
GDP Gross Domestic Product
Other definitions and abbreviations
Series A Shares 50,000 Shares of Arctic Paper S.A. A series ordinary shares of PLN 1 each
Series B Shares 44,253,500 Shares of Arctic Paper S.A. B series ordinary shares of PLN 1 each
Series C Shares 8,100,000 Shares of Arctic Paper S.A. C series ordinary shares of PLN 1 each
Series E Shares 3,000,000 Shares of Arctic Paper S.A. E series ordinary shares of PLN 1 each
Arctic Paper Capital Group/ Consolidated quarterly report for Q3 2018 8 Introduction
Series F Shares 13,884,283 Shares of Arctic Paper S.A. F series ordinary shares of the nominal value
of PLN 1 each
Shares, Issuer’s Shares Series A, Series B, Series C, Series E, and Series F Shares jointly
Forward looking statements
The information contained in this report which does not relate to historical facts relates to forward looking statements. Such
statements may, in particular, concern the Group’s strategy, business development, market projections, planned investment
outlays, and future revenues. Such statements may be identified by the use of expressions pertaining to the future su ch as,
e.g., “believe”, “think”, “expect”, “may”, “will” , “should”, “is expected”, “is assumed”, and any negations and
grammatical forms of these expressions or similar terms. The statements contained in this report concerning matters which
are not historical facts should be treated only as projections subject to risk and uncertainty. Forward-looking statements are
inevitably based on certain estimates and assumptions which, although our management finds them rational, are naturally
subject to known and unknown risks and uncertainties and other factors that could cause the actual results to differ
materially from the historical results or the projections. For this reason, we cannot assure that any of the events provided
for in the forward-looking statements will occur or, if they occur, about their impact on the Group’s operating activity or
financial situation. When evaluating the information presented in this report, one should not rely on such forward -looking
statements, which are stated only as at the date they are expressed. Unless legal regulations contain detailed requirements
in this respect, the Group shall not be obliged to update or verify those forward -looking statements in order to provide for
new developments or circumstances. Furthermore, the Group is not obliged to verify or to confirm the analysts’
expectations or estimates, except for those required by law.

Arctic Paper Capital Group/ Consolidated quarterly report for Q3 2018 9
Selected consolidated and standalone financial data
Arctic Paper Capital Group/ Consolidated quarterly report for Q3 2018 10
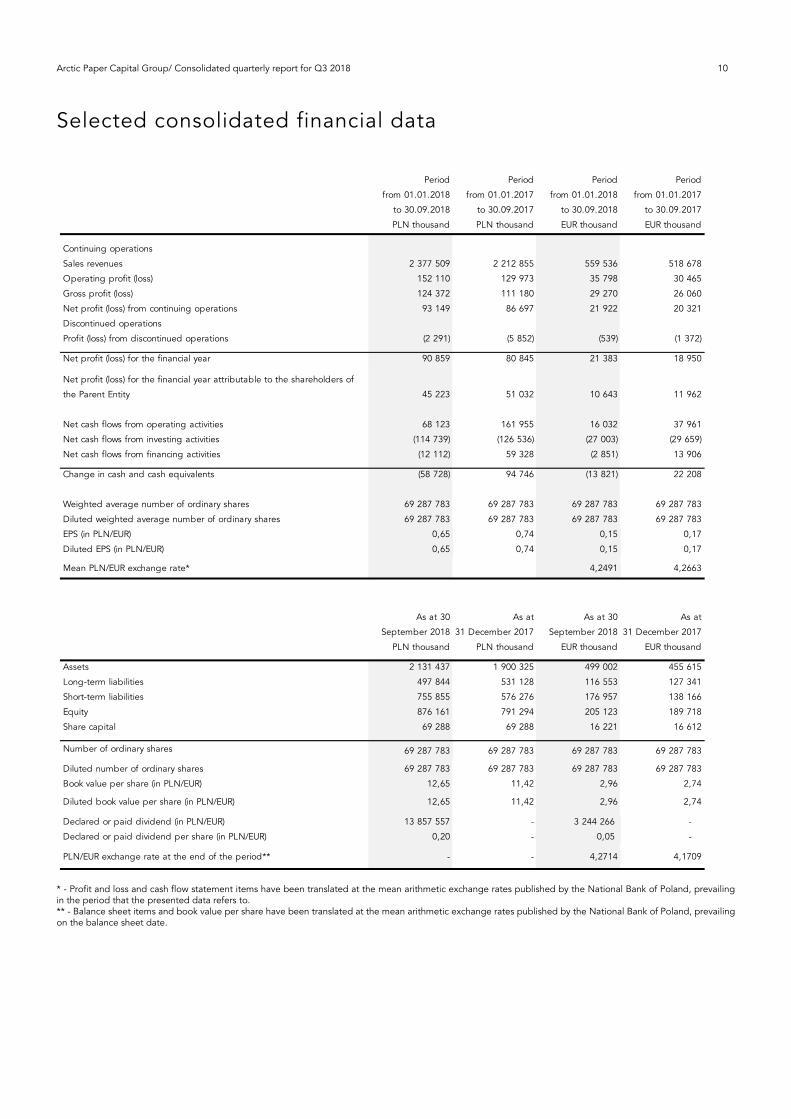
Selected consolidated financial data
* - Profit and loss and cash flow statement items have been translated at the mean arithmetic exchange rates published by the National Bank of Poland, prevailing in the period that the presented data refers to. ** - Balance sheet items and book value per share have been translated at the mean arithmetic exchange rates published by the National Bank of Poland, prevailing on the balance sheet date.
Period
from 01.01.2018
to 30.09.2018
Period
from 01.01.2017
to 30.09.2017
Period
from 01.01.2018
to 30.09.2018
Period
from 01.01.2017
to 30.09.2017
PLN thousand PLN thousand EUR thousand EUR thousand7
Continuing operations
Sales revenues 2 377 509 2 212 855 559 536 518 678
Operating profit (loss) 152 110 129 973 35 798 30 465
Gross profit (loss) 124 372 111 180 29 270 26 060
Net profit (loss) from continuing operations 93 149 86 697 21 922 20 321
Discontinued operations
(2 291) (5 852) (539) (1 372)
Net profit (loss) for the financial year 90 859 80 845 21 383 18 950
45 223 51 032 10 643 11 962
Net cash flows from operating activities 68 123 161 955 16 032 37 961
Net cash flows from investing activities (114 739) (126 536) (27 003) (29 659)
Net cash flows from financing activities (12 112) 59 328 (2 851) 13 906
Change in cash and cash equivalents (58 728) 94 746 (13 821) 22 208
Weighted average number of ordinary shares 69 287 783 69 287 783 69 287 783 69 287 783
Diluted weighted average number of ordinary shares 69 287 783 69 287 783 69 287 783 69 287 783
EPS (in PLN/EUR) 0,65 0,74 0,15 0,17
Diluted EPS (in PLN/EUR) 0,65 0,74 0,15 0,17
Mean PLN/EUR exchange rate* 4,2491 4,2663
As at 30
September 2018
As at
31 December 2017
As at 30
September 2018
As at
31 December 2017
PLN thousand PLN thousand EUR thousand EUR thousand
Assets 2 131 437 1 900 325 499 002 455 615
Long-term liabilities 497 844 531 128 116 553 127 341
Short-term liabilities 755 855 576 276 176 957 138 166
Equity 876 161 791 294 205 123 189 718
Share capital 69 288 69 288 16 221 16 612
Number of ordinary shares 69 287 783 69 287 783 69 287 783 69 287 783
Diluted number of ordinary shares 69 287 783 69 287 783 69 287 783 69 287 783
Book value per share (in PLN/EUR) 12,65 11,42 2,96 2,74
Diluted book value per share (in PLN/EUR) 12,65 11,42 2,96 2,74
Declared or paid dividend (in PLN/EUR) 13 857 557 - 3 244 266 -
Declared or paid dividend per share (in PLN/EUR) 0,20 - 0,05 -
PLN/EUR exchange rate at the end of the period** - - 4,2714 4,1709
Profit (loss) from discontinued operations
Net profit (loss) for the financial year attributable to the shareholders of
the Parent Entity
Arctic Paper Capital Group/ Consolidated quarterly report for Q3 2018 11
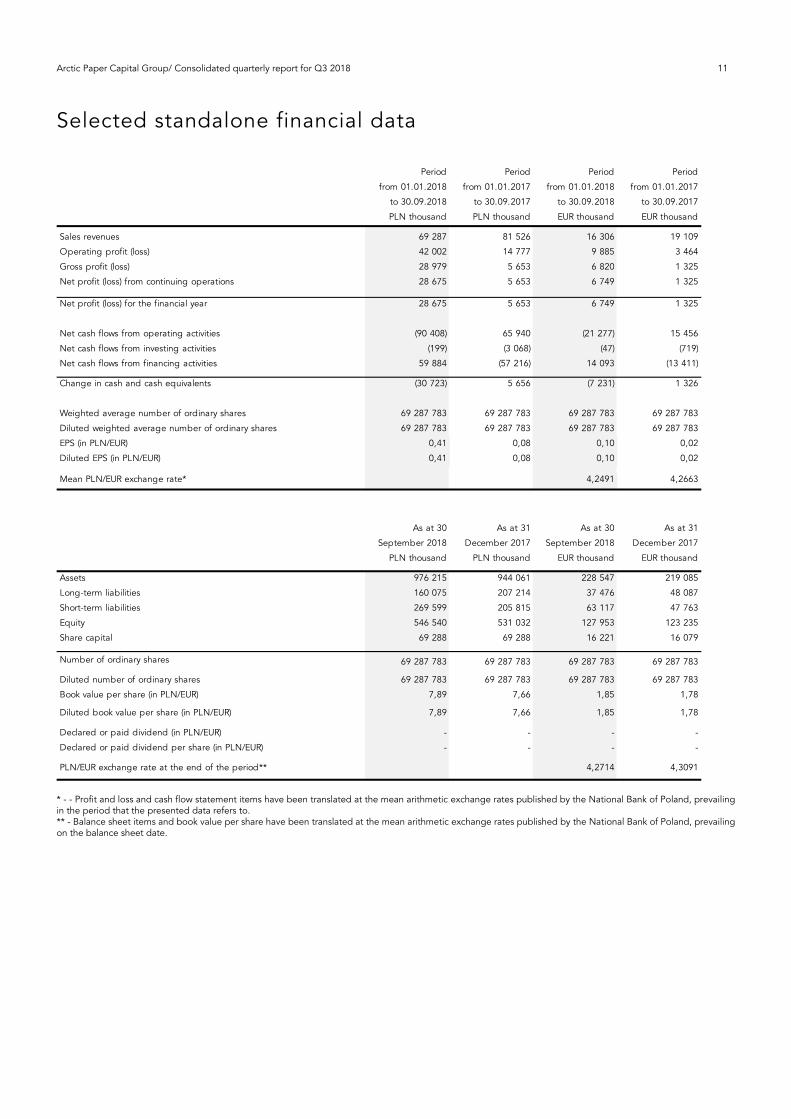
Selected standalone financial data
* - - Profit and loss and cash flow statement items have been translated at the mean arithmetic exchange rates published by the National Bank of Poland, prevailing in the period that the presented data refers to. ** - Balance sheet items and book value per share have been translated at the mean arithmetic exchange rates published by the National Bank of Poland, prevailing on the balance sheet date.
Period
from 01.01.2018
to 30.09.2018
Period
from 01.01.2017
to 30.09.2017
Period
from 01.01.2018
to 30.09.2018
Period
from 01.01.2017
to 30.09.2017
PLN thousand PLN thousand EUR thousand EUR thousand7
Sales revenues 69 287 81 526 16 306 19 109
Operating profit (loss) 42 002 14 777 9 885 3 464
Gross profit (loss) 28 979 5 653 6 820 1 325
Net profit (loss) from continuing operations 28 675 5 653 6 749 1 325
Net profit (loss) for the financial year 28 675 5 653 6 749 1 325
Net cash flows from operating activities (90 408) 65 940 (21 277) 15 456
Net cash flows from investing activities (199) (3 068) (47) (719)
Net cash flows from financing activities 59 884 (57 216) 14 093 (13 411)
Change in cash and cash equivalents (30 723) 5 656 (7 231) 1 326
Weighted average number of ordinary shares 69 287 783 69 287 783 69 287 783 69 287 783
Diluted weighted average number of ordinary shares 69 287 783 69 287 783 69 287 783 69 287 783
EPS (in PLN/EUR) 0,41 0,08 0,10 0,02
Diluted EPS (in PLN/EUR) 0,41 0,08 0,10 0,02
Mean PLN/EUR exchange rate* 4,2491 4,2663
As at 30
September 2018
As at 31
December 2017
As at 30
September 2018
As at 31
December 2017
PLN thousand PLN thousand EUR thousand EUR thousand
Assets 976 215 944 061 228 547 219 085
Long-term liabilities 160 075 207 214 37 476 48 087
Short-term liabilities 269 599 205 815 63 117 47 763
Equity 546 540 531 032 127 953 123 235
Share capital 69 288 69 288 16 221 16 079
Number of ordinary shares 69 287 783 69 287 783 69 287 783 69 287 783
Diluted number of ordinary shares 69 287 783 69 287 783 69 287 783 69 287 783
Book value per share (in PLN/EUR) 7,89 7,66 1,85 1,78
Diluted book value per share (in PLN/EUR) 7,89 7,66 1,85 1,78
Declared or paid dividend (in PLN/EUR) - - - -
Declared or paid dividend per share (in PLN/EUR) - - - -
PLN/EUR exchange rate at the end of the period** 4,2714 4,3091

Arctic Paper Capital Group/ Consolidated quarterly report for Q3 2018 12 Management Board’s Report
Management Board’s Report from operations of the Arctic
Paper Capital Group and of Arctic Paper S.A.
to the report for Q3 2018
Arctic Paper Capital Group/ Consolidated quarterly report for Q3 2018 13 Management Board’s Report
Description of the business of the Arctic Paper Group
General information
The Arctic Paper Group is a leading European producer in terms of production volume of bulky book paper, offering a
broad range of products in the segment and one of the leading producers of high -quality graphic paper in Europe. The
Group produces numerous types of uncoated and coated wood-free paper as well as wood-containing uncoated paper for
printing houses, paper distributors, book and magazine publishing houses and the advertising industry. In connection with
acquisition of the Rottneros Group in December 2012, the Group's assortment was expand ed with the production of pulp.
As on the day hereof, the Arctic Paper Group employs app. 1,700 people in its Paper Mills, Pulp Mills, companies dealing in
paper distribution and sales, and a company dealing in timber procurement for pulp production. Our p aper mills are
located in Poland and Sweden and have total production capacity of more than 700,000 metric tons of paper per year. The
Pulp Mills are located in Sweden and have total production capacity of 400,000 tons of pulp per year. The Group has
fourteen Sales Offices which handle distribution and marketing of products offered by the Group providing access to all
European markets, including Central and Eastern Europe. Our consolidated sales revenues for three quarters of 2018
amounted to PLN 2,378 mill ion.
Arctic Paper S.A. is a holding company set up in April 2008. The Parent Entity is entered in the register of entrepreneurs of
the National Court Register maintained by the District Court in Poznań – Nowe Miasto i Wilda, 8th Commercial Division of
the National Court Register, under KRS number 0000306944. The Parent Entity holds statistical number REGON 080262255.
The Company has a foreign branch in Göteborg, Sweden.
Group Profile
The principal business of the Arctic Paper Group is paper production and sales.
The Group’s additional business, partly subordinate to paper production, covers:
Production and sales of pulp,
Generation of electricity,
Transmission of electricity,
Electricity distribution,
Heat production,
Heat distribution,
Logistics services,
Paper distribution.
Our production facilities
As on 30 September 2018 as well as on the day hereof, the Group owned the following Paper Mills:
— the Paper Mill in Kostrzyn nad Odrą (Poland) has the production capacity of about 280,000 tons per year and mainly
produces uncoated wood-free paper for general printing use such as printing books, brochures and forms, and for
producing envelopes and other paper products;
— the Paper Mill in Munkedal (Sweden) has the production capacity of about 160,000 tons per y ear and mainly produces
fine uncoated wood-free paper used primarily for printing books and high-quality brochures;
— the Paper Mill in Grycksbo (Sweden) has the production capacity of about 250,000 tons per year and produces coated
wood-free paper used for printing maps, books, magazines, posters and printing of advertising materials.
Arctic Paper Capital Group/ Consolidated quarterly report for Q3 2018 14 Management Board’s Report
As on 30 September 2018 as well as on the day hereof, the Group owned the following Pulp Mills:
— The pulp mill in Rottneros (Sweden) has production capacity of about 160,000 tons annually and produces mainly two
types of mechanical pulp: groundwood and chemi thermo mechanical pulp (CTMP);
— the Pulp Mill in Vallvik (Sweden) has the annual production capacity of about 240,000 tons and produces two types of
long-fibre sulphate pulp: fully bleached sulphate pulp and unbleached sulphate pulp. The most of Vallvik Pulp Mill
production is known as NBSK pulp. The unbleached sulphate pulp produced by the mill is characterised with a high level
of purity. The high quality of the pulp which had been developed for years, made V allvik a leader in supplies of such
pulp. The pulp is used among others to produce transformers and in cable industry.
Our products
The product assortment of the Arctic Paper Group covers:
Uncoated wood-free paper;
Coated wood-free paper;
Uncoated wood-containing paper;
Sulphate pulp;
Mechanical fibre pulp.
A detailed description of the Group’s assortment is included in the consolid ated annual report for 2017.
Capital Group structure
The Arctic Paper Capital Group comprises Arctic Paper S.A., as the Pa rent Entity, and its subsidiaries, as well as joint
ventures. Since 23 October 2009, Arctic Paper S.A. has been listed on the primary market of the Warsaw Stock Exchange
and since 20 December 2012 in the NASDAQ stock exchange in Stockholm. The Group operates through its Paper Mills and
Pulp Mills and its subsidiary producing packaging as well as its sales Offices and Procurement Offices.
Details on the organisation of the Arctic Paper S.A. Capital Group along with identification of the consolidated entitie s are
specified in note 2 in the abbreviated consolidated financial statements, further below in this quarterly report.
Changes in the capital structure of the Arctic Paper Group
In Q3 2018, no changes in the capital structure of the Arctic Paper Group oc curred.
Shareholding structure
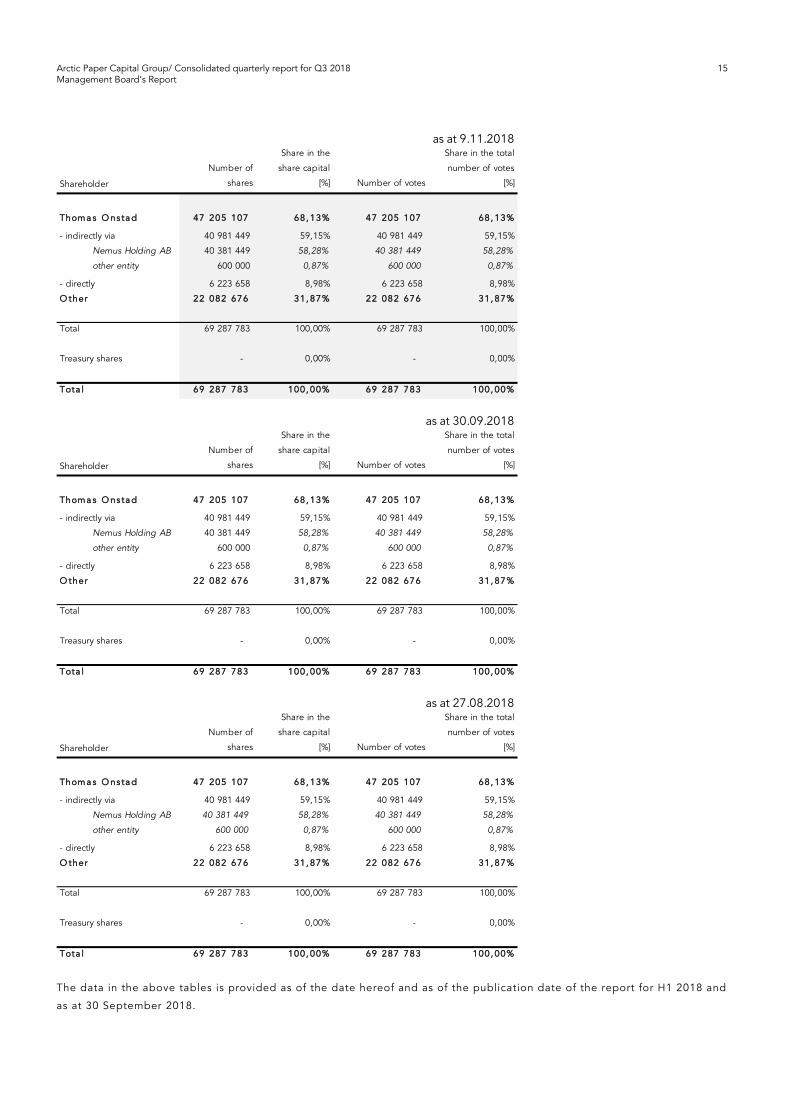
Nemus Holding AB, a company under Swedish law (a company owned indirectly by Mr Thomas Onstad), is the majority
shareholder of Arctic Paper S.A., holding (as at 30 September 2018) 40,381,449 shares of our Company, which co nstitutes
58.28% of its share capital and corresponds to 58.28% of the total number of votes at General Meetings. Thus Nemus
Holding AB is the parent entity of the Issuer.
Additionally, Mr Thomas Onstad, an indirect shareholder of Nemus Holding AB, holds directly 6,223,658 shares
representing 8.98% of the total number of shares in the Company, and via another entity – 600,000 shares accounting for
0.87% of the total number of shares of the Issuer. Mr Thomas Onstad’s total direct and indirect holding in the capital of
Arctic Paper S.A. as at 30 September 2018 was 68.13% and has not changed until the date hereof.
Arctic Paper Capital Group/ Consolidated quarterly report for Q3 2018 15 Management Board’s Report
The data in the above tables is provided as of the date hereof and as of the publication date of the report for H1 2018 and
as at 30 September 2018.
Number of
shares
Share in the
share capital
[%] Number of votes
Share in the total
number of votes
[%]
47 205 107 68, 13% 47 205 107 68, 13%
40 981 449 59,15% 40 981 449 59,15%
Nemus Holding AB 40 381 449 58,28% 40 381 449 58,28%
other entity 600 000 0,87% 600 000 0,87%
6 223 658 8,98% 6 223 658 8,98%
O ther 22 082 676 31, 87% 22 082 676 31, 87%
Total 69 287 783 100,00% 69 287 783 100,00%
Treasury shares - 0,00% - 0,00%
Tota l 69 287 783 100, 00% 69 287 783 100, 00%
as at 9.11.2018
Shareholder
Thom a s O ns ta d
- indirectly via
- directly
Number of
shares
Share in the
share capital
[%] Number of votes
Share in the total
number of votes
[%]
47 205 107 68, 13% 47 205 107 68, 13%
40 981 449 59,15% 40 981 449 59,15%
Nemus Holding AB 40 381 449 58,28% 40 381 449 58,28%
other entity 600 000 0,87% 600 000 0,87%
6 223 658 8,98% 6 223 658 8,98%
O ther 22 082 676 31, 87% 22 082 676 31, 87%
Total 69 287 783 100,00% 69 287 783 100,00%
Treasury shares - 0,00% - 0,00%
Tota l 69 287 783 100, 00% 69 287 783 100, 00%
as at 30.09.2018
Shareholder
Thom a s O ns ta d
- indirectly via
- directly
Number of
shares
Share in the
share capital
[%] Number of votes
Share in the total
number of votes
[%]
47 205 107 68, 13% 47 205 107 68, 13%
40 981 449 59,15% 40 981 449 59,15%
Nemus Holding AB 40 381 449 58,28% 40 381 449 58,28%
other entity 600 000 0,87% 600 000 0,87%
6 223 658 8,98% 6 223 658 8,98%
O ther 22 082 676 31, 87% 22 082 676 31, 87%
Total 69 287 783 100,00% 69 287 783 100,00%
Treasury shares - 0,00% - 0,00%
Tota l 69 287 783 100, 00% 69 287 783 100, 00%
as at 27.08.2018
- directly
Shareholder
Thom a s O ns ta d
- indirectly via

Arctic Paper Capital Group/ Consolidated quarterly report for Q3 2018 16 Management Board’s Report
Summary of consolidated financial results
Selected items of the consolidated profit and loss statement
Due to an adjustment of a previous years’ error concerning verification of periods of economic useful lives of tangible fixed
assets and intangible assets for Rottneros companies (described in note 6.5 of these interim abbreviated consolidated
financial statements), the above data for Q3 2017 and YTD 2017 is not the data disclosed in the consolidated report for Q3
2017 of the Arctic Paper Group.
Additionally, a change was made of presentation of the results realised on term transactions hedging the pulp sale price in
2018. The results were transferred from other operating costs to revenues on pulp sales. In view of the above, the data for
Q2 2018 is not the data disclosed in the Semi-annual Consolidated Report of the Arctic Paper Group for 2018. The above
change did not affect EBIT, EBITDA and net profit.
PLN thousand
Q3
2018
Q2
2018
Q3
2017
YTD
2018
YTD
2017
Change %
Q3 2018/
Q2 2018
Change %
Q3 2018/
Q3 2017
Change %
YTD 2018/
YTD 2017
Sa les revenues 812 371 781 013 735 866 2 377 509 2 212 855 4, 0 10, 4 7, 4
of which:
Sales of paper 591 808 558 761 542 344 1 724 190 1 630 568 5,9 9,1 5,7
Sales of pulp 220 563 222 252 193 522 653 320 582 287 (0,8) 14,0 12,2
Profit / (loss) on sales 158 230 146 658 143 580 452 733 449 261 7,9 10,2 0,8
% of sales revenues 19,48 18,78 19,51 19,04 20,30 0,7 p.p. (0,0) p.p. (1,3) p.p.
Selling and distribution costs (85 035) (84 046) (85 739) (253 933) (263 513) 1,2 (0,8) (3,6)
Administrative expenses (20 693) (19 186) (19 714) (60 997) (68 453) 7,9 5,0 (10,9)
Other operating income 14 993 7 176 10 430 33 987 32 708 108,9 43,8 3,9
Other operating expenses (8 037) (5 148) (5 271) (19 679) (20 030) 56,1 52,5 (1,8)
EB IT 59 459 45 454 43 285 152 110 129 973 30, 8 37, 4 17, 0
% of sales revenues 7,32 5,82 5,88 6,40 5,87 1,5 p.p. 1,4 p.p. 0,5 p.p.
EB ITD A 82 524 66 770 70 780 220 481 210 838 23, 6 16, 6 4, 6
% of sales revenues 10,16 8,55 9,62 9,27 9,53 1,6 p.p. 0,5 p.p. (0,3) p.p.
Financial income 299 371 2 253 1 234 7 618 (19,3) (86,7) (83,8)
Financial expenses (7 017) (14 136) (9 450) (28 972) (26 411) (50,4) (25,8) 9,7
Gross p rof it (los s ) 52 741 31 688 36 088 124 372 111 180 66, 4 46, 1 11, 9
Income tax (9 553) (11 125) (6 732) (31 222) (24 484) (14,1) 41,9 27,5
43 188 20 563 29 355 93 149 86 697 110, 0 47, 1 7, 4
% of sales revenues 5,32 2,63 3,99 3,92 3,92 2,7 p.p. 1,3 p.p. 0,0 p.p.
Discontinued operations
(452) (934) (1 849) (2 291) (5 852) (51, 6) (75, 5 ) (60, 9)
% of sales revenues (0,06) (0,12) (0,25) (0,10) (0,26) 0,1 p.p. 0,2 p.p. 0,2 p.p.
Net p rof it /(loss ) 42 736 19 629 27 507 90 859 80 845 117, 7 55, 4 12, 4
% of sales revenues 5,26 2,51 3,74 3,82 3,65 2,7 p.p. 1,5 p.p. 0,2 p.p.
25 321 4 069 19 506 45 223 51 032 522,4 29,8 (11,4)
Net profit / (loss) attributable to the shareholders of the
Parent Entity
Net p rof it /(loss ) f rom cont inu ing op era t ions
Net p rof it / (los s ) f rom d is cont inued

Arctic Paper Capital Group/ Consolidated quarterly report for Q3 2018 17 Management Board’s Report
Commentary of the President of the Management Board Per Skoglund on the results of Q3 2 018
For the third quarter, Arctic Paper Group reached a turnover of PLN 812,4 million (compared to PLN 735,9 million in Q3,
2017). EBITDA rose by 16,6 percent to PLN 82,5 million (70,8 million), making the quarter the second best on consolidated
level in the Group´s history. The paper segment increased its revenue to PLN 591,8 million (542,3 million) while EBITDA
decreased to PLN 27,5 million (38,9 million).
For the paper segment, our efforts are starting to show results. The combination of a better product mix and price increases
have partially, but still not fully, compensated for the increased pulp costs. Further price increases are being implemented
during Q4 and we are working hard to recover our margins. Since summer, pulp prices have stabilised on a v ery high level.
Our paper production amounted in Q3 to 161,000 tonnes, comparable to last year. With p ulp prices on a record high, and
the subsequent need to raise graphical paper prices, the European graphical paper market demand/volume has dropped
significantly during the second and third quarters. However, this has been compensated by increased market s hare and
sales in the North American market.
The challenging market conditions once again stresses the value of combining our paper operations with our 51 percent
ownership in the pulp producer Rottneros AB, which reached in Q3 2018 a turnover of SEK 601 million (SEK 472 million in
Q3 2017) and a record EBITDA of SEK 136 million (66 million). The full report is available at
http://www.rottneros.com/investors/financial-reports/
We are still in the process of implementing our new strategy – A Future in Paper. We feel confident that the actions we are
undertaking leads us in the right direction towards our long term financial goal.
Revenues
In Q3 2018, the consolidated sales revenues amounted to PLN 812,371 thousand (sales of paper: PLN 591,808 thousand),
pulp sales: PLN 220,563 thousand), as compared to PLN 735,866 thousand (sales of paper: PLN 542,344 thousand), pulp
sales: PLN 193,522 thousand), in the equivalent period of the previous year. That means a growth by PLN 76,505 thousand
(growth of paper sales by PLN 49,464 thousand, growth of pulp sales by PLN 27,041 thousand) and by +10.4% respectively
(paper sales: +9.1%, pulp sales: +14.0%).
In the first nine months of 2018, the sales revenues amounted to PLN 2,377,509 thousand (sales of paper: PLN 1,724,190
thousand), pulp sales: PLN 653,320 thousand), as compared to PLN 2,212,855 thousand (sales of paper: PLN 1,630,568
thousand pulp sales: PLN 582,287 thousand), generated in the equivalent period of the previous year. That means a growth
of revenues by PLN 164,654 thousand (growth of paper sales by PLN PLN 93,622 thousand), growth of pulp sales by PLN
PLN 71,033 thousand), and by +7.4% respectively (paper sales: +5.7%, pulp sales: +12.2%).
Paper sales volume in Q3 2018 amounted to 162 thousand tons compared to 164 thousand tons in the same period of the
previous year. The change represents a decrease of 2 thousand tons and by -1.2% respectively. Pulp sales volume in Q3
2018 amounted to 88 thousand tons compared to 88 thousand tons in the same period of the previous year.
Paper sales volume in the first three quarters of 2018 amounted to 490 thousand tons compared to 499 thousand tons in
the same period of the previous year. The change represents a decrease of 9 thousand tons and by -1.8% respectively. Pulp
sales volume in the first three quarters of 2018 amounted to 275 thousand tons compared to 273 thousand tons in the same
period of the previous year. The change represents an increase of 2 thousand tons and by +0.7% respectively.
Profit on sales, costs of sales, selling and distribution costs, and administrative expenses
In Q3 2018, profit on sales amounted to PLN 158,230 thousand This resu lt was by 10.2% higher than in the corresponding
period of the previous year. Sales profit margin in the current quarter stood at 19.48% compared to 19.51% ( -0.0 p.p.) in
the equivalent period of the previous year. The core reason for the increased profit on sales in Q3 2018 versus the
equivalent period of the previous year was a faster growth of sales revenues primarily due to growing PLN denominated
sales prices than the growth of internal selling costs due mainly to a growth of consumption costs of pulp and energy.
For three quarters of 2018, profit on sales amounted to PLN 452,733 thousand. This result was by 0.8% higher than in the
corresponding period of the previous year. Sales profit margin in the period stood at 19.04% compared to 20.30% ( -1.3
p.p.) in the equivalent period of the previous year. The core reasons for the increased profit on sales in 9 months of 2018
versus the equivalent period of the previous year were faster growth of sales revenues primarily due to growing PLN

Arctic Paper Capital Group/ Consolidated quarterly report for Q3 2018 18 Management Board’s Report
denominated sales prices than the growth of internal selling costs due mainly to a growth of consumption costs of pulp and
energy.
In Q3 2018, the selling and distribution costs amounted to PLN 85,035 thousand which was a decrease by 0.8% compared
to the costs incurred in Q3 2017.
In three quarters of 2018, the selling and distribution costs amounted to PLN 253,933 thousand which was a decrease by
3.6% compared to the costs incurred in the equivalent period of 2017. The selling costs include primarily costs of transport
of finished products to counterparties.
In Q3 2018, the administrative expenses amounted to PLN 20,693 thousand as compared to PLN 19,714 thousand in the
equivalent period of 2017 (growth by 5.0%). The overheads are composed primarily of the costs of advisory a nd
administrative services in the Group.
In three quarters of 2018, the administrative expenses amounted to PLN 60,997 thousand as compared to PLN 68,453
thousand in the equivalent period of 2017 which was a growth by 10.9%. The main reason of the decrease were lower costs
related to consulting services rendered to the Group by third parties.
Other operating income and expenses
Other operating income amounted to PLN 14,993 thousand in Q3 2018 as compared to PLN 10,430 thousand in Q3 2017.
Other operating income amounted to PLN 33,987 thousand for three quarters of 2018 which was an increase as compared
to the equivalent period of the previous year (by PLN 1,279 thousand).
Other operating income consisted mainly of revenues from heat and e lectricity sales as well as sales revenues from other
materials and CO2 emission rights. The growth of other operating revenues in the current period was primarily due to sales
of rights for CO2 emissions in Q1 and Q3 2018.
In Q3 2018, the other operating expenses amounted to PLN 8,037 thousand as compared to PLN 5,271 thousand in Q3
2017.
Other operating expenses amounted to PLN 19,679 thousand for three quarters of 2018 which was a decrease as compared
to the equivalent period of the previous year by PLN 351 thousand.
The other operating expenses comprised mainly the costs of electricity and heat sales as well as the costs of other materials
sold.
Financial income and financial expenses
Financial income in Q3 2018 amounted to PLN 299 thousand as compared to PLN 2,253 thousand incurred in Q3 2017.
In the first nine months 2018, the financial income amounted to PLN 1,234 thousand while in the equivalent period in 2017
it was PLN 7,618 thousand. The high value of financial revenues for three quarters of 201 7 results from the net presentation
of FX differences or as a surplus of FX gains over FX losses (financial income) or as a surplus of FX losses over FX gains
(financial expenses). The surplus of FX gains over FX losses for the three quarters of 2017 amoun ted to PLN 4,356 thousand.
In Q3 2018, financial expenses amounted to PLN 7,017 thousand as compared to PLN 9,450 thousand incurred in Q3 2017.
Financial expenses for three quarters of 2018 amounted to PLN 28,972 thousand as compared to PLN 26,411 thousan d
incurred for three quarters of 2017. The higher financial expenses for three quarters of 2018 were primarily due to FX losses
recorded as financial expenses.
Income tax
In Q3 2018, income tax amounted to PLN
-9,553 thousand while in the equivalent period in 2017 it was PLN -6,732 thousand.
The current portion of income tax in the analysed quarter of 2018 amounted to PLN -1,234 thousand while the deferred
portion to PLN -8,319 thousand. In Q3 the previous year, the amount was PLN +318 thousand and PLN -7,050 thousand
respectively.
Arctic Paper Capital Group/ Consolidated quarterly report for Q3 2018 19 Management Board’s Report
For three quarters of 2018, income tax amounted to PLN -31,222 thousand while in the equivalent period in 2017 it was
PLN -24,484 thousand.
The current portion of income tax in the analysed three quarters of 2018 amounted to PL N -4,351 thousand while the
deferred portion to PLN -26,871 thousand. In the equivalent quarters of the previous year, the amount was PLN -2,743
thousand and PLN -21,741 thousand respectively.
Net profit / (loss) from discontinued operations
Net profit/loss on discontinued operations covers the results of AP Mochenwangen and of the companies set up to acquire
the Paper Mill. As the Management Board of Arctic Paper S.A. remains ready to sell the Paper Mill, its business has been
treated as discontinued. In the first three quarters of 2018, the loss on discontinued operations amounted to PLN 2,291
thousand (for 3 quarters of 2017: PLN 5,852 thousand).

Arctic Paper Capital Group/ Consolidated quarterly report for Q3 2018 20 Management Board’s Report
Profitability analysis
In Q3 2018, the result on continuing operations amounted to PLN 59,459 thousand as compared to PLN 43,285 thousand in
the equivalent period of the previous year. The changes resulted in a growth of operational profit margin from +5.9% in the
Q3 2017 to +7.3% in Q3 the current year.
For three quarters of 2018, the result on continuing operations amounted to PLN 152,110 tho usand as compared to PLN
129,973 thousand in the equivalent period of the previous year. The changes resulted in a growth of operational profit
margin from +5.9% for three quarters of 2017 to +6.4% for three quarters of the current year.
EBITDA in Q3 2018 was PLN 82,524 thousand while in the equivalent period in 2017 it was PLN 70,780 thousand. In the
reporting period, the EBITDA margin was 10.2% compared to 9.6% in the equivalent period of 2017.
EBITDA for three quarters of 2018 was PLN 220,481 thousand while in the equivalent period in 2017 it was PLN 210,838
thousand. In the reporting period, the EBITDA margin was 9.3% compared to 9.5% in the equivalent period of 2017.
In the current quarter of 2018, net profit amounted to PLN 42,736 thousand as compared to the net profit of PLN 27,507
thousand in Q3 2017.
In three quarters of 2018, net profit amounted to PLN 90,859 thousand as compared to the net profit of PLN 80,845
thousand in three quarters of 2017.
In Q3 2018, return on equity was 4.9%, (10.4% for three quarters of 2018) while in Q3 2017 it was 3.2% (9.5% for three
quarters of 2017).
In Q3 of 2018, return on equity was 2.0%, (4.3% for three quarters of 2018) while in the third quarter of 2017 it was 1 .4%
(4.1% for three quarters of 2017).
PLN thousand
Q3
2018
Q2
2018
Q3
2017
YTD
2018
YTD
2017
Change %
Q3 2018/
Q2 2018
Change %
Q3 2018/
Q3 2017
Change %
YTD 2018/
YTD 2017
Profit on sales 158 230 146 658 143 580 452 733 449 261 7,9 10,2 0,8
% of sales revenues 19,48 18,78 19,51 19,04 20,30 0,7 p.p. (0,0) p.p. (1,3) p.p.
EB ITD A 82 524 66 770 70 780 220 481 210 838 23, 6 16, 6 4, 6
% of sales revenues 10,16 8,55 9,62 9,27 9,53 1,6 p.p. 0,5 p.p. (0,3) p.p.
EB IT 59 459 45 454 43 285 152 110 129 973 30, 8 37, 4 17, 0
% of sales revenues 7,32 5,82 5,88 6,40 5,87 1,5 p.p. 1,4 p.p. 0,5 p.p.
43 188 20 563 29 355 93 149 86 697 110, 0 47, 1 7, 4
% of sales revenues 5,32 2,63 3,99 3,92 3,92 2,7 p.p. 1,3 p.p. 0,0 p.p.
(452) (934) (1 849) (2 291) (5 852) (51, 6 ) (75, 5 ) (60, 9 )
% of sales revenues (0,06) (0,12) (0,25) (0,10) (0,26) 0,1 p.p. 0,2 p.p. 0,2 p.p.
Net p rof it /(loss ) 42 736 19 629 27 507 90 859 80 845 117, 7 55, 4 12, 4
% of sales revenues 5,26 2,51 3,74 3,82 3,65 2,7 p.p. 1,5 p.p. 0,2 p.p.
Return on equity / ROE (%) 4,9 2,3 3,2 10,4 9,5 2,5 p.p. 1,6 p.p. 0,8 p.p.
Return on assets / ROA (%) 2,0 1,0 1,4 4,3 4,1 1,0 p.p. 0,6 p.p. 0,2 p.p.
Net p rof it /(loss ) f rom cont inuing
op era t ions
Net p rof it / (loss ) f rom
d iscont inued op era t ions
Arctic Paper Capital Group/ Consolidated quarterly report for Q3 2018 21 Management Board’s Report
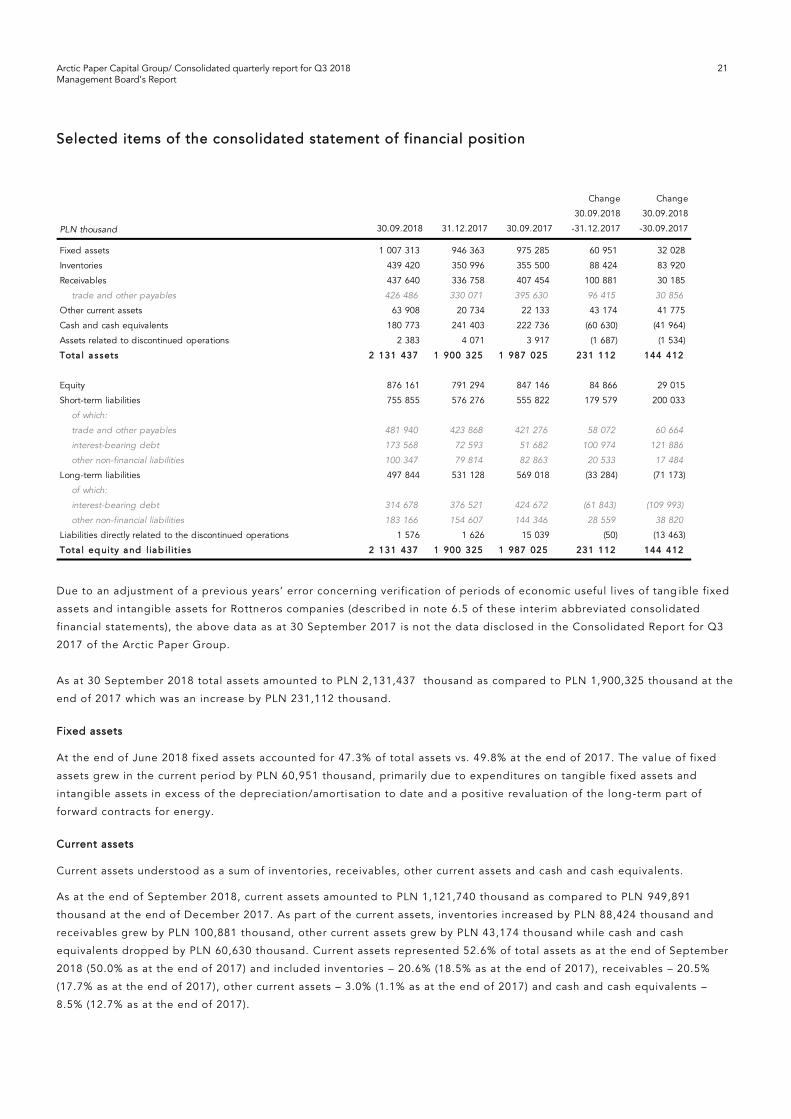
Selected items of the consolidated statement of financial position
Due to an adjustment of a previous years’ error concerning verification of periods of economic useful lives of tang ible fixed
assets and intangible assets for Rottneros companies (described in note 6.5 of these interim abbreviated consolidated
financial statements), the above data as at 30 September 2017 is not the data disclosed in the Consolidated Report for Q3
2017 of the Arctic Paper Group.
As at 30 September 2018 total assets amounted to PLN 2,131,437 thousand as compared to PLN 1,900,325 thousand at the
end of 2017 which was an increase by PLN 231,112 thousand.
Fixed assets
At the end of June 2018 fixed assets accounted for 47.3% of total assets vs. 49.8% at the end of 2017. The val ue of fixed
assets grew in the current period by PLN 60,951 thousand, primarily due to expenditures on tangible fixed assets and
intangible assets in excess of the depreciation/amorti sation to date and a positive revaluation of the long-term part of
forward contracts for energy.
Current assets
Current assets understood as a sum of inventories, receivables, other current assets and cash and cash equivalents.
As at the end of September 2018, current assets amounted to PLN 1,121,740 thousand as compared to PLN 949,891
thousand at the end of December 2017. As part of the current assets, inventories increased by PLN 88,424 thousand and
receivables grew by PLN 100,881 thousand, other current assets grew by PLN 43,174 thousand while cash and cash
equivalents dropped by PLN 60,630 thousand. Current assets represented 52.6% of total assets as at the end of September
2018 (50.0% as at the end of 2017) and included inventories – 20.6% (18.5% as at the end of 2017), receivables – 20.5%
(17.7% as at the end of 2017), other current assets – 3.0% (1.1% as at the end of 2017) and cash and cash equivalents –
8.5% (12.7% as at the end of 2017).
PLN thousand 30.09.2018 31.12.2017 30.09.2017
Change
30.09.2018
-31.12.2017
Change
30.09.2018
-30.09.2017
Fixed assets 1 007 313 946 363 975 285 60 951 32 028
Inventories 439 420 350 996 355 500 88 424 83 920
Receivables 437 640 336 758 407 454 100 881 30 185
trade and other payables 426 486 330 071 395 630 96 415 30 856
Other current assets 63 908 20 734 22 133 43 174 41 775
Cash and cash equivalents 180 773 241 403 222 736 (60 630) (41 964)
Assets related to discontinued operations 2 383 4 071 3 917 (1 687) (1 534)
Tota l a s sets 2 131 437 1 900 325 1 987 025 231 112 144 412
Equity 876 161 791 294 847 146 84 866 29 015
Short-term liabilities 755 855 576 276 555 822 179 579 200 033
of which:
trade and other payables 481 940 423 868 421 276 58 072 60 664
interest-bearing debt 173 568 72 593 51 682 100 974 121 886
other non-financial liabilities 100 347 79 814 82 863 20 533 17 484
Long-term liabilities 497 844 531 128 569 018 (33 284) (71 173)
of which:
314 678 376 521 424 672 (61 843) (109 993)
other non-financial liabilities 183 166 154 607 144 346 28 559 38 820
Liabilities directly related to the discontinued operations 1 576 1 626 15 039 (50) (13 463)
Tota l eq uity a nd l ia b il it ies 2 131 437 1 900 325 1 987 025 231 112 144 412
interest-bearing debt
Arctic Paper Capital Group/ Consolidated quarterly report for Q3 2018 22 Management Board’s Report
Assets for sale
The assets related to the discontinued operations cover the assets of the Mochenwangen Group with the exception of
assets of the other companies in the Arctic Paper Group. The amount of PLN 2,383 thousand as at 30 September 2018 was
composed of inventories (PLN 21 thousand), trade and other receivables (PLN 987 thousand), cash (PLN 1,252 thousand)
and other financial and non-financial assets (PLN 124 thousand).
Equity
As at the end of Q3 2018, the equity amounted to PLN 876,161 thousand as compared to PLN 791,294 thousand at the end
of 2017. Equity represented 41.1% of total liabilities as at the end of September 2018 as c ompared to 41.6% of total
liabilities as at the end of December 2017. The growth of equity is due to the net profit for 9 months of 2018 and a positive
net measurement of hedging instruments recognised in other comprehensive income reduced partly by divide nd
distribution to the shareholders of AP S.A. and to non-controlling shareholders and a growth of FX losses from translation
of foreign entities.
Short-term liabilities
As at the end of September 2018, short -term liabilities amounted to PLN 755,855 thousand (35.5% of balance sheet total)
as compared to PLN 576,276 thousand (30.3% of balance sheet total) as at the end of 2017. During three months of 2018
there was a growth of current liabilities by PLN 179,579 thousand which was primarily due to a growth of trade and other
payables, accruals and shorty-term loans (including reclasification of overdraft facilities to short -term loans and borrowings
due to the repayment date of August 2019).
Long-term liabilities
As at the end of September 2018, long-term liabilities amounted to PLN 497,844 thousand (23.4% of balance sheet total) as
compared to PLN 531,128 thousand (27.9% of balance sheet to tal) as at the end of 2017. In the period under report, a
decrease of long-term liabilities occurred by PLN 33,284 thousand, primarily due to the reclasification of overdraft facilities
to short-term loans and borrowings described above.
Liabilities directly related to assets held for sale
The liabilities directly related to the discontinued operations cover the liabili ties of the Mochenwangen Group with the
exception of retirement benefits and liabilities to the other companies in the Arctic Paper Group . The amount of PLN 1,576
thousand as at 30 September 2018 was composed of provisions (PLN 859 thousand), trade and oth er payables (PLN 440
thousand) and other financial and non-financial liabilities (PLN 278 thousand).

Arctic Paper Capital Group/ Consolidated quarterly report for Q3 2018 23 Management Board’s Report
Debt analysis
As at the end of September 2018 the debt to equity ratio was 143.3% and was higher by 1.3 p.p. as compared to the end of
June of 2018 and higher by 8.7 p.p. as compared to the end of September 2017.
The equity to non-current assets ratio was 87.0% as at the end of Q3 2018 and was higher by 1.7 p.p. than at the end of
June of 2018 and lower by 0.1 p.p. than at the end of September 2017.
The interest bearing debt to equity ratio was 55.7% as at the end of Q3 2018 and was lower by 1.5 p.p. as compared to the
end of June 2018 and lower by 0.5 p.p. as compared to the level of the ratio calculated at the end of September 2017.
Net borrowings to EBITDA calculated for the last 12 months ended on 30 September 2018 amounted to 1.19x compared to
1.39x in the equivalent period ended on 30 June 2018 and 1.02x for 12-month period ended on 30 September 2017.
EBITDA to interest coverage ratio amounted to 10 .5x for the twelve months ended on 30 September 2018, 9.8x for the
twelve months ended on 30 June 2018 and 10.9x for the twelve months ended on 30 September 2017.
Q3
2018
Q2
2018
Q3
2017
Change %
Q3 2018/
Q2 2018
Change %
Q3 2018/
Q3 2017
143,3 142,0 134,6 1,3 p.p. 8,7 p.p.
87,0 85,3 86,9 1,7 p.p. 0,1 p.p.
55,7 57,2 56,2 (1,5) p.p. (0,5) p.p.
1,19x 1,39x 1,02x (0,21) 0,17
10,5x 9,8x 10,9x 0,7 (0,4)
Debt to equity ratio (%)
Equity to fixed assets ratio (%)
Interest-bearing debt-to-equity ratio (%)
Net debt to EBITDA ratio for the last 12 months (x)
EBITDA to interest expense ratio for the last 12 months (x)
Arctic Paper Capital Group/ Consolidated quarterly report for Q3 2018 24 Management Board’s Report
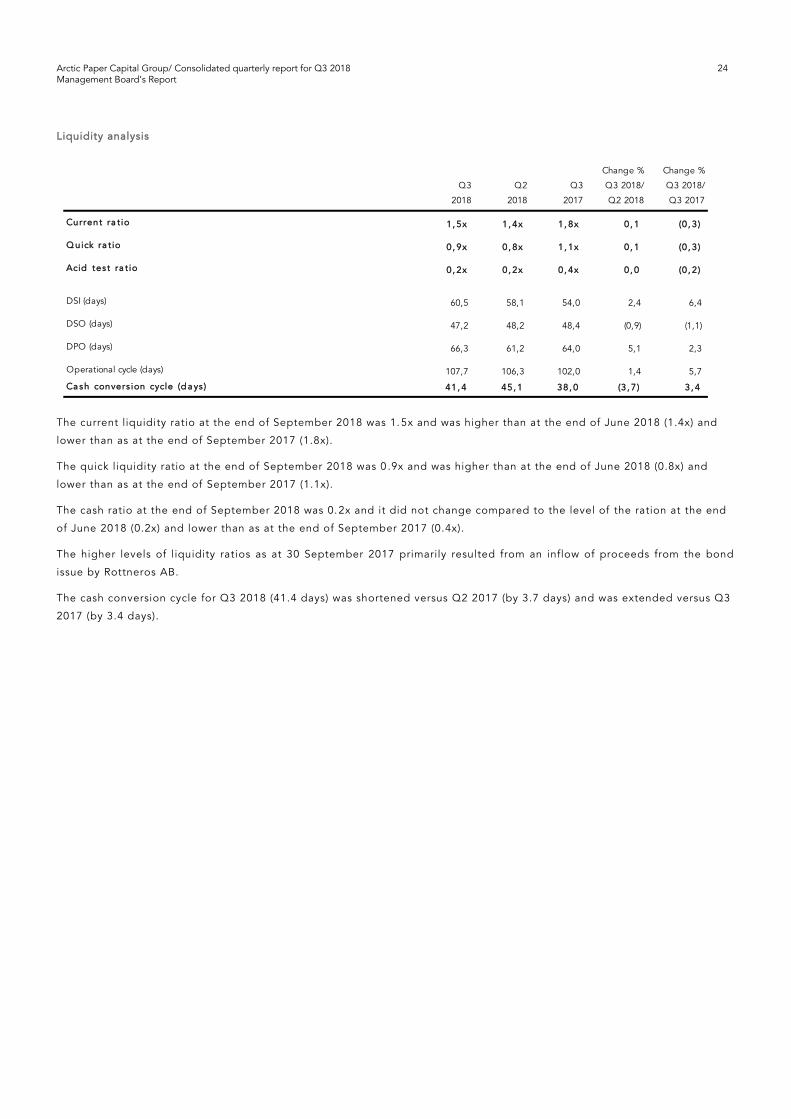
Liquidity analysis
The current liquidity ratio at the end of September 2018 was 1.5x and was higher than at the end of June 2018 (1.4x) and
lower than as at the end of September 2017 (1.8x).
The quick liquidity ratio at the end of September 2018 was 0 .9x and was higher than at the end of June 2018 (0.8x) and
lower than as at the end of September 2017 (1.1x).
The cash ratio at the end of September 2018 was 0.2x and it did not change compared to the level of the ration at the end
of June 2018 (0.2x) and lower than as at the end of September 2017 (0.4x).
The higher levels of liquidity rat ios as at 30 September 2017 primarily resulted from an inflow of proceeds from the bond
issue by Rottneros AB.
The cash conversion cycle for Q3 2018 (41.4 days) was shortened versus Q2 2017 (by 3.7 days) and was extended versus Q3
2017 (by 3.4 days).
Q3
2018
Q2
2018
Q3
2017
Change %
Q3 2018/
Q2 2018
Change %
Q3 2018/
Q3 2017
Current ra t io 1, 5x 1, 4x 1, 8x 0, 1 (0 , 3 )
Q uick ra t io 0, 9x 0, 8x 1, 1x 0, 1 (0 , 3 )
Acid tes t ra t io 0, 2x 0, 2x 0, 4x 0, 0 (0 , 2 )
DSI (days) 60,5 58,1 54,0 2,4 6,4
DSO (days) 47,2 48,2 48,4 (0,9) (1,1)
DPO (days) 66,3 61,2 64,0 5,1 2,3
Operational cycle (days) 107,7 106,3 102,0 1,4 5,7
Ca sh convers ion cycle (d a ys ) 41, 4 45, 1 38, 0 (3, 7 ) 3 , 4
Arctic Paper Capital Group/ Consolidated quarterly report for Q3 2018 25 Management Board’s Report
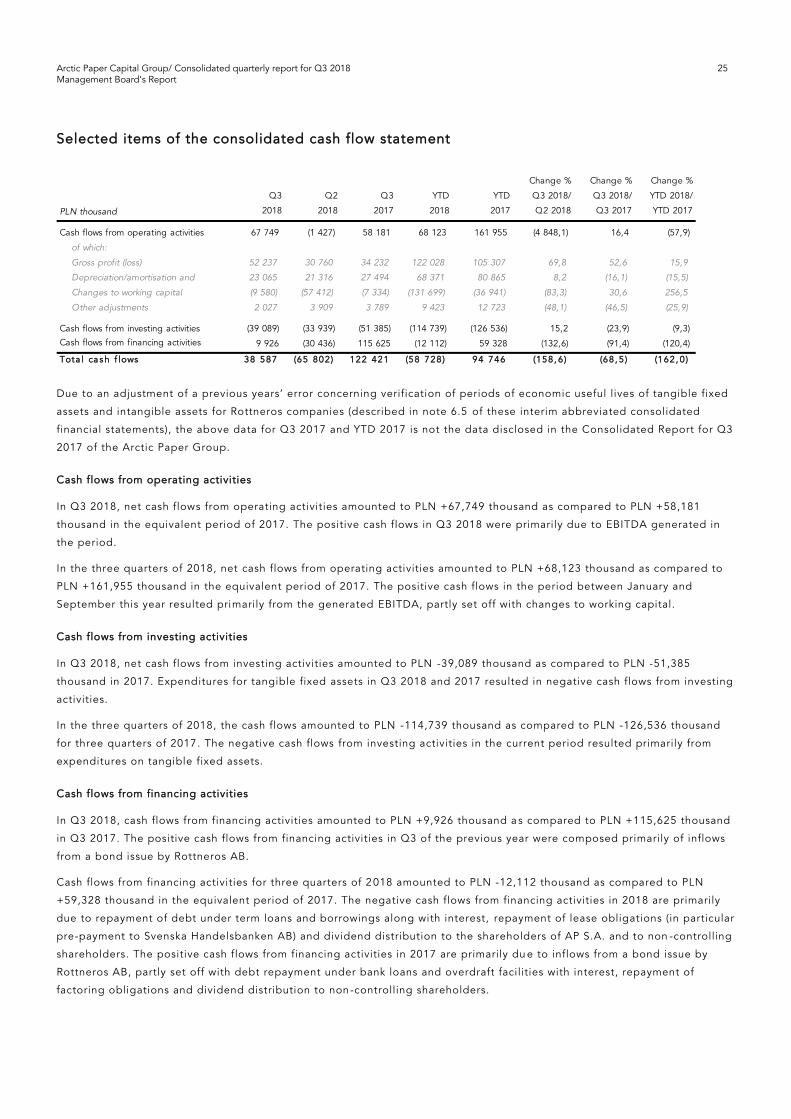
Selected items of the consolidated cash flow statement
Due to an adjustment of a previous years’ error concerning verification of periods of economic useful lives of tangible fixed
assets and intangible assets for Rottneros companies (described in note 6.5 of these interim abbreviated consolidated
financial statements), the above data for Q3 2017 and YTD 2017 is not the data disclosed in the Consolidated Report for Q3
2017 of the Arctic Paper Group.
Cash flows from operating activities
In Q3 2018, net cash flows from operating activities amounted to PLN +67,749 thousand as compared to PLN +58,181
thousand in the equivalent period of 2017. The positive cash flows in Q3 2018 were primarily due to EBITDA generated in
the period.
In the three quarters of 2018, net cash flows from operating activities amounted to PLN +68,123 thousand as compared to
PLN +161,955 thousand in the equivalent period of 2017. The positive cash flows in the period between January and
September this year resulted primarily from the generated EBITDA, partly set off with changes to working capital.
Cash flows from investing activities
In Q3 2018, net cash flows from investing activities amounted to PLN -39,089 thousand as compared to PLN -51,385
thousand in 2017. Expenditures for tangible fixed assets in Q3 2018 and 2017 resulted in negative cash flows from investing
activities.
In the three quarters of 2018, the cash flows amounted to PLN -114,739 thousand as compared to PLN -126,536 thousand
for three quarters of 2017. The negative cash flows from investing activities in the current period resulted primarily from
expenditures on tangible fixed assets.
Cash flows from financing activities
In Q3 2018, cash flows from financing activities amounted to PLN +9,926 thousand a s compared to PLN +115,625 thousand
in Q3 2017. The positive cash flows from financing activities in Q3 of the previous year were composed primarily of inflows
from a bond issue by Rottneros AB.
Cash flows from financing activities for three quarters of 2018 amounted to PLN -12,112 thousand as compared to PLN
+59,328 thousand in the equivalent period of 2017. The negative cash flows from financing activities in 2018 are primarily
due to repayment of debt under term loans and borrowings along with interest, repayment of lease obligations (in particular
pre-payment to Svenska Handelsbanken AB) and dividend distribution to the shareholders of AP S.A. and to non -controlling
shareholders. The positive cash flows from financing activities in 2017 are primarily du e to inflows from a bond issue by
Rottneros AB, partly set off with debt repayment under bank loans and overdraft facilities with interest, repayment of
factoring obligations and dividend distribution to non-controlling shareholders.
PLN thousand
Q3
2018
Q2
2018
Q3
2017
YTD
2018
YTD
2017
Change %
Q3 2018/
Q2 2018
Change %
Q3 2018/
Q3 2017
Change %
YTD 2018/
YTD 2017
Cash flows from operating activities 67 749 (1 427) 58 181 68 123 161 955 (4 848,1) 16,4 (57,9)
of which:
Gross profit (loss) 52 237 30 760 34 232 122 028 105 307 69,8 52,6 15,9
23 065 21 316 27 494 68 371 80 865 8,2 (16,1) (15,5)
Changes to working capital (9 580) (57 412) (7 334) (131 699) (36 941) (83,3) 30,6 256,5
Other adjustments 2 027 3 909 3 789 9 423 12 723 (48,1) (46,5) (25,9)
Cash flows from investing activities (39 089) (33 939) (51 385) (114 739) (126 536) 15,2 (23,9) (9,3)
Cash flows from financing activities 9 926 (30 436) 115 625 (12 112) 59 328 (132,6) (91,4) (120,4)
Tota l ca sh f lows 38 587 (65 802) 122 421 (58 728) 94 746 (158, 6) (68, 5 ) (162, 0 )
Depreciation/amortisation and
Arctic Paper Capital Group/ Consolidated quarterly report for Q3 2018 26 Management Board’s Report
Summary of standalone financial results
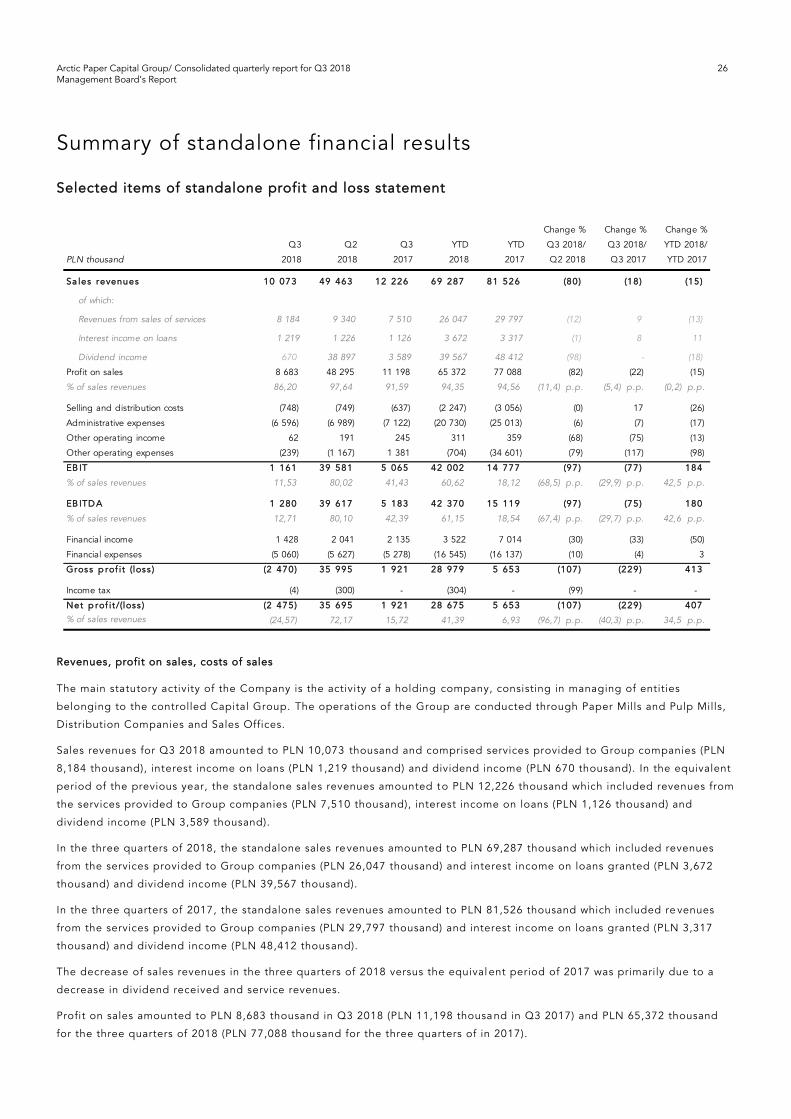
Selected items of standalone profit and loss statement
Revenues, profit on sales, costs of sales
The main statutory activity of the Company is the activity of a holding company, consisting in managing of entities
belonging to the controlled Capital Group. The operations of the Group are conducted through Paper Mills and Pulp Mills,
Distribution Companies and Sales Offices.
Sales revenues for Q3 2018 amounted to PLN 10,073 thousand and comprised services provided to Group companies (PLN
8,184 thousand), interest income on loans (PLN 1,219 thousand) and dividend income (PLN 670 thousand). In the equivalent
period of the previous year, the standalone sales revenues amounted to PLN 12,226 thousand which included revenues from
the services provided to Group companies (PLN 7,510 thousand), interest income on loans (PLN 1,126 thousand) and
dividend income (PLN 3,589 thousand).
In the three quarters of 2018, the standalone sales revenues amounted to PLN 69,287 thousand which included revenues
from the services provided to Group companies (PLN 26,047 thousand) and interest income on loans granted (PLN 3,672
thousand) and dividend income (PLN 39,567 thousand).
In the three quarters of 2017, the standalone sales revenues amounted to PLN 81,526 thousand which included re venues
from the services provided to Group companies (PLN 29,797 thousand) and interest income on loans granted (PLN 3,317
thousand) and dividend income (PLN 48,412 thousand).
The decrease of sales revenues in the three quarters of 2018 versus the equival ent period of 2017 was primarily due to a
decrease in dividend received and service revenues.
Profit on sales amounted to PLN 8,683 thousand in Q3 2018 (PLN 11,198 thousa nd in Q3 2017) and PLN 65,372 thousand
for the three quarters of 2018 (PLN 77,088 thousand for the three quarters of in 2017).
PLN thousand
Q3
2018
Q2
2018
Q3
2017
YTD
2018
YTD
2017
Change %
Q3 2018/
Q2 2018
Change %
Q3 2018/
Q3 2017
Change %
YTD 2018/
YTD 2017
Sa les revenues 10 073 49 463 12 226 69 287 81 526 (80) (18) (15)
of which:
Revenues from sales of services 8 184 9 340 7 510 26 047 29 797 (12) 9 (13)
Interest income on loans 1 219 1 226 1 126 3 672 3 317 (1) 8 11
Dividend income 670 38 897 3 589 39 567 48 412 (98) - (18)
Profit on sales 8 683 48 295 11 198 65 372 77 088 (82) (22) (15)
% of sales revenues 86,20 97,64 91,59 94,35 94,56 (11,4) p.p. (5,4) p.p. (0,2) p.p.
Selling and distribution costs (748) (749) (637) (2 247) (3 056) (0) 17 (26)
Administrative expenses (6 596) (6 989) (7 122) (20 730) (25 013) (6) (7) (17)
Other operating income 62 191 245 311 359 (68) (75) (13)
Other operating expenses (239) (1 167) 1 381 (704) (34 601) (79) (117) (98)
EB IT 1 161 39 581 5 065 42 002 14 777 (97) (77) 184
% of sales revenues 11,53 80,02 41,43 60,62 18,12 (68,5) p.p. (29,9) p.p. 42,5 p.p.
EB ITD A 1 280 39 617 5 183 42 370 15 119 (97) (75) 180
% of sales revenues 12,71 80,10 42,39 61,15 18,54 (67,4) p.p. (29,7) p.p. 42,6 p.p.
Financial income 1 428 2 041 2 135 3 522 7 014 (30) (33) (50)
Financial expenses (5 060) (5 627) (5 278) (16 545) (16 137) (10) (4) 3
Gross p rof it (loss ) (2 470) 35 995 1 921 28 979 5 653 (107) (229) 413
Income tax (4) (300) - (304) - (99) - -
Net p rof it /(loss ) (2 475) 35 695 1 921 28 675 5 653 (107) (229) 407
% of sales revenues (24,57) 72,17 15,72 41,39 6,93 (96,7) p.p. (40,3) p.p. 34,5 p.p.
Arctic Paper Capital Group/ Consolidated quarterly report for Q3 2018 27 Management Board’s Report
Selling and distribution costs
In Q3 2018 the Company recognised the amount of PLN 748 thousand as selling and distribution costs (PLN 637 thousand
in Q3 2017). In the three quarters of 2018 the Company recognised t he amount of PLN 2,247 thousand as selling and
distribution costs (PLN 3,056 thousand in three quarters of 2017).
The selling and distribution costs relate fully to inte rmediation costs in pulp purchases.
Administrative expenses
In Q3 2018, the administrative expenses amounted to PLN 6,596 thousand which was a decrease as compared to the
equivalent period of the previous year by PLN 526 thousand. In the three quarters of 2018, administrative expenses
amounted to PLN 20,730 thousand as compared to PLN 25,013 thousand in the equivalent period of 2017.
The administrative expenses include costs of the administration of the Company operation, costs of services provided for
the companies in the Group and all costs incurred by the Company for the purposes of purs uing holding company activities.
Among them, a significant group of costs relates only to statutory activities and includes, among others: costs of tax, legal
and accounting services, as well as the costs of the Supervisory Board and the Management Board.
Other operating income and expenses
Other operating income amounted to PLN 62 thousand in Q3 2018 which was a decrease as compared to the equivalent
period of the previous year by PLN 183 thousand. Other operating expenses totalled PLN 726 thousand in Q3 2 018 (PLN
+1,381 thousand in the equivalent quarter of 2017). The positive other operating revenues in Q3 2017 were due to reversal
of an impairment allowances for certain loans granted to Arctic Paper Mochenwangen GmbH (APMW repaid loans to APSA
for EUR 380 thousand in August 2017).
For the three quarters of 2018, the other operating income and other operating expenses amounted to PLN +311 thousand
and PLN -704 thousand respectively, and for the equivalent period in 2017 – PLN +359 thousand and PLN -34,601 thousand
respectively. The major growth of other operating expenses in three quarters of the previous year was primarily due to a
write-off of the value of interests in Arctic Paper Investment AB (PLN 32,947 thousand).
Financial income and financial expenses
In Q3 2018, the financial income amounted to PLN 1,428 thousand and was by PLN 707 thousand lower than generated in
Q3 2017.
In Q3 2018, financial expenses amounted to PLN 5,060 thousand. In the equivalent period of 2017, the financial expenses
amounted to PLN 5,278 thousand.
For three quarters of 2018, the financial income and expenses amounted to PLN +3,522 thousand and PLN -16,545
thousand respectively, and for the equivalent period in 2017 – PLN +7,014 thousand and PLN -16,137 thousand
respectively. The higher financial income in 2017 was due to recognition of additional revenues due to a modified margin
on the Company’s loans.

Arctic Paper Capital Group/ Consolidated quarterly report for Q3 2018 28 Management Board’s Report
Selected items of the standalone statement of financial position
As at 30 September 2018 total assets amounted to PLN 976,215 thousand as compared to PLN 944,061 thousand at the end
of 2017.
The growth of assets is primarily due to higher other current assets in the period under report.
Fixed assets
As at the end of September 2018 non-current assets represented nearly 78.0% of total assets which means that the share
decreased (by 1.6 p.p.) compared to the end of 2017. The main item of non -current assets includes interests in subsidiaries.
At the end of Q3 2018, the value was PLN 678,313 thousand and there was no chan ge versus the end of 2017.
Current assets
As at the end of September 2018, current assets amounted to PLN 206,081 thousand as compared to PLN 192,904 thousand
at the end of 2017. The level of current assets grew at the end of September 2017, primarily with respect to trade
receivables and other current assets. As at the end of Q3 2018, current assets represented 22.0% of total assets compared
to 20.4% as at the end of the previous year.
As part of the current assets, receivables increased by PLN 14,344 thou sand, other current assets by PLN 38,222 thousand
while cash and cash equivalents decreased by PLN 30,722 thousand.
Equity
As at the end of Q3 2018, the equity amounted to PLN 546,540 thousand as compared to PLN 531,032 thousand at the end
of 2017. As at the end of September 2018, equity accounted for 56.0% of balance sheet total vs. 56.2% of balance sheet
total as at the end of 2017. The increase of equity is primarily due to the net profit for three quarters of 2018.
Short-term liabilities
As at the end of September 2018, short-term liabilities amounted to PLN 269,599 thousand (27.6% of balance sheet total) as
compared to PLN 205,815 thousand as at the end of 2016 (21.8% of balance sheet total). The increase of short-term liabilities
was a result of reclasification of overdraft facilities to short-term loans and borrowings due to the repayment date of August
2019.
Long-term liabilities
As at the end of September 2018, long-term liabilities amounted to PLN 160,075 thousand (16.4% of balance sheet total) as
compared to PLN 207,214 thousand as at the end of 2017 (21.9% of balance sheet total).
The changes to long-term liabilities in the analysed period were primarily due to reclasification of overdraft facilities and
also a drawdown of new tranchee of long-term loans, in particular loans to repay lease obligations of Arctic Paper Grycksbo
AB and perform the investment in Arctic Paper Kostrzyn S.A.
PLN thousand 30.09.2018 31.12.2017 30.09.2017
Change
30.09.2018
-31.12.2017
Change
30.09.2018
-30.09.2017
Fixed assets 761 468 751 157 773 701 10 311 (12 233)
Receivables 89 630 75 287 71 908 14 344 17 722
Other current assets 118 896 80 675 77 199 38 222 41 697
Cash and cash equivalents 6 220 36 943 16 520 (30 722) (10 300)
Tota l a ssets 976 215 944 061 939 328 32 154 36 887
Equity 546 540 531 032 576 484 15 508 (29 943)
Short-term liabilities 269 599 205 815 139 967 63 784 129 633
Long-term liabilities 160 075 207 214 222 877 (47 139) (62 802)
Tota l eq uity a nd l ia b i l i t ies 976 215 944 061 939 328 32 154 36 887

Arctic Paper Capital Group/ Consolidated quarterly report for Q3 2018 29 Management Board’s Report
Selected items of the standalone cash flow statement
The cash flow statement presents a decrease in cash and cash equivalents in the three quarters of 2018 by PLN -30,723
thousand which includes:
negative cash flows from operating activities of PLN -90,408 thousand,
negative cash flows from investing activities of PLN -199 thousand,
positive cash flows from financial activities of PLN +59,884 thousand.
Cash flows from operating activities
In the three quarters of 2018, net cash flows from operating activities amounted to PLN -90,408 thousand as compared to
PLN +65,940 thousand in the equivalent period of 2017. The negative cash flows from operating activities in the three
quarters of the current year were due primarily to a change of the balance of loans to subsidiary companies and liabilities
under cash-pooling.
Cash flows from investing activities
In the first nine months 2018, cash flows from investing activities amounted to PLN -199 thousand as compared to PLN -
3,068 thousand for three quarters of 2017. The higher investing cash flows in 2017 were related to the acquisit ion of
interests in the subsidiary company Arctic Paper Investment AB.
Cash flows from financing activities
In 2018 cash flows from financing activities amounted to PLN +59,884 thousand as compared to PLN -57,216 thousand in
2017. The cash flows from financing activities in 2018 were primarily related to changes in balances of working capital
loans.
PLN thousand
Q3
2018
Q2
2018
Q3
2017
YTD
2018
YTD
2017
Change %
Q3 2018/
Q2 2018
Change %
Q3 2018/
Q2 2018
Change %
YTD 2018/
YTD 2017
Cash flows from operating activities (1 690) (77 509) 11 199 (90 408) 65 940 (97,8) (115,1) (237,1)
of which:
Gross profit (2 466) 35 995 1 921 28 979 5 653 (106,9) (228,4) 412,7
Depreciation and impairment of fixed assets 119 37 117 368 342 226,5 1,7 7,6
Changes to working capital 1 921 8 572 (7 641) 7 000 4 668 (77,6) (125,1) 49,9
Net interest and dividends 2 068 (157) 3 194 6 078 10 924 (1 416,9) (35,3) (44,4)
Increase / decrease of loans granted to subsidiaries 4 738 (25 139) 7 530 (50 072) 10 595 (118,8) (37,1) (572,6)
Change to liabilities due to cash-pooling (6 633) (6 632) 12 524 (83 332) 29 383 0,0 (153,0) (383,6)
Other adjustments (1 437) (90 184) (6 446) 572 4 376 (98,4) (77,7) (86,9)
Cash flows from investing activities (60) (116) (273) (199) (3 068) (48,4) (78,0) (93,5)
Cash flows from financing activities 6 288 50 598 (9 779) 59 884 (57 216) (87,6) (164,3) (204,7)
Tota l ca sh f lows 4 539 (27 027) 1 148 (30 723) 5 657 (116, 8 ) 295, 4 (643, 1 )
Arctic Paper Capital Group/ Consolidated quarterly report for Q3 2018 30 Management Board’s Report
Relevant information and factors affecting the financial results
and the assessment of the financial standing
Key factors affecting the performance results
The Group’s operating activity has been historically and will continue to be influenced by the following key factors:
macroeconomic and other economic factors;
paper prices;
prices of pulp for Paper Mills, timber for Pulp Mills and energy prices;
currency fluctuations.
Macroeconomic and other economic factors
We believe that a number of macro-economic and other economic factors have a material impact on the demand for high -
quality paper, and they may also influence the demand for the Group products and the Group's operating results. Those
factors include:
— GDP growth;
— net income – as a metric of income and affluence of the population;
— production capacity – the surplus of supply in the high quality paper segment over demand and decreasing sale s
margins on paper;
— paper consumption;
— technology development.
Paper prices
Paper prices undergo cyclic changes and fluctuations, they depend on global changes in demand and overall
macroeconomic and other economic factors such as indicated above. Prices of paper are also influenced by a number of
factors related to the supply, primarily changes in production capacities at the worldwide and European level.
Costs of raw materials, energy and transportation
The main elements of the Group’s operating expenses include raw materials, energy and transportation. The costs of raw
materials include mainly the costs of pulp for Paper Mills, timber for Paper and Pulp Mills and chemical agents used for
paper and pulp production. The Group's energy costs historically i nclude mostly the costs of electricity, natural gas, coal
and fuel oil. The costs of transportation include the costs of transportation services provided to the Group mainly by
external entities.
Taking into account the share of those costs in total operat ing expenses of the Group and the limited possibility of
controlling those costs by the Companies, their fluctuations may have a significant impact on the Group’s profitability.
A part of pulp supplies to the Group's Paper Mills is made from the Group's o wn Pulp Mills. The rest of the pulp produced
in the Group's Pulp Mills is sold to external customers.
Currency rate fluctuations
The Group's operating results are significantly influenced by currency rate fluctuations. In particular, the Group's revenues
and costs are expressed in different foreign currencies and are not matched, therefore, the appreciation of the currencies in
which we incur costs towards the currencies in which we generate revenues, will have an adverse effect on the Group's
results. Our products are primarily sold to euro zone countries, Scandinav ia, Poland and the UK, thus our revenues are
largely denominated in EUR, GBP, SEK and PLN while revenues from the pulp mills are primarily denominated in USD. The
Group’s operating expenses are primarily expressed in USD (pulp costs for Paper Mills), EUR (costs related to pulp for Paper
Mills, energy, transportation, chemicals), PLN (the majority of other costs incurred by the mill in Kostrzyn nad Odrą) and
SEK (the majority of other costs incurred by the Munkedal and Grycksbo mills as well as the Rottneros and Vallvik Pulp
Mills).
Exchange rates also have an important influence on results reported in the Group's financial statements because of changes
in exchange rates of the currencies in which we generate revenues and incur costs, and the currency in wh ich we report the
Group's financial results (PLN).
Arctic Paper Capital Group/ Consolidated quarterly report for Q3 2018 31 Management Board’s Report
Unusual events and factors
In Q3 2018 there were no unusual events or factors.
Impact of changes in Arctic Paper Group’s structure on the financial result
In Q3 2018 there were no changes in the Arctic Paper Group’s structure that would have material influence on the financial result
generated.
Other material information
Repayment of lease liabilities of Arctic Paper Grycksbo AB and receipt of a re-financing tranche from banks
On 7 January 2018, Arctic Paper SA granted a loan to its subsidiary Arctic Paper Grycksbo AB of EUR 5.56 million to cover
repayment under lease contracts with Svenska Handelsbanken AB. The Company requested the existing consortium of
financing banks (Santander Bank S.A. [Bank Zachodni WBK S.A.] and Bank BGŻ BNP Paribas S.A.) for approval for the
Company to contract an additional short -term loan up to PLN 25,820 thousand to be granted as an additional tranche under
the loan agreement of 9 September 2016 in order to finance or re-finance repayment of lease debt by Arctic Paper
Grycksbo AB to Svenska Handelsbanken AB. The Meeting of Bondholders agreed to contract such financing on 20 February
2018. The new loan tranche of PLN 25,820 thousand was disbursed by the banks on 18 July 2018.
New investment by the Group
On 12 March 2018 the Company's Management Board decided to commence a project to expand the hydro power plant in
the paper mill in Munkedal (Sweden). The objective of the project is to support the factor y's environmental sustainabil ity.
The investment will double the quantity of energy generated by the environment -friendly hydro power plant at Arctic Paper
Munkedals which will enhance the energy self -sufficiency of the paper mill.
The investment is estimated at SEK 70 million (about PLN 29 million). The Arctic Paper Group plans to finance the project
with its own funds. When the project is completed, it will be refinanced with a bank loan. The Company has already signed
a letter of intent with Swedbank concerning refinancing of the project.
The Arctic Paper Group has obtained the permits required for the investment. The project is to be completed in Q4 2019.
Published strategy on paper business
The Management Board of Arctic Paper SA decided to set a long -term financial goal – EBIT at 10%. Additionally, the
Management Board approved its new strategy for the Group's paper business “The future lies in paper – Strategic Agenda
2022” which aims at developing the business and improving the profitability of the segment. The new business strategy
relies on six strategic initiatives:
— Business development by focusing on selected profitable segments and markets, including specialist products and
premium products, in Eastern Europe and in new markets.
— New innovative products and weights, developed in close cooperation with customers.
— Development of strong brands for the premium segment in order to increase revenues per one ton of paper.
— Optimisation of all processes in order to reduce costs.
— Reinforcement of the efficiency culture among employees, based on clear and measurable objectives.
— Sustainable activities based on products that may be recycled and on renewable materials.
The implementation of the strategy has already started which means that units of the Company have been developing detailed
action plans based on those strategic initiatives.
Arctic Paper Capital Group/ Consolidated quarterly report for Q3 2018 32 Management Board’s Report
Factors influencing the development of the Arctic Paper Group
Information on market trends
Supplies of fine paper
In Q3 2018 the Arctic Paper Group recorded an increased level of orders versus Q2 2018 by 1.4% and a drop of orders
versus the equivalent period of 2017 by 1.1%.
Source of data: Arctic Paper analysis
Paper prices
In Q3 2018, the average prices of high quality paper grew by: 8% for UWF paper and by 7% for CWF paper respectively
versus equivalent prices at the end of 2017.
In the period from July to September 2018, the prices of uncoated wood-free paper (UWF) and coated wood-free paper
(CWF) for selected markets: Germany, France, Spain, Italy and the UK, expressed in EUR and GBP,experienced similar
increases: by 2.4% and 2.2% respectively
The average prices invoiced by Arctic Paper in EUR for comparable products in the segment of uncoated wood -free paper
(UWF) increased from July to September 2018 by 3.6% while in the segment of coated wood-free paper (CWF) the prices
increased by 2.2%. Vis-a-vis the equivalent prices from the end of Q3 2017, the average prices invoiced by Arctic Paper
grew by 9.7% for UWF and 7.7% for CWF.
Source: For market data – RISI, price changes for selected markets in Germany, France, Spain, Italy and the UK in local
currencies for graphic papers similar to the product portfolio of the Arctic Paper Group. The prices are expressed without
considering specific rebates for individual c lients and they include neither additions nor price reductions in relation to the
publicly available price lists. The estimated prices for each month reflect orders placed in the month while the deliveries
may take place in the future. Because of that, RIS I price estimates for a particular month do not reflect the actual prices at
which deliveries are performed but only express ordering prices. For Arctic Paper products, the average invoiced sales
prices for all served markets in EUR.
Pulp prices
At the end of Q3 2018, the pulp prices reached the level of: NBSK – USD 1.230/ton and BHKP – USD 1.050/ton. The
average price of NBSK in Q3 2018 was higher by 37.2% compared to the equivalent period of the previous year while the
price of BHKP was by 20.2% higher. The average pulp price in Q3 2018 was higher by 5.8% for NBSK and by 0.5% for BHKP
as compared to Q2 2018.
The average cost of pulp per ton of produced paper as calculated for the Arctic Paper Group, expressed in PLN, in Q3 2018
increased by 7.1% versus Q2 2018 and increased by 26.8% versus Q3 2017. The share of pulp costs in cost of paper sales in
Q3 of the current year amounted to 62% and was higher compared to the level recorded in Q3 2017 (55%).
In the first three quarters of 2018, the AP Group used pulp in the production process in the following structure: BHKP 72%,
NBSK 20% and other 8%.The Arctic Paper Group uses the pulp in the production process according to the following
structure: BHKP 71%, NBSK 20% and other 9%.
Source of data: www.foex.fi analysis by Arctic Paper.
Currency exchange rates
The EUR/PLN exchange rate at the end of Q3 2018 amounted to 4.2714 and was lower by 2.1% than at the end of Q2 2018
and lower by 0.9% than at the end of Q3 2017. The average exchange rate in Q3 2018 was higher by 1.0% than in Q2 2018
and amounted to 4.3057, compared to 4.2615. The average exchange rate in Q3 2018 was by 1.1% higher than in Q3 2017.
The EUR/SEK exchange rate at the end of September 2018 was 10.2950 versus 10. 4095 at the end of H1 2018, and 9.5928
at the end of Q3 2017 which was a depreciation of EUR to SEK by 1.1% and appreciation by 7.3% respectively.
For this pair, the mean exchange rate in the first quarter was 0.7% higher compared to Q2 2018. The average exchange rate
in Q3 2018 was 8.9% higher than in the corresponding period of 2017.
Arctic Paper Capital Group/ Consolidated quarterly report for Q3 2018 33 Management Board’s Report
The changes mean a depreciation of SEK vis -a-vis EUR in Q3 2018 which had favourable impact on the Group's financial
results, primarily with reference to the sales revenues generated by the Swedish factories that depend on prices in EUR.
At the end of Q3 2018, the USD/PLN rate recorded a decrease by 1.8% versus the end of Q2 2018 and amounted to 3.6754.
In Q3 2018, the mean exchange rate amounted to 3.7018 compared to 3.5778 in Q2 2018. That was a PLN depreciation to
USD by 3.5%. At the end of Q3 2018, the USD/SEK rate amounted to 8.8585 and was by 0.9% lower than at the end of Q2
2018. The mean exchange rate in Q3 2018 amounted to 8.9465 which was an increase by 3.2% compare d to Q2 2018.
The changes of the USD/SEK exchange rates adversely affected the costs incurred in USD by the Swedish Pulp Mills, in
particular the costs of pulp. With reference to the paper mill in Kostrzyn, the average monthly USD/PLN exchange rate
remained disadvantageous with a material PLN appreciation at the end of the quarter.
At the end of September 2018, the EUR/USD rate amounted to 1.1622 compared to 1.1650 at the end of Q2 2016 and to
1.1800 at the end of September 2017. In terms of percentage, tha t means an appreciation of EUR to USD by 0.2% versus
Q2 2017 and a depreciation of the currency by 1.5% versus the equivalent period of the previous year. In Q3 2018, the
mean exchange rate of the pair amounted to 1.1632 compared to 1.1921 in Q2 2018 ( -2.4%).
Further appreciation of EUR versus SEK has positively affected the Group's financial results, mainly due to increased sales
revenues generated in EUR and denominated in SEK. The depreciating PLN versus USD in Q3 2018 adversely affected the
purchase prices of raw materials for the paper mill in Kostrzyn. USD appreciating vis-a-vis SEK also adversely affected the
above costs in the paper mills in Sweden.
Factors influencing the financial results in the perspective of the next quarter
The material factors that have an impact on the financial resu lts over the next quarter, include:
Demand for fine paper in Europe. Over the recent years there has been a major decrease of demand for fine paper in
Europe (level of executed orders). Further adverse developments in the market situation may adversely affect the levels
of orders placed with the Group's Paper Mills and, as a result, will have an adverse impact on the financial results of
the Group.
Price changes of fine paper. In particular, the poss ibility to raise the prices of Arctic Paper products in local currencies
in view of the declining supply/demand in Europe and in the context exchange rates fluctuations, will have a material
influence on the financial results. Paper prices are going to be of particular importance for the Paper Mill of Grycksbo
which - in connection with the market changes - experiences the greatest adverse impact of drop of sales volumes,
prices as well as of exchange rate fluctuations.
Price fluctuations of raw materials, including pulp for Paper Mills and electricity for all operational entities. In
particular, financial results of Paper Mills may be negatively influenced by increasing pulp prices, particularly BHKP. On
the other hand, dropping NBSK pulp prices may adversely affect the financial results of Pulp Mills. Fluctuations of
electricity prices in Sweden may also have a material impact on the results generated by the Group. In future, such
market changes may translate into changes of sales profitability in Paper Mi lls of AP Munkedals and AP Grycksbo as
well as in Pulp Mil ls of Rottneros and Vallvik.
Changes in currency rates, in particular, the appreciation of PLN and SEK in relation to EUR and GBP, the appreciation
of PLN in relation to SEK, and the depreciation of PLN and SEK in relation to USD, may have an adverse effec t on the
financial results. However, the Group's Pulp Mills may benefit from the appreciation of USD in relation to SEK.
Risk factors
Major changes to risk factors
In Q3 2018 there were no material changes to the risk factors. Those were presented in det ail in the semi-annual report for
2018.

Arctic Paper Capital Group/ Consolidated quarterly report for Q3 2018 34 Management Board’s Report
Supplementary information
Management Board position on the possibility to achieve the projected financial results published earlier
The Management Board of Arctic Paper S.A. has not published the projected fina ncial results for 2018.
Changes in holdings of the Issuer’s shares or rights to shares by persons managing and supervising Arctic Paper S.A.
Information on sureties and guarantees
As at 30 September 2018, the Capital Group reported:
— pledge on properties of Arctic Paper Grycksbo AB resulting from an FPG contract in favour of the mutual life insurance
company PRI for SEK 50,000 thousand;
— contingent liability under a guarantee for FPG in favour of the mutual life insurance company PRI for SEK 1,414 thousand
at Arctic Paper Grycksbo AB and for SEK 760 thousand at Arctic Paper Munkedals AB;
— pledge on properties of Arct ic Paper Munkedals AB resulting from an FPG contract in favour of the mutual life insurance
company PRI for SEK 50,000 thousand;
— a contingent liability of Arctic Paper Munkedals AB related to a surety for the obligations of Kalltorp Kraft HB in the
amount of SEK 1,698 thousand;
— mortgage on the properties held by Kalltorp Kraft HB for SEK 8,650 thousand;
— a bank guarantee in favour of Skatteverket Ludvika for SEK 135 thousand;
— pledges on shares in subsidiary companies in the Rottneros Group for SEK 773,368 th ousand under loan agreements
concluded with Danske Bank;
— pledge on 19,950,000 shares of Rottneros AB under the loan agreement for EUR 10,000 tho usand granted by Arctic
Paper Finance AB to Arctic Paper S.A. and EUR 10,000 thousand granted by Mr Thomas Onst ad to Arctic Paper Finance
AB;
— a guarantee by Rottneros AB for SEK 5,000 thousand to local authorities covering future environmental liabilities of the
Vallvik pulp mill.
In connection with the term and revolving loan agreements, agreements relating to the bond issue and the intercreditor
agreement (described in more detail in the note “Obtaining new financing”) signed on 9 September 2016, on 3 O ctober 2016
the Company signed agreements and statements pursuant to which collateral to the above debt and other claims would be
established in favour of Bank BGŻ BNP Paribas S.A., acting as the Collateral Agent, that is
1. under Polish law – Collateral Documents establishing the following Collateral:
Number of shares
or rights to shares
as at 09.11.2018
Number of shares
or rights to shares
as at 30.09.2018
Number of shares
or rights to shares
as at 27.08.2018 Change
Ma na g em ent B oa rd
Per Skoglund 20 000 20 000 20 000 -
Göran Eklund - - - -
- - - -
Sup ervisory B oa rd - - - -
Per Lundeen 34 760 34 760 34 760 -
Thomas Onstad 6 223 658 6 223 658 6 223 658 -
Roger Mattsson - - - -
Maciej Georg - - - -
Mariusz Grendowicz - - - -- - - -
Managing and supervising persons
Arctic Paper Capital Group/ Consolidated quarterly report for Q3 2018 35 Management Board’s Report
› financial and registered pledges on all shares and interests registered in Poland, owned by the Company and the
Guarantors, in companies in the Company Group (with the exception of Rottneros AB, Arctic Paper Mochenwangen
GmbH and Arctic Paper Investment GmbH), except the shares in the Company;
› mortgages on all properties located in Poland and owned by the Company and the Guarantors;
› registered pledges on all material rights and movable assets owned by the Com pany and the Guarantors, constituting
an organised part of enterprise, located in Poland (with the exception of the assets listed in the Loan Agreement);
› assignment of (existing and future) insurance policies covering the assets of the Company and the Guar antors (with the
exception of insurance policies listed in the Loan Agreement);
› declaration by the Company and the Guarantors on voluntary submission to enforcement, in the form of a notary deed;
› financial pledges and registered pledges on the bank accounts of the Company and the Guarantors, registered in
Poland;
› powers of attorney to Polish bank accounts of the Company and the Guarantors, registered in Poland;
› subordination of the debt held by intragroup lenders (specified in the Intercreditor Agreement).
2. under Swedish law – Collateral Documents establishing the following Collateral:
› pledges on all shares and interests registered in Poland, owned by the Company and the Guarantors, in Group
companies, with the exception of the shares in the company, as well as pledged on the shares in Rottneros (with the
exception of the free package of shares in Rottneros);
› mortgages on all properties located in Sweden and owned by the Company and the Guarantors as long as such
collateral covers solely the existing mortgage deeds;
› corporate mortgage loans granted by the Guarantors registered in Sweden as l ong as such collateral covers solely the
existing mortgage deeds;
› assignment of (existing and future) insurance policies covering the assets of the Company and the Guar antors (with the
exception of insurance policies listed in the Loan Agreement);
› pledges on Swedish bank accounts of the Company and the Guarantors as long as such collateral is without prejudice
to free management of funds deposited on bank accounts until an event of default specified in the Loan Agreement.
› As a result of repayment on 7 January 2018 of liabilities of Arctic Paper Grycksbo AB under the lease contract with
Svenska Handelsbanken AB (pledge on movable assets and properties) and in view of the p rovisions of loan
agreements, the process of releasing the above pledges made in favour of Svenska Handelsbanken AB was started and
they were incorporated in the inter-creditor agreement.
Material off-balance sheet items
The information regarding off-balance sheet items is disclosed in the interim abbreviated consolidated financial statement s.
Information on court and arbitration proceedings and proceedings pending before public administrative authorities
During the period under report, Arctic Paper S.A. and its subsidiaries were not a party to any proceedings pending before a
court, arbitration or public administrative authority, the individual or joint value of which would equal or exceed 10% of the
Company’s equity.
Information on transactions with related parties executed on non-market terms and conditions
During the period under report, Arctic Paper S.A. and its subsidiaries did not execute any material transactions with related
entities on non-market terms and conditions.
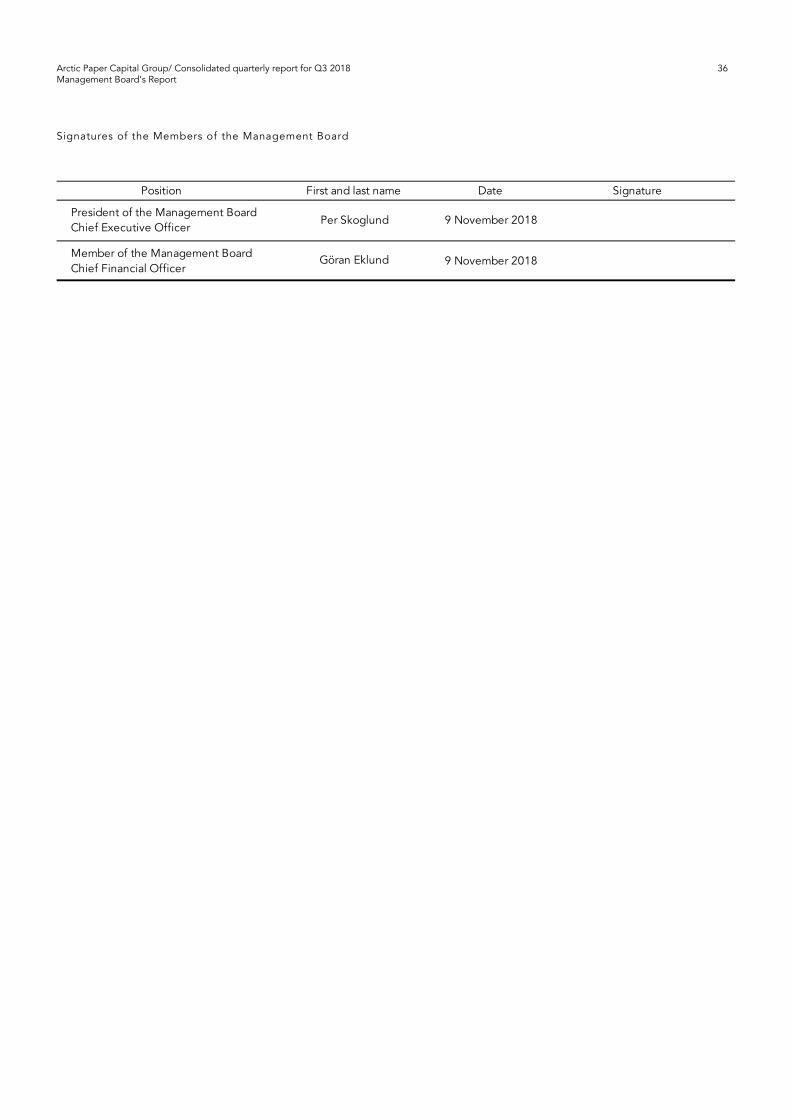
Arctic Paper Capital Group/ Consolidated quarterly report for Q3 2018 36 Management Board’s Report
Signatures of the Members of the Management Board
Position First and last name Date Signature
President of the Management Board Chief Executive Officer
Per Skoglund 9 November 2018
Member of the Management BoardChief Financial Officer
Göran Eklund 9 November 2018
Interim abbreviated financial statements
for the period of 9 months ended on 30 September 2018

Arctic Paper Capital Group/ Consolidated quarterly report for Q3 2018 38 Interim abbreviated consolidated financial statements
Additional notes to the interim abbreviated consolidated financial statements provided on pages 48 to 75 constitute an integral part hereof
Interim abbreviated consolidated financial statements
Interim abbreviated consolidated profit and loss statement
*Information on the transformed data is provided in note 6.5 hereof
3-month period
ended on
30 September 2018
9-month period
ended on
30 September 2018
3-month period
ended on
30 September 2017
9-month period
ended on
30 September 2017
(unaudited) (unaudited) (transformed)* (transformed)*
Continuing operations
Revenues from sales of goods 812 371 2 377 509 735 866 2 212 855
Sales revenues 812 371 2 377 510 735 866 2 212 855
Costs of sales (654 140) (1 924 777) (592 286) (1 763 594)
Profit / (loss) on sales 158 230 452 733 143 580 449 261
Selling and distribution costs (85 035) (253 933) (85 739) (263 513)
Administrative expenses (20 693) (60 997) (19 714) (68 453)
Other operating income 14 993 33 987 10 430 32 708
Other operating expenses (8 037) (19 679) (5 271) (20 030)
Operating profit (loss) 59 459 152 110 43 285 129 973
Financial income 299 1 234 2 253 7 618
Financial expenses (7 017) (28 972) (9 450) (26 411)
Gross profit (loss) 52 741 124 372 36 088 111 180
Income tax (9 553) (31 222) (6 732) (24 484)
43 188 93 149 29 355 86 697
Discontinued operations
(452) (2 291) (1 849) (5 852)
Net profit (loss) for the financial year 42 736 90 859 27 507 80 845
Attributable to:
The shareholders of the Parent Entity, of which: 25 321 45 223 19 506 51 032
25 773 47 514 21 355 56 884
(452) (2 291) (1 849) (5 852)-
Non-controlling shareholders, of which: 17 415 45 635 8 001 29 813
17 415 45 635 8 001 29 813
- - - -
42 736 90 859 27 507 80 845
Earnings per share:
0,37 0,65 0,28 0,74
0,37 0,69 0,31 0,82
0,37 0,65 0,28 0,74
0,37 0,69 0,31 0,82
– basic earnings from the profit/(loss) attributable to the
shareholders of the Parent Entity
– basic profit/(loss) from continuing operations attributable to
the shareholders of the Parent Entity
– diluted earnings from the profit attributable to the
shareholders of the Parent Entity
– diluted profit from continuing operations attributable to
the shareholders of the Parent Entity
Profit (loss) for the financial year from discontinued operations
- profit (loss) from continuing operations
- profit (loss) from discontinued operations
- profit (loss) from continuing operations
- profit (loss) from discontinued operations
Net profit (loss) from continuing operations
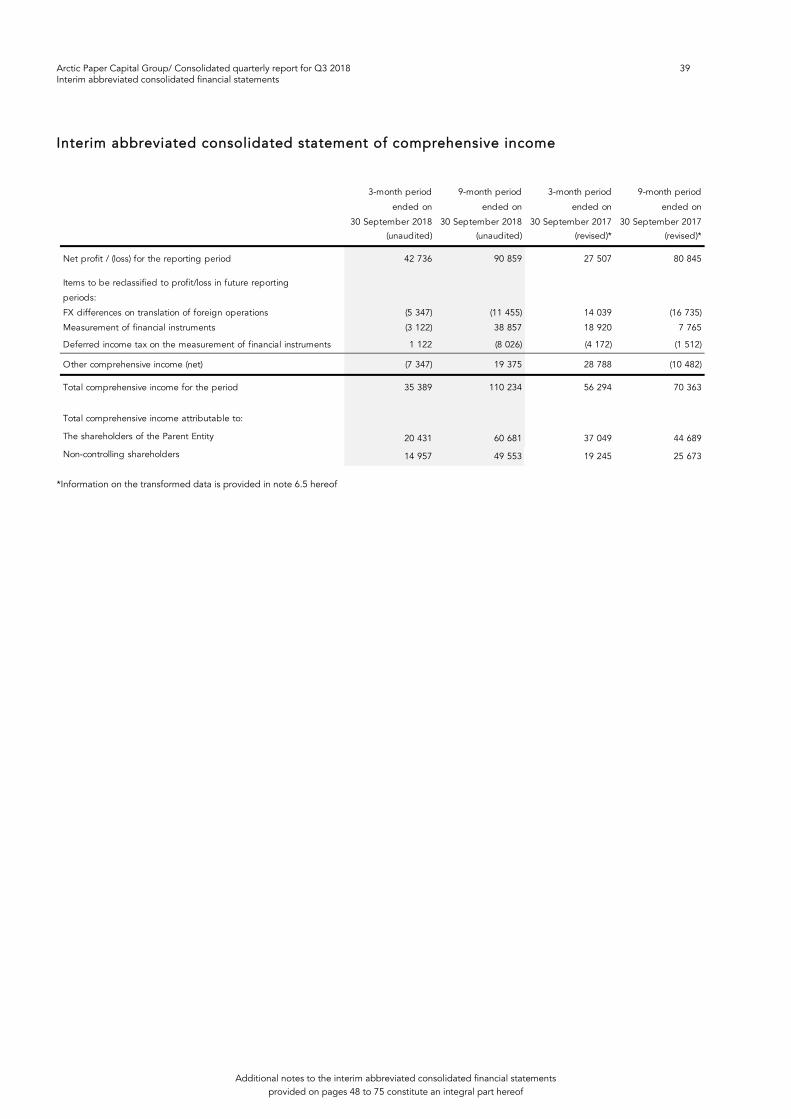
Arctic Paper Capital Group/ Consolidated quarterly report for Q3 2018 39 Interim abbreviated consolidated financial statements
Additional notes to the interim abbreviated consolidated financial statements provided on pages 48 to 75 constitute an integral part hereof
Interim abbreviated consolidated statement of comprehensive income
*Information on the transformed data is provided in note 6.5 hereof
3-month period
ended on
30 September 2018
9-month period
ended on
30 September 2018
3-month period
ended on
30 September 2017
9-month period
ended on
30 September 2017
(unaudited) (unaudited) (revised)* (revised)*
Net profit / (loss) for the reporting period 42 736 90 859 27 507 80 845
FX differences on translation of foreign operations (5 347) (11 455) 14 039 (16 735)
Measurement of financial instruments (3 122) 38 857 18 920 7 765
Deferred income tax on the measurement of financial instruments 1 122 (8 026) (4 172) (1 512)
Other comprehensive income (net) (7 347) 19 375 28 788 (10 482)
Total comprehensive income for the period 35 389 110 234 56 294 70 363
20 431 60 681 37 049 44 689
14 957 49 553 19 245 25 673 Non-controlling shareholders
Items to be reclassified to profit/loss in future reporting
periods:
Total comprehensive income attributable to:
The shareholders of the Parent Entity

Arctic Paper Capital Group/ Consolidated quarterly report for Q3 2018 40 Interim abbreviated consolidated financial statements
Additional notes to the interim abbreviated consolidated financial statements provided on pages 48 to 75 constitute an integral part hereof
Interim abbreviated consolidated statement of financial position
*Information on the transformed data is provided in note 6.5 hereof
As at
30 September 2018
As at
30 June 2018
As at
31 December 2017
As at
30 September 2017
(unaudited) (reviewed) (audited) (revised)*
ASSETS
Fixed assets
Tangible fixed assets 880 684 854 554 834 205 864 591
Investment properties 4 107 4 107 4 107 4 074
Intangible assets 47 920 50 064 51 108 59 106
Interests in joint ventures 966 976 988 898
Other financial assets 44 659 46 194 22 056 22 851
Other non-financial assets 1 498 1 512 1 513 1 335
Deferred income tax assets 27 479 27 939 32 387 22 429
1 007 313 985 346 946 363 975 285
Current assets
Inventories 439 420 409 243 350 996 355 500
Trade and other receivables 426 486 418 237 330 071 395 630
Corporate income tax receivables 11 154 9 495 6 687 11 825
Other non-financial assets 16 467 14 123 13 583 13 133
Other financial assets 47 441 51 753 7 151 9 000
Cash and cash equivalents 180 773 143 235 241 403 222 736
1 121 740 1 046 087 949 891 1 007 823
Assets related to discontinued operations 2 383 2 831 4 071 3 917
TOTAL ASSETS 2 131 437 2 034 263 1 900 325 1 987 025
EQUITY AND LIABILITIES
Equity
Equity (attributable to the shareholders of the Parent Entity)
Share capital 69 288 69 288 69 288 69 288
Reserve capital 407 976 407 976 447 638 447 638
Other reserves 134 282 136 196 125 997 127 958
FX differences on translation (15 812) (12 802) (9 207) 9 592
Retained earnings / Accumulated losses 22 521 (2 800) (62 364) (43 866)
Cumulated other comprehensive income related to discontinued operations (11 690) (11 725) (11 611) (11 966)
606 564 586 133 559 740 598 644
Non-controlling stake 269 597 254 640 231 555 248 502
Total equity 876 161 840 772 791 294 847 146
Long-term liabilities
Interest-bearing loans and borrowings 311 555 253 868 372 576 398 140
Provisions 102 122 103 512 101 554 88 257
Other financial liabilities 3 123 3 396 3 945 26 531
Deferred income tax liability 64 073 57 409 34 301 36 652
Accruals and deferred income 16 971 17 565 18 752 19 437
497 844 435 750 531 128 569 018
Short-term liabilities
Interest-bearing loans and borrowings 153 270 198 228 39 440 39 463
Provisions 552 279 4 667 -
Other financial liabilities 20 298 25 572 33 153 12 219
Trade and other payables 481 940 431 365 423 868 421 276
Income tax liability 291 1 212 570 256
Accruals and deferred income 99 503 99 342 74 576 82 607
755 855 755 996 576 276 555 822
Liabilities directly related to the discontinued operations 1 576 1 744 1 626 15 039
TOTAL LIABILITIES 1 255 276 1 193 491 1 109 030 1 139 879
TOTAL EQUITY AND LIABILITIES 2 131 437 2 034 263 1 900 325 1 987 025

Arctic Paper Capital Group/ Consolidated quarterly report for Q3 2018 41 Interim abbreviated consolidated financial statements
Additional notes to the interim abbreviated consolidated financial statements provided on pages 48 to 75 constitute an integral part hereof
Interim abbreviated consolidated cash flow statement
*Information on the transformed data is provided in note 6.5 hereof
3-month period
ended on
30 September
2018
9-month period
ended on
30 September
2018
3-month period
ended on
30 September
2017
9-month period
ended on
30 September
2017
(unaudited) (unaudited) (transformed)* (transformed)*
Ca sh f lows f rom op era t ing a ct ivit ies
Gross profit/(loss) on continuing operations 52 741 124 372 36 088 111 180
Gross profit /(loss) on discontinued operations (504) (2 344) (1 856) (5 873)
Gross profit (loss) 52 237 122 028 34 232 105 307
Adjustments for:
Depreciation/amortisation 23 065 68 371 27 494 80 865
FX gains / (loss) (1 153) 3 415 (370) (1 429)
Net interest and dividends 5 824 17 052 6 081 16 157
Profit / loss from investing activities (54) (58) (61) (48)
Increase / decrease in receivables and other non-financial assets (13 245) (103 536) (48 961) (59 235)
Change to inventories (33 015) (94 087) 1 014 7 948
38 725 44 629 45 686 26 153
Changes in accruals and prepayments (2 045) 21 295 (5 074) (11 806)
Change in provisions (39) (1 982) 6 (722)
Income tax paid (4 272) (9 442) (2 244) (2 927)
Co-generation certificates 1 627 767 (395) 278
Other 93 (329) 772 1 413
Net cash flows from operating activities 67 749 68 123 58 181 161 955
Ca sh f lows f rom inves t ing a ct ivit ies
Disposal of tangible fixed assets and intangible assets 149 1 311 62 182
Purchase of tangible fixed assets and intangible assets (39 256) (105 253) (51 447) (127 163)
Other capital outflows / inflows 19 (10 796) 0 445
Net cash flows from investing activities (39 089) (114 739) (51 385) (126 536)
Ca sh f lows f rom f ina ncing a ct ivit ies
Change to overdraft facilities 8 937 48 901 8 598 (38 880)
Repayment of financial leasing liabilities (258) (23 398) (981) (2 985)
Inflows from other financial liabilities - - - -
Repayment of other financial liabilities (415) (416) 383 (16 568)
Net inflows from bonds - - 175 461 175 461
Inflows from loans and borrowings 22 009 36 514 1 267 52 394
Borrowings and loans repaid (14 839) (31 933) (59 102) (76 152)
Dividend disbursed to shareholders of AP SA (0) (13 858) - -
Dividend disbursed to non-controlling shareholders - (11 510) - (12 759)
Interest paid (5 507) (16 412) (10 001) (21 184)
Net cash flows from financing activities 9 926 (12 112) 115 625 59 328
Change in cash and cash equivalents 38 587 (58 728) 122 421 94 746
Net FX differences (1 463) (3 099) 2 099 (327)
Cash and cash equivalents at the beginning of the period 144 901 243 851 101 375 131 476
Cash and cash equivalents at the end of the period 182 025 182 025 225 895 225 895
including with restricted access - - - -
Increase (decrease) of liabilities except loans, borrowings, bonds and other
financial liabilities
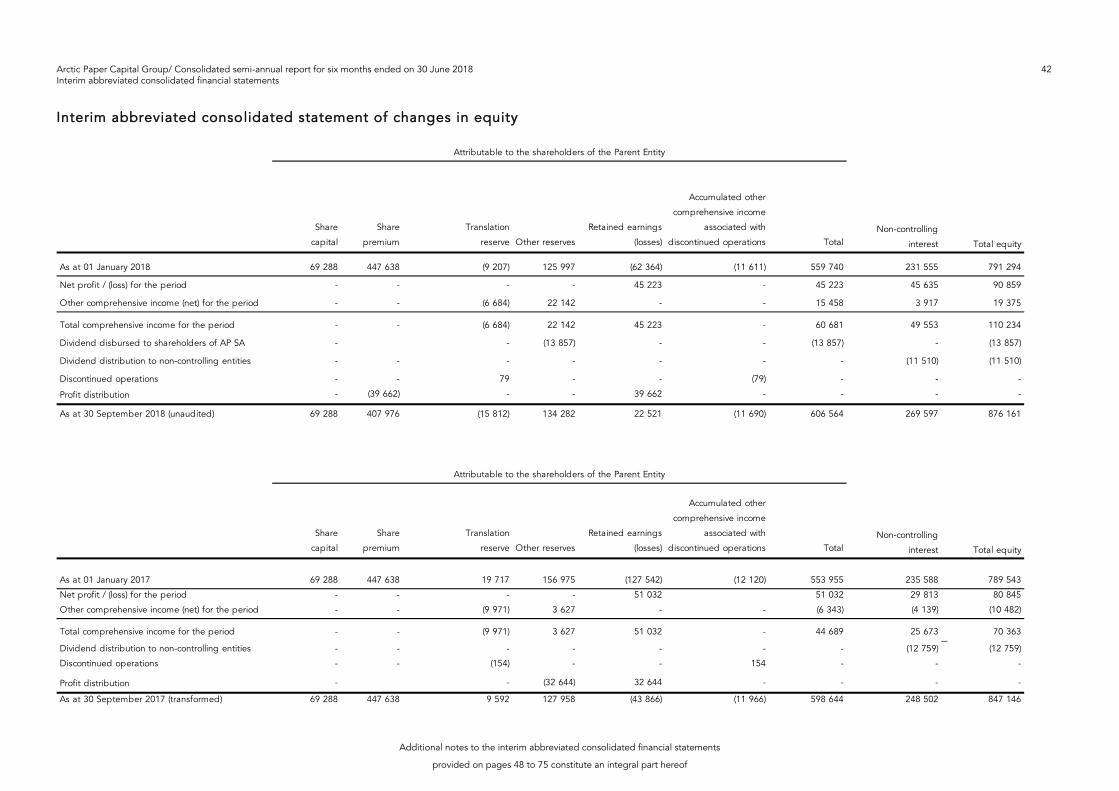
Arctic Paper Capital Group/ Consolidated semi-annual report for six months ended on 30 June 2018 42 Interim abbreviated consolidated financial statements
Additional notes to the interim abbreviated consolidated financial statements
provided on pages 48 to 75 constitute an integral part hereof
Interim abbreviated consolidated statement of changes in equity
Share
capital
Share
premium
Translation
reserve Other reserves
Retained earnings
(losses)
Accumulated other
comprehensive income
associated with
discontinued operations Total
As at 01 January 2018 69 288 447 638 (9 207) 125 997 (62 364) (11 611) 559 740 231 555 791 294
Net profit / (loss) for the period - - - - 45 223 - 45 223 45 635 90 859
Other comprehensive income (net) for the period - - (6 684) 22 142 - - 15 458 3 917 19 375
Total comprehensive income for the period - - (6 684) 22 142 45 223 - 60 681 49 553 110 234
Dividend disbursed to shareholders of AP SA - - (13 857) - - (13 857) - (13 857)
Dividend distribution to non-controlling entities - - - - - - - (11 510) (11 510)
Discontinued operations - - 79 - - (79) - - -
- (39 662) - - 39 662 - - - -
As at 30 September 2018 (unaudited) 69 288 407 976 (15 812) 134 282 22 521 (11 690) 606 564 269 597 876 161
Profit distribution
Non-controlling
interest Total equity
Attributable to the shareholders of the Parent Entity
Share
capital
Share
premium
Translation
reserve Other reserves
Retained earnings
(losses)
Accumulated other
comprehensive income
associated with
discontinued operations Total
As at 01 January 2017 69 288 447 638 19 717 156 975 (127 542) (12 120) 553 955 235 588 789 543
Net profit / (loss) for the period - - - - 51 032 51 032 29 813 80 845
Other comprehensive income (net) for the period - - (9 971) 3 627 - - (6 343) (4 139) (10 482)
Total comprehensive income for the period - - (9 971) 3 627 51 032 - 44 689 25 673 70 363
Dividend distribution to non-controlling entities - - - - - - - (12 759) (12 759)
Discontinued operations - - (154) - - 154 - - -
- - (32 644) 32 644 - - - -
As at 30 September 2017 (transformed) 69 288 447 638 9 592 127 958 (43 866) (11 966) 598 644 248 502 847 146
Profit distribution
Attributable to the shareholders of the Parent Entity
Non-controlling
interest Total equity

Arctic Paper Capital Group/ Consolidated semi-annual report for six months ended on 30 June 2018 43 Interim abbreviated standalone financial statements
Additional notes to the interim abbreviated standalone financial statements provided on pages 48 to 75 constitute an integral part hereof
Interim abbreviated standalone financial statements
Interim abbreviated standalone profit and loss statement
3-month period
ended on
30 September 2018
9-month period
ended on
30 September 2018
3-month period
ended on
30 September 2017
9-month period
ended on
30 September 2017
(unaudited) (unaudited) (unaudited) (unaudited)
Continuing operations
Revenues from sales of services 8 184 26 047 7 510 29 797
Interest income on loans 1 219 3 672 1 126 3 317
Dividend income 670 39 567 3 589 48 412
Sales revenues 10 073 69 287 12 226 81 526
(1 390) (3 915) (1 028) (4 438)
Profit / (loss) on sales 8 683 65 372 11 198 77 088
Other operating income 62 311 245 359
Selling and distribution costs (748) (2 247) (637) (3 056)
Administrative expenses (6 596) (20 730) (7 122) (25 013)
(192) (630) 1 399 (34 508)
Other operating expenses (47) (74) (18) (93)
Operating profit (loss) 1 161 42 002 5 065 14 777
Financial income 1 428 3 522 2 135 7 014
Financial expenses (5 060) (16 545) (5 278) (16 137)
Gross profit (loss) (2 470) 28 979 1 921 5 653
Income tax (4) (304) - -
(2 475) 28 675 1 921 5 653
Discontinued operations
- - - -
Net profit (loss) for the financial year (2 475) 28 675 1 921 5 653
Earnings per share:
(0,04) 0,41 0,03 0,08
(0,04) 0,41 0,03 0,08
– basic earnings from the profit (loss) for the period
– basic earnings from the profit (loss) from continuing
operations for the period
Interest expense to related entities and internal costs of sale of
logistics services
Impairment charges to assets
Net profit (loss) from continuing operations
Profit (loss) for the financial year from discontinued operations

Arctic Paper Capital Group/ Consolidated semi-annual report for six months ended on 30 June 2018 44 Interim abbreviated standalone financial statements
Additional notes to the interim abbreviated standalone financial statements provided on pages 48 to 75 constitute an integral part hereof
Interim abbreviated standalone comprehensive income statement
3-month period
ended on
30 September 2018
9-month period
ended on
30 September 2018
3-month period
ended on
30 September 2017
9-month period
ended on
30 September 2017
(unaudited) (unaudited) (unaudited) (unaudited)
Net profit/(loss) for the reporting period (2 475) 28 675 1 921 5 653
Measurement of financial instruments 362 595
FX differences on translation of foreign operations (53) 281 (237) 289
Other comprehensive income (net) 309 876 (237) 289
Total comprehensive income (2 166) 29 551 1 684 5 942
Items to be reclassified to profit/loss in future reporting
periods:
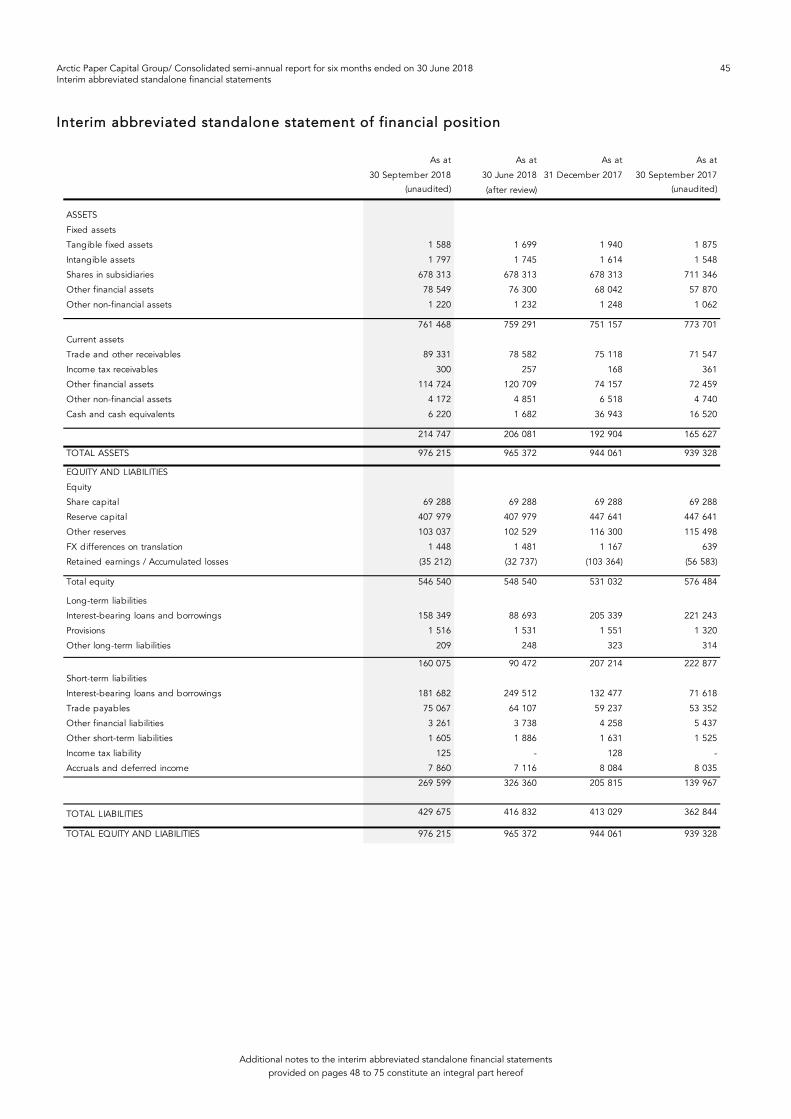
Arctic Paper Capital Group/ Consolidated semi-annual report for six months ended on 30 June 2018 45 Interim abbreviated standalone financial statements
Additional notes to the interim abbreviated standalone financial statements provided on pages 48 to 75 constitute an integral part hereof
Interim abbreviated standalone statement of financial position
As at
30 September 2018
As at
30 June 2018
As at
31 December 2017
As at
30 September 2017
(unaudited) (after review) (unaudited)
ASSETS
Fixed assets
Tangible fixed assets 1 588 1 699 1 940 1 875
Intangible assets 1 797 1 745 1 614 1 548
Shares in subsidiaries 678 313 678 313 678 313 711 346
Other financial assets 78 549 76 300 68 042 57 870
Other non-financial assets 1 220 1 232 1 248 1 062
761 468 759 291 751 157 773 701
Current assets
Trade and other receivables 89 331 78 582 75 118 71 547
Income tax receivables 300 257 168 361
Other financial assets 114 724 120 709 74 157 72 459
Other non-financial assets 4 172 4 851 6 518 4 740
Cash and cash equivalents 6 220 1 682 36 943 16 520
214 747 206 081 192 904 165 627
TOTAL ASSETS 976 215 965 372 944 061 939 328
EQUITY AND LIABILITIES
Equity
Share capital 69 288 69 288 69 288 69 288
Reserve capital 407 979 407 979 447 641 447 641
Other reserves 103 037 102 529 116 300 115 498
FX differences on translation 1 448 1 481 1 167 639
Retained earnings / Accumulated losses (35 212) (32 737) (103 364) (56 583)
Total equity 546 540 548 540 531 032 576 484
Long-term liabilities
Interest-bearing loans and borrowings 158 349 88 693 205 339 221 243
Provisions 1 516 1 531 1 551 1 320
Other long-term liabilities 209 248 323 314
160 075 90 472 207 214 222 877
Short-term liabilities
Interest-bearing loans and borrowings 181 682 249 512 132 477 71 618
Trade payables 75 067 64 107 59 237 53 352
Other financial liabilities 3 261 3 738 4 258 5 437
Other short-term liabilities 1 605 1 886 1 631 1 525
Income tax liability 125 - 128 -
Accruals and deferred income 7 860 7 116 8 084 8 035
269 599 326 360 205 815 139 967
TOTAL LIABILITIES 429 675 416 832 413 029 362 844
TOTAL EQUITY AND LIABILITIES 976 215 965 372 944 061 939 328
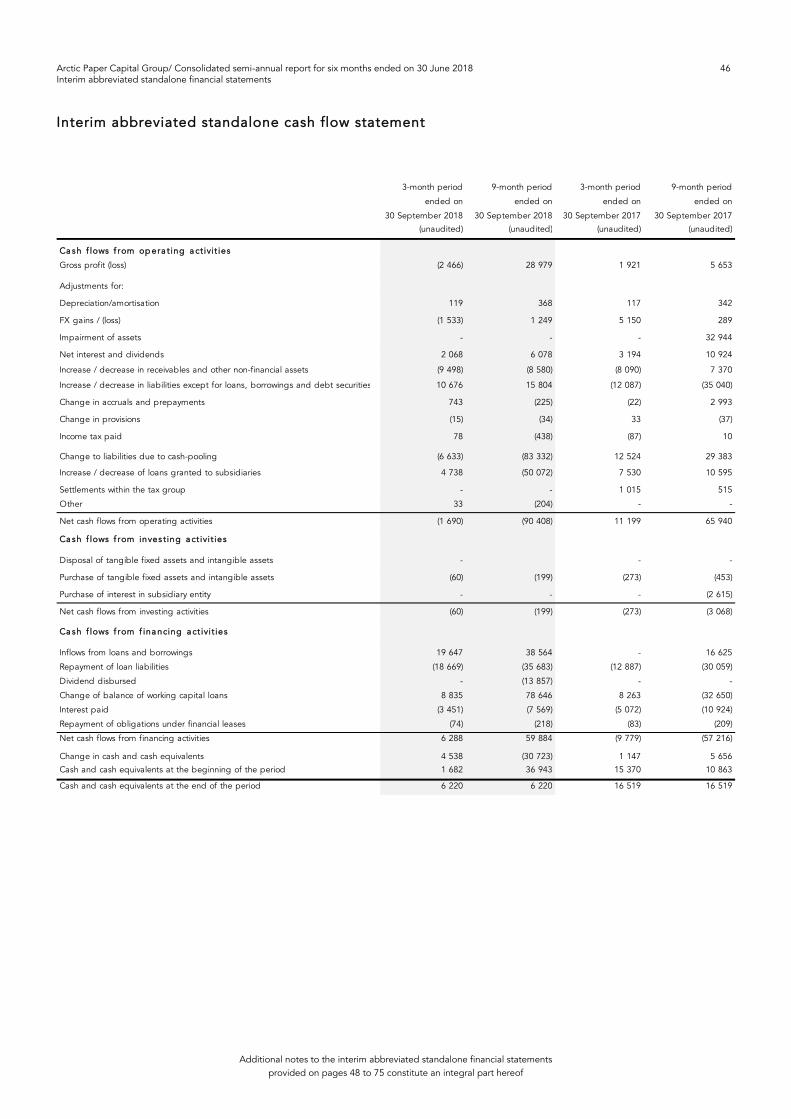
Arctic Paper Capital Group/ Consolidated semi-annual report for six months ended on 30 June 2018 46 Interim abbreviated standalone financial statements
Additional notes to the interim abbreviated standalone financial statements provided on pages 48 to 75 constitute an integral part hereof
Interim abbreviated standalone cash flow statement
3-month period
ended on
30 September 2018
9-month period
ended on
30 September 2018
3-month period
ended on
30 September 2017
9-month period
ended on
30 September 2017
(unaudited) (unaudited) (unaudited) (unaudited)
Ca sh f lows f rom op era t ing a ct ivit ies
Gross profit (loss) (2 466) 28 979 1 921 5 653
Adjustments for:
Depreciation/amortisation 119 368 117 342
FX gains / (loss) (1 533) 1 249 5 150 289
Impairment of assets - - - 32 944
Net interest and dividends 2 068 6 078 3 194 10 924
Increase / decrease in receivables and other non-financial assets (9 498) (8 580) (8 090) 7 370
Increase / decrease in liabilities except for loans, borrowings and debt securities 10 676 15 804 (12 087) (35 040)
Change in accruals and prepayments 743 (225) (22) 2 993
Change in provisions (15) (34) 33 (37)
Income tax paid 78 (438) (87) 10
(6 633) (83 332) 12 524 29 383
4 738 (50 072) 7 530 10 595
Settlements within the tax group - - 1 015 515
Other 33 (204) - -
Net cash flows from operating activities (1 690) (90 408) 11 199 65 940
Ca sh f lows f rom inves t ing a ct ivit ies
Disposal of tangible fixed assets and intangible assets - - -
Purchase of tangible fixed assets and intangible assets (60) (199) (273) (453)
Purchase of interest in subsidiary entity - - - (2 615)
Net cash flows from investing activities (60) (199) (273) (3 068)
Ca sh f lows f rom f ina ncing a ct ivit ies
Inflows from loans and borrowings 19 647 38 564 - 16 625
Repayment of loan liabilities (18 669) (35 683) (12 887) (30 059)
Dividend disbursed - (13 857) - -
Change of balance of working capital loans 8 835 78 646 8 263 (32 650)
Interest paid (3 451) (7 569) (5 072) (10 924)
Repayment of obligations under financial leases (74) (218) (83) (209)
Net cash flows from financing activities 6 288 59 884 (9 779) (57 216)
Change in cash and cash equivalents 4 538 (30 723) 1 147 5 656
Cash and cash equivalents at the beginning of the period 1 682 36 943 15 370 10 863
Cash and cash equivalents at the end of the period 6 220 6 220 16 519 16 519
Change to liabilities due to cash-pooling
Increase / decrease of loans granted to subsidiaries
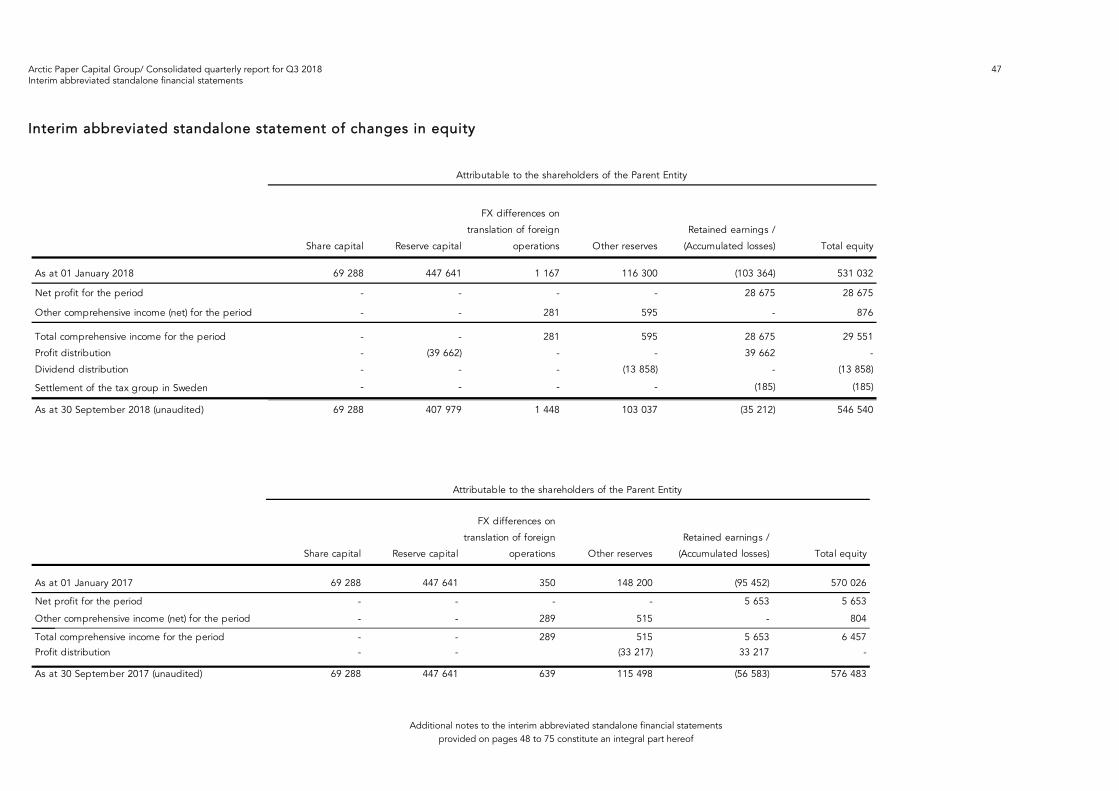
Arctic Paper Capital Group/ Consolidated quarterly report for Q3 2018 47 Interim abbreviated standalone financial statements
Additional notes to the interim abbreviated standalone financial statements provided on pages 48 to 75 constitute an integral part hereof
Interim abbreviated standalone statement of changes in equity
Share capital Reserve capital
FX differences on
translation of foreign
operations Other reserves
Retained earnings /
(Accumulated losses) Total equity
As at 01 January 2018 69 288 447 641 1 167 116 300 (103 364) 531 032
Net profit for the period - - - - 28 675 28 675
Other comprehensive income (net) for the period - - 281 595 - 876
Total comprehensive income for the period - - 281 595 28 675 29 551
- (39 662) - - 39 662 -
Dividend distribution - - - (13 858) - (13 858)
- - - - (185) (185)
As at 30 September 2018 (unaudited) 69 288 407 979 1 448 103 037 (35 212) 546 540
Settlement of the tax group in Sweden
Attributable to the shareholders of the Parent Entity
Profit distribution
Share capital Reserve capital
FX differences on
translation of foreign
operations Other reserves
Retained earnings /
(Accumulated losses) Total equity
As at 01 January 2017 69 288 447 641 350 148 200 (95 452) 570 026
Net profit for the period - - - - 5 653 5 653
Other comprehensive income (net) for the period - - 289 515 - 804
Total comprehensive income for the period - - 289 515 5 653 6 457
Profit distribution - - (33 217) 33 217 -
As at 30 September 2017 (unaudited) 69 288 447 641 639 115 498 (56 583) 576 483
Attributable to the shareholders of the Parent Entity
Arctic Paper Capital Group/ Consolidated quarterly report for Q3 2018 48 Interim abbreviated consolidated financial statements
Additional explanatory notes
1. General information
The Arctic Paper Group is a leading European producer in terms of production volume of bulky book paper, offering a
broad range of products in the segment and one of the leading producers of high -quality graphic paper in Europe. The
Group produces numerous types of uncoated and coated wood-free paper as well as wood-containing uncoated paper for
printing houses, paper distributors, book and magazine publishing houses and the advertising industry. As of the day
hereof, the Arctic Paper Group employs app. 1,700 people in its Paper Mills and Pulp Mills, companies dealing in paper
distribution the procurement office. Our Paper Mills are located in Poland and Sweden and have total production capacity
of more than 700,000 metric tons of paper per year. The Pulp Mills are located in Sweden and have total production
capacity of app.400,000 tons of pulp per year. The Group has fourteen Sales Offices which handle distribution and
marketing of products offered by the Group providing access to all Europe an markets, including Central and Eastern
Europe.
Our consolidated sales revenues for nine months of 2018 amounted to PLN 2,378 million.
Arctic Paper S.A. is a holding company set up in April 2008. As a result of capital restructuring carried out in 2008, the
Paper Mills Arctic Paper Kostrzyn (Poland) and Arctic Paper Munkedals (Sweden), Distribution Companies and Sales Offices
have become the properties of Arctic Paper SA. Previously they were owned by Arctic Paper AB (now Trebruk AB), which
was then the parent company of Arctic Paper S.A. In addition, under the expansion, the Group acquired the Paper Mill
Arctic Paper Mochenwangen (Germany) in November 2008 and the Paper Mill Grycksbo (Sweden) in March 2010. In 2012,
the Group acquired shares in Rottneros AB, a company listed on NASDAQ in Stockholm, Sweden, holding interests in two
Pulp Mills (Sweden).
The Parent Entity is entered in the register of entrepreneurs of the National Court Register maintained by the District Court
in Poznań – Nowe Miasto i Wilda, 8th Commercial Division of the National Court Regi ster, under KRS number 0000306944.
The Parent Entity holds statistical number REGON 080262255. The Company has a foreign branch in Göteborg, Sweden.
The interim abbreviated consolidated financial statements of the Group for 9 months of 2018 cover:
— interim abbreviated consolidated profit and loss account, statement of comprehensive income and a cash flow statement
for the periods of three and nine months ended on 30 September 2018 and contain compar able data for the equivalent
periods ended on 30 September 2017.
— interim abbreviated statement of changes in equity for the period of nine months ended on 30 September 2018 and
comparative data for the equivalent period ended on 30 September 2017 as well a s for the year ended on 31 December
2017;
— interim consolidated statement of financial position as at 30 September 2018 and comparative data as at 30 June 2018,
31 December 2017 and 30 September 2017.
Arctic Paper Capital Group/ Consolidated quarterly report for Q3 2018 49 Interim abbreviated consolidated financial statements
1.1. Group Profile
The main area of the Arctic Paper Group’s business activities is paper production.
The additional business activities of the Group, subordinated to paper production are:
Production and sales of pulp,
Generation of electricity,
Transmission of electricity,
Electricity distribution,
Heat production,
Heat distribution,
Logistics services,
Paper distribution.
1.2. Shareholding structure
Nemus Holding AB, a company under Swedish law (a company owned indirectly by Mr Thomas Onstad), is the majority
shareholder of Arctic Paper S.A., holding (as at 30 September 2018) 40,381,449 shares of our Company, which consti tutes
58.28% of its share capital and corresponds to 58.28% of the total number of votes at General Meetings. Thus Nemus
Holding AB is the parent entity of the Issuer.
Additionally, Mr Thomas Onstad, an indirect shareholder of Nemus Holding AB, holds dire ctly 6,223,658 shares
representing 8.98% of the total number of shares in the Company, and via another entity – 600,000 shares accounting for
0.87% of the total number of shares of the Issuer. Mr Thomas Onstad’s total direct and indirect holding in the cap ital of
Arctic Paper S.A. as at 30 September 2018 was 68.13% and has not changed until the date hereof.
The parent company of the Arctic Paper Group is Incarta Development S.A.
The duration of the Company is indefinite.
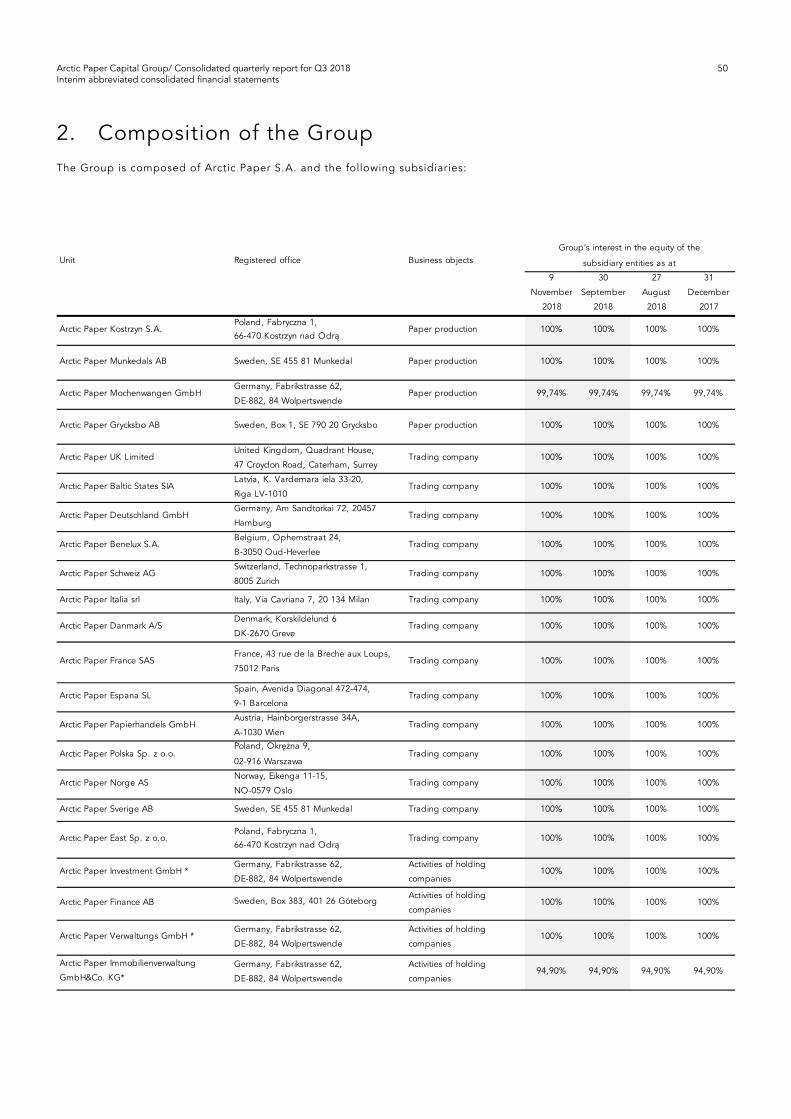
Arctic Paper Capital Group/ Consolidated quarterly report for Q3 2018 50 Interim abbreviated consolidated financial statements
2. Composition of the Group The Group is composed of Arctic Paper S.A. and the following subsidiaries:
9
November
2018
30
September
2018
27
August
2018
31
December
2017
Arctic Paper Kostrzyn S.A.Poland, Fabryczna 1,
66-470 Kostrzyn nad OdrąPaper production 100% 100% 100% 100%
Arctic Paper Munkedals AB Sweden, SE 455 81 Munkedal Paper production 100% 100% 100% 100%
Arctic Paper Mochenwangen GmbHGermany, Fabrikstrasse 62,
DE-882, 84 WolpertswendePaper production 99,74% 99,74% 99,74% 99,74%
Arctic Paper Grycksbo AB Sweden, Box 1, SE 790 20 Grycksbo Paper production 100% 100% 100% 100%
Arctic Paper UK LimitedUnited Kingdom, Quadrant House,
47 Croydon Road, Caterham, SurreyTrading company 100% 100% 100% 100%
Arctic Paper Baltic States SIALatvia, K. Vardemara iela 33-20,
Riga LV-1010Trading company 100% 100% 100% 100%
Arctic Paper Deutschland GmbHGermany, Am Sandtorkai 72, 20457
HamburgTrading company 100% 100% 100% 100%
Arctic Paper Benelux S.A.Belgium, Ophemstraat 24,
B-3050 Oud-HeverleeTrading company 100% 100% 100% 100%
Arctic Paper Schweiz AGSwitzerland, Technoparkstrasse 1,
8005 ZurichTrading company 100% 100% 100% 100%
Arctic Paper Italia srl Italy, Via Cavriana 7, 20 134 Milan Trading company 100% 100% 100% 100%
Arctic Paper Danmark A/SDenmark, Korskildelund 6
DK-2670 GreveTrading company 100% 100% 100% 100%
Arctic Paper France SASFrance, 43 rue de la Breche aux Loups,
75012 ParisTrading company 100% 100% 100% 100%
Arctic Paper Espana SLSpain, Avenida Diagonal 472-474,
9-1 BarcelonaTrading company 100% 100% 100% 100%
Arctic Paper Papierhandels GmbHAustria, Hainborgerstrasse 34A,
A-1030 WienTrading company 100% 100% 100% 100%
Arctic Paper Polska Sp. z o.o.Poland, Okrężna 9,
02-916 WarszawaTrading company 100% 100% 100% 100%
Arctic Paper Norge ASNorway, Eikenga 11-15,
NO-0579 Oslo Trading company 100% 100% 100% 100%
Arctic Paper Sverige AB Sweden, SE 455 81 Munkedal Trading company 100% 100% 100% 100%
Arctic Paper East Sp. z o.o.Poland, Fabryczna 1,
66-470 Kostrzyn nad OdrąTrading company 100% 100% 100% 100%
Arctic Paper Investment GmbH *Germany, Fabrikstrasse 62,
DE-882, 84 Wolpertswende
Activities of holding
companies100% 100% 100% 100%
Sweden, Box 383, 401 26 GöteborgActivities of holding
companies 100% 100% 100% 100%
Arctic Paper Verwaltungs GmbH *Germany, Fabrikstrasse 62,
DE-882, 84 Wolpertswende
Activities of holding
companies100% 100% 100% 100%
Germany, Fabrikstrasse 62,
DE-882, 84 Wolpertswende
Activities of holding
companies94,90% 94,90% 94,90% 94,90%
Arctic Paper Finance AB
Arctic Paper Immobilienverwaltung
GmbH&Co. KG*
Unit Registered office Business objectsGroup’s interest in the equity of the
subsidiary entities as at
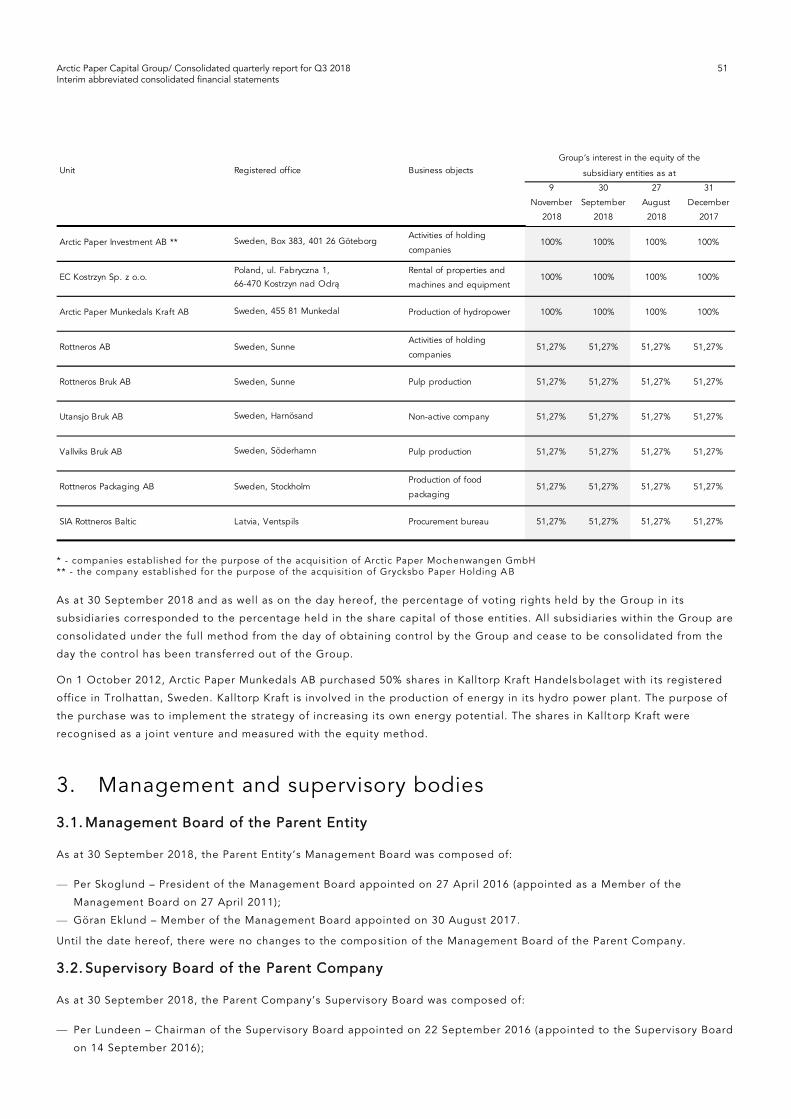
Arctic Paper Capital Group/ Consolidated quarterly report for Q3 2018 51 Interim abbreviated consolidated financial statements
* - companies established for the purpose of the acquisition of Arctic Paper Mochenwangen GmbH ** - the company established for the purpose of the acquisition of Grycksbo Paper Holding A B
As at 30 September 2018 and as well as on the day hereof, the percentage of voting rights held by the Group in its
subsidiaries corresponded to the percentage held in the share capital of those entities. All subsidiaries within the Group are
consolidated under the full method from the day of obtaining control by the Group and cease to be consolidated from the
day the control has been transferred out of the Group.
On 1 October 2012, Arctic Paper Munkedals AB purchased 50% shares in Kalltorp Kraft Handels bolaget with its registered
office in Trolhattan, Sweden. Kalltorp Kraft is involved in the production of energy in its hydro power plant. The purpose of
the purchase was to implement the strategy of increasing its own energy potential. The shares in Kallt orp Kraft were
recognised as a joint venture and measured with the equity method.
3. Management and supervisory bodies
3.1. Management Board of the Parent Entity
As at 30 September 2018, the Parent Entity’s Management Board was composed of:
— Per Skoglund – President of the Management Board appointed on 27 April 2016 (appointed as a Member of the
Management Board on 27 April 2011);
— Göran Eklund – Member of the Management Board appointed on 30 August 2017.
Until the date hereof, there were no changes to the composition of the Management Board of the Parent Company.
3.2. Supervisory Board of the Parent Company
As at 30 September 2018, the Parent Company’s Supervisory Board was composed of:
— Per Lundeen – Chairman of the Supervisory Board appointed on 22 September 2016 (a ppointed to the Supervisory Board
on 14 September 2016);
9
November
2018
30
September
2018
27
August
2018
31
December
2017
Arctic Paper Investment AB ** Sweden, Box 383, 401 26 GöteborgActivities of holding
companies100% 100% 100% 100%
EC Kostrzyn Sp. z o.o.Poland, ul. Fabryczna 1,
66-470 Kostrzyn nad Odrą
Rental of properties and
machines and equipment100% 100% 100% 100%
Arctic Paper Munkedals Kraft AB Sweden, 455 81 Munkedal Production of hydropower 100% 100% 100% 100%
Rottneros AB Sweden, SunneActivities of holding
companies51,27% 51,27% 51,27% 51,27%
Rottneros Bruk AB Sweden, Sunne Pulp production 51,27% 51,27% 51,27% 51,27%
Utansjo Bruk AB Sweden, Harnösand Non-active company 51,27% 51,27% 51,27% 51,27%
Vallviks Bruk AB Sweden, Söderhamn Pulp production 51,27% 51,27% 51,27% 51,27%
Rottneros Packaging AB Sweden, StockholmProduction of food
packaging51,27% 51,27% 51,27% 51,27%
SIA Rottneros Baltic Latvia, Ventspils Procurement bureau 51,27% 51,27% 51,27% 51,27%
Unit Registered office Business objectsGroup’s interest in the equity of the
subsidiary entities as at

Arctic Paper Capital Group/ Consolidated quarterly report for Q3 2018 52 Interim abbreviated consolidated financial statements
— Roger Mattsson – Deputy President of the Supervisory Board appointed on 22 September 2016 (appointed as a Member
of the Supervisory Board on 16 September 2014);
— Thomas Onstad – Member of the Supervisory Board appointed on 22 October 2008;
— Mariusz Grendowicz – Member of the Supervisory Board appointed on 28 June 2012 (independent member);
— Maciej Georg – Member of the Supervisory Board appointed on 14 September 2016 (independent member).
On 13 June 2018, the Ordinary General Meeting decided to appoint the Supervisory Board with no changes for the next joint
term of office, effective on 21 December 2018.
Until the date hereof, there were no changes to the composition of the Supervisory Board of the Paren t Company.
3.3. Audit Committee of the Parent Entity
As at 30 September 2018, the Parent Entity’s Audit Committee was compos ed of:
Mariusz Grendowicz – President of the Audit Committee appointed on 18 September 2017 (appointed as a Member of
the Audit Committee on 20 February 2013);
Roger Mattsson – Member of the Audit Committee appointed on 23 June 2016;
Maciej Georg – Member of the Audit Committee appointed on 22 September 2016. Until the date hereof, there were no changes in the composition of the Audit Comm ittee of the Parent Company.
4. Approval of the financial statements These interim abbreviated consolidated financial statements were approved for publication by the Management Board on 9
November 2018.
5. Basis of preparation of the interim abbreviated consolidated financial statements
These interim abbreviated consolidated financial statements were prepared in accordance with the requirements of
International Accounting Standard No. 34 and the Regulation of the Minister of Finance of 29 March 2018 on current an d
periodic disclosure provided by issuers of securities and on conditions under which information required by legal
regulations of a non-Member State may be recognised as equivalent (Journal of Laws of 2018, item 757).
These interim abbreviated consolidated financial statements have been presented in Polish zloty (“PLN”) and all values are
rounded to the nearest thousand (PLN ‘000) except as stated otherwise.
These interim abbreviated consolidated financial statements have been prepared based on the assu mption that the Group
will continue as a going concern in the foreseeable future.
In connection with the term and revolving loan agreements, agreements related to bond issues, signed on 9 September
2016, the Group agreed to maintain specified financial rat ios that are calculated at the end of each quarter. As at 30
September 2018, the Group complied with the financial ratios required with the above loan agreement concluded with the
consortium of financing banks (Santander Bank S.A. [Bank Zachodni WBK S.A.], Bank BGŻ BNP Paribas S.A., European Bank
for Reconstruction and Development).
The interim abbreviated consolidated financial statements do not include all the information and disclosures required in the
annual consolidated financial statements and should be read in conjunction with the Group’s annual consolidated financial
statements for the year ended on 31 December 2017.
6. Significant accounting principles (policies)
The accounting principles (policies) applied to prepare the abbreviated interim consolidat ed financial statements are
compliant with those applied to the annual consolidated financial statement s of the Group for the year ended on 31
December 2017, with the following exceptions:
Arctic Paper Capital Group/ Consolidated quarterly report for Q3 2018 53 Interim abbreviated consolidated financial statements
— IFRS 15 Revenue from Contracts with Customers (issued on 28 May 201 4) – effective for financial years beginning on or
after 1 January 2018,
The Management Board analysed the existing agreements and in view of their nature and no non-standard provisions,
the amendments to IFRS 15 had no material impact on the Group's resul ts (details are presented in note 6.1 hereof).
— IFRS 9 Financial Instruments (issued on 24 July 2014) – effective for financial years beginning on or after 1 January 2018.
The Management Board analysed the existing agreements and in view of their nature, th e amendments to IFRS 9 had no
material impact on the Group's results (details are presented in note 6.2 hereof).
6.1. Implementation of IFRS 15
Selected accounting principles
The International Financial Reporting 15 Revenue from Contracts with Customers (“I FRS 15”), issued in May 2014 and
amended in April 2016, establishes a Five-Step Model to recognise revenues resulting from contracts with customers.
Requirements applicable to identifying contracts with customers: contracts with customers meet the definit ion when all
of the following criteria have been satisfied: the parties to the contract have concluded the contract and are obliged to
perform their obligations; the Group is able to identify the rights of each party concerning the goods and services to be
provided; the Group is able to identify the payment terms for the goods and services to be provided; the contract has
economic content and it is likely that the Group will receive its remuneration due to it in exchange for the goods and
services to be provided to the customer.
— Identification of obligations to perform the service: at contract conclusion, the Group assesses the goods and services
promised in the contract and identifies each promise as a liability for deliver to the customer: the goods or ser vices (or a
package of goods or services) that may be identified or a group of separate goods or services that are basically the
same and when the delivery has the same nature.
— Identification of the transactional price: in order to determine the transactio nal price, the Group takes the contractual
conditions into account as well as its customary commercial practices. The transactional price is the amount that - as the
Group expects - will be due to it in exchange for the delivery of the promised goods or se rvices to the customer, net of
any amounts collected on behalf of third parties. The contractual remuneration may cover fixed amounts, variable
amounts or both types; in order to estimate the variable remuneration, the Group has decided to apply the most
probable value method.
— The allocation of the transactional price of each liability to perform: The Group allocates the transactional price to each
obligation to perform (or for separate goods or separate services) in an amount that reflects the remuneration amount, in
line with the Group’s expectations - it is due to the Group in exchange for the delivery of the promised goods or
services to the customer.
— Revenue recognition when the obligation to perform is being executed: The Group recognises revenues at c ompletion
(or during completion) of its obligation to perform by delivery of the promised goods or services (an asset) to the
customer (the customer acquires control over the asset). Revenues are recognised in the remuneration amount which – as
expected by the entity – is due to it in exchange for the goods or services promised to customers.
Impact assessment of the new standard
The Group applied IFRS 15 from its effective date, applying a full retrospective method.
The Group is primarily involved in sales of paper and pulp. A detailed analysis of the impact of the changes was completed
in 2017. The analysed areas:
Identification of contractual obligations to perform: the business objects of the Group include production and sale of
standardised paper types and pulp products; therefore, the acceptance of IFRS 15 has no impact on the Group's
revenues and profit and loss with reference to contracts with customers under which sal e of products is the sole
contractual obligation to perform. The Group generates sales invoices and recognises revenues at the time when control
over assets is transferred to customers - generally, at delivery of the goods.
— Variable remuneration: certain contracts with customers provide for quantitative rebates; the Group recognises re venues
from sales of goods measured at the fair value of the received remuneration or receivables, net of any discounts and
quantitative rebates; if the revenues cannot be re liably estimated, the Group delays revenue recognition until such time
when the uncertainty is resolved. As a result, variable remuneration is generated in compliance with IFRS 15 which is
Arctic Paper Capital Group/ Consolidated quarterly report for Q3 2018 54 Interim abbreviated consolidated financial statements
estimated at contract conclusion and updated afterwards. In accordance with IFRS 15, the estimated remuneration is
limited to prevent re-evaluation of revenues. The applied limitation did not result in additional adjustment to revenues
as the amount of the estimated rebate was estimated at contract conclusion (the amount of the estimated rebate is
recognised in the period when the sale is executed).
— Presentation and requirements concerning disclosures: as IFRS 15 has no impact on the value and time of revenue
recognition in the Group versus the principles used so far, the Group has not made any additional disclosures in this
consolidated quarterly report.
6.2. Implementation of IFRS 9
Selected accounting principles
In July 2014, the International Accounting Standards Board published International Financial Reporting Standard 9 Financial
Instruments ("IFRS 9"). IFRS 9 covers three aspects related to financ ial instruments: classification and measurement,
impairment, and hedge accounting. IFRS 9 is effective for annual periods beginning on or after 1 January 2018, with the
possibility of earlier application.
Classification and measurement of financial assets and liabilities
In compliance with IFRS 9, the Group classifies financial assets to one of the following categories:
measured at amortised cost: To measure its financial assets measured at amortised cost, the Group applies the effective
interest rate method; those are trade receivables, loans granted, other financial receivables and cash and cash
equivalents. After initial recognition, trade receivables are measured amortised cost with the effective interest rate
method subject to impairment allowances’ trade receivables due within 12 months of the day of their origin (without
financing elements) and not forwarded to factoring, are not discounted and are measured at nominal;
measured at fair value through other comprehensive income: profit and loss on a fina ncial asset being a capital
instrument which is subject to a measurement option via other comprehensive income, are recognised in other
comprehensive income with the exception of dividend received;
measured at fair value through financial results: profit o r loss resulting from measurement of financial assets, classi fied
as measured at fair value through profit and loss, are recognised in profit and loss account in the period in which it was
generated; those are primarily derivative instruments not designate d for hedge accounting. Profit or loss resulting from
measurement of items measured at fair value through profit and loss account covers also interest and dividend revenues.
hedging financial instruments: Hedging financial instruments are measured in compl iance with the principles of hedge
accounting.
The Group classifies debt financial assets to an appropriate category subject to the business model of managing financial
assets and to the characteristics of contractual cash flows for each financial asset.
In compliance with IFRS 9, the Group classifies financial liabilities to one of the following categories:
measured at amortised cost: trade payables, loans, borrowings and bonds
measured at fair value via the profit and loss account: liabilities under deri vative instruments not designated to hedge
accounting
hedging financial instruments, assets and financial liabilities being derivative instruments hedging cash flows and
hedging fair value
Impairment of financial assets
IFRS 9 introduces a new approach to estimating impairment of financial assets at amortised cost o r at fair value via other
comprehensive income (except investments in financial assets and contractual assets). The impairment model is based on
calculation of anticipated losses contrary to the currently applied model resulting from IAS 39 which was based on a
concept of incurred losses. Trade receivables are the most important financial asset in the Group’s financial statements that
are subject to the new principles of calculating anticipated credit losses.
The Group applies a simplified model to recognise impairment allowances to trade receivables.
In the simplified model, the Group does not monitor changes to credit risk level over the life of the instrument and
estimates anticipated credit losses over the horizon until the maturity of the instrument. In order to estimate the anticipated
credit loss, the Group applies a provision matrix estimated on the basis of historic collectibility levels and recoveries fro m

Arctic Paper Capital Group/ Consolidated quarterly report for Q3 2018 55 Interim abbreviated consolidated financial statements
counterparties. The anticipated credit loss is calculated at the time the receivables are recognised in the statement of
financial position and it is updated as at each closing of reporting periods, subject to the number of overdue dates.
Hedge accounting
The Group decided to continue applying accounting principles compliant with IAS 39 with respect to hedging instruments.
Impact assessment of the new standard
The Group applied IFRS 9 from its effective date which was January 2018, without transforming its comparable data. In
2017, the Group carried out an assessment of the impact of the IFRS 9 introduction on the accounting principles (policy)
applied by the Group with respect to the Group's operations or its financial results. The implementation of IFRS 9 did not
have any impact on the statement of financial position and equity. As a result of the application of IFRS 9, classification to
certain financial instruments was changed.
— Classification and measurement: the application of IFRS 9 did not affect the measurement of financial assets a nd
liabilities and on the relevant values recognised in the statement of financial position and on equity. The Group
classified financial assets and liabilities in accordance with IFRS 9. Trade receivables until contractual cash flows are
received and therefore they continue to be measured at amortised cost th rough profit and loss account. The Group sells
trade receivables under no-recourse factoring - each payment from the factor automatically repays the receivables from
counterparties. The Group uses a practical exemption, and for trade receivables less than 12 months does not identify
significant elements of financing.
The table below presents the classification and measurement of the financial assets in compliance with IAS 39 and IFRS 9 as
at 1 January 2018:
— Impairment: In accordance with IFRS 9, the Group measures write-downs for expected credit losses in the amount equal
to the 12-month expected credit losses or expected credit losses in the life of the financial instrument. In case of trade
receivables, the Group applies a simplified approach and estimates allowances for anticipated credit loss equal to
anticipated credit loss over the life of the receivables which does not exceed 12 months. In view of the nature of trade
receivables, the calculation method of impairment has not changed.
— Hedge accounting: since the Group decided to continue to apply IAS 39 in that respect, the entry into force of IFRS 9
did not affect the Group's financial statements.
6.3. New standards and interpretations that have been published and are not yet effective
The following standards and interpretations were issued by the International Accounting Standards Board (IASB) or the
International Financial Reporting Interpretations Committee (IFRIC) but are not yet effective:
— IFRS 16 Leasing (issued on 13 January 2016) – effective for financial years beginning on or after 1 January 2019.
The Group does not expect the Standard to have material impact on its financial statements at its effective date since no uni t
is not a party to material contracts covered with IFRS 16.
Category and method
in compliance with IAS
39
Value in
compliance with
IAS 39 as at
1 January 2018
Category and valuation
method in compliance
with IFRS 9
Value in
compliance with
IFRS 9 as at
1 January 2018
Loans and receivables
valued at amortised
cost 305 368
Financial assets valued at
amortised cost 305 368
Loans and receivables
valued at amortised
cost 7 293
Financial assets valued at
amortised cost 7 293
Cash and cash equivalents
Loans and receivables
valued at amortised
cost 241 403
Financial assets valued at
amortised cost 241 403
Other financial assets
Trade and other receivables

Arctic Paper Capital Group/ Consolidated quarterly report for Q3 2018 56 Interim abbreviated consolidated financial statements
6.4. Foreign currency translation
Transactions denominated in currencies other than the functional currency of the entity are translated into the presentation
currency at the foreign exchange rate prevailing on the transaction date.
On the balance sheet date, monetary assets and liabiliti es expressed in currencies other than the functional currency of the
entity are translated into the functional currency using the mean foreign exchange rate prevailing for the presentatio n
currency as at the end of the reporting period. Foreign exchange di fferences from translation are recognised under financial
income or financial expenses or are capitalised as cost of assets, as defined in the accounting policies. Non -monetary
foreign currency assets and liabilities recognised at historical cost are trans lated at the historical foreign exchange rates
prevailing on the transaction date. Non-monetary foreign currency assets and liabilities recognised at fair value are
translated into PLN using the rate of exchange prevailing on the date of revaluation to fai r value.
The functional currencies of the foreign subsidiaries are EUR, SEK, DKK, NOK, GBP and CHF. As on the balance sheet date,
the assets and liabilities of those subsidiaries are translated into the presentation currency of the Group (PLN) at the rate of
exchange prevailing on the balance sheet date and their income statements are translated using the average weighted
exchange rates for the relevant reporting period. The FX differences on translation are recognised in other total
comprehensive income and cumulated in a separate equity item. On disposal of a foreign operation, the cumulative amount
of the deferred exchange differences recognised in equity and relating to that particular foreign operation shall be
recognised in the profit and loss account.
Exchange differences on loans treated in compliance with IAS 21 as investments in subsidiaries are recognised in the
interim abbreviated consolidated financial statements in other total comprehensive income.
The following exchange rates were used for book valuation purposes:
Mean foreign exchange rates for the reporting periods are as follows:
6.5. Data comparability / adjustments to previous years’ errors
In order to verify the economic useful life for tangible fixed assets and intangible assets as at 31 December 2017, the Group
decided to adjust the economic useful life periods for tangible fixed assets and intangible assets for the Rottneros Group to
those applied by the Rottneros Group for consolidation purposes to those that are actually used by the Group in a
retrospective approach (earlier economic useful life periods had been based on estimates by appraisers who appraised the
assets as of the day control was assumed over Rottneros AB which was not cohesive with the economic useful life periods
30 September 2018
31 December 2017
USD 3,6754 3,4813
EUR 4,2714 4,1709
SEK 0,4149 0,4243
DKK 0,5728 0,5602
NOK 0,4503 0,4239
GBP 4,8055 4,7001
CHF 3,7638 3,5672
01/01 - 30/09/2018 01/01 - 30/09/2017
USD 3,5599 3,8382
EUR 4,2491 4,2663
SEK 0,4152 0,4453
DKK 0,5703 0,5736
NOK 0,4431 0,4623
GBP 4,8062 4,8886
CHF 3,6604 3,8997
Arctic Paper Capital Group/ Consolidated quarterly report for Q3 2018 57 Interim abbreviated consolidated financial statements
applied by the Rottneros Group companies and thus an incorrect verification was applied to those periods in the previous
years).
As a result, changes were made to the value of tangible fixed assets, depreciation costs and deferred tax for the
comparative data for the periods of 3 and 9 months respectively ended on at 30 September 2017 and on 30 September
2017 versus the interim abbreviated consolidated financial statements for the period ended on 30 September 2017.
As at 30 December 2017, the value of tangible fixed assets grew by PLN 72,690 thousand while the deferred income tax
asset decreased by PLN 15,992 thousand and the equity increased by PLN 56,698 thousand , however the minority interests
increased by PLN 27,612 thousand and the FX translation reserve decreased by PLN 648 thousand with the accumulated
uncovered loss reduced by PLN 29,734 thousand. The change of economic useful life for tangible assets of the Rottneros
Group resulted in a growth of net profit for the nine-month period ended on 30 September 2017 by PLN 11,163 thousand
as a result of a reduction to internal costs of sales by PLN 14,311 thousand and an increase of income tax by PLN 3,148
thousand.
Basic and diluted profit per share attributable to the shareholders of the parent entity for the nine-month period ended on
30 September 2017 grew from PLN 0.65 to PLN 0.74.
The change of economic useful life for tangible assets of the Rottneros Group resulted in a growth of net profit for the
three-month period ended on 30 September 2017 by PLN 3,721 thousand as a result of a reduction to internal costs of sales
by PLN 4,770 thousand and an increase of income tax by PLN 1,049 thousand.
Basic and diluted profit per share attributable to the shareholders of the parent entity for the three-month period ended on
30 September 2017 grew from PLN 0.25 to PLN 0.28.
In three quarters of 2018 there were no other changes that would result in changes to the comparable data.
6.6. Data comparability/change to estimates
Effective on 1 January 2018, on the basis of verification of the previous periods of economic useful lives for tangible fixe d
assets and intangible assets, AP Kostrzyn has changed the periods of economic useful lives for selected tangible fixed
assets, mainly plant and machinery. The changes were primarily due to previous modernisation of the assets that resulted in
extension of their periods of economic useful lives. Annual depreciation for those tangible fixed assets will decrease by
PLN 7,982 thousand versus the annual depreciation cost for 2017.
7. Seasonality The Group’s activities are not of seasonal nature. Therefore the results presented by the Group do not change significantly
during the year.
8. Information on business segments The principal continuing operations of the Group include paper production which is conducted in three paper mills
belonging to the Group and pulp production in two Pulp Mills. The presentation of the segments cover the continu ing
activities of the Arctic Paper Group.
The Group identifies four business segments:
— Uncoated paper – paper for printing or other graphic purposes, including wood-free and wood-containing paper.
Uncoated wood-free paper may be produced from various types of pulp, with different filler content, and can undergo
various finishing processes, such as surface sizing and calendering. Two main categories of this type of paper are
graphic paper (used for example for printing books and catalogues) and office papers (for instance, photocopy paper);
however, the Group currently does not produce office paper. Uncoated wood paper from mechanical pulp intended for
printing or other graphic purposes. This type of paper is used for printing magazines with the use of rotogr avure or
offset printing techniques.
— Coated paper – coated wood-free paper for printing or other graphic purposes, one-side or two-side coated with
mixtures containing mineral pigments, such as china clay, calcium carbonate, etc. The coating process can i nvolve

Arctic Paper Capital Group/ Consolidated quarterly report for Q3 2018 58 Interim abbreviated consolidated financial statements
different methods, both on-line and off-line, and can be supplemented by super-calendering to ensure a smooth surface.
Coating improves the printing quality of photographs and illustrations.
— Pulp – fully bleached sulphate pulp and unbleached sulphate pulp which is used mainly for the production of printing
and writing papers, cardboard, toilet paper and white packaging paper as well as chemi thermo mechanical pulp (CTMP)
and groundwood which are used mainly for production of printing and writing pap ers.
— Other – the segment contains the results of Arctic Paper S.A. and Arctic Paper Finance AB business operations.
The split of operating segments into the uncoated and coated paper segments is due to the following factors:
— Demand for products and their supply as well as the prices of products sold in the market are affected by key
operational factors for each segment, such as e.g. the production capacity level in the specific paper segment,
— The key operating parameters such as inflow of orders or the leve l of production costs are determined by the factors
that are similar for each paper segment,
— The products manufactured at the Paper Mills operated by the Group may (with certain restrictions) be allocated to
production in other entities within the same paper segment which to a certain extent distorts the financial results
generated by each Paper Mill,
— The results of the Arctic Paper Group are under the pressure of global market trends with respect to the prices of paper
and core raw materials, in particular of pulp, and to a lesser extent are subject to the specific conditions of production
entities.
Every month, on the basis of internal reports received from companies (apart from companies of the Rottneros Group), the
results in each operating segment are analysed by the management of the Group. The financial results of companies in the
Rottneros Groups are analysed on the basis of quarterly financial results published on the websites of Rottneros AB.
The operating results are measured primarily on the basis of EBITDA calculated by adding depreciation/amortisation and
impairment charges to tangible fixed assets and intangible assets to profit (loss) on operations, in each case in compliance
with EU IFRS. In accordance with EU IFRS, EBITDA is not a metric of operating profit (loss), operational results or liquidity.
EBITDA is a metric that the Management Board uses to manage the operations.
Transactions between segments are concluded at arms’ length like between unrelated entities.
The table below presents data concerning revenues and profit as well as certain assets and liabilities split by segments of
the Group for the period of 9 months ended on 30 September 2018 and as at 30 September 2018.
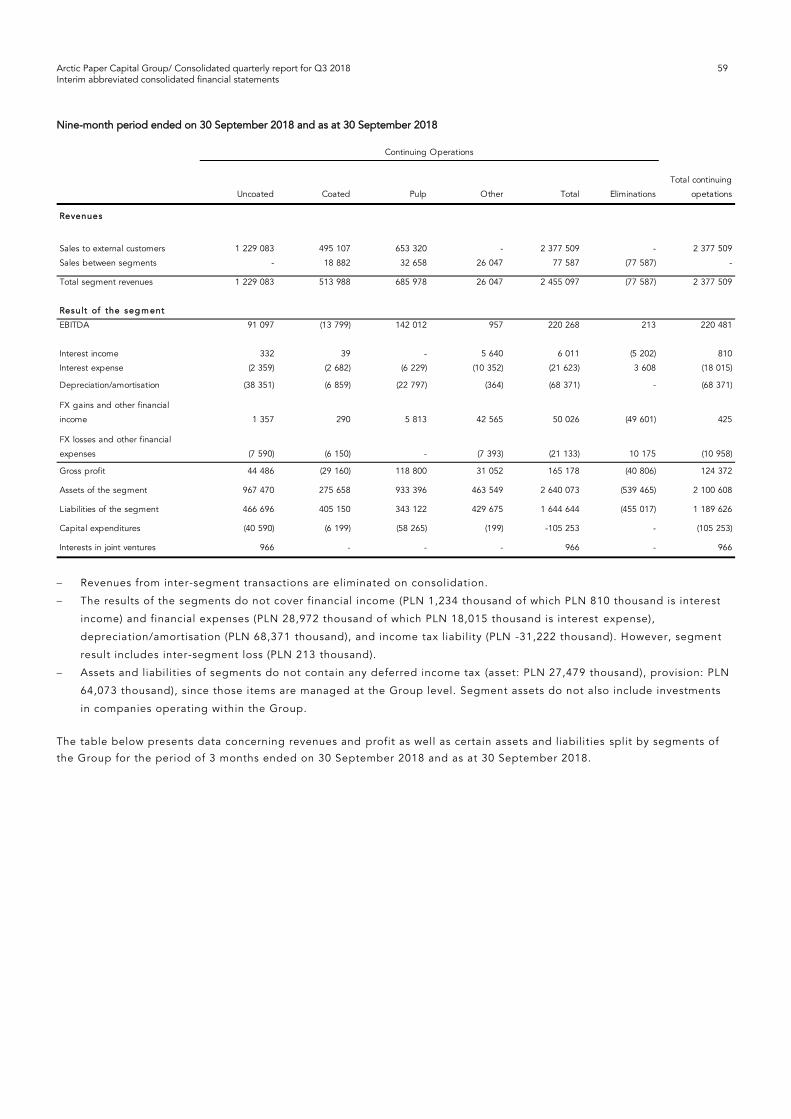
Arctic Paper Capital Group/ Consolidated quarterly report for Q3 2018 59 Interim abbreviated consolidated financial statements
Nine-month period ended on 30 September 2018 and as at 30 September 2018
Revenues from inter-segment transactions are eliminated on consolidation.
The results of the segments do not cover financial income (PLN 1,234 thousand of which PLN 810 thousand is interest
income) and financial expenses (PLN 28,972 thousand of which PLN 18,015 thousand is interest expense),
depreciation/amortisation (PLN 68,371 thousand), and income tax liability (PLN -31,222 thousand). However, segment
result includes inter-segment loss (PLN 213 thousand).
Assets and liabilities of segments do not contain any deferred income tax (asset: PLN 27,479 thousand), provision: PLN
64,073 thousand), since those items are managed at the Group level. Segment assets do not also include investments
in companies operating within the Group.
The table below presents data concerning revenues and profit as well as certain assets and liabilities split by segments of
the Group for the period of 3 months ended on 30 September 2018 and as at 30 September 2018.
Uncoated Coated Pulp Other Total Eliminations
Total continuing
opetations
Revenues
1 229 083 495 107 653 320 - 2 377 509 - 2 377 509
Sales between segments - 18 882 32 658 26 047 77 587 (77 587) -
Total segment revenues 1 229 083 513 988 685 978 26 047 2 455 097 (77 587) 2 377 509
Result of the seg m ent
EBITDA 91 097 (13 799) 142 012 957 220 268 213 220 481
Interest income 332 39 - 5 640 6 011 (5 202) 810
Interest expense (2 359) (2 682) (6 229) (10 352) (21 623) 3 608 (18 015)
(38 351) (6 859) (22 797) (364) (68 371) - (68 371)
1 357 290 5 813 42 565 50 026 (49 601) 425
(7 590) (6 150) - (7 393) (21 133) 10 175 (10 958)
Gross profit 44 486 (29 160) 118 800 31 052 165 178 (40 806) 124 372
Assets of the segment 967 470 275 658 933 396 463 549 2 640 073 (539 465) 2 100 608
Liabilities of the segment 466 696 405 150 343 122 429 675 1 644 644 (455 017) 1 189 626
Capital expenditures (40 590) (6 199) (58 265) (199) -105 253 - (105 253)
Interests in joint ventures 966 - - - 966 - 966
Continuing Operations
Sales to external customers
Depreciation/amortisation
FX gains and other financial
income
FX losses and other financial
expenses
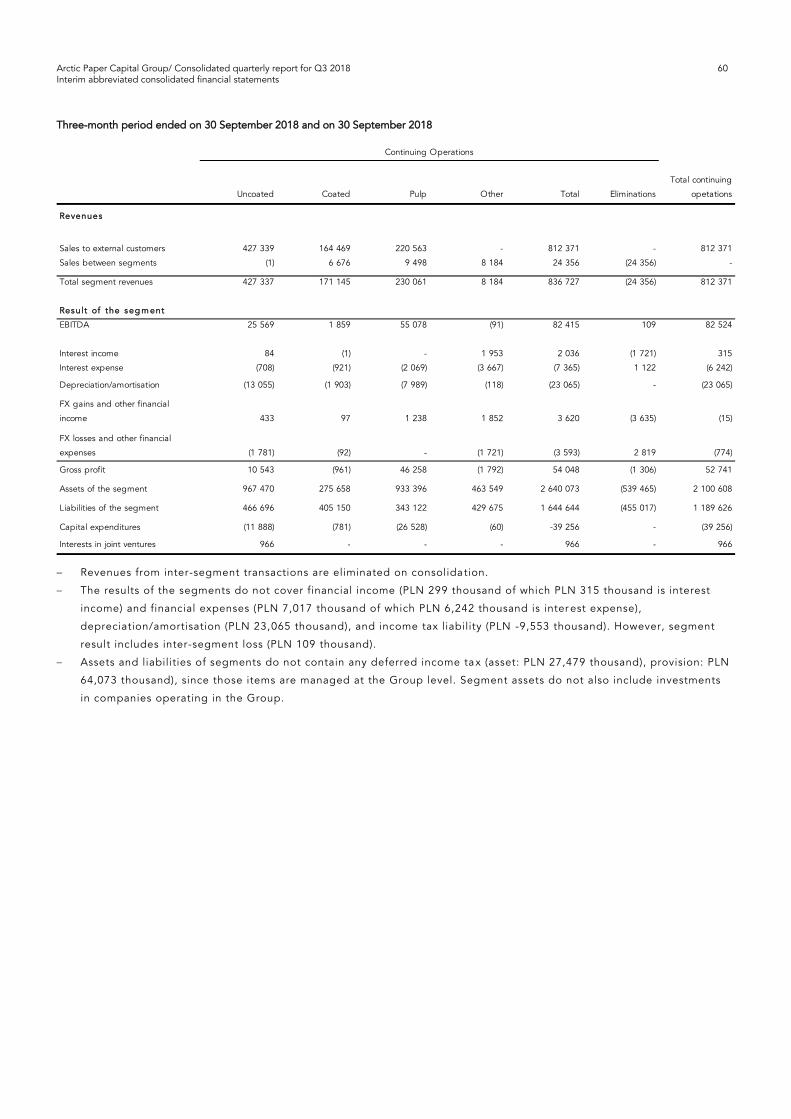
Arctic Paper Capital Group/ Consolidated quarterly report for Q3 2018 60 Interim abbreviated consolidated financial statements
Three-month period ended on 30 September 2018 and on 30 September 2018
Revenues from inter-segment transactions are eliminated on consolidation.
The results of the segments do not cover financial income (PLN 299 thousand of which PLN 315 thousand is interest
income) and financial expenses (PLN 7,017 thousand of which PLN 6,242 thousand is inter est expense),
depreciation/amortisation (PLN 23,065 thousand), and income tax liability (PLN -9,553 thousand). However, segment
result includes inter-segment loss (PLN 109 thousand).
Assets and liabilities of segments do not contain any deferred income tax (asset: PLN 27,479 thousand), provision: PLN
64,073 thousand), since those items are managed at the Group level. Segment assets do not also include investments
in companies operating in the Group.
Uncoated Coated Pulp Other Total Eliminations
Total continuing
opetations
Revenues
427 339 164 469 220 563 - 812 371 - 812 371
Sales between segments (1) 6 676 9 498 8 184 24 356 (24 356) -
Total segment revenues 427 337 171 145 230 061 8 184 836 727 (24 356) 812 371
Result of the seg m ent
EBITDA 25 569 1 859 55 078 (91) 82 415 109 82 524
Interest income 84 (1) - 1 953 2 036 (1 721) 315
Interest expense (708) (921) (2 069) (3 667) (7 365) 1 122 (6 242)
(13 055) (1 903) (7 989) (118) (23 065) - (23 065)
433 97 1 238 1 852 3 620 (3 635) (15)
(1 781) (92) - (1 721) (3 593) 2 819 (774)
Gross profit 10 543 (961) 46 258 (1 792) 54 048 (1 306) 52 741- - - - -
Assets of the segment 967 470 275 658 933 396 463 549 2 640 073 (539 465) 2 100 608
Liabilities of the segment 466 696 405 150 343 122 429 675 1 644 644 (455 017) 1 189 626
Capital expenditures (11 888) (781) (26 528) (60) -39 256 - (39 256)
Interests in joint ventures 966 - - - 966 - 966
Continuing Operations
Sales to external customers
Depreciation/amortisation
FX gains and other financial
income
FX losses and other financial
expenses
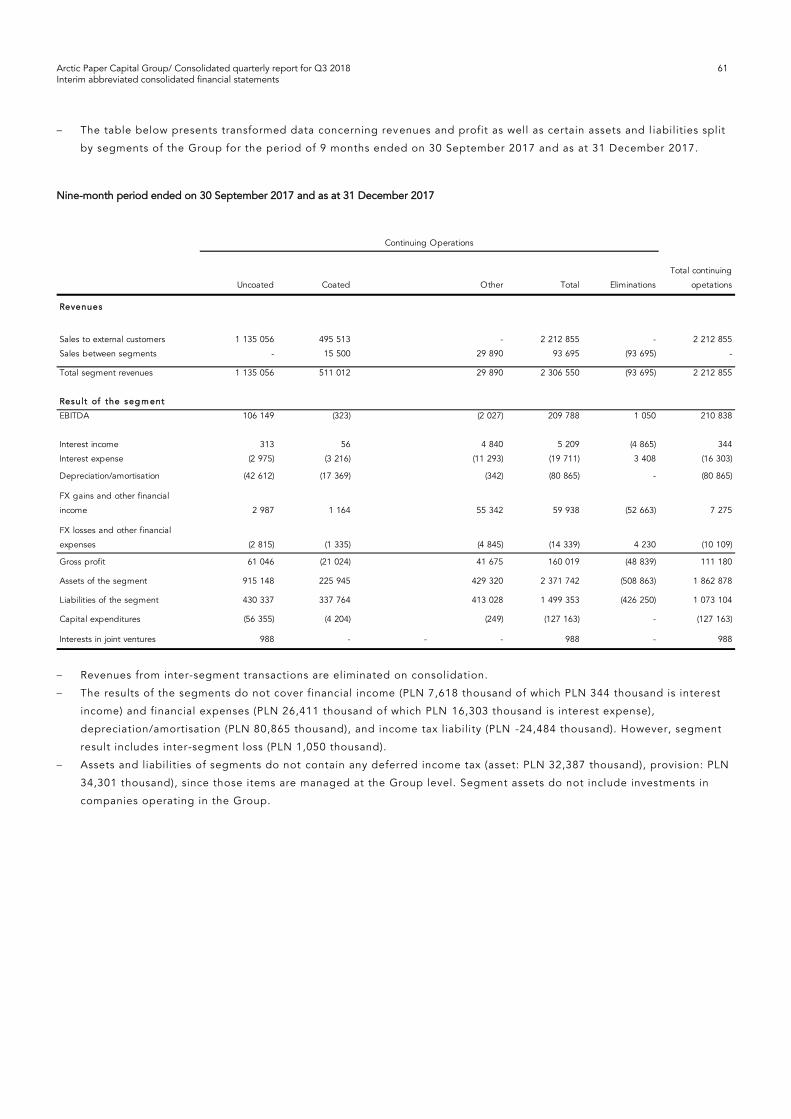
Arctic Paper Capital Group/ Consolidated quarterly report for Q3 2018 61 Interim abbreviated consolidated financial statements
The table below presents transformed data concerning revenues and profit as well as certain assets and l iabilities split
by segments of the Group for the period of 9 months ended on 30 September 2017 and as at 31 December 2017.
Nine-month period ended on 30 September 2017 and as at 31 December 2017
Revenues from inter-segment transactions are eliminated on consolidation.
The results of the segments do not cover financial income (PLN 7,618 thousand of which PLN 344 thousand is interest
income) and financial expenses (PLN 26,411 thousand of which PLN 16,303 thousand is interest expense),
depreciation/amortisation (PLN 80,865 thousand), and income tax liability (PLN -24,484 thousand). However, segment
result includes inter-segment loss (PLN 1,050 thousand).
Assets and liabilities of segments do not contain any deferred income tax (asset: PLN 32,387 thousand), provision: PLN
34,301 thousand), since those items are managed at the Group level. Segment assets do not include investments in
companies operating in the Group.
Uncoated Coated Other Total Eliminations
Total continuing
opetations
Revenues
1 135 056 495 513 - 2 212 855 - 2 212 855
Sales between segments - 15 500 29 890 93 695 (93 695) -
Total segment revenues 1 135 056 511 012 29 890 2 306 550 (93 695) 2 212 855
Result of the seg m ent
EBITDA 106 149 (323) (2 027) 209 788 1 050 210 838
Interest income 313 56 4 840 5 209 (4 865) 344
Interest expense (2 975) (3 216) (11 293) (19 711) 3 408 (16 303)
(42 612) (17 369) (342) (80 865) - (80 865)
2 987 1 164 55 342 59 938 (52 663) 7 275
(2 815) (1 335) (4 845) (14 339) 4 230 (10 109)
Gross profit 61 046 (21 024) 41 675 160 019 (48 839) 111 180
Assets of the segment 915 148 225 945 429 320 2 371 742 (508 863) 1 862 878
Liabilities of the segment 430 337 337 764 413 028 1 499 353 (426 250) 1 073 104
Capital expenditures (56 355) (4 204) (249) (127 163) - (127 163)
Interests in joint ventures 988 - - - 988 - 988
Continuing Operations
FX losses and other financial
expenses
Sales to external customers
Depreciation/amortisation
FX gains and other financial
income
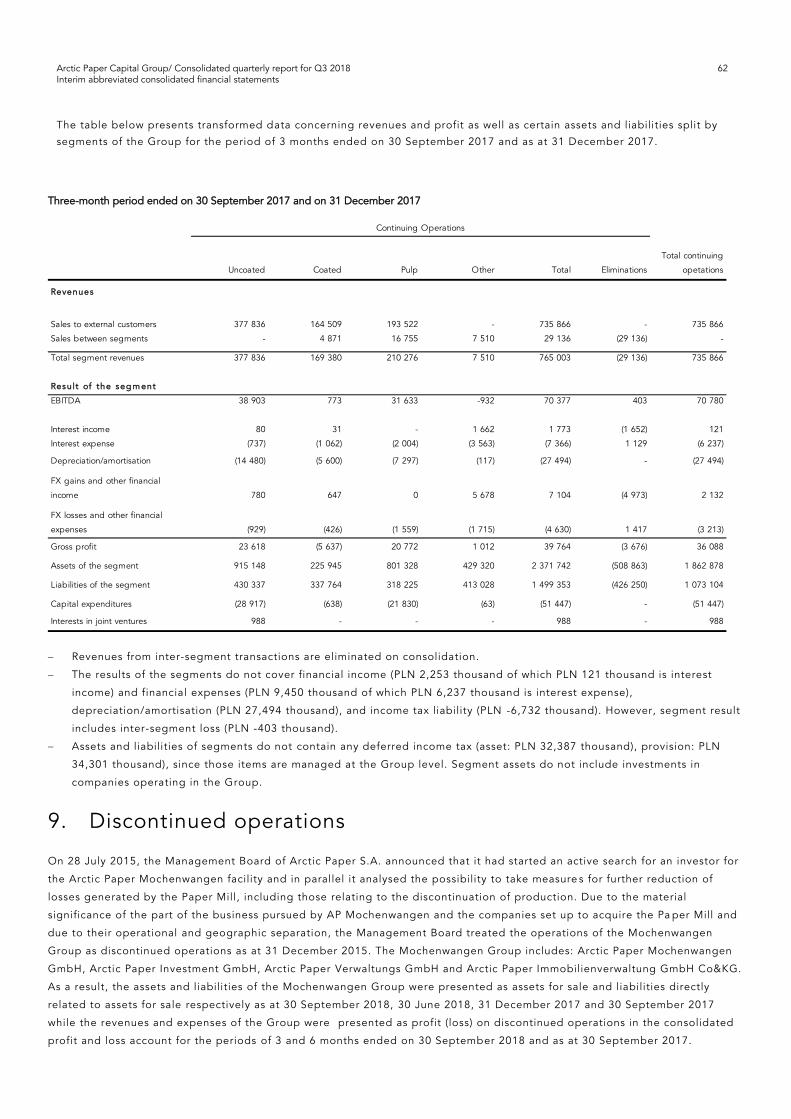
Arctic Paper Capital Group/ Consolidated quarterly report for Q3 2018 62 Interim abbreviated consolidated financial statements
The table below presents transformed data concerning revenues and profit as well as certain assets and liabilities split by
segments of the Group for the period of 3 months ended on 30 September 2017 and as at 31 December 2017.
Three-month period ended on 30 September 2017 and on 31 December 2017
Revenues from inter-segment transactions are eliminated on consolidation.
The results of the segments do not cover financial income (PLN 2,253 thousand of which PLN 121 thousand is interest
income) and financial expenses (PLN 9,450 thousand of which PLN 6,237 thousand is interest expense),
depreciation/amortisation (PLN 27,494 thousand), and income tax liability (PLN -6,732 thousand). However, segment result
includes inter-segment loss (PLN -403 thousand).
Assets and liabilities of segments do not contain any deferred income tax (asset: PLN 32,387 thousand), provision: PLN
34,301 thousand), since those items are managed at the Group level. Segment assets do not include investments in
companies operating in the Group.
9. Discontinued operations
On 28 July 2015, the Management Board of Arctic Paper S.A. announced that it had started an active search for an investor for
the Arctic Paper Mochenwangen facility and in parallel it analysed the possibility to take measure s for further reduction of
losses generated by the Paper Mill, including those relating to the discontinuation of production. Due to the material
significance of the part of the business pursued by AP Mochenwangen and the companies set up to acquire the Pa per Mill and
due to their operational and geographic separation, the Management Board treated the operations of the Mochenwangen
Group as discontinued operations as at 31 December 2015. The Mochenwangen Group includes: Arctic Paper Mochenwangen
GmbH, Arctic Paper Investment GmbH, Arctic Paper Verwaltungs GmbH and Arctic Paper Immobilienverwaltung GmbH Co&KG.
As a result, the assets and liabilities of the Mochenwangen Group were presented as assets for sale and liabilities directly
related to assets for sale respectively as at 30 September 2018, 30 June 2018, 31 December 2017 and 30 September 2017
while the revenues and expenses of the Group were presented as profit (loss) on discontinued operations in the consolidated
profit and loss account for the periods of 3 and 6 months ended on 30 September 2018 and as at 30 September 2017.
Uncoated Coated Pulp Other Total Eliminations
Total continuing
opetations
Revenues
377 836 164 509 193 522 - 735 866 - 735 866
Sales between segments - 4 871 16 755 7 510 29 136 (29 136) -
Total segment revenues 377 836 169 380 210 276 7 510 765 003 (29 136) 735 866
Result of the seg m ent
EBITDA 38 903 773 31 633 -932 70 377 403 70 780
Interest income 80 31 - 1 662 1 773 (1 652) 121
Interest expense (737) (1 062) (2 004) (3 563) (7 366) 1 129 (6 237)
(14 480) (5 600) (7 297) (117) (27 494) - (27 494)
780 647 0 5 678 7 104 (4 973) 2 132
(929) (426) (1 559) (1 715) (4 630) 1 417 (3 213)
Gross profit 23 618 (5 637) 20 772 1 012 39 764 (3 676) 36 088- - - -
Assets of the segment 915 148 225 945 801 328 429 320 2 371 742 (508 863) 1 862 878-
Liabilities of the segment 430 337 337 764 318 225 413 028 1 499 353 (426 250) 1 073 104
Capital expenditures (28 917) (638) (21 830) (63) (51 447) - (51 447)
Interests in joint ventures 988 - - - 988 - 988
Sales to external customers
Depreciation/amortisation
FX gains and other financial
income
Continuing Operations
FX losses and other financial
expenses

Arctic Paper Capital Group/ Consolidated quarterly report for Q3 2018 63 Interim abbreviated consolidated financial statements
In view of a continued search for an investor for the factory of Arctic Paper Mochenwangen or its individual assets and in
connection with negotiations under way with potential buyers, the Management Board decided to treat the operations of the
Mochenwangen Group as discontinued activities as at 30 September 2018.
As at 31 December 2017 and continuing the approach in 2018, the Management Board decided that the provision for
retirement leaves would not be sold as part of the discontinued activities and as a result it was excluded from liabilities related
directly to the discontinued activities.
The tables below present the corresponding financial data on the discontinued oper ations:
Revenues and expenses of discontinued operations
9-month period
ended on
30 September 2018
9-month period
ended on
30 September 2017
(unaudited) (unaudited)
Revenues from sales of goods - -
Costs of sales (863) (1 809)
Profit / (loss) on sales (863) (1 809)
Selling and distribution costs (54) (733)
Administrative expenses (2 349) (3 661)
Other operating income 935 917
Other operating expenses - (576)
Operating profit (loss) (2 331) (5 861)
Financial income 0 (0)
Financial expenses (13) (13)
Gross profit (loss) (2 344) (5 873)
Income tax 53 22
(2 291) (5 852)
Cumulated other comprehensive income related to discontinued operations
FX differences on translation of foreign operations (79) 154
Actuarial profit/loss - -
(79) 154
Earnings per share:
(0,03) (0,08)
(0,03) (0,08)
– diluted profit from discontinued operations attributable to the shareholders of the Parent
Entity
Profit (loss) from discontinued operations
– basic profit/(loss) from discontinued operations attributable to the shareholders of the
Parent Entity
Net assets for sale As at 30 June 2018 As at 31 December 2017
(unaudited)
Assets for sale
Inventories and other tangible assets 21 21
Trade and other receivables 987 1 293
Corporate income tax receivables 124 121
Other financial assets - 188
Cash and cash equivalents 1 252 2 448
2 383 4 071
Liabilities directly related to assets held for sale
Provisions 859 838
Trade and other payables 440 517
Income tax liability 103 100
Accruals and deferred income 175 171
1 576 1 626
Net assets for sale 807 2 445

Arctic Paper Capital Group/ Consolidated quarterly report for Q3 2018 64 Interim abbreviated consolidated financial statements
The Group intends to sell the land and afterwards the entire discontinued activity as an organised whole. Due to the fact that
the Group now is trying to identify the contamination of the land and the condition will materially impact the ma rket value of
the asset, it is not possible to estimate the fair value of the land in a reliable manner. In consequence, the Group recognised
the land at PLN 0 as at 30 September 2018, 30 June 2018, 31 December 2017 and 30 September 2017.
10. Dividend paid and proposed
10.1. Dividend disbursed and proposed to be disbursed by Arctic Paper S.A.
Dividend is paid based on the net profit disclosed in the standalone annual financial statements of Arctic Paper S.A. after
covering losses carried forward from the previous years.
In accordance with provisions of the Code of Commercial Companies, the parent entity is obliged to establish reserve capital
to cover potential losses. At least 8% of the profit for the financial year disclosed in the standalone financial s tatements of the
parent company should be transferred to the category of capital until the capital has reached the amount of at least one third
of the share capital of the parent entity. The use of reserve capital and reserve funds is determined by the Gen eral Meeting;
however, a part of reserve capital equal to one third of the share capital can be used solely to cover the losses disclosed in the
standalone financial statements of the parent entity and cannot be distributed to other purposes.
As on the date hereof, the Company had no preferred shares.
The possibility of disbursement of potential dividend by the Company to its shareholders depends on the level of payments
received from its subsidiaries. The risk associated with the Company’s ability to disb urse dividend was described in the part
“Risk factors” of the annual report for 2017.
In connection with the term and revolving loan agreements signed on 9 September 2016, agreements related to the bond issue
pursuant to which on 30 September 2016 the Company issued bonds and the intercreditor agreement, the poss ibility of the
Company to pay dividend is subject to satisfying certain financial ratios by the Group in two periods preceding such
distribution (as the term is defined in the term and revolving loan agreements) and no occurrence of any events of default ( as
defined in the term and revolving loan agreements).
The Company’s General Meeting held on 13 June 2018 approved a resolution on distribution of dividend to the Company's
shareholders from its retained net profit in the Company's reserves of PLN 13,857,556.60. Dividend per share was PLN 0.20.
The Company’s General Meeting determined 20 June 2018 as the ex -dividend date and 27 June 2018 as the dividend
distribution date. The dividend was paid according to schedule.
10.2. Dividend disbursed by Rottneros AB
At the General Meeting of Rottneros AB of 16 May 2018 adopted a resolution on dividend distribution of SEK 0.37 per share.
The dividend was disbursed to Arctic Paper S.A. and to the non -controlling shareholders of Rottneros AB in the total amount of
PLN 23.6 million (SEK 56 million).
Cash flows related to discontinued operations
9-month period
ended on
30 September 2018
9-month period
ended on
30 September 2017
Net cash flows from operating activities (1 249) 1 855
Net cash flows from investing activities - -
Net cash flows from financing activities - -
Increase / (decrease) in cash and cash equivalents (1 249) 1 855
Net FX differences 53 (16)
Cash and cash equivalents at the beginning of the period 2 448 1 320
Cash and cash equivalents at the end of the period 1 252 3 159
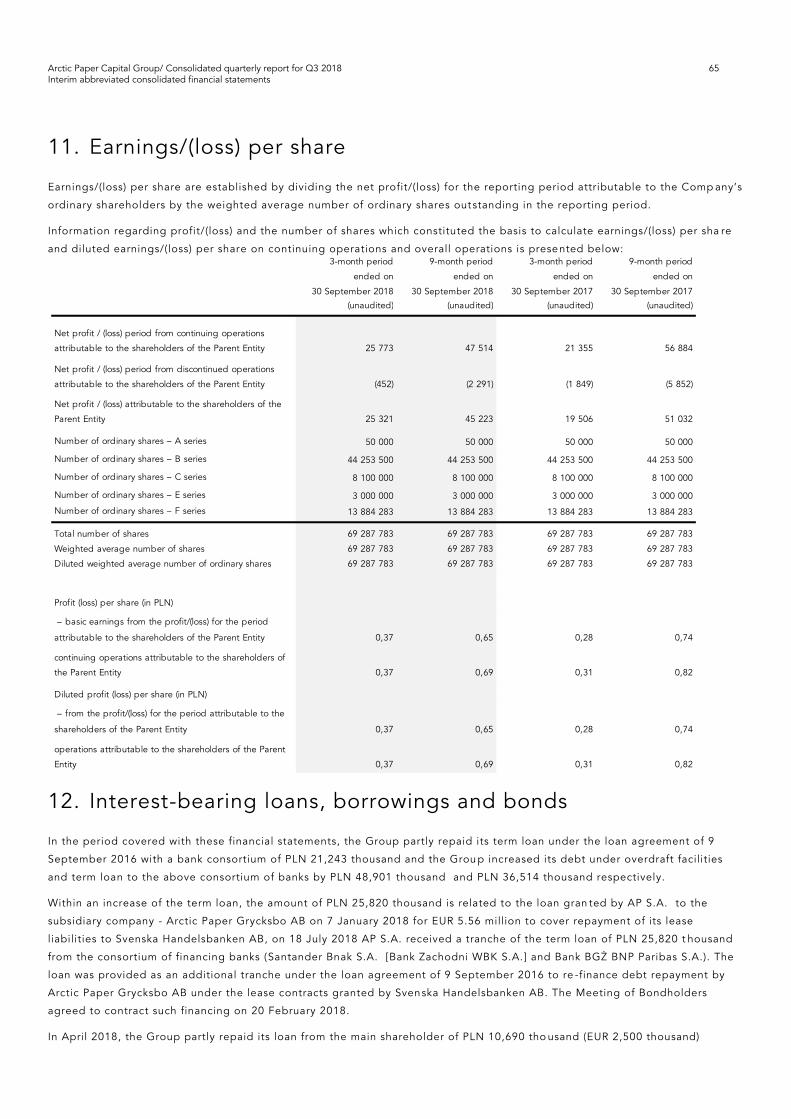
Arctic Paper Capital Group/ Consolidated quarterly report for Q3 2018 65 Interim abbreviated consolidated financial statements
11. Earnings/(loss) per share
Earnings/(loss) per share are established by dividing the net profit/(loss) for the reporting period attributable to the Comp any’s
ordinary shareholders by the weighted average number of ordinary shares outstanding in the reporting period.
Information regarding profit/(loss) and the number of shares which constituted the basis to calculate earnings/(loss) per sha re
and diluted earnings/(loss) per share on continuing operations and overall operations is presented below:
12. Interest-bearing loans, borrowings and bonds
In the period covered with these financial statements, the Group partly repaid its term loan under the loan agreement of 9
September 2016 with a bank consortium of PLN 21,243 thousand and the Grou p increased its debt under overdraft facilities
and term loan to the above consortium of banks by PLN 48,901 thousand and PLN 36,514 thousand respectively.
Within an increase of the term loan, the amount of PLN 25,820 thousand is related to the loan gran ted by AP S.A. to the
subsidiary company - Arctic Paper Grycksbo AB on 7 January 2018 for EUR 5.56 million to cover repayment of its lease
liabilities to Svenska Handelsbanken AB, on 18 July 2018 AP S.A. received a tranche of the term loan of PLN 25,820 t housand
from the consortium of financing banks (Santander Bnak S.A. [Bank Zachodni WBK S.A.] and Bank BGŻ BNP Paribas S.A.). The
loan was provided as an additional tranche under the loan agreement of 9 September 2016 to re -finance debt repayment by
Arctic Paper Grycksbo AB under the lease contracts granted by Svenska Handelsbanken AB. The Meeting of Bondholders
agreed to contract such financing on 20 February 2018.
In April 2018, the Group partly repaid its loan from the main shareholder of PLN 10,690 tho usand (EUR 2,500 thousand)
3-month period
ended on
30 September 2018
9-month period
ended on
30 September 2018
3-month period
ended on
30 September 2017
9-month period
ended on
30 September 2017
(unaudited) (unaudited) (unaudited) (unaudited)
25 773 47 514 21 355 56 884
(452) (2 291) (1 849) (5 852)
25 321 45 223 19 506 51 032
Number of ordinary shares – A series 50 000 50 000 50 000 50 000
Number of ordinary shares – B series 44 253 500 44 253 500 44 253 500 44 253 500
Number of ordinary shares – C series 8 100 000 8 100 000 8 100 000 8 100 000
Number of ordinary shares – E series 3 000 000 3 000 000 3 000 000 3 000 000
Number of ordinary shares – F series 13 884 283 13 884 283 13 884 283 13 884 283
Total number of shares 69 287 783 69 287 783 69 287 783 69 287 783
Weighted average number of shares 69 287 783 69 287 783 69 287 783 69 287 783
Diluted weighted average number of ordinary shares 69 287 783 69 287 783 69 287 783 69 287 783
Profit (loss) per share (in PLN)
0,37 0,65 0,28 0,74
0,37 0,69 0,31 0,82
Diluted profit (loss) per share (in PLN)
0,37 0,65 0,28 0,74
0,37 0,69 0,31 0,82
Net profit / (loss) period from continuing operations
attributable to the shareholders of the Parent Entity
Net profit / (loss) period from discontinued operations
attributable to the shareholders of the Parent Entity
– basic earnings from the profit/(loss) for the period
attributable to the shareholders of the Parent Entity – basic earnings profit/(loss) for the period from
continuing operations attributable to the shareholders of
the Parent Entity
– from the profit/(loss) for the period attributable to the
shareholders of the Parent Entity – from the profit/(loss) for the period from continuing
operations attributable to the shareholders of the Parent
Entity
Net profit / (loss) attributable to the shareholders of the
Parent Entity
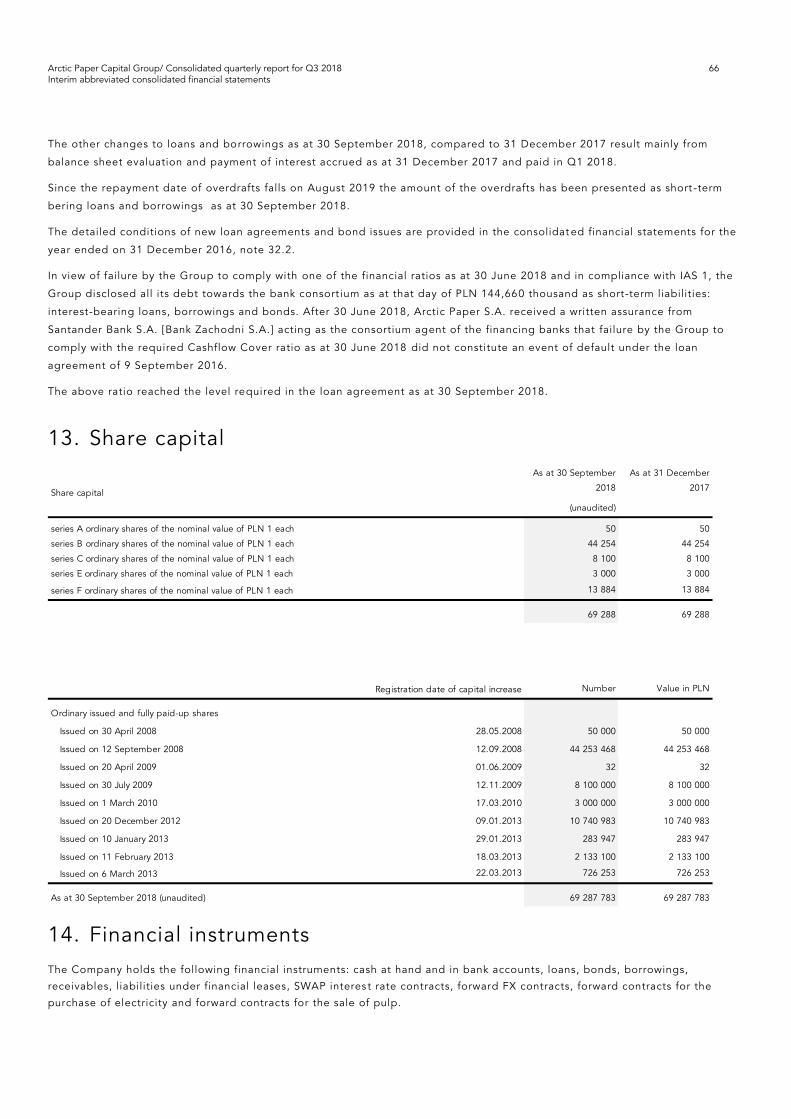
Arctic Paper Capital Group/ Consolidated quarterly report for Q3 2018 66 Interim abbreviated consolidated financial statements
The other changes to loans and borrowings as at 30 September 2018, compared to 31 December 2017 result mainly from
balance sheet evaluation and payment of interest accrued as at 31 December 2017 and paid in Q1 2018.
Since the repayment date of overdrafts falls on August 2019 the amount of the overdrafts has been presented as short -term
bering loans and borrowings as at 30 September 2018.
The detailed conditions of new loan agreements and bond issues are provided in the consolidat ed financial statements for the
year ended on 31 December 2016, note 32.2.
In view of failure by the Group to comply with one of the financial ratios as at 30 June 2018 and in compliance with IAS 1, the
Group disclosed all its debt towards the bank consort ium as at that day of PLN 144,660 thousand as short-term liabilities:
interest-bearing loans, borrowings and bonds. After 30 June 2018, Arctic Paper S.A. received a written assurance from
Santander Bank S.A. [Bank Zachodni S.A.] acting as the consortium agent of the financing banks that failure by the Group to
comply with the required Cashflow Cover ratio as at 30 June 2018 did not constitute an event of default under the loan
agreement of 9 September 2016.
The above ratio reached the level required in the loan agreement as at 30 September 2018.
13. Share capital
14. Financial instruments The Company holds the following financial instruments: cash at hand and in bank accounts, loans, bonds, borrowings,
receivables, liabilities under financial leases, SWAP interes t rate contracts, forward FX contracts, forward contracts for the
purchase of electricity and forward contracts for the sale of pulp.
Share capital
As at 30 September
2018
As at 31 December
2017
(unaudited)
series A ordinary shares of the nominal value of PLN 1 each 50 50
series B ordinary shares of the nominal value of PLN 1 each 44 254 44 254
series C ordinary shares of the nominal value of PLN 1 each 8 100 8 100
series E ordinary shares of the nominal value of PLN 1 each 3 000 3 000
series F ordinary shares of the nominal value of PLN 1 each 13 884 13 884Trade receivables
69 288 69 288
Number Value in PLN
Ordinary issued and fully paid-up shares
Issued on 30 April 2008 28.05.2008 50 000 50 000
Issued on 12 September 2008 12.09.2008 44 253 468 44 253 468
Issued on 20 April 2009 01.06.2009 32 32
Issued on 30 July 2009 12.11.2009 8 100 000 8 100 000
Issued on 1 March 2010 17.03.2010 3 000 000 3 000 000
Issued on 20 December 2012 09.01.2013 10 740 983 10 740 983
Issued on 10 January 2013 29.01.2013 283 947 283 947
Issued on 11 February 2013 18.03.2013 2 133 100 2 133 100
Issued on 6 March 2013 22.03.2013 726 253 726 253
As at 30 September 2018 (unaudited) 69 287 783 69 287 783
Registration date of capital increase

Arctic Paper Capital Group/ Consolidated quarterly report for Q3 2018 67 Interim abbreviated consolidated financial statements
14.1. Hedge accounting
In order to reduce the volatility of the projected cash flows related to FX risk, the Group companies us e FX risk hedging based
on the use of derivatives related to the FX market. Those in particular include forward term contracts. Additionally, in orde r to
mitigate the volatility of future energy prices, the Paper Mills and Pulp Mills in Sweden apply forwar d contracts for the
purchase of electricity. Arctic Paper Kostrzyn, in order to mitigate the volatility of future interest costs on loans, has conclu ded
interest rate SWAP contracts. Rottneros Group companies, in order to mitigate the volatility of future inflows from pulp sales,
entered into forward contracts for pulp sales.
As at 30 September 2018, the Group used cash flow hedge accounting for the following hedging items:
— Arctic Paper S.A. designated SWAP derivatives to hedge accounting to hedge interest payments in EUR on a bank loan in
EUR,
— Arctic Paper S.A. designated SWAP derivatives to hedge accounting to hedge interest payments in PLN on a bank loan in
PLN,
— Arctic Paper Munkedals AB, Arctic Paper Grycksbo AB and the companies of the Rottneros Group d esignated for cash flow
hedge accounting the forward derivatives in order to hedge future purchases of electricity,
— the companies of the Rottneros Group designated for cash flow hedge accounting the FX forward derivatives in order to
hedge a part of inflows in EUR related to pulp sales,
— the companies of the Rottneros Group designated for cash flow hedge accounting the FX forward derivatives in order to
hedge a part of inflows in USD related to pulp sales,
— the Companies of the Rottneros Group designated for cash flow hedge accounting the FX forward derivatives for the sale of
pulp in order to hedge the sale prices of pulp in SEK,
14.1.1. Cash flow hedges
As at 30 September 2018, the Group's cash flows were hedged with forward FX contracts, forward contracts for purc hases of
electricity, forward contracts for sales of pulp, interest rate SWAPs.
Cash flow hedge accounting related to foreign currency trading using FX forward transactions
The table below presents detailed information concerning the hedging relationship i n the cash flow hedge accounting
regarding the sale of EUR for SEK:
The table below presents detailed information concerning the hedging relationship in the cash flow hedge accounting
regarding the sale of USD for SEK:
Type of hedge Cash flow hedge related to planned sales in foreign currencies
Hedged position The hedged position is a part of highly likely future cash inflows for exports
Hedging instruments FX forward contracts are used wherein the Company agrees to sell EUR for SEK
Contract parameters:
Contract conclusion dates 2 018
Maturity date subject to contract; by 30.11.2018
Hedged amount EUR 2.5 million
Term exchange rate 10.46 SEK/EUR
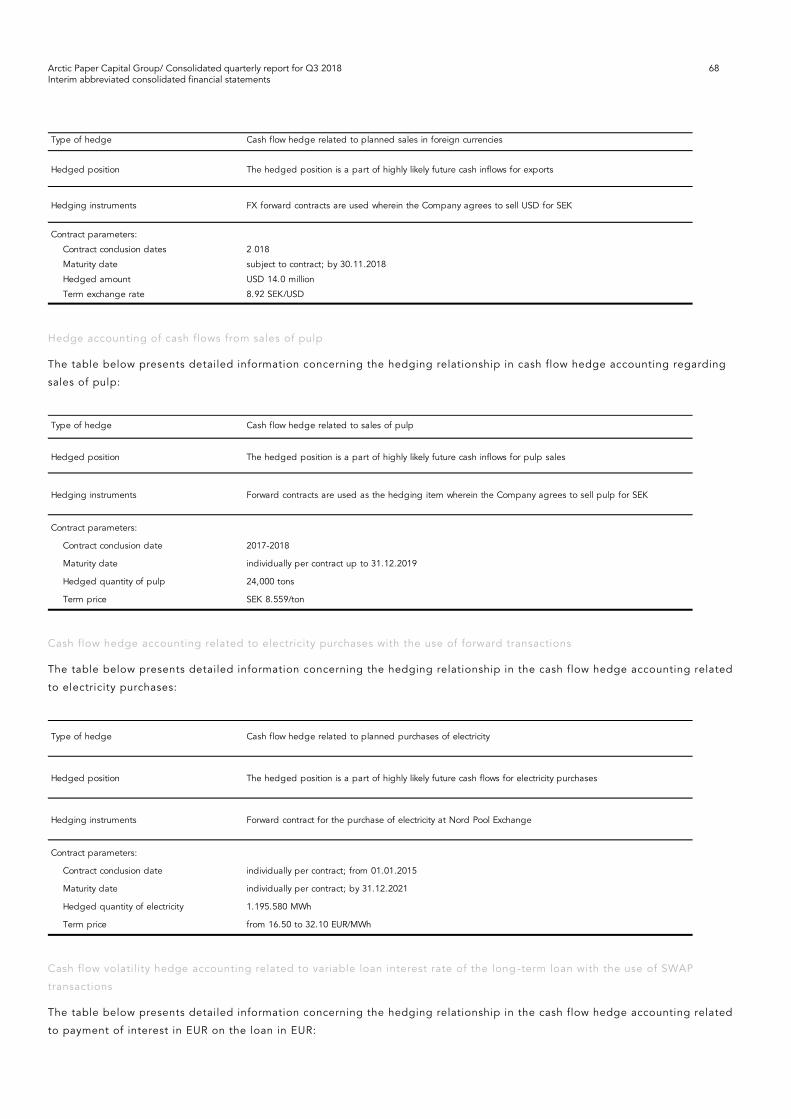
Arctic Paper Capital Group/ Consolidated quarterly report for Q3 2018 68 Interim abbreviated consolidated financial statements
Hedge accounting of cash flows from sales of pulp
The table below presents detailed information concerning the hedging relationship in cash flow hedge accounting regarding
sales of pulp:
Cash flow hedge accounting related to electricity purchases with the use of forward transactions
The table below presents detailed information concerning the hedging relationship in the cash flow hedge accounting related
to electricity purchases:
Cash flow volatility hedge accounting related to variable loan interest rate of the long -term loan with the use of SWAP
transactions
The table below presents detailed information concerning the hedging relationship in the cash flow hedge accounting related
to payment of interest in EUR on the loan in EUR:
Type of hedge Cash flow hedge related to planned sales in foreign currencies
Hedged position The hedged position is a part of highly likely future cash inflows for exports
Hedging instruments FX forward contracts are used wherein the Company agrees to sell USD for SEK
Contract parameters:
Contract conclusion dates 2 018
Maturity date subject to contract; by 30.11.2018
Hedged amount USD 14.0 million
Term exchange rate 8.92 SEK/USD
Type of hedge Cash flow hedge related to sales of pulp
Hedged position The hedged position is a part of highly likely future cash inflows for pulp sales
Hedging instruments Forward contracts are used as the hedging item wherein the Company agrees to sell pulp for SEK
Contract parameters:
Contract conclusion date 2017-2018
Maturity date individually per contract up to 31.12.2019
Hedged quantity of pulp 24,000 tons
Term price SEK 8.559/ton
Type of hedge Cash flow hedge related to planned purchases of electricity
Hedged position The hedged position is a part of highly likely future cash flows for electricity purchases
Hedging instruments Forward contract for the purchase of electricity at Nord Pool Exchange
Contract parameters:
Contract conclusion date individually per contract; from 01.01.2015
Maturity date individually per contract; by 31.12.2021
Hedged quantity of electricity 1.195.580 MWh
Term price from 16.50 to 32.10 EUR/MWh
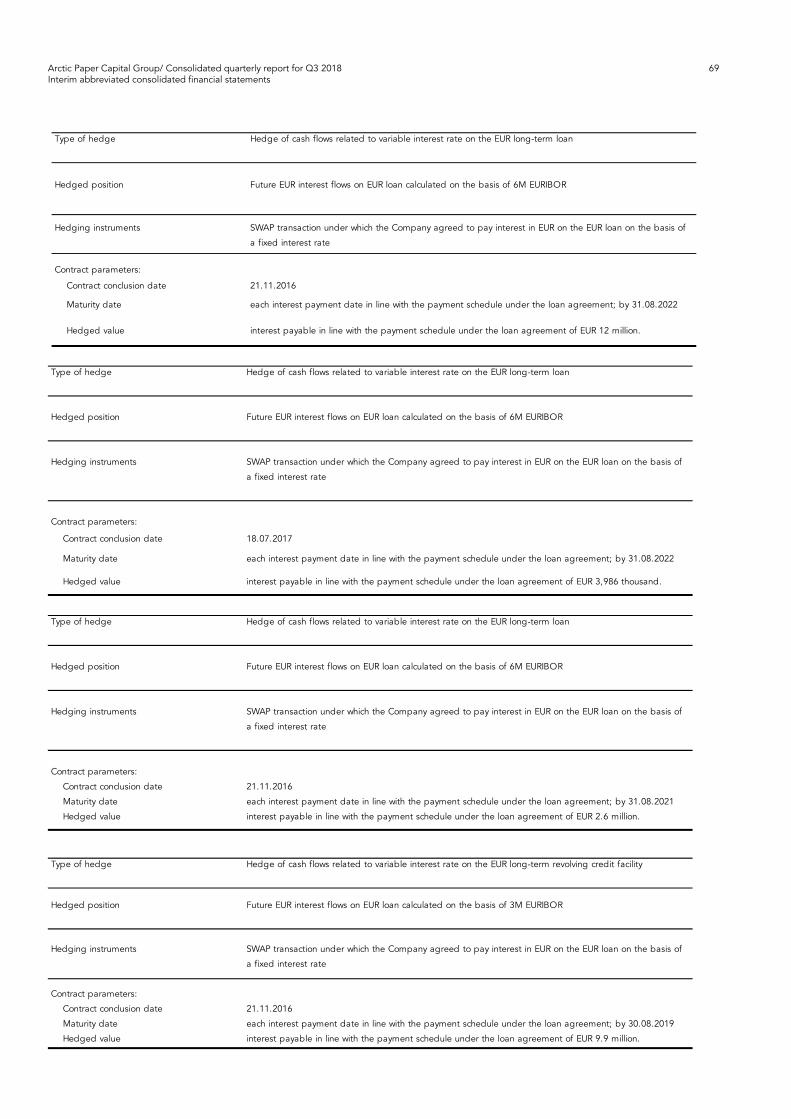
Arctic Paper Capital Group/ Consolidated quarterly report for Q3 2018 69 Interim abbreviated consolidated financial statements
Type of hedge Hedge of cash flows related to variable interest rate on the EUR long-term loan
Hedged position Future EUR interest flows on EUR loan calculated on the basis of 6M EURIBOR
Hedging instruments SWAP transaction under which the Company agreed to pay interest in EUR on the EUR loan on the basis of
a fixed interest rate
Contract parameters:
Contract conclusion date 21.11.2016
Maturity date each interest payment date in line with the payment schedule under the loan agreement; by 31.08.2022
Hedged value interest payable in line with the payment schedule under the loan agreement of EUR 12 million.
Type of hedge Hedge of cash flows related to variable interest rate on the EUR long-term loan
Hedged position Future EUR interest flows on EUR loan calculated on the basis of 6M EURIBOR
Hedging instruments SWAP transaction under which the Company agreed to pay interest in EUR on the EUR loan on the basis of
a fixed interest rate
Contract parameters:
Contract conclusion date 18.07.2017
Maturity date each interest payment date in line with the payment schedule under the loan agreement; by 31.08.2022
Hedged value interest payable in line with the payment schedule under the loan agreement of EUR 3,986 thousand.
Type of hedge Hedge of cash flows related to variable interest rate on the EUR long-term loan
Hedged position Future EUR interest flows on EUR loan calculated on the basis of 6M EURIBOR
Hedging instruments SWAP transaction under which the Company agreed to pay interest in EUR on the EUR loan on the basis of
a fixed interest rate
Contract parameters:
Contract conclusion date 21.11.2016
Maturity date each interest payment date in line with the payment schedule under the loan agreement; by 31.08.2021
Hedged value interest payable in line with the payment schedule under the loan agreement of EUR 2.6 million.
Type of hedge Hedge of cash flows related to variable interest rate on the EUR long-term revolving credit facility
Hedged position Future EUR interest flows on EUR loan calculated on the basis of 3M EURIBOR
Hedging instruments SWAP transaction under which the Company agreed to pay interest in EUR on the EUR loan on the basis of
a fixed interest rate
Contract parameters:
Contract conclusion date 21.11.2016
Maturity date each interest payment date in line with the payment schedule under the loan agreement; by 30.08.2019
Hedged value interest payable in line with the payment schedule under the loan agreement of EUR 9.9 million.

Arctic Paper Capital Group/ Consolidated quarterly report for Q3 2018 70 Interim abbreviated consolidated financial statements
The table below presents detailed information concerning the hedging relationship in the cash flow hedge accounting related
to payment of interest in PLN on the loan in PLN:
Type of hedge Hedge of cash flows related to variable interest rate on the EUR long-term loan
Hedged position Future EUR interest flows on EUR loan calculated on the basis of 6M EURIBOR
Hedging instruments SWAP transaction under which the Company agreed to pay interest in EUR on the EUR loan on the basis of
a fixed interest rate
Contract parameters:
Contract conclusion date 27.07.2018
Maturity date each interest payment date in line with the payment schedule under the loan agreement; by 28.02.2022
Hedged value interest payable in line with the payment schedule under the loan agreement of EUR 3,344 thousand.
Type of hedge Hedge of cash flows related to variable interest rate on the PLN long-term loan
Hedged position Future PLN interest flows on PLN loan calculated on the basis of 6M WIBOR
Hedging instruments SWAP transaction under which the Company agreed to pay interest in PLN on the PLN loan on the basis of
a fixed interest rate
Contract parameters:
Contract conclusion date 21.11.2016
Maturity date each interest payment date in line with the payment schedule under the loan agreement; by 31.08.2021
Hedged value interest payable in line with the payment schedule under the loan agreement of PLN 11.5 million.
Type of hedge Hedge of cash flows related to variable interest rate on the PLN long-term revolving credit facility
Hedged position Future PLN interest flows on PLN loan calculated on the basis of 3M WIBOR
Hedging instruments SWAP transaction under which the Company agreed to pay interest in PLN on the PLN loan on the basis of
a fixed interest rate
Contract parameters:
Contract conclusion date 21.11.2016
Maturity date each interest payment date in line with the payment schedule under the loan agreement; by 30.08.2019
Hedged value interest payable in line with the payment schedule under the loan agreement of PLN 10 million.

Arctic Paper Capital Group/ Consolidated quarterly report for Q3 2018 71 Interim abbreviated consolidated financial statements
14.1.2. Fair value hedges
As at 30 September 2018, the Group had floor options as hedge to fair value.
Fair value hedge accounting related to a floor option
Type of hedge Hedge of cash flows related to variable interest rate on the PLN bonds
Hedged position Future PLN interest flows in PLN loan calculated on the basis of interest payments on PLN bonds at 6M
WIBOR
Hedging instruments The hedging item is a SWAP transaction under which the Company agreed to pay interest in PLN on the
PLN bonds on the basis of a fixed interest rate
Contract parameters:
Contract conclusion date 21.11.2016
Maturity date each interest payment date in line with the payment schedule under the bond issue agreement; by
31.08.2021 Hedged value interest payable in line with the payment schedule under of interest of PLN 100 million.
Type of hedge Hedge of cash flows related to variable interest rate on the PLN long-term loan
Hedged position Future PLN interest flows on PLN loan calculated on the basis of 3M WIBOR
Hedging instruments SWAP transaction under which the Company agreed to pay interest in PLN on the PLN loan on the basis of
a fixed interest rate
Contract parameters:
Contract conclusion date 31.07.2018
Maturity date each interest payment date in line with the payment schedule under the loan agreement; by 29.01.2021
Hedged value interest payable in line with the payment schedule under the loan agreement of PLN 25.8 million.
Type of hedge The right to reduce cash flows under payment of interest due to decrease of EURIBOR below 0%
Hedged position The hedged item are future EUR interest flows in EUR related to a loan in EUR calculated on the basis of 6M
EURIBOR
Hedging instruments The hedging item is a floor option under which the Company acquires the right to pay interest in EUR on
the basis of EURIBOR below 0%
Contract parameters:
Contract conclusion date 21.11.2016
Maturity date each interest payment date in line with the payment schedule under the loan agreement; by 31.08.2022
Hedged value interest payable in line with the payment schedule under the loan agreement of EUR 12 million.
Type of hedge The right to reduce cash flows under payment of interest due to decrease of EURIBOR below 0%
Hedged position The hedged item are future EUR interest flows in EUR related to a loan in EUR calculated on the basis of 6M
EURIBOR
Hedging instruments The hedging item is a floor option under which the Company acquires the right to pay interest in EUR on
the basis of EURIBOR below 0%
Contract parameters:
Contract conclusion date 18.07.2017
Maturity date each interest payment date in line with the payment schedule under the loan agreement; by 31.08.2022
Hedged value interest payable in line with the payment schedule under the loan agreement of EUR 3,986 thousand.

Arctic Paper Capital Group/ Consolidated quarterly report for Q3 2018 72 Interim abbreviated consolidated financial statements
The table below presents the fair value of hedging instruments in cash flow and fair value hedge accounting as at 30
September 2018 and the comparative data:
15. Financial risk management objectives and policies
The Group’s principal financial instruments comprise bank loans and borrowings, bonds, financial leases and hire purchase
contracts. The main purpose of those financial instruments is to raise finance for t he Group’s operations.
The Group also uses factoring without recourse for trade receivables. The main purpose for using the financial instrument is
to quickly raise funds.
The Group has various other financial instruments such as trade receivables and pay ables which arise directly from its
operations. The core risks arising from the Group's financial instruments include: interest rate risk, liquidity risk, FX risk and
credit risk. The Management Board reviews and approves policies for managing each of thos e risks.
In the opinion of the Management Board – in comparison to the annual consolidated financial statements made as at 31
December 2017 there have been no significant changes of the financial risk. There have been no changes to the objectives
and policies of the management of the risk.
16. Capital management The primary objective of the Group’s capital management is maintaining a strong credit rating and healthy capital ratios in
order to support its business operations and maximise shareholder value. In t he Management Board’s opinion – in
comparison to the annual consolidated financial statements made as at 31 December 2017, there have been no significant
changes to the objectives and policies of capital management.
Type of hedge The right to reduce cash flows under payment of interest due to decrease of EURIBOR below 0%
Hedged position The hedged item are future EUR interest flows in EUR related to a loan in EUR calculated on the basis of 6M
EURIBOR
Hedging instruments The hedging item is a floor option under which the Company acquires the right to pay interest in EUR on
the basis of EURIBOR below 0%
Contract parameters:
Contract conclusion date 27.07.2018
Maturity date each interest payment date in line with the payment schedule under the loan agreement; by 28.02.2022
Hedged value interest payable in line with the payment schedule under the loan agreement of EUR 3,344 thousand.
(unaudited) (unaudited)
AssetsEquity and
LiabilitiesAssets
Equity and
Liabilities
FX forward 415 - 849 1 170
Forward on pulp sales - 15 766 - 3 394
SWAP - 3 240 - 3 604
Floor option - (159) - 370
Forward for electricity 71 277 - 21 065 -
Tota l hed g ing d er iva t ive ins t rum ents 71 692 18 848 21 914 8 539
As at 30 September 2018 As at 31 December 2017
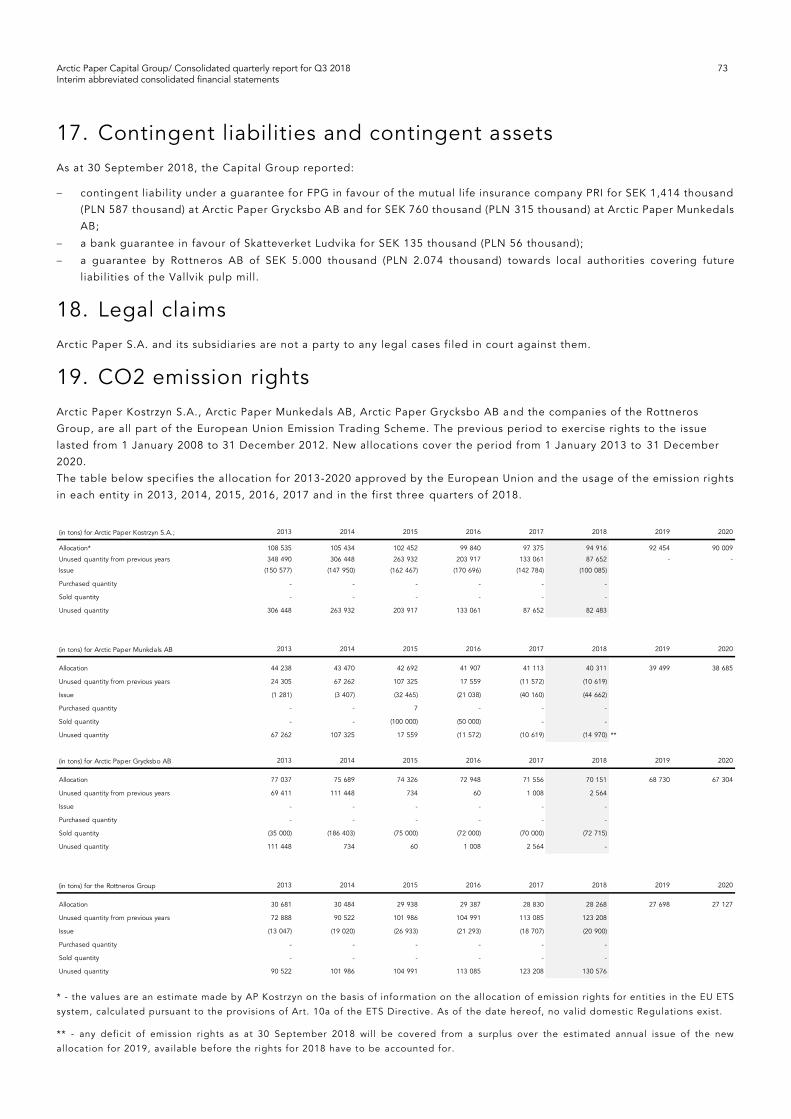
Arctic Paper Capital Group/ Consolidated quarterly report for Q3 2018 73 Interim abbreviated consolidated financial statements
17. Contingent liabilities and contingent assets As at 30 September 2018, the Capital Group reported:
contingent liability under a guarantee for FPG in favour of the mutual life insurance company PRI for SEK 1,414 thousand
(PLN 587 thousand) at Arctic Paper Grycksbo AB and for SEK 760 thousand (PLN 315 thousand) at Arctic Paper Munkedals
AB;
a bank guarantee in favour of Skatteverket Ludvika for SEK 135 thousand (PLN 56 thousand);
a guarantee by Rottneros AB of SEK 5.000 thousand (PLN 2.074 thousand) towards local authorities covering future
liabilities of the Vallvik pulp mill.
18. Legal claims Arctic Paper S.A. and its subsidiaries are not a party to any legal cases filed in court against them.
19. CO2 emission rights Arctic Paper Kostrzyn S.A., Arctic Paper Munkedals AB, Arctic Paper Grycksbo AB a nd the companies of the Rottneros
Group, are all part of the European Union Emission Trading Scheme. The previous period to exercise rights to the issue
lasted from 1 January 2008 to 31 December 2012. New allocations cover the period from 1 January 2013 to 31 December
2020.
The table below specifies the allocation for 2013-2020 approved by the European Union and the usage of the emission rights
in each entity in 2013, 2014, 2015, 2016, 2017 and in the first three quarters of 2018.
* - the values are an estimate made by AP Kostrzyn on the basis of info rmation on the allocation of emission rights for entities in the EU ETS
system, calculated pursuant to the provisions of Art. 10a of the ETS Directive. As of the date hereof, no valid domestic Regulations exist.
** - any deficit of emission rights as at 30 September 2018 will be covered from a surplus over the estimated annual issue of the new
allocation for 2019, available before the rights for 2018 have to be accounted for.
(in tons) for Arctic Paper Kostrzyn S.A.; 2013 2014 2015 2016 2017 2018 2019 2020
Allocation* 108 535 105 434 102 452 99 840 97 375 94 916 92 454 90 009
Unused quantity from previous years 348 490 306 448 263 932 203 917 133 061 87 652 - -
Issue (150 577) (147 950) (162 467) (170 696) (142 784) (100 085)
Purchased quantity - - - - - -
Sold quantity - - - - - -
Unused quantity 306 448 263 932 203 917 133 061 87 652 82 483
(in tons) for Arctic Paper Munkdals AB 2013 2014 2015 2016 2017 2018 2019 2020
Allocation 44 238 43 470 42 692 41 907 41 113 40 311 39 499 38 685
Unused quantity from previous years 24 305 67 262 107 325 17 559 (11 572) (10 619)
Issue (1 281) (3 407) (32 465) (21 038) (40 160) (44 662)
Purchased quantity - - 7 - - -
Sold quantity - - (100 000) (50 000) - -
Unused quantity 67 262 107 325 17 559 (11 572) (10 619) (14 970) **
(in tons) for Arctic Paper Grycksbo AB 2013 2014 2015 2016 2017 2018 2019 2020
Allocation 77 037 75 689 74 326 72 948 71 556 70 151 68 730 67 304
Unused quantity from previous years 69 411 111 448 734 60 1 008 2 564
Issue - - - - - -
Purchased quantity - - - - - -
Sold quantity (35 000) (186 403) (75 000) (72 000) (70 000) (72 715)
Unused quantity 111 448 734 60 1 008 2 564 -
(in tons) for the Rottneros Group 2013 2014 2015 2016 2017 2018 2019 2020
Allocation 30 681 30 484 29 938 29 387 28 830 28 268 27 698 27 127
Unused quantity from previous years 72 888 90 522 101 986 104 991 113 085 123 208
Issue (13 047) (19 020) (26 933) (21 293) (18 707) (20 900)
Purchased quantity - - - - - -
Sold quantity - - - - - -
Unused quantity 90 522 101 986 104 991 113 085 123 208 130 576

Arctic Paper Capital Group/ Consolidated quarterly report for Q3 2018 74 Interim abbreviated consolidated financial statements
20. Government grants and operations in the Special Economic Zone
20.1. Government grants
In the current half-year period, the Group companies have not received any material grants.
20.2. Operations in the Special Economic Zone
Arctic Paper Kostrzyn S.A. operates in the Kostrzyńsko-Słubicka Specjalna Strefa Ekonomiczna (Special Economic Zone –
KSSSE). Based on the permission issued by the Kostrzyńsko-Słubicka Specjalna Strefa Ekonomiczna S.A. the Company
benefits from an investment tax relief as regards the activities carried out under the permission.
The tax exemption is of conditional nature. The provisions of the Act on special economic zones provide that such tax relief
may be revoked if at least one of the following occurs:
— The Company ceases to conduct business operations in the zone for which it obtained the permission,
— The Company materially violates the conditions of the permission,
— The Company does not remedy errors/ irregularities identified during the course of inspections within the period of time
specified in the order issued by minister competent for economic affairs,
— The Company transfers, in any form, the title to the assets to which the investment tax relief related within less than 5
years of introducing those assets to the fixed assets register,
— Machines and equipment will be handed over for business purposes outs ide the zone,
— The Company receives compensation, in any form, of the investment expenditure incurred,
— The Company goes into liquidation or if it is declared bankrupt.
Based on the permit issued on 25 August 2006, the Company could benefit from the exemptio n until 15 November 2017.
Item I of the permit relating to the date by which the Company may enjoy the permit was deleted by Decision of the
Minister of Economy No. 321/IW/14 of 6 November 2014. Now the Company is entitled to use the permit by 2026 or by t he
date SSE exist in Poland pursuant to the applicable regulations. The permit may be used subject to the incurrence in the
zone of capital expenditures within the meaning of Art. 6 of the Regulation of the Council of Ministers of 14 September
2004 on the Kostrzyńsko-Słubicka Specjalna Strefa Ekonomiczna (Special Economic Zone), underlying the calculation of
public aid in compliance with Art. 3 of the Regulation with the value in excess of EUR 40,000 thousand by 31 December
2013. The amount was translated at the mean exchange rate of EUR published by the President of the National Bank of
Poland of the day the expense was incurred. The additional requi rements are as follows: creation in Zone of minimum five
new jobs within the meaning of Art. 3.3 and Art. 3 .6 of the Regulation by 31 December 2011 and maintaining the
employment level of minimum 453 people during the period from 1 January 2012 to 31 Dece mber 2013. The above terms
and conditions have been satisfied.
The conditions of the exemption have not changed in the reporting period. The Group has not been inspected by any
competent body.
During the period from 25 August 2006 to 30 September 2018, the Company incurred eligible investment expenditures
classified as (non-discounted) expenditure in KSSSE in the amount of PLN 227,102 thousand. During the period, the
discounted amount of related public aid was PLN 63,379 thousand.
If the eligible investment expenditures incurred are not covered with income of the current year, the Company recognises a
deferred income tax asset on the surplus.
The amount of deferred income tax asset recognised with reference to the expenditures incurred in KSSSE amounted to
PLN 5,255 thousand as at 30 September 2018.
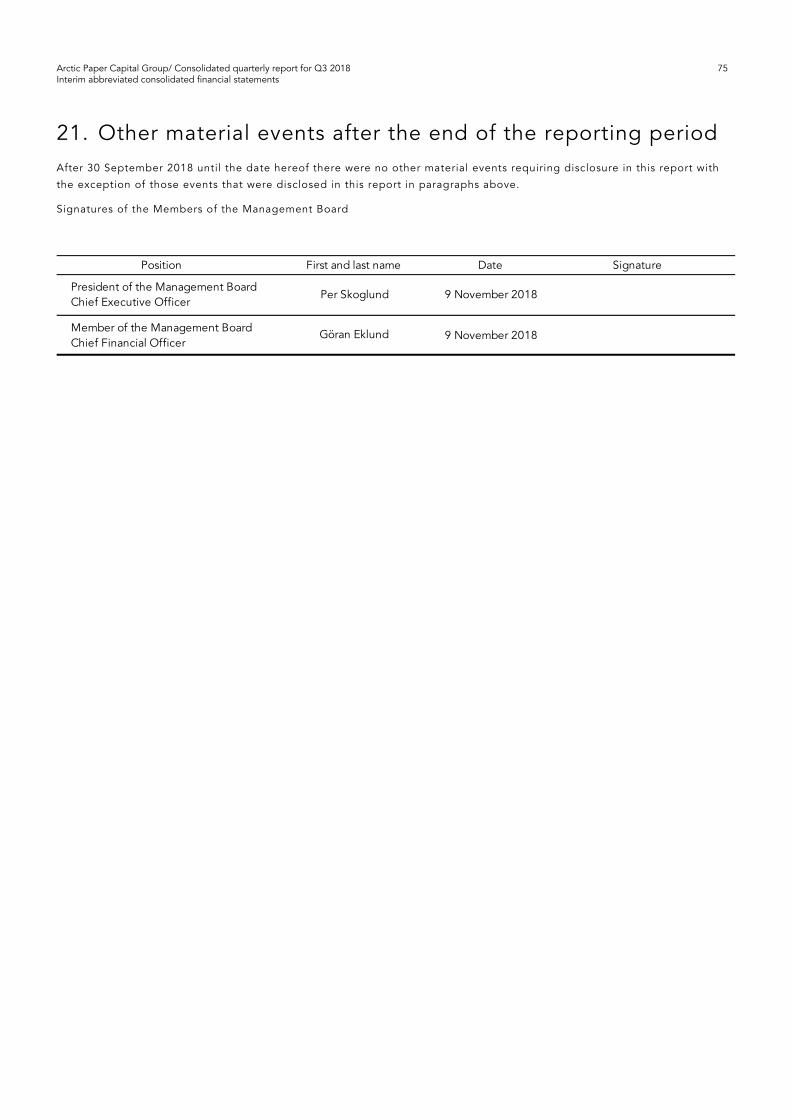
Arctic Paper Capital Group/ Consolidated quarterly report for Q3 2018 75 Interim abbreviated consolidated financial statements
21. Other material events after the end of the reporting period After 30 September 2018 until the date hereof there were no other material events requiring disclosure in this report with
the exception of those events that were disclosed in this report in paragraphs above.
Signatures of the Members of the Management Board
Position First and last name Date Signature
President of the Management Board Chief Executive Officer
Per Skoglund 9 November 2018
Member of the Management BoardChief Financial Officer
Göran Eklund 9 November 2018
www.arcticpaper.com
Head Office Branch in Sweden
Arctic Paper S.A.
J.H. Dąbrowskiego 334 A, Box 383 PL-60406, Poznań, Poland SE-401 26 Göteborg, Sweden Phone: +48 61 6262 000 Phone: +46 770 110 120 Fax.+48 61 6262 001 Fax. +46 31 631 725 Investor relations: [email protected] © 2018 Arctic Paper S.A.