Embed Size (px)
Citation preview

Arctic Oscillation and Polar Vortex Analysis and Forecasts
December 30, 2019
Special blog on winter 2018/2019 retrospective can be found here - http://www.aer.com/winter2019
Special blog on winter 2017/2018 retrospective can be found here - http://www.aer.com/winter2018
Special blog on winter 2016/2017 retrospective can be found here - http://www.aer.com/winter2017
Special blog on winter 2015/2016 retrospective can be found here - http://www.aer.com/winter2016
Dr. Judah Cohen from Atmospheric and Environmental Research (AER) recently embarked on an
experimental process of regular research, review, and analysis of the Arctic Oscillation (AO) and Polar
Vortex (PV). This analysis is intended to provide researchers and practitioners real-time insights on one
of North America’s and Europe’s leading drivers for extreme and persistent temperature patterns.
During the winter schedule the blog is updated once every week. Snow accumulation forecasts replace
precipitation forecasts. Also, there is renewed emphasis on ice and snow boundary conditions and their
influence on hemispheric weather.
Subscribe to our email list or follow me on Twitter (@judah47) for notification of updates.
The AO/PV blog is partially supported by NSF grant AGS: 1657748.
Summary
• The Arctic Oscillation (AO) is currently positive and is predicted to remain positive the next two
weeks.
• The current positive AO is reflective of negative pressure/geopotential height anomalies in the
central Arctic and Alaska with mixed pressure/geopotential height anomalies across the mid-
latitudes. The North Atlantic Oscillation (NAO) is also positive with weak negative
pressure/geopotential height anomalies spread across Greenland and Iceland; and the NAO is
predicted to remain positive over the next two weeks as heights remain negative across
Greenland.
• The general pattern across Europe the next two weeks is ridging/positive geopotential height
anomalies over Europe. The general above normal geopotential heights and the lack of snow
cover will result in widespread normal to above normal temperatures across Europe including
the United Kingdom (UK). However, during the end of the first week and into the second week
of January a trough/low pressure propagating through the Mediterranean will induce northerly
flow with normal to below normal temperatures in Western and Southern Europe.
• With a positive AO the general predicted pattern for Asia the next two weeks is ridging/positive
geopotential height anomalies with normal to above normal temperatures. Exceptions will be
troughing/negative pressure/geopotential height anomalies and normal to below normal
temperatures across the northern Indian subcontinent the entire period and Eastern Siberia
week two.

• This week the predicted pattern across North America is troughing/negative
pressure/geopotential height anomalies with widespread normal to below normal temperatures
across Alaska and the Western United States (US) with ridging/positive geopotential height
anomalies and normal to above normal temperatures widespread in Canada and the central and
eastern US. Next week the troughing/negative pressure/geopotential height anomalies will slide
into the Eastern US pulling some of the normal to below normal temperatures now in Alaska
into Eastern Canada and the Eastern US. In week two the troughing/negative
pressure/geopotential height anomalies are predicted to retrograde once more into western
North America allowing cold temperatures to become widespread across Alaska and Canada and
possibly the Northern US, though overall the Eastern US should be milder this period.
• In the Impacts section I focus on my expectations for the coming weeks vis-a-vis polar vortex
behavior.
Impacts
I feel like it is déjà-vu all over again with a strong stratospheric polar vortex (PV) in December leading to
a positive AO and a relatively mild pattern across the Northern Hemisphere as we head into
January. Reminds me most recently of winters 2015/16 and 2016/17. In 2015/16 possibly the
combination of a westerly quasi biennial oscillation (QBO) and super El Nino lead to an anomalously
strong, possibly even an all-time record strong PV that I would argue contributed to an overall mild
winter. January was surprisingly cold in the Eastern US given the record strong PV in large part because
a cyclone penetrated unusually far north into the central Arctic bringing with it anomalous heat and
humidity that triggered a tropospheric negative AO event. Eventually though in February and especially
March the PV became more disrupted and contributed to at least episodic more severe winter weather.
In 2016/17, the PV started off record weak in the fall and at one point the models were predicting one
of the earliest major warmings (where the zonal mean zonal wind at 10hPa and 60°N reverses from
positive to negative) ever observed in November. But the major warming never materialized the PV
quickly strengthened, coupled with the surface and the AO was positive in January with relatively mild
temperatures across the NH. Again, the PV became more perturbed in February and contributed to
more episodic severe winter weather in February and March.
This winter the PV weakened in November heading into December but the PV weakening fell well short
of major warming status, despite model forecasts to the contrary. The PV has since recovered and has
been on the stronger side of normal and this has coupled with the surface contributing to a positive AO
to at least kick-off January accompanied by a relatively mild pattern across the NH. In the Eastern US
the mild patter will be interrupted briefly by colder temperatures early next week. I would attribute this
interruption in the mild pattern to a relatively minor and short-lived reflective PV disruption. But once
the forcing from the PV disruption abates by late next week, it makes sense to me that Madden Julian
Oscillation forcing should dominate North American weather. MJO is predicted to be in a fairly robust
phase five which favors ridging south of the Aleutians troughing in western North America and more
ridging in the Eastern US. However, Canada is predicted to remain cold and storms traversing North
America can tap into this reservoir of cold resulting in at least short-term cold air outbreaks. Also I do
believe that the models are overly sensitive to tropical forcing and they could adjust colder with time.

But like in 2016 and again 2017 I expect the PV to become more disrupted. Increasing at least episodic
severe winter weather. Our polar vortex model is predicting a weakening of the PV from the very end of
the second into the third week of January. Though I am certain the predicted weakening in the model is
overdone, the model at least usually matches the trend in the PV. Also based on what I see from the
ECMWF stratospheric winds a much more defined reflective layer is predicted to form in the
stratosphere so if nothing else I would expect more reflective PV disruptions. So, though January looks
to start off relatively mild in the Eastern US or at least seasonable given the cold air from the reflective
event next week, I expect an increasing risk of cold weather related to PV disruptions. The risk for cold
weather is probably aided by the warm sea surface temperatures in the eastern North Pacific that favors
mid-tropospheric ridging in the region.
Whatever probability of cold weather that I see for the Eastern US, I anticipate lower probabilities for
Europe with the possible exception of the Mediterranean region. Outside of the higher elevations,
Europe has seen little winter weather this year. And with the AO predicted to be positive into the
foreseeable future, there is little reason to expect that to change. Though the GFS is predicting higher
probabilities of snowfall across Central and Eastern Europe than I might have expected given the
positive AO. And without a large PV disruption, I have a hard time imagining an extended period of
winter weather across Europe for the reminder of the winter.
Admittedly I don’t have some insightful analysis as to why I expect the PV to become more disrupted
with time other than to point to other recent winters. It does seem blocking in the North Atlantic sector
would go a long way to disrupting the PV and none is apparent in the short term. Also, I would say a
major warming is not likely this winter given that we had a major warming each of the past two
winters. Three winters in a row is not unprecedented but fairly uncommon.
Near Term Conditions
1-5 day
The AO is currently positive (Figure 1) with negative geopotential height anomalies across the Arctic and
mixed geopotential height anomalies across the mid-latitudes of the NH (Figure 2). And with weak
negative geopotential height anomalies across Greenland and Iceland (Figure 2), the NAO is slightly
positive as well.

Figure 1. (a) The predicted daily-mean AO at 10 hPa from the 00Z 30 December 2019 GFS ensemble. (b)
The predicted daily-mean near-surface AO from the 00Z 30 December 2019 GFS ensemble. Gray lines
indicate the AO index from each individual ensemble member, with the ensemble-mean AO index
given by the red line with squares.
This week ridging/positive geopotential height anomalies are predicted to dominate Western and
Northern Europe with troughing/negative geopotential height anomalies mostly confined to
Southeastern Europe (Figure 2). General high heights and lack of snow cover will result in normal to
above normal temperatures across much of Europe including the UK with the possible exception of
normal to below normal temperatures across the Balkan States and Turkey (Figure 3). This week,
ridging/positive geopotential height anomalies are predicted to dominate much of Asia (Figure 2)
favoring widespread normal to above normal temperatures across much of Asia (Figure 3). Exceptions
are the northern India subcontinent and Northeastern Asia where regional troughing/negative
geopotential height anomalies (Figure 2) are predicted to result in normal to below normal
temperatures (Figure 3).

Figure 2. Forecasted average 500 mb geopotential heights (dam; contours) and geopotential height
anomalies (m; shading) across the Northern Hemisphere from 31 December 2019 – 4 January 2020. The
forecasts are from the 30 December 00z GFS ensemble.
This week, troughing/negative geopotential height anomalies in Alaska and the Western US will force
downstream ridging/positive geopotential height anomalies across central and eastern North America
(Figure 2). This is predicted to result in normal to below normal temperatures in Alaska and the
Western US with normal to above normal temperatures across much of Canada and the Central and
Eastern US (Figure 3).
Figure 3. Forecasted surface temperature anomalies (°C; shading) from 31 December 2019 – 4 January
2020. The forecast is from the 00Z 30 December2019 GFS ensemble.
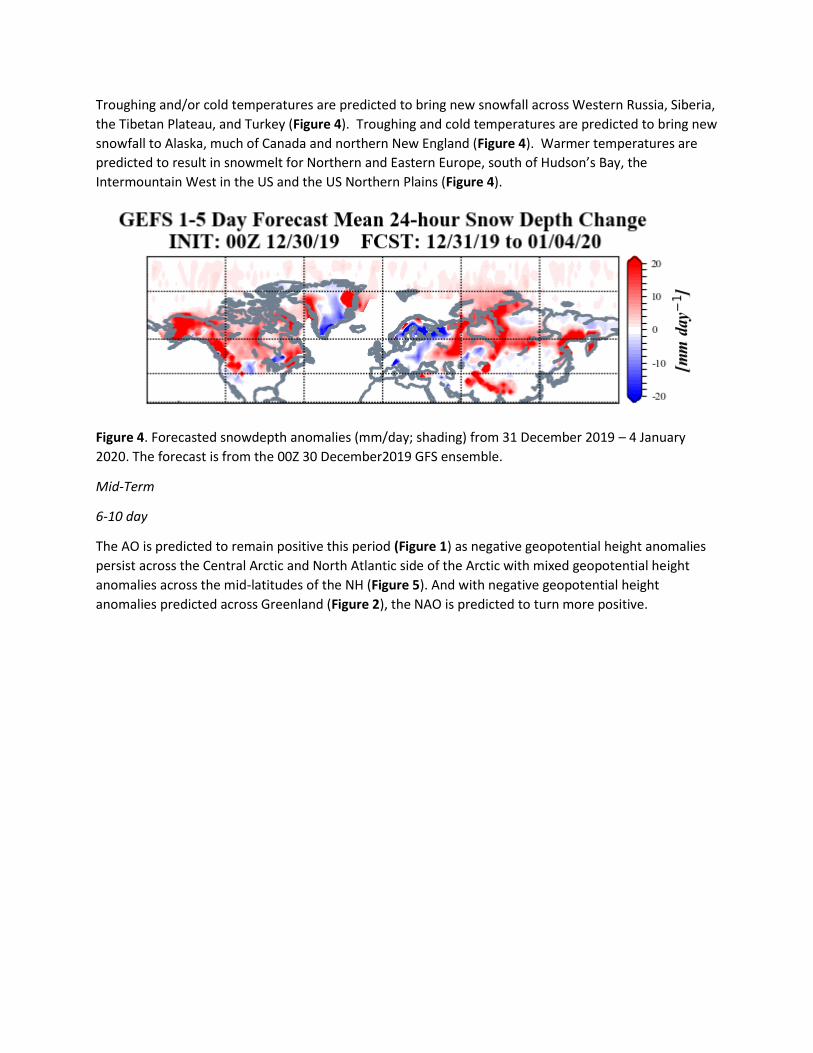
Troughing and/or cold temperatures are predicted to bring new snowfall across Western Russia, Siberia,
the Tibetan Plateau, and Turkey (Figure 4). Troughing and cold temperatures are predicted to bring new
snowfall to Alaska, much of Canada and northern New England (Figure 4). Warmer temperatures are
predicted to result in snowmelt for Northern and Eastern Europe, south of Hudson’s Bay, the
Intermountain West in the US and the US Northern Plains (Figure 4).
Figure 4. Forecasted snowdepth anomalies (mm/day; shading) from 31 December 2019 – 4 January
2020. The forecast is from the 00Z 30 December2019 GFS ensemble.
Mid-Term
6-10 day
The AO is predicted to remain positive this period (Figure 1) as negative geopotential height anomalies
persist across the Central Arctic and North Atlantic side of the Arctic with mixed geopotential height
anomalies across the mid-latitudes of the NH (Figure 5). And with negative geopotential height
anomalies predicted across Greenland (Figure 2), the NAO is predicted to turn more positive.
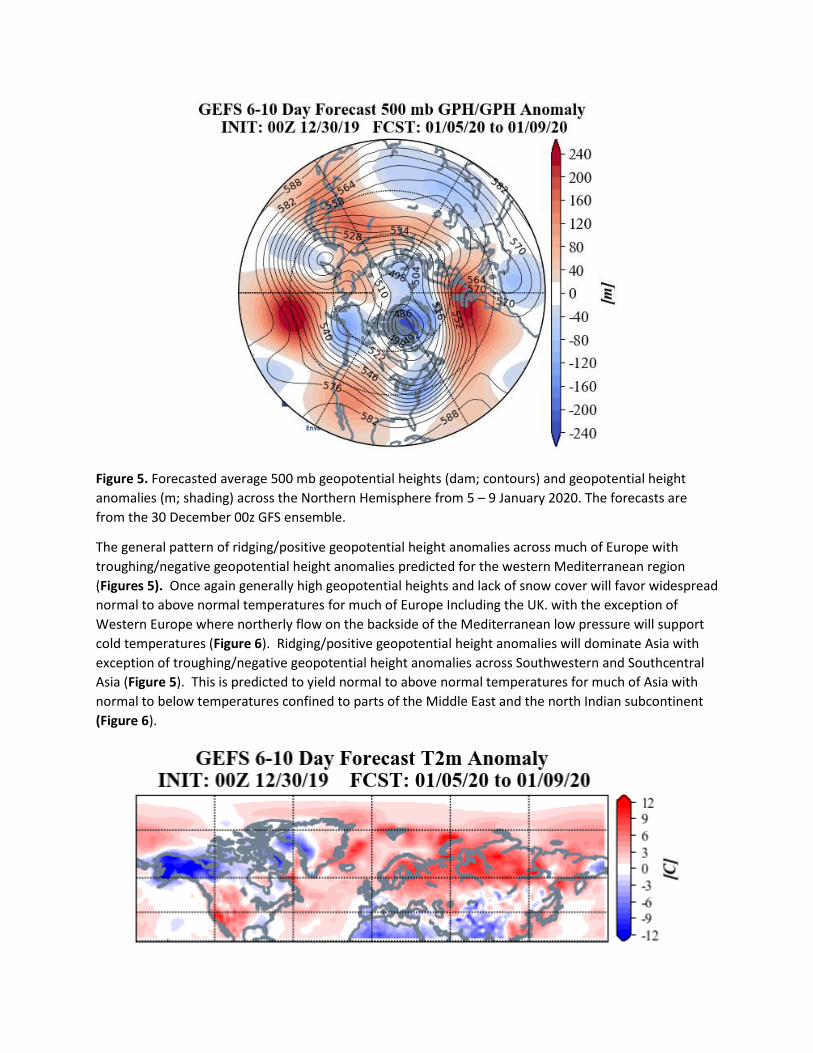
Figure 5. Forecasted average 500 mb geopotential heights (dam; contours) and geopotential height
anomalies (m; shading) across the Northern Hemisphere from 5 – 9 January 2020. The forecasts are
from the 30 December 00z GFS ensemble.
The general pattern of ridging/positive geopotential height anomalies across much of Europe with
troughing/negative geopotential height anomalies predicted for the western Mediterranean region
(Figures 5). Once again generally high geopotential heights and lack of snow cover will favor widespread
normal to above normal temperatures for much of Europe Including the UK. with the exception of
Western Europe where northerly flow on the backside of the Mediterranean low pressure will support
cold temperatures (Figure 6). Ridging/positive geopotential height anomalies will dominate Asia with
exception of troughing/negative geopotential height anomalies across Southwestern and Southcentral
Asia (Figure 5). This is predicted to yield normal to above normal temperatures for much of Asia with
normal to below temperatures confined to parts of the Middle East and the north Indian subcontinent
(Figure 6).
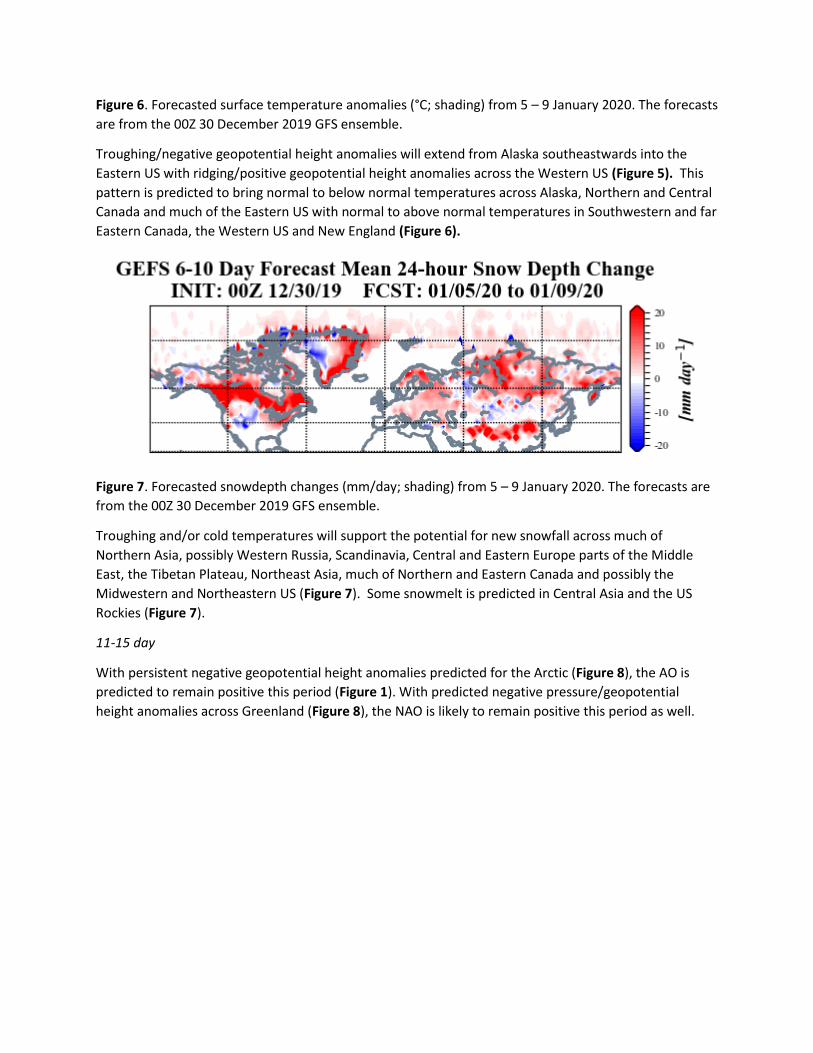
Figure 6. Forecasted surface temperature anomalies (°C; shading) from 5 – 9 January 2020. The forecasts
are from the 00Z 30 December 2019 GFS ensemble.
Troughing/negative geopotential height anomalies will extend from Alaska southeastwards into the
Eastern US with ridging/positive geopotential height anomalies across the Western US (Figure 5). This
pattern is predicted to bring normal to below normal temperatures across Alaska, Northern and Central
Canada and much of the Eastern US with normal to above normal temperatures in Southwestern and far
Eastern Canada, the Western US and New England (Figure 6).
Figure 7. Forecasted snowdepth changes (mm/day; shading) from 5 – 9 January 2020. The forecasts are
from the 00Z 30 December 2019 GFS ensemble.
Troughing and/or cold temperatures will support the potential for new snowfall across much of
Northern Asia, possibly Western Russia, Scandinavia, Central and Eastern Europe parts of the Middle
East, the Tibetan Plateau, Northeast Asia, much of Northern and Eastern Canada and possibly the
Midwestern and Northeastern US (Figure 7). Some snowmelt is predicted in Central Asia and the US
Rockies (Figure 7).
11-15 day
With persistent negative geopotential height anomalies predicted for the Arctic (Figure 8), the AO is
predicted to remain positive this period (Figure 1). With predicted negative pressure/geopotential
height anomalies across Greenland (Figure 8), the NAO is likely to remain positive this period as well.
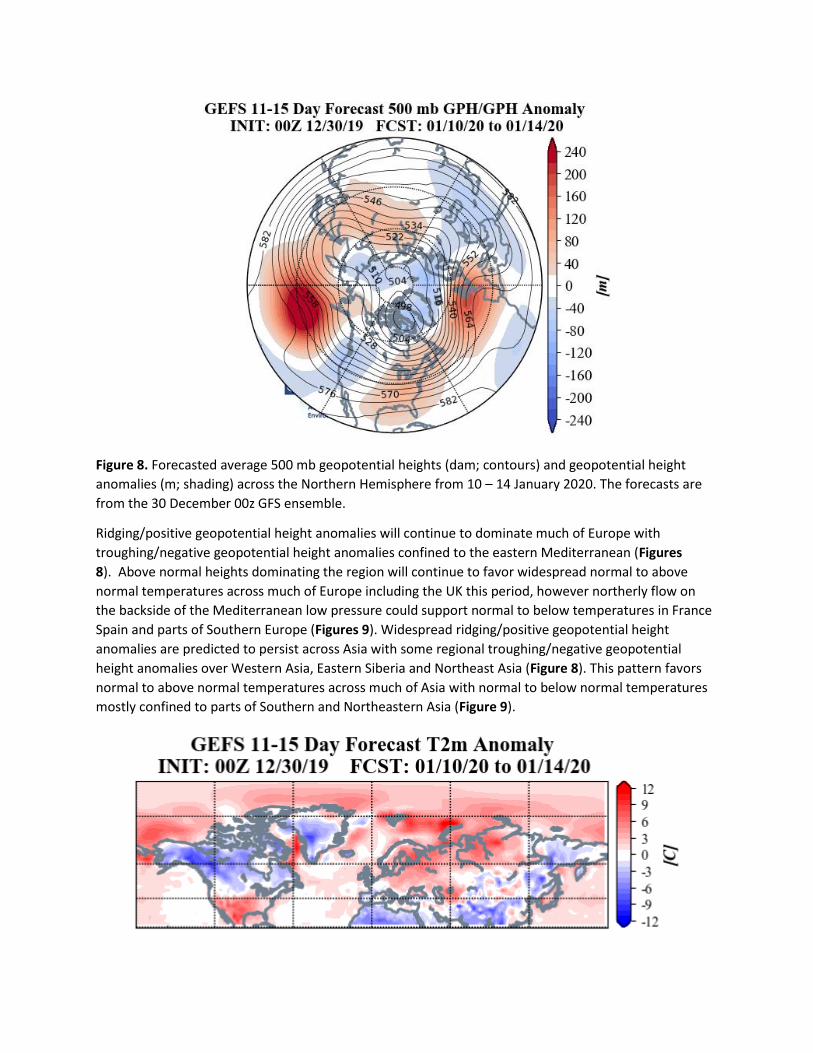
Figure 8. Forecasted average 500 mb geopotential heights (dam; contours) and geopotential height
anomalies (m; shading) across the Northern Hemisphere from 10 – 14 January 2020. The forecasts are
from the 30 December 00z GFS ensemble.
Ridging/positive geopotential height anomalies will continue to dominate much of Europe with
troughing/negative geopotential height anomalies confined to the eastern Mediterranean (Figures
8). Above normal heights dominating the region will continue to favor widespread normal to above
normal temperatures across much of Europe including the UK this period, however northerly flow on
the backside of the Mediterranean low pressure could support normal to below temperatures in France
Spain and parts of Southern Europe (Figures 9). Widespread ridging/positive geopotential height
anomalies are predicted to persist across Asia with some regional troughing/negative geopotential
height anomalies over Western Asia, Eastern Siberia and Northeast Asia (Figure 8). This pattern favors
normal to above normal temperatures across much of Asia with normal to below normal temperatures
mostly confined to parts of Southern and Northeastern Asia (Figure 9).

Figure 9. Forecasted surface temperature anomalies (°C; shading) from 10 – 14 January 2020. The
forecasts are from the 30 December 00z GFS ensemble.
Strong predicted ridging/positive geopotential height anomalies south of the Aleutians will support
downstream troughing/negative geopotential height anomalies across western North America while
ridging/positive geopotential height anomalies return to Eastern Canada and the Eastern US (Figure
8). This pattern is predicted to favor normal to below normal temperatures across Alaska, much of
Canada and the US along the Canadian border with normal to above normal temperatures for much of
the Southern and Central US (Figure 9).
Figure 10. Forecasted snow depth changes (mm/day; shading) from 10 – 14 January 2020. The forecasts
are from the 00z 30 December GFS ensemble.
Troughing and/or cold temperatures will support new snowfall across much of northern Asia, the
Tibetan Plateau and possibly Eastern and Central Europe (Figure 10). New snowfall is possible across
much of Canada, the Northern US but especially the Northwestern US (Figure 10). Some snowmelt is
possible in Central Asia the US Ohio Valley (Figure 10).
Longer Term
30–day
The latest plot of the polar cap geopotential height anomalies (PCHs) currently shows only weak
anomalies with normal to below normal PCHs in the troposphere and stratosphere (Figure 11). The one
exception is strong negative/cold PCHs in the lower troposphere predicted for this week consistent with
a predicted positive AO this week (Figure 1). The predicted cold PCHs in the lower troposphere this
week appear to be coupled with and in response to downward propagation of cold PCHs in the middle
stratosphere due to a normal to strong PV since mid-December (Figure 11).

Figure 11. Observed and predicted daily polar cap height (i.e., area-averaged geopotential heights
poleward of 60°N) standardized anomalies. The forecasts are from the 00Z 30 December 2019 GFS
ensemble.
The plot of Wave Activity Flux (WAFz) or poleward heat transport shows a relatively quiet two-week
period week with only weak positive anomalies predicted (Figure 12). The predicted positive WAFz for
the upcoming week are predicted to be followed by weak negative anomalies over the weekend and
into early next week. Positive followed by negative WAFz anomalies is characteristic of a reflective PV
disruption that tends to favor cold temperatures in central and eastern North America. I would
attribute the shot of cold temperatures predicted for early next week in the Eastern US to this reflective
event. But the event looks relatively minor and the impacts should be transitory.
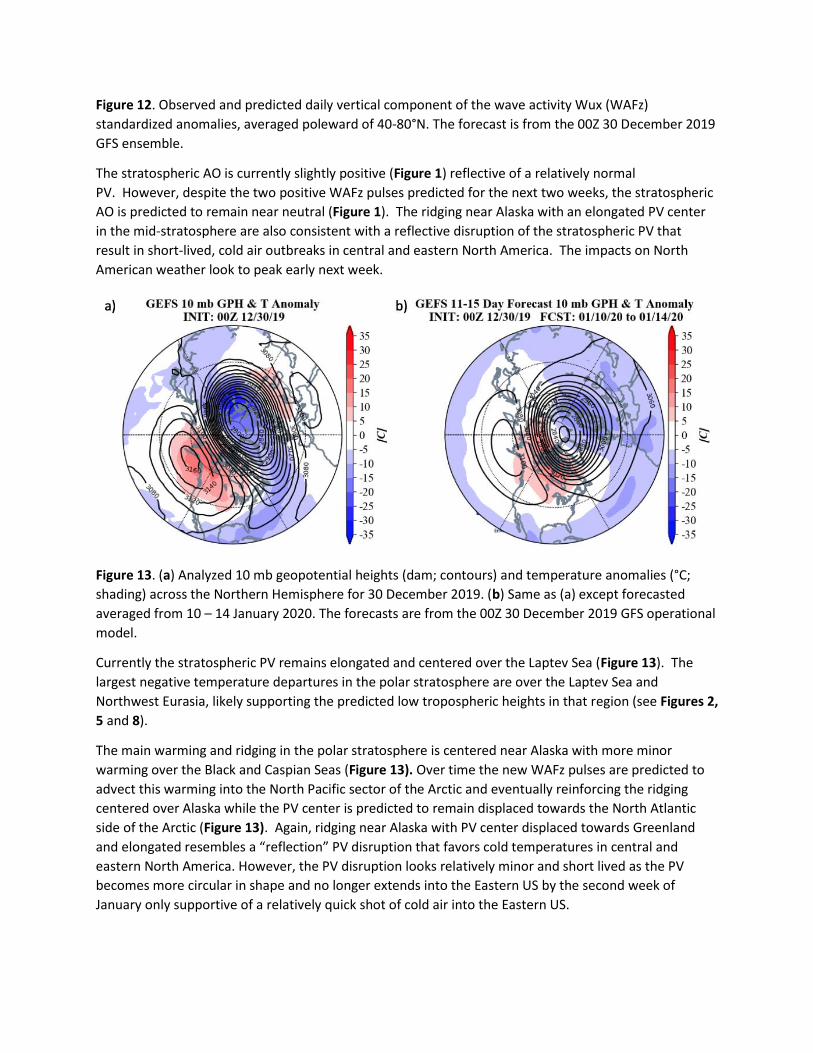
Figure 12. Observed and predicted daily vertical component of the wave activity Wux (WAFz)
standardized anomalies, averaged poleward of 40-80°N. The forecast is from the 00Z 30 December 2019
GFS ensemble.
The stratospheric AO is currently slightly positive (Figure 1) reflective of a relatively normal
PV. However, despite the two positive WAFz pulses predicted for the next two weeks, the stratospheric
AO is predicted to remain near neutral (Figure 1). The ridging near Alaska with an elongated PV center
in the mid-stratosphere are also consistent with a reflective disruption of the stratospheric PV that
result in short-lived, cold air outbreaks in central and eastern North America. The impacts on North
American weather look to peak early next week.
Figure 13. (a) Analyzed 10 mb geopotential heights (dam; contours) and temperature anomalies (°C;
shading) across the Northern Hemisphere for 30 December 2019. (b) Same as (a) except forecasted
averaged from 10 – 14 January 2020. The forecasts are from the 00Z 30 December 2019 GFS operational
model.
Currently the stratospheric PV remains elongated and centered over the Laptev Sea (Figure 13). The
largest negative temperature departures in the polar stratosphere are over the Laptev Sea and
Northwest Eurasia, likely supporting the predicted low tropospheric heights in that region (see Figures 2,
5 and 8).
The main warming and ridging in the polar stratosphere is centered near Alaska with more minor
warming over the Black and Caspian Seas (Figure 13). Over time the new WAFz pulses are predicted to
advect this warming into the North Pacific sector of the Arctic and eventually reinforcing the ridging
centered over Alaska while the PV center is predicted to remain displaced towards the North Atlantic
side of the Arctic (Figure 13). Again, ridging near Alaska with PV center displaced towards Greenland
and elongated resembles a “reflection” PV disruption that favors cold temperatures in central and
eastern North America. However, the PV disruption looks relatively minor and short lived as the PV
becomes more circular in shape and no longer extends into the Eastern US by the second week of
January only supportive of a relatively quick shot of cold air into the Eastern US.

Figure 14. Forecasted average 500 mb geopotential heights (dam; contours) and geopotential height
anomalies (m; shading) across the Northern Hemisphere for January 2020. The forecasts are from the 30
December 2019 CFS.
I include in this week’s blog the monthly 500 hPa geopotential heights (Figure 14) and the surface
temperatures (Figure 15) forecast for January from the Climate Forecast System (CFS; the plots
represent yesterday’s four ensemble members). The forecast for the troposphere is ridging across
Europe, Central Siberia, south of the Aleutians and the Eastern US with troughs over the eastern
Mediterranean, Central Asia, Eastern Siberia/the western North Pacific and western North America
(Figure 14). This pattern favors relatively mild temperatures for Europe, Western Asia Western and
Central Siberia, Southern Canada and the US with seasonable to relatively cold temperatures for
Southern Asia, Eastern Siberia, Northeast Asia, Alaska, and Northern Canada (Figure 15). The CFS
forecast for January has returned to predicting a circulation pattern that projects on to the pattern of
variability associated with a positive AO.
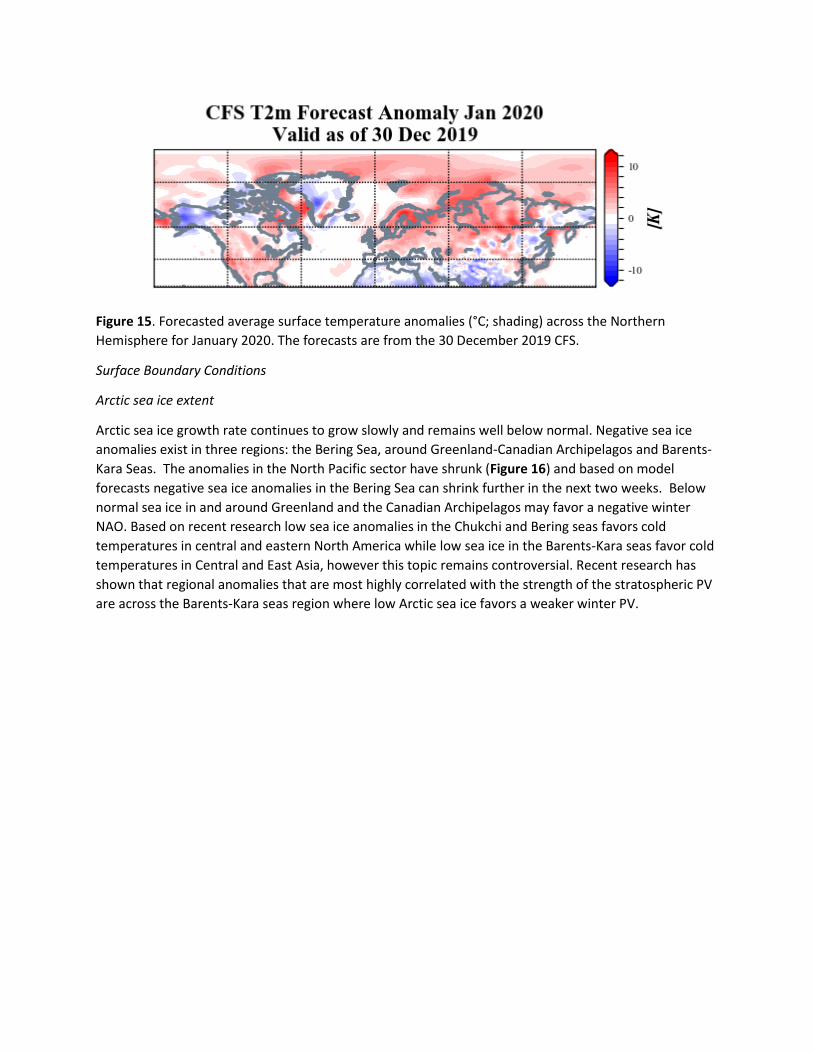
Figure 15. Forecasted average surface temperature anomalies (°C; shading) across the Northern
Hemisphere for January 2020. The forecasts are from the 30 December 2019 CFS.
Surface Boundary Conditions
Arctic sea ice extent
Arctic sea ice growth rate continues to grow slowly and remains well below normal. Negative sea ice
anomalies exist in three regions: the Bering Sea, around Greenland-Canadian Archipelagos and Barents-
Kara Seas. The anomalies in the North Pacific sector have shrunk (Figure 16) and based on model
forecasts negative sea ice anomalies in the Bering Sea can shrink further in the next two weeks. Below
normal sea ice in and around Greenland and the Canadian Archipelagos may favor a negative winter
NAO. Based on recent research low sea ice anomalies in the Chukchi and Bering seas favors cold
temperatures in central and eastern North America while low sea ice in the Barents-Kara seas favor cold
temperatures in Central and East Asia, however this topic remains controversial. Recent research has
shown that regional anomalies that are most highly correlated with the strength of the stratospheric PV
are across the Barents-Kara seas region where low Arctic sea ice favors a weaker winter PV.

Figure 16. a) Observed Arctic sea ice extent on 29 December 2019 (white). Orange line shows
climatological extent of sea ice based on the years 1981-2010.
SSTs/El Niño/Southern Oscillation
Equatorial Pacific sea surface temperatures (SSTs) anomalies have cooled and neutral El Niño/Southern
Oscillation (ENSO) conditions seem most likely (Figure 17). Observed SSTs across the NH remain well
above normal especially near Alaska and in the Gulf of Alaska though below normal SSTs exist regionally
especially west of South America. Warm SSTs in the Gulf of Alaska may favor mid-tropospheric ridging
in the region this winter.
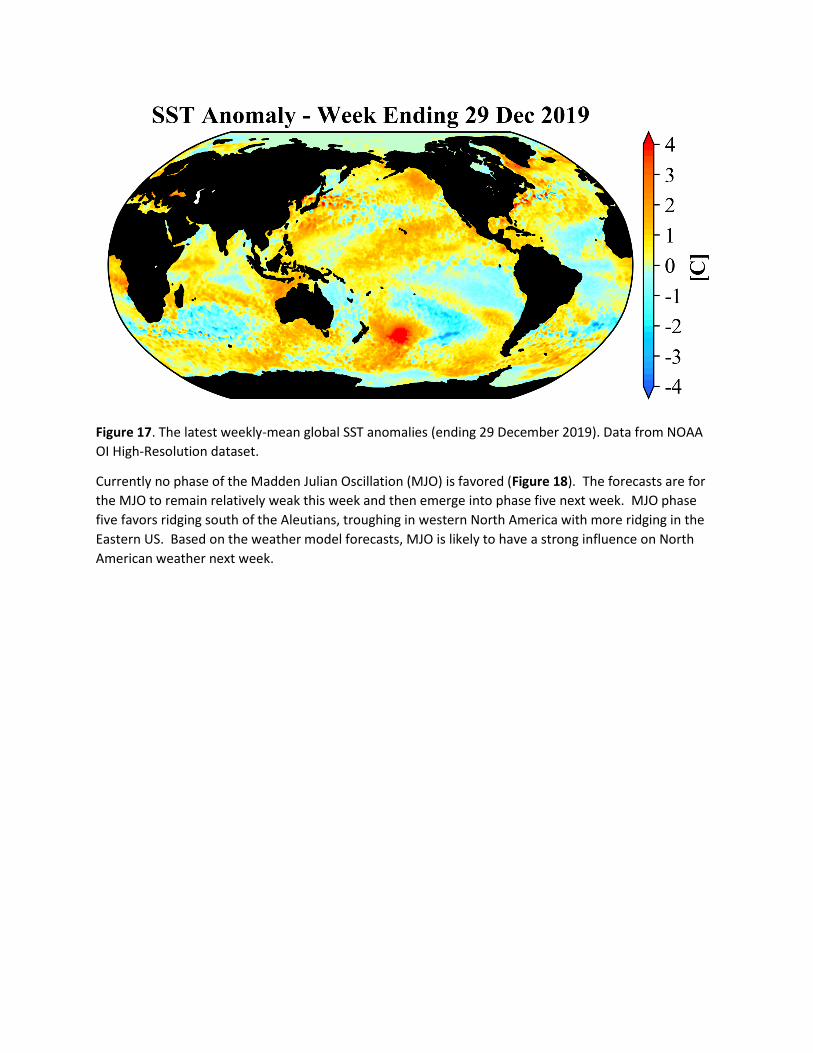
Figure 17. The latest weekly-mean global SST anomalies (ending 29 December 2019). Data from NOAA
OI High-Resolution dataset.
Currently no phase of the Madden Julian Oscillation (MJO) is favored (Figure 18). The forecasts are for
the MJO to remain relatively weak this week and then emerge into phase five next week. MJO phase
five favors ridging south of the Aleutians, troughing in western North America with more ridging in the
Eastern US. Based on the weather model forecasts, MJO is likely to have a strong influence on North
American weather next week.
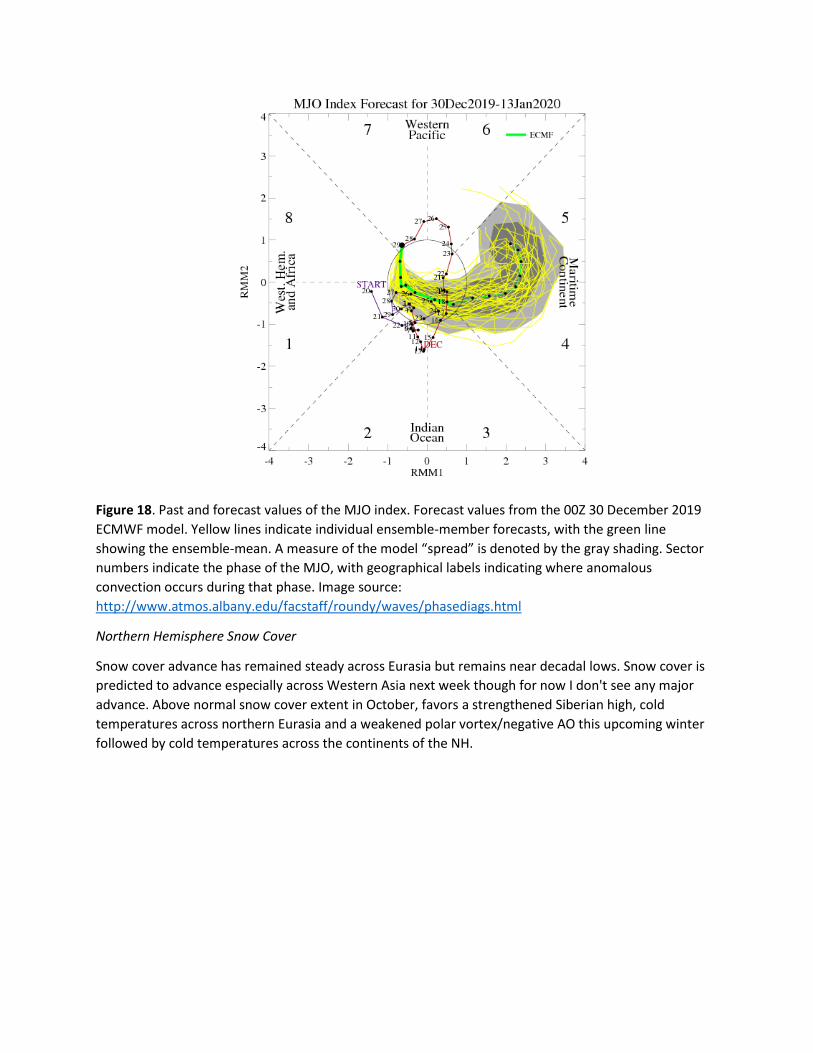
Figure 18. Past and forecast values of the MJO index. Forecast values from the 00Z 30 December 2019
ECMWF model. Yellow lines indicate individual ensemble-member forecasts, with the green line
showing the ensemble-mean. A measure of the model “spread” is denoted by the gray shading. Sector
numbers indicate the phase of the MJO, with geographical labels indicating where anomalous
convection occurs during that phase. Image source:
http://www.atmos.albany.edu/facstaff/roundy/waves/phasediags.html
Northern Hemisphere Snow Cover
Snow cover advance has remained steady across Eurasia but remains near decadal lows. Snow cover is
predicted to advance especially across Western Asia next week though for now I don't see any major
advance. Above normal snow cover extent in October, favors a strengthened Siberian high, cold
temperatures across northern Eurasia and a weakened polar vortex/negative AO this upcoming winter
followed by cold temperatures across the continents of the NH.

Figure 19. Observed Eurasian (top) and North American (bottom) snow cover extent through 29
December 2019. Image source:
https://www.star.nesdis.noaa.gov/smcd/emb/snow/HTML/snow_extent_plots.html
North American snow cover has melted back this past week with warmer temperatures and is now near
decadal lows. I don't foresee any major advance for the upcoming week. The early advance of snow
cover across Canada this fall, has likely contributed to an early start of cold temperatures across the
Western US and now the Eastern US.