Embed Size (px)
Citation preview

Tellus (2007), 59B, 99–114 C© 2007 The AuthorsJournal compilation C© 2007 Blackwell Munksgaard
Printed in Singapore. All rights reservedT E L L U S
Arctic haze: current trends and knowledge gaps
By P. K. QUINN 1∗, G . SHAW 2, E . ANDREWS 3, E . G . DUTTON 4, T. RUOHO-AIROLA 5 and S .L . GONG 6, 1NOAA PMEL, 7600 Sand Point Way NE, Seattle, WA 98115, USA; 2University of Alaska, Fairbanks,
AK 99775, USA; 3University of Colorado, Boulder, CO 80309, USA; 4NOAA GMD, Boulder, CO 80305, USA;5Finnish Meteorological Institute, P.O. Box 503, FI-00101, Helsinki, Finland; 6Air Quality Research Branch,
Meteorological Service of Canada, Toronto, Ontario, Canada, M3H 5T4
(Manuscript received 20 June 2006; in final form 25 October 2006)
ABSTRACTTrend analyses were performed on several indicators of Arctic haze using data from sites located in the North American,Norwegian, Finnish and Russian Arctic for the spring months of March and April. Concentrations of nonseasalt (nss)SO4
= in the Canadian, Norwegian and Finnish Arctic were found to have decreased by 30–70% from the early 1990sto present. The magnitude of the decrease depended on location. The trend in nss SO4
= at Barrow, Alaska from 1997to present, is unclear. Measurements at Barrow of light scattering by aerosols show a decrease of about 50% betweenthe early 1980s and the mid-1990s for both March and April. Restricting the analysis to the more recent period of 1997to present indicates an increase in scattering of about 50% during March. Aerosol NO3
− measured at Alert, Canada hasincreased by about 50% between the early 1990s and 2003. Nss K+ and light absorption, indicators of forest fires, havea seasonal maximum during the winter and spring and minimum during the summer and fall at both Alert and Barrow.Based on these data, the impact of summertime forest fire emissions on low-altitude surface sites within the Arctic isrelatively small compared to winter/spring emissions. Key uncertainties about the impact of long range transport ofpollution to the Arctic remain including the certainty of the recent detected trends; sources, transport and trends of soot;and radiative effects due to complex interactions between aerosols, clouds and radiation in the Arctic.
1. The Arctic haze phenomenon
It has been more than 50 yr since observations of a strange haze,of unknown origin, were reported by pilots flying in the Canadianand Alaskan Arctic (Greenaway, 1950; Mitchell, 1956). Based onmeasurements at McCall Glacier in Alaska, Shaw and Wendler(1972) noted that the turbidity maximized in spring. First mea-surements of the vertical structure of the haze were made in anAlaskan “bush” airplane with a hand-held sunphotometer (Shaw,1975). At that time the origin of the haze was uncertain and wasattributed to ice crystals seeded by open leads or blowing dustfrom riverbeds. It was only through “chemical fingerprinting”of the haze that its anthropogenic source was revealed (Rahnet al., 1977; Rahn and McCaffrey, 1979; Ottar et al., 1986; Rahn1989). By the late 1970s the anthropogenic origin was clear butsurprising since it was widely believed that aerosol was generallynot transported more than a few hundreds of kilometres from itssource regions. Experts from Europe and America convened atthe first Arctic Air Chemistry Symposium at Lillestrom, Norwayin 1978 and an informal measurement network was agreed upon.
∗Corresponding author.e-mail: [email protected]: 10.1111/j.1600-0889.2006.00238.x
Spatial gradients soon showed the direction of flow and the sur-prisingly large extent of this anthropogenic cloud of pollution. Acombination of intensive field programs and long-term measure-ments extending over the past 30 yr confirmed the early conclu-sions that the haze is anthropogenic in origin due to emissionsfrom Europe and the former Soviet Union that are transportedto and trapped in the Arctic air mass during the winter and earlyspring.
The haze is composed of a varying mixture of sulphate andparticulate organic matter (POM) and, to a lesser extent, ammo-nium, nitrate, dust, and black carbon (e.g. Li and Barrie, 1993;Quinn et al., 2002). It also is rich in distinct heavy metals, whichhas allowed for the identification of particular industrial sources(e.g. Shaw, 1983; Polissar et al., 1998, 2001). Particles withinthe haze are well aged with a mass median diameter of about0.2 microns or less (e.g. Heintzenberg, 1980; Hoff et al., 1983;Pacyna et al., 1984; Shaw, 1984; Clarke, 1989; Leaitch et al.,1989; Trivett et al., 1989; Hillamo et al., 1993). This particle sizerange is very efficient at scattering visible solar radiation sincethe peak in the particle surface-area size distribution is near themaximum efficiency for Mie scattering (Waggoner and Weiss,1980; Shaw, 1987). The haze also is weakly absorbing due to thepresence of black carbon (e.g. Hansen and Rosen, 1984; Nooneand Clarke, 1988; Kahl and Hansen, 1989; Hopper et al., 1994).
Tellus 59B (2007), 1 99

100 P. K. QUINN ET AL.
The result of the strong scattering and weaker absorption is anoticeable reduction in visibility to a few kilometres or less. The“weak” absorption may have large climatic influences when thedark coloured haze spreads out over the highly reflecting snowand ice pack of the Arctic. The highly reflecting surface enhancesaerosol-radiative interactions due to multiple scattering betweenthe surface and the haze (e.g. Shaw and Stamnes, 1980).
Several seasonally dependent mechanisms contribute to theformation of Arctic haze. Strong surface-based temperature in-versions form in the polar night causing the atmosphere to stabi-lize. This cold and stable atmosphere inhibits turbulent transferbetween atmospheric layers as well as the formation of cloudsystems and precipitation, the major removal pathway for par-ticulates from the atmosphere (Barrie et al., 1981; Shaw, 1981a,1995; Heintzenberg and Larssen, 1983). In addition, meridionaltransport from the midlatitudes to the Arctic intensifies duringthe winter and spring (Iversen and Joranger, 1985). The combi-nation of these factors results in the transport of precursor gasesand particulates to the Arctic and the trapping of the pollutanthaze for up to 15 to 30 d (Shaw, 1981a, 1995).
Aircraft and lidar measurements throughout the 1980s and1990s revealed that the haze occurs primarily in the lowest5 km of the atmosphere and peaks in the lowest 2 km (Leaitchet al., 1984; Hoff, 1988; Pacyna and Ottar, 1988; Barrie, 1996).Throughout the haze season, the pollution layers are highly in-homogeneous both vertically (tens of metres to 1 km thick) andspatially (20–200 km in horizontal extent) (Radke et al., 1984;Brock et al., 1989).
Recent aircraft measurements of sulphate aerosol using a hightime resolution technique revealed detailed information about theevolution of the vertical structure of the haze between Februaryand May (Scheuer et al., 2003). During early February, signif-icant enhancements in sulphate aerosol are confined near thesurface (<2 km) as long-range transport from northern Eura-sia occurs along low level, sinking isentropes (Klonecki et al.,2003). As the haze season progresses, enhanced sulphate occursat higher altitudes (up to at least 8 km). Since vertical mixingis prohibited by the persistent low-level inversion (Kahl, 1990),the higher-altitude haze layers are thought to be due to transportinto the Arctic along vertically higher isentropes tracing back toincreasingly warmer source regions in northern Eurasia. Duringearly April, sulphate layers below 3 km begin to dissipate dueto the beginning of solar heating and resulting mixing near thesurface. However, more stable isentropic transport continues athigher altitudes. By the end of May, both the lower- and higher-altitude sulphate enhancements are significantly decreased dueto the continued break-up of the inversion and return of wetdeposition.
Recent studies also have provided evidence for an influenceof natural climate variability on interannual changes in lev-els of Arctic haze. Modeling the dispersion of anthropogenicemissions from northern hemisphere continents, Eckhardt et al.(2003) found that the North Atlantic Oscillation (NAO) influ-
ences pollution transport into the Arctic during the winter–springhaze season. During positive phases of the NAO, surface con-centrations of modelled tracers in the Arctic winter were foundto be elevated by about 70% relative to negative phases. Thisdifference was mainly due to a change in pathways of Euro-pean pollution and, to a lesser extent, North American pollutionto the Arctic both of which are enhanced during positive NAOphases. In addition, during positive NAO phases, significant pos-itive correlations between the NAO and measured CO concentra-tions were found at three Arctic stations (Spitsbergen, Barrowand Alert) confirming enhanced poleward transport of pollu-tion from Europe, Asia and North America. Similar but weakercorrelations between the NAO and measured CO were foundfor spring. Low correlations were found during summer andfall.
During transport from the source regions to the Arctic, thepollutant-containing air masses have a high probability of reach-ing saturation and nucleating and precipitating clouds. It is notunderstood how so much material gets through a strongly scav-enging system (Bowling and Shaw, 1992).
Arctic haze has been the subject of much study because of itspotential to change the short and longwave radiation balance ofthe Arctic, affect visibility, and provide a source of contaminantsto Arctic ecosystems. The near surface concentration of aerosolsat most places in the Arctic are about an order of magnitude lowerthan those found at more polluted and industrialized locations.At the same time, however, the affected areas are much larger insize and the affected ecosystems in the high Arctic are thoughtto be quite sensitive to gaseous and aerosol contamination.
It is not known what fraction of Arctic haze contaminantsleave the Arctic and what fraction is deposited within the Arcticon land and sea surfaces. As the polar night ends, some of thepollution that has accumulated is released to the mid-latitudes(Penkett et al., 1993; Heintzenberg et al., 2003). It is known thathaze contaminants (e.g. acidic sulphate and organics) end upin Arctic ecosystems (Meijer et al., 2003; Wania, 2003) but thetiming and mechanism of the scavenging from the atmosphereis not well understood.
In general, seasonality of the concentrations of anthropogenicspecies in surface snow and atmospheric aerosols correspondsfor regions of the Arctic with available relevant data. Sharp etal. (2002) found that the seasonal cycle of snow compositionon Ellesmere Island, Canada (79◦40′N, 74◦23′W) correspondedto the aerosol composition measured at Alert, Canada with in-creases in concentration during the Arctic haze period. Similarly,concentrations of Arctic haze tracers (SO4
= , Pb, Cd and As)in snow at sixteen sites across northwest Alaska were found tobe highest in late winter snow pack (Douglas and Sturm, 2004).Measurements from the Greenland ice sheet show an increase inthe concentration of anthropogenic species (SO4
=, black carbon,Pb, Cd, Cu, Zn) in the atmosphere and fresh snow during spring(e.g. Davidson et al., 1993; Candelone et al., 1996; Masclet et al.,2000). The peak in snow and atmospheric concentrations occurs
Tellus 59B (2007), 1
ARCTIC HAZE: CURRENT TRENDS AND KNOWLEDGE GAPS 101
later (spring rather than winter) on the Greenland ice sheet dueto its high altitude.
Aerosols are removed from the atmosphere through either dryor wet deposition. On an annual basis, wet deposition is the mainremoval mechanism although dry deposition can become impor-tant in years of exceptionally low precipitation (Davidson et al.,1993) Differences in concentrations patterns between snow andthe atmosphere can occur as precipitation does not always coin-cide with episodic transport events. Contaminants deposited inthe snow end up in the tundra and rivers as the snow melts. Thenetwork of snow measurements across northwest Alaska (Dou-glas and Sturm, 2004) showed spatially homogeneous concentra-tions in sulphate and trace elements suggesting little variabilityin atmospheric concentration or scavenging efficiency within theconfines of the sampled region. By contrast, the acidity of thesnow was much patchier indicating that competing acidifyingand buffering sources determine the local pH. For example, pHwas consistently higher in the Brooks Range than elsewhere dueto mechanical weathering of carbonate rocks.
2. Trends in Arctic haze
2.1. Chemical composition
Arctic haze is marked by a dramatic increase in concentrationsof several key particulate pollutants during winter and earlyspring. The seasonal trend in the haze has been detected at severalmonitoring sites in the Arctic including Alert (82.46◦N) in theCanadian Arctic, Station Nord in Greenland (81.4◦N), Zeppelin(79◦N) on the island of Svalbard, Barrow in Alaska (71.3◦N),Karasjok (69.5◦N) and Svanvik (69.45◦N) in northern Norway,Oulanka (66.3◦N) in northern Finland and Janiskoski (69◦N) inwestern Russia. (Fig. 1). A time-series of particulate sulphate isshown for these eight monitoring sites in Figure 2. Each site has
Fig. 1. Arctic sampling station locations. Spitsbergen is the island onwhich the Zeppelin mountain research station is located.
a similar winter/early spring increase in sulphate with maximumconcentrations reaching up to about 1 μg S m−3. Summertimemonthly average concentrations are less than 0.03 μg S m−3.Nss (nonseasalt) sulphate makes up about 30% of the submicronmass during the haze season (Barrie et al., 1981; Quinn et al.,2000, 2002). Figure 3 shows the time-series of particulate ni-trate at Alert and Barrow, two sites which have a clear seasonalpattern for this chemical species. Maximum concentrations arenear 0.04 μg N m−3. Other species also indicative of continentalsources (nss K+ for biomass burning and Mg+2 and Ca+2 fordust) have maximum concentrations in winter and spring indi-cating long range transport to the Arctic (Fig. 4; Quinn et al.,2002).
Natural aerosol chemical components display seasonal cyclesquite different from anthropogenic components. Submicrome-ter sea salt concentrations are highest at Alert and Barrow fromNovember to February (Quinn et al., 2002). The winter max-imum has been attributed to seasonally high winds in high-latitude source regions of the Pacific and Atlantic Oceans andlong-range transport to the Arctic (Sturges and Barrie, 1988;Sirois and Barrie, 1999). Supermicron sea salt aerosol is at amaximum during the summer months at Barrow when the icepack extent is at a minimum (Quinn et al., 2002). Atmosphericmethanesulfonic acid or MSA− is derived solely from the ox-idation of biogenically produced dimethylsulfide (DMS). Con-centrations of MSA− begin to increase in April, peak in May toSeptember, and decrease sharply in October (Fig. 5). In both theBarrow and Alert data, two peaks are observed during this latespring–summer period. The earlier peak has been attributed tolong-range transport from oceanic source regions in the NorthPacific (Li et al., 1993). The later peak is due to more localproduction as the ice recedes and phytoplankton productivity insurface waters begins (Fig. 5). In addition, DMS that has beentrapped under the ice is released (Ferek et al., 1995).
Two years of measurements at a site in northern Finland re-vealed that POM made up, on average, 22% of the total fineaerosol mass (range of 3–69%) (Ricard et al., 2002). Correlationof POM with nss sulphate was low indicating that POM is of adifferent origin than nss sulphate. Since POM displayed a sea-sonal cycle with maximum concentrations in the summer, it mostlikely is a result of biogenic emissions and/or enhanced oxidationprocesses. There is a small increase in organic acids as early asFebruary/March which may be an indication of photooxidationat polar sunrise as was pointed out for Alert by Kawamura et al.(1996).
The longest record of sulphate concentrations in the Arctic(1980 to present at Alert, Canada) revealed no change in sulphateconcentrations during the 1980s (Sirois and Barrie, 1999). Thislack of a trend was attributed to little change in emissions inthe former Soviet Union between 1985 and 1990. Beginning in1991, sulphate and other measured anthropogenic constituents(Pb, Zn, Cu, excess V and Mn and ammonium) began to declinesuggesting that the reduction of industry in the early years of the
Tellus 59B (2007), 1

102 P. K. QUINN ET AL.
1.5
1.0
0.5
0.0
1/82 1/84 1/86 1/88 1/90 1/92 1/94 1/96 1/98 1/00 1/02 1/04
1.5
1.0
0.5
0.0
2.5
2.0
1.5
1.0
0.5
0.0
1/80 1/82 1/84 1/86 1/88 1/90 1/92 1/94 1/96 1/98 1/00 1/02
1.5
1.0
0.5
0.0
1.5
1.0
0.5
0.0
1.5
1.0
0.5
0.0
1.5
1.0
0.5
0.0g
S m
-3
1.5
1.0
0.5
0.0
Nord (81.4°N)
Zeppelin (79°N)
Karasjok (69.5°N)
Svanvik (69.45°N)
Janiskoski (69°N)
Oulanka (66.3°N)
Alert (82.47°N)
Barrow (71.3°N)
Fig. 2. Time-series of monthly averaged particulate sulphate concentrations in μg S m−3 for eight Arctic monitoring sites. Data made available forAlert by the Canadian National Atmospheric Chemistry (NAtChem) Database and Analysis System, for Barrow by NOAA PMEL(http://saga.pmel.noaa.gov/data/), and for the other stations by EMEP (http://www.emep.int/).
60x10-3
40
20
0NO
3
- (
μg N
m-3
)
1/82 1/84 1/86 1/88 1/90 1/92 1/94 1/96 1/98 1/00 1/02 1/04
40x10-3
30
20
10
0NO
3
- (
μg N
m-3
)
1/98 1/99 1/00 1/01 1/02 1/03 1/04
0.4
0.3
0.2
0.1
0.0 nss S
O4
= (
μg S
m-3
)
1.0
0.8
0.6
0.4
0.2
0.0 nss S
O4
= (
μg S
m-3
)
NO3
-
nss SO4
=
Fig. 3. Time-series of monthly averagedparticulate sulphate and nitrateconcentrations in μg S m−3 and μg N m−3,respectively, for (a) Barrow, Alaska and (b)Alert, Canada. Data made available for Alertby the Canadian National AtmosphericChemistry (NAtChem) Database andAnalysis System and for Barrow by NOAAPMEL (http://saga.pmel.noaa.gov/data/).
new Eurasian republics led to lower levels of pollutants reachingthe Arctic.
A combined modeling and measurement analysis of sulphateconcentrations at Station Nord in northern Greenland indicateda decreasing trend throughout the 1990s (Heidam et al., 2004).The analysis was able to account for scatter in measured concen-trations due to changing meteorology. With the meteorologicalvariability removed, they were able to attribute the decrease inconcentration to a reduction in emissions. The model that wasused estimates that more than 70% of the sulphur measured atStation Nord is emitted from the area making up the former So-viet Union so that the trend analysis indicates that emissionsfrom that region decreased significantly during the 1990s. This
result is supported by the 50% decrease in Russian sulphur emis-sions reported to EMEP during the 1990s (Vestreng, 2003). It isnot clear from this analysis how reductions from Western Eu-rope and North America influenced the sulphate concentrationsat Station Nord.
As pointed out by MacDonald et al. (2005), the detection ofrecent trends in the Arctic is difficult due to the combinationof short or incomplete data records at some sites and interfer-ence from natural variations on seasonal, annual and decadaltimescales. To remove seasonal variability from the trend analy-ses, we focus here on average monthly concentrations for Marchand April which are two of the months during with Arctic hazeis most pronounced (Bodhaine and Dutton, 1993). The existence
Tellus 59B (2007), 1

ARCTIC HAZE: CURRENT TRENDS AND KNOWLEDGE GAPS 103
80x10-3
60
40
20
0
g m
-3 (
Ba
rro
w)
1/98 1/99 1/00 1/01 1/02 1/03 1/04
0.15
0.10
0.05
0.0060
40
20
0
x10
-3
0.4
0.3
0.2
0.1
0.0
g m
-3 (
Ale
rt) Alert
Barrownss K
+
nss Mg+2
nss Ca+2
Fig. 4. Time-series of monthly averaged nssK+, nss Mg+2, and nss Ca+2 in μg m−3 forBarrow, Alaska (left axes) and Alert, Canada(right axis). Alert nss K+ are available from1980 to 2003.Data made available for Alertby the Canadian National AtmosphericChemistry (NAtChem) Database andAnalysis System and for Barrow by NOAAPMEL (http://saga.pmel.noaa.gov/data/).
1.2
1.0
0.8
0.6
0.4
0.2
0.0
nss S
O4
=,
g m
-3
1/98 1/99 1/00 1/01 1/02 1/03 1/04
60x10-3
50
40
30
20
10
0
MS
A,
g m
-3 Barrow nss SO4
=
Alert MSA Barrow MSA
Fig. 5. Time-series of monthly averagedMSA in μg m−3 for Barrow, Alaska andAlert, Canada. Barrow nss SO4
= is shownfor the seasonal contrast. Alert MSA data areavailable from 1980 to 2003. Data madeavailable for Alert by the Canadian NationalAtmospheric Chemistry (NAtChem)Database and Analysis System and forBarrow by NOAA PMEL(http://saga.pmel.noaa.gov/data/).
of a monotonic increasing or decreasing trend in the time-serieswas tested with the nonparametric Mann-Kendall test at signifi-cance levels P < 0.001, P < 0.01 and P < 0.1 as a two-tailed test(Gilbert, 1987). The estimate for the slope of a linear trend wascalculated with the nonparametric Sen’s method (Sen, 1968).The Mann-Kendall test is suitable for cases where the trend maybe assumed to be monotonic such that no seasonal or other cycleis present in the data. In the Mann-Kendall test, missing datavalues are allowed and the data need not conform to any par-ticular distribution. The Sen’s slope is the median of the slopescalculated from all pairs of values in the data series. The Sen’smethod is not greatly affected by data outliers and it can beused when data are missing (Salmi et al., 2002). Here, trends areonly reported for a significance level of <0.1, that is, when theprobability of no trend is 10% or less.
Average monthly concentrations of sulphate for March andApril are shown in Figure 6 along with the Sen’s slope estimates,the slope is given only for cases where the Mann-Kendall testyields a trend at a significance level of <0.1. The significanceof the trend, slope estimate, and percent change over the mea-surement period are given in Table 1. For sites with a significanttrend (based on the Mann-Kendall test), sulphate concentrationsdecreased by 30–60% between 1990 and present. The decreasing
trend in sulphate at Alert detected through the 1990s has contin-ued into the present century. In addition, sulphate has decreasedsignificantly at Zeppelin, Karasjok and Oulanka.
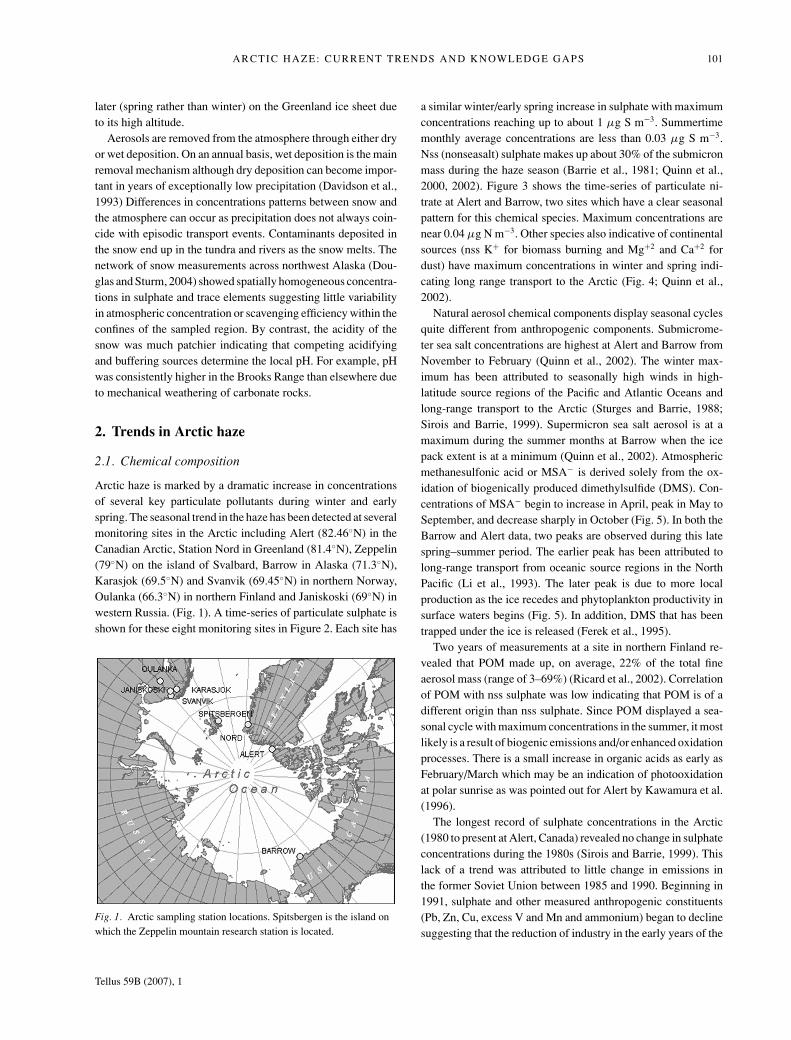
Identical data are shown for nitrate in Figure 7 and Table 2. Incontrast to sulphate, nitrate increased during April at Alert forthe long-term period of 1981 to 2003 and during March for theshorter term more recent period of 1990 to 2003. Between 1990and 2003, nitrate concentrations increased by about 50%.
2.2. Optical properties
The seasonality and trends of Arctic haze are clearly seen intime-series data of light absorption and scattering by aerosolsmeasured at the surface (Fig. 8; Bodhaine, 1989; Delene andOgren, 2002) and in total column aerosol optical depth (Duttonet al., 1984; Herber et al., 2002). Bodhaine and Dutton (1993)reported that both aerosol scattering and optical depth measure-ments at Barrow showed a maximum in 1982 followed by afactor of two decrease between 1982 and 1992. The decreasewas only apparent during March and April corresponding to thetime of year when Arctic haze is most pronounced. The cause ofthe decrease is uncertain and most likely is due to a combinationof factors. Bodhaine and Dutton (1993) hypothesized that the
Tellus 59B (2007), 1

104 P. K. QUINN ET AL.
0.8
0.6
0.4
0.2
0.0
g S
m-3
2005200019951990198519801975
0.6
0.4
0.2
0.0
3.0
2.0
1.0
0.0
2005200019951990198519801975
1.2
0.8
0.4
0.01.5
1.0
0.5
0.01.2
0.8
0.4
0.0
1.5
1.0
0.5
0.0
0.4
0.3
0.2
0.1
0.0
a) Alert
b) Nord
c) Zeppelin
d) Barrow
e) Karasjok
f) Svanvik
g) Janiskoski
h) Oulanka
April SO4
=
March SO4
=
LT April Trend ST April Trend LT March Trend ST March Trend
Fig. 6. Monthly averaged concentrations in μg S m−3 of sulphate for March and April. Red lines indicate the Sen’s slope estimate for the long-term(LT) trend (approximately 1980 through the available data). Blues lines indicate the Sen’s slope estimate for the short-term (ST) trend(approximately 1990 through the available data). Trend lines are not shown if the significance for the trend according to the Mann-Kendall test is α
> 0.1. Data made available for Alert by the Canadian National Atmospheric Chemistry (NAtChem) Database and Analysis System, for Barrow byNOAA PMEL (http://saga.pmel.noaa.gov/data/), and for the other stations by EMEP (http://www.emep.int/).
decrease in the haze was most likely due to a combination of areduction in the output of pollution aerosol by Europe and theformer Soviet Union and stricter pollution controls in WesternEurope. The decreases in aerosol scattering and optical depthat Barrow during this 10 yr period are not equal to the knownreductions of sulphate emissions, however, indicating that otherfactors such as changes in transport could have played a role(Jaffe et al., 1995). The NAO has been in a mostly positive phasesince the 1970s. Since a positive phase implies enhanced trans-port of pollutants to the Arctic (Hurrell and van Loon, 1997), theNAO does not appear to have invoked the changes in transportresponsible for the decreasing trend.
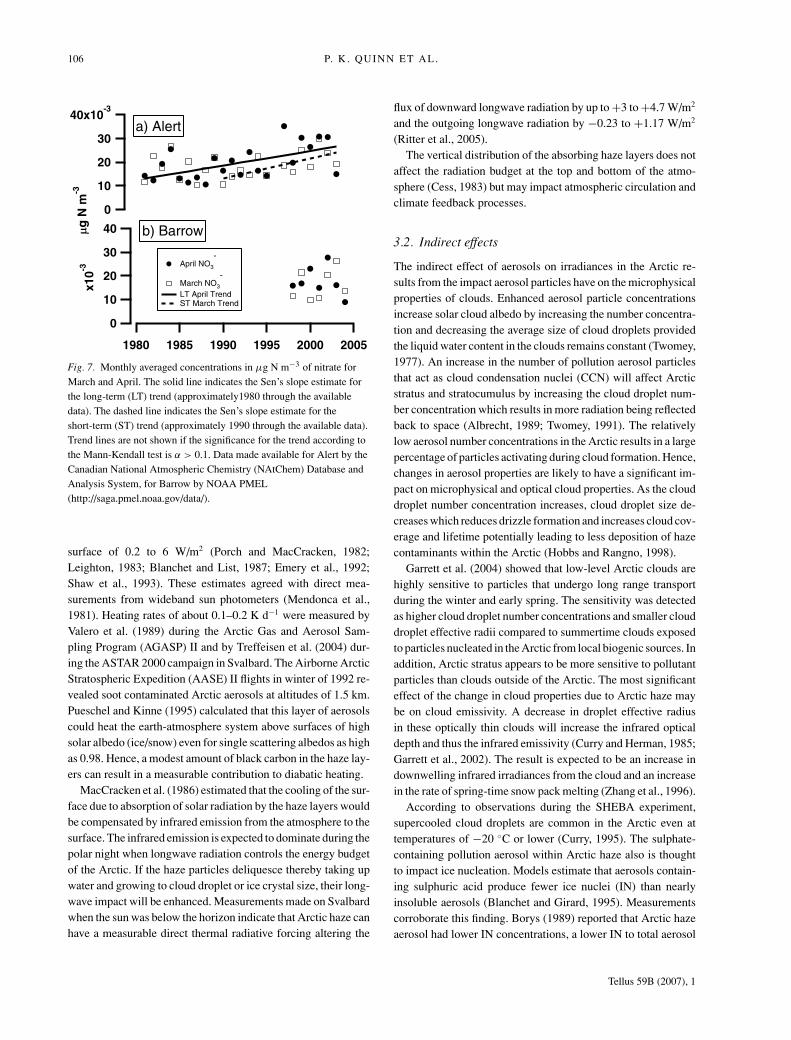
An update of the monthly averaged light scattering data anal-ysis originally performed by Bodhaine and Dutton (1993) isshown in Figures 9 and 10 with data extending through 2006.Significance of the detected trends is given in Table 3 along withslope estimates and percent change in scattering for periods withlinear trends. For March, there is a significant decreasing (but notlinear) trend in scattering over the entire measurement period of1977 to 2006. Breaking the period into two smaller intervals re-veals a decreasing linear trend from 1982 to 1996, which reversesto yield an increasing linear from 1997 to 2006. The increasingtrend for March is significant at the 0.05 level indicating thatthere is a probability of 95% that the trend exists.
A similar analysis for light absorption at Barrow indicates anoverall significant decrease between 1988 and 2006 for March.Trends between 1997 and 2006 are unclear (Figs. 9 and 10; Table3). Sharma et al. (2006) report an increasing trend in absorptionfor the winter months (defined as January to April) at Barrowbetween 2000 and 2003.
Black carbon concentrations derived from measured light ab-sorption (often called equivalent black carbon) at Alert show adecreasing trend for both March and April over the measure-ment period of 1990 to 2001 (Figs. 9 and 10; Table 3). Sharmaet al. (2004) reported a decrease in (equivalent) black carbon(the main light absorber in the Arctic atmosphere) of 56% forthe winter/spring season from 1989 to 2002 at Alert. However,Sharma et al. (2006) report an increase during winter (Januaryto April) beginning in 2000.
A recent study using a general circulation model suggestedthat one of the major sources of Arctic soot today is southernAsia (Koch and Hansen, 2004) due to increasing emissions fromindustrial and biofuel combustion. This conclusion has been re-futed by Stohl (2006); however, based on the long passage frompollution sources in south and east Asia to the Arctic relative tomore rapid transport from Europe and northern Asia. Using aparticle dispersion model, it was found that, for a transport timeof 5 d, the south Asia black carbon contribution is about 1–2%
Tellus 59B (2007), 1

ARCTIC HAZE: CURRENT TRENDS AND KNOWLEDGE GAPS 105
Table 1. Change in monthly average sulphate concentrations for March and April. Significance of the trend,Sen’s slope estimate and percent change per period are listed
Station Species Period αa Slopeb Change per period%
Alert nss SO4= March 1981–2002 0.01 −0.066 − 66
April 1981–2003 0.001 −0.079 − 71March 1990–2002 0.001 −0.088 −59April 1990–2003 0.01 −0.086 − 63
Nord SO4= March 1990–2002
April 1990–2002Zeppelin SO4
= March 1990–2003 0.1 −0.094 − 33April 1990–2003 0.1 −0.079 − 27
Barrow nss SO4= March 1998–2004
April 1998–2004Karasjok SO4
= March 1978–2003 0.001 −0.044 − 80April 1978–2003 0.001 −0.021 − 59March 1990–2003 0.1 −0.017 − 40April 1990–2003 0.01 −0.025 − 48
Svanvik SO4= March 1993–2000
April 1993–2000Janiskoski SO4
= March 1991–2002April 1991–2002
Oulanka SO4= March 1990–2002 0.1 −0.034 − 45
April 1990–2002 0.01 −0.043 − 56
aSignificance level, α, of the Mann-Kendall test. A significance level of 0.001 indicates a 0.1% probability of notrend. No value indicates a significance level > 0.1.bSen’s nonparametric method was used to estimate the slope of the existing trend as change per year (μg S m−3
yr−1).
of the European source contribution near the surface and 3–5%for the total column.
Results reported in Stohl (2006) identify boreal and temperateforest fires, especially Siberian fires, as a significant source ofblack carbon during the summer. It is suggested that in intense fireyears, boreal forest fires may be the dominant source of black car-bon for the Arctic. As measurements at Alert and Barrow show,there is a strong seasonal cycle in nss K+ with minimum valuesin the summer and maximum values in the winter (Fig. 4). Basedon these data, the impact of summertime forest fire emissions onlow-altitude surface sites within the Arctic is relatively smallcompared to winter emissions. There is evidence, however, ofpyrocumulonimbus injection of smoke from boreal forest fires tothe upper atmosphere (Fromm et al., 2005). In addition, biomassburning signatures have been observed in the snow at the high-altitude (3200 m) site of Summit, Greenland (Dibb et al., 1996).The fraction of this material that is deposited to lower elevationsthroughout the Arctic is unknown. More measurements coupledwith modeling studies are required to identify sources of blackcarbon to the Arctic and to assess trends in black carbon andlight absorption by aerosols.
An extension of the Barrow aerosol optical depth datathrough 2002 shows a continued decrease through the mid-1990s (Fig. 11). Monthly averaged values of AOD anomalies(relative to a base of nonvolcanic years) for March show a con-
tinued decline through 2002. However, the AOD anomalies forApril indicate an increase between 1998 and 2001 where thecurrently available data record ends. In contrast to the Barrowtrend through the 1990s, Herber et al. (2002) report a slightlyincreasing trend in AOD (1% per year) at Koldewey station inNy-Alesund, Spitzbergen between 1991 and 1999.
3. Effects of aerosol on the climate systemin the Arctic
3.1 Direct effect
The direct effect of aerosols on the radiation balance in the Arcticis due to the absorption and scattering of radiation by the aerosol.The Arctic is thought to be particularly sensitive to changesin radiative fluxes imposed by aerosols because of the smallamount of solar energy normally absorbed in the polar regions(Valero et al., 1989). Arctic haze is present as a layer of lightabsorbing material over a highly reflective ice/snow surface.Shaw and Stamnes (1980) first realized that the absorbing na-ture of Arctic haze would have a significant impact on the en-ergy balance of the Arctic. Several early calculations using 1-Dradiative transfer models estimated that the diurnally averagedatmospheric warming due to the layer ranged between 2 and20 W/m2 with a corresponding depletion of the solar flux at the
Tellus 59B (2007), 1
106 P. K. QUINN ET AL.
40x10-3
30
20
10
0
g N
m-3
200520001995199019851980
40
30
20
10
0
x1
0-3
a) Alert
b) Barrow
April NO3
-
March NO3
-
LT April Trend ST March Trend
Fig. 7. Monthly averaged concentrations in μg N m−3 of nitrate forMarch and April. The solid line indicates the Sen’s slope estimate forthe long-term (LT) trend (approximately1980 through the availabledata). The dashed line indicates the Sen’s slope estimate for theshort-term (ST) trend (approximately 1990 through the available data).Trend lines are not shown if the significance for the trend according tothe Mann-Kendall test is α > 0.1. Data made available for Alert by theCanadian National Atmospheric Chemistry (NAtChem) Database andAnalysis System, for Barrow by NOAA PMEL(http://saga.pmel.noaa.gov/data/).
surface of 0.2 to 6 W/m2 (Porch and MacCracken, 1982;Leighton, 1983; Blanchet and List, 1987; Emery et al., 1992;Shaw et al., 1993). These estimates agreed with direct mea-surements from wideband sun photometers (Mendonca et al.,1981). Heating rates of about 0.1–0.2 K d−1 were measured byValero et al. (1989) during the Arctic Gas and Aerosol Sam-pling Program (AGASP) II and by Treffeisen et al. (2004) dur-ing the ASTAR 2000 campaign in Svalbard. The Airborne ArcticStratospheric Expedition (AASE) II flights in winter of 1992 re-vealed soot contaminated Arctic aerosols at altitudes of 1.5 km.Pueschel and Kinne (1995) calculated that this layer of aerosolscould heat the earth-atmosphere system above surfaces of highsolar albedo (ice/snow) even for single scattering albedos as highas 0.98. Hence, a modest amount of black carbon in the haze lay-ers can result in a measurable contribution to diabatic heating.
MacCracken et al. (1986) estimated that the cooling of the sur-face due to absorption of solar radiation by the haze layers wouldbe compensated by infrared emission from the atmosphere to thesurface. The infrared emission is expected to dominate during thepolar night when longwave radiation controls the energy budgetof the Arctic. If the haze particles deliquesce thereby taking upwater and growing to cloud droplet or ice crystal size, their long-wave impact will be enhanced. Measurements made on Svalbardwhen the sun was below the horizon indicate that Arctic haze canhave a measurable direct thermal radiative forcing altering the
flux of downward longwave radiation by up to +3 to +4.7 W/m2
and the outgoing longwave radiation by −0.23 to +1.17 W/m2
(Ritter et al., 2005).The vertical distribution of the absorbing haze layers does not
affect the radiation budget at the top and bottom of the atmo-sphere (Cess, 1983) but may impact atmospheric circulation andclimate feedback processes.
3.2. Indirect effects
The indirect effect of aerosols on irradiances in the Arctic re-sults from the impact aerosol particles have on the microphysicalproperties of clouds. Enhanced aerosol particle concentrationsincrease solar cloud albedo by increasing the number concentra-tion and decreasing the average size of cloud droplets providedthe liquid water content in the clouds remains constant (Twomey,1977). An increase in the number of pollution aerosol particlesthat act as cloud condensation nuclei (CCN) will affect Arcticstratus and stratocumulus by increasing the cloud droplet num-ber concentration which results in more radiation being reflectedback to space (Albrecht, 1989; Twomey, 1991). The relativelylow aerosol number concentrations in the Arctic results in a largepercentage of particles activating during cloud formation. Hence,changes in aerosol properties are likely to have a significant im-pact on microphysical and optical cloud properties. As the clouddroplet number concentration increases, cloud droplet size de-creases which reduces drizzle formation and increases cloud cov-erage and lifetime potentially leading to less deposition of hazecontaminants within the Arctic (Hobbs and Rangno, 1998).
Garrett et al. (2004) showed that low-level Arctic clouds arehighly sensitive to particles that undergo long range transportduring the winter and early spring. The sensitivity was detectedas higher cloud droplet number concentrations and smaller clouddroplet effective radii compared to summertime clouds exposedto particles nucleated in the Arctic from local biogenic sources. Inaddition, Arctic stratus appears to be more sensitive to pollutantparticles than clouds outside of the Arctic. The most significanteffect of the change in cloud properties due to Arctic haze maybe on cloud emissivity. A decrease in droplet effective radiusin these optically thin clouds will increase the infrared opticaldepth and thus the infrared emissivity (Curry and Herman, 1985;Garrett et al., 2002). The result is expected to be an increase indownwelling infrared irradiances from the cloud and an increasein the rate of spring-time snow pack melting (Zhang et al., 1996).
According to observations during the SHEBA experiment,supercooled cloud droplets are common in the Arctic even attemperatures of −20 ◦C or lower (Curry, 1995). The sulphate-containing pollution aerosol within Arctic haze also is thoughtto impact ice nucleation. Models estimate that aerosols contain-ing sulphuric acid produce fewer ice nuclei (IN) than nearlyinsoluble aerosols (Blanchet and Girard, 1995). Measurementscorroborate this finding. Borys (1989) reported that Arctic hazeaerosol had lower IN concentrations, a lower IN to total aerosol
Tellus 59B (2007), 1

ARCTIC HAZE: CURRENT TRENDS AND KNOWLEDGE GAPS 107
Table 2. Change in monthly average nitrate concentrations for March and April.Significance of the trend, Sen’s slope estimate and percent change per period are listed.
Station Species Period αa Slopeb Change per period%
Alert NO3− March 1981–2003
April 1981–2003 0.1 0.0006 67March 1990–2003 0.05 0.0008 50April 1990–2003
Barrow NO3− March 1998–2004
April 1998–2004
aSignificance level, α, of the Mann-Kendall test. A significance level of 0.001 indicates a0.1% probability of no trend. No value indicates a significance level > 0.1.bSen’s nonparametric method was used to estimate the slope of the existing trend aschange per year (μg N m−3 yr−1).
2.5
2.0
1.5
1.0
0.5
0.0Ab
so
rptio
n,
Mm
-1
1/77 1/79 1/81 1/83 1/85 1/87 1/89 1/91 1/93 1/95 1/97 1/99 1/01 1/03 1/05
30
25
20
15
10
5
0Scattering, M
m-1
250
200
150
100
50
BC
, n
g m
-3
a) Barrow
b) Barrow
c) Alert
Fig. 8. Monthly averaged (a) light scattering and (b) absorption at 550 nm by sub-10 micron aerosol at Barrow, Alaska (Mm−1) and (c) black carbonmass concentration (ng m−3) at Alert, Canada. Data made available for Barrow by NOAA GMD and for Alert by the Canadian NationalAtmospheric Chemistry (NAtChem) Database and Analysis System.
fraction, and slower ice nucleation rates than aerosol from theremote unpolluted troposphere. The reduction in IN leads toa decrease in the ice crystal number concentration and an in-crease in the mean size of ice crystals (Girard et al., 2005). Asa result, the sedimentation and precipitation rates of ice crystalsincrease leading to an increase in the lower troposphere dehydra-tion rate and a decrease in the downwelling infrared irradiancesfrom the cloud. Using a 1-D simulation and observations fromAlert, Girard et al. (2005) found that a cloud radiative forcing of−9 W/m2 may occur locally as a result of the enhanced dehydra-tion rate produced by sulphate aerosol. The mechanism by whichIN concentrations are decreased in the presence of sulphuric acidaerosol has yet to be explained and warrants further research. Ifthis mechanism applies to much of the Arctic, it could explainthe cooling tendency in the eastern high Arctic during winter.
Because of the combination of the static stability of the Arcticatmosphere, the persistence of low-level clouds, and the rela-
tively long lifetime of aerosols during the haze season, the impactof aerosols on cloud microphysical and optical properties may belarger in the Arctic than elsewhere on earth (Curry, 1995; Garrettet al., 2004). The winter/spring occurrence of Arctic haze eventsenables the study of anthropogenic influences against a veryclean atmospheric background. In other regions of the globe, areliable distinction between natural and anthropogenic effects ismore difficult. In this sense, the Arctic is a natural laboratory tostudy the anthropogenic portion of the aerosol–cloud-radiationinteractions.
3.3. Surface albedo
Surface albedo affects the magnitude and sign of climate forcingby aerosols. Absorbing soot deposited to the surface via wet anddry deposition impacts the surface radiation budget by enhanc-ing absorption of solar radiation at the ground and reducing the
Tellus 59B (2007), 1
108 P. K. QUINN ET AL.
20
10
0
Scatt
eri
ng
, M
m-1
2005200019951990198519801975
2.0
1.5
1.0
0.5
0.0
Ab
so
rpti
on
, M
m-1
300
200
100
0
BC
, n
g m
-3
30
2.5
March averages
1982 - 1996 trend (α = 0.01)
1997 - 2006 trend (α = 0.05)
1988 - 2006 Trend (α = 0.1)
1990 - 2001 Trend (α = 0.001)
1997 - 2001 Trend (α = 0.1)
a) Barrow scattering
b) Barrow absorption
c) Alert black carbon
Fig. 9. Monthly averaged concentrations forMarch of (a) light scattering and (b) lightabsorption (Mm−1) at 550 nm for sub-10micron aerosol at Barrow and (c) blackcarbon (ng m−3) for Alert. Lines indicate theSen’s slope estimate for the periodsindicated. The α value indicates thesignificance level of the trend. α = 0.001indicates there is a 0.1% probability that thetrend does not exist. Trend lines are notshown for α > 0.1. Data made available forBarrow by NOAA GMD and for Alert by theCanadian National Atmospheric Chemistry(NAtChem) Database and Analysis System.
30
25
20
15
10
5
0
Sca
tte
rin
g,
Mm
-1
2005200019951990198519801975
1.0
0.8
0.6
0.4
0.2
0.0
Absorp
tion, M
m-1
300
200
100
0
BC
, ng m
-3
a) Barrow scattering
b) Barrow absorption
c) Alert black carbon
April averages
1982 - 1996 trend (α = 0.01)
1990 - 2001 Trend (α = 0.05)
Fig. 10. Monthly averaged concentrationsfor April of a) light scattering and b) lightabsorption (Mm−1) at 550 nm for sub-10micron aerosol at Barrow, and c) blackcarbon (ng m−3) for Alert. Lines indicate theSen’s slope estimate for the periodsindicated. The α value indicates thesignificance level of the trend. α = 0.001indicates there is a 0.1% probability that thetrend does not exist. Trend lines are notshown for α > 0.1. Data made available forBarrow by NOAA GMD and for Alert by theCanadian National Atmospheric Chemistry(NAtChem) Database and Analysis System.
surface albedo (Warren and Wiscombe, 1980). Clarke and Noone(1985) found a 1–3% reduction in snow albedo due to depositedBC with another factor of 3 reduction as the snow ages andBC becomes more concentrated. Hansen and Nazarenko (2004)
have estimated that soot contamination of snow in the Arcticand the corresponding decrease in surface albedo yields a posi-tive hemispheric radiative forcing of +0.3 W m−2. The resultingwarming may lead to the melting of ice and may be contributing
Tellus 59B (2007), 1

ARCTIC HAZE: CURRENT TRENDS AND KNOWLEDGE GAPS 109
Table 3. Change in monthly average light scattering and absorption at Barrow and blackcarbon (BC) at Alert for March and April. Significance of the trend, Sen’s slope estimate,and percent change per period are listed.
Station Species Period αa Slopeb Change per period%
Barrow σ spc March 1977–2006 0.01
April 1977–2006March 1982–1996 0.01 −5.7 E-07 − 42April 1982–1996 0.01 −6.6 E-7 − 56March 1997–2006 0.05 7.8 E-07 46April 1997–2006
Barrow σ apc March 1988–2006 0.1 −3.9 E-08 −61
April 1988–2006March 1988–1996April 1988–1996March 1997–2006April 1997–2006
Alert BC March 1990–2001 0.001 −17 − 88April 1990–2001 0.05 −8.3 −63March 1997–2001 0.1 −3.9 −20April 1997–2001
aSignificance level, α, of the Mann-Kendall test. A significance level of 0.001 indicates a0.1% probability of no trend. No value indicates a significance level >0.1.bSen’s nonparametric method was used to estimate the slope of the existing trend aschange per year (Mm−1 yr−1 for scattering and absorption, ng m−3 yr−1 for black carbon).cSub-10 micrometer aerosol.
0.20
0.15
0.10
0.05
0.00
-0.05
-0.10
AO
D A
no
ma
ly
1/78 1/80 1/82 1/84 1/86 1/88 1/90 1/92 1/94 1/96 1/98 1/00 1/02
0.20
0.15
0.10
0.05
0.00
-0.05
-0.10
AO
D A
no
ma
ly
March
April
Fig. 11. Monthly averaged AOD anomaliesat Barrow, Alaska for March and April. Theanomalies are relative to a base ofnonvolcanic years. Data from 1992 and 1993were removed due to stratospheric aerosolinflux from the Pinatubo eruption in 1991.Vertical lines represent the 1-σ standarddeviation of the monthly mean. Data madeavailable by NOAA GMD.
to earlier snowmelts on tundra in Siberia, Alaska, Canada andScandanavia (Foster et al., 1992; Stone et al., 2002).
Clearly, the radiative impacts of pollutant aerosols in the Arc-tic are complex. Complex feedbacks between aerosols, clouds,radiation, sea ice and vertical and horizontal transport processescomplicate the impact, as do potentially competing effects ofdirect and indirect forcing. As a result, the magnitude and signof the forcing for the Arctic are not yet well understood.
3.4. Calculated direct radiative forcing of Arctic haze
The direct radiative forcing of Arctic haze was calculated for arepresentative case during the haze maximum (mid-April) and
for the latitude of Barrow. A two-stream radiative transfer modelwas used over the wavelength range of 300–1100 nm in 100 nmwide intervals. Multiple reflections between the surface and thehaze layer were taken into account using calculations similar tothose of Coakley and Chylek (1975) and Twomey (1977). Themodel requires knowledge of the albedo of the underlying surface(A), the aerosol optical depth (τ ), single scattering albedo (ω) andthe fraction of upward scattered radiation (β). Values employedfor each of these parameters in the calculations and the basisfor their use are listed in Table 4. In mid-April, in the Alaskansector of the Arctic, cloudiness is at its annual minimum and theregion of Barrow is frequently under the influence of anticyclonicflow. Hence, cloudiness is assumed to be zero in the calculations.
Tellus 59B (2007), 1

110 P. K. QUINN ET AL.
Table 4. Calculated radiative forcing of Arctic haze at the top of theatmosphere and at the surface in W m−2.
Aa tb ωc βd μe Hf ag �F TOAh �F surfacei
0.92 0.12 0.94 0.26 0.46 1 1.5 2.5 −0.93
aSurface albedo based on measurements over a snow-covered surfacein April. The measured range of A was 0.85 to 0.95 for wavelengthsbetween 400 and 650 nm.bAerosol optical depth at 500 nm based on a weighted mean fromseveral measurement sources (Valero and Ackerman, 1986; Stone,2002). A power law form for the wavelength dependence of τ wasassumed. An Angstrom exponent of 1.5 was used in all calculationsrepresenting submicrometer particles based on measurements atBarrow (Delene and Ogren, 2002).cSingle scattering albedo at 550 nm based on measurements at Barrowreported by Delene and Ogren (2002). No wavelength dependenceincorporated into the calculations because of uncertainties in thewavelength variation, size, and composition of the aerosol.dFraction of scattered radiation that is scattered into the upwardhemisphere. Based on nephelometer measurements of the hemisphericbackscattered fraction, b, and the use of the Henyey-Greenstein phasefunction to calculate β from b (Wiscombe and Grams, 1976; Sheridanand Ogren, 1999). A b of 0.105 was used based on measurements atBarrow (Delene and Ogren, 2002).eCosine of the noon solar zenith angle for April 15 at the latitude ofBarrow.fVertical thickness of the haze layer in kilometres.gAngstrom exponent or power law coefficient of aerosol optical depth.hRadiative forcing at the top of atmosphere in W m−2
iRadiative forcing at the surface in W m−2.
Direct radiative forcing in the thermal infrared by Arctic hazeis not considered here although recent measurements indicate itmay be nonnegligible (Ritter et al., 2005).
Table 4 shows the results for conditions typical of the latitudeof Barrow during spring haze maxima. The slightly absorbinghaze results in a net heating of the earth-atmosphere systemestimated to be 2.5 W m−2 averaged over a day. The absorbingand scattering haze above the highly reflecting snow surfaceresults in a slightly negative net radiation balance or coolingat the surface of −0.93 W m−2. The difference, 3.4 W m−2, isabsorbed in the haze layer itself. Calculations for a lower surfacealbedo of 0.2, which would be representative of the tundra aftersnow melt in late spring, results in a cooling due to the sameamount of haze of −4 W m−2. However, normally by the timeof snow melt in mid-May, Arctic haze has disappeared.
The heating of the atmosphere by the haze may be calculatedfrom
dT/dt = g × �F/Cp × �P (1)
where dT/dt is the heating in K s−1 (but expressed here in K d−1),g is the acceleration of gravity, Cp is the specific heat of air(1006 J K−1 kg−1) and P is pressure. Assuming the haze to be in
a region 1 km thick (�P = 100 hPa), the heating rate is calcu-lated to be 0.25K d−1. The heating is due to multiple reflections,each absorbing some radiation, brought about by the underlyinghighly reflective surface.
The calculated radiative forcing values shown in Table 4 arelower but of the same sign as previous calculations. Shaw andStamnes (1980) estimated a heating at TOA of 19 W m−2 andcooling at the surface of −5.3 W m−2. The factor of six disagree-ment with the current calculations is due to a much lower value ofsingle scattering albedo (0.6) used in the earlier calculations. Thevalue of 0.6 was based on measurements of light reflected fromfilters exposed to aerosols and, although, there are systematicerrors known to be associated with this type of determination,it may also be that the haze was sootier two decades ago. Lessefficient flue gas cleanup employed in eastern Europe and theformer Soviet Union may have led to a stronger and “blacker”Arctic haze such that the radiative forcings were several timesthose calculated using more recent values of the haze opticalproperties.
Net radiative forcing is very sensitive to even relatively smallperturbations in the amount of soot present in the transportedhaze. At the top of the atmosphere, a +3.1% change in radiativeforcing results from a 1% increase in single scattering albedo.Hence, a slightly sootier haze could cause substantial heating ofthe Arctic regions in spring. Doubling the aerosol optical depthof the haze would increase the radiative forcing at the top of theatmosphere by a factor of 1.8 while increasing the cooling at thesurface by a factor of 1.7.
The calculations described here indicate that the presence ofArctic haze over a representative location in the Arctic during thetime of maximum haze results in an estimated 2–3 W m−2 of ad-ditional heating to the atmosphere and a smaller, approximately−1 W m−2 of cooling at the surface. This amount of heating issignificant when compared to the estimated forcing due to theincrease in carbon dioxide since the industrial revolution (4.5 Wm−2). It may be even more significant when recognizing thatmodels indicate that there is a factor of 2 to 4 polar amplificationof temperature change introduced at high latitudes by radiativeforcing.
4. Summary
Based on measurements of sulphate aerosol, a main constituentof Arctic haze, and light scattering and extinction, the amountof the haze reaching the Arctic was either relatively constantor decreasing between the 1980s and early 1990s (Sirois andBarrie, 1999; Bodhaine and Dutton, 1993; Heidam et al., 2004).The updated trends in light scattering presented here show acontinued decrease through the late 1990s with an increase inthe first years of the 21st century at Barrow, Alaska. There alsois evidence, although not as strong, of an increasing trend inblack carbon during this same period at Alert, Canada. Sul-phate appears to have continued decreasing into the 21st century
Tellus 59B (2007), 1

ARCTIC HAZE: CURRENT TRENDS AND KNOWLEDGE GAPS 111
based on measurements at Alert in the Canadian Arctic, Zep-pelin on the island of Svalbard, Karasjok in northern Norway andOulanka in northern Finland. On the other hand, nitrate appearsto be increasing at Alert with an unclear trend at Barrow. Con-tinued measurements coupled with chemical transport modelsare required to better define emerging trends and to assess theircauses.
Arctic haze is generally understood to consist of antropogeni-cally generated material, and has often been attributed to sourcesin central Eurasia (Shaw, 1983). There are examples, however,of Asian dust entering the Alaskan sector of the Arctic from aslong ago as the mid-1970s (e.g. Rahn et al., 1981). Recent mod-eling studies yield conflicting results on whether southern Asiais a significant source of pollutants to the Arctic or not. Giventhe rapid industrialization of China, the increasing amounts ofpollution being transported over long distances, and indicationsof increasing concentrations of absorbing aerosol in the Arcticmore research is warranted to document the contribution of thissource to Arctic haze and to determine its climate impact on theArctic. A warming climate has been forecast to result in large in-creases in the areal extent of fires within Russian and CanadianBoreal forests (Stocks et al., 1998). Hence, boreal forest firesare another source to be monitored to determine their impact onblack carbon concentrations in atmospheric aerosol as well asblack carbon that is deposited to snow and ice surfaces.
Other key atmospheric species have a distinct seasonality inthe Arctic. There is evidence of the enrichment of halogens inArctic air masses in late winter and spring. Since these com-pounds tend to peak later in the year, it is thought that they are pro-duced photochemically. Of special note is iodine, which shows abimodal seasonal behaviour, peaking in both spring and autumn(Sturges and Shaw, 1983). The similarity between the seasonalbehaviour of iodine and MSA, a biogenic aerosol component,(Fig. 5) suggests that iodine also has a biogenic source. Moreresearch is required, however, to partition the sources of thesespecies (e.g. anthropogenic, especially coal combustion versusmarine), to investigate their numerous and complex chemicalpathways, and to assess their environmental impacts.
The direct radiative effect of Arctic haze has been estimatedwith 1-D radiative transfer models which find a warming in theatmosphere due to absorption of solar radiation and a concurrentcooling at the surface. These estimates are highly sensitive to theassumed properties of the aerosol in the haze. Despite the manyresearch activities devoted to the characterization of Arctic hazesince the 1970s, measurements of Arctic aerosols are not exten-sive or well distributed in space or time which limits the accuracyof the estimates of both the direct and indirect radiative forcing.Treffeisen et al. (2004) have designed an approach based on clus-ter analysis for integrating aircraft, ground based, and long-termdata sets for use in 3-D climate models. The accurate evaluationof climate forcing by Arctic haze requires such data sets coupledwith 3-D climate models that consider both direct and indirecteffects. In particular, 3-D models are required to assess the com-
plex feedbacks between aerosols, clouds, radiation, sea ice, anddynamic transport and to quantify climate forcing due to Arctichaze (Girard et al., 2005).
5. Acknowledgments
This work was supported by the Atmospheric Constituents Pro-gram of the NOAA Office of Global Programs and the NOAAArctic Research Office. We thank all members of the AMAPworking group on Acidifying Pollutants, Arctic Haze and Acid-ification in the Arctic for helpful discussions. This is PMELcontribution number 2945.
References
Albrecht, B. A. 1989. Aerosols, cloud microphysics, and fractionalcloudiness. Science 245, 1227–1230.
Barrie, L. A. 1996. Occurrence and trends of pollution in the Arctictroposphere. In: Chemical Exchange Between the Atmosphere andPolar Snow (eds E. Wolff and R. C. Bales). NATO ASI Series 1: GlobalEnvironmental Change 43, Springer-Verslag, Heidelberg, pp. 93–130
Barrie, L. A., Hoff, R. M. and Daggupaty, S. M. 1981. The influenceof mid-latitudinal pollution sources on haze in the Canadian Arctic.Atmos. Environ. 15, 1407–1419.
Blanchet, J.-P. and List, R. 1987. Estimation of optical properties ofArctic haze using a numerical model. Atmos.-Ocean 21, 444–464.
Blanchet, J.-P. and Girard, E. 1995. Water-vapor temperature feedbackin the formation of continental Arctic air: implications for climate.Sci. Tot. Environ. 160/161, 793–802.
Bodhaine, B. A. 1989. Barrow surface aerosol: 1976–1986. Atmos. En-viron. 23, 2357–2369.
Bodhaine, B. A. and Dutton, E. G. 1993. A long-term decrease in Arctichaze at Barrow, Alaska. Geophys. Res. Lett. 20(10), 947–950.
Borys, R. D. 1989. Studies of ice nucleation by Arctic aerosol onAGASP-II, J. Atmos. Chem. 9, 169–185.
Bowling, S. A. and Shaw, G. E. 1992. The thermodynamics of pollu-tion removal as an indicator of possible source areas for Arctic Haze.Atmos. Env. 26, 2953–2961.
Brock, C. A., Radke, L. F., Lyons, J. H. and Hobbs, P. V. 1989. Arctichazes in summer over Greenland and the North American Arctic, I,Incidence and origins. J. Atmos. Chem. 9, 129–148.
Candelone, J.-P., Jaffrezo, J.-L., Hong, S., Davidson, C. I. and Boutron, C.F. 1996. Seasonal variations in heavy metal concentrations in presentday Greenland snow. Sci. Tot. Environ. 193, 101–110.
Cess, C. R. 1983. Arctic aerosol: model estimates of the interactive influ-ences upon the surface-troposphere radiation budget. Atmos. Environ.17, 2555–2564.
Clarke, A. D. 1989. In-stiu measurements of the aerosol size distribu-tions, physicochemistry, and light absorption properties of Arctic haze.J. Atmos. Chem. 9, 255–267.
Clarke, A. D. and Noone, K. J. 1985. Soot in the Arctic snowpack: acause for perturbation in radiative transfer. Atmos. Environ. 19, 2045–1053.
Coakley, J. A., Jr. and Chylek, P. 1975. The two-stream approximationin radiative transfer: including the angle of the incident radiation. J.Atmos. Sci. 32, 409–418.
Tellus 59B (2007), 1
112 P. K. QUINN ET AL.
Curry, J. A. 1995. Interactions among aerosols, clouds, and climate ofthe Arctic Ocean. Sci. Tot. Environ. 160/161, 777–791.
Curry, J. A. and Herman, G. F. 1985. Infrared radiative properties ofArctic stratus clouds. J. Clim. Appl. Met. 24, 525–538.
Davidson, C. I. and co-authors. 1993. Chemical constituents in the air andsnow at Dye 3, Greenland—1. Seasonal variations. Atmos. Environ.27A, 2709–2722.
Delene, D. J. and Ogren, J. A. 2002. Variability of aerosol optical prop-erties at four North American surface monitoring sites. J. Atmos. Sci.59, 1135–1150.
Dibb, J. E., Talbot, R. W., Whitlow, S. I., Shipham, M. C., Winterle, J.and co-authors. 1996. Biomass burning signatures in the atmosphereand snow at Summit, Greenland: an event on 5 August 1994. Atmos.Environ. 30, 553–561.
Douglas, T. A. and Sturm, M. 2004. Arctic haze, mercury, and the chemi-cal composition of snow across northwestern Alaska. Atmos. Environ.38, 805–820.
Dutton, E. G., DeLuisi, J. J. and Bodhaine, B. A. 1984. Features of aerosoloptical depth observed at Barrow, March 10-20, 1983. Geophys. Res.Lett. 11, 385–388.
Eckhardt, S., Stohl, A., Beirle, S., Spichtinger, N., James, P. andco-authors. 2003. The north Atlantic Oscillation controls air pollu-tion transport to the Arctic. Atmos. Chem. Phys. 3, 1769–1778.
Emery, C. A., Haberle, R. and Ackermann, T. P. 1992. A one-dimensionalmodeling study of carbonaceous haze effects on the springtime Arcticenvironment. J. Geophys. Res. 97, 20 599–20 613.
Ferek, R. J., Hobbs, P. V., Radke, L. F., Herring, J. A., Sturges, W. T.and co-authors. 1995. Dimethyl sulfide in the Arctic atmosphere. J.Geophys. Res. 100, 26 093–26 104.
Foster, J. S., Winchester, J. W. and Dutton, E. G. 1992. IEEE Trans.Geosci. Remote Sens. 30, 793–798.
Fromm, M., Bevilacqua, R., Servrancks, R., Rosen, J., Thayer, J. P.and co-authors. 2005. Pyro-cumulonimbus injection of smoke to thestratosphere: observations and impact of a super blowup in north-western Canada on 3-4 August 1998. J. Geophys. Res. 110, D08205,doi:10.1029/2004/JD005350.
Garrett, T. J., Radke, L. F. and Hobbs, P. V. 2002. Aerosol effects on thecloud emissivity and surface longwave heating in the Arctic. J. Atmos.Sci. 59, 769–778.
Garrett, T. J., Zhao, C., Dong, X., Mace, G. G. and Hobbs, P. V. 2004. Ef-fects of varying aerosol regimes on low-level Arctic stratus. Geophys.Res. Lett. 31, doi:10.1029/2004GL019928.
Gilbert, R. O. 1987. Statistical methods for environmental pollution mon-itoring. Van Nostrand Reinhold, New York.
Girard, E., Blanchet, J.-P. and Dubois, Y. 2005. Effects of Arcticsulphuric acid aerosols on wintertime low-level atmospheric ice crys-tals, humidity and temperature at Alert, Nunavut. Atm. Res. 73, 131–148.
Greenaway, K. R. 1950. Experiences with Arctic flying weather, RoyalMeteorological Society Canadian Branch (Nov. 30, 1950), Toronto,Ontario.
Hansen, A. D. A. and Rosen, H. 1984. Vertical distribution of particulatecarbon, sulphur and bromine in the Arctic haze and comparison withground-level measurements at Barrow, Alaska. Geophys. Res. Lett.11, 381–384.
Hansen, J. and Nazarenko, L. 2004. Soot climate forcing via snow andice albedos. Proc. Natl. Acad. Sci. 101(2), 423–428.
Heidam, N. Z., Christensen, J., Wahlin, P. and Skov, H. 2004. Arcticatmospheric contaminants in NE Greenland: levels, variations, origins,transport, transformations, and trends 1990–2001. Sci. Tot. Environ.331(1-3), 5–28.
Heintzenberg, J. 1980. Particle size distribution and optical properties ofArctic haze. Tellus 32B, 251–260.
Heintzenberg, J. and Larssen, S. 1983. SO2 and SO4 in the Arctic. Inter-pretation of observations at three Norwegian Arctic-Subarctic stations.Tellus 35B, 255–265.
Heintzenberg, J., Tuch, T., Wehner, B., Wiedensohler, A., Wex, H. andco-authors. 2003. Arctic Haze over Central Europe. Tellus 55B, 796–807.
Herber, A. and co-authors. 2002. Continuous day and night aerosol op-tical depth observations in the Arctic between 1991 and 1999. J. Geo-phys. Res. 107(D10), 10.1029/2001JD000536.
Hillamo, R. E., Kerminen, V.-M., Maenhaut, W., Jaffrezo, J.-L., Bal-achandran, S. and co-authors. 1993. Size distributions of atmospherictrace elements at Dye 3, Greenland—1. Distribution characteristicsand dry deposition velocities. Atmos. Environ. 27A(17-18), 2787–2803.
Hobbs, P. V. and Rangno, A. L. 1998. Microstructures of low and middle-level clouds over the Beaufort Sea. Q.J.R. Met. Soc. 124, 2035–2071.
Hoff, R. M. 1988. Vertical structure of Arctic haze observed by Lidar. J.Appl. Met. 27, 125–139.
Hoff, R. M., Leaitch, W. R., Fellin, P. and Barrie, L. A. 1983. Mass-sizedistributions of chemical constituents of the winter Arctic aerosol. J.Geophys. Res. 88, 10 947–10 956.
Hopper, J. E., Worthy, D. E. J., Barrie, L. A. and Trivett, N. B. A. 1994.Atmospheric observations of aerosol black carbon, carbon dioxide andmethane in the high Arctic. Atmos. Environ. 28, 3047–3054.
Hurrell, J. W. and Van Loon, H. 1997. Decadal variations in climateassociated with the North Atlantic Oscillation. Clim. Change 36, 301–326.
Iversen, T. and Joranger, E. 1985. Arctic air pollution and large scaleatmospheric flows. Atmos. Environ. 19, 2099–2108.
Jaffe, D., Iversen, T. and Shaw, G. 1995. Comment on “A long termdecrease in Arctic haze at Barrow, Alaska” by B.A. Bodhaine andE.G. Dutton. Geophys. Res. Lett. 22(6), 739–740.
Kahl, J. D. and Hansen, A. D. A. 1989. Determination of regional sourcesof aerosol black carbon in the Arctic. Geophys. Res. Lett. 16(4), 327–330.
Kahl, J. D. 1990. Characteristics of the low-level temperature inversionalong the Alaskan Arctic coast. Int. J. Climatol. 10, 537–548.
Kawamura, K., Kasukabe, H. and Barrie, L. A. 1996. Source and re-action pathways of dicarboxylic acids, ketoacids, and dicarbonyls inArctic aerosols: one year of observations. Atmos. Environ. 30, 1709–1722.
Klonecki, A., Hess, P., Emmons, L., Smith, L., Orlando, J. and co-authors. 2003. Seasonal changes in the transport of pollutants intothe Arctic troposphere—model study. J. Geophys. Res. 108, 8367.doi:10.1029/2002JD002199.
Koch, D. and Hansen, J. 2004. Distant origins of Arctic black carbon: aGoddard Institute for Space Studies Model Experiment. J. Geophys.Res. 100, D04204, doi:10.1029/2004JD005296.
Leaitch, W. R., Hoff, R. M., Melnichuk, S. and Hogan, A. 1984. Somephysical and chemical properties of the Arctic winter aerosol in north-eastern Canada. J. Clim. Appl. Met. 23, 916–928.
Tellus 59B (2007), 1

ARCTIC HAZE: CURRENT TRENDS AND KNOWLEDGE GAPS 113
Leaitch, W. R., Hoff, R. M. and MacPherson, J. L. 1989. Airborne andLidar measurements of aerosol and cloud particles in the troposphereover Alert Canada in April 1986. J. Atmos. Chem. 9(1-3), 187–212.
Leighton, H. 1983. Influence of the Arctic haze on the solar radiationbudget. Atmos. Environ. 17, 2065–2068.
Li, S. M. and Barrie, L. A. 1993. Biogenic sulphur aerosols in the Arctictroposphere. 1. Contributions to sulphate. J. Geophys. Res. 98D, 20613–20 622.
Li, S. M., Barrie, L. A. and Sirois, A. 1993. Biogenic sulfate aerosol inthe Arctic troposphere, 2, Trends and seasonal variations. J. Geophys.Res. 98, 20 623–20 631.
Macdonald, R. W., Harner, T. and Fyfe, J. 2005. Recent climate change inthe Arctic and its impact on contaminant pathways and interpretationof temporal trend data. Sci. Tot. Environ. 342, 5–86.
MacCraken, M. C., Cess, R. D. and Potter, G. L. 1986. Climatic effectsof anthropogenic Arctic aerosols: an illustration of climatic feedbackmechanisms with one-and two-dimensional climate models. J. Geo-phys. Res. 91, 14 445–14 450.
Masclet, P., Hoyau, V., Jaffrezo, J. L. and Cachier, H. 2000. Polycyclicaromatic hydrocarbon deposition on the ice sheet of Greenland. Part1: superficial snow. Atmos. Environ. 34, 3195–3207.
Meijer, S. N., Ockenden, W. A., Sweetman, A., Breivik, K., Grimalt,J. O. and co-authors. 2003. Global distribution and budget of PCBsand HCB in background surface soils: implications for sources andenvironmental processes. Environ. Sci. Technol. 37, 667–672.
Mendonca, B. G., DeLuisi, J. J. and Schroeder, J. A. 1981. Arctic hazeand perturbation in the solar radiation fluxes at Barrow, Alaska, Pro-ceedings from the 4th Conference on Atmospheric Radiation. Atm.Met. Sco., Toronto, Ontario, Canada, pp. 95–96.
Mitchell, M. 1956. Visual range in the polar regions with particularreference to the Alaskan Arctic. J. Atmos. Terrestrial Phys., SpecialSuppl.: 195–211.
Noone, K. J. and Clarke, A. D. 1988. Soot scavenging measurements inArctic snowfall. Atmos. Environ. 22(12), 2773–2779.
Ottar, B., Gotaas, Y., Hov, O., Iversen, T., Joranger, E., and co-authors.1986. Air pollutants in the Arctic. Final report of a research programmeconducted on the behalf of British Petroleum, Ltd. The NorwegianInstitute of Air Research, Kjeller, Norway, NILU OR 30/86. 80p.
Pacyna, J. M. and Ottar, B. 1988. Vertical distribution of aerosols in theNorwegian Arctic. Atmos. Environ. 22(10), 2213–2223.
Pacyna, J. M., Vitolis, V. and Hanssen, J. E. 1984. Size differentiatedcomposition of the Arctic aerosol at Ny Alesund Zeppelin. Atmos.Environ. 18, 2447–2459.
Penkett, S. A., Blake, N. J., Lightman, P., Marsh, A. R. W., Anwyl, P. andco-authors. 1993. The seasonal variation of nonmethane hydrocarbonsin the free troposphere over the North Atlantic Ocean: possible evi-dence for extensive reaction of hydrocarbons with the nitrate radical.J. Geophys. Res. 98, 2865–2885.
Polissar, A. V., Hopke, P. K., Paatero, P., Malm, W. C., Sisler, J. F.1998. Atmospheric aerosol over Alaska 2. Elemental composition andsources. J. Geophys. Res. 103, 19 045–19 057.
Polissar, A. V., Hopke, P. K., Harris, J. M. 2001. Source regions foratmospheric aerosol measured at Barrow, Alaska. Environ. Sci. Tech.35, 4214–4226.
Porch, W. M. and MacCracken, M. C. 1982. Parametric study of theeffects of Arctic soot on the solar radiation. Atmos. Environ. 16, 1365–1371.
Pueschel, R. F. and Kinne, S. A. 1995. Physical and radiative propertiesof Arctic atmospheric aerosols. Sci. Tot. Environ. 161, 811–824.
Quinn, P. K., Bates, T. S., Miller, T. L., Coffman, D. J., Johnson, J.E. and co-authors. 2000. Surface submicron aerosol chemical com-position: what fraction is not sulfate? J. Geophys. Res. 105, 6785–6806.
Quinn, P. K., Miller, T. L., Bates, T. S., Ogren, J. A., Andrews, E. and co-authors. 2002. A three-year record of simultaneously measured aerosolchemical and optical properties at Barrow, Alaska. J. Geophys. Res.107(D11), 10.1029/2001JD001248.
Radke, F. S., Lyons, J. H., Hegg, D. A., Hobbs, P. V. and Bailey, I. H.1984. Airborne observations of Arctic aerosols, I, Characteristics ofArctic haze. Geophys. Res. Lett. 11, 393–396.
Rahn, K. A. 1989. Proceedings of the International Symposium on ArcticAir Chemistry. Atmos. Environ. 23(11), 2345–2347.
Rahn, K. A. and MacCaffrey, R. J. 1979. Long range transport of pol-lution aerosol to the Arctic. A problem without borders. Proc. WMOSymp. On the long range transport of pollutants and its relationsto general circulation including stratospheric/tropospheric exchangeprocesses, pp. 25–25, Sofia, 1–5 Oct 1980. WMO No. 538.
Rahn, K. A., Borys, R. and Shaw, G. E. 1977. The Asian source of Arctichaze bands. Nature 268, 713–715.
Rahn, K. A., Borys, R. D. and Shaw, G. E. 1981. Asian desert dust overAlaska: anatomy of an Arctic haze Episode, Desert Dust. In: Origin,Characteristic and Effect on Man, (edT. Pewe), Special paper No. 186,The Geol. Soc. Am.,Boulder, Colorado, pp. 37–70.
Ricard, V., Jaffrezo, J.-L., Kerminen, V.-M., Hillamo, R. E., Sillan-paa, M. and co-authors. 2002. Two years of continuous aerosolmeasurements in northern Finland. J. Geophys. Res. 107(D11),10.1029/2001JD000952.
Ritter, C., Notholt, J., Fischer, J. and Rathke, C. 2005. Direct thermalradiative forcing of tropospheric aerosol in the Arctic measured byground based infrared spectrometry. Geophys. Res. Lett. 32, L23816,doi:10.1029/2005GL024331.
Salmi, T., Maatta, A., Anttila, P., Ruoho-Airola, T. and Amnell, T. 2002.Detecting trends of annual values of atmospheric pollutants by theMann-Kendall test and Sen’s slope estimates—the Excel templateapplication MAKESENS, Publications on Air Quality, no. 31, FMI-AQ-31, FMI, Helsinki, Finland.
Scheuer, E., Talbot, R. W., Dibb, J. E., Seid, G. K., DeBell, L. andco-authors. 2003. Seasonal distributions of fine aerosol sulfate inthe North American Arctic basin during TOPSE. J. Geophys. Res.108(D4), 8370, doi:10.1029/2001JD001364.
Sen P.K. 1968. Estimates of the regression coefficient based on Kendall’stau. J. Am. Stat. Assoc. 63, 1379–1389.
Sharma, S., Lavoue, D., Cachier, H., Barrie, L. A., Gong, S. L. 2004.Long-term trends of the black carbon concentrations in the CanadianArctic. J. Geophys. Res. 109, doi:10.1029/2003JD004331.
Sharma, S., Andrews, E., Barrie, L. A., Ogren, J. A. and Lavoue, D.2006. Variations and sources of the equivalent black carbon in the HighArctic revealed by long term observations at Alert and Barrow: 1989–2003. J. Geophys. Res. 11, D14208, doi:10.1029/2005JD006581.
Sharp, M., Skidmore, M. and Nienow, P. 2002. Seasonal and spatialvariations in the chemistry of a High Arctic supraglacial snow cover.J. Glaciology 48, 149–158.
Shaw, G. E. 1975. The vertical distribution of atmospheric aerosols atBarrow, Alaska. Tellus 27, 39–50.
Tellus 59B (2007), 1

114 P. K. QUINN ET AL.
Shaw, G. E. 1981a. Eddy diffusion transport of Arctic pollution from themid-latitudes: a preliminary model. Atmos. Environ. 15, 1483–1490.
Shaw, G. E. 1983. Evidence for a central Eurasian source area of Arctichaze in Alaska. Nature 299, 815–818.
Shaw, G. E. 1984. Microparticle size spectrum of Arctic haze. Geophys.Res. Lett. 11, 409–412.
Shaw, G. E. 1987. Aerosols as climate regulators: a climate biospherelinkage? Atmos. Env. 21, 985–1086.
Shaw 1995. The Arctic haze phenomenon. Bull. Am. Met. Soc. 76, 2403–2413.
Shaw, G. E. and Wendler, G. 1972. Atmospheric turbidity measurementsat McCall Glacier in northeast Alaska, Conference Proc. On Atmo-spheric Radiation, pp. 181–187, Fort Collins, Colorado. Am. Met.Soc., Boston.
Shaw, G. E. and Stamnes, K. 1980. Arctic haze: perturbation of the Polarradiation budget. Am. N.Y. Acad. Sci 338, 533–539.
Shaw, G. E., Stamnes, K. and Hu, Y. X. 1993. Arctic haze: perturbationto the radiation field, Meteorol. Atmos. Phys. 51, 227–235.
Shaw, G. E. 1981b. Aerosol chemical components in Alaska air masses1. Aged pollution and II sea salt and marine product. J. Geophy. Res.96, 22 357–22 372.
Sirois, A. and Barrie, L. A. 1999. Arctic lower tropospheric aerosol trendsand composition at Alert, Canada: 1980–1995. J. Geophys. Res. 104,11 599–11 618.
Stocks, B. J. et al 1998. Climate change and forest fire potential in Russianand Canadian boreal forests. Clim. Change 38, 1–13.
Stohl, A. 2006. Characteristics of atmospheric transport intothe Arctic troposphere. J. Geophysical Res. 111, D11306,doi:10.1029/2005JD006888.
Stone, R. S. 2002. Monitoring aerosol optical depth at Barrow, Alaskaand South Pole; Historical overview, recent results, and future goals,Proceedings of the 9th Workshop Italian Research on AntarcticAtmosphere, Rome, Italy, 22–24, October, 2001, edited byM. Co-lacino, pp. 123–144, Ital. Phys. Soc., Bologna, Italy.
Stone, R. S., Dutton, E. G., Harris, J. M. and Longenecker, D. 2002.Earlier spring snowmelt in northern Alaska as an indicator of climatechange. J. Geophys. Res. 107, d104089, doi:10.1029/2000JD000286.
Sturges, W. T. and Barrie, L. A. 1988. Chlorine, bromine, and iodine inArctic aerosols. Atmos. Environ. 22, 1179–1194.
Sturges, W. T. and Shaw, G. E. 1983. Halogens in aerosols in centralAlaska. Atmos. Environ. 27, 2969–2977.
Treffeisen, R. and co-authors 2004. Interpretation of Arctic aerosol prop-erties using cluster analysis applied to observations in the Svalbardarea. Tellus 56B, 457–476.
Trivett, N. B. A., Barrie, L. A., Blanchet, J. P., Bottenheim, R. M.,Hoff, R. M. and co-authors. 1989. An experimental investigation ofArctic haze at Alert, N.W.T., March 1985. Atmos. Ocean. 26, 341–376.
Twomey, S. 1977. The influence of pollution on the shortwave albedo ofclouds. J. Atmos. Sci. 34, 1149–1152.
Twomey, S. 1991. Aerosols, clouds and radiation. Atmos. Environ. 25A,2435.
Valero, F. P. J. and Ackerman, T. P. 1986. Arctic haze and radiationbalance. In: Arctic Air Pollution (edB. Stonehouse), Cambridge Press,pp. 121–133.
Valero, F. P. J., Ackerman, T. P. and Gore, W. J. R. 1989. The effects of theArctic haze as determined from airborne radiometric measurementsduring AGASP II, J. Atmos. Chem. 9, 225–244.
Vestreng, V. 2003. Review and revision of emission data reported to CLR-TAP. EMEP/MSC-W Note1. Norwegian Meteorological Institute.
Waggoner, A. P. and Weiss, R. E. 1980. Comparison of the fine particlemass concentration and light scattering extinction in ambient aerosol.Atmos. Environ. 14, 623–626.
Wania, F. 2003. Assessing the potential of persistent organic chemicalsfor long-range transport and accumulation in polar regions. Environ.Sci. Technol. 37, 1344–1351.
Warren, S. G. and Wiscombe, W. J. 1980. A model for the spectral albedoof snow. II. Snow containing atmospheric aerosols. Aer. Sci. Tech. 4,31–43.
Wiscombe, W. J. and Grams, G. W. 1976. The backscattered fraction intwo-stream approximations. J. Atmos Sci. 33, 2440–2451.
Zhang, T., Stamnes, K. and Bowling, S. A. 1996. Impact of clouds onsurface radiative fluxes and snowmelt in the Arctic and subarctic. J.Clim. 9, 2110–2123.
Tellus 59B (2007), 1