Embed Size (px)
Citation preview

- - - 4
NASA Technical Mernoranduth 86784
Arctic Haze and the Radiation Balance Francisco P.J. Valero and Thomas P. Ackerman
(N&SA-TN-67t L4) PECTIC H12E AZIJ THE N87-2C146 bADIATICN BALANCE (NASA) 30 F CSCL 03A
Unclas G3/88 43549
December 1985
NASA National Aeronautics and Space Administration
https://ntrs.nasa.gov/search.jsp?R=19870010713 2018-06-23T09:46:19+00:00Z

NASA Technical Memorandum 86784
Arctic Haze and the Radiation Balance Francisco P. J. Valero, Thomas P. Ackerman, Ames Research Center, Moffett Field, California
December 1985
NASA National Aeronautics and Space Administration
Ames Research Center Moffett Field, California 94035
ABSTRACT
Airborne measurements of the absorption of solar radiation by the Arctic haze
indicateatmospheric heating rates of from 0.15 to 0.25 Kday (24 hr weighted
averages) at latitudes between 72.6N and 74.ON during the early spring (March 15- April 14, 1983).
The haze interaction with solar radiation alters the radiative balance of the
atmosphere-surface system. Generally, this interaction results in an increase of
the solar energy absorbed by the atmosphere and in a decrease of the radiation
absorbed by the ground (ice or water). The effective planetary albedo is also
affected, increasing for haze over water and decreasing for haze over ice.
The haze interaction with infrared (planetary) radiation has not been mea-
sured. However, the infrared component of the energy budget represents one of the
most important contributions to the overall energy balance. Calculations can pro-
vide some information, but experimental evidence is required (at least to validate
the calculations) because of the enhanced concentration of greenhouse gases measured
in the haze layers.
The cumulative deposition of black carbon over the surface, produces a change
in the optical properties of the ice which may result in an accelerating rate of ice
melt. Experimental evidence of the magnitude of this effect is necessary to prop-
erly evaluate its consequences. An extended monitoring program is suggested. The
significance of energy budget changes induced by the Arctic aerosol on climate
depends on the spatial and temporal properties of the haze layers. Therefore, an
important concern with climatic studies done using available measurements is with
truly sampling the spatial and temporal properties of the haze layers. Do a few
episodic airborne experiments (sort of a snapshot approach) yield information repre-
sentative enough to be useful for building a sufficient understanding for climate
studies?
INTRODUCTION
One would expect that the polar regions are a clean, pristine, environment.
This is true in Antarctica, but the atmosphere in the northern polar regions, which
is clean and clear during the summer, becomes heavily polluted with anthropogenic
particles (aerosols) and gases during the winter. In 1957, Mitchell reported his
findings on the "Visual Range in the Polar Regions with Particular Reference to the
Alaskan Arctic." Mitchell (1957) notes that the Arctic aerosol was composed of non-
ice particles of sizes less than 2 um. He also observed that a significant

degradation in visibility occurs during the periods of heavy pollution (haze
events). About fifteen years later, Shaw (1975) confirmed quantitatively that the atmosphere became very turbid during haze events. Shaw's measurements were done
near Barrow, Alaska and at that time the origin of the haze was uncertain. Recent
studies of the Arctic aerosol (Rahn and McCaffrey, 1980; Shaw and Stamnes, 1980; Rahn et al., 1977; Barrie et al., 1981; Heintzenberg et al., 1982) and the series of papers published in the Arctic Haze special issue of Geophysical Research Letters (May 198 14) have reported the presence of large concentrations of aerosols in the Arctic atmosphere and discuss its possible impact on Earth's radiative balance and
climate. The temporal behavior of the haze is characterized by a remarkable
increase in density every winter, from about November through April, with a maximum
in the period between late winter and early spring. This temporal behavior is
governed by air-flow patterns, and by the lack of precipitation, which encourages
the accumulation of aerosols in the atmosphere during the win€er months. Figure 1 shows a photograph taken during an Arctic haze event in March 1983.
It has been shown (Rahn and McCaffrey, 1980) that the air pollution which permeates the Arctic during the winter originates in industrialized regions in the Soviet Union, Europe, and the United Kingdom, with minor contributions f'?om North America. It has also been found that haze events are accompanied by an increase in
the concentration of trace gases that originate in combustion processes, such as
those associated with power and industrial plants (Khalil and Rasmussen, 1984).N
From the climatic point of view, the interaction of solar and infrared radia-
tion with the polluted atmosphere-surface system must be considered. The Arctic
aerosols interact with solar radiation mostly during the late winter, early spring
period when the aerosol concentration is at or near its maximum and the Sun eleva-
tion is sufficient for a significant amount of solar radiation to reach the
Arctic. The interaction of solar radiation with the haze results in radiation being
scattered and absorbed in the atmosphere. Shaw (1982) and Bodhaine et al. (19814) have determined high optical depths and Valero et al. (1983, 1984) have measured "in situ" the absorption of radiation by the haze. Rosen et al. (1981) reported that graphitic carbon (soot) is an important component of the Arctic aerosol. Most
of the absorption of solar energy by the aerosol is attributable to the soot (Rosen and Novakov, 1981; Rosen and Hansen, 19814). The absorption of solar radiation by the haze is incremented by the fact that a large portion of the radiation reaching
the ice surface (which acts like a mirror reflecting about 80% of the solar energy that touches it; water reflects only about 5%-15%) is reflected back into the atmosphere. Consequently, the reflected radiation passes through the haze layers
for a second time resulting in additional absorption. As more energy is retained by
the soot, an enhanced warming of the atmosphere takes place.
The combined effect of increased light scattering and absorption in the atmo-
sphere results in a diminished amount of solar energy reaching the ground. The
change in the energy absorption profile in the atmosphere (which is a function of
the haze vertical structure) further modifies the energetics of the atmosphere-
surface system. It is clear that this redistribution of the radiation budget
between the atmosphere and the surface may have consequences in climate and in the
dynamics of the Arctic atmosphere.
The processes described above may be further compounded by the potentially
important effect of the deposition of black carbon over the ice-snow surface. This
could result in larger absorption by the surface, particularly after the haze season
is over and could extend into the summer months, when the sunlight reaches the
ground with maximum intensity. This would lead to a higher, self-accelerating rate
of ice melt. As the top layers of ice melt, the soot deposited in previous seasons
appears on the surface with a net result of an ever increasing number of soot par-
ticles being exposed to the solar radiation. If this cumulative process continues
year after year, the result may be an accelerating rate of ice melt which has the
potential to move the ice cap boundaries northward, thus reducing the extent of the
insulating ice cover and opening up the ocean as an additional heating source. Not
much work has been done on the surface effects of the Arctic Haze, but the potential
for significant changes is there.
Finally, no infrared radiation measurements or calculations have been made.
The infrared contribution to the radiation balance is generally considered to be
minor. However, the increased concentration of pollution-related gases (HNO3,
hydrocarbons, etc.) with strong spectral bands in the 10-15 Mm region (greenhouse,
gases)--in the neighborhood of the blackbody emission peak at Arctic atmosphere
temperatures--may result in an additional mechanism influencing the Arctic energy
budget. Furthermore, atmospheric infrared radiative effects of the haze take place
through the winter months, and the surface effects persist all year long. The time
scale of the infrared processes is such that their overall influence may not be
trivial when compared to solar radiation.
In this paper, we focus on the absorption of solar radiation by the Arctic haze
and on its vertical structure as determined from net flux measurements. We deduce
the perturbations introduced by the haze.in the solar energy distribution in the
atmosphere-ground system, and determine the haze-induced changes in the atmospheric
heating rates as a function of altitude. New radiation measurements are also sug-
gested to confirm and improve our present understanding of the Arctic energetics.
We emphasize the need for a program to monitor possible changes (caused by the
cumulative deposition of the black aerosols) in the ability of the ice cap to
reflect light.
EXPERIMENTAL CONCEPTS AND MEASUREMENTS
As discussed above, an important aspect of the Arctic haze is its effect on the
Earth's energy budget. This effect can be studied by collecting samples of the haze
and then measuring its optical properties in the laboratory. A different approach
is to measure the absorption by the polluted atmosphere "in situ." From the com-
parison of the energy absorbed by the atmosphere during haze events and the energy
absorbed by the haze-free atmosphere, one can determine the effect of the Arctic

haze on the solar energy budget. To determine "in situ" the magnitude of the
absorption of solar radiation by the aerosol, we proceeded to measure radiative flux
densities at different altitudes in the atmosphere and from these measurements, we
determined the energy absorbed in the atmospheric layer included between flight
levels. This can be done by measuring the upwelling (u) and down-welling (d) radia-
tive flux densities at various altitudes (h) within the atmosphere (see figure 2).
The difference between d(h) and u(h) gives the net flux density at altitude h; the
difference between the net fluxes at two altitudes (A in fig. 2) is the radiative
flux density absorbed by the atmospheric layer included between measuring altitudes.
Atmospheric gases, including water vapor, absorb light only at particular
wavelengths (spectral features); on the other hand, the haze acts as a grey body and
absorbs energy at practically all wavelengths. If one would measure the radiative
flux densities in the atmosphere for a broad spectral bandpass (including all wave-
lengths), the result would be the radiative flux density absorbed by all components
of the atmosphere including gases and aerosols. During AGAS? I, we were interested
in measuring the absorption of solar energy by the haze itself when immersed in the
atmospheric environment, independently from the contributions by atmospheric gases
to the total absorption. This can be done by selecting wavelength intervals where
it is known that atmospheric gases do not absorb. In this way, any absorption
measured in these narrow wavelength intervals can be attributed exclusively to
absorption by the haze. With proper data analysis and modeling, the absorption of
radiation by the aerosol at all wavelengths can be determined from the measurements
in narrow spectral intervals. Once one knows how much flux density is absorbed in
the atmosphere, it is a simple matter to determine the resulting heating profiles in
the atmosphere.
A way to verify the results from the above-described approach is to simulta-
neously measure the broadband of total absorbed radiation. It can be shown that if
we substract the portion attributable to gases from the total energy absorbed by the
atmosphere, what is left is the absorption by the haze. The spectral parameters
that describe the absorption by gases and water vapor are known from laboratory
spectroscopy. With this information, the portion of the flux density absorbed by
the haze can be calculated. A comparison of the two results (broadband and narrow
spectral bandpasses approaches) offers a way to check the consistency of the
results.
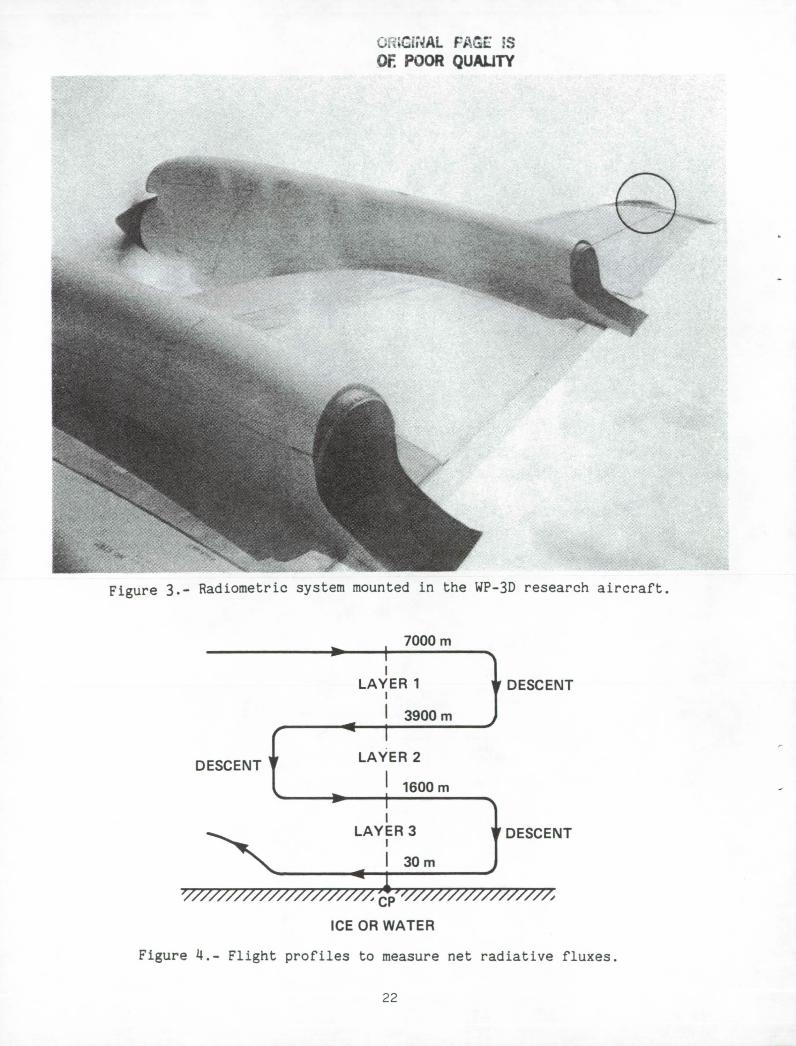
To perform the radiation measurements described in the previous paragraph, we
designed and built a special radiometric system that was installed in the MOAA WP-3D
Orion research aircraft and used during AGASP I (see fig. 3). The radiometric
system consists of three narrow, one intermediate, and one broad spectral bandpass
channels. All channels have a hemispherical field of view. These hemispherically
integrating radiometers were mounted in a rotor installed in the right wing tip of
the aircraft. The rotating arrangement exposed each radiometer alternately to
upwelling and downwelling radiative fluxes. Differencing the upward- and downward-
looking measurements, done using the same radiometer, minimizes the systematic
errors in the system and provides a direct measurement of the net flux density
crossing a plane parallel to the flightpath of the aircraft. As explained above,
4

the difference between net fluxes at different altitudes gives the absorption by the
atmospheric column included between net flux measurement altitudes.
The wavelengths selected for the three narrow (0.01 pm) spectral bandpass
channels were centered at 0.485, 0.680, and 0.860 pm; the one intermediate (0.08 pm)
bandpass channel was centered at 0.940 pm (to monitor the concentration of water
vapor), and the broad spectral bandpass channel covered the region from 0.26 to
2.6 pm. This radiometric system is sufficient to apply the methods described above.
The radiative net fluxes at different altitudes were measured by flying pro-
files similar to the one illustrated in figure 4. The measurements were done around
noon in order to minimize the effects of changes in Sun elevation with time. (At
polar latitudes, the Sun elevation changes very slowly and the corresponding correc-
tions did not exceed 2% in any case.)
RESULTS
a) Narrow Spectral Bandpass Radiometers
Figure 5(a), (b), and (c) depicts the narrow band flux density absorption as
measured during AGASP flights 3, 4, and 8, respectively.
Column 1 of table 1 shows the altitudes h at which measurements of the radia-
tive flux were made; column 2 shows the thicknesses Ah of the atmospheric layers
between the altitudes of column 1; the quantities in column 3 are the mean alti-
tudes h of the layers. Column 4 shows the identification numbers assigned to each
layer. The ordinate in figure 5 refers to the radiative flux density absorbed in
watts/m2 for a 0.01 pm spectral bandpass; it applies to atmospheric layers of
thickness Ah and mean altitude h, as identified in table 1. Table 2 shows the
measured values that correspond to the radiative flux density absorbed by each
atmospheric layer during each of the AGASP flights discussed in this paper,.
Here, we report only measurements obtained under cloud-free conditions. AGASP
flights 3 and 4 were over the western Arctic and were made on March 15 and 17, 1983,
respectively. The flux measurements were centered at 72.6 0N latitude and 156.90W
plongitude. The measured albedo (reflectivity) of the overflown ice surface was
0.75. AGASP flight 8 was over the eastern Arctic and was made on March 31, 1983.
The flux measurements were centered at 74.0°N latitude and 25.0°E longitude. Some
broken clouds were encountered during this flight but those portions of the flight
are omitted from this analysis. The albedo of the open ocean was measured as
0.15. This high albedo value was presumably a result of the large contribution of
specular reflection at these large solar zenith angles.
To compute the heating rates produced by the absorption of solar radiation, we
extended the narrow-band spectral measurements to all solar wavelengths using the
following procedure: An approximate aerosol model, consistent with ground-based
data on Arctic haze (Heintzenberg et al., 1981; Heintzenberg, 1980; Rosen et al.,
5

1981; Bodhaine et al., 1981) was constructed. The aerosol was assumed to be an external mixture of sulfate and carbon and had a single-scattering albedo of 0.8 at 0.5 pm. This aerosol was then incorporated in a multilayer version of the delta-four-stream model described by Cuzzi et al. (1982).
For simplicity in the case of the narrow bandpass channels, we modeled the haze
as a single layer, uniformly mixed with height. Based on particle counter data, the
haze layer was defined to be 3 km thick for AGASP flight 14, and 5 km thick for AGASP flights 3 and 8. In addition, a nonabsorbing stratospheric aerosol layer of optical depth 0.1 (Dutton et al., 198 14) was placed at 10 km. Model calculations were car-ried out for various values of the aerosol optical depth for the three wavelengths
corresponding to the narrow-band radiometer channels for each of the three
flights. The surface albedo in each case was determined from the radiometer mea-
surements at the lowest flight level. The results of these calculations are shown
in figure 6.
It is apparent that a good agreement can be obtained in each case between the
measured absorption and the calculated absorption. In the case of AGASP 3, some
ground optical depth information was available from the Barrow monitoring facility
operated by NOAA. These measured optical depths agree well with the values deter-
mined here, but an exact comparison is difficult because of the presence of strato-
spheric aerosol and the spatial variations of the haze. It should be noted that the
calculation of absorbed energy is sensitive primarily to the amount of black carbon
included in the aerosol model. The carbon is relatively insensitive to the nonab-
sorbing aerosol component and to the assumed aerosol microphysics. Consequently,
the agreement exhibited in figure 6 is indicative only of a correct choice of the
amount of black carbon.
Using the aerosol properties determined by fitting the measurements, the model
was run for 26 spectral intervals covering the range of 0.25 to 4L3 Um. Profiles of
gaseous absorbers were taken from the subarctic winter profile of McClatchey et al.
(1972). The instantaneous heating rates computed for the three flights are given in table 3. For comparison purposes, we have also computed the heating rate in the
absence of haze aerosols and the ratio of the two heating rates. To better under-
stand the role of the haze, the results of a calculation done for flight 8 with a high-albedo surface (As 0.75) are also included, and is representative of the effects of a thick haze layer over the ice-covered Arctic basin.
b) Broad Spectral Bandpass Radiometer
In this section, we report the results obtained from the broadband channel
measurements. One objective of these measurements is to use them as a verification
of the results presented in a); another important objective is to determine the
radiative transfer changes introduced by the Arctic haze relative to an "average"
standard Arctic atmosphere. For example, if water vapor concentrations are in some
way correlated with haze concentrations or haze absorption properties (as may or may
not be the case), our concern, then, is to investigate "in situ" the combined,
6

integrated effects on the absorption of radiation by all atmospheric components
during haze events, and their relationship to average standard conditions.
Table 14 presents the results of the broadband measurements for AGASP flights 3
and 8; the values of absorbed power per unit area presented in column 14 were used to
calculate the heating rates for each atmospheric layer. This was done using the
conventional expression, in pressure coordinates, for the heating rate for an atmo-spheric layer thickness AP (Liou, 1980):
I ii - _. F(P) (1) 3PC AP
where T is temperature (K), t is time, g is the gravitational acceleration, C,
is the specific heat at constant pressure, AF is the radiative energy absorbed,
and AP is the pressure differential between the top and bottom of the atmospheric
layer under consideration. The values of the heating rates obtained using equa-
tion (1) are shown in column 5 of table t. Figure 7 depicts the radiative power
absorbed by the atmosphere as a function of altitude and the corresponding heating
rates, respectively.
In order top compare the haze and no-haze heating rates, we calculated heating
rates for a representative Arctic winter atmosphere in the absence of haze. The
results of these calculations are shown, for individual atmospheric layers, in
column 6 of table 14. The water vapor profiles obtained from the standard instrumen-
tation of the aircraft (Schnell and Raatz, 1984; Raatz and Schnell, 198 14) and the data from the 940-nm spectral channel, dedicated to monitor water vapor absorption
(Valero et al., 1983), were used to compute the values in column 7 of table 14 that shows the heating rates that correspond to a haze-free atmosphere with the water
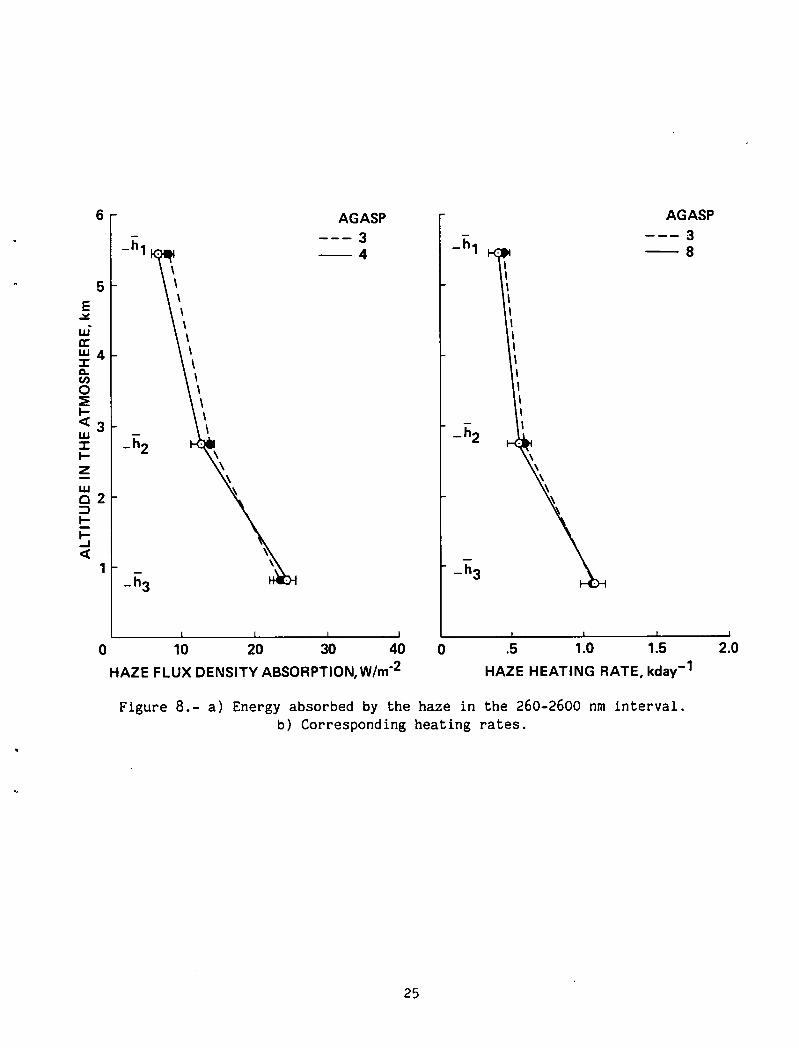
vapor concentrations determined as described above. Figure 8 presents the flux
density absorbed by the haze and the corresponding haze heating rates for each
atmospheric layer. Table 5 shows the broadband flux density absorbed in each layer
and corresponding daily averaged heating rates. Table 6 presents a comparison of
heating rates as determined from broad and narrow spectral bandpasses.
c) The Vertical Structure of the Arctic Haze
By differencing the net flux values at the various altitudes and comparing
these values to model calculations, we can deduce the aerosol optical depth for each
of the three layers defined by the flight altitudes. These values are also tested
for consistency by comparing the narrow and broadband measurements. In addition,
using the optical depth values and the carbon column values of Rosen and Hansen
(1984), we can infer the "in situ" specific absorption of carbon.
The model described in a previous section was used to infer the aerosol optical
depths for flights 3 and 8 by computing the absorbed power per layer in three
narrow-band channels. The calculations were iterated for several extinction optical
7

p
depth profiles until good agreement with the measurements was obtained. Since the
aerosol optical properties are fixed in the model, this is essentially equivalent to
varying the absorption optical depth, ta• Multiple-scattering is included but is a
seôond-order effect owing to the relatively modest aerosol optical depths being considered.
In figure 9, the computed energy absorption in the three narrow-band channels is compared to the measured values for both flight 3 and flight 8. For flight 3, the inferred total haze optical depth at 0.55 um is 0.27. Of this, 0.03 is in layer 1 (3.9-7.0 km), 0.09 is in layer 2 (1.6-3.9 kin), and 0.15 in layer 3 (0-1.6 km). For flight 8, the total optical depth is 0.31, with 0.03, 0.09, and 0.19 in layers 1, 2, and 3, respectively. The good agreement between the model results and the data is primarily indicative of a correct choice of
Ta' since the measurements constrain the absorption. The total optical depth is then constrained
by the single-scattering albedo which we have fixed. Since, in reality, this albedo
may plausibly lie roughly between 0.70 and 0.90, the total optical depth values have an uncertainty of 10% to 15%. As expected, the wavelength dependence of the absorp-tion is consistent with a broadband absorber such as black carbon. Thus, we can
conclude from this comparison that the absorption optical depth, Ta' for the aerosol
for the three layers was 0.007, 0.020, and 0.033 for flight 3, and 0.007, 0.020, and 0.041 for flight 8.
The computed and measured broadband (0.26 to 2.6 i.im) energy absorption as a function of layer for both flights is presented in table 7. The calculations were carried out using the same aerosol model and the optical depth values given above,
which were determined from the narrow band measurements. The agreement between the
measurements and the calculations is remarkably good, both for the total absorption
in the haze and for the absorption in the individual layers. This is further proof
that the aerosol absorption optical depths deduced from the narrow-band data are
correct, and that the wavelength dependence of the aerosol absorption is indeed broadband.
From the results presented above, we can conclude that during both these
flights the majority of the absorbing aerosol was located between the surface and 1.6 km. For flight 8, 10% of the aerosol absorption optical depth is in layer 1, 29% in layer 2, and 61% in layer 3, which is the lowest layer. We have assumed that this absorbing aerosol is predominantly black carbon. Rosen and Hansen (19814) have reported measurements of graphitic (or black) carbon concentration as a function of altitude for flight 8. These measurements cover the same altitude range (0 to 7 kin) as our net-flux measurements and have a higher vertical resolution. We have inte-
grated the vertical profile given in figure 3 of their paper and find that 114% of their total column concentration is located in layer 1, 35% in layer 2, and 51% in layer 3. Given the considerable difference between the two experiments in terms of the quantities being measured, the temporal and spatial resolution, the experimental
techniques, as well as the uncertainties involved in both sets of measurements and
the model results, the agreement between the percentages is quite good.
The results of Rosen and Hansen (19814) and those presented here can be used to infer a specific absorption for black carbon in the Arctic atmosphere. The total
8

column amount of carbon measured by Rosen and Hansen (19814) is 0.0028 gIm2 . From the model, we infer the value of T 0.068. The specific absorption is found by dividing Ta by the total column amount, which gives a value of 214 m2/g. This is a somewhat surprising value since the generally .accepted value for black carbon is on
the order of 8-10 m2/g (Roessler and Faxfog, 1980; Szkarlat and Japar, 1981). There are several possible explanations for this large specific absorption. One is that
the model has grossly overestimated the value of Ta because of an incorrect
aerosol model. As we have noted above, this is unlikely. The measurements-effec-
tively constrain T rather than the extinction optical depth. Thus a change in the aerosol model will have little effect on
A second is that the factor used by Rosen and Hansen (19814) to convert their optical attenuation data to black carbon concentration is incorrect. In view of
their laboratory studies (Gundel et al., 198 14), this also appears unlikely. Alter-
natively, Ackerman and Toon (1981) have shown that it is possible to enhance the absorption per unit volume (or mass) of an aerosol particle by surrounding it with a
nonabsorbing shell.
To illustrate this latter effect, we performed a series of calculations for
particles composed of carbon cores and sulfate shells using the particle size dis-
tribution assumed in this model for sulfate particles. The specific absorption per
unit volume of carbon as a function of the volume fraction of carbon in the par-
ticles is shown in figure 10. To get values of the specific absorption per unit
mass, one must divide by the density of the carbon in units of g/cm 3 . It is appar-ent that we must assume a carbon density of approximately 1 g/cm3 in order to get
the specific absorption of pure carbon spheres to agree with the measured value of 8-10 m2/g. Such a density is reasonable if the carbon volume is an aggregate of small spheres rather than a single, solid sphere, as is often the case (for exam-
ples, see Janzen, 1980, or Borghesi et al., 1983). Using this value of the density converts the ordinate of figure 9 to units of m2/g. We can then infer from the figure that our value of
T is consistent with the black carbon amount of Rosen
and Hansen (1981) if the carbon is present as an internal mixture and represents about 10% of the aerosol volume. While these assumptions would seem to be fairly
plausible, they imply an aerosol with a single-scatter albedo on the order of
0.61. This is smaller than that of the external mixture used in the model calcula-
tions above and smaller than that deduced from the surface measurements of Rosen
et al. (1981) and Bodhaine et al. (1981). The use of the internal mixture in the model leads to a reduction in the aerosol extinction optical depth from 0.31 to 0.18, but causes essentially no change in the value of Ta. The correct choice of aerosol model cannot be resolved at this time, but further analysis of the data
collected on the AGASP flights may lead to new insights.
DISCUSSION AND CONCLUSIONS
It is clear that heating rate changes of the magnitude found have the potential
to significantly modify the local climate and possibly influence the climate at
9

mid-latitudes. At the present time, it is not possible for us to completely assess
the actual climatic effects of the radiation-haze interaction in the Arctic. How-
ever, an indication of the consequences of these effects on the energy budget can be
inferred from considering the modifications introduced by the haze both in the total
radiative energy absorbed by the atmosphere-surface system and in the resulting
changes in the distribution of the absorbed energy between the atmosphere and the
surface. This can be done using the data obtained during flights 3 and 8. Flight 3 took place over an ice surface, and the broadband albedo measured during the lowest
altitude path was 0.78. For flight 8, over the ocean, albedo measured was 0.13.
Using the measured albedos.,
the calculated energy absorption
determine the calculated heating
the energy budget and the distri
the surface change with the haze
analysis shows that the presence
as follows:
the measured energy absorbed by the atmosphere, and
for no-haze conditions (the same values used to
rates for no-haze conditions), one can estimate how
Dution of absorbed energy between the atmosphere and
and the two types of surface conditions. Such
of haze modified the energy budget and distribution
1. For haze over ice (flight 3, March 15, 1983, 72.6 0 N latitude, 156.90W longitude.
a. Increased the total flux density absorption in the atmosRheric layer between 7 and 0.03 km altitude from approximately 36 wm to 77 wnr2.
b. Decreased the flux density absorbed by the ice surface itself from
54 wm -2 to 43 -2
c. Increased the total absorption of radiative solar flux density by the atmosphere-surface system (7 to 0.03 km altitude) from approximately 90 wm 2 to 122
d. Reduced the effective planetary albedo by about 9% (from 63% to 514%) at the given location.
2. For haze over water (flight 8, March 31, 1983, 7LLO°N latitude, 25.0°E longitude.
a. Increased the total flux density absorption in the atmospheric layer
between 7 and 0.03 km from about 40 to 79
b. Decreased the flux density absorbed by the water surface from about
257 wm 2 to 202 -2
c. Decreased the total absorption of solar radiation b the atmosphere
surface system (7 to 0.03 km altitude) from 297 wm to 285 wm2.
d. Increased the effective planetary albedo by about 2.5% (from 21.8% to 24.3%) at the given location.

The results described above demonstrate the potential effect of the Arctic haze
on the Arctic energy budget. The heating rates are comparable to those computed in
earlier purely theoretical studies (e.g., Porch and MacCraken, 1982). However, the
absorbed energy is actually greater than that found in those studies, primarily
because of the larger optical depths found during AGASP. It is also important to
note that the vertical extent of the haze layers during AGASP I was considerably
greater than had been anticipated by those studies. The exact effect of these
perturbations in the energy budget is difficult to assess using only a radiative
model because of the complicated interaction with ice physics and atmospheric dynam-
ics. Furthermore, we neglected one of the most complicated aspects of the problem,
the interaction of the haze with clouds. The studies described here were all made
for cloud-free atmospheres. Calculations that we have carried out indicate that the
heating may be reduced if clouds overlie the haze. However, if the haze is mixed
with the clouds, there is a potential enhancement of the absorption within the
clouds.
From the analysis of our data, we also conclude that a new series of radiation
measurements over the Arctic is necessary. Airborne Sun-photometry, infrared
radiometry, and a total/diffuse ratio radiometer should be included as well as
particle size measurements, size-segregated samples for black carbon analysis, and
filter micrographs to see what particles look like. The information from these
instruments will complement the flux density measurements, simplify the necessary
corrections, and remove uncertainties from the model calculation. Also, a detailed,
and extended program to measure surface albedo and its seasonal and annual changes
should be contemplated since temporal changes in albedo, owing to cumulative deposi-
tion of black carbon over the ice, may introduce significant radiative effects in
the solar and infrared regions of the spectrum.
The cumulative deposition of black carbon over the polar ice cap with its
potential to alter the optical properties of the surface suggests the need for a
detailed and extended program to monitor the seasonal and annual changes in the
surface radiative properties.
11

REFERENCES
Ackerman, T. P.; and Toon, 0. B.: Absorption of Visible Radiation in Atmospheres
Containing Mixtures of Absorbing and Nonabsorbing Particles. Appi. Opt., vol. 20, no. 20, Oct. 15, 1981, pp. 3661-3668.
Ackerman, T. P.; and Valero, F. P. J.: The Vertical Structure of Arctic Haze as
Determined From Airborne Net-Flux Radiometer Measurements. Geophys. Res. Lett., vol. 11, No. 5, May 1984, pp. 1469-1472.
Barrie, L. A.; Hoff, R. M.; and Daggupaty, S. J.: The Influence of Mid-latitudinal Pollution Sources on Haze in the Canadian Arctic. Atmos. Environ., vol. 15, no. 8, 1981, pp. 11407-11419.
Bodhaine, B. A.; Harris, J. M.; and Herbert, G. A.: Aerosol Light Scattering and
Condensation Nuceli Measurements at Barrow, Alaska. Atmos. Environ., vol. 15, no. 8,,1981, pp. 1375-1389.
Bodhaine, B. A.; Dutton, E. G.; and DeLuisi, J. J.: Surface Aerosol Measurements at
Barrow during AGASP. Geophys. Res. Lett., vol. 11, no. 5, May 1984, pp. 377-380.
Borghesi, A.; Bussoletti, E.; Colangeli, L.; Minafra, A.; and Rubini, F.: The
Absorption Efficiency of Submicron Amorphous Carbon Particles Between 2.5 and 40 um, Infrared Phys., vol. 23, no. 2, Mar. 1983, pp. 85-92.
Cuzzi, J. N.; Ackerman, T. P.;and Helmle, L. C.: The Delta-Four-Stream Approxima-
tion for Radiative Flux Transfer. J. Atmos. Sci., vol. 39, no. 14, April 1982, pp. 917-925.
Dutton, E.; DeLuisi, J. J.; and Bodhaine, B. A.: Features of Total Vertical Aerosol
Optical Depth at Barrow, Alaska, 10-20 March 1983. Geophys. Res. Lett., vol. 11, no. 5, May 1984, pp. 385-398.
Gundel, L. A.; Dod, R. L.; Rosen, H. J.; and Novàkov, T.: The Relationship Between
Optical Attenuation and Black Carbon Concentration for Ambient and Source Par-
ticles, Science of the Total Environment, 19814 (in press).
Heintzenberg, J.; Hansson, H. C.; and Lannefors, H.: The Chemical Composition of
Arctic Haze at Ny-Alesund, Spitzbergen. Tellus, vol. 33, no. 2, 1981, pp. 162-171.
Heintzenberg, J.: Particle Size Distribution and Optical Properties of the Arctic
Haze. Tellus, vol. 32, no. 3, 1980, pp. 251-260.
Heintzenberg, J.: Size-Segregated Measurements of Particulate Elemental Carbon and Aerosol Light Absorption of Remote Arctic Locations. Atmos. Environ., vol. 16, no. 10, 1982, pp. 2461-21469.
iK

Janzen, J.: Extinction of Light by Highly Nonspherical Strongly Absorbing Colloidal
Particles: Spectrophotometric Determination of Volumn Distributions for Carbon
Black. Appi. Opt., vol. 19, no. 17, Sept. 1, 1980, pp. 2977-2985.
Khalil, M. A. K.; and Rasmussen, R. A.: Analysis of Trace Gases in Arctic Haze.
Geophys. Res. Lett., vol. 11, no. 5, May 1984, pp. 437440.
Liou, K. N.: An Introduction to Atmospheric Radiation. Academic Press, New York,
1980, P. 392.
McClatchey, R. A.; Fenn, R. W.; Selby, J. E. A.; Volz, F. E.; and Garing, G. S.:
Optical Properties of the Atmosphere, AFCRL Report, 3d ed., 72-0197, 1972.
Mitchel, J. M., Jr.: Visual Range in the Polar Regions with Particular Reference to
the Alaskan Arctic. J. Atmos. Terr. Phys., Spec. Suppi. Pt. 1, 1957,
pp. 195-211.
Ottar, B.: The Transfer of Airborne Pollutants to the Arctic Region. Atmos.
Environ., vol. 15, no. 8, 1981, pp. 114391445.
Porch, W. M.; and MacCracken, M. C.: Parametric Study of the Effects of Arctic Soot
on Solar Radiation. Atmos. Environ., vol. 16, no. 6, 1982, pp. 1365-1371.
Raatz, W. E.; and Schnell, R. C.: Aerosol Distributions and an Arctic Aerosol Front
During AGASP, Norwegian Arctic. Geophys. Res. Lett., vol. 11, no. 5, May 1984,
pp. 373-376.
Rahn, K.; Borys, R.; and Shaw, G. E.: The Asian Source of Arctic Haze Bands.
Nature, vol. 268, no. 5622, Aug. 25, 1977, pp. 713-715.
Rahn, K. A.; and McCaffrey, R. J.: On the Origin and Transport of the Winter Arctic
Aerosol. Ann. N.Y. Acad. Sci., vol. 338, 1980.
Roessler, D. M.; and Faxfog, F. R.: Photoacoustic Determination of Optical Absorp-
tion to Extinction Ratio in Aerosols. Appi. Opt., vol. 19, no. 4, Feb. 15, 1980,
pp. 578-581.
Rosen, H.; and Hansen, A. D. A.: Role of Combustion-Generated Carbon Particles in
the Absorption of Solar Radiation in the Arctic Haze. Geophys. Res. Lett.,
vol. 11, no. 5, May 1984, pp. 461-464.
Rosen, H.; Novakov, T.; and Bodhaine, B. A.: Soot in the Arctic. Atmos. Environ.,
vol. 15, no. 8, 1981, pp. 1371-1374.
Rosen, H.; and Novakov, T.: Combustion-Generated Carbon Particles in the Arctic
Atmosphere. Nature, vol. 306, no. 5945, Dec. 22, 1983, pp. 768-770.
13
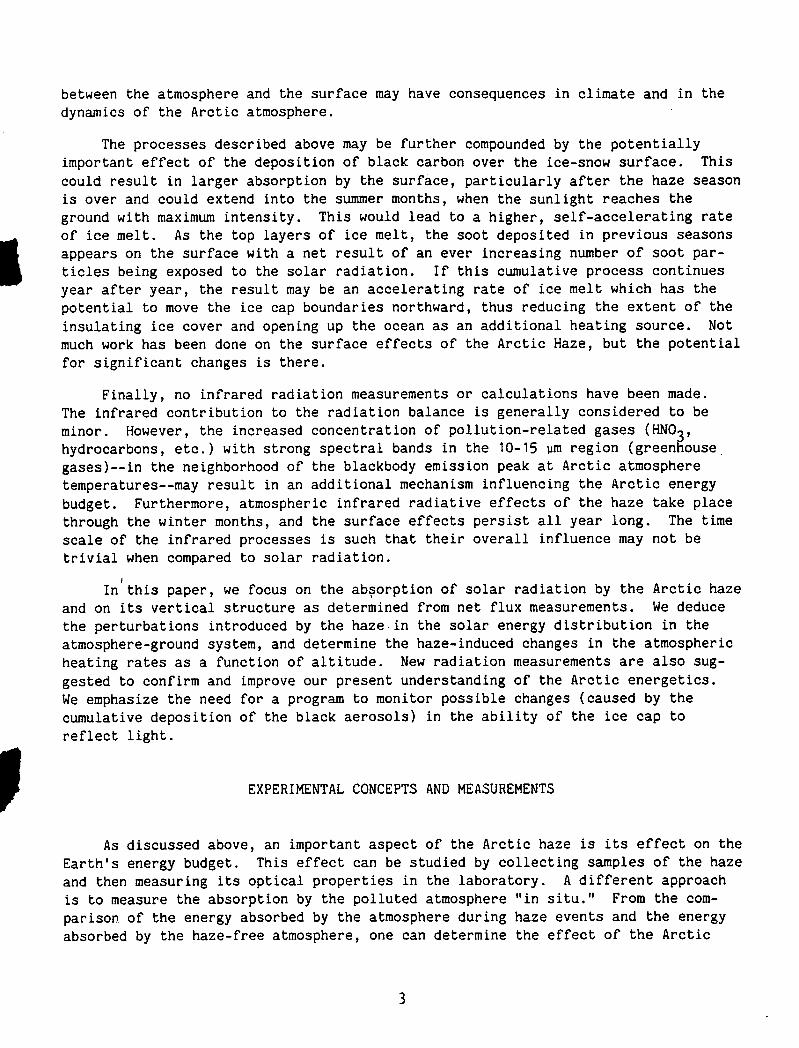
Schnell, R. C.: Arctic Haze and the Arctic Gas and Aerosols Sampling Program
(AGASP). Geophys. Res. Lett., vol. 11, no. 5, May 1984, pp. 361-363.
Schnell, R. C.; and Raatz, W. E.: Vertical and Horizontal Characterization of
Arctic Haze during AGASP, Alaskan Arctic. Geophys. Res. Lett., vol. 11, no. 5, May 1984, PP . 369-372.
Shaw, G. E.; and Stamnes, K.: Arctic Haze; Perturbation of the Polar Radiation
Budget. Ann. N.Y. Acad. Sci., vol. 338, 1980, pp. 535-539.
Shaw, G. E.: Atmospheric Turbidity in the Polar Regions. J. Appi. Meteor.,
vol. 21, no. 8, Aug. 1982, pp. 1080-1088.
Shaw, G. E.: The Vertical Distribution of Atmospheric Aerosols at Barrow, Alaska. Tellus, vol. 27, no. 1, 1975, pp. 39-50.
Szkarlat, A. C.; and Japar, S. M.: Light Absorption by Airborne Aerosols: Compari-
son of Integrating Plate and Spectrophone Techniques. Appl. Opt., vol. 20, no. 7, Apr. 1981, pp. 1151-1155.
Valero, F. P. J.; Ackerman, T. P.; and Gore, W. J. Y.: Radiative Effects of the
Arctic Haze. Geophys. Res. Lett., vol. 10, no. 12, Dec. 1983, pp. 1184-1187.
Valero, F. P. J.; Ackerman, T. P.; and Gore, W. J. Y.: The Absorption of Solar
Radiation by the Arctic Atmosphere During the Haze Season and Its Effects on the
Radiation Budget. Geophys. Res. Lett., vol. 11, no. 5, May 1984, pp. 465-468.
14

TABLE 1.- FLUX MEASUREMENT
ALTITUDES
h, Layer
km km km number
7.0
3.1 5.45 3.9
2.3 2.75 2 1.6
1.57 .81 3 0.03
Notes:
h altitude at which flux
measurements were made.
thickness of atmosphere
layer; h mean altitude.

TABLE 2.- ABSORPTION OF RADIATIVE FLUX DENSITIES
Flux density absorbed (_2) at noon AGASP Layer
flight number
Channel A Channel B Channel C
(0.485 pm) (0.680 um) (0.860 urn)
3 1 0.15 ±0.02 0.08 ±0.01 0.07 ±0.01 2 0.38 ±0.03 0.25 ±0.02 0.18 ±0.03 3 0.55 ±0.05 0.36 ±0.04 0.28 ±0.03
4 1 ---2 0.27 ±0.03 0.17 ±0.01 0.11 ±0.01 3 0.41 ±0.03 0.28 ±0.03 0.20 ±0.01
8 1 0.114 ±0.01 0.10 ±0.01 0.05 ±0.01 2 0.38 ±0.03 0.23 ±0.01 0.14 ±0.01 3 0.54 ±0.03 0.36 ±0.03 0.23 ±0.02
Notes: Altitude and thickness of layers are given in
table 1; spectral bandpass is 0.01 urn.

TABLE 3.- DAILY AVERAGED HEATING RATES
Heating Rates,
AGASP Best Fit, K/day Heat rate ratio,
flight (TH)a haze/no-haze
Haze No haze
3 0.26 0.17 0.08 2.1
.17 .19 .07 2.7 8 .31 .21 .08 2.6
.31 .27 .10 2.7
aHaze optical depth at 500 nm.
b1 over ice. See text.
17

TABLE 1L- TOTAL RADIATIVE FLUX DENSITY ABSORPTION AND HEATING RATES
Calculated haze-free heating rates Measured Measuredb
AGAS? broadband Layera flux density
flight surface absorption, Measured Actual no. albedo wm2 haze event Standard water vapor
heating rate, atmosphere, atmosphere, Kday 1 Kday Kday1
3 0.78 1 20 ±2 0.16 ± 0.02 0.10 0.09 2 28 ±2 0.19 ± 0.01 .08 .08
3 29 ±2 0.25 ± 0.02 .06 .06
8 .13 1 14 ±2 0.11 ± 0.01 .09 .06 2 36 ±3 0.24 ± 0.02 .11 .14
3 29 ±3 0.25 ± 0.16 .06 .06
aLayers 1, 2, and 3 refer to atmospheric layers included between the altitudes 7
and 3.9 km, 3.9 and 1.6 kin, and 1.6 and 0.03 kin, respectively. bEnergy absorption is instantaneous at noon.
18
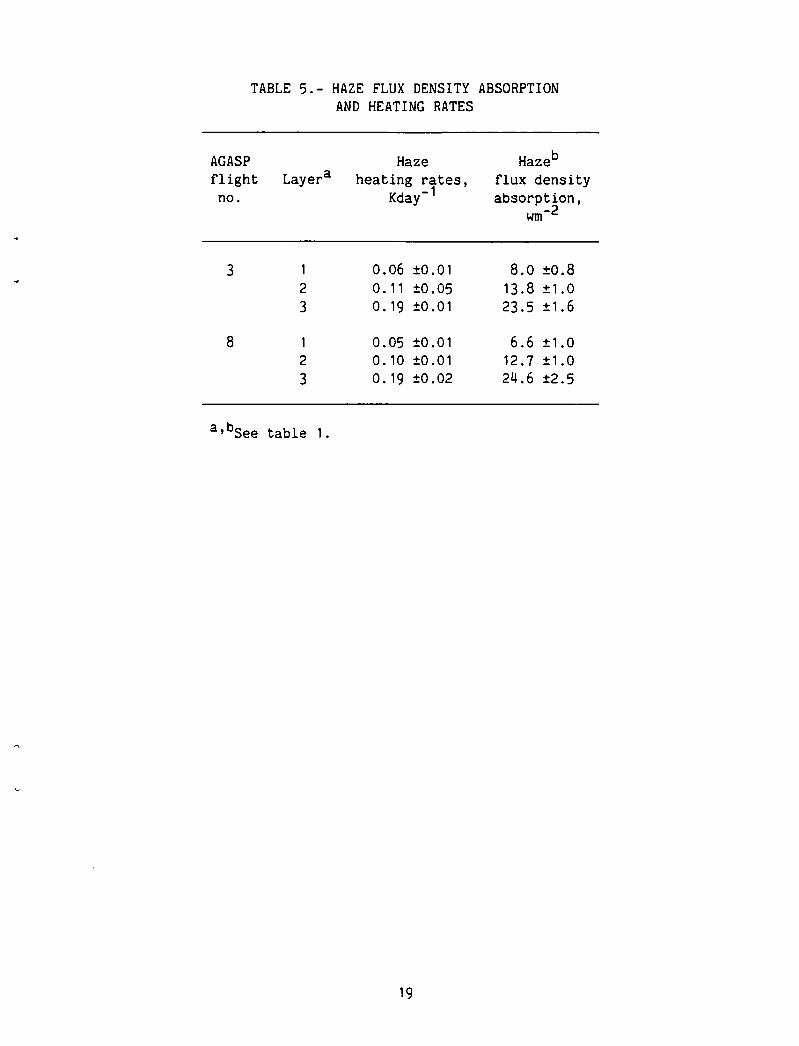
TABLE 5.- HAZE FLUX DENSITY ABSORPTION
AND HEATING RATES
AGASP Haze Hazeb
flight Layera heating rates, flux density no. Kday1 absorption,
wm-2
3 1 0.06 ±0.01 8.0 ±0.8
2 0.11 ±0.05 13.8 ±1.0
3 0.19 ±0.01 23.5 ±1.6
8 1 0.05 ±0.01 6.6 ±1.0
2 0.10 ±0.01 12.7 ±1.0
3 0.19 ±0.02 214.6 ±2.5
a , b ee table 1.
19

TABLE 6.- ALTITUDE AVERAGED
HEATING RATES
Daily averaged
AGASP heating rate, Kday1
flight
no.
Broadband Narrow band
3 0.20 0.17 8 .20 .21
TABLE 7.- BROADBAND FLUX DENSITY
ABSORPTION, W/m2
Flight no. 3 Flight no. 14
Layer
number
Data Model Data Model
1 20 21 iLl 15 2 28 28 36 37
3 29 30 29 32
Total 77 79 79 814
20

Figure 1.- Arctic haze event, March 1983.
h ___ d0=I0sinO
__________________ TOP OFTHE
di 0 ATMOSPHERE
hiUo
4 Al2=(d1 -u 1 ) -(d2-u2) d
U1I
u2t ds ust
SSURFACE
Figure 2.- Method used to measure "in situ" the power absorbed by atmospheric layers.
OFu.. ç
21
Fill OF POOR QUALITY
I RM > I
Figure 3.- Radiometric system mounted in the WP-3D research aircraft.
7000 m
LAYER 1 'F DESCENT
I 3900m J
LAYER 2 DESCENT
1600m
LAYER 3tDESCENT
30m
ICE OR WATER
Figure 1L- Flight profiles to measure net radiative fluxes.
22

AGASP No.8
o MEASURED - MODELED
.3
uJ Ca cc 07 CO
>. - .6
AGASP NO. 3
T = 0.30
\ ,T=O.25
RADIOMETER DATA
1.1
1.0
e.,1 .9 E
U,
Ui
0 .5 X
LL
1
.4
TH = 0.20
N
AGASP NO.4 AGASP NO. 8
RADIOMETER DATA
T = 0.14
rH = 0.30 /
\ RADIOMETER \ DATA
.6 AGASP No. 3
c1
5LAYER
E 01
d LU
0 CO
I-
z III
AGASP No.4
0
U.(a)
I I(c)
.4 .5 .6 .7 .8 .9 .4 .5 .6 .7 .8 .9 .4 .5 .6 .7 .8 .9 X, Am X,pm X,pm
Figure 5.- Radiative power absorbed in 0.01 urn spectral bandpasses as a
function of wavelength. Layers are defined in Table 1.
_________1(b ) 1(c)
.4 .5 .6 .7 .8 .9 .4 .5 .6 .7 .8 .9 .4 .5 .6 .7 .8 .9 X, Am
Figure 6.- Measured and calculated total power absorbed by the atmosphere in 0.01 urn intervals. TH is the extinction optical depth at 500 nm. Symbols are measured
values, solid lines represent model results.
23

FLIGHT 3
FLIGHT 8
N
I LAYER 1
1-LAYEI
h3 LAYEI
6 E
LU
cc 5 uJ I 0. C,, 0
I-
LU I '-.3 z LU
I—I--j
-hl
'-h2
• •1--- FLIGHT
FLIGHT 8
• LAYER 1
ihi
. h 2 LAYER 2
\
• 1 \
—h3 LAYER 3
0 10 20 30 40 0 .08 .16 .24 .32
SOLAR FLUX DENSITY ABSORBED BY THE ATMOSPHERE HEATING RATES, kday ATMOSPHERE, W/m2
Figure 7.- a) Broadband (260-2600 nm) solar radiation absorbed by the polluted arctic atmosphere. b) Daily averaged heating rates as a function of altitude.
[ --hl
5 E
cn
LU3[
w
'U c2 I-I--J
it- - _h3
0 10 20 30 40
HAZE FLUX DENSITY ABSORPTION, W/m 2
0 .5 1.0 1.5 2.0
HAZE HEATING RATE, kday
AGASP 3 4
Figure 8.- a) Energy absorbed by the haze in the 260-2600 nm interval.
b) Corresponding heating rates.
25

NE S.-
d.4 W
0 U) co <.3 >. I—U) z Ui
x
-J U-
.1
LAYER 2
)
AGASP FLIGHT NO. 3
AGASP FLIGHT NO.8
L.
LAYER 3
.5
LAYER 3
56 7 8 9 4 5 6 7 8 .9
X,pm X,pm
Figure 9. absorbed in bandpasses in each atmospheric layer. Symbols are measured values, solid lines represent model results.
35
:J30
E20 I 0 U) m
10 U-
05 Ui
U) .
0 .2 .4 .6 .8 1.0 VOLUME FRACTION OF CARBON
Figure 10.- Specific absorption per unit volume of carbon as a function of volume fraction of carbon.
26

1. Report No. 2. Government Accession No. 3. Recipient's Catalog No. NASA TM 86784
4. Title and Subtitle 5. Report Date
December 1985 ARCTIC HAZE AND THE RADIATION BALANCE 6. Performing Organization Code
7. Author(s) 8. Performing Organization Report No.
Francisco P. J. Valero and Thomas P. Ackerman
10. Work Unit No. 9. Performing Organization Name and Address
Ames Research Center11. Contract or Grant No.
Moffett Field, California 94035
13. Type of Report and Period Covered
Technical Memorandum 12. Sponsoring Agency Name and Address
National Aeronautics and Space Administration14. Sponsoring Agency Code
Washington DC, 20546672-22-99-10
15. Supplementary Notes
Point of Contact: Francisco P. J. Valero, Ames Research Center, MS 245-6 Moffett Field, CA (415) 694-5510 or FTS 448-5510
16. AbstractAirborne measurements of the absorption of solar radiation by the Arctic haze
indicate atmospheric heating rates of from 0.15 to 0.25 Kday (24 hr weighted averages) at latitudes between 72.6N and 74.0)1 during the early spring (March 15-April 4, 1983).
The haze interaction with solar radiation alters the radiative balance of the atmosphere-surface system. Generally, this interaction results in an increase of the solar energy absorbed by the atmosphere and in a decrease of the radiation absorbed by tPe ground (ice or water). The effective planetary albedo is also affected, increasing for haze over water and decreasing for haze over ice.
The haze interaction with infrared (planetary) radiation has not been mea-sured. However, the infrared component of the energy budget represents one of the most important contributions to the overall energy balance. Calculations can pro-vide some information, but experimental evidence is required (at least to validate the calculations) because of the enhanced concentration of greenhouse gases measured in the haze layers.
The cumulative deposition of black carbon over the surface, produces a change in the optical properties of the ice which may result in an accelerating rate of ice melt. Experimental evidence of the magnitude of this effect is necessary to prop-erly evaluate its consequences. An extended monitoring program is suggested. The significance of energy budget changes induced by the Arctic aerosol on climate depends on the spatial and temporal properties of the haze layers. Therefore, an Important concern with climatic studies done using available measurements Is with truly sampling the spatial and temporal properties of the haze layers. Do a few episodic airborne experiments (sort of a snapshot approach) yield information repre-sentative enough to be useful for building a sufficient understanding for climate studies?
17. Key Words (Suggested by Author(s)) 18. Distribution Statement
Arctic Radiative balance Unlimited Aerosol haze Carbon Subject Category: 88 Atmospheric heating Carbon 19. Security Classif. (of this report) 20. Security Classif. (of this page) 21. No. ofPages 22. Price
Uncl Unci 28 A03
For sale by the National Technical Information Service, Springfield, Virginia 22161