Embed Size (px)
Citation preview
applied sciences
Article
Arc Shape Characteristics with Ultra-High-FrequencyPulsed Arc Welding
Mingxuan Yang *, Hao Zheng and Ling Li
Department of Materials Processing, Beijing Universtity of Aeronautics and Astronautics, Beijing 100191, China;[email protected] (H.Z.); [email protected] (L.L.)* Correspondence: [email protected]; Tel.: +86-138-1189-1251
Academic Editor: Hai-Lung TsaiReceived: 17 October 2016; Accepted: 7 December 2016; Published: 3 January 2017
Abstract: Arc plasma possesses a constriction phenomenon with a pulsed current. The constrictionis created by the Lorentz force, the radial electromagnetic force during arc welding, whichdetermines the energy distribution of the arc plasma. Welding experiments were carried out withultra-high-frequency pulsed arc welding (UHFP-AW). Ultra-high-speed camera observations wereproduced for arc surveillance. Hue-saturation-intensity (HSI) image analysis was used to distinguishthe regions of the arc plasma that represented the heat energy distribution. The measurement of arcregions indicated that, with an ultra-high-frequency pulsed arc, the constriction was not only withinthe decreased arc geometry, but also within the constricted arc core region. This can be checked bythe ratio of the core region to the total area. The arc core region expanded significantly at 40 kHz at60 A. A current level of 80 A caused a decrease in the total region of the arc. Meanwhile, the ratioof the core region to the total increased. It can be concluded that arc constriction depends on theincreased area of the core region with the pulsed current (>20 kHz).
Keywords: arc constriction; ratio of core region to the total; pulsed arc welding
1. Introduction
Arc welding is a traditional process technology in industry. It has been developed through a longhistory of studying its mechanism and engineering applications. However, many phenomena lack asystematic approach, which includes the arc constriction. With classical theory, it was found that theparallel current lines attracted each other when they were in the same direction. This is also applicablein an arc plasma [1] with direct current welding (DC welding). Most of the time, DC arc welding createsthe current pointing from the base metal to the electrode. The current is formed during the movementsof electrons and positive particles. The current elements with the same direction can be recognized asthe current line series. They will attract each other with a macro perspective as one is surrounded in theelectromagnetic field created by another. Mutual attraction occurs between any two lines or elements.It can be deduced that the Lorentz force, which is the major electromagnetic force and only changesthe direction of charged particles, would constrict the arc plasma in a radial direction, which is calledarc constriction. This phenomenon has been proved by experiments [2]. Arc constriction will create apinched arc plasma [3] during the welding process. It is regularly believed to increase the stiffness,arc voltage, and energy density of the arc plasma. As a result, it will enhance the penetration andreduce the shielding area of the welding arc, which is important for the arc welding process. Firstly,constriction of the arc leads to an increased arc temperature and axial flow velocity with the increasedcurrent density [4]. Significant results can usually be obtained under the condition of a large weldingcurrent greater than 150 A [5,6] and a pulsed current [7,8]. The research [9] revealed an increased arcvoltage with different shielding gases, which displayed obvious arc constriction. Secondly, some resultsindicate significant constriction with the pulsed welding process [10,11]. Previous work indicates
Appl. Sci. 2017, 7, 45; doi:10.3390/app7010045 www.mdpi.com/journal/applsci
Appl. Sci. 2017, 7, 45 2 of 9
that the root radius decreased during pulsed arc welding [12], and the attenuation coefficient of themagnetic force is defined to evaluate the intensity of the arc constriction, even though it was a directreflection of the constriction view. Thirdly, some studies demonstrated the effect of arc constriction onthe weld appearance [13,14], which was also proved with pulsed welding [15]. Previous work foundan increase in the arc voltage and arc constriction with pulsed welding [16]. Such reflections couldbe correlated with the arc constriction during pulsed arc welding. Finally, the continued arc shapeswere displayed to exhibit the arc constriction with an ultra-high-speed camera most of the time. Someexperiments found the increased arc size with a large current [17,18], although that caused the arcconstriction. Thus, the arc constriction is predicted to have other reflections with a pulsed arc plasmaof more than 20 kHz. Furthermore, visual observation is very popular in arc plasma surveillance; itcan be used to track characteristic elements and to conduct arc plasma diagnosis by imaging of thecontinuous spectra [19]. At the same time, it is simple and rapid to analyze the distribution of thetemperature field using the method of image processing, and the dynamic change of the arc plasmacan be monitored in real time by a high-speed camera, and the image processing methods are requiredin order to distinguish the region of the arc plasma for further study.
Above all, the welding arc core region and the edge of the arc contain plenty of informationabout the welding arc physics, and it is meaningful to study the ratio of the arc core region to the totalregion. This paper studies the principle of arc constriction in order to experiment, conjecture, andverify. The aim is to contribute to arc diagnosis with respect to the pulsed arc constriction.
2. Methods
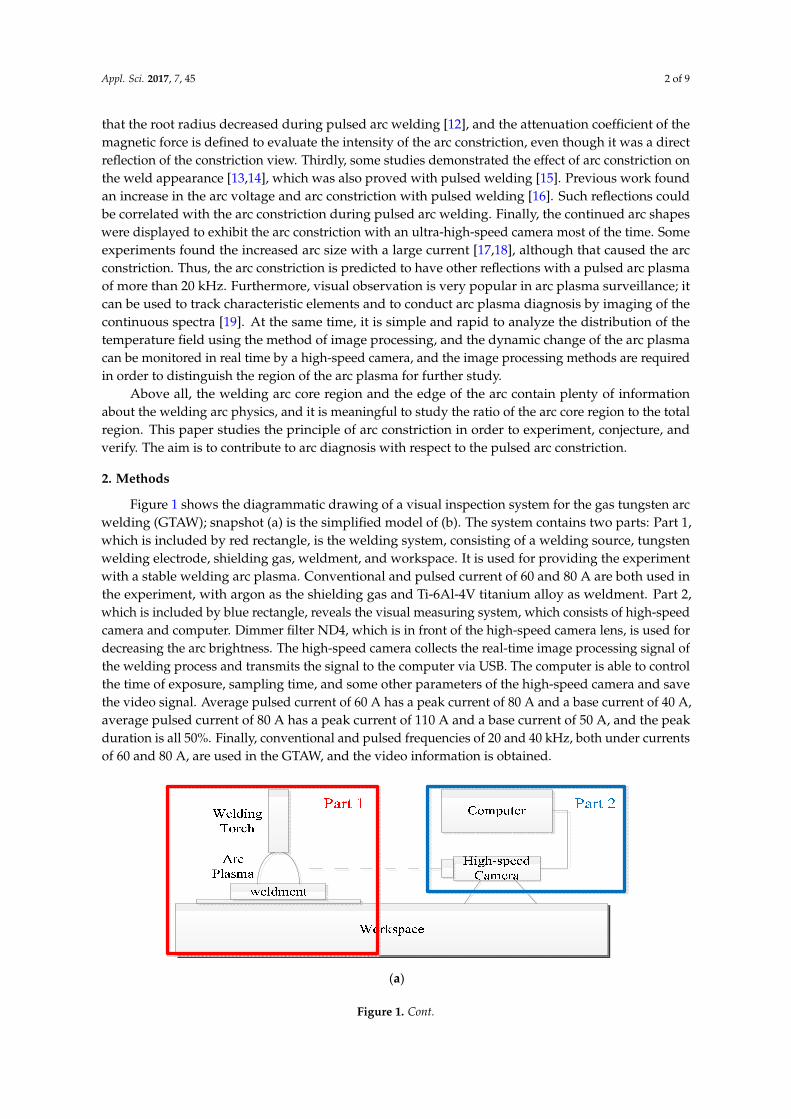
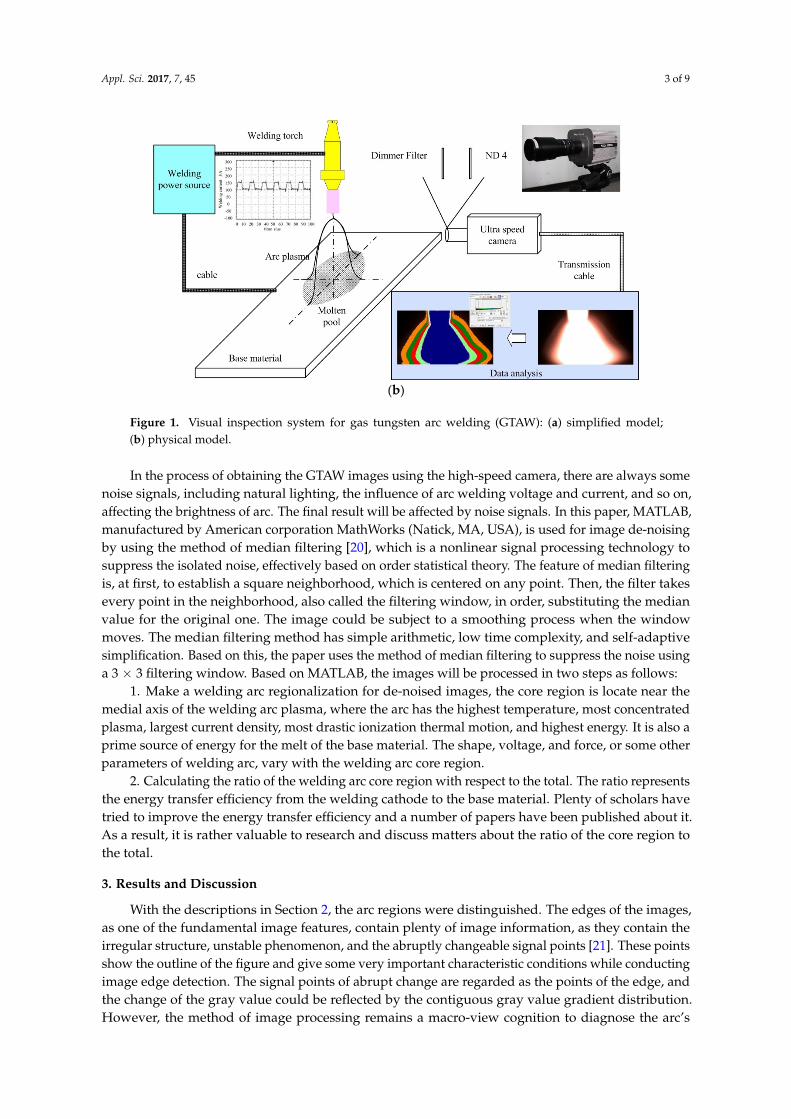
Figure 1 shows the diagrammatic drawing of a visual inspection system for the gas tungsten arcwelding (GTAW); snapshot (a) is the simplified model of (b). The system contains two parts: Part 1,which is included by red rectangle, is the welding system, consisting of a welding source, tungstenwelding electrode, shielding gas, weldment, and workspace. It is used for providing the experimentwith a stable welding arc plasma. Conventional and pulsed current of 60 and 80 A are both used inthe experiment, with argon as the shielding gas and Ti-6Al-4V titanium alloy as weldment. Part 2,which is included by blue rectangle, reveals the visual measuring system, which consists of high-speedcamera and computer. Dimmer filter ND4, which is in front of the high-speed camera lens, is used fordecreasing the arc brightness. The high-speed camera collects the real-time image processing signal ofthe welding process and transmits the signal to the computer via USB. The computer is able to controlthe time of exposure, sampling time, and some other parameters of the high-speed camera and savethe video signal. Average pulsed current of 60 A has a peak current of 80 A and a base current of 40 A,average pulsed current of 80 A has a peak current of 110 A and a base current of 50 A, and the peakduration is all 50%. Finally, conventional and pulsed frequencies of 20 and 40 kHz, both under currentsof 60 and 80 A, are used in the GTAW, and the video information is obtained.
Appl. Sci. 2016, 6, 430 2 of 9
with the pulsed welding process [10,11]. Previous work indicates that the root radius decreased
during pulsed arc welding [12], and the attenuation coefficient of the magnetic force is defined to
evaluate the intensity of the arc constriction, even though it was a direct reflection of the constriction
view. Thirdly, some studies demonstrated the effect of arc constriction on the weld appearance
[13,14], which was also proved with pulsed welding [15]. Previous work found an increase in the arc
voltage and arc constriction with pulsed welding [16]. Such reflections could be correlated with the
arc constriction during pulsed arc welding. Finally, the continued arc shapes were displayed to
exhibit the arc constriction with an ultra‐high‐speed camera most of the time. Some experiments
found the increased arc size with a large current [17,18], although that caused the arc constriction.
Thus, the arc constriction is predicted to have other reflections with a pulsed arc plasma of more than
20 kHz. Furthermore, visual observation is very popular in arc plasma surveillance; it can be used to
track characteristic elements and to conduct arc plasma diagnosis by imaging of the continuous
spectra [19]. At the same time, it is simple and rapid to analyze the distribution of the temperature
field using the method of image processing, and the dynamic change of the arc plasma can be
monitored in real time by a high‐speed camera, and the image processing methods are required in
order to distinguish the region of the arc plasma for further study.
Above all, the welding arc core region and the edge of the arc contain plenty of information
about the welding arc physics, and it is meaningful to study the ratio of the arc core region to the
total region. This paper studies the principle of arc constriction in order to experiment, conjecture,
and verify. The aim is to contribute to arc diagnosis with respect to the pulsed arc constriction.
2. Methods
Figure 1 shows the diagrammatic drawing of a visual inspection system for the gas tungsten arc
welding (GTAW); snapshot (a) is the simplified model of (b). The system contains two parts: Part 1,
which is included by red rectangle, is the welding system, consisting of a welding source, tungsten
welding electrode, shielding gas, weldment, and workspace. It is used for providing the experiment
with a stable welding arc plasma. Conventional and pulsed current of 60 and 80 A are both used in
the experiment, with argon as the shielding gas and Ti‐6Al‐4V titanium alloy as weldment. Part 2,
which is included by blue rectangle, reveals the visual measuring system, which consists of high‐
speed camera and computer. Dimmer filter ND4, which is in front of the high‐speed camera lens, is
used for decreasing the arc brightness. The high‐speed camera collects the real‐time image processing
signal of the welding process and transmits the signal to the computer via USB. The computer is able
to control the time of exposure, sampling time, and some other parameters of the high‐speed camera
and save the video signal. Average pulsed current of 60 A has a peak current of 80 A and a base current of 40 A, average pulsed current of 80 A has a peak current of 110 A and a base current of 50
A, and the peak duration is all 50%. Finally, conventional and pulsed frequencies of 20 and 40 kHz,
both under currents of 60 and 80 A, are used in the GTAW, and the video information is obtained.
(a)
Figure 1. Cont.
Appl. Sci. 2017, 7, 45 3 of 9
Appl. Sci. 2016, 6, 430 3 of 9
(b)
Figure 1. Visual inspection system for gas tungsten arc welding (GTAW): (a) simplified model; (b)
physical model.
In the process of obtaining the GTAW images using the high‐speed camera, there are always
some noise signals, including natural lighting, the influence of arc welding voltage and current, and
so on, affecting the brightness of arc. The final result will be affected by noise signals. In this paper,
MATLAB, manufactured by American corporation MathWorks (Natick, MA, USA), is used for image
de‐noising by using the method of median filtering [20], which is a nonlinear signal processing
technology to suppress the isolated noise, effectively based on order statistical theory. The feature of
median filtering is, at first, to establish a square neighborhood, which is centered on any point. Then,
the filter takes every point in the neighborhood, also called the filtering window, in order,
substituting the median value for the original one. The image could be subject to a smoothing process
when the window moves. The median filtering method has simple arithmetic, low time complexity,
and self‐adaptive simplification. Based on this, the paper uses the method of median filtering to
suppress the noise using a 3 × 3 filtering window. Based on MATLAB, the images will be processed
in two steps as follows:
1. Make a welding arc regionalization for de‐noised images, the core region is locate near the
medial axis of the welding arc plasma, where the arc has the highest temperature, most concentrated
plasma, largest current density, most drastic ionization thermal motion, and highest energy. It is also
a prime source of energy for the melt of the base material. The shape, voltage, and force, or some
other parameters of welding arc, vary with the welding arc core region.
2. Calculating the ratio of the welding arc core region with respect to the total. The ratio
represents the energy transfer efficiency from the welding cathode to the base material. Plenty of
scholars have tried to improve the energy transfer efficiency and a number of papers have been
published about it. As a result, it is rather valuable to research and discuss matters about the ratio of
the core region to the total.
3. Results and Discussion
With the descriptions in Section 2, the arc regions were distinguished. The edges of the images,
as one of the fundamental image features, contain plenty of image information, as they contain the
irregular structure, unstable phenomenon, and the abruptly changeable signal points [21]. These
points show the outline of the figure and give some very important characteristic conditions while
conducting image edge detection. The signal points of abrupt change are regarded as the points of
the edge, and the change of the gray value could be reflected by the contiguous gray value gradient
distribution. However, the method of image processing remains a macro‐view cognition to diagnose
the arc’s physical properties because the arc shape, shown by the high‐speed camera, is not able to
Figure 1. Visual inspection system for gas tungsten arc welding (GTAW): (a) simplified model;(b) physical model.
In the process of obtaining the GTAW images using the high-speed camera, there are always somenoise signals, including natural lighting, the influence of arc welding voltage and current, and so on,affecting the brightness of arc. The final result will be affected by noise signals. In this paper, MATLAB,manufactured by American corporation MathWorks (Natick, MA, USA), is used for image de-noisingby using the method of median filtering [20], which is a nonlinear signal processing technology tosuppress the isolated noise, effectively based on order statistical theory. The feature of median filteringis, at first, to establish a square neighborhood, which is centered on any point. Then, the filter takesevery point in the neighborhood, also called the filtering window, in order, substituting the medianvalue for the original one. The image could be subject to a smoothing process when the windowmoves. The median filtering method has simple arithmetic, low time complexity, and self-adaptivesimplification. Based on this, the paper uses the method of median filtering to suppress the noise usinga 3 × 3 filtering window. Based on MATLAB, the images will be processed in two steps as follows:
1. Make a welding arc regionalization for de-noised images, the core region is locate near themedial axis of the welding arc plasma, where the arc has the highest temperature, most concentratedplasma, largest current density, most drastic ionization thermal motion, and highest energy. It is also aprime source of energy for the melt of the base material. The shape, voltage, and force, or some otherparameters of welding arc, vary with the welding arc core region.
2. Calculating the ratio of the welding arc core region with respect to the total. The ratio representsthe energy transfer efficiency from the welding cathode to the base material. Plenty of scholars havetried to improve the energy transfer efficiency and a number of papers have been published about it.As a result, it is rather valuable to research and discuss matters about the ratio of the core region tothe total.
3. Results and Discussion
With the descriptions in Section 2, the arc regions were distinguished. The edges of the images,as one of the fundamental image features, contain plenty of image information, as they contain theirregular structure, unstable phenomenon, and the abruptly changeable signal points [21]. These pointsshow the outline of the figure and give some very important characteristic conditions while conductingimage edge detection. The signal points of abrupt change are regarded as the points of the edge, andthe change of the gray value could be reflected by the contiguous gray value gradient distribution.However, the method of image processing remains a macro-view cognition to diagnose the arc’s
Appl. Sci. 2017, 7, 45 4 of 9
physical properties because the arc shape, shown by the high-speed camera, is not able to display thescope of every part inside the arc. Meanwhile, ionization zones vary with the shooting conditions.As a result, it is quite difficult to determine the edge of the arc with the method of image processing.Spectrum analysis is an efficient way to recognize the edge of the arc. According to Xiao [22], it ispossible to obtain the curves of variation in light intensity from the core region to the edge of the arcby using spectroscopic methods [23]. As a result, the ratio of the trough to the peak of the curve canbe obtained, which represents the edge of the arc to the core of the arc. An approximation method isused, simultaneously, to obtain the ratio of the welding arc core region to the total region. Calculatingthe two ratios above, the gray value of the edge of the arc is about 15. It is well known that the rangefrom 95%–100% of the energy is the power core, which is relevant to the welding arc intensity of light.Therefore, 95% of the highest gray value defines the edge of arc core region, 15, as the edge of the arctotal region.
3.1. De-Noising Processing
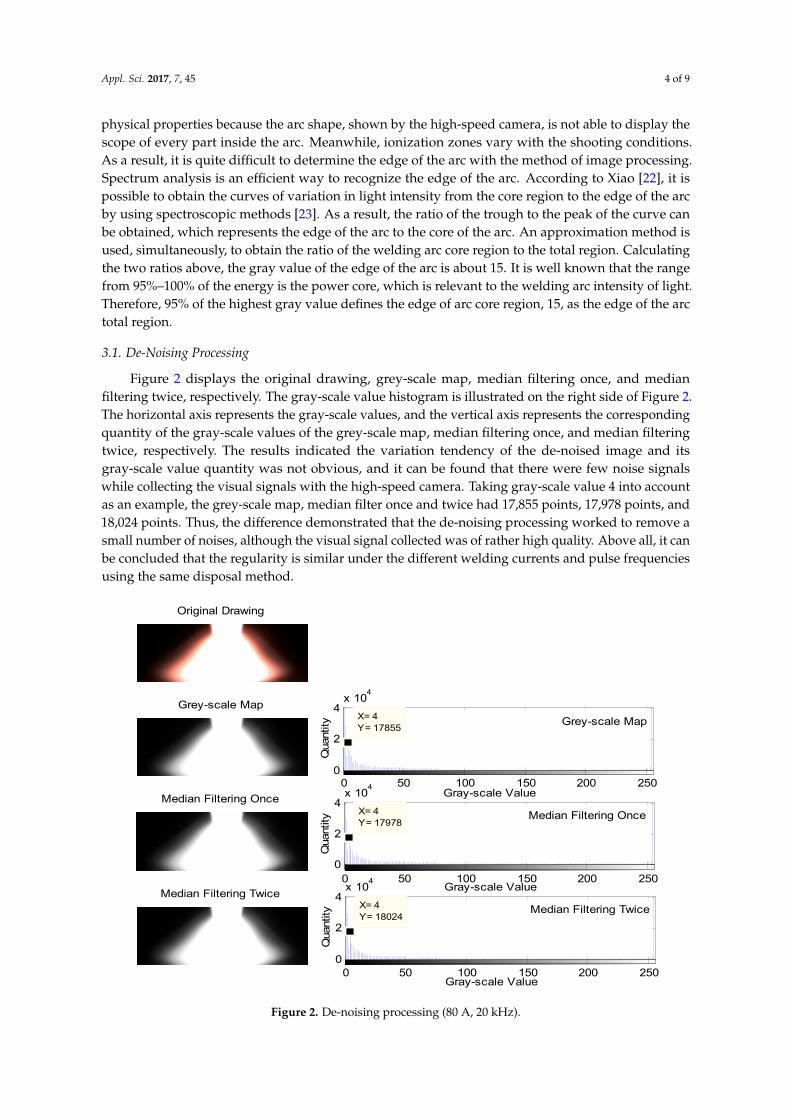
Figure 2 displays the original drawing, grey-scale map, median filtering once, and medianfiltering twice, respectively. The gray-scale value histogram is illustrated on the right side of Figure 2.The horizontal axis represents the gray-scale values, and the vertical axis represents the correspondingquantity of the gray-scale values of the grey-scale map, median filtering once, and median filteringtwice, respectively. The results indicated the variation tendency of the de-noised image and itsgray-scale value quantity was not obvious, and it can be found that there were few noise signalswhile collecting the visual signals with the high-speed camera. Taking gray-scale value 4 into accountas an example, the grey-scale map, median filter once and twice had 17,855 points, 17,978 points, and18,024 points. Thus, the difference demonstrated that the de-noising processing worked to remove asmall number of noises, although the visual signal collected was of rather high quality. Above all, it canbe concluded that the regularity is similar under the different welding currents and pulse frequenciesusing the same disposal method.
Appl. Sci. 2016, 6, 430 4 of 9
display the scope of every part inside the arc. Meanwhile, ionization zones vary with the shooting
conditions. As a result, it is quite difficult to determine the edge of the arc with the method of image
processing. Spectrum analysis is an efficient way to recognize the edge of the arc. According to Xiao
[22], it is possible to obtain the curves of variation in light intensity from the core region to the edge
of the arc by using spectroscopic methods [23]. As a result, the ratio of the trough to the peak of the
curve can be obtained, which represents the edge of the arc to the core of the arc. An approximation
method is used, simultaneously, to obtain the ratio of the welding arc core region to the total region.
Calculating the two ratios above, the gray value of the edge of the arc is about 15. It is well known
that the range from 95%–100% of the energy is the power core, which is relevant to the welding arc
intensity of light. Therefore, 95% of the highest gray value defines the edge of arc core region, 15, as
the edge of the arc total region.
3.1. De‐Noising Processing
Figure 2 displays the original drawing, grey‐scale map, median filtering once, and median
filtering twice, respectively. The gray‐scale value histogram is illustrated on the right side of Figure
2. The horizontal axis represents the gray‐scale values, and the vertical axis represents the
corresponding quantity of the gray‐scale values of the grey‐scale map, median filtering once, and
median filtering twice, respectively. The results indicated the variation tendency of the de‐noised
image and its gray‐scale value quantity was not obvious, and it can be found that there were few
noise signals while collecting the visual signals with the high‐speed camera. Taking gray‐scale value
4 into account as an example, the grey‐scale map, median filter once and twice had 17,855 points,
17,978 points, and 18,024 points. Thus, the difference demonstrated that the de‐noising processing
worked to remove a small number of noises, although the visual signal collected was of rather high
quality. Above all, it can be concluded that the regularity is similar under the different welding
currents and pulse frequencies using the same disposal method.
Figure 2. De‐noising processing (80 A, 20 kHz).
3.2. Arc Regionalization
Original Drawing
Grey-scale Map
Median Filtering Once
Median Filtering Twice
0
2
4x 10
4
X= 4Y= 17855
Grey-scale Map
Gray-scale Value
Qua
ntity
0 50 100 150 200 250
0
2
4x 10
4
X= 4Y= 17978
Gray-scale Value
Median Filtering Once
Qua
ntity
0 50 100 150 200 250
0
2
4x 10
4
X= 4Y= 18024
Median Filtering Twice
Qua
ntity
Gray-scale Value0 50 100 150 200 250
Figure 2. De-noising processing (80 A, 20 kHz).
Appl. Sci. 2017, 7, 45 5 of 9
3.2. Arc Regionalization
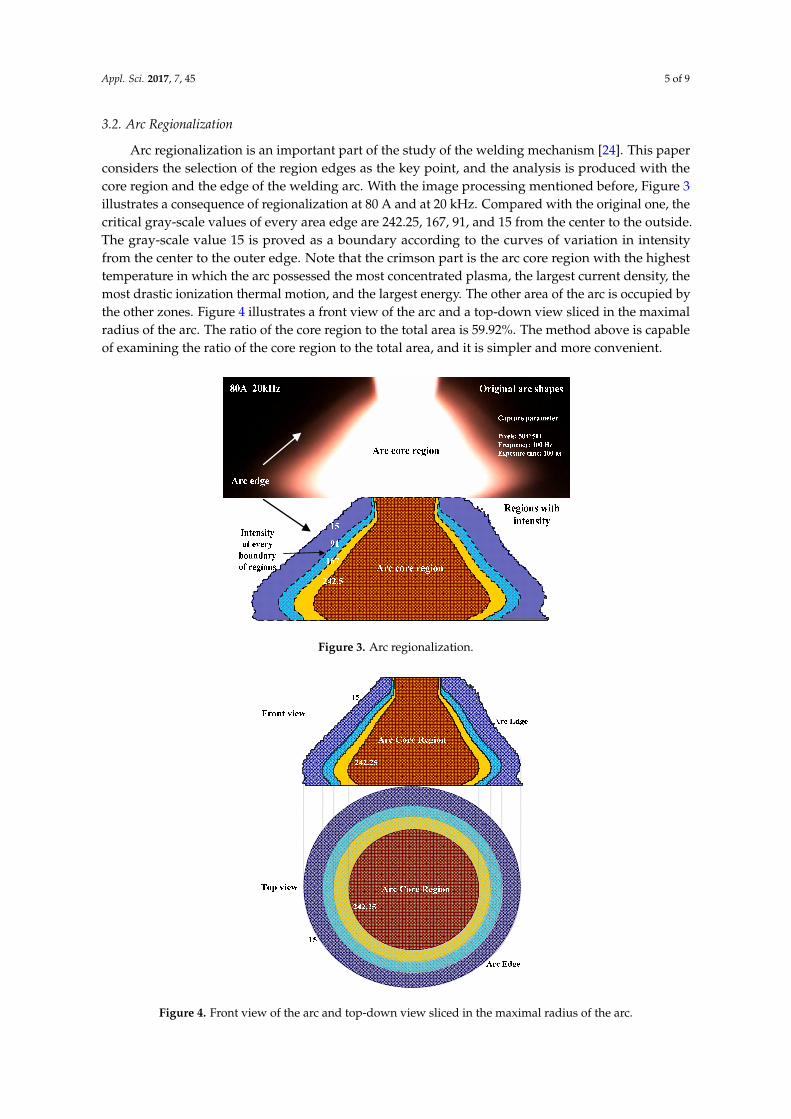
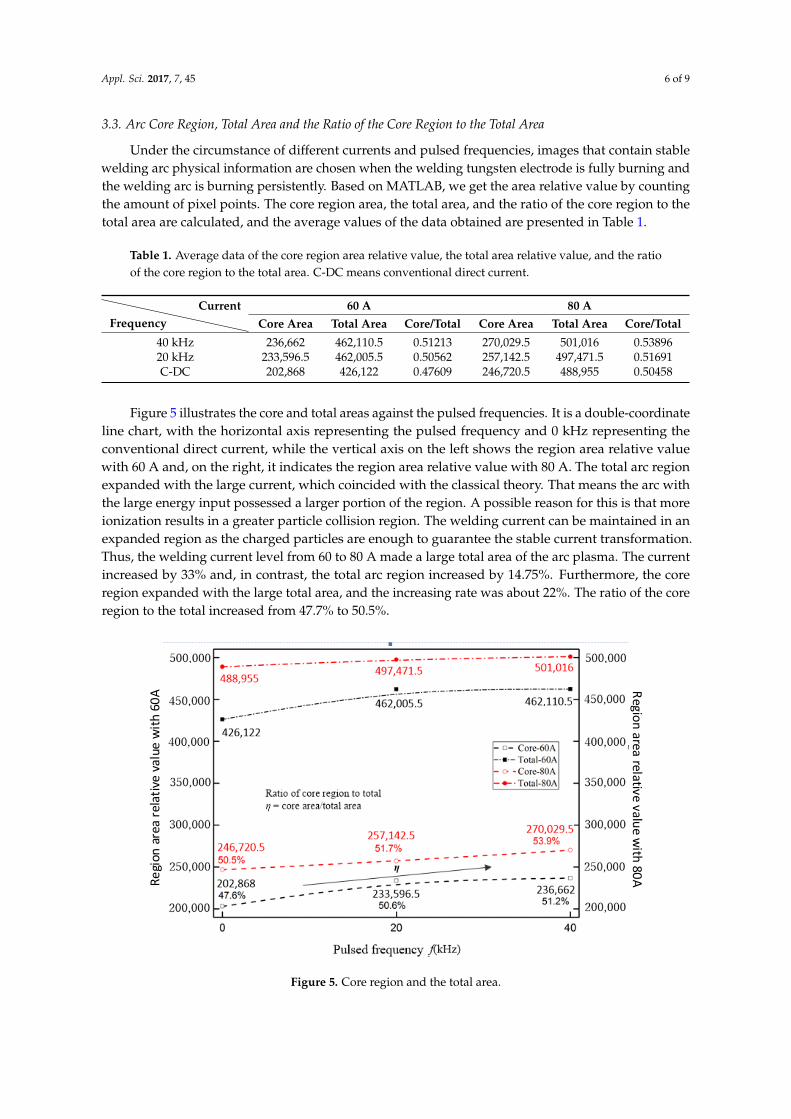
Arc regionalization is an important part of the study of the welding mechanism [24]. This paperconsiders the selection of the region edges as the key point, and the analysis is produced with thecore region and the edge of the welding arc. With the image processing mentioned before, Figure 3illustrates a consequence of regionalization at 80 A and at 20 kHz. Compared with the original one, thecritical gray-scale values of every area edge are 242.25, 167, 91, and 15 from the center to the outside.The gray-scale value 15 is proved as a boundary according to the curves of variation in intensityfrom the center to the outer edge. Note that the crimson part is the arc core region with the highesttemperature in which the arc possessed the most concentrated plasma, the largest current density, themost drastic ionization thermal motion, and the largest energy. The other area of the arc is occupied bythe other zones. Figure 4 illustrates a front view of the arc and a top-down view sliced in the maximalradius of the arc. The ratio of the core region to the total area is 59.92%. The method above is capableof examining the ratio of the core region to the total area, and it is simpler and more convenient.
Appl. Sci. 2016, 6, 430 5 of 9
Arc regionalization is an important part of the study of the welding mechanism [24]. This paper
considers the selection of the region edges as the key point, and the analysis is produced with the
core region and the edge of the welding arc. With the image processing mentioned before, Figure 3
illustrates a consequence of regionalization at 80 A and at 20 kHz. Compared with the original one,
the critical gray‐scale values of every area edge are 242.25, 167, 91, and 15 from the center to the
outside. The gray‐scale value 15 is proved as a boundary according to the curves of variation in
intensity from the center to the outer edge. Note that the crimson part is the arc core region with the
highest temperature in which the arc possessed the most concentrated plasma, the largest current
density, the most drastic ionization thermal motion, and the largest energy. The other area of the arc
is occupied by the other zones. Figure 4 illustrates a front view of the arc and a top‐down view sliced
in the maximal radius of the arc. The ratio of the core region to the total area is 59.92%. The method
above is capable of examining the ratio of the core region to the total area, and it is simpler and more
convenient.
Figure 3. Arc regionalization.
Figure 3. Arc regionalization.
Appl. Sci. 2016, 6, 430 5 of 9
Arc regionalization is an important part of the study of the welding mechanism [24]. This paper
considers the selection of the region edges as the key point, and the analysis is produced with the
core region and the edge of the welding arc. With the image processing mentioned before, Figure 3
illustrates a consequence of regionalization at 80 A and at 20 kHz. Compared with the original one,
the critical gray‐scale values of every area edge are 242.25, 167, 91, and 15 from the center to the
outside. The gray‐scale value 15 is proved as a boundary according to the curves of variation in
intensity from the center to the outer edge. Note that the crimson part is the arc core region with the
highest temperature in which the arc possessed the most concentrated plasma, the largest current
density, the most drastic ionization thermal motion, and the largest energy. The other area of the arc
is occupied by the other zones. Figure 4 illustrates a front view of the arc and a top‐down view sliced
in the maximal radius of the arc. The ratio of the core region to the total area is 59.92%. The method
above is capable of examining the ratio of the core region to the total area, and it is simpler and more
convenient.
Figure 3. Arc regionalization.
Figure 4. Front view of the arc and top-down view sliced in the maximal radius of the arc.
Appl. Sci. 2017, 7, 45 6 of 9
3.3. Arc Core Region, Total Area and the Ratio of the Core Region to the Total Area
Under the circumstance of different currents and pulsed frequencies, images that contain stablewelding arc physical information are chosen when the welding tungsten electrode is fully burning andthe welding arc is burning persistently. Based on MATLAB, we get the area relative value by countingthe amount of pixel points. The core region area, the total area, and the ratio of the core region to thetotal area are calculated, and the average values of the data obtained are presented in Table 1.
Table 1. Average data of the core region area relative value, the total area relative value, and the ratioof the core region to the total area. C-DC means conventional direct current.
FrequencyCurrent 60 A 80 A
Core Area Total Area Core/Total Core Area Total Area Core/Total
40 kHz 236,662 462,110.5 0.51213 270,029.5 501,016 0.5389620 kHz 233,596.5 462,005.5 0.50562 257,142.5 497,471.5 0.51691C-DC 202,868 426,122 0.47609 246,720.5 488,955 0.50458
Figure 5 illustrates the core and total areas against the pulsed frequencies. It is a double-coordinateline chart, with the horizontal axis representing the pulsed frequency and 0 kHz representing theconventional direct current, while the vertical axis on the left shows the region area relative valuewith 60 A and, on the right, it indicates the region area relative value with 80 A. The total arc regionexpanded with the large current, which coincided with the classical theory. That means the arc withthe large energy input possessed a larger portion of the region. A possible reason for this is that moreionization results in a greater particle collision region. The welding current can be maintained in anexpanded region as the charged particles are enough to guarantee the stable current transformation.Thus, the welding current level from 60 to 80 A made a large total area of the arc plasma. The currentincreased by 33% and, in contrast, the total arc region increased by 14.75%. Furthermore, the coreregion expanded with the large total area, and the increasing rate was about 22%. The ratio of the coreregion to the total increased from 47.7% to 50.5%.
Appl. Sci. 2016, 6, 430 6 of 9
Figure 4. Front view of the arc and top‐down view sliced in the maximal radius of the arc.
3.3. Arc Core Region, Total Area and the Ratio of the Core Region to the Total Area
Under the circumstance of different currents and pulsed frequencies, images that contain stable
welding arc physical information are chosen when the welding tungsten electrode is fully burning
and the welding arc is burning persistently. Based on MATLAB, we get the area relative value by
counting the amount of pixel points. The core region area, the total area, and the ratio of the core
region to the total area are calculated, and the average values of the data obtained are presented in
Table 1.
Table 1. Average data of the core region area relative value, the total area relative value, and the ratio
of the core region to the total area. C‐DC means conventional direct current.
Current
Frequency
60 A 80 A
Core Area Total Area Core/Total Core Area Total Area Core/Total
40 kHz 236,662 462,110.5 0.51213 270,029.5 501,016 0.53896
20 kHz 233,596.5 462,005.5 0.50562 257,142.5 497,471.5 0.51691
C‐DC 202,868 426,122 0.47609 246,720.5 488,955 0.50458
Figure 5 illustrates the core and total areas against the pulsed frequencies. It is a double‐
coordinate line chart, with the horizontal axis representing the pulsed frequency and 0 kHz
representing the conventional direct current, while the vertical axis on the left shows the region area
relative value with 60 A and, on the right, it indicates the region area relative value with 80 A. The
total arc region expanded with the large current, which coincided with the classical theory. That
means the arc with the large energy input possessed a larger portion of the region. A possible reason
for this is that more ionization results in a greater particle collision region. The welding current can
be maintained in an expanded region as the charged particles are enough to guarantee the stable
current transformation. Thus, the welding current level from 60 to 80 A made a large total area of the
arc plasma. The current increased by 33% and, in contrast, the total arc region increased by 14.75%.
Furthermore, the core region expanded with the large total area, and the increasing rate was about
22%. The ratio of the core region to the total increased from 47.7% to 50.5%.
Region
area relative value
with 60A R
egion area relative valu
e with
80A
Figure 5. Core region and the total area. Figure 5. Core region and the total area.
Appl. Sci. 2017, 7, 45 7 of 9
When the current is constant at 60 or 80 A, from conventional DC to a pulsed frequency of 20or 40 kHz, a larger core region, total area, and ratio of the core region to the total area can be found.At the 60 A current level, the absolute values were larger in the core/total regions with the increasingpulse frequency. The effect of the pulsed current was significant with the expanded core region, whichincreased by 15%, at least compared with C-GTAW (Conventional-GTAW). Furthermore, the ratioof the core region to the total area was even more than C-GTAW at the 80 A level. It needs to benoted that the differences of the absolute areas between 20 and 40 kHz were not significant. However,the ratio was 51.2% at 40 kHz, which meant a large core region. The variation of the arc total areashows the shrinkage-expansion of the arc shape. The variation of the core region reflects not only theionization thermal motion, temperature, and current density, but also the shape, force, and others;it is a sign of the transmission of energy. As for the ratio of the core region to the total area, it is theefficiency of the energy transfer from the cathode to the arc to the welding material [25]. Obviouslylarge currents can create more energy input with larger arc plasma. The ratio of the core region wasrecognized as the result of the energy concentration or arc constriction. The classical theory indicatedthe radial electromagnetic force compressed the arc plasma with a large or pulsed current. The resultsabove demonstrated the increased arc region at 20–40 kHz; however, the core region was larger thanC-GTAW. That meant a large ratio of the core region in arc plasma. We can also assume the movementof dynamically charged particles. The particles with large kinetic energy will be affected by a largeLorentz force, and they will be forced to deflect to the center of the arc plasma, which would create aregion with a large absolute energy density. Additionally, the region can be assumed to possess a largecurrent density. Significant numbers of moving particles can be predicted in this region and light, andtransferred energy reflections with collisions or other processes will be much easier to capture, andthey are displayed in Section 3.2. The authors predict that the energy input to the base metal is mostlyfrom the core region.
It can be concluded that when the pulsed current frequency is constant at 20 kHz, 40 kHz, orC-GTAW, with a current of 80 or 60 A, the arc plasma possesses a constriction phenomenon both forthe total area and the core region, a lower ratio of the core region to the total area, a lower temperature,a smaller current density, a slower ionization thermal motion, and a lower efficiency of energy transfer.When the current is constant at 60 or 80 A, from a pulsed frequency of 40 kHz to 20 kHz to C-GTAW,the arc plasma possesses the same phenomenon. Above all, the effect of the pulsed arc plasma can beconsidered as the constriction, which reflects an expanded core region. The large ratio of the core regionmeans there is energy concentration, or the enlarged area of the high energy region. This phenomenonis created by the Lorentz force which deflects the charged particles, especially for electrons that havelarge velocities. Such a deflection causes more possibilities for collisions which would create more heator higher temperatures. Thus, the heat input of the arc plasma is believed to be more effective with apulsed current, and the pulsed arc is supposed to obtain significant penetration.
4. Conclusions
Arc plasma possesses a constriction phenomenon, which is created by the Lorentz force thatdeflects the charged particles and causes more collisions, for the total area and the core region, alower ratio of the core region to the total area, a lower temperature, a smaller current density, a slowerionization thermal motion, and a lower efficiency of energy transfer. Heat input of the arc plasmais more effective with a pulsed current. Comparing the current of 80 and 60 A, 60 A responds moreobviously when switching C-GTAW to a pulsed current. Eighty ampere responds more obviously toswitching to the pulsed frequency of 20–40 kHz.
Acknowledgments: This work is supported by the National Natural Science Foundation of China under grantNo. 51405007, No. 51675031 and the Fundamental Research Funds for the Central Universities of China. Allsupport from Beijing University of Aeronautics and Astronautics is highly appreciated.
Appl. Sci. 2017, 7, 45 8 of 9
Author Contributions: Mingxuan Yang and Ling Li conceived and designed the experiments; Mingxuan Yang andLing Li performed the experiments; Mingxuan Yang and Hao Zheng analyzed the data; Hao Zheng contributedanalysis tools; Mingxuan Yang and Hao Zheng wrote the paper.
Conflicts of Interest: The authors declare no conflict of interest.
References
1. Xu, G.; Hu, J.; Tsai, H.L. Modeling 3D Plasma Arc in Gas Tungsten Arc Welding. ASME J. Manuf. Sci. Eng.2012, 134, 031001. [CrossRef]
2. Palani, P.K.; Murugan, N. Selection of parameters of pulsed current gas metal arc welding. J. Mater.Process. Technol. 2006, 172, 1–10. [CrossRef]
3. Yang, X.; Hu, J.; Pallis, J. Simulation of Gas Tungsten Arc Welding Arc in COMSOL. In Proceedings of theASME-IMECE, Houston, TX, USA, 9–15 November 2012.
4. Murphy, A.B.; Tanaka, M.; Yamamoto, K.; Tashiro, S.; Sato, T.; Lowke, J.J. Modelling of thermal plasmas forarc welding: The role of the shielding gas properties and of metal vapour. J. Phys. D Appl. Phys. 2009, 42,194006. [CrossRef]
5. Fujii, H.; Sumi, Y.; Tanaka, M. Effect of gravity on arc shape in GTA welding. J. Mater. Sci. Technol. 2003, 19,209–211.
6. Zhang, S.S.; Cao, M.Q.; Wu, D.T.; Zou, Z.D. Effects of process parameters on arc shape and penetration intwin-wire indirect arc welding. Front. Mater. Sci. China 2009, 3, 212–217. [CrossRef]
7. Cook, G.E.; El-deam, H.; Eassa, E.H. The effect of high frequency pulsing of a welding arc. IEEE Trans.Ind. Appl. 1985, 21, 1294–1299. [CrossRef]
8. Zhao, J.R.; Sun, D.; Hu, S.S. Arc behavior of high frequency pulse TIG welding arc. Trans. China Weld. Inst.1992, 13, 59–66.
9. Murphy, A.B. The effect of metal vapour in arc welding. J. Phys. D Appl. Phys. 2010, 43, 434001. [CrossRef]10. Jin, O.; Yoshisa, A.; Masayasu, N.; Mitsuo, K.; Onuma, A.; Funamoto, T. Development of a new
high-frequency, high-peak current power source for high constricted arc formation. Jpn. J. Appl. Phys.2002, 41, 5821–5826.
11. Ghosh, P.K.; Dorn, L.; Hübner, M.; Goyal, V.K. Arc characteristics and behavior of metal transfer in pulsedcurrent GMA welding of aluminum alloy. J. Mater. Process. Technol. 2007, 209, 163–175. [CrossRef]
12. Yang, M.X.; Qi, B.J.; Cong, B.Q.; Liu, F.J.; Yang, Z.; Chu, P.K. Study on electromagnetic force of arc plasma withby ultrahigh frequency pulsed GTAW of Ti-6Al-4V. IEEE Trans. Plasma Sci. 2013, 41, 2561–2568. [CrossRef]
13. Li, M.Q.; Wang, X.H.; Zou, Z.D.; Wu, J. Effect of activating flux on arc shape and arc voltage in tungsten inertgas welding. Trans. Nonferr. Met. Soc. China 2007, 17, 486–490. [CrossRef]
14. Howse, D.S.; Lucas, W. Investigation into arc constriction by active fluxes for tungsten inert gas welding.Sci. Technol. Weld. Join. 2000, 5, 189–193. [CrossRef]
15. Balasubramanian, M.; Jayabalan, V.; Balasubramanian, V. Effect of process parameters of pulsed currenttungsten inert gas welding on weld pool geometry of titanium welds. Acta Metall. Sin. 2010, 23, 312–320.
16. Qi, B.J.; Yang, M.X.; Cong, B.Q.; Liu, F.J. The effect of arc behavior on weld geometry by high frequency pulseGTAW process with 0Cr18Ni9Ti stainless steel. Int. J. Adv. Manuf. Technol. 2013, 66, 1545–1553. [CrossRef]
17. Hu, J.; Tsai, H.L. Effects of Welding Current on Droplet Generation and Arc Plasma in Gas Metal Arc Welding.J. Appl. Phys. 2006, 100, 053304. [CrossRef]
18. Pierce, S.W.; Burgardt, P.; Olson, D.L. Thermocapillary and arc phenomena in stainless steel welding. Weld. J.1999, 78, 45s–52s.
19. Zong, R.; Chen, J.; Wu, C.; Padhy, G.K. Influence of shielding gas on undercutting formation in gas metal arcwelding. J. Mater. Process. Technol. 2016, 234, 169–176. [CrossRef]
20. Faragallah, O.S.; Ibrahemb, H.M. Adaptive switching weighted median filter framework for suppressingsalt-and-pepper noise. Int. J. Electron. Commun. 2016, 70, 1034–1040. [CrossRef]
21. Hasan, S.M.A.; Ko, K. Depth edge detection by image-based smoothing and morphological operations.J. Comput. Des. Eng. 2016, 3, 191–197.
22. Xiao, T. A Study on Conductive Mechanism of TIG Welding Arc and Its Energy Distribution. Ph.D. Thesis,Beijing University of Technology, Beijing, China, 8 June 2013.
Appl. Sci. 2017, 7, 45 9 of 9
23. Xiao, X.; Xueming, H.; Yixiong, W. Comparison of temperature and composition measurement byspectroscopic methods for argon–helium arc plasma. Opt. Laser Technol. 2015, 66, 138–145. [CrossRef]
24. Zhenbo, Z.; Jianchao, G.; Jinlong, L.; Liangxian, C.; Ruihua, Z.; Xiongbo, Y.; Junjun, W.; Lifu, H.;Chengming, L. Effect of area arc distribution on diamond nucleation. J. Synth. Cryst. 2014, 43, 2515–2521.
25. Wei, Y.; Hua, Z.; Zhigang, J.; Hon, K.K.B. Multi-objective optimization of arc welding parameters: Thetrade-offs between energy and thermal efficiency. J. Clean. Prod. 2016, in press. [CrossRef]
© 2017 by the authors; licensee MDPI, Basel, Switzerland. This article is an open accessarticle distributed under the terms and conditions of the Creative Commons Attribution(CC-BY) license (http://creativecommons.org/licenses/by/4.0/).