Embed Size (px)
Citation preview
WELDING RESEARCH
-s147WELDING JOURNAL
ABSTRACT. Thick plates of Al-Cu-Li-Mg-Ag-Zr-type alloy were butt-jointwelded with pulsed gas metal arc welding(GMAW-P). The joints were made at dif-ferent pulse frequencies but using onedrop detachment per pulse (ODPP) con-dition. Effect of pulse frequency on mi-crostructure, microhardness, tensilestrength, and crack growth resistance aswell as fracture path were studied. Somelaser-welded joints of the same materialwere also made for comparison purposes.It was observed that the mechanical prop-erties of the joints made with GMAW-Pwere comparable to the laser weldedjoints as well as the ones reported in theliterature. At the same time, theGMAW-P joints showed reduction in yieldstrength with increase in pulse frequency.The fracture path also was found to be dif-ferent with specimens made at differentfrequencies.
Introduction
Every 1% of Li addition (up to the4.2% Li solubility limit) to aluminum re-duces the alloy density by about 3% andincreases the elastic modulus by about 6%L, making aluminum-lithium alloys strongcandidates for high-strength low-weightapplications like aerospace (Ref. 1).
These alloys in welded form could be usedto further lighten the structures withweight savings up to 18% (Ref. 2). In the1980s, the attraction of the light weight ofAl-Li alloys prompted development of“second generation” Al-Li alloys 2090 and8090 to replace conventional aerospace al-loys like 2024 and 7075. They containedmore than 2% of Li. They had the advan-tages of lower density, higher modulus ofelasticity, and higher fatigue life. But theyalso had disadvantages like lower short-transverse fracture toughness and higheranisotropy of tensile properties. Weldabil-ity was not considered important in devel-oping these alloys. These and other con-siderations gave rise in the late 1980s andearly 1990s to the development of alloyswith reduced Li concentration (from1–1.8%), higher Cu concentration andother alloying elements. These are thethird generation of Al-Cu-Li-Mg-Ag-ZrWeldalite™-type alloys 2094, 2095, 2195,2096, 2097, and 2197. Out of these, 2195and 2097 have been used in welded appli-cations such as cryotankage and fighteraircraft bulkhead (Ref. 3). In terms ofphysical metallurgy of these alloys, mag-nesium and copper contribute to solid so-lution and precipitation strengthening aswell as minimize precipitate free zone for-mation near grain boundaries. Strength-ening precipitates are T1 (Al2Cu Li), δ′
(Al3Li), and θ′ (Al2Cu). The β′-Al3Zr orα'-Al3(Zr,Li) precipitates act as nucle-ation sites in addition to grain refinement.Overall, Weldalite-type alloys have an ex-traordinary natural aging response typi-cally providing longitudinal tensilestrength of 590 MPa in T4 temper alongwith good weldability (Ref. 4).
Weldable high-strength alloys in thicksections could be very useful not only foraerospace applications but also for marineapplications, lightweight pressure vessels,and armored land vehicles. Hence, for ac-complishing wider application, weldabilityshould be extensively studied. Welding Li-containing aluminum alloys withprocesses like gas metal arc welding(GMAW), gas tungsten arc welding(GTAW), variable polarity plasma arcwelding (VPPA), electron beam welding(EBW), laser beam welding (LBW), resis-tance welding (RW), and friction stir weld-ing (FSW) have been reported in the lit-erature (Refs. 4–8). Even though thepower beam welding processes seem to beyielding better weldment strengths com-pared to that with arc welding processes,they have certain disadvantages like highaccuracy of joint fitup needed, transverseheat-affected zone (HAZ) tearing, largepores and high cost. Another aspect of Al-Li alloys is reduction in thermal conduc-tivity with Li addition, opening the possi-bility to weld with low-energy-densityprocesses. Therefore, for wider applica-tion, it was felt that welding these alloysusing the arc welding process in thickersections might be looked into moreclosely. The weldable Al-Cu-Li-Mg-Ag-Zr-type alloys were chosen for the investi-gations, but the formation of a joint weak-ening equiaxed grain zone (EQZ) at theweld interface (Ref. 9) is an importantissue to be addressed in these alloys.Gutierrez et al. (Ref. 10) proposed a
SUPPLEMENT TO THE WELDING JOURNAL, JUNE 2007Sponsored by the American Welding Society and the Welding Research Council
KEYWORDS
Aluminum-LithiumAl-LiGas Metal ArcPulsed ArcPulse FrequencyAluminum Alloys
Tensile and Fracture Behavior of Pulsed GasMetal Arc-Welded Al-Cu-Li
At a given mean current, the pulse frequency affects the yield strength of pulsedgas metal arc-welded Al-Cu-Li alloy
BY G. PADMANABHAM, M. SCHAPER, S. PANDEY, AND E. SIMMCHEN
G. PADMANABHAM ([email protected]) is scien-tist-G, International Advanced Research Center forPowder Metallurgy & New Materials, Hyderabad,India. M. SCHAPER ([email protected]) is professor, Institute of Mate-rials Science, Dresden University of Technology,Dresden, Germany. S. PANDEY ([email protected]) is associate professor of Me-chanical Engineering, Indian Institute of Technol-ogy, New Delhi, India. E. SIMMCHEN([email protected]) is sci-entist, Institute of Materials Science, Dresden Uni-versity of Technology, Dresden, Germany.
Padmanabham layout NEW:Layout 1 5/10/07 2:17 PM Page 147
WELDING RESEARCH
JUNE 2007, VOL. 86-s148
mechanism for formation of the EQZ andpointed out that the narrow liquid layerthat forms into EQZ could be eliminatedby enhanced weld pool stirring. In anotherstudy using a multigravity research weld-ing system (MGRWS), elevated gravitylevels resulted in elimination of the EQZby promoting rapid mixing throughout theweld pool and dissolution of precipitates,which are believed to be responsible forEQZ formation (Ref. 11).
Gas metal arc welding (GMAW)comes as a preliminary choice when weld-
ing thicker sectionswith high productivity.But it has certain disad-vantages like very highheat input, which mayresult in wide heat-af-fected zone (HAZ).Pulsed gas metal arcwelding (GMAW-P) isknown to provide spraytransfer conditions atrelatively lower meancurrents viz., currents below the spray transition current and for
a given heat input per unit length of weldthe pulsed arc gives a narrower and deeperfusion zone compared with steadyGMAW operation, and the HAZ issmaller with less loss of alloy elements dueto volatilization (Ref. 12). In GMAW-P,controlled metal transfer is possible at lowmean currents (Refs. 13, 14). The pulseparameters can be adjusted to control thedroplet transfer mode, heat input, dropletsize, or droplet velocities for differentwelding situations (Ref. 15). This type offlexibility is not possible for conventionalGMAW. Welding wire melt-off rate perampere is more in GMAW-P compared tosteady GMAW above the transition cur-rent, as proportionately more heat istransferred to the filler metal in GMAW-P than in steady GMAW (Ref. 16). Thismeans better heat transfer efficiency intothe weld pool. Additionally, in GMAW-P,high pulse currents result in high electro-magnetic forces, which in turn may pro-mote mixing in the bulk of the weld pool(Ref. 17). The filler metal added to thecenter of the top surface can be quicklytransferred to the bottom of the weld pool,then pushed up to the top surface alongthe fusion boundary and finally drivenback to the center (Ref. 18). Enhancedweld metal convection/fluid flow may af-fect the fusion zone (including EQZ).
Accordingly, experiments were done by
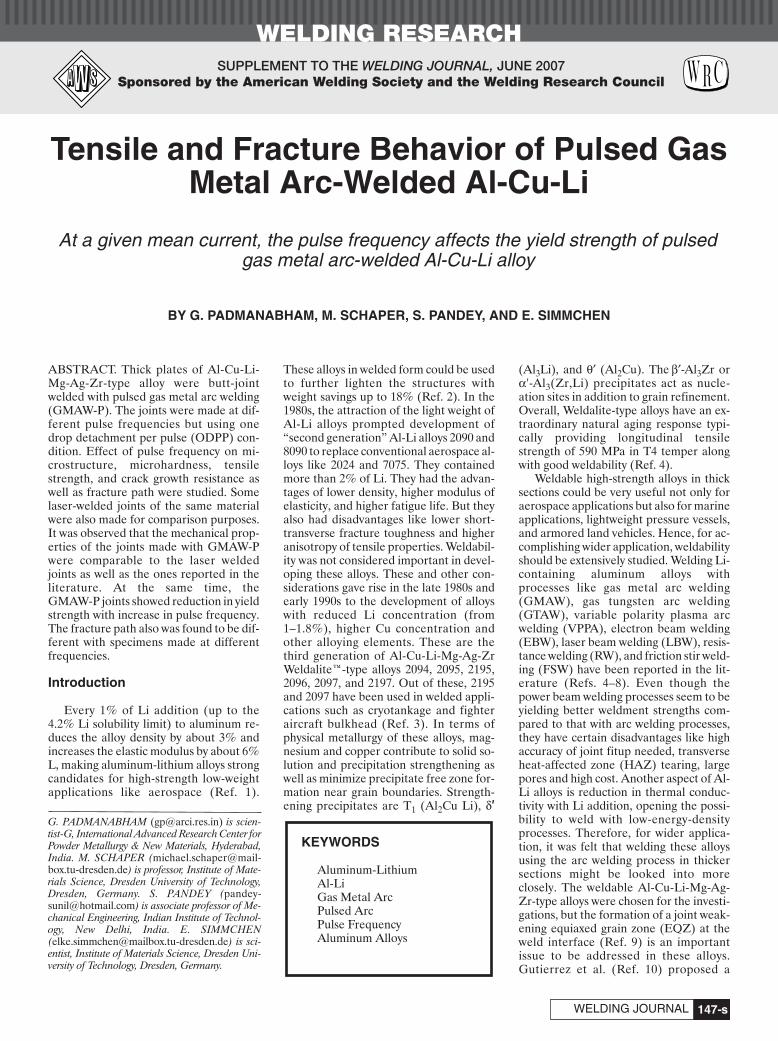
Fig. 1 — Schematic of pulsed current structure in GMAW-P showing onedroplet detachment per pulse (ODPP) condition.
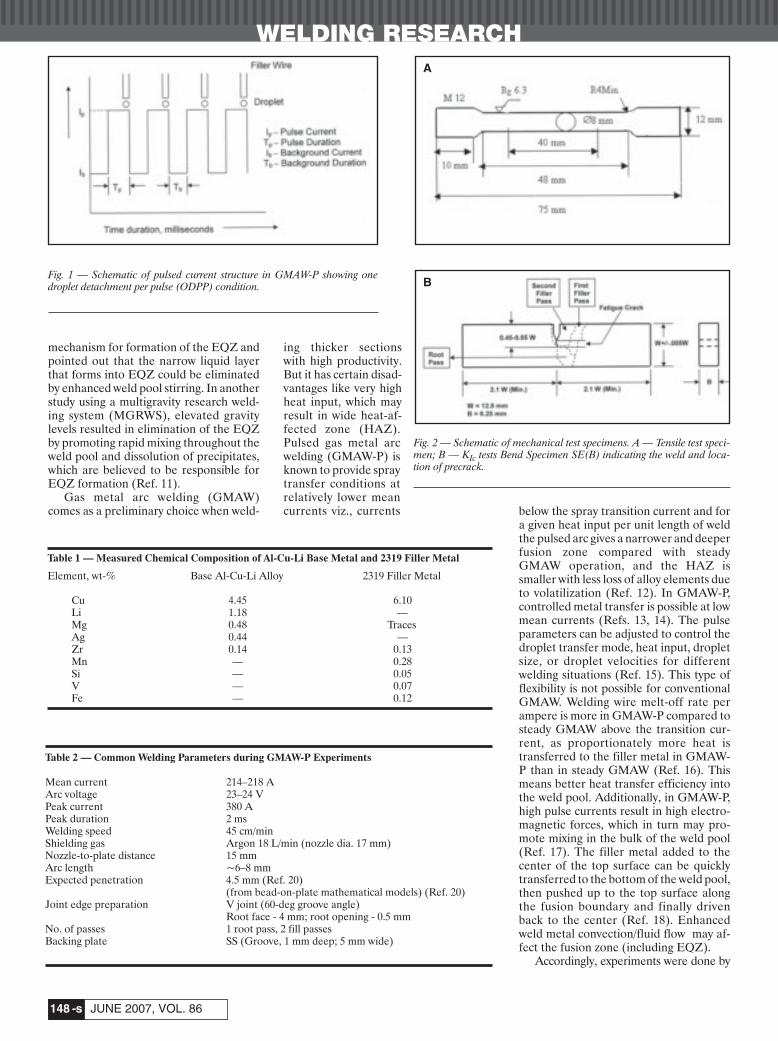
Fig. 2 — Schematic of mechanical test specimens. A — Tensile test speci-men; B — KIc tests Bend Specimen SE(B) indicating the weld and loca-tion of precrack.
Table 1 — Measured Chemical Composition of Al-Cu-Li Base Metal and 2319 Filler Metal
Element, wt-% Base Al-Cu-Li Alloy 2319 Filler Metal
Cu 4.45 6.10Li 1.18 —Mg 0.48 TracesAg 0.44 —Zr 0.14 0.13Mn — 0.28Si — 0.05V — 0.07Fe — 0.12
Table 2 — Common Welding Parameters during GMAW-P Experiments
Mean current 214–218 AArc voltage 23–24 VPeak current 380 APeak duration 2 msWelding speed 45 cm/minShielding gas Argon 18 L/min (nozzle dia. 17 mm)Nozzle-to-plate distance 15 mmArc length ~6–8 mmExpected penetration 4.5 mm (Ref. 20)
(from bead-on-plate mathematical models) (Ref. 20)Joint edge preparation V joint (60-deg groove angle)
Root face - 4 mm; root opening - 0.5 mmNo. of passes 1 root pass, 2 fill passesBacking plate SS (Groove, 1 mm deep; 5 mm wide)
A
B
Padmanabham layout NEW:Layout 1 5/10/07 2:18 PM Page 148
WELDING RESEARCH
-s149WELDING JOURNAL
varying metal droplet transfer frequencywith the pulse frequency. Varying pulse fre-quency here means changing the pulsestructure keeping the mean current con-stant, so that the effect of pulse frequencywill be known. Pulse structure at a givenmean current has insignificant influence onwire feed rate, hence similar in overall heatinput into the weldment (Ref. 19). Eventhough GMAW-P is generally used forwelding thin plates, it has been shown to beuseful in welding thicker plates of Al-Cu-Liand that the pulse parameters had some ef-fect on bead geometry and microstructureof the welded joints (Refs. 20, 21). While thegeneral effects of pulsing at various fre-quencies could be applicable to other alloysalso, the effect on EQZ was of interest in thecase of the Al-Cu-Li alloy being investi-gated in this study. In view of the above,GMAW-P seemed to have promise in termsof metallurgical and technological advan-tages for this type of alloy, including lowcost. Therefore, investigations on weldingof thick plates of Al-Cu-Li-Mg-Ag-Zr alloyswith GMAW-P and some laser welding ex-periments for comparison were done.Hardness measurements, tensile tests,metallography, fractography, and a fewfracture toughness and fatigue tests werecarried out.
Experimental Details
In this experiment, the base metal was13.7 × 50 × 200 mm and made of an ex-perimental alloy (Table 1) in the W and T6conditions. The welding wire was 1.6-mm-diameter 2319 alloy (Table 1).
The recommended welding parame-ters and joint design for welding 13.7-mm-thick aluminum plates with GMAW (Ref.22) is a single-V groove of 60 deg with abacking plate. It prescribes a root face ofabout 1.5–2.5 mm. But higher root thick-nesses have been successfully used for alu-minum alloys (Ref. 23) and higher pene-tration was observed in GMAW-P (Ref.20). So, a root face dimension of 4 mm waschosen with a view to minimizing fillermetal dilution. The base metal plates weredry machined to obtain necessary edgepatterns. Surface layers up to 0.2 mm wereremoved from the locations of welding.The plates were held in position by clamp-ing in the middle of the length direction ofthe plates with one clamp on each side.Clamping was used during all the weldpasses. While this helps in maintaininggood ground contact and keeping the twoparts in position, it may have resulted inresidual stresses. Welding was carried outin the rolling direction of the plates withina few hours of edge preparation.
The parameters for GMAW-P werecarried out with direct current (DC) elec-trode positive polarity (DCEP) using a
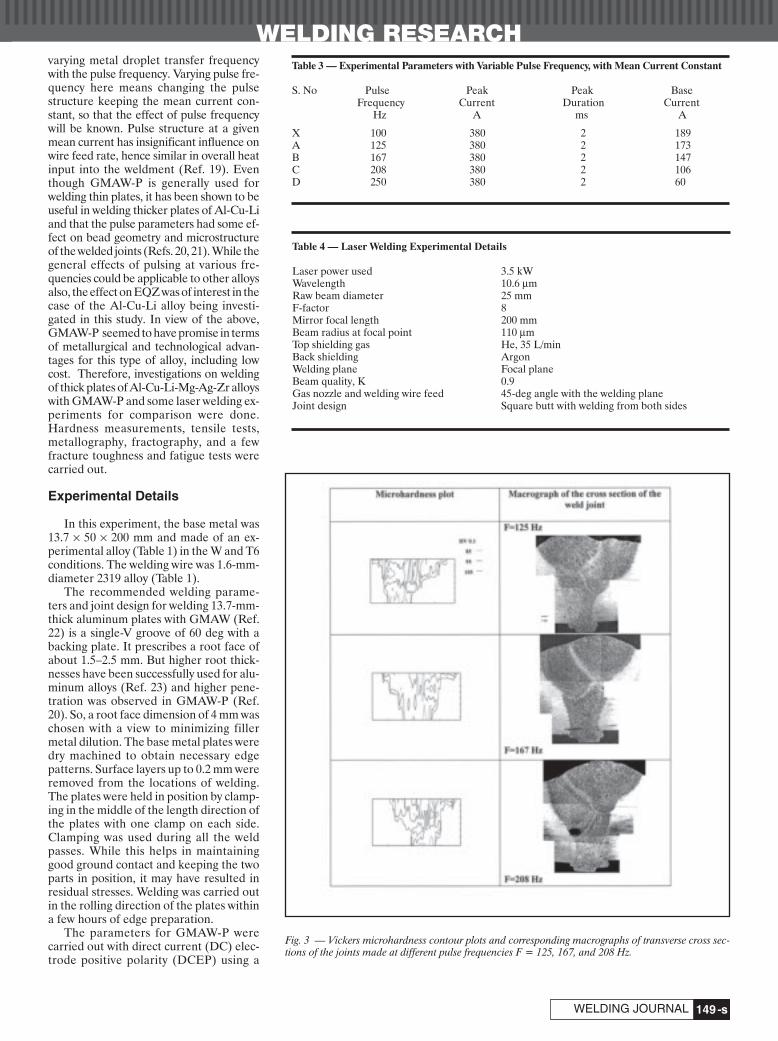
Fig. 3 — Vickers microhardness contour plots and corresponding macrographs of transverse cross sec-tions of the joints made at different pulse frequencies F = 125, 167, and 208 Hz.
Table 4 — Laser Welding Experimental Details
Laser power used 3.5 kWWavelength 10.6 μmRaw beam diameter 25 mmF-factor 8Mirror focal length 200 mmBeam radius at focal point 110 μmTop shielding gas He, 35 L/minBack shielding ArgonWelding plane Focal planeBeam quality, K 0.9Gas nozzle and welding wire feed 45-deg angle with the welding planeJoint design Square butt with welding from both sides
Table 3 — Experimental Parameters with Variable Pulse Frequency, with Mean Current Constant
S. No Pulse Peak Peak BaseFrequency Current Duration Current
Hz A ms A
X 100 380 2 189A 125 380 2 173B 167 380 2 147C 208 380 2 106D 250 380 2 60
Padmanabham layout NEW:Layout 1 5/10/07 2:19 PM Page 149

WELDING RESEARCH
JUNE 2007, VOL. 86-s150
transistorized power source. The outputV/A slope of the welding power sourcewas set in constant current condition.Mechanized GMAW station was em-ployed for depositing weld beads. An arclength of about 6–8 mm was maintainedduring all the experiments through man-ual control of wire feed speed. Based onsome preliminary experimental trials andparameters as per handbooks, welding pa-rameters as given in Table 2 were chosen.Joints were made in three passes: one rootpass and two filler passes. Between thepasses, enough time was allowed to bringthe specimens to ambient temperature.Throughout the experimentation, theoverall heat input per unit length was keptconstant by keeping the mean current, arcvoltage, and welding speed the same. Onedrop per pulse (ODPP) mode of detach-ment with droplet detachment at the endof the pulse was used — Fig. 1. Pulse pa-rameters were fixed and background con-ditions varied based on the calculated pa-rameters determined using the followingequations (Ref. 20):
Wf (m/min) (wire feed rate)= 0.0258 (Im) (1)
Equation 1 is an experi-mentally determined re-lation between weldingwire feed rate and meancurrent to meet themelt-off criterion to ob-tain a stable arc (viz.,sufficient amount ofwelding wire is fedequaling the meltingduring welding so that astable welding arc ismaintained). Using thisequation, the requiredwire feed rate (Wf) is de-termined for a particu-lar mean current (Im), ofwhich Im = 215 A andWf = 5.6 m/min wereused in all the experi-ments. In spray transfermode, metal transfer
with the diameter of the transferringdroplet equal to or less than the diameterof the welding wire is preferred. Assumingnegligible material losses due to spatter,the volume of wire melted (Wf × π r2
wherein r is the radius of the welding wire)divided by the volume of single droplet(4/3 π rd
3 where rd is the radius of thedroplet) will yield the frequency (F),which is the same as pulse frequency F incase of ODPP condition of metal transfer.This can be represented as Equation 2below.
Wf × π r2 = F × 4/3 π rd3 (2)
Relation between pulse frequency F, totalcycle time T, pulse duration Tp, and basecurrent duration Tb is given by Equations3 and 4.
F (pulse frequency) = 1/T (3)
T (Total pulse cycle time) = Tp+Tb (4)
Using Equations 1–4, for a particularmean current and possible pulse frequen-cies (consequently total pulse cycle time)for droplet radius equal to or less than thewire radius can be determined. The rela-tion between Ip and Tp (pulse current andduration) is known to follow a power lawfor achieving the ODPP condition asshown in Fig. 1. This relation experimen-tally determined for the 2319 alloy weld-ing wire (Ref. 20) is as follows:
Ip1.4 Tp = 8857 A1.4.ms (5)
For a given pulse current, pulse durationcan be determined by Equation 5. At agiven mean current and pulse frequency,using Equations 1–5, values of Ip, Tp, andTb values can be calculated. The meancurrent and pulse parameters are relatedas per Equation 6 below.
Im (Mean Current) = (IpTp+IbTb)/T (6)
Using Equation 6 the value of Tb can bedetermined.
Based on the above relations and cal-culation using these equations, theGMAW-P parameters for various possiblesets of experiments (X, A, B, C, and D) fordifferent pulse frequencies for a conditionwhere the detached droplet diameter isequal to or less than the diameter of thewelding wire are given in Table 3. For thesame mean current, pulse frequency is in-creased from a particular value. This im-plies detachment of more droplets keep-ing the mean current/wire feed rateconstant. The aim was to vary the metaltransfer conditions keeping the mean cur-rent constant. As the welding speed alsowas kept constant in all the cases, the over-all heat input into the weld is expected tobe the same. While using parameters X inTable 3, the voltage transient showedsome droplet detachments during thebackground conditions as well. The weld-ing conditions also were not good in termsof arc stability and noise. It was thoughtthat background current being in the spray
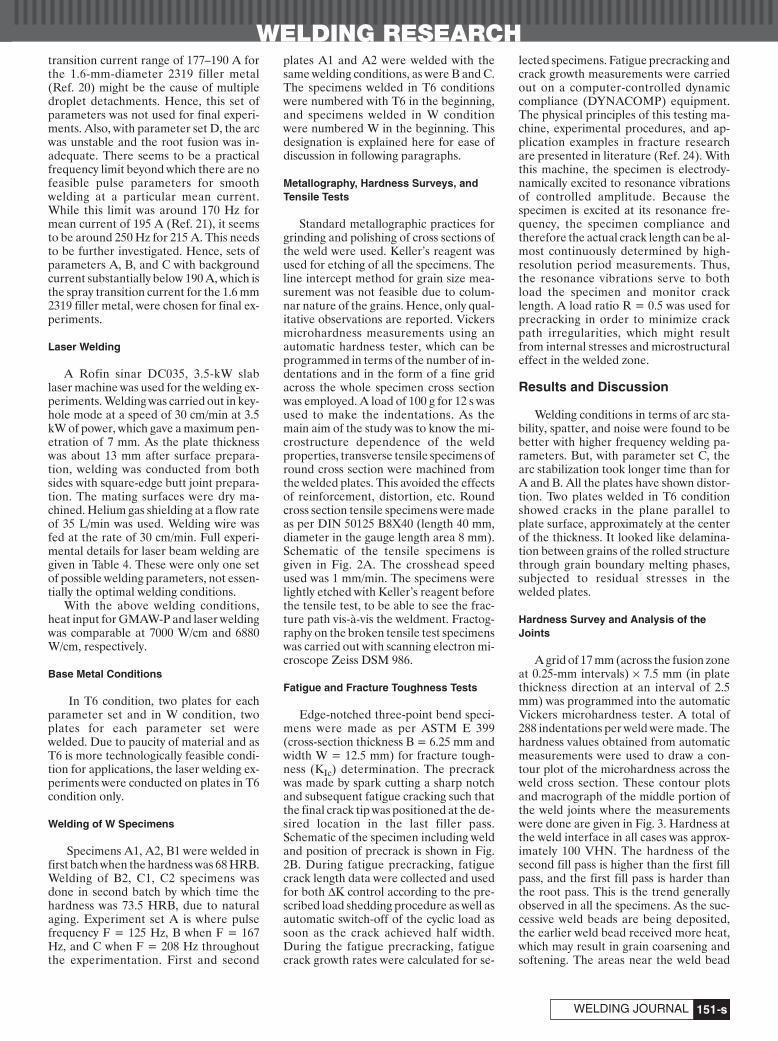
Fig. 4 — Microstructure near fusion boundary of root pass weld (crosssection) in as-welded condition for various pulse frequencies. A — 125Hz; B — 167 Hz; C — 208 Hz. EQZ = Fine equiaxed grain zone; PMZ= partially melted zone; CLZ = columnar zone; and HAZ = heat-affected zone.
A B
C
Padmanabham layout NEW:Layout 1 5/10/07 2:19 PM Page 150
WELDING RESEARCH
-s151WELDING JOURNAL
transition current range of 177–190 A forthe 1.6-mm-diameter 2319 filler metal(Ref. 20) might be the cause of multipledroplet detachments. Hence, this set ofparameters was not used for final experi-ments. Also, with parameter set D, the arcwas unstable and the root fusion was in-adequate. There seems to be a practicalfrequency limit beyond which there are nofeasible pulse parameters for smoothwelding at a particular mean current.While this limit was around 170 Hz formean current of 195 A (Ref. 21), it seemsto be around 250 Hz for 215 A. This needsto be further investigated. Hence, sets ofparameters A, B, and C with backgroundcurrent substantially below 190 A, which isthe spray transition current for the 1.6 mm2319 filler metal, were chosen for final ex-periments.
Laser Welding
A Rofin sinar DC035, 3.5-kW slablaser machine was used for the welding ex-periments. Welding was carried out in key-hole mode at a speed of 30 cm/min at 3.5kW of power, which gave a maximum pen-etration of 7 mm. As the plate thicknesswas about 13 mm after surface prepara-tion, welding was conducted from bothsides with square-edge butt joint prepara-tion. The mating surfaces were dry ma-chined. Helium gas shielding at a flow rateof 35 L/min was used. Welding wire wasfed at the rate of 30 cm/min. Full experi-mental details for laser beam welding aregiven in Table 4. These were only one setof possible welding parameters, not essen-tially the optimal welding conditions.
With the above welding conditions,heat input for GMAW-P and laser weldingwas comparable at 7000 W/cm and 6880W/cm, respectively.
Base Metal Conditions
In T6 condition, two plates for eachparameter set and in W condition, twoplates for each parameter set werewelded. Due to paucity of material and asT6 is more technologically feasible condi-tion for applications, the laser welding ex-periments were conducted on plates in T6condition only.
Welding of W Specimens
Specimens A1, A2, B1 were welded infirst batch when the hardness was 68 HRB.Welding of B2, C1, C2 specimens wasdone in second batch by which time thehardness was 73.5 HRB, due to naturalaging. Experiment set A is where pulsefrequency F = 125 Hz, B when F = 167Hz, and C when F = 208 Hz throughoutthe experimentation. First and second
plates A1 and A2 were welded with thesame welding conditions, as were B and C.The specimens welded in T6 conditionswere numbered with T6 in the beginning,and specimens welded in W conditionwere numbered W in the beginning. Thisdesignation is explained here for ease ofdiscussion in following paragraphs.
Metallography, Hardness Surveys, andTensile Tests
Standard metallographic practices forgrinding and polishing of cross sections ofthe weld were used. Keller’s reagent wasused for etching of all the specimens. Theline intercept method for grain size mea-surement was not feasible due to colum-nar nature of the grains. Hence, only qual-itative observations are reported. Vickersmicrohardness measurements using anautomatic hardness tester, which can beprogrammed in terms of the number of in-dentations and in the form of a fine gridacross the whole specimen cross sectionwas employed. A load of 100 g for 12 s wasused to make the indentations. As themain aim of the study was to know the mi-crostructure dependence of the weldproperties, transverse tensile specimens ofround cross section were machined fromthe welded plates. This avoided the effectsof reinforcement, distortion, etc. Roundcross section tensile specimens were madeas per DIN 50125 B8X40 (length 40 mm,diameter in the gauge length area 8 mm).Schematic of the tensile specimens isgiven in Fig. 2A. The crosshead speedused was 1 mm/min. The specimens werelightly etched with Keller’s reagent beforethe tensile test, to be able to see the frac-ture path vis-à-vis the weldment. Fractog-raphy on the broken tensile test specimenswas carried out with scanning electron mi-croscope Zeiss DSM 986.
Fatigue and Fracture Toughness Tests
Edge-notched three-point bend speci-mens were made as per ASTM E 399(cross-section thickness B = 6.25 mm andwidth W = 12.5 mm) for fracture tough-ness (KIc) determination. The precrackwas made by spark cutting a sharp notchand subsequent fatigue cracking such thatthe final crack tip was positioned at the de-sired location in the last filler pass.Schematic of the specimen including weldand position of precrack is shown in Fig.2B. During fatigue precracking, fatiguecrack length data were collected and usedfor both ΔK control according to the pre-scribed load shedding procedure as well asautomatic switch-off of the cyclic load assoon as the crack achieved half width.During the fatigue precracking, fatiguecrack growth rates were calculated for se-
lected specimens. Fatigue precracking andcrack growth measurements were carriedout on a computer-controlled dynamiccompliance (DYNACOMP) equipment.The physical principles of this testing ma-chine, experimental procedures, and ap-plication examples in fracture researchare presented in literature (Ref. 24). Withthis machine, the specimen is electrody-namically excited to resonance vibrationsof controlled amplitude. Because thespecimen is excited at its resonance fre-quency, the specimen compliance andtherefore the actual crack length can be al-most continuously determined by high-resolution period measurements. Thus,the resonance vibrations serve to bothload the specimen and monitor cracklength. A load ratio R = 0.5 was used forprecracking in order to minimize crackpath irregularities, which might resultfrom internal stresses and microstructuraleffect in the welded zone.
Results and Discussion
Welding conditions in terms of arc sta-bility, spatter, and noise were found to bebetter with higher frequency welding pa-rameters. But, with parameter set C, thearc stabilization took longer time than forA and B. All the plates have shown distor-tion. Two plates welded in T6 conditionshowed cracks in the plane parallel toplate surface, approximately at the centerof the thickness. It looked like delamina-tion between grains of the rolled structurethrough grain boundary melting phases,subjected to residual stresses in thewelded plates.
Hardness Survey and Analysis of theJoints
A grid of 17 mm (across the fusion zoneat 0.25-mm intervals) × 7.5 mm (in platethickness direction at an interval of 2.5mm) was programmed into the automaticVickers microhardness tester. A total of288 indentations per weld were made. Thehardness values obtained from automaticmeasurements were used to draw a con-tour plot of the microhardness across theweld cross section. These contour plotsand macrograph of the middle portion ofthe weld joints where the measurementswere done are given in Fig. 3. Hardness atthe weld interface in all cases was approx-imately 100 VHN. The hardness of thesecond fill pass is higher than the first fillpass, and the first fill pass is harder thanthe root pass. This is the trend generallyobserved in all the specimens. As the suc-cessive weld beads are being deposited,the earlier weld bead received more heat,which may result in grain coarsening andsoftening. The areas near the weld bead
Padmanabham layout NEW:Layout 1 5/9/07 3:50 PM Page 151

WELDING RESEARCH
-s152
-
JUNE 2007, VOL. 86
interface experience this effect more se-verely. The lowest hardness was observedin the middle of the root pass in all thespecimens. With the specimen welded at125 Hz, low hardness was also observed infirst fill pass adjacent to the interface withsecond fill pass as well as in the middle ofthe weld bead. With the specimen weldedat a frequency of 167 Hz, the lowest hard-
ness was observed atthe interface of two fillpasses, in the first fillpass, as well as inter-face of root pass andfirst fill pass and in theroot pass. The sametrend was observed inthe specimen made at208 Hz. So, the inter-faces between passescould be the lowstrength areas in thejoints.
Porosity was ob-served in all the weld-ments. The second fillpass was deposited
after cleaning the top of the root and thefirst fill pass with a stainless steel wire brush.This amount of cleaning was perhaps notenough for these alloys. A large irregularpore was observed with the specimenwelded at 208 Hz. As mentioned above,while welding the specimen at this pulse fre-quency, there was some instability in the arc,which could have resulted in air aspiration
resulting in such a pore. The laser weldedspecimens had pores of irregular shape upto 2 mm in size.
Microstructure
The microstructures of the weld beadcross section near the weld interface of theroot pass made at different pulse frequen-cies are shown in Fig. 4. Grain growth andrecrystallization is seen in the heat-af-fected zone (HAZ). The zone immedi-ately adjacent to the fusion zone is identi-fied as partially melted zone (PMZ), andit had some pores. Specimen A showsmore severely affected PMZ. The first re-gion within the fusion zone on the weld in-terface contains fine equiaxed grains. Thisis the EQZ. Beyond this EQZ, into the fu-sion zone the microstructure is dendritic,typical of weld microstructures. The EQZis only 2–3 grains thick, and in specimen C,bands of EQZ were seen in the fusionzone — Fig. 5. The location where thesebands were observed showed absence ofthe EQZ at the weld interface. This is sim-ilar to that observed in the bead-on-plate
Fig. 5 — EQZ bands seen in the body of the weld in specimen made at pulsefrequency 208 Hz. A — Low magnification showing more EQZ bands; Band C — higher magnification of some EQZ bands.
Fig. 6 — Microstructure of cross section of weld made at F = 125 Hz. A— Boundaries of heat-affected zone of base metal (HAZ) – root pass(RP) – first fill pass (FFP); B — boundaries of root pass – first fill pass –last fill pass (LFP).
B
A
C
A
B
Padmanabham layout NEW:Layout 1 5/10/07 2:20 PM Page 152
-s153WELDING JOURNAL
WELDING RESEARCHTable 5 — Tensile Test Results and Other Observations on Failure Path and Visual Examination of Presence of Pores
Specimen No. YS, MPa UTS, MPa % Elong. Position of Failure/Fracture Path and Other Observations
Frequency = 125 Hz
T6A1-S1 210 255 0.65 Fracture surface showed two large pores of up to 1 mm dia.T6A1-S2 227 323 2.17 Weld interface – crown side
Weld metal – root sideT6A1-S3 213 306 1.9 Weld interface – crown side
Weld metal and weld interface – root side,T6A2-S1 215 314 2.14 Weld metal – crown side (but could be on weld interface of two face passes)
Weld interface – root sideT6A2-S2 230 309 1.4 Fusion zone – crown side and root side,
But at one place where there was a pore, it was on weld interface.T6A2-S3 229 278 0.72 Fusion zone – crown side and root side,
but at one place where there was a pore, it was on weld interface.WA1S1 237 316 2.21 Through last fill pass to weld interface and along weld interface on root passWA1S2 244 309 1.32 Through second bead and weld interface of root passWA2S1 241 302 1.25 Through last bead to its weld interface and through weld interface of root passWA2S2 230 273 0.62 Through first fill pass weld interface with last fill pass and through root pass
Frequency = 167 Hz
T6B1-S1 205 315 3 Weld metal – crown sideWeld interface – root side
T6B1-S2 230 311 1.57 Through weld metal on the root side. It went through fusion zone for somedistance but one end of the fracture seems to on the weld interface.
T6B1-S3 216 279 0.93 Same as aboveT6B2-S1 213 305 2 Observable minor porosity on the specimen surface. Fracture path
predominantly on weld interface.T6B2-S2 205 261 1 Through weld metal on crown side ending on weld interface on the root side.T6B2-S3 216 275 0.86 Fusion zone on crown side extending into weld interface on root side. On root
side, fracture seemed to have gone into base metal as well.T6B2-S4 208 276 1.1 Crown side – fusion zone (could be on weld interface of two face passes)
Root side – weld interfaceWB1-S1 212 334 4.13 Through first face pass up to weld interface with base metal and through weld
interface of root passWB1-S2 204 323 2.18 Same as aboveWB2-S1 205 289 2.1 Mostly through fusion zone, across the large poresWB2S2 218 324 2.94 Through first face pass to weld interface with base metal and along the weld
interface up to end of root pass
Frequency = 208 Hz
T6C1-S2 — — — Fusion defect in the specimen. Not suitable for testing.T6C1-S3 203 296 1.9 Two large pores on fracture surface. Fracture path predominantly in fusion zone.T6C1-S4 — — — Fusion defect in the specimenT6C2-S1 Fusion defect in the specimen. Not suitable for testing.T6C2-S2 210 326 3.36 One large pore of dia. 1 mm in the fracture surface. Fracture through fusion zone
on crown side and weld interface root side.T6C2-S3 205 323 3.68 Fracture path similar to T6C2-S2 aboveT6C2-S4 200 289 One pore of 0.5 mm dia.
Crown side – fusion zoneRoot side – weld interface
WC1-S1 207 291 1.94 Fracture through first face pass and through root pass. Path seems to be decidedby presence of pores
WC1-S2 210 281 1.89 Same as aboveWC2-S1 208 265 1.69 Same as aboveWC2-S2 214 296 1.89 Same as above and ending on weld interface of root pass
Laser Welded Specimens
T6A-S1 253 317 1.6 Generally through fusion zone and large pores, touched the weld interface rarelyT6A-S2 241 310 1.59 Same as aboveT6B-S1 249 299 1.29 Same as aboveT6B-S2 246 316 1.74 Same as above
Padmanabham layout NEW:Layout 1 5/10/07 2:21 PM Page 153
WELDING RESEARCH
JUNE 2007, VOL. 86-s154
Fig. 7 — Microstructure in the middle of different weld passes in the welds made at different frequencies. A — F = 125 Hz; B — 167 Hz; C — 208 Hz.
Root Pass First Filler Pass Last Filler Pass
A
B
C
A
B
C
A
B
C
Table 6 — Average Transverse Tensile Properties of As-Welded Joints Made of GMAW-P at Different Pulse Frequencies and Laser Welding
Base Metal Condition Pulse Freq. Hz Yield Stress, MPa Fracture Stress, MPa % Elongation on 40-mm Gauge Length
Pulsed GMAW
T6 125 221 298 1.5167 213 289 1.5208 204 309 2.72
W 125 238 300 1.35167 210 318 2.84208 210 283 1.85
Laser Welded
T6 247 310 1.55
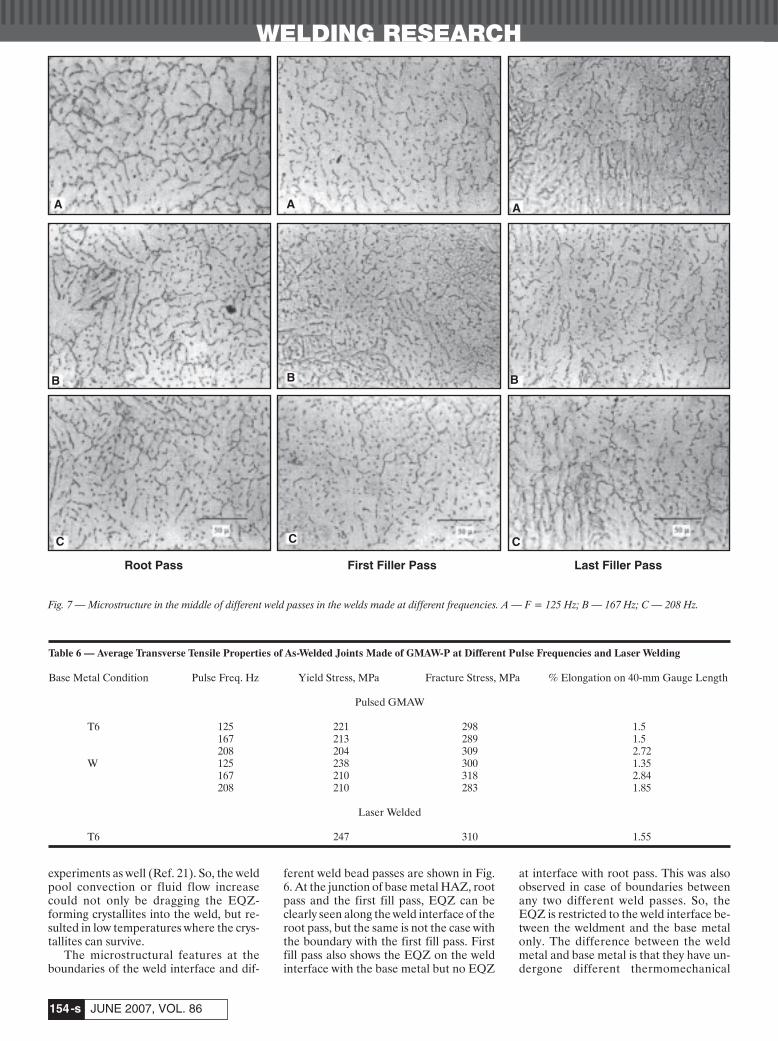
experiments as well (Ref. 21). So, the weldpool convection or fluid flow increasecould not only be dragging the EQZ-forming crystallites into the weld, but re-sulted in low temperatures where the crys-tallites can survive.
The microstructural features at theboundaries of the weld interface and dif-
ferent weld bead passes are shown in Fig.6. At the junction of base metal HAZ, rootpass and the first fill pass, EQZ can beclearly seen along the weld interface of theroot pass, but the same is not the case withthe boundary with the first fill pass. Firstfill pass also shows the EQZ on the weldinterface with the base metal but no EQZ
at interface with root pass. This was alsoobserved in case of boundaries betweenany two different weld passes. So, theEQZ is restricted to the weld interface be-tween the weldment and the base metalonly. The difference between the weldmetal and base metal is that they have un-dergone different thermomechanical
Padmanabham layout NEW:Layout 1 5/10/07 2:22 PM Page 154
WELDING RESEARCH
-s155WELDING JOURNAL
C
B
A A
B
C
Fig. 8 — Microstructure at the boundary of root pass (RP) and first fill pass(FFP) of welds made at different frequencies. A — 125 Hz; B — 167 Hz; C— 208 Hz.
Fig. 9 — Microstructure at the boundary of first fill pass (FFP) and last fill pass(LFP) of welds made at different frequencies. A — 125 Hz; B —167 Hz; C —208 Hz.
processes. The base metal has a rolled andheat-treated structure and the weld metala cast structure solidified from high weld-ing temperatures. The EQZ grains areknown to form through a heterogeneous
nucleation mechanism aided by Al3Zr andAl3(ZrxLi1-x) phases. These phases do notsurvive temperatures above 643°C.Hence, the fusion zone, which has solidi-fied from high temperatures, is not ex-
pected to have them. So, the differencebetween base metal and a solidified weldbead is the presence and absence of theseheterogeneous nucleation sites. Hence, atthe fusion boundary with the base metal,
Padmanabham layout NEW:Layout 1 5/10/07 2:22 PM Page 155
WELDING RESEARCH
JUNE 2007, VOL. 86-s156
the EQZ could form and at the fusionboundary between two weld passes itcould not form. This result is similar tothat reported by other workers as well(Refs. 10, 30).
Microstructures in the middle of the dif-ferent passes for specimens made at dif-ferent frequencies are given in Fig. 7A, B,C. In the first fill pass and the last pass, itis observed that the higher frequency spec-imen shows coarser dendritic structure(subgrain microstructure) than the lowerfrequency specimen.
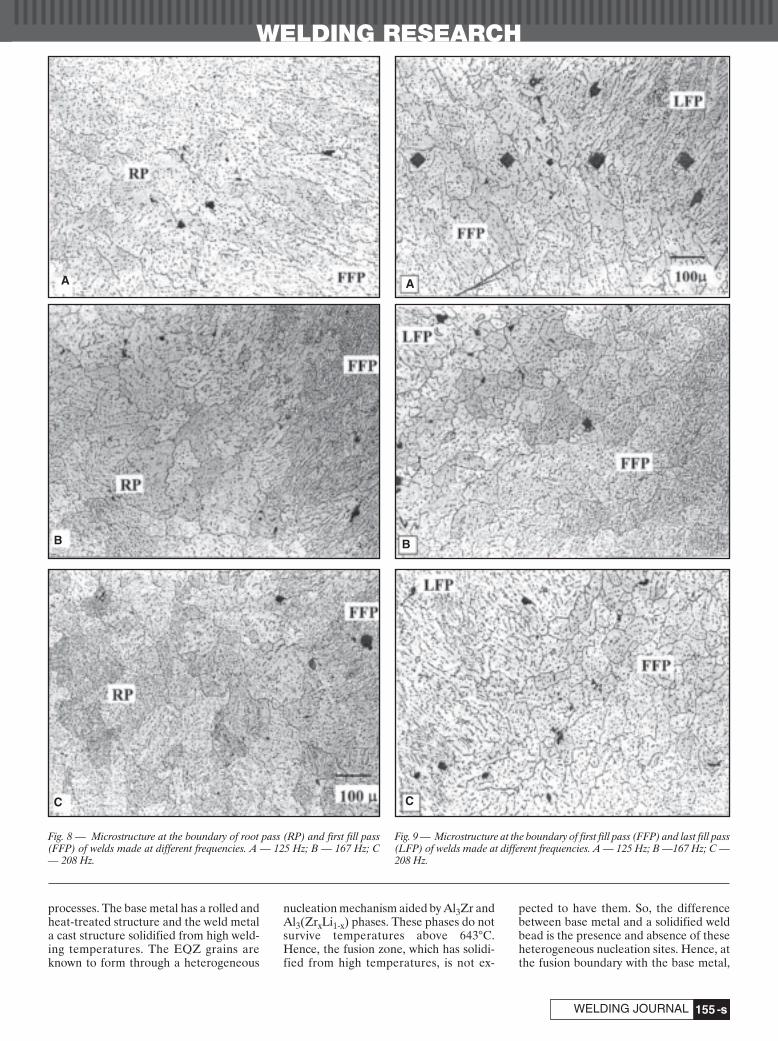
Microstructures of boundary betweenroot pass and first fill pass are shown inFig. 8. Coarsening of the subgrain struc-ture is very clearly evident in the areas ad-jacent to the weld interface. Similarly, ad-jacent to the boundary between the first fillpass and last fill pass, the subgrain structureof the first fill passes have coarsened asshown in Fig. 9. This coarsening effect ishigher in the root pass than in the first fill
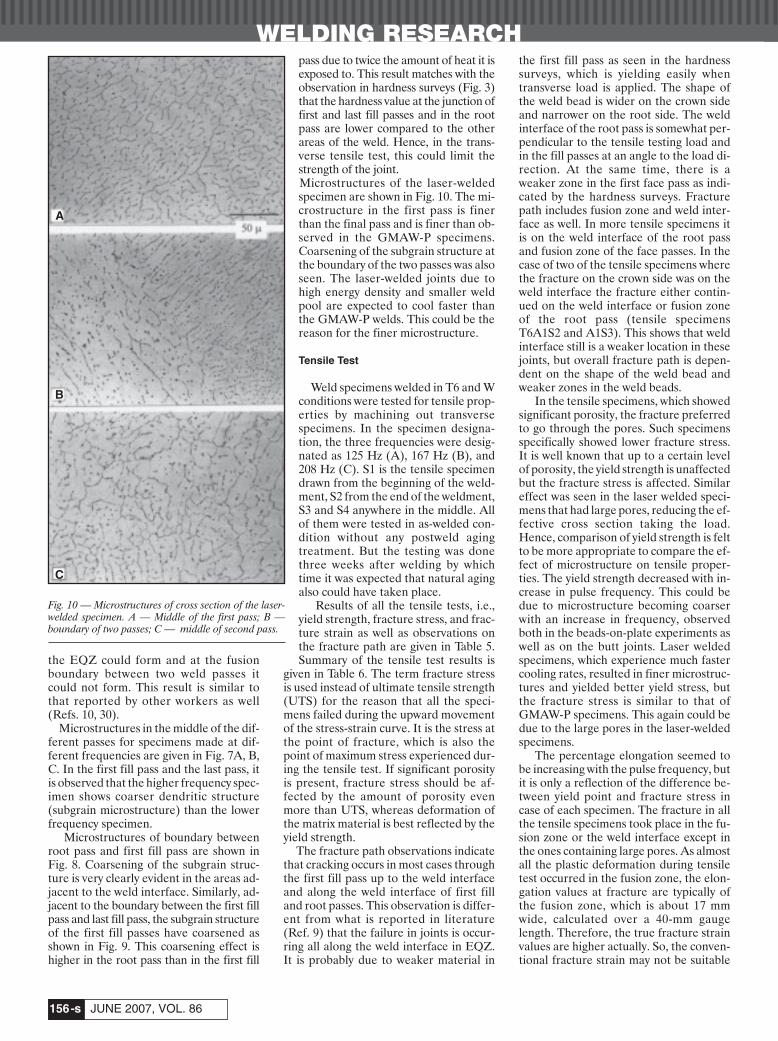
pass due to twice the amount of heat it isexposed to. This result matches with theobservation in hardness surveys (Fig. 3)that the hardness value at the junction offirst and last fill passes and in the rootpass are lower compared to the otherareas of the weld. Hence, in the trans-verse tensile test, this could limit thestrength of the joint.Microstructures of the laser-weldedspecimen are shown in Fig. 10. The mi-crostructure in the first pass is finerthan the final pass and is finer than ob-served in the GMAW-P specimens.Coarsening of the subgrain structure atthe boundary of the two passes was alsoseen. The laser-welded joints due tohigh energy density and smaller weldpool are expected to cool faster thanthe GMAW-P welds. This could be thereason for the finer microstructure.
Tensile Test
Weld specimens welded in T6 and Wconditions were tested for tensile prop-erties by machining out transversespecimens. In the specimen designa-tion, the three frequencies were desig-nated as 125 Hz (A), 167 Hz (B), and208 Hz (C). S1 is the tensile specimendrawn from the beginning of the weld-ment, S2 from the end of the weldment,S3 and S4 anywhere in the middle. Allof them were tested in as-welded con-dition without any postweld agingtreatment. But the testing was donethree weeks after welding by whichtime it was expected that natural agingalso could have taken place.
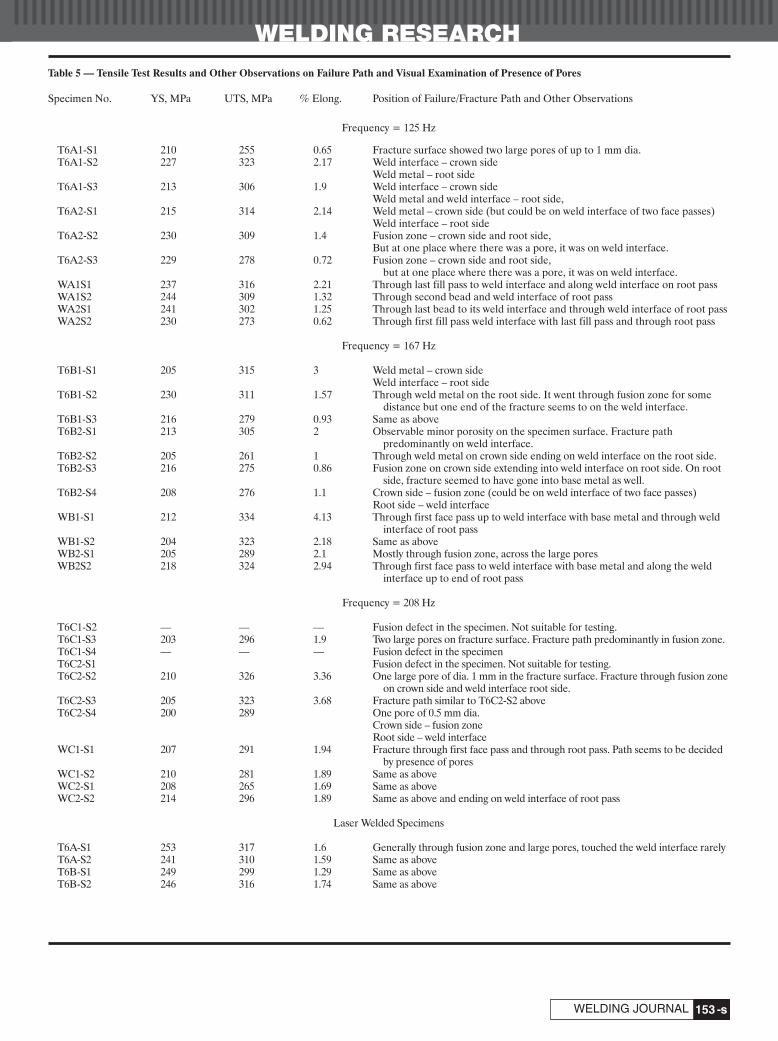
Results of all the tensile tests, i.e.,yield strength, fracture stress, and frac-ture strain as well as observations onthe fracture path are given in Table 5.Summary of the tensile test results is
given in Table 6. The term fracture stressis used instead of ultimate tensile strength(UTS) for the reason that all the speci-mens failed during the upward movementof the stress-strain curve. It is the stress atthe point of fracture, which is also thepoint of maximum stress experienced dur-ing the tensile test. If significant porosityis present, fracture stress should be af-fected by the amount of porosity evenmore than UTS, whereas deformation ofthe matrix material is best reflected by theyield strength.
The fracture path observations indicatethat cracking occurs in most cases throughthe first fill pass up to the weld interfaceand along the weld interface of first filland root passes. This observation is differ-ent from what is reported in literature(Ref. 9) that the failure in joints is occur-ring all along the weld interface in EQZ.It is probably due to weaker material in
the first fill pass as seen in the hardnesssurveys, which is yielding easily whentransverse load is applied. The shape ofthe weld bead is wider on the crown sideand narrower on the root side. The weldinterface of the root pass is somewhat per-pendicular to the tensile testing load andin the fill passes at an angle to the load di-rection. At the same time, there is aweaker zone in the first face pass as indi-cated by the hardness surveys. Fracturepath includes fusion zone and weld inter-face as well. In more tensile specimens itis on the weld interface of the root passand fusion zone of the face passes. In thecase of two of the tensile specimens wherethe fracture on the crown side was on theweld interface the fracture either contin-ued on the weld interface or fusion zoneof the root pass (tensile specimensT6A1S2 and A1S3). This shows that weldinterface still is a weaker location in thesejoints, but overall fracture path is depen-dent on the shape of the weld bead andweaker zones in the weld beads.
In the tensile specimens, which showedsignificant porosity, the fracture preferredto go through the pores. Such specimensspecifically showed lower fracture stress.It is well known that up to a certain levelof porosity, the yield strength is unaffectedbut the fracture stress is affected. Similareffect was seen in the laser welded speci-mens that had large pores, reducing the ef-fective cross section taking the load.Hence, comparison of yield strength is feltto be more appropriate to compare the ef-fect of microstructure on tensile proper-ties. The yield strength decreased with in-crease in pulse frequency. This could bedue to microstructure becoming coarserwith an increase in frequency, observedboth in the beads-on-plate experiments aswell as on the butt joints. Laser weldedspecimens, which experience much fastercooling rates, resulted in finer microstruc-tures and yielded better yield stress, butthe fracture stress is similar to that ofGMAW-P specimens. This again could bedue to the large pores in the laser-weldedspecimens.
The percentage elongation seemed tobe increasing with the pulse frequency, butit is only a reflection of the difference be-tween yield point and fracture stress incase of each specimen. The fracture in allthe tensile specimens took place in the fu-sion zone or the weld interface except inthe ones containing large pores. As almostall the plastic deformation during tensiletest occurred in the fusion zone, the elon-gation values at fracture are typically ofthe fusion zone, which is about 17 mmwide, calculated over a 40-mm gaugelength. Therefore, the true fracture strainvalues are higher actually. So, the conven-tional fracture strain may not be suitable
Fig. 10 — Microstructures of cross section of the laser-welded specimen. A — Middle of the first pass; B —boundary of two passes; C — middle of second pass.
A
C
B
Padmanabham layout NEW:Layout 1 5/9/07 3:46 PM Page 156
WELDING RESEARCH
-s157WELDING JOURNAL
for comparison.Tensile properties of butt joints of this
experimental alloy made with GMAW-Pand similar alloys with other processes aregiven in Table 7. The tensile properties arecomparable with even higher energy den-sity processes like variable polarity plasmaarc welding or laser beam welding.
Fractography
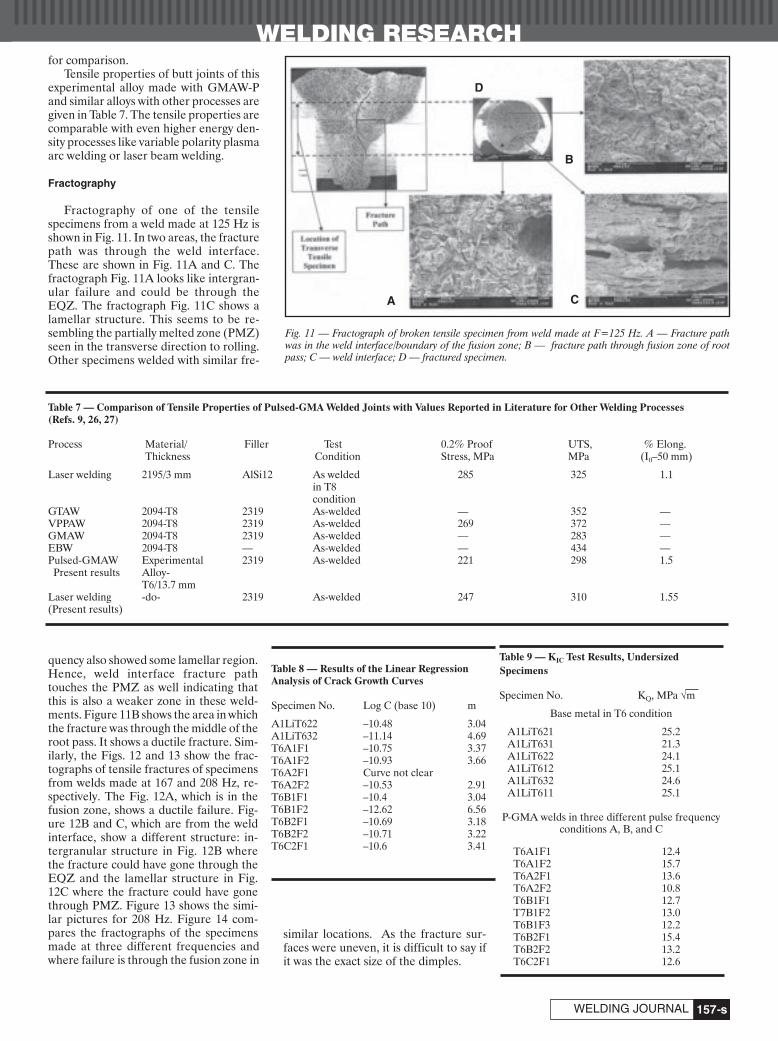
Fractography of one of the tensilespecimens from a weld made at 125 Hz isshown in Fig. 11. In two areas, the fracturepath was through the weld interface.These are shown in Fig. 11A and C. Thefractograph Fig. 11A looks like intergran-ular failure and could be through theEQZ. The fractograph Fig. 11C shows alamellar structure. This seems to be re-sembling the partially melted zone (PMZ)seen in the transverse direction to rolling.Other specimens welded with similar fre-
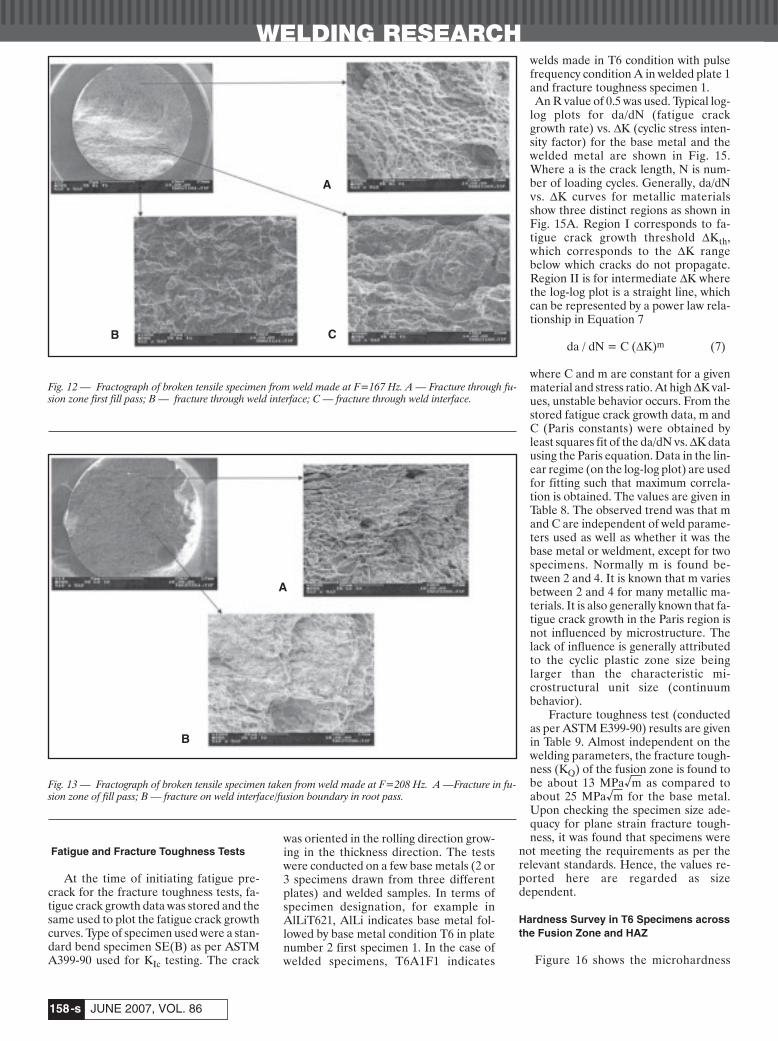
quency also showed some lamellar region.Hence, weld interface fracture pathtouches the PMZ as well indicating thatthis is also a weaker zone in these weld-ments. Figure 11B shows the area in whichthe fracture was through the middle of theroot pass. It shows a ductile fracture. Sim-ilarly, the Figs. 12 and 13 show the frac-tographs of tensile fractures of specimensfrom welds made at 167 and 208 Hz, re-spectively. The Fig. 12A, which is in thefusion zone, shows a ductile failure. Fig-ure 12B and C, which are from the weldinterface, show a different structure: in-tergranular structure in Fig. 12B wherethe fracture could have gone through theEQZ and the lamellar structure in Fig.12C where the fracture could have gonethrough PMZ. Figure 13 shows the simi-lar pictures for 208 Hz. Figure 14 com-pares the fractographs of the specimensmade at three different frequencies andwhere failure is through the fusion zone in
similar locations. As the fracture sur-faces were uneven, it is difficult to say ifit was the exact size of the dimples.
Fig. 11 — Fractograph of broken tensile specimen from weld made at F=125 Hz. A — Fracture pathwas in the weld interface/boundary of the fusion zone; B — fracture path through fusion zone of rootpass; C — weld interface; D — fractured specimen.
Table 7 — Comparison of Tensile Properties of Pulsed-GMA Welded Joints with Values Reported in Literature for Other Welding Processes(Refs. 9, 26, 27)
Process Material/ Filler Test 0.2% Proof UTS, % Elong.Thickness Condition Stress, MPa MPa (I0–50 mm)
Laser welding 2195/3 mm AlSi12 As welded 285 325 1.1in T8condition
GTAW 2094-T8 2319 As-welded — 352 —VPPAW 2094-T8 2319 As-welded 269 372 —GMAW 2094-T8 2319 As-welded — 283 —EBW 2094-T8 — As-welded — 434 —Pulsed-GMAW Experimental 2319 As-welded 221 298 1.5Present results Alloy-
T6/13.7 mmLaser welding -do- 2319 As-welded 247 310 1.55(Present results)
Table 8 — Results of the Linear RegressionAnalysis of Crack Growth Curves
Specimen No. Log C (base 10) m
A1LiT622 –10.48 3.04A1LiT632 –11.14 4.69T6A1F1 –10.75 3.37T6A1F2 –10.93 3.66T6A2F1 Curve not clearT6A2F2 –10.53 2.91T6B1F1 –10.4 3.04T6B1F2 –12.62 6.56T6B2F1 –10.69 3.18T6B2F2 –10.71 3.22T6C2F1 –10.6 3.41
Table 9 — KIC Test Results, Undersized Specimens
Specimen No. KQ, MPa √m
Base metal in T6 condition
A1LiT621 25.2A1LiT631 21.3A1LiT622 24.1A1LiT612 25.1A1LiT632 24.6A1LiT611 25.1
P-GMA welds in three different pulse frequencyconditions A, B, and C
T6A1F1 12.4T6A1F2 15.7T6A2F1 13.6T6A2F2 10.8T6B1F1 12.7T7B1F2 13.0T6B1F3 12.2T6B2F1 15.4T6B2F2 13.2T6C2F1 12.6
A
D
B
C
Padmanabham layout NEW:Layout 1 5/9/07 3:47 PM Page 157
WELDING RESEARCH
JUNE 2007, VOL. 86-s158
Fatigue and Fracture Toughness Tests
At the time of initiating fatigue pre-crack for the fracture toughness tests, fa-tigue crack growth data was stored and thesame used to plot the fatigue crack growthcurves. Type of specimen used were a stan-dard bend specimen SE(B) as per ASTMA399-90 used for KIc testing. The crack
was oriented in the rolling direction grow-ing in the thickness direction. The testswere conducted on a few base metals (2 or3 specimens drawn from three differentplates) and welded samples. In terms ofspecimen designation, for example inAlLiT621, AlLi indicates base metal fol-lowed by base metal condition T6 in platenumber 2 first specimen 1. In the case ofwelded specimens, T6A1F1 indicates
welds made in T6 condition with pulsefrequency condition A in welded plate 1and fracture toughness specimen 1.An R value of 0.5 was used. Typical log-
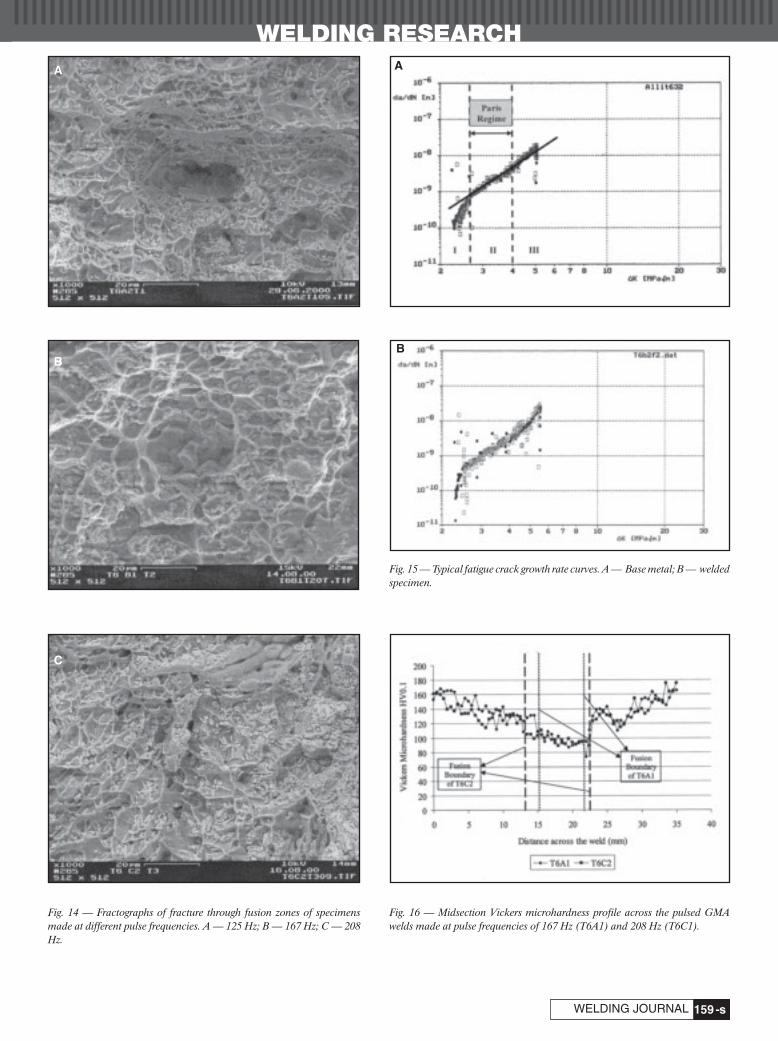
log plots for da/dN (fatigue crackgrowth rate) νs. ΔK (cyclic stress inten-sity factor) for the base metal and thewelded metal are shown in Fig. 15.Where a is the crack length, N is num-ber of loading cycles. Generally, da/dNνs. ΔK curves for metallic materialsshow three distinct regions as shown inFig. 15A. Region I corresponds to fa-tigue crack growth threshold ΔKth,which corresponds to the ΔK rangebelow which cracks do not propagate.Region II is for intermediate ΔK wherethe log-log plot is a straight line, whichcan be represented by a power law rela-tionship in Equation 7
da / dN = C (ΔK)m (7)
where C and m are constant for a givenmaterial and stress ratio. At high ΔK val-ues, unstable behavior occurs. From thestored fatigue crack growth data, m andC (Paris constants) were obtained byleast squares fit of the da/dN νs.ΔK datausing the Paris equation. Data in the lin-ear regime (on the log-log plot) are usedfor fitting such that maximum correla-tion is obtained. The values are given inTable 8. The observed trend was that mand C are independent of weld parame-ters used as well as whether it was thebase metal or weldment, except for twospecimens. Normally m is found be-tween 2 and 4. It is known that m variesbetween 2 and 4 for many metallic ma-terials. It is also generally known that fa-tigue crack growth in the Paris region isnot influenced by microstructure. Thelack of influence is generally attributedto the cyclic plastic zone size beinglarger than the characteristic mi-crostructural unit size (continuum behavior).
Fracture toughness test (conductedas per ASTM E399-90) results are givenin Table 9. Almost independent on thewelding parameters, the fracture tough-ness (KQ) of the fusion zone is found tobe about 13 MPa√m as compared toabout 25 MPa√m for the base metal.Upon checking the specimen size ade-quacy for plane strain fracture tough-ness, it was found that specimens were
not meeting the requirements as per therelevant standards. Hence, the values re-ported here are regarded as size dependent.
Hardness Survey in T6 Specimens acrossthe Fusion Zone and HAZ
Figure 16 shows the microhardness
Fig. 12 — Fractograph of broken tensile specimen from weld made at F=167 Hz. A — Fracture through fu-sion zone first fill pass; B — fracture through weld interface; C — fracture through weld interface.
Fig. 13 — Fractograph of broken tensile specimen taken from weld made at F=208 Hz. A —Fracture in fu-sion zone of fill pass; B — fracture on weld interface/fusion boundary in root pass.
A
B C
A
B
Padmanabham layout NEW:Layout 1 5/9/07 3:47 PM Page 158
WELDING RESEARCH
-s159WELDING JOURNAL
A A
BB
C
Fig. 14 — Fractographs of fracture through fusion zones of specimensmade at different pulse frequencies. A — 125 Hz; B — 167 Hz; C — 208Hz.
Fig. 15 — Typical fatigue crack growth rate curves. A — Base metal; B — weldedspecimen.
Fig. 16 — Midsection Vickers microhardness profile across the pulsed GMAwelds made at pulse frequencies of 167 Hz (T6A1) and 208 Hz (T6C1).
Padmanabham layout NEW:Layout 1 5/9/07 3:48 PM Page 159
WELDING RESEARCH
JUNE 2007, VOL. 86-s160
profile across the fusion zone and HAZ ofspecimens welded in T6 condition at twofrequencies 125 and 208 Hz, respectively.The trend seems to be similar to the onereported by other workers (Refs. 28, 29).There is double inflection in the hardnessprofile from fusion zone through theHAZ. Hardness is low in the fusion zoneand steadily increases up to some distancein the HAZ until a peak and then again de-creases after which it again increasessteadily. It is suggested in their work thatit is due to concurrent effects of dissolu-tion and coarsening of precipitates like T1,θ′, or S′, natural aging due to precipitationof δ′ after welding and diffusion of lithiumfrom HAZ into the weld pool. The firstpoint of inflection (a maximum) corre-sponds to the point of maximum precipi-tation of δ′, while the second point of in-flection (a minimum) corresponds to thepoint where the contribution of δ′ and theoveraged plate-like precipitate are equal.
Conclusions
1) Welded joints of Al-Cu-Li alloy thickplates made with the GMAW-P processcompare well with joints of similar Al-Cu-Lialloys like 2094, 2095, and 2195 in terms ofmechanical properties. The GMAW-Pprocess could be considered for weldingthese types of alloys as thick plates. SinceGMAW-P is a less expensive process, manyapplications could be attempted.
2) Increase in pulse frequency withsame mean current and welding speed re-duced the yield strength of the joint due tocoarsening of weld microstructure. Per-centage elongation seems to be increasingslightly, but this may be due to the increasein difference between yield stress andstress at fracture. The tensile properties inspecimens made from base metal in T6 orW condition are the same, as the fusionzone mainly governs the properties.
3) Fracture in tensile specimens oc-curred mostly through the first fill passand weld interface of the root pass. Thefractographs on the weld interface indi-cated that the fracture could be throughthe fine equiaxed grain zone or the par-tially melted zone. So, the fine equiaxedgrain zone has an effect on the GMAW-Pweldability of Al-Cu-Li alloys. Specimenswith large pores had the fracture path fol-lowing the pores rather than the weld in-terface. They showed significantly lowerfracture stress but yield stress similar toother specimens without large pores.
4) Hardness surveys revealed weakerregions in the fusion zone especially at theboundary between successive weld passes,due to grain coarsening. These mi-crostructural features affect tensile prop-erties. Hardness survey across the fusionzone and heat-affected zone showed the
double inflection (a maxima followed by aminima and increase to base metal hard-ness level) behavior as reported in the literature.
5) Fatigue crack growth behavior in theParis regime is almost the same in all thespecimens, including the base metal. Thefracture toughness measured using under-sized specimens is found to be almost in-dependent on the welding parameters andamounts to about 13 MPa√m for the fu-sion zone as compared to about 25MPa√m for the base metal.
Acknowledgments
The authors acknowledge with thanksthe DMRL, Hyderabad, for the alloy, theDAAD for fellowship for work at TU-Dresden, Ing. Zschetzsche (Institute ofProduction Technology, TU Dresden) forhelp in welding, and Mrs. Ing. Trommer(Institute of Materials Science, TU Dres-den) for help in SEM work.
References
1. Quist, W. H., and Narayanan, G. H. 1989.Aluminum-lithium alloys. Material Science &Technology, Vol. 31, p. 219.
2. Irving, B. 1997. Why aren’t airplaneswelded. Welding Journal 76(1): 31–40.
3. Rioja, R. J. 1998. Fabrication methods tomanufacture isotropic Al-Li alloys and productsfor space and aerospace applications. MaterialsScience & Engineering A 257, pp. 100–107.
4. Cross, C. E., and Tack, W. T. 1995. ASMMetals Handbook, 10th Ed, Vol. 6, pp. 549–553.
5. Kostrivas, A., and Lippold, J. C. 1999.Weldability of Li-bearing aluminum alloys. In-ternational Materials Reviews, 446, pp. 217–237.
6. Lippold, J. C. 1989. Weldability of com-mercial aluminum-lithium alloys, Proc. of 5thInt. Al-Li Conf., Williamsberg, Va. pp.1365–1375.
7. Pickens, J. R. 1990. Recent developmentsin the weldability of lithium-containing alu-minum alloys. Journal of Materials Science 25,pp. 3035–3047.
8. Ellis, M. B. D. 1996. Fusion welding ofaluminum-lithium alloys. Welding & Metal Fab-rication (2): 55–60.
9. Shah, S. R., Wittig, J. E., and Hahn, G. T.1992. Microstructural analysis of a high strengthAl-Cu-Li (Weldalite™ 049) alloy weld. Proceed-ings of the 3rd International Conference on Trendsin Welding Research, Gatlinburg, Tenn.
10. Gutierrez, A., and Lippold, J. C. 1998. Aproposed mechanism for equiaxed grain for-mation along the fusion boundary in aluminum-copper-lithium alloys. Welding Journal 77(3):123-s to 132-s.
11. Aidun, K., and Dean, J. P. 1999. Effect ofenhanced convection on the microstructure ofAl-Cu-Li welds. Welding Journal 78(10): 349-sto 354-s.
12. Cornu, J. 1998. Consumable electrode
processes. Advanced Welding Systems, Vol-II,IFS Publications U.K.
13. Jilong, M., and Apps, R. L. 1982. MIGtransfer discovery of importance to industry.Welding and Metal Fabrication (9): 307–316.
14. Apps, R. L. 1984. Controlled transfergas metal arc welding Proceedings of the Inter-national Conference on the Joining of Metals,(JOM-2), Denmark.
15. Subramaniam, S., White, D. R., Jones, J.E., and Lyons, D. W. 1998. Droplet transfer inpulsed gas metal arc welding of aluminum.Welding Journal 77(11): 458-s to 464-s.
16. Rajasekaran, S., Kulkarni, S. D., Mallya,U. D., and Chaturvedi, R. C. 1998. Droplet de-tachment and plate fusion characteristics inpulsed current gas metal arc welding process.Welding Journal 77(6): 254-s to 269-s.
17. Kou, S. 1987. Welding Metallurgy. NewYork, N.Y.: J. Wiley.
18. Kim, I. S., and Basu, A. 1998. A mathe-matical model of heat transfer and fluid flow ingas metal arc welding process. J. of AdvancedMaterials Processing Technology 77: 17–24.
19. Trindade, E. M., and Allum. 1981. Char-acteristics in steady and pulsed current GMAW.Welding and Metal Fabrication (9): 265–271.
20. Padmanabham, G., Pandey, S., andSchaper, M. 2005. Pulsed-GMAW of an Al-Cu-Li alloy. Science & Technology of Welding andJoining 10(1): 67.
21. Padmanabham, G., Pandey, S., andSchaper, M. 2004. Effect of pulse frequency ofP-GMAW on weld bead geometry and structureof Al-Cu-Li base plate, Australasian WeldingJournal 49(3): 33–43.
22. Metals Handbook, Vol. 6. 1983. Welding,brazing and soldering – Arc welding of alu-minum alloys, ASM International, MaterialsPark, Ohio.
23. Pandey, S. 1986. PhD thesis, Indian In-stitute of Technology, Delhi, India.
24. Proc. of 9th Congress on Materials Testing,Vol. 1. 1986. F. Schlät, M. Schaper, E. Czoboly,ed., Technoinform, Budapest, pp. 109–113.
25. Chan, K. S. 1993. Metall. Trans. A.24A,pp. 2473–2486.
26. Ellis, M. B. D. 1996. Fusion welding ofaluminum-lithium alloys. Welding & Metal Fab-rication (2): 55–60.
27. Strength and fatigue behaviour of fusionjoints. 2000. Proceedings of the German Societyfor Materials Research (DVM), Berlin, Germany.
28. Rading, G. O., and Berry, J. T. 1998. Amodel for heat-affected zone hardness profilesin Al-Li-X alloys. Welding Journal 77(9): 383-sto 388-s.
29. Rading, G. O., Shamsuzzoha, M., andBerry, J. T. 1998. A model for HAZ hardness pro-files in Al-Li-X alloys: Application to the Al-Li-Cu alloy 2095. Welding Journal 77(10): 411-s to416-s.
30. Reddy, G. M., Gokhale, A. A., Prasad, K.S., and Prasada, R. K. 1998. Chill zone formationin Al-Li alloy welds. Science & Technology ofWelding and Joining 3(4): 208.
Padmanabham layout NEW:Layout 1 5/11/07 10:27 AM Page 160