Embed Size (px)
Citation preview

ARC Debugger
TRACE32 Online Help
TRACE32 Directory
TRACE32 Index
TRACE32 Documents ......................................................................................................................
ICD In-Circuit Debugger ................................................................................................................
Processor Architecture Manuals ..............................................................................................
ARC ...........................................................................................................................................
ARC Debugger ...................................................................................................................... 1
Introduction ....................................................................................................................... 4
Supported ARC Cores 4
Brief Overview of Documents for New Users 5
Demo and Start-up Scripts 6
Warning .............................................................................................................................. 7
Troubleshooting ................................................................................................................ 8
SYStem.Up Errors 8
FAQ ..................................................................................................................................... 9
Quick Start ......................................................................................................................... 14
Access Classes ................................................................................................................. 18
CPU specific SYStem Commands ................................................................................... 19
SYStem.CONFIG.state Display target configuration 19
SYStem.CONFIG Configure debugger according to target topology 21
<parameters> describing the “DebugPort” 22
<parameters> describing the “JTAG” scan chain and signal behavior 25
<parameters> configuring a CoreSight Debug Access Port “DAP” 28
Multicore Examples 31
SYStem.CONFIG.MULTITAP Select type of JTAG multi-TAP network 32
SYStem.CPU Select CPU type 33
SYStem.CpuAccess Run-time memory access (intrusive) 33
SYStem.JtagClock Select clock for JTAG communication 35
SYStem.LOCK Lock and tristate the debug port 36
SYStem.MemAccess Real-time memory access (non-intrusive) 37
SYStem.Mode Select target reset mode 38
SYStem.Option Set a target specific option 40
SYStem.Option AHBHPROT Select AHB-AP HPROT bits 40
SYStem.Option AXIACEEnable ACE enable flag of the AXI-AP 40
ARC Debugger 1 ©1989-2018 Lauterbach GmbH

SYStem.Option AXICACHEFLAGS Select AXI-AP CACHE bits 41
SYStem.Option AXIHPROT Select AXI-AP HPROT bits 42
SYStem.Option DAPDBGPWRUPREQ Force debug power in DAP 42
SYStem.Option DAPREMAP Rearrange DAP memory map 43
SYStem.Option DAPSYSPWRUPREQ Force system power in DAP 43
SYStem.Option DAPNOIRCHECK No DAP instruction register check 44
SYStem.Option DEBUGPORTOptions Options for debug port handling 44
SYStem.Option detectOTrace Disable auto-detection of on-chip trace 45
SYStem.Option Endianness Set the target endianness 45
SYStem.Option EnReset Allow the debugger to drive nRESET (nSRST) 45
SYStem.Option HotBreakPoints Set breakp. when CPU is running 46
SYStem.Option IMASKASM Disable interrupts while single stepping 46
SYStem.Option IMASKHLL Disable interrupts while HLL single stepping 47
SYStem.Option IntelSOC Core is part of Intel® SoC 47
SYStem.Option LimmBreakPoints Software breakpoints with extra NOPs 47
SYStem.Option MMUSPACES Enable space IDs 48
SYStem.Option OVERLAY Enable overlay support 49
SYStem.Option RegNames Enable trivial names for core registers 49
SYStem.Option PowerDetection Choose method to detect the target power 50
SYStem.Option ResetDetection Choose method to detect a target reset 50
SYStem.Option TIMEOUT Define maximum time for core response 51
SYStem.POWER Control target power 52
SYStem.state Show SYStem settings window 52
On-chip Breakpoints/Actionpoints .................................................................................. 53
Using On-chip Breakpoints 53
Breakpoints in a ROM Area 53
Limitations 54
TrOnchip.CONVert Allow extension of address range of breakpoint 55
TrOnchip.VarCONVert Convert breakpoints on scalar variables 57
TrOnchip.OnchipBP Number of on-chip breakpoints used by debugger 58
TrOnchip.RESet Set on-chip trigger to default state 59
TrOnchip.state Display on-chip trigger window 59
CPU specific MMU Commands ........................................................................................ 60
MMU.DUMP Page wise display of MMU translation table 60
MMU.List Compact display of MMU translation table 61
MMU.SCAN Load MMU table from CPU 62
CPU specific JTAG.CONFIG Commands ........................................................................ 63
JTAG.CONFIG Electrical characteristics of MIPI-60 debug signals 63
JTAG.CONFIG.DRiVer Set slew rate of JTAG signals 63
JTAG.CONFIG.Voltage.HooKTHreshold Set hook threshold voltages 64
JTAG.CONFIG.Voltage.THreshold Set JTAG threshold voltages 64
JTAG.CONFIG.Voltage.REFerence Voltage level of signals send to target 65
ARC Debugger 2 ©1989-2018 Lauterbach GmbH

Connector Type and Pinout ............................................................................................. 66
Normal 20-Pin Connector 66
MIPI10 / MIPI20 / MIPI34 Connector 68
Converged MIPI60-Cv2 Connector 68
Legacy MIPI60-C Connector 68
XDP Connector 68
Support ............................................................................................................................... 69
Available Tools 69
Compilers 70
Target Operating Systems 70
3rd-Party Tool Integrations 71
Products ............................................................................................................................. 72
Product Information 72
Order Information 73
ARC Debugger 3 ©1989-2018 Lauterbach GmbH

ARC Debugger
Version 22-Mar-2018
Introduction
This document describes the processor-specific settings and features of the ARC in-circuit debugger.
Supported ARC Cores
The following ARC cores from Synopsys, Virage Logic or ARC International are supported:
• ARC-HS family : HS34, HS36, HS38, HS47D
• ARC-EM family : EM4, EM6, EM5D, EM7D, EM9D, EM11D
• ARC 700 core family : ARC710D, ARC725D, ARC750D, ARC770D
• ARC 600 core family : ARC601, ARC605, ARC610D, ARC652D, ARC630D, AS211SFX, AS221BD
• ARCtangent-A5 cores
• ARCtangent-A4 cores
If you require support of any other ARC core, please [email protected].
ARC Debugger 4 ©1989-2018 Lauterbach GmbH

Brief Overview of Documents for New Users
Architecture-independent information:
• “Debugger Basics - Training” (training_debugger.pdf): Get familiar with the basic features of a TRACE32 debugger.
• “T32Start” (app_t32start.pdf): T32Start assists you in starting TRACE32 PowerView instances for different configurations of the debugger. T32Start is only available for Windows.
• “General Commands” (general_ref_<x>.pdf): Alphabetic list of debug commands.
Architecture-specific information:
• “Processor Architecture Manuals”: These manuals describe commands that are specific for the processor architecture supported by your debug cable. To access the manual for your processor architecture, proceed as follows:
- Choose Help menu > Processor Architecture Manual.
• “RTOS Debuggers” (rtos_<x>.pdf): TRACE32 PowerView can be extended for operating system-aware debugging. The appropriate RTOS manual informs you how to enable the OS-aware debugging.
To get started with the most important manuals, use the WELCOME.view dialog:
ARC Debugger 5 ©1989-2018 Lauterbach GmbH

Demo and Start-up Scripts
Lauterbach provides ready-to-run PRACTICE start-up scripts and examples.
To search for PRACTICE scripts, do one of the following in TRACE32 PowerView:
• Type at the command line: WELCOME.SCRIPTS
• or choose File menu > Search for Script.
You can now search the demo folder and the subdirectories for PRACTICE start-up scripts (*.cmm) and other demo software:
You can also inspect the demo folder manually in the root installation directory of TRACE32. The ~~/demo/arc/ folder contains:
hardware/ Ready-to-run debugging demos for known evaluation boards. Recommended for getting started!
compiler/ Hardware independent compiler examples.
etc/ Various examples, e.g. code overlays, nSIM, JTAG unlock, …
fdx/ Example applications for the FDX feature.
flash/ Binaries for target based flash programming.
hostlink/ Example for using transfer data between target application and debugger. E.g. send text to debugger via printf()
kernel/ Various RTOS examples.
ARC Debugger 6 ©1989-2018 Lauterbach GmbH

Warning
NOTE: To prevent debugger and target from damage it is recommended to connect or disconnect the debug cable only while the target power is OFF.
Recommendation for the software start:
1. Disconnect the debug cable from the target while the target power is off.
2. Connect the host system, the TRACE32 hardware and the debug cable.
3. Power ON the TRACE32 hardware.
4. Start the TRACE32 software to load the debugger firmware.
5. Connect the debug cable to the target.
6. Switch the target power ON.
7. Configure your debugger e.g. via a start-up script.
Power down:
1. Switch off the target power.
2. Disconnect the debug cable from the target.
3. Close the TRACE32 software.
4. Power OFF the TRACE32 hardware.
ARC Debugger 7 ©1989-2018 Lauterbach GmbH

Troubleshooting
SYStem.Up Errors
The SYStem.UP command is the first command of a debug session where communication with the target is required. If you receive error messages while executing this command this may have the following reasons.
• The target has no power.
• A FPGA which could hold an ARC Core like an ARCangel, is not loaded yet or does not contain an ARC Core with a debugging interface.
• There is a problem with the electrical connection between the debugger and the target - check if the JTAG connector is plugged correctly and if the target is built corresponding to the definition of the used JTAG connector.
The LAUTERBACH debug module LA-7701 “DEBUG INTERFACE” is not supported. You require a Power Debug module (e.g. LA-7702, LA-7704, LA-7705, LA-7707, LA-7708, LA-7690, LA-7699)
ARC Debugger 8 ©1989-2018 Lauterbach GmbH

FAQ
Debugging via VPN
Ref: 0307
The debugger is accessed via Internet/VPN and the performance is very slow. What can be done to improve debug performance?
The main cause for bad debug performance via Internet or VPN are low data throughput and high latency. The ways to improve performance by the debugger are limited:
In PRACTICE scripts, use "SCREEN.OFF" at the beginning of the scriptand "SCREEN.ON" at the end. "SCREEN.OFF" will turn off screenupdates. Please note that if your program stops (e.g. on error) without exe-cuting "SCREEN.OFF", some windows will not be updated.
"SYStem.POLLING SLOW" will set a lower frequency for target statechecks (e.g. power, reset, jtag state). It will take longer for the debugger torecognize that the core stopped on a breakpoint.
"SETUP.URATE 1.s" will set the default update frequency ofData.List/Data.dump/Variable windows to 1 second (the slowest possiblesetting).
prevent unneeded memory accesses using "MAP.UPDATEONCE[address-range]" for RAM and "MAP.CONST [address--range]" forROM/FLASH. Address ranged with "MAP.UPDATEONCE" will read thespecified address range only once after the core stopped at a breakpoint ormanual break. "MAP.CONST" will read the specified address range onlyonce per SYStem.Mode command (e.g. SYStem.Up).
ARC Debugger 9 ©1989-2018 Lauterbach GmbH

Setting a Software Breakpoint fails
Ref: 0276
What can be the reasons why setting a software breakpoint fails?
Setting a software breakpoint can fail when the target HW is not able to implement the wanted breakpoint. Possible reasons:
The wanted breakpoint needs special features that are only possible torealize by the trigger unit inside the controller.
Example: Read, write and access (Read/Write) breakpoints ("type" in Break.Set window). Breakpoints with checking in real-time for data-values ("Data"). Breakpoints with special features ("action") like TriggerTrace, TraceEnable, TraceOn/TraceOFF.
TRACE32 can not change the memory.Example: ROM and Flash when no preparation with FLASH.Create, FLASH.TARGET and FLASH.AUTO was made. All type of memory if the memory device is missing the necessary control signals like WriteEnable or settings of registers and SpecialFunctionRegisters (SFR).
Contrary settings in TRACE32.Like: MAP.BOnchip for this memory range. Break.SELect.<breakpoint-type> Onchip (HARD is only available for ICE and FIRE).
RTOS and MMU:If the memory can be changed by Data.Set but the breakpoint doesn't work it might be a problem of using an MMU on target when setting the breakpoint to a symbolic address that is different than the writable and intended memory location.
ARC
Emulation debug port fail
Ref: 0332
I've received the error message "Emulation debug port fail".
What has happened?
"emulation debug port fail" can happen with TRACE32 for ARC under the following circumstances:
Stopping the core onSYStem.UP failed, because the core does not stop even after 1000ms.
Try SYStem.Mode Attach instead of SYStem.Mode Up
The JTAG Status Register of the ARC debug interface reports an error, byshowing the Failure-Bit active.
Try a lower JTAG frequency (e.g.: SYStem.JtagClock CTCK 1MHz ). Check your core.
A read or write transaction to/from the ARC core does not complete. TheJTAG Status Register does not show the Ready bit after waiting for1000ms and even not after re-initializing the read/write-transaction andwaiting for. (Timeout) Try a lower JTAG frequency (e.g.:
SYStem.JtagClock CTCK 1MHz ). Disable or disconnect any external source which resets the ARC core frequently (like e.g. a watchdog timer).
ARC Debugger 10 ©1989-2018 Lauterbach GmbH
ARC
MetaWare Hostlink Library
Ref: 0380
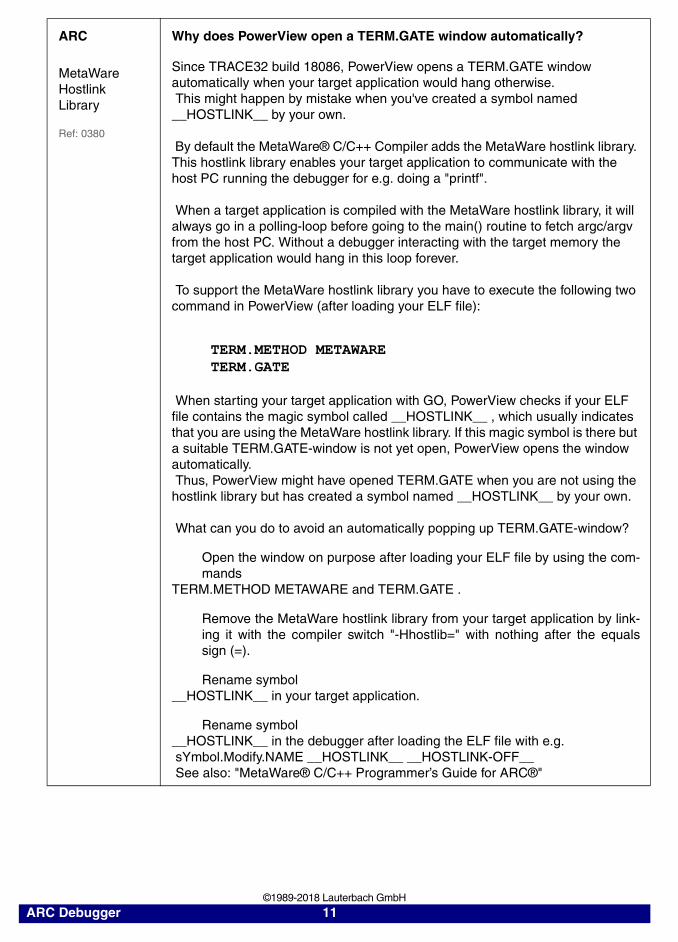
Why does PowerView open a TERM.GATE window automatically?
Since TRACE32 build 18086, PowerView opens a TERM.GATE window automatically when your target application would hang otherwise. This might happen by mistake when you've created a symbol named __HOSTLINK__ by your own. By default the MetaWare® C/C++ Compiler adds the MetaWare hostlink library. This hostlink library enables your target application to communicate with the host PC running the debugger for e.g. doing a "printf". When a target application is compiled with the MetaWare hostlink library, it will always go in a polling-loop before going to the main() routine to fetch argc/argv from the host PC. Without a debugger interacting with the target memory the target application would hang in this loop forever. To support the MetaWare hostlink library you have to execute the following two command in PowerView (after loading your ELF file):
TERM.METHOD METAWARE TERM.GATE
When starting your target application with GO, PowerView checks if your ELF file contains the magic symbol called __HOSTLINK__ , which usually indicates that you are using the MetaWare hostlink library. If this magic symbol is there but a suitable TERM.GATE-window is not yet open, PowerView opens the window automatically. Thus, PowerView might have opened TERM.GATE when you are not using the hostlink library but has created a symbol named __HOSTLINK__ by your own. What can you do to avoid an automatically popping up TERM.GATE-window?
Open the window on purpose after loading your ELF file by using the com-mands
TERM.METHOD METAWARE and TERM.GATE .
Remove the MetaWare hostlink library from your target application by link-ing it with the compiler switch "-Hhostlib=" with nothing after the equalssign (=).
Rename symbol__HOSTLINK__ in your target application.
Rename symbol__HOSTLINK__ in the debugger after loading the ELF file with e.g. sYmbol.Modify.NAME __HOSTLINK__ __HOSTLINK-OFF__ See also: "MetaWare® C/C++ Programmer’s Guide for ARC®"
ARC Debugger 11 ©1989-2018 Lauterbach GmbH

ARC
MetaWare Hostlink Library
Ref: 0381
My target application never reaches the main() function. What's up?
By default the MetaWare® C/C++ Compiler adds the MetaWare hostlink library. This hostlink library enables your target application to communicate with the host PC running the debugger for e.g. doing a "printf".
When a target application is compiled with the MetaWare hostlink library it will always go in a polling loop before going to the main() routine to fetch argc/argv from the host PC. Without a debugger interacting with the target memory the target application would hang in this loop forever.
However TRACE32 for ARC build 17699 an earlier (before Apr.2009) does not support the MetaWare hostlink library.
What can you do?
Update your installation of TRACE32 for ARC.
Remove the MetaWare hostlink library from your target application by link-ing it with the compiler switch "-Hhostlib=" with nothing after the equalssign (=).
If you are using TRACE32 for ARC with a buildnumber within the range(17699 < build < 18086) please execute the commands
TERM.METHOD METAWARE and TERM.GATE after loading your ELF file.
Please consider that there might be lots of other individual reasons, why your target application never reaches the main() function.
ARC
Viewing auxiliary registers
Ref: 0275
How can I see the auxiliary registers?
The auxiliary register space is accessible in PowerView via the special memory class "AUX".
To view the registers simply type:
data.dump AUX:0
For any ARC700 core lots of registers will be displayed with ???????? , which means that those registers are inaccessible, because they are not present at your core.
For ARC600 and older cores unimplemented auxiliary registers normally show the same value than the IDENTITY register.
The most common auxiliary register are also shown in the peripheral view. Open the peripheral view with the command PER .
ARC Debugger 12 ©1989-2018 Lauterbach GmbH

ARC
Viewing member variables in C++ methods
Ref: 0367
How can I see member variables in C++ methods without using the 'this' pointer?
Adding a member variable to the watch window without an object name should show a usefull value, when you are debugging a method/function of the desired object (like local variables). However at least MetaWare compiler 8.5 and earlier do not mark its code as C++ code. As a result TRACE32 does not search for the 'this' pointer. Solution: Update TRACE32 to build 27455 or higher and load your ELF with /CPP option or update your MetaWare compiler to a version witch addresses this issue. Workaround: Always explicitly use 'this->' in the watch window.
ARC Debugger 13 ©1989-2018 Lauterbach GmbH
Quick Start
This chapter should help you to prepare your debugger for ARC. Depending on your application not all steps might be necessary.
For some applications additional steps might be necessary, that are not described in this Quick Start section.
1. Prepare the Start
Connect the Debug Cable to your target. Check the orientation of the connector. Pin 1 of the debug cable is marked with a small triangle next to the nose of the target connector.
Power up your TRACE32 system.
Start the TRACE32 Debugger Software.
Power up your Target!
2. Select the CPU Type
For example:
If you have a normal ARC core without the need of special configurations (e.g. position inside a JTAG daisy chain) you can also use the keyword AUTO. E.g.:
3. Set the speed of the JTAG debug clock
You can select the JTAG clock frequency, which the Debugger uses to communicate with the target. This can be either done in the JtagClock field in the SYStem window, or by using the command line with the command SYStem.JtagClock. The maximum clock frequency might depend on the configuration of your FPGA design. The default clock frequency is 1 MHz.
To prevent damage please take care to follow this sequence all the time you are preparing a start.
SYStem.CPU ARC600
SYStem.CPU AUTO
ARC Debugger 14 ©1989-2018 Lauterbach GmbH

4. Configure the JTAG debug accesses
If you have a single ARC core and you use standard JTAG (IEEE 1149.1) there is nothing you have to do in this step.
Configure a multi-core setup
If you have more than one CPU core connected to the same JTAG port, please tell the debugger how it should connect to the core you want to debug:
In case of a JTAG daisy chain use command SYStem.DETECT SHOWChain to scan the chain. The result is shown in a window. Double-click on the desired core to tell the debugger which core you’d like to debug.
To configure the position of your core in the JTAG daisy chain manually use commands SYStem.CONFIG IRPOST, SYStem.CONFIG IRPRE, SYStem.CONFIG DRPOST and SYStem.CONFIG DRPRE.
In case your CPU is designed in the mature ARC MADI multicore configuration, please use command SYStem.CONFIG MADI to specify the core you want to debug.
Configure Compact-JTAG
Some ARC cores must be debugged via a two-wire debug interface called Compact-JTAG, cJTAG or IEEE 1149.7.
Use command SYStem.CONFIG DEBUGPORTTYPE CJTAG to enable two wire mode.Add command SYStem.CONFIG CJTAGFLAGS 0x03 to skip TCA-scanning and to use TRACE32-pseudo-keeper to workaround problems with the cJTAG implementation of your core.
5. Enter Debug Mode
This command resets the CPU, enters debug mode and jumps to the break address of the debugged core. After this command is executed it is possible to access memory and registers.
6. Load your Application Program
When the core is prepared the code can be downloaded. This can be done with the command Data.Load.<file_format> <file>.
SYStem.Up ; Connect to ARC core, stop the core and jump to reset vector
Data.Load.Elf <file>.elf ; load application file
ARC Debugger 15 ©1989-2018 Lauterbach GmbH

The options of the Data.LOAD command depend on the file format generated by the compiler. A detailed description of the Data.LOAD command is given in “General Commands Reference”.
7. Initialize Program Counter and Stackpointer (if required)
In a ready-to-run compiled ELF file, these settings are in the start-up code of the ELF file. In this case nothing has to be done. You can check the contents of Program Counter and Stack Pointer in the Register window, which provides the contents of all CPU Registers. Use CPU Registers in the CPU menu to open this window or use the command Register.
The Program Counter and the Stackpointer and all other registers can be set with the commands Register.Set PC <value> and Register.Set SP <value>. Here is an example of how to use these commands:
8. View the Source Code
Use the command Data.List to view the source code at the location of the Program Counter.
Now the quick start is done. If you were successful you can start to debug.
To reach the main() function use command GO main
Register.Set PC 0xc000 ; Set the Program Counter to address 0xC000
Register.Set SP 0xbff ; Set the Stack Pointer to address 0xbff
Register.Set PC main ; Set the PC to a label (here: function main)
ARC Debugger 16 ©1989-2018 Lauterbach GmbH

10. Create a PRACTICE Script
LAUTERBACH recommends to prepare a PRACTICE script (*.cmm, ASCII file format) to be able to do all the necessary actions with only one command. Here is a typical start sequence:
For information about how to build a PRACTICE script file (*.cmm file), refer to “Debugger Basics - Training” (training_debugger.pdf). There you can also find some information on basic actions with the debugger.
Please keep in mind that only the Processor Architecture Manual (the document you are reading at the moment) is CPU specific, while all other parts of the online help are generic for all CPUs. So if there are questions related to the CPU, the Processor Architecture Manual should be your first choice.
WinClear ; Clear all windows
SYStem.Reset ; Set all options in the SYStem window; to default values
SYStem.CPU ARC700 ; Use generic ARC700 core support.
System.JtagClock 5.MHz ; Set JTAG clock speed.
SYStem.Up ; Reset the target and enter debug mode
Data.LOAD.Elf demo.elf ; Load the application
Data.List ; Open disassembly window
Register.view ; Open register window
Var.Frame /Args /Locals ; Show call stack
Var.Ref %HEX %DECIMAL ; Auto-watch local variables
Break.Set 0x400 ; Set software breakpoint on address; 0x400
Break.Set main ; Set software breakpoint on address of; main function.
ARC Debugger 17 ©1989-2018 Lauterbach GmbH

Access Classes
Currently the cache is bypassed with any access. Thus, the debugger updates the memory from the cache before any memory gets accessed. After each memory access the debugger invalidates the cache.
See also
SYStem.MemAccess
Description
P: Program Memory.
D: Data Memory.
C: Program or Data Memory (unspecified)
AUX: Auxiliary Register Space. Accesses to this memory class allows you to read and write Auxiliary Registers and read Build Registers.
A:AP:, AD:
Absolute addressing (physical address) on SoCs with Memory Mangament Unit (MMU)
E Access memory while the CPU is running.See SYStem.CpuAccess and SYStem.MemAccess.Any memory class can be prefixed with E, if the memory class supports access while the CPU is running.
APB: Access no the APB bus connected to the CoreSight DAP (if DAP is available).See also SYStem.CONFIG APBACCESSPORT.
AHB:NAHB:, ZAHB:
Access no the AHB bus connected to the CoreSight DAP (if DAP is available).See also SYStem.CONFIG AHBACCESSPORT.Prefix N forces non-secure-access (default), Prefix Z forces secure-access.
AXI:NAHB:, ZAHB:
Access no the AXI bus connected to the CoreSight DAP (if DAP is available).See also SYStem.CONFIG AXIACCESSPORT.Prefix N forces non-secure-access (default), Prefix Z forces secure-access.
USR: Access to special memory via user-defined target program.See Data.USRACCESS.
OVS: On systems with code overlays, OVS allows to access in-active overlay segments located at the memory where it gets loaded from (storage) via the addresses where it gets executed.See sYmbol.OVERLAY.
XM:. XR: Access to “extension memory” and “extension registers.”These memory classes are only implemented on some custom SoC with individual meaning.
VM: Virtual Memory (memory on the debug system.
ARC Debugger 18 ©1989-2018 Lauterbach GmbH

CPU specific SYStem Commands
SYStem.CONFIG.state Display target configuration
Opens the SYStem.CONFIG.state window, where you can view and modify most of the target configuration settings. The configuration settings tell the debugger how to communicate with the chip on the target board and how to access the on-chip debug and trace facilities in order to accomplish the debugger’s operations.
Alternatively, you can modify the target configuration settings via the TRACE32 command line with the SYStem.CONFIG commands. Note that the command line provides additional SYStem.CONFIG commands for settings that are not included in the SYStem.CONFIG.state window.
Format: SYStem.CONFIG.state [/<tab>]
<tab>: DebugPort | Jtag | DAP | COmponents
<tab> Opens the SYStem.CONFIG.state window on the specified tab. For tab descriptions, refer to the list below.
DebugPort Informs the debugger about the debug connector type and the communication protocol it shall use.
Jtag Informs the debugger about the position of the Test Access Ports (TAP) in the JTAG chain which the debugger needs to talk to in order to access the debug and trace facilities on the chip.
ARC Debugger 19 ©1989-2018 Lauterbach GmbH

MultiTap Informs the debugger about the existence and type of a System/Chip Level Test Access Port. The debugger might need to control it in order to reconfigure the JTAG chain or to control power, clock, reset, and security of different chip components.
For descriptions of the commands on the MultiTap tab, see Multitap.
DAP Informs the debugger about an ARM CoreSight Debug Access Port (DAP) and about how to control the DAP to access chip-internal memory busses (AHB, APB, AXI) or chip-internal JTAG interfaces.
COmponents Informs the debugger about the existence and interconnection of on-chip CoreSight debug and trace modules and informs the debugger on which memory bus and at which base address the debugger can find the control registers of the modules.
This is only relevant in case used ARC core is debugged over a CoreSight DAP.
For descriptions of the commands on the COmponents tab, see COmponents in “ARM Debugger” (debugger_arm.pdf).
tbd.
ARC Debugger 20 ©1989-2018 Lauterbach GmbH

SYStem.CONFIG Configure debugger according to target topology
The SYStem.CONFIG commands inform the debugger about the available on-chip debug and trace components and how to access them.
Some commands need a certain CPU type selection (SYStem.CPU <type>) for Lauterbach debug hardware to become active.
Format: SYStem.CONFIG.<sub_cmd> <parameter>SYStem.MultiCore.<sub_cmd> <parameter> (deprecated)
<sub_cmd>:(DebugPort)
CONNECTOR [MIPI34 | MIPI20T]CORE <core> <chip>CoreNumber <number>DEBUGPORT [DebugCable0 | DebugCableA | DebugCableB]DEBUGPORTTYPE [JTAG | SWD | CJTAG | CJTAGSWD]Slave [ON | OFF]TriState [ON | OFF]MADI <id>CJTAGFLAGS <flags>CJTAGTCA <value>SWDP [ON | OFF]SWDPTargetSel <value>
<sub_cmd>:(JTAG)
DAPDRPOST <bits>DAPDRPRE <bits>DAPIRPOST <bits>DAPIRPRE <bits>DRPRE <bits>DRPOST <bits>IRPRE <bits>IRPOST <bits>Slave [ON | OFF]TriState [ON | OFF]TAPState <state>TCKLevel [0 | 1]
<sub_cmd>:(DAP)
AHBACCESSPORT <port>APBACCESSPORT <port>AXIACCESSPORT <port>DEBUGACCESSPORT <port>COREJTAGPORT <port>JTAGACCESSPORT <port>
<sub_cmd>:(misc)
DEBUGTIMESCALE <multiplier>ADDRTICYCLES <dr> <ir>MULTITAP
ARC Debugger 21 ©1989-2018 Lauterbach GmbH

Ideally you can select with SYStem.CPU the chip you are using which causes all setup you need and you do not need any further SYStem.CONFIG command.
The SYStem.CONFIG command information shall be provided after the SYStem.CPU command which might be a precondition to enter certain SYStem.CONFIG commands and before you start up the debug session e.g. by SYStem.Up.
<parameters> describing the “DebugPort”
CJTAGFLAGS <flags> Activates workarounds for incomplete or buggy cJTAG (IEEE 1149.7) implementations.Bit 0: Disable scanning of cJTAG ID (TCA-scanning). Bit 1: Target has no “keeper”. Use TRACE32 pseudo keeper.Bit 2: Inverted meaning of SREDGE register.Bit 3: Old command opcodes (cJTAG < 1.14).Bit 4: APFC unlock required.Bit 5: OAC required
Default: 0
CJTAGTCA <value> Selects the TCA (TAP Controller Address) to address a device in a cJTAG (IEEE 1149.7) Star-2 configuration. The Star-2 configuration requires a unique TCA for each device on the debug port.
CONNECTOR[MIPI34 | MIPI20T]
Specifies the connector “MIPI34” or “MIPI20T” on the target. This is mainly needed in order to notify the trace pin location.
This command is only available if the used Lauterbach debug cable supports different pin-outs. E.g. if a CombiProbe is used with a MIPI34 whisker.Default: MIPI34.
ARC Debugger 22 ©1989-2018 Lauterbach GmbH

CORE <core> <chip> The command helps to identify cores which have debug and trace resources which are commonly used by different cores. The command might be required in a multicore environment if you use multiple debugger instances (multiple TRACE32 GUIs) to simultaneously debug different cores on the same target system over the same PowerDebug.
All core which share the same debug resources should have the same <chip> number.
E.g.: If you SoC contains an ARConnect unit for inter-core communication and cross-triggering, all cores, which arc connected to the same ARConnect should have the same <chip> number. (Otherwise truly synchronous start and stop of the cores wouldn’t work)
This are the default settings of the command: 1st TRACE32 GUI: <core>=1 <chip>=1 2nd TRACE32 GUI: <core>=1 <chip>=2 ... n-th TRACE32 GUI: <core>=1 <chip>=nThis means that by default the cores are handled as unrelated.
CoreNumber <number> Number of cores to be considered in an SMP (symmetric multiprocessing) debug session.
DEBUGPORT [DebugCa-bleA | DebugCableB]
In case you’re using a Lauterbach CombiProbe with two MIPI34 whiskers, this command allows to select the whisker cable, which should be used by the current TRACE32 GUI.
DEBUGPORTTYPE[JTAG | SWD | CJTAG | CJTAGSWD]
It specifies the used debug port type “JTAG”, “SWD”, “CJTAG”, “CJTAG-SWD”. It assumes the selected type is supported by the target.
• JTAG: Standard 5- or 4-pin JTAG (IEEE 1149.1)
• CJTAG: Compact 2-wire-JTAG (IEEE 1149.7)
• SWD: ARM Serial Wire Debug (requires that the ARC debug logic is connected to a CoreSight DAP inside the target SoC)
• CJTAGSWD: CJTAG in a mixed SWD/cJTAG configuration.
Default: JTAG
ARC Debugger 23 ©1989-2018 Lauterbach GmbH

SWDP [ON | OFF] With this command you can change from the normal JTAG communication to Serial Wire Debug. SWD (Serial Wire Debug) uses just two signals instead of five. It works only if your target SoC contains a CoreSight DAP and the ARC core debug register are connected to that DAP (via APB or JTAG-AP)
If SYStem.CONFIG.DEBUGPORTTYPE is set to CJTAGSWD, this command selects if cJTAG or SWD should be used.
Default: OFF.
Slave [ON | OFF] (default: OFF) If more than one debugger share the same JTAG port, all except one must have this option active. Only one debugger - the “master” - is allowed to control the signals nTRST and nSRST (nRESET).
Default: OFF for the first TRACE32 GUI connected a PowerDebug, ON for every further TRACE32 GUI connected to the same PowerDebug for AMP multicore debugging.
SWDPTargetSel <value> Device address in case of a multidrop Serial Wire Debug Port.Default: OFF.
TriState [ON | OFF] TriState has to be set to ON if several debug cables are connected to a common JTAG port. TAPState and TCKLevel define the TAP state and TCK level which is selected when the debugger switches to tristate mode. Please note: nTRST must have a pull-up resistor on the target, TCK can have a pull-up or pull-down resistor, other trigger inputs need to be kept in inactive state. (Pull-down resistor on TCK is strongly recommended!)
Default: OFF.
MADI Some chips with multiple ARC cores use the so called Multiple ARCtangent Processor Debug Interface (MADI). MADI is a multiplexer which allows you to debug several ARC cores via one JTAG TAP. While you select the TAP with IRPRE, IRPOST, DRPRE, DRPOST the MADI options tells the debugger which core connected to the MADI-TAP you want to debug.Setting MADI to OFF means you don’t have a MADI IP between your TAP and your core.If your target system does not have MADI, MADI is set automatically to OFF.
ARC Debugger 24 ©1989-2018 Lauterbach GmbH

<parameters> describing the “JTAG” scan chain and signal behavior
With a JTAG interface you can access a Test Access Port controller (TAP) which has implemented a state machine to provide a mechanism to read and write data to an Instruction Register (IR) and a Data Register (DR) in the TAP. The JTAG interface will be controlled by 5 signals: nTRST(reset), TCK (clock), TMS (state machine control), TDI (data input), TDO (data output). Multiple TAPs can be controlled by one JTAG interface by daisy-chaining the TAPs (serial connection). If you want to talk to one TAP in the chain you need to send a BYPASS pattern (all ones) to all other TAPs. For this case the debugger needs to know the position of the TAP it wants to talk to.
To tell the debugger the exact position of your core’s Test Access Port controller (TAP) within a JTAG daisy-chain you’ll require the commands IRPRE, IRPOST, DRPRE, and DRPOST.
Most ARC cores are directly connected to JTAG Test Access Port controller (TAP), which is accessible directly to the debugger via JTAG. However, in case you’re ARC core is debugged via a CoreSight DAP you’ll need DAPDRPRE/POST and DAPIRPRE/POST below instead.
DRPRE <bits> (default: 0) <number> of TAPs in the JTAG chain between the core of interest and the TDO signal of the debugger. If each core in the system contributes only one TAP to the JTAG chain, DRPRE is the number of cores between the core of interest and the TDO signal of the debugger.
DRPOST <bits> (default: 0) <number> of TAPs in the JTAG chain between the TDI signal of the debugger and the core of interest. If each core in the system contributes only one TAP to the JTAG chain, DRPOST is the number of cores between the TDI signal of the debugger and the core of interest.
IRPRE <bits> (default: 0) <number> of instruction register bits in the JTAG chain between the core of interest and the TDO signal of the debugger. This is the sum of the instruction register length of all TAPs between the core of interest and the TDO signal of the debugger.
IRPOST <bits> (default: 0) <number> of instruction register bits in the JTAG chain between the TDI signal and the core of interest. This is the sum of the instruction register lengths of all TAPs between the TDI signal of the debugger and the core of interest.
ARC Debugger 25 ©1989-2018 Lauterbach GmbH

If you JTAG daisy chain contains a CoreSight DAP and the DAP is accessible via JTAG the DAP’s JTAG Test Access Port controller (TAP) may also be inside a JTAG daisy-chain. To tell the debugger the exact position DAP’s TAP within the JTAG daisy-chain you’ll require the commands DAPIRPRE, DAPIRPOST, DAPDRPRE, and DAPDRPOST. These settings are especially important if the CoreSight DAP is not just used to access memory, but also your ARC cores’s debug registers are also accessed via the DAP.
.
DAPDRPOST <bits> (default: 0) <number> of TAPs in the JTAG chain between the DAP and the TDO signal of the debugger.
DAPDRPRE <bits> (default: 0) <number> of TAPs in the JTAG chain between the TDI signal of the debugger and the DAP.
DAPIRPOST <bits> (default: 0) <number> of instruction register bits in the JTAG chain between the DAP and the TDO signal of the debugger. This is the sum of the instruction register length of all TAPs between the DAP and the TDO signal of the debugger.
DAPIRPRE <bits> (default: 0) <number> of instruction register bits in the JTAG chain between the TDI signal and the DAP. This is the sum of the instruction register lengths of all TAPs between the TDI signal of the debugger and the DAP.
Slave [ON | OFF] If more than one debugger share the same JTAG port, all except one must have this option active. Only one debugger - the “master” - is allowed to control the signals nTRST and nSRST (nRESET).
Default: OFF for the first TRACE32 GUI connected a PowerDebug, ON for every further TRACE32 GUI connected to the same PowerDebug for AMP multicore debugging.
TriState [ON | OFF] TriState has to be set to ON if several debug cables are connected to a common JTAG port. TAPState and TCKLevel define the TAP state and TCK level which is selected when the debugger switches to tristate mode. Please note: nTRST must have a pull-up resistor on the target, TCK can have a pull-up or pull-down resistor, other trigger inputs need to be kept in inactive state. (Pull-down resistor on TCK is strongly recommended!)
Default: OFF.
ARC Debugger 26 ©1989-2018 Lauterbach GmbH

TCKLevel <level> Level of TCK signal when all debuggers are tristated. Normally defined by a pull-up or pull-down resistor on the target. (Pull-down resistor on TCK is strongly recommended!)
Default: 0.
TAPState <state> This is the state of the TAP controller when the debugger switches to tristate mode. All states of the JTAG TAP controller are selectable.
0 Exit2-DR1 Exit1-DR2 Shift-DR3 Pause-DR4 Select-IR-Scan5 Update-DR6 Capture-DR7 Select-DR-Scan8 Exit2-IR9 Exit1-IR10 Shift-IR11 Pause-IR12 Run-Test/Idle13 Update-IR14 Capture-IR15 Test-Logic-Reset
Default: 7 = Select-DR-Scan.
ARC Debugger 27 ©1989-2018 Lauterbach GmbH

<parameters> configuring a CoreSight Debug Access Port “DAP”
A Debug Access Port (DAP) is a CoreSight module from ARM which provides access via its debugport (JTAG, cJTAG, SWD) to:
1. Memory busses (AHB, APB, AXI). This is especially important if the on-chip debug register needs to be accessed this way. You can access the memory buses by using certain access classes with the debugger commands: “AHB:”, “APB:”, “AXI:. The interface to these buses is called Memory Access Port (MEM-AP).The debug registers of some cores are accessible via such a memory bus (mostly APB).
2. Chip-internal JTAG interfaces. This is important if the core you intend to debug is connected to such an internal JTAG interface. The module controlling these JTAG interfaces is called JTAG Access Port (JTAG-AP). Each JTAG-AP can control up to 8 internal JTAG interfaces. A port number between 0 and 7 denotes the JTAG interfaces to be addressed
The following SYStem.CONFIG commands configure the port-number for the memory busses:
The following SYStem.CONFIG commands are required if your ARC core is connected to a chip-internal JTAG interface, which is controlled via the DAP:.
AHBACCESSPORT <port> DAP access port number (0-255) which shall be used for “AHB:” access class. Default: <port>=0.
APBACCESSPORT <port> DAP access port number (0-255) which shall be used for “APB:” access class. Default: <port>=1.
AXIACCESSPORT <port> DAP access port number (0-255) which shall be used for “AXI:” access class. Default: port not available
DEBUGACCESSPORT <port>
DAP access port number (0-255) where the debug register can be found (typically on APB). Used for “DAP:” access class. Default: <port>=1.
JTAGACCESSPORT <port> DAP access port number (0-255) of the JTAG Access Port.
COREJTAGPORT <port> JTAG-AP port number (0-7) connected to the core which shall be debugged.
ARC Debugger 28 ©1989-2018 Lauterbach GmbH

Example 1: ARC core debugged via CoreSight APB interfaceD
ebu
gg
er
Memory Access Port(MEM-AP)
1
Memory Access Port(MEM-AP)
0
JTAG Access Port(JTAG-AP)
2S
yste
m B
us (
AH
B)
Deb
ug B
us (
AP
B)
System Memory
Any core
ROM Table
0 JTAG
7 JTAG
Debug Access Port (DAP)
AHBACCESSPORT 0APBACCESSPORT 1DEBUGACCESSPORT 1
Debug PortJTAG or cJTAG orSWD
Chip
with CoreSightAPB interface
ARCwith CoreSightAPB interface
Any corewith
JTAG interface
ARC Debugger 29 ©1989-2018 Lauterbach GmbH

Example 2: ARC core debugged via chip-internal JTAG interface controlled via the DAP:D
ebu
gg
er
Memory Access Port(MEM-AP)
1
Memory Access Port(MEM-AP)
0
JTAG Access Port(JTAG-AP)
2S
yste
m B
us (
AH
B)
Deb
ug B
us (
AP
B)
System Memory
ROM Table
0 JTAG
7 JTAG
Debug Access Port (DAP)
COREJTAGPORT 7AHBACCESSPORT 0APBACCESSPORT 1JTAGACCESSPORT 2
Debug PortJTAG or cJTAG orSWD
Chip
Any corewith CoreSightAPB interface
ARCwith
JTAG interface
ARC Debugger 30 ©1989-2018 Lauterbach GmbH

Multicore Examples
Multicore with JTAG Daisy Chain
+------------------------+ +--------------------+ TDI --|-> Core A ---> Core B --|--|-> ARC ---> Core D -|--> TDO +------------------------+ +--------------------+ Chip1 Chip2
Instruction register length of
• Core A: 3 bit
• Core B: 5 bit
• Core D: 6 bit
SMP multicore debugging of a quad-core ARC-HS
Setup for a ARC-HS quad core, which should debugged in SMP mode, which means that all 4 core are debugged via the same TRACE32 PowerView GUI. SMP is the right mode if all cores share the same memory and task. E.g. when Linux is running on the ARC quad core cluster.
In this example all ARC cores of the quad-core cluster have a separate JTAG-TAP, which is the most common configuration..
SYStem.CONFIG.IRPRE 6SYStem.CONFIG.IRPOST 8SYStem.CONFIG.DRPRE 1SYStem.CONFIG.DRPOST 2SYStem.CONFIG.CORE 1. 2.SYStem.Up
; IR Core D; IR Core A + B; DR Core D; DR Core A + B; Core 1 in Chip 2
SYStem.CPU ARC-HSSYStem.CONFIG CoreNumber 4SYStem.CONFIG IRPRE 12. 8. 4. 0.SYStem.CONFIG DRPRE 3. 2. 1. 0.SYStem.CONFIG IRPOST 0. 8. 4. 12.SYStem.CONFIG DRPOST 0. 1. 2. 3.CORE.ASSIGN 1 2 3 4SYStem.Up
ARC Debugger 31 ©1989-2018 Lauterbach GmbH

Multicore with Multiple ARCtangent Processor Debug Interface (MADI)
+-------------+TDI --|---> MADI ---|--> TDO +----/-|-\----+ / | \ / | \ / | \ CoreA CoreB ARCtangent
SYStem.CONFIG.MULTITAP Select type of JTAG multi-TAP network
Some SoCs with a JTAG interface need special JTAG sequences before the ARC core can be accessed.E.g. The JTAG-TAP of the ARC has to be dynamically added to the JTAG daisy chain of the SoC.
SYStem.CONFIG MADI 2SYStem.Up
; Debug 3rd core attached to MADI
Format: SYStem.CONFIG.MULTITAP <multitap>
<multitap>: NONEPrimaryTAP <irlength> <irvalue> <drlength> <drenable> <drdisable>
NONE Disables any special multi-TAP handling (default).
PrimaryTAP Before accessing the ARC core via JTAG, the debugger writes <irvalue> to the JTAG IR shift-register and then <drenable> to the JTAG DR shift-register.After accessing the ARC core via JTAG, the debugger writes <irvalue> to the JTAG IR shift-register and then <drdisable> to the JTAG DR shift-register.
ARC Debugger 32 ©1989-2018 Lauterbach GmbH

SYStem.CPU Select CPU type
Default: AUTO.
Selects the processor type.
ARC-A4 and ARC-A5 are abbreviations for “ARCtangent-A4” and “ARCtangent-A5”.
AUTO reads out the IDENTITY auxiliary register after a SYStem.Up or SYStem.Mode Attach, and sets the system cpu to ARC-A4, ARC-A5, ARC600, ARC700, ARC-EM or ARC-HS accordingly.
SYStem.CpuAccess Run-time memory access (intrusive)
Default: Denied.
Format: SYStem.CPU <cpu>
<cpu>: AUTO |ARC-A4 |ARC-A5 |ARC600 | ARC601 | ARC605 | ARC610 | ARC625D |ARC700 | ARC710D | ARC725D | ARC750D | ARC770DARC-EM-1r0ARC-EMARC-HS
Format: SYStem.CpuAccess Enable | Denied | Nonstop
Enable Allow intrusive run-time memory access.In order to perform a memory read or write while the CPU is executing the program, the debugger stops the program execution shortly. Each short stop takes 1 … 100 ms depending on the speed of the debug interface and on the number of the read/write accesses required.A red S in the state line of the TRACE32 main window indicates this intrusive behavior of the debugger.
ARC Debugger 33 ©1989-2018 Lauterbach GmbH

ARC cores normally support non-intrusive run-time memory access. Use SYStem.MemAccess therefore.
If specific windows, that display memory or variables should be updated while the program is running select the memory class prefix E: or the format option %E.
See also
Memory ClassesSYStem.MemAccess
Denied Lock intrusive run-time memory access.
Nonstop Lock all features of the debugger that affect the run-time behavior. Nonstop reduces the functionality of the debugger to:• Run-time access to memory and variables• Trace displayThe debugger inhibits the following:• To stop the program execution• All features of the debugger that are intrusive (e.g. action Spot for
breakpoints, performance analysis via StopAndGo mode, condi-tional breakpoints, etc.)
Data.dump ED:0x100
Data.List EP:main
Var.View %E first
ARC Debugger 34 ©1989-2018 Lauterbach GmbH

SYStem.JtagClock Select clock for JTAG communication
Default frequency: 10 MHz.
Selects the JTAG port frequency (TCK) used by the debugger to communicate with the processor. The frequency affects e.g. the download speed. It could be required to reduce the JTAG frequency if there are buffers, additional loads or high capacities on the JTAG lines or if VTREF is very low. A very high frequency will not work on all systems and will result in an erroneous data transfer. Therefore we recommend to use the default setting if possible.
Format: SYStem.JtagClock [<clockmode>] <frequency>
<clockmode>: RTCK | ARTCK | CTCK | CRTCK (<clockmode> only available if an ARM debug cable (e.g. LA-3750) is used.)
<frequency>: 6 kHz … 80 MHz1250000. | 2500000. | 5000000. | 10000000. (on obsolete ICD hardware)(<frequency> is optional if <clockmode> is set to RTCK)
<frequency> The debugger cannot select all frequencies accurately. It chooses the next possible frequency and displays the real value in the SYStem.state window.Besides a decimal number like “100000.” also short forms like “10kHz” or “15MHz” can be used. The short forms imply a decimal value, although no “.” is used.
RTCK The JTAG clock is controlled by the RTCK signal (Returned TCK).On some processor derivatives there is the need to synchronize the processor clock and the JTAG clock. In this case RTCK shall be selected. Synchronization is maintained, because the debugger does not progress to the next TCK edge until after an RTCK edge is received. In case you have a processor derivative requiring a synchronization of the processor clock and the JTAG clock, but your target does not provide a RTCK signal, you need to select a fix JTAG clock below 2/3 of the processor clock.When RTCK is selected, the frequency depends on the processor clock and on the propagation delays. The maximum reachable frequency is about 16 MHz.Example: SYStem.JtagClock RTCK
ARC Debugger 35 ©1989-2018 Lauterbach GmbH

SYStem.LOCK Lock and tristate the debug port
Default: OFF.
If the system is locked, no access to the debug port will be performed by the debugger. While locked, the debug connector of the debugger is tristated. The main intention of the lock command is to give debug access to another tool.
The process can also be automated, see SYStem.CONFIG TriState.
ARTCK Accelerated method to control the JTAG clock by the RTCK signal (Accelerated Returned TCK).Theoretically RTCK mode allows frequencies up to 2/3 of the processor clock.For designs using a very low processor clock we offer a different mode (ARTCK) which might not work on all target systems. In ARTCK mode the debugger uses a fixed JTAG frequency for TCK, independent of the RTCK signal. TDI and TMS will be delayed by 1/2 TCK clock cycle. TDO will be sampled with RTCK
CTCK With this option higher JTAG speeds can be reached. The TDO signal will be sampled by a signal which derives from TCK, but which is timely compensated regarding the debugger internal driver propagation delays (Compensation by TCK). This feature can be used with a debug cable versions 3b or newer. If it is selected, although the debug cable is not suitable, a fix JTAG clock will be selected instead (minimum of 10 MHz and selected clock).
CRTCK With this option higher JTAG speeds can be reached, if your target provides RTCK. The TDO signal will be sampled by the RTCK signal. This compensates the debugger internal driver propagation delays, the delays on the cable and on the target (Compensation by RTCK). This feature requires that the target provides a RTCK signal. Other as on RTCK option, the TCK is always output with the selected, fix frequency.
The modes RTCK, ARTCK, CRTCK can only be used if the target provides a RTCK signal.Furthermore the modes are only available with the 20-pin Debug Cable LA-3750 (or LA-3750A in an ARM Debug Cable).
Format: SYStem.LOCK [ON | OFF]
ARC Debugger 36 ©1989-2018 Lauterbach GmbH

It must be ensured that the state of the JTAG state machine remains unchanged while the system is locked. To ensure correct hand over the options SYStem.CONFIG TAPState and SYStem.CONFIG TCKLevel must be set properly. They define the TAP state and TCK level which is selected when the debugger switches to tristate mode. Please note: nTRST must have a pull-up resistor on the target.
SYStem.MemAccess Real-time memory access (non-intrusive)
This option declares if an non-intrusive memory access can take place while the CPU is executing code. Although the CPU is not halted, run-time memory access creates an additional load on the processor’s internal data bus.
If SYStem.MemAccess is not Denied, it is possible to read from memory, to write to memory and to set software breakpoints while the CPU is executing the program.
If specific windows, that display memory or variables should be updated while the program is running select the memory class prefix E: or the format option %E.
See also
Memory ClassesSYStem.CpuAccess
Format: SYStem.MemAccess CPU | Denied | <cpu_specific>SYStem.ACCESS (deprecated)
CPU Real-time memory access during program execution to target is enabled.
Denied Real-time memory access during program execution to target is disabled.
Data.dump ED:0x100
Data.List EP:main
Var.View %E first
ARC Debugger 37 ©1989-2018 Lauterbach GmbH

SYStem.Mode Select target reset mode
Format: SYStem.Mode <mode>
<mode>: DownNoDebugAttachUpGoPrepare
Down The debug adapter gets tristated. The state of the CPU remains unchanged. Debug mode is not active.In this mode the target behaves as if the debugger is not connected.
If SYStem.Option.EnReset.ON is set to ON and SYStem.CONFIG.Slave is set to OFF the debugger will drive a low-active reset pulse on the nRESET (nSRST) on the JTAG connector.
NoDebug The debug adapter gets tristated.The state of the CPU remains unchanged. Debug mode is not active.In this mode the target behaves as if the debugger is not connected.
Attach Initializes the debug interface and connects to core while program remains running.
After this command the user program can be stopped with the break command or by any other break condition (e.g a breakpoints).
Up Initializes the debug interface, enters debug mode, stops the core and initializes several registers to their reset value. The debugger sets the program counter to the reset address of the core.
If SYStem.Option.EnReset.ON is set to ON and SYStem.CONFIG.Slave is set to OFF the debugger will drive a low-active reset pulse on the nRESET (nSRST) on the JTAG connector.
Go Start code execution from reset vector.Actually the debugger performs the same actions than on SYStem.Mode.Up followed by Go.direct.
ARC Debugger 38 ©1989-2018 Lauterbach GmbH
Prepare Allow memory access without checking the go-stated of the core.
On SoCs with CoreSight DAP the debugger connects to the DAP and allows accesses to the APB, AHB and/or AXI bus - without communicating with the ARC core.
On SoCs with direct JTAG connection to the ARC core, memory can be accessed via the ARC core in prepare-mode.
StandBy Not available for ARC.(This mode is used to start debugging from power-on. The debugger will wait until power-on is detected, then initialize the debug interface and connect to core.)
NOTE: SYStem.Down is an abbreviation for SYStem.Mode Down.SYStem.Up is an abbreviation for SYStem.Mode Up.SYStem.Attach is an abbreviation for SYStem.Mode Attach.
ARC Debugger 39 ©1989-2018 Lauterbach GmbH

SYStem.Option Set a target specific option
Set target specific options, e.g. SYStem.Option Endianness or SYStem.Option IMASKHLL. See the description of the available options below.
SYStem.Option AHBHPROT Select AHB-AP HPROT bits
Default: 0
Selects the value used for the HPROT bits in the Control Status Word (CSW) of an AHB Access Port of a DAP, when using the AHB: memory class.
This option is only meaningful, if the chip contains a CoreSight DAP.
SYStem.Option AXIACEEnable ACE enable flag of the AXI-AP
Default: OFF
Enables ACE transactions on the DAP AXI-AP, including barriers. This does only work if the debug logic of the target CPU implements coherent AXI accesses. Otherwise this option will be without effect.
This option is only meaningful, if the chip contains a CoreSight DAP.
Format: SYStem.Option <option> <value>
Format: SYStem.Option AHBHPROT <value>
Format: SYStem.Option AXIACEEnable [ON | OFF]
ARC Debugger 40 ©1989-2018 Lauterbach GmbH

SYStem.Option AXICACHEFLAGS Select AXI-AP CACHE bits
Default: 0
This option selects the value used for the CACHE and DOMAIN bits in the Control Status Word (CSW) of an AXI Access Port of a DAP, when using the AXI: memory class.
This option is only meaningful, if the chip contains a CoreSight DAP.
Format: SYStem.Option AXICACHEFLAGS <value>
<value>: DEVICENONSHAREABLEDEVICEINNERSHAREABLEDEVICEOUTERSHAREABLEDeviceSYStem NonCacheableNonShareableNonCacheableInnerShareableNonCacheableOuterShareableNonCacheableSYStem WriteThroughNonShareableWriteThroughInnerShareableWriteBackOuterShareableWRITETHROUGHSYSTEM
DEVICENONSHAREABLE CSW.CACHE = 0x0, CSW.DOMAIN = 0x0
DEVICEINNERSHAREABLE CSW.CACHE = 0x1, CSW.DOMAIN = 0x1
DEVICEOUTERSHAREABLE CSW.CACHE = 0x1, CSW.DOMAIN = 0x2
DeviceSYStem CSW.CACHE = 0x1, CSW.DOMAIN = 0x3
NonCacheableNonShareable CSW.CACHE = 0x2, CSW.DOMAIN = 0x0
NonCacheableInnerShareable CSW.CACHE = 0x3, CSW.DOMAIN = 0x1
NonCacheableOuterShareable CSW.CACHE = 0x3, CSW.DOMAIN = 0x2
NonCacheableSYStem CSW.CACHE = 0x3, CSW.DOMAIN = 0x3
WriteThroughNonShareable CSW.CACHE = 0x6, CSW.DOMAIN = 0x0
WriteThroughInnerShareable CSW.CACHE = 0xA, CSW.DOMAIN = 0x1
WriteBackOuterShareable CSW.CACHE = 0xE, CSW.DOMAIN = 0x2
WRITETHROUGHSYSTEM CSW.CACHE = 0xE, CSW.DOMAIN = 0x3
ARC Debugger 41 ©1989-2018 Lauterbach GmbH

SYStem.Option AXIHPROT Select AXI-AP HPROT bits
Default: 0
This option selects the value used for the HPROT bits in the Control Status Word (CSW) of an AXI Access Port of a DAP, when using the AXI: memory class.
This option is only meaningful, if the chip contains a CoreSight DAP.
SYStem.Option DAPDBGPWRUPREQ Force debug power in DAP
Default: ON.
This option controls the DBGPWRUPREQ bit of the CTRL/STAT register of the Debug Access Port (DAP) before and after the debug session. Debug power will always be requested by the debugger on a debug session start because debug power is mandatory for debugger operation.
Use case:
Imagine an AMP session consisting of at least of two TRACE32 PowerView GUIs, where one GUI is the master and all other GUIs are slaves. If the master GUI is closed first, it releases the debug power. As a result, a debug port fail error may be displayed in the remaining slave GUIs because they cannot access the debug interface anymore.
To keep the debug interface active, it is recommended that SYStem.Option DAPDBGPWRUPREQ is set to AlwaysON.
This option is only meaningful, if the chip contains a CoreSight DAP.
Format: SYStem.Option AXIHPROT <value>
Format: SYStem.Option DAPDBGPWRUPREQ [ON | AlwaysON]
ON Debug power is requested by the debugger on a debug session start, and the control bit is set to 1.The debug power is released at the end of the debug session, and the control bit is set to 0.
AlwaysON Debug power is requested by the debugger on a debug session start, and the control bit is set to 1.The debug power is not released at the end of the debug session, and the control bit is set to 0.
ARC Debugger 42 ©1989-2018 Lauterbach GmbH
SYStem.Option DAPREMAP Rearrange DAP memory map
The Debug Access Port (DAP) can be used for memory access during runtime. If the mapping on the DAP is different than the processor view, then this re-mapping command can be used
This option is only meaningful, if the chip contains a CoreSight DAP.
SYStem.Option DAPSYSPWRUPREQ Force system power in DAP
Default: ON.
This option controls the SYSPWRUPREQ bit of the CTRL/STAT register of the Debug Access Port (DAP) during and after the debug session
This option is only meaningful, if the chip contains a CoreSight DAP.
Format: SYStem.Option DAPREMAP {<address_range> <address>}
NOTE: Up to 16 <address_range>/<address> pairs are possible. Each pair has to contain an address range followed by a single address.
Format: SYStem.Option DAPSYSPWRUPREQ [AlwaysON | ON | OFF]
AlwaysON System power is requested by the debugger on a debug session start, and the control bit is set to 1.The system power is not released at the end of the debug session, and the control bit remains at 1.
ON System power is requested by the debugger on a debug session start, and the control bit is set to 1.The system power is released at the end of the debug session, and the control bit is set to 0.
OFF System power is not requested by the debugger on a debug session start, and the control bit is set to 0.
ARC Debugger 43 ©1989-2018 Lauterbach GmbH

SYStem.Option DAPNOIRCHECK No DAP instruction register check
Default: OFF.
Bug fix for derivatives which do not return the correct pattern on a DAP (ARM CoreSight Debug Access Port) instruction register (IR) scan. When activated, the returned pattern will not be checked by the debugger.
This option is only meaningful, if the chip contains a CoreSight DAP.
SYStem.Option DEBUGPORTOptions Options for debug port handling
Default: auto.
This option is only required for expert users in case a non-standard SWD implementation is used.
JTAGTOSWD tells the debugger what to do when switching from JTAG to SWD mode:
SWDDORMANT tells the debugger how to handle a dormant state when switching to SWD:
Format: SYStem.Option DAPNOIRCHECK [ON | OFF]
Format: SYStem.Option DEBUGPORTOptions <option>
<option>: JTAGTOSWD.[auto | CORTEX | LUMINARY | None]SWDDORMANT.[auto | WakeUp | NoWakeUp]
auto Auto detection.The debugger tries to detect the correct SWD to JTAG shift sequence.
CORTEX Switching procedure like it should be done for Cortex cores.
LUMINARY Switching procedure like it should be done for LuminaryMicro devices.
None Do not send any SWD to JTAG sequence.
auto Auto detection.
WakeUp Wake up the debug port without prior checks by sending DORMANT to SWD sequence.
NoWakeUp Do not wake up the debug port by suppressing the DORMANT to SWD sequence.
ARC Debugger 44 ©1989-2018 Lauterbach GmbH

This option is only meaningful, if the chip contains a CoreSight DAP.
SYStem.Option detectOTrace Disable auto-detection of on-chip trace
Default: OFF.
When connecting the debugger to the ARC core via commands SYStem.Mode Attach or SYStem.Mode Up the debugger tries to detect if the ARC on-chip trace (SmaRT) by reading auxiliary register 255 (AUX:0xFF).For some reason some rare core implementations without SmaRT seem to have a fatal side-effect on AUX:0xFF. For these cores use this option to avoid the read of AUX:0xFF during SYStem.Mode Attach or SYStem.Mode Up.
SYStem.Option Endianness Set the target endianness
Default: AUTO.
This option selects the target byte ordering mechanism (endianness). It effects the way data is read from or written to the target CPU.
In AUTO mode the debugger sets the endianness corresponding to the “ARC Build Registers”, when the debugger is attached to the target. AUTO mode is not available for ARCtangent-A4 cores.
Consider that the compiler, the ARC core and the debugger should all use the same endianness.
SYStem.Option EnReset Allow the debugger to drive nRESET (nSRST)
Default: OFF.
If this option is set to ON, the debugger will drive a low-active reset pulse on the nRESET (nSRST) line on the JTAG connector on SYStem.Up and SYStem.Down.
Format: SYStem.Option detectOTrace [ON | OFF]
Format: SYStem.Option Endianness [Big | Little | AUTO]
Format: SYStem.Option EnReset [ON | OFF]
ARC Debugger 45 ©1989-2018 Lauterbach GmbH

From the view of the core, it is not necessary that nRESET (nSRST) becomes active at the start of a debug session (SYStem.Up), but there may be other logic on the target which requires a reset.
If SYStem.CONFIG.Slave or SYStem.Opiton IntelSOC is set to ON, the debugger will never drive the nRESET (nSRST), independently from SYStem.Option EnReset.
SYStem.Option HotBreakPoints Set breakp. when CPU is running
Default: AUTO.
This option controls how software breakpoints are set to a running ARC core:
SYStem.Option IMASKASM Disable interrupts while single stepping
Default: OFF.
If enabled, the debug core will disable all interrupts for the CPU, when single stepping assembler instructions. No hardware interrupt will be executed during single-step operations. When you execute a Go command, the hardware interrupts will be enabled again, according to the system control registers.
Format: SYStem.Option HotBreakPoints [AUTO | ON | OFF]
ON The debugger tries to set a software breakpoint while the CPU is running, if SYStem.MemAccess is set to CPU
OFF To set a software breakpoint, the debugger tries to stop the CPU temporarily, if SYStem.CpuAccess is set to ENABLED.
AUTO To set a software breakpoint, the debugger stops the CPU temporarily if the CPU has an Instruction Cache (requires SYStem.CpuAccess set to ENABLED) otherwise the debugger tries to set a software breakpoint while the CPU is running (requires SYStem.MemAccess set to CPU)
Format: SYStem.Option IMASKASM [ON | OFF]
ARC Debugger 46 ©1989-2018 Lauterbach GmbH
SYStem.Option IMASKHLL Disable interrupts while HLL single stepping
Default: OFF.
If enabled, the debug core will disable all interrupts for the CPU, during HLL single-step operations. When you execute a Go command, the hardware interrupts will be enabled again, according to the system control registers. This option should be used in conjunction with IMASKASM.
SYStem.Option IntelSOC Core is part of Intel® SoC
Default: OFF.
Informs the debugger that the ARC core is part of an Intel® SoC. When enabled, all IR and DR pre/post settings are handled automatically, no manuel configuration is necessary.
Requires that the ARC debugger is slave in a multicore setup. The master of the multicore setup must be “TRACE32 for x86” with SYStem.Option.CLTAPOnly enabled.
SYStem.Option LimmBreakPoints Software breakpoints with extra NOPs
Default: OFF.
Any ARC instruction set allows instructions with so called Long Immediate Data (LIMM). These instructions have a total length of 6 or 8 bytes. When setting a software breakpoint the instruction at the address of the software breakpoints gets replaced by a BRK or BRK_S instruction. The BRK instruction has a length of 4
Format: SYStem.Option IMASKHLL [ON | OFF]
Format: SYStem.Option IntelSOC [ON | OFF] [<socid>]
<socid> An integer ID used by TRACE32 to identify a specific core in an SOC if there is more than one core of the same type. This ID is platform specific. For more details, see “Slave Core Debugging” in Intel® x86/x64 Debugger, page 34 (debugger_x86.pdf).Default: 0.
Format: SYStem.Option LimmBreakPoints [ON | OFF]
ARC Debugger 47 ©1989-2018 Lauterbach GmbH
byte and the BRK_S has a length of 2 bytes. When SYStem.Option LimmBreakPoints is set to ON the remaining 2 or 4 bytes of a LIMM instruction are overwritten with NOP_S instructions when setting a software breakpoint on them.
This option helps to workaround a buggy implementation of an ARC core.
SYStem.Option MMUSPACES Enable space IDs
Default: OFF.
Enables the use of space IDs for logical addresses to support multiple address spaces.
Examples:
Format: SYStem.Option MMUSPACES [ON | OFF]SYStem.Option MMUspaces [ON | OFF] (deprecated)SYStem.Option MMU [ON | OFF] (deprecated)
NOTE: SYStem.Option MMUSPACES should not be used if only one translation table is used on the target.
If a debug session requires space IDs, you must observe the following sequence of steps:
1. Activate SYStem.Option MMUSPACES.
2. Load the symbols with Data.LOAD.
Otherwise, the internal symbol database of TRACE32 may become inconsistent.
;Dump logical address 0xC00208A belonging to memory space with ;space ID 0x012A:Data.dump D:0x012A:0xC00208A
;Dump logical address 0xC00208A belonging to memory space with ;space ID 0x0203:Data.dump D:0x0203:0xC00208A
ARC Debugger 48 ©1989-2018 Lauterbach GmbH

SYStem.Option OVERLAY Enable overlay support
Default: OFF.
SYStem.Option RegNames Enable trivial names for core registers
Default: ON.
This option just effects the way core registers are displayed e.g. in the Register.view window or in disassembled memory. If the option is enabled some core registers are displayed by their trivial names describing the registers function e.g. “blink” for core register 31. When disabled the systematic name is used corresponding tho the register number e.g. “r31” for core register 31.
Format: SYStem.Option OVERLAY [ON | OFF | WithOVS]
ON Activates the overlay extension and extends the address scheme of the debugger with a 16 bit virtual overlay ID. Addresses therefore have the format <overlay_id>:<address>. This enables the debugger to handle overlaid program memory.
OFF Disables support for code overlays.
WithOVS Like option ON, but also enables support for software breakpoints. This means that TRACE32 writes software breakpoint opcodes both to the execution area (for active overlays) and to the storage area. In this way, it is possible to set breakpoints into inactive overlays. Upon activation of the overlay, the target’s runtime mechanisms copies the breakpoint opcodes to the execution area. For using this option, the storage area must be readable and writable for the debugger.
SYStem.Option OVERLAY ON Data.List 0x2:0x11c4 ; Data.List <overlay_id>:<address>
Format: SYStem.Option IMASKHLL [ON | OFF]
ARC Debugger 49 ©1989-2018 Lauterbach GmbH

SYStem.Option PowerDetection Choose method to detect the target power
Default: VTREF.
Selects the method how the debugger detects if the target system is powered.
SYStem.Option ResetDetection Choose method to detect a target reset
Default: Sem1.
Selects the method how an external target reset can be detected by the debugger.
Format: SYStem.Option PowerDetection <method>
<method>: VTREFPowerGood
VTREF The debugger uses the VTREF line on the debug connector to check if the target system is powered.
PowerGood The debugger uses the PWRGOOD line on the debug connector to check if the target system is powered.This setting is only available if the used debug probe supports the PowerGood signal.
Format: SYStem.Option ResetDetection <method>
<method>: Sem0 | Sem1 | Sem2 | Sem3RAbitnSRSTNone
Sem0 … Sem3 Detects a reset if corresponding semaphore bit in the SEMAPHORE auxiliary register (AUX:0x01) is set to zero. This option is not available on ARC700 and ARC-EM cores, since these cores do not have a SEMAPHORE register.(This method detects “core resets”.)
RAbit Detects a reset by checking the RA-bit in the JTAG status register or DEBUG auxiliary Register (AUX:0x05). This option is only available for ARC cores with JTAG version 2 or higher. (This detects core resets.)(This method detects “core resets”.)
ARC Debugger 50 ©1989-2018 Lauterbach GmbH

SYStem.Option TIMEOUT Define maximum time for core response
Default: 1000.ms
After each JTAG transaction the debugger has to wait until the ARC core acknowledges the successful transaction.
With this option you can specify how long the debugger waits until the debugger has to assume that the core does no longer respond. You have to use this option only if you what to debug a unusual slow core.
nSRST Detects a reset if nSRTS line on the debug connector is pulled low.(This method detects a “chip resets” or a complete “target resets”.)Furthermore by enabling this option the debugger will actively pull down the nSRST line while in system-down state and when going to system-up state and.
None Detection of external resets is disabled.
Format: SYStem.Option TIMEOUT <time>
ARC Debugger 51 ©1989-2018 Lauterbach GmbH

SYStem.POWER Control target power
This command requires a MIPI60 debug probe (e.g. CombiProbe with MIPI60 whisker).
If supported by the target and the used debug probe, this command turns the target power ON (if off) or OFF (if on), or does a power CYCLE (if on) via the PowerGood signal (pin#42 on MIPI60 connector).
SYStem.state Show SYStem settings window
Opens a window which enables you to view and modify CPU specific system settings.
Format: SYStem.POWER [ON | OFF | CYCLE]
Format: SYStem.state
ARC Debugger 52 ©1989-2018 Lauterbach GmbH
On-chip Breakpoints/Actionpoints
“On-chip Breakpoints” and “Actionpoints” are two names for the same thing: A mechanism provided by the on-chip debug logic to stop the core when an instruction is fetched form a specific address or data is read from or written to a specific memory location. This enables you to set breakpoints even if your not able to modify the code on the fly e.g. in a Read Only Memory.
“Actionpoints” is the name used by Synopsys in the ARC manuals, while “On-chip Breakpoints” is the generic name used by Lauterbach. In the rest of the documentation we’ll speak only about “On-chip Breakpoints”.
An ARC core can have 2, 4, 8 or none on-chip breakpoints. The debugger detects the number of available breakpoints after you’ve connected to your target CPU with SYStem.Up or SYStem.Mode Attach. To find out how many on-chip breakpoints are available execute PER.view, "Build" and check the value at “AP_BUILD”.
Using On-chip Breakpoints
See chapters Break and On-chip Breakpoints in the “General Commands Reference Guide B”.
.
On ARC600 you can set on-chip breakpoints only when the core is stopped. You can set SYStem.CpuAccess to Enable to allow the debugger to stop and restart the core to set on-chip breakpoints.
On ARC700 you can set on-chip breakpoints also while the core is running, when you’ve set SYStem.MemAccess to CPU.
Breakpoints in a ROM Area
With the command MAP.BOnchip <range> it is possible to tell the debugger where you have ROM / FLASH on the target. If a breakpoint is set into a location mapped as BOnchip it gets automatically implemented as on-chip breakpoint.
When a read or write breakpoint triggers, any ARC CPU stops with an additional delay after the instructions, which causes the trigger.The delay is 1 cycle for ARC700 and 3 cycles for ARC600. For memory reads there is an extra delay corresponding to the memory latency.(However program breakpoints always stop before executing the instruction.)
ARC Debugger 53 ©1989-2018 Lauterbach GmbH

Limitations
Due to limitations in the ARC core logic, some common features for on-chip breakpoint are not available.
• ARC600 and ARC700 cores do not provide resources to set on-chip breakpoints for arbitrary address or data ranges. Instead they use bit masks. If a given range can’t be programmed with a bit mask, the next larger range will be used, if TrOnchip.CONVert is active.You can check the address ranges actually set by the debugger inside the Break.List /Onchip window.
• While normal read breakpoints are available, which stop the core on the read of a given address, so called “read data breakpoints” area not available. So you can’t stop the core, when specific data is read from a given address.(“Write data breakpoints” are available.)
• On ARC700 you can use “Write data breakpoints” together with address ranges only for 32-bit wide data.
• For ARC600 using on-chip program breakpoints together with instruction data is not supported, since the on-chip logic of an ARC600 does not align the fetched instruction before comparing it to the value, which make this feature useless.
• On ARC600 you can’t set on-chip breakpoints, while the core is running.
ARC Debugger 54 ©1989-2018 Lauterbach GmbH
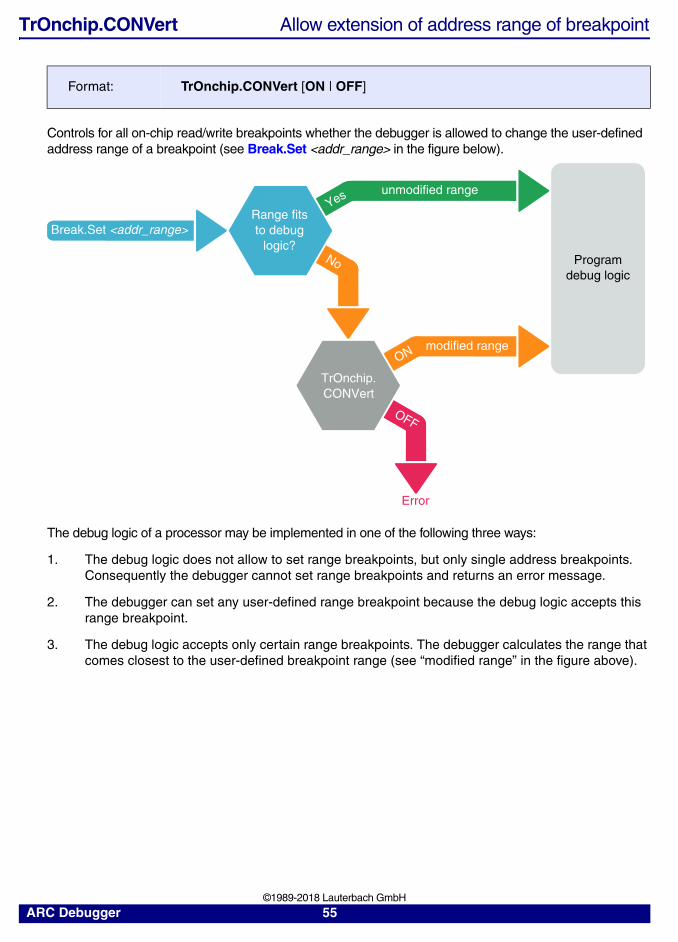
TrOnchip.CONVert Allow extension of address range of breakpoint
Controls for all on-chip read/write breakpoints whether the debugger is allowed to change the user-defined address range of a breakpoint (see Break.Set <addr_range> in the figure below).
The debug logic of a processor may be implemented in one of the following three ways:
1. The debug logic does not allow to set range breakpoints, but only single address breakpoints. Consequently the debugger cannot set range breakpoints and returns an error message.
2. The debugger can set any user-defined range breakpoint because the debug logic accepts this range breakpoint.
3. The debug logic accepts only certain range breakpoints. The debugger calculates the range that comes closest to the user-defined breakpoint range (see “modified range” in the figure above).
Format: TrOnchip.CONVert [ON | OFF]
Range fitsto debug
logic?No
Break.Set <addr_range>
Programdebug logic
Yes
Yes unmodified range
TrOnchip.CONVert
OFF
ONmodified range
No
Error
ARC Debugger 55 ©1989-2018 Lauterbach GmbH

The TrOnchip.CONVert command covers case 3. For case 3) the user may decide whether the debugger is allowed to change the user-defined address range of a breakpoint or not by setting TrOnchip.CONVert to ON or OFF.
In the Break.List window, you can view the requested address range for all breakpoints, whereas in the Break.List /Onchip window you can view the actual address range used for the on-chip breakpoints.
ON(default)
If TrOnchip.Convert is set to ON and a breakpoint is set to a range which cannot be exactly implemented, this range is automatically extended to the next possible range. In most cases, the breakpoint now marks a wider address range (see “modified range” in the figure above).
OFF If TrOnchip.Convert is set to OFF, the debugger will only accept breakpoints which exactly fit to the debug logic (see “unmodified range” in the figure above).If the user enters an address range that does not fit to the debug logic, an error will be returned by the debugger.
ARC Debugger 56 ©1989-2018 Lauterbach GmbH

TrOnchip.VarCONVert Convert breakpoints on scalar variablesf
Controls for all scalar variables whether the debugger sets an HLL breakpoint with Var.Break.Set only on the start address of the scalar variable or on the entire address range covered by this scalar variable.
Format: TrOnchip.VarCONVert [ON | OFF]
Programdebug logicYes
Yes unmodified range
Range fitsto debug
logic?
TrOnchip.VarCONVert
ONsingle address
TrOnchip.CONVert
Var.Break.Set <scalar>
ONmodified range
OF
F
No
OFF
addr
rang
e
No
OFF
Error
ARC Debugger 57 ©1989-2018 Lauterbach GmbH

In the Break.List window, you can view the requested address range for all breakpoints, whereas in the Break.List /Onchip window you can view the actual address range used for the on-chip breakpoints.
TrOnchip.OnchipBP Number of on-chip breakpoints used by debugger
Default: AUTO.
An ARC core has between 0 and 8 on-chip breakpoint resources (Called “Actionpoints” in the ARC core documentation). These resources are normally completely controlled by the debugger and are modified e.g. when you set on-chip breakpoints e.g. via Break.Set <addr> /Onchip /Write.
Sometimes you might want to control the breakpoint resources (AUX:0x220--0x237) or parts of it by you own. With TrOnchip.OnchipBP you can tell the debugger how many on-chip breakpoint registers the debugger may control, leaving the rest of them untouched.
ON If TrOnchip.VarCONVert is set to ON and a breakpoint is set to a scalar variable (int, float, double), then the breakpoint is set only to the start address of the scalar variable.• Allocates only one single on-chip breakpoint resource.• Program will not stop on accesses to the variable’s address space.
OFF(default)
If TrOnchip.VarCONVert is set to OFF and a breakpoint is set to a scalar variable (int, float, double), then the breakpoint is set to the entire address range that stores the scalar variable value.• The program execution stops also on any unintentional accesses
to the variable’s address space.• Allocates up to two on-chip breakpoint resources for a single
range breakpoint.NOTE: The address range of the scalar variable may not fit to the debug logic and has to be converted by the debugger, see TrOnchip.CONVert.
Format: TrOnchip.OnchipBP [<number> | AUTO]
ARC Debugger 58 ©1989-2018 Lauterbach GmbH

E.g.: If you have an ARC core with 4 on-chip breakpoints but you want control one breakpoint by your own, set TrOnchip.OnchipBP to 3. The registers you can control then by your own are those of the fourth breakpoint (AUX:0x229--0x22b).
TrOnchip.RESet Set on-chip trigger to default state
Sets the TrOnchip settings and trigger module to the default settings.
TrOnchip.state Display on-chip trigger window
Opens the TrOnchip.state window.
NOTE: This option is only for advanced users which have a good knowledge of the Actionpoint Auxiliary Registers described in the ARC600 Ancillary Components Reference or the ARC700 System Components Reference.
Format: TrOnchip.RESet
Format: TrOnchip.state
ARC Debugger 59 ©1989-2018 Lauterbach GmbH

CPU specific MMU Commands
MMU.DUMP Page wise display of MMU translation table
Displays the contents of the CPU specific MMU translation table.
• If called without parameters, the complete table will be displayed.
• If the command is called with either an address range or an explicit address, table entries will only be displayed, if their logical address matches with the given parameter.
The optional <root> argument can be used to specify a page table base address deviating from the default page table base address. This allows to display a page table located anywhere in memory.
CPU specific tables:
Format: MMU.DUMP <table> [<range> | <addr> | <range> <root> | <addr> <root>]MMU.<table>.dump (deprecated)
<table>: PageTableKernelPageTableTaskPageTable <magic_number> | <task_id> | <task_name><cpu_specific_tables>
PageTable Display the current MMU translation table entries of the CPU. This command reads all tables the CPU currently uses for MMU translation and displays the table entries.
KernelPageTable Display the MMU translation table of the kernel.If specified with the MMU.FORMAT command, this command reads the MMU translation table of the kernel and displays its table entries.
TaskPageTable <magic_number> | <task_id> | <task_name>
Display the MMU translation table entries of the given process. In MMU based operating systems, each process uses its own MMU translation table. This command reads the table of the specified process, and displays its table entries.See also the appropriate OS awareness manuals: RTOS Debugger for <x>.For information about the parameters, see “What to know about Magic Numbers, Task IDs and Task Names” (general_ref_t.pdf).
ITLB Displays the contents of the Instruction Translation Lookaside Buffer.
DTLB Displays the contents of the Data Translation Lookaside Buffer.
ARC Debugger 60 ©1989-2018 Lauterbach GmbH

MMU.List Compact display of MMU translation table
Lists the address translation of the CPU-specific MMU table. If called without address or range parameters, the complete table will be displayed.
If called without a table specifier, this command shows the debugger-internal translation table. See TRANSlation.List.
If the command is called with either an address range or an explicit address, table entries will only be displayed, if their logical address matches with the given parameter.
TLB Displays the contents of the Translation Lookaside Buffer.
TLB0 Displays the contents of the Translation Lookaside Buffer 0.
Format: MMU.List <table> [<range> | <addr> | <range> <root> | <addr> <root>] MMU.<table>.List (deprecated)
<table>: PageTableKernelPageTableTaskPageTable <magic_number> | <task_id> | <task_name> | <space_id>:0x0
<root> The optional <root> argument can be used to specify a page table base address deviating from the default page table base address. This allows to display a page table located anywhere in memory.
PageTable List the current MMU translation of the CPU. This command reads all tables the CPU currently uses for MMU translation and lists the address translation.
KernelPageTable List the MMU translation table of the kernel.If specified with the MMU.FORMAT command, this command reads the MMU translation table of the kernel and lists its address translation.
TaskPageTable <magic_number> | <task_id> | <task_name>
List the MMU translation of the given process. In MMU-based operating systems, each process uses its own MMU translation table. This command reads the table of the specified process, and lists its address translation.See also the appropriate OS awareness manuals: RTOS Debugger for <x>.For information about the parameters, see “What to know about Magic Numbers, Task IDs and Task Names” (general_ref_t.pdf).
ARC Debugger 61 ©1989-2018 Lauterbach GmbH

MMU.SCAN Load MMU table from CPU
Loads the CPU-specific MMU translation table from the CPU to the debugger-internal translation table. If called without parameters, the complete page table will be loaded. The loaded address translation can be viewed with TRANSlation.List.
If the command is called with either an address range or an explicit address, page table entries will only be loaded if their logical address matches with the given parameter.
Format: MMU.SCAN <table> [<range> <address>]MMU.<table>.SCAN (deprecated)
<table>: PageTableKernelPageTableTaskPageTable <magic_number> | <task_id> | <task_name>ALL<cpu_specific_tables>
PageTable Load the current MMU address translation of the CPU. This command reads all tables the CPU currently uses for MMU translation, and copies the address translation into the debugger-internal translation table.
KernelPageTable Load the MMU translation table of the kernel.If specified with the MMU.FORMAT command, this command reads the table of the kernel and copies its address translation into the debugger-internal translation table.
TaskPageTable <magic_number> | <task_id> | <task_name>
Load the MMU address translation of the given process. In MMU-based operating systems, each process uses its own MMU translation table. This command reads the table of the specified process, and copies its address translation into the debugger-internal translation table.See also the appropriate OS awareness manual: RTOS Debugger for <x>.For information about the parameters, see “What to know about Magic Numbers, Task IDs and Task Names” (general_ref_t.pdf).
ALL Load all known MMU address translations. This command reads the OS kernel MMU table and the MMU tables of all processes and copies the complete address translation into the debugger-internal translation table. See also the appropriate OS awareness manual: RTOS Debugger for <x>.
ARC Debugger 62 ©1989-2018 Lauterbach GmbH
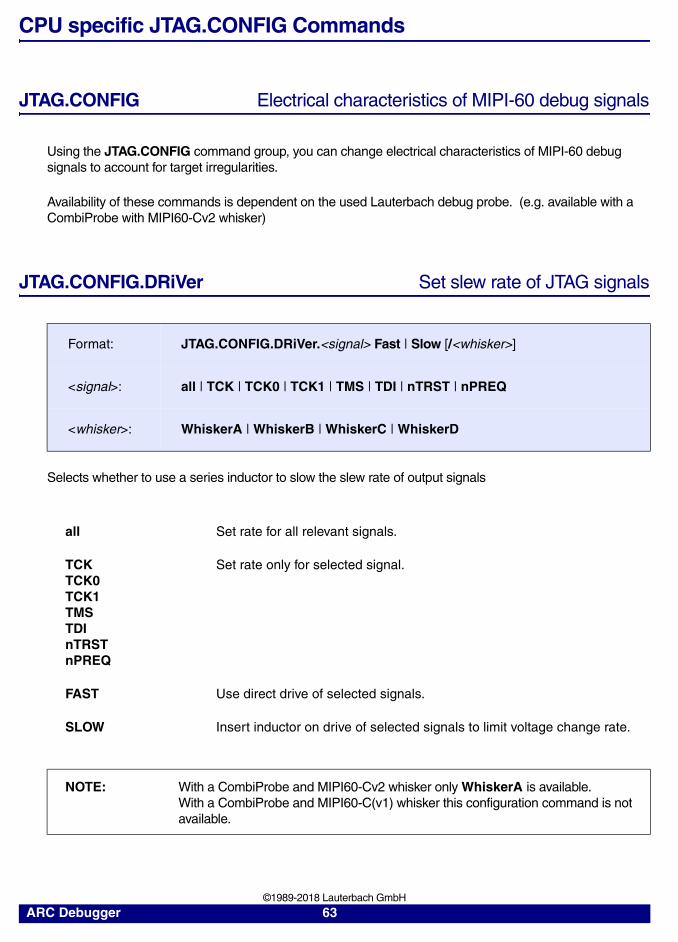
CPU specific JTAG.CONFIG Commands
JTAG.CONFIG Electrical characteristics of MIPI-60 debug signals
Using the JTAG.CONFIG command group, you can change electrical characteristics of MIPI-60 debug signals to account for target irregularities.
Availability of these commands is dependent on the used Lauterbach debug probe. (e.g. available with a CombiProbe with MIPI60-Cv2 whisker)
JTAG.CONFIG.DRiVer Set slew rate of JTAG signals
Selects whether to use a series inductor to slow the slew rate of output signals
Format: JTAG.CONFIG.DRiVer.<signal> Fast | Slow [/<whisker>]
<signal>: all | TCK | TCK0 | TCK1 | TMS | TDI | nTRST | nPREQ
<whisker>: WhiskerA | WhiskerB | WhiskerC | WhiskerD
all Set rate for all relevant signals.
TCKTCK0TCK1TMSTDInTRSTnPREQ
Set rate only for selected signal.
FAST Use direct drive of selected signals.
SLOW Insert inductor on drive of selected signals to limit voltage change rate.
NOTE: With a CombiProbe and MIPI60-Cv2 whisker only WhiskerA is available. With a CombiProbe and MIPI60-C(v1) whisker this configuration command is not available.
ARC Debugger 63 ©1989-2018 Lauterbach GmbH
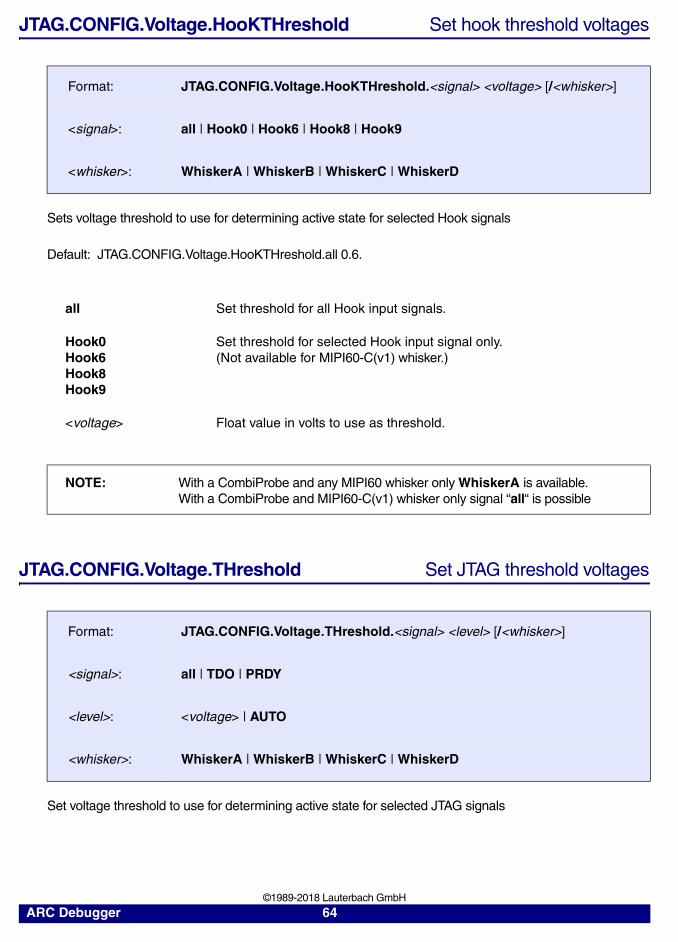
JTAG.CONFIG.Voltage.HooKTHreshold Set hook threshold voltages
Sets voltage threshold to use for determining active state for selected Hook signals
Default: JTAG.CONFIG.Voltage.HooKTHreshold.all 0.6.
JTAG.CONFIG.Voltage.THreshold Set JTAG threshold voltages
Set voltage threshold to use for determining active state for selected JTAG signals
Format: JTAG.CONFIG.Voltage.HooKTHreshold.<signal> <voltage> [/<whisker>]
<signal>: all | Hook0 | Hook6 | Hook8 | Hook9
<whisker>: WhiskerA | WhiskerB | WhiskerC | WhiskerD
all Set threshold for all Hook input signals.
Hook0Hook6Hook8Hook9
Set threshold for selected Hook input signal only. (Not available for MIPI60-C(v1) whisker.)
<voltage> Float value in volts to use as threshold.
NOTE: With a CombiProbe and any MIPI60 whisker only WhiskerA is available. With a CombiProbe and MIPI60-C(v1) whisker only signal “all“ is possible
Format: JTAG.CONFIG.Voltage.THreshold.<signal> <level> [/<whisker>]
<signal>: all | TDO | PRDY
<level>: <voltage> | AUTO
<whisker>: WhiskerA | WhiskerB | WhiskerC | WhiskerD
ARC Debugger 64 ©1989-2018 Lauterbach GmbH

Default: JTAG.CONFIG.Voltage.THreshold.all AUTO.
JTAG.CONFIG.Voltage.REFerence Voltage level of signals send to target
Selects voltage level with which all signals from the debug probe to the target system are driven.
Default: JTAG.CONFIG.Voltage.REFerence AUTO.
all Set threshold for TDO and PRDY. (Sets also voltage threshold for VTREF on a MIPI60-C(v1) whisker.)
TDOPRDY
Set threshold for only selected signal. (Not available for MIPI60-C(v1) whisker.)
AUTO Use threshold derived from reference voltage.
<voltage> Value in volts to use as threshold.
NOTE: With a CombiProbe and any MIPI60 whisker only WhiskerA is available. With a CombiProbe and MIPI60-C(v1) whisker only signal “all“ is possible
Format: JTAG.CONFIG.Voltage.REFerence <voltage> | AUTO
Setting a too high voltage level may damage you target hardware!Don’t use this command unless you know, which voltage levels can be handled by your CPU device.
<voltage> Use specified value in volts as reference voltage.
AUTO Output voltage set by measuring reference voltage supplied from target system.
NOTE: With a CombiProbe and MIPI60-Cv2 whisker only WhiskerA is available. With a CombiProbe and MIPI60-C(v1) whisker this command is not available.
ARC Debugger 65 ©1989-2018 Lauterbach GmbH

Connector Type and Pinout
Normal 20-Pin Connector
The 20-pin connector is the typical connector used with ARC CPUs but also with quite a lot of other CPU families (like e.g. ARM Cortex). The Lauterbach debug cable LA-3750 is designed for this pin-out.
The following drawing shows the top view to the male connector on the target board.
The meaning of the signals is as follows:
Signal Pin Pin SignalVTREF 1 2 VSUPPLY (not used)
TRST- (optional) 3 4 GNDTDI 5 6 GND
TMS|TMSC 7 8 GNDTCK|TCKC 9 10 GND
RTCK (optional) 11 12 GNDTDO 13 14 GND
SRST- (optional) 15 16 GND(leave open) 17 18 GND(leave open) 19 20 GND
TCK | TCKC to CPU JTAG ClockIt is recommended to put a pull-DOWN to GND on this signal.
TMS to CPU Standard JTAG TMSIt is recommended to put a pull-UP to VTREF on this signal for standard 4-pin JTAG.
TMSC to/from CPU Compact JTAG TMSCYour chip should have a bus-hold on this line for compact JTAG.
TDI to CPU JTAG TDIIt is recommended to put a pull-UP to VTREF on this signal.Only required for standard 4-pin JTAG / Optional for compact JTAG.
TDO from CPU JTAG TDO (No pull-up or pull-down is required.)Only required for standard 4-pin JTAG / Optional for compact JTAG.
TRST- to CPU JTAG Testport Reset (Optional signal)No pull-up or pull-down is required.
ARC Debugger 66 ©1989-2018 Lauterbach GmbH

For details on logical functionality, physical connector, alternative connectors, electrical characteristics, timing behavior and printing circuit design hints refer to “ARM JTAG Interface Specifications” (arm_app_jtag.pdf).
RTCK from CPU JTAG Return Clock (Optional signal)No pull-up or pull-down is required.
VTREF from CPU Reference voltageThis voltage should indicate the nominal HIGH level for the JTAG and trace pins. So for example, if your signals have a voltage swing from 0 … 3.3 V, the VTREF pin should be connected to 3.3 V.
SRST- to/from CPU System Reset Signal. (Optional signal)If your board has a low active CPU reset signal, you can connect this low active reset signal to this pin. This enables the debugger to detect a CPU reset (see SYStem.Option.ResetDetection.nSRST). Furthermore the debugger can drive this pin to GND to reset the CPU (see SYStem.Option.EnReset). The debugger drives this pin as open-drain, so a pull-up is mandatory.
ARC Debugger 67 ©1989-2018 Lauterbach GmbH

MIPI10 / MIPI20 / MIPI34 Connector
For the pin-out of the MIPI10, MIPI20, or MIPI34 connector see http://www.lauterbach.com/adarmcombi.html.
You can connect to the MIPI10, MIPI20, or MIPI34 connector by either using a converter for the normal 20-pin debug cable, or by using a CombiProbe with a standard MIPI34 whisker (which is suitable for MIPI10, MIPI20 and MIPI34)
Converged MIPI60-Cv2 Connector
For the converged MIPI60 target pinout specified by Intel®see“MIPI60-Cv2 Connector” (debugger_x86.pdf)or http://www.lauterbach.com/adcobintelx86.html
To use this connector you usually need a Lauterbach CombiProbe with MIPI60-Cv2 whisker plus a separate ARC debug license. (LA-4580 + LA3750A)
Legacy MIPI60-C Connector
For the legacy MIPI60-C target connector specified by Intel® see “MIPI60-Cv2 Connector” (debugger_x86.pdf)or http://www.lauterbach.com/adcobintelx86.html
XDP Connector
For the 60-pin XDP connector specified by Intel® see“JTAG Connector” (debugger_x86.pdf)or http://www.lauterbach.com/adatom.html
The Lauterbach debug cable LA-3752 is designed for the 60-pin XDP pin-out.
Do not use the legacy MIPI60-C connector for new designs.
Instead use the “Converged MIPI60-Cv2 Connector”, page 68.
Do not use the 60-pin XDP connector for new designs.
Instead use the “Converged MIPI60-Cv2 Connector”, page 68.
ARC Debugger 68 ©1989-2018 Lauterbach GmbH

Support
Available Tools
CP
U
ICE
FIR
E
ICD
DE
BU
G
ICD
MO
NIT
OR
ICD
TR
AC
E
PO
WE
RIN
TE
GR
ATO
R
INS
TR
UC
TIO
NS
IMU
LA
TOR
ARC-A4 YESARC-A5 YESARC-EM11D YES YESARC-EM4 YES YESARC-EM5D YES YESARC-EM6 YES YESARC-EM7D YES YESARC-EM9D YES YESARC-HS34 YES YESARC-HS36 YES YESARC-HS38 YES YESARC-HS44 YES YESARC-HS45D YES YESARC-HS46 YES YESARC-HS47D YES YESARC-HS48 YES YESARC601 YESARC605 YESARC605LE YESARC610D YESARC625D YESARC710D YESARC725D YESARC750D YESARC770D YESAS210 YESAS211SFX YESAS221BD YES
ARC Debugger 69 ©1989-2018 Lauterbach GmbH

Compilers
Target Operating Systems
Language Compiler Company Option Comment
C/C++ GNU-GCC Free Software Foundation, Inc.
ELF/DWARF
C/C++ METAWARE-C/C++ Synopsys, Inc ELF/DWARF
Company Product Comment
freeRTOS FreeRTOS up to v9- Linux Kernel Version 2.4 and 2.6, 3.x, 4.xMicrium Inc. MicroC/OS-IISynopsys, Inc MQX 2.40 and 2.50, 3.6Express Logic Inc. ThreadX 3.0, 4.0, 5.0
ARC Debugger 70 ©1989-2018 Lauterbach GmbH
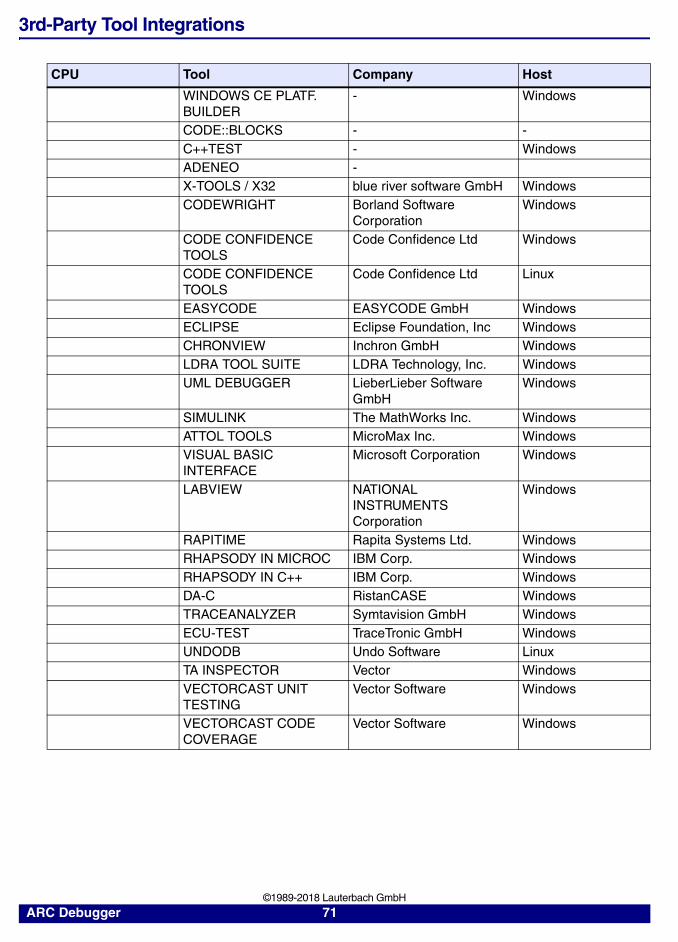
3rd-Party Tool Integrations
CPU Tool Company Host
WINDOWS CE PLATF. BUILDER
- Windows
CODE::BLOCKS - -C++TEST - WindowsADENEO -X-TOOLS / X32 blue river software GmbH WindowsCODEWRIGHT Borland Software
CorporationWindows
CODE CONFIDENCE TOOLS
Code Confidence Ltd Windows
CODE CONFIDENCE TOOLS
Code Confidence Ltd Linux
EASYCODE EASYCODE GmbH WindowsECLIPSE Eclipse Foundation, Inc WindowsCHRONVIEW Inchron GmbH WindowsLDRA TOOL SUITE LDRA Technology, Inc. WindowsUML DEBUGGER LieberLieber Software
GmbHWindows
SIMULINK The MathWorks Inc. WindowsATTOL TOOLS MicroMax Inc. WindowsVISUAL BASIC INTERFACE
Microsoft Corporation Windows
LABVIEW NATIONAL INSTRUMENTS Corporation
Windows
RAPITIME Rapita Systems Ltd. WindowsRHAPSODY IN MICROC IBM Corp. WindowsRHAPSODY IN C++ IBM Corp. WindowsDA-C RistanCASE WindowsTRACEANALYZER Symtavision GmbH WindowsECU-TEST TraceTronic GmbH WindowsUNDODB Undo Software LinuxTA INSPECTOR Vector WindowsVECTORCAST UNIT TESTING
Vector Software Windows
VECTORCAST CODE COVERAGE
Vector Software Windows
ARC Debugger 71 ©1989-2018 Lauterbach GmbH

Products
Product Information
OrderNo Code Text
LA-3750 JTAG-ARC
JTAG Debugger for ARC (ICD)supports ARC 700, ARC 600, ARC EM, ARC HS,ARCtangent-A5 and ARCtangent-A4includes software for Windows, Linux and MacOSXrequires Power Debug Moduledebug cable with 20 pin connector
LA-3750A JTAG-ARC-A
JTAG Debugger License for ARC Add.supports ARC 700, ARC 600, ARC EM, ARC HS,ARCtangent-A5 and ARCtangent-A4please add the base serial number of your debugcable to your order
LA-3752 JTAG-ARC-XDP
JTAG Debugger for ARC XDP 60 (ICD)supports ARC 700, ARC 600, ARC EM, ARC HS,ARCtangent-A5 and ARCtangent-A4includes software for Windows, Linux and MacOSXrequires Power Debug Moduledebug cable with 60 pin XDP connector
LA-3914X TRACE-LICENSE-ARC
Trace License for ARC (Cable)Support for Nexus Onchip Trace (ARC RTT)(Not required for "Small Onchip Trace" (SmaRT))please add the base serial number of your debugcable to your order
LA-3860 CONV-ARM-PPC16
Converter ARM-20 to PPC-16Converter to connect a ARM Debug Cableto a 16 pin PowerPC connector (PPC4xx)
ARC Debugger 72 ©1989-2018 Lauterbach GmbH

Order Information
Order No. Code Text
LA-3750 JTAG-ARC JTAG Debugger for ARC (ICD)LA-3750A JTAG-ARC-A JTAG Debugger License for ARC Add.LA-3752 JTAG-ARC-XDP JTAG Debugger for ARC XDP 60 (ICD)LA-3914X TRACE-LICENSE-ARC Trace License for ARC (Cable)LA-3860 CONV-ARM-PPC16 Converter ARM-20 to PPC-16
Additional OptionsLA-2101 AD-HS-20 Adapter Half-Size 20 pinLA-4585 COB-DCI-OOB Package CombiProbe Intel® DCI OOBLA-4580 COB-MIPI60-CV2 Package CombiProbe MIPI60-Cv2LA-4581 COB-MIPI60-CV2-L Package CombiProbe MIPI60-Cv2 LongLA-2720 CON-ARM20-MIPS14 Converter ARM-20 to MIPS-14LA-3722 CON-JTAG20-MICTOR ARM Converter ARM-20 to Mictor-38LA-3770 CONV-ARM20/MIPI34 ARM Converter ARM-20 to MIPI-10/20/34LA-3776A DEBUG-INTEL-X86-A JTAG Debugger for Intel x86/x64 Add.LA-7760A EJTAG-MIPS32-A Debugger License for MIPS32 Add.LA-3778A JTAG-APS-A JTAG Debugger License for APS Add.LA-7744A JTAG-ARM10-A JTAG Debugger License for ARM10 Add.LA-7765A JTAG-ARM11-A JTAG Debugger License for ARM11 Add.LA-7746A JTAG-ARM7-A JTAG Debugger License for ARM7 Add.LA-7742A JTAG-ARM9-A JTAG Debugger License for ARM9 Add.LA-7843A JTAG-ARMV7-A/R-A JTAG Debugger Lic. Cortex-A/-R (32-bit) Add.LA-3743A JTAG-ARMV8-A-A JTAG Debugger Lic. Cortex-A/R (ARMv8) Add.LA-7844A JTAG-CORTEX_M-A JTAG Debugger License for Cortex-M Add.LA-7774A JTAG-TEAK-JAM-20-A JTAG Debug. for Teak/TeakLite JAM 20 Add.LA-3760A JTAG-XTENSA-A JTAG Debugger License for Xtensa Add.LA-7960X MULTICORE-LICENSE License for Multicore Debugging
ARC Debugger 73 ©1989-2018 Lauterbach GmbH