Embed Size (px)
Citation preview

Indian Journal of Marine Sciences Vol. 2S, September 1 999, pp. 225-232
Environmental characteristics of the United Arab Emirates waters along the Arabian Gulf : Hydrographical survey and nutrient salts
Mohammed M A Shriadah* & Saif M. AI-Ghais Desert and Marine Environment Research Center, United Arab Emirates University.
AI-Ain. P O Box 1 7777, United Arab Emirates
Received 1 January 1998, revised 30 March 1999
Surface and bottom seawater samples were collected monthly from October 1 993 to September 1 994 at twenty-four stations. The levels of different parameters were in the range of : temperature ( I 6.90-34.60°C). salinity (35.2-44.0x I 0-\ transparency (0.5- 1 3 .0 m), pH (7.9 1 -8.60), dissolved oxygen (3.63-9.02 mgll), biological oxygen demand (0.05-6. 1 1 mgll), ammonia (ND- 1 5.32 �g-at Nil). nitrite (ND-5 . I S �g-at Nil), nitrate (0.07- 1 4.32 �g-at Nil), phosphate (0.0 I - I 0.2 Ilg-at P/I) . and silicate (0.4-26.5 �g-at Sill). The patterns of distriblltion indicated insignificant differences between surface and bottom layers due to the shallowness of the area, turbulence of the water column, and effects of sewage wastewaters. Water temperatures exhibited their lowest average value in the winter season and the highest in the summer season. The lowest averages of salinity, transparency, pH, and dissolved oxygen were measured in the summer season. Whereas. the highest averages for these parameters were observed in the winter season. Except for nitrate and phosphate. insigniticant differences between average values of other nutrient salts in the summer and winter seasons were observed. Nitrate and phosphate showed lower average values in the summer season compared to the winter season due to the increase in the rate of uptake by phytoplankton which was more abundant in the summer season. Horizontal patterns of distributions for hydrographic parameters revealed only an increase for transparency and a decrease for biological oxygen demand in a seaward direction. Except for Sharjah creek, no distinct horizontal patterns of distributions for nutrient salts were observed. At Sharjah, most of the nutrient salts decreased in a seaward direction due to the presence of effective sewage pollution sources inside the creek. The atomic ratio of the elements N: P: Si were similar in Abu-Dhabi, Umm al-Quwain, and Ras al-Khaimah areas. but with lower values in Sharjah. It is concluded that the discharge of sewage and industrial wastes has affected the quality .of . . ' seawater inside some semi-enclosed areas, especially Sharjah creek, as indicated by the increase in the levels of biologic'al ' oxygen demand and the elevation in the concentrations of the nutrient salts.
. . .:. . .
The marine environment of the Arabian Gulf and in particular the United Arab Emirates is subjected to different types of pollutants- oil from production and transportation, as well as disposal of industrial and sewage wastes, which may lead to environmental problems and serious health hazards. Coastal
. development programs and other human activities can also affect the environment. Although the Arabian Gulf waters have been subjected to a reasonable number of oceanographic investigations ' ·4, knowledge on the United Arab Emirates territorial waters is extremely poor due to the lack of regular observations.
The present work is an attempt to elucidate the variations and distributions of the hydrographical parameters and nutrient salts as an index of potential fertility and indicators of anthropogenic inputs in the United Arab Emirates waters .
*For correspondence and Present address: Department of Marine Chemistry, National Institute of Oceanography and Fisheries. Kayet Bey, AI-Anfushi, Alexandria, Egypt
Materials and Methods The coast of the United Arab EroirMes., Which '
extends for more than 800 km alo�g th6 Arabian G�1f and the Gulf of Oman has several :' w"ate� creeks, locally known as "Khors". These khors are semienclosed, long and narrow, channel-like wa�r, .boates that increase in width landward, extend ior-(e'l!s' of kilometers and used as harbours. These' cree�·(jmch: as Abu Dhabi, Dubai, Sharjah, Ajman,' Upun alQuwain, Ras al-Khaimah, and Kalba, a�.e e�posyd 'to polluting discharges from numerous sour�ei,-. rriainlY: industrial and municipal wastewater. - .: .� .: . . '
Surface and bottom water samples (average depth 7 m) were collected monthly (October 1 993 to September, 1 994) at 24 stations selected in the territorial waters of the Emirates of Abu Dhabi, Sharjah, Umm al-Quwain, Ras al-Khaimah (Fig. I ) . Seawater sampling was done using a Hydro-Bios plastic water sampler and analyzed for temperature, salinity, transparency, pH, dissolved oxygen, biological oxygen demand, and ' nutrient salts

226 I NDIAN 1. MAR. SCI. , VOL., 28, SEPTEMBER 1999 .
N . 55 � 25\9 t
Arabian GuJf
Arabian S u 54 00
N · 55 40 t
2 K . ��----------� u •• AI-Quwain Khor
o ,. 24 00
o SOKII I......-..J
o ,. S5 25 Abu - Dhilbi Khor 2 K m '--'
Fig. I -The Gulf coast of the United Arab Emirates and locations of sampling stations.
(ammonia, mtrIte, nitrate, phosphate, and silicate) . Seawater samples for nutrient salts were immediately treated with 0.5% chloroform to prevent or at least to minimize changes. Samples were kept in wellstoppered polyethylene bottles and were frozen at an extremely low temperature (-25°C). Air and surface temperatures were measured using an ordinary thermometer graduated to O. I °C. Bottom water temperatures were measured by using a protected thermometer with a scale ranging from -5 to 3 1 °C. Salinity measurements were carried out using a salinometer (calibrated labcomp model SeT - 1 000) and pH by means of a portable pH-meter (Hanna HI 83 14 membrane pH-meter). Dissolved oxygen (DO) was determined according to Grasshoff, and biological oxygen demand (BOD) according to APHA7. Determination of nutrient salts (ammonia, nitrite, nitrate, phosphate, and silicate) were carried out spectrophotometrically according to the methods 'described by Grasshoff.
Results and Discussion Temperature
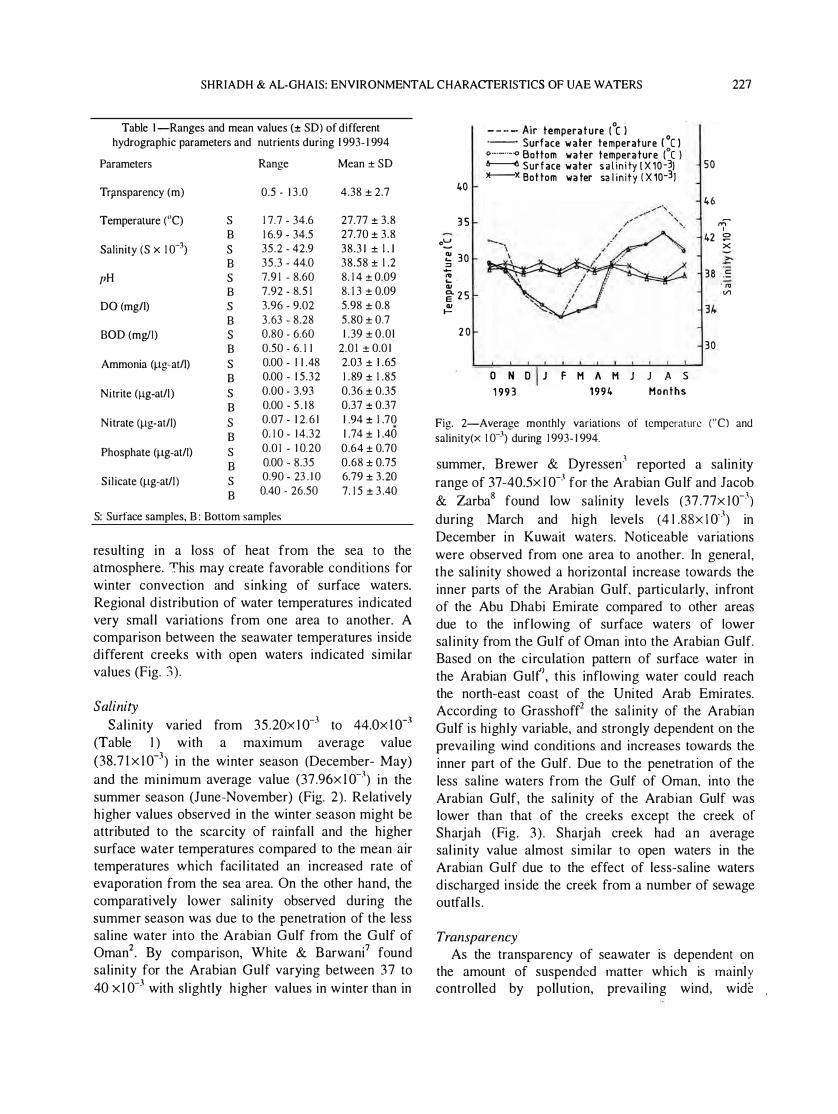
Temperature showed, general ly, broad varIatIOns which fol lowed that of the air (Table I ) . The minimum seawater temperatures were measured in the winter season (December-May) when air temperatures were at minimum. In response to the rising of air temperatures in the s'ummer season (JuneNovember), an increase in seawater temperatures has occurred. As a result of mixing and the sha!low nature of the water body (average depth 7 m), surface water temperatures were, however, same as bottom water temperatures. Another feature in the distribution of temperature, is the lower values at the surface compared with air temperature in most months (Fig. 2) resulting in a transfer of heat from the atmosphere to the water. This may increase the stability and stratification of water column. In contrast, the surface water temperatures were higher than air temperatures during December and January
SHRIADH & AL-GHAIS: ENVIRONMENTAL eHARACfERISTles OF UAE WATERS 227
Table I -Ranges and mean values (± SD) of different hydrographic parameters and nutrients during 1 993- 1 994
Parameters Range Mean ± SD
Trflnsparency (m) 0.5 - 1 3 .0 4.38 ± 2.7
Temperature (Ue) S 1 7.7 - 34.6 27.77 ± 3.8 B 1 6.9 - 34.5 27.70 ± 3.8
Salinity (S x 1 0-') S 35.2 - 42.9 38.3 1 ± 1 . 1 B 35 .3 - 44.0 38.58 ± 1 .2
pH S 7.9 1 - 8.60 8. 1 4 ± 0.09 B 7.92 - 8.5 1 8. 1 3 ± 0.09
DO (mg/I) S 3.96 - 9.02 5.98 ± 0.8 B 3.63 - 8.28 5 .80 ± 0.7
BOD (mg/I) S 0.80 - 6.60 1 .39 ± 0.01 B 0.50 - 6. 1 1 2.0 1 ± 0.0 1
Ammonia (Ilg-atll) S 0.00 - 1 1 .48 2.03 ± 1 .65
B 0.00 - 1 5 .32 1 . 89 ± 1 .85
Nitrite (Ilg-atll ) S 0.00 - 3.93 0.36 ± 0.35
B 0.00 - 5 . 1 8 0.37 ± 0.37
Nitrate (Ilg-at/l) S 0.07 - 1 2. 6 1 1 .94 ± 1 .70
B 0. 1 0 - 1 4.32 1 .74 ± 1 .40
Phosphate (Ilg-atll) S 0.0 1 - 1 0.20 0.64 ± 0.70
B 0.00 - 8.35 0.68 ± 0.75
Silicate (Ilg-atll) S 0.90 - 23 . 1 0 6.79 ± 3.20
B 0.40 - 26.50 7. 1 5 ± 3 .40
S: Surface samples, B : Bottom samples
resulting in a loss of heat from the sea to the atmosphere. This may create favorable conditions for winter convection and s inking of surface waters. Regional d istribution of water temperatures indicated very smal l variations from one area to another. A comparison between the seawater temperatures inside different creeks with open waters indicated simi lar values (Fig. 3).
Salinity Salinity varied from 35.20x I 0-' to 44.0x 1 0-"
(Table I ) with a maximum average value (38.7 1 x 1 0-3) in the winter season (December- May) and the minimum average value (37 .96x 1 0-') in the summer season (June-November) (Fig. 2) . Relatively higher values observed in the winter season might be attributed to the scarcity of rainfall and the higher surface water temperatures compared to the mean air temperatures which faci l i tated an increased rate of evaporation from the sea area. On the other hand, the comparatively lower sal inity observed during the summer season was due to the penetration of the less saline water into the Arabian Gulf from the Gulf of Oman2• By comparison, White & Barwani7 found salinity for the Arabian Gulf varying between 37 to 40 X 1 0-3 with slightly h igher values in winter than in
40
3 5
o=: � 3 0 :::l -'" ... . CII � 2 5 CII f-
2 0
• 0 . - - - - Air tempera t u re ( C ) 0 ._- Surface w a ter te mperature ( C ) 0'-'-"-0 Bottom wa ter tempera ture (oC ) . Ir-----t. Sur f ace water s a l i ni ty ( X 10 -3) If-'--X Bot tom wa ter sa I in ity ( X 10-3,
O N D J F M A M J J A S
1 9 9 3 1 9 9 4 M o n t h s
5 0
46
rf" 42 �
x :t::
38 c: -. '" til
30
Fig. 2-Average monthly variations of temperature ("e) and salinity(x 1 0-') during 1 993- 1 994.
summer, Brewer & Dyressen' reported a salin ity range of 37-40.5x 1 0-' for the Arabian Gu lf and Jacob & Zarba8 found low salin ity levels (37 .77x I 0-') during March and high levels (4 1 .88x I 0·') in December in Kuwait waters. Noticeable variations were observed from one area to another. In general, the sal inity showed a horizontal increase towards the inner parts of the Arabian Gulf, particularly, infront of the Abu Dhabi Emirate compared to other areas due to the inflowing of surface waters of lower sal inity from the Gulf of Oman into the Arabian Gulf. Based on the circulation pattern of surface water in the Arabian Gulf, this inflowing water could reach the north-east coast of the United Arab Emirates. According to Grasshoff2 the sal inity of the Arabian Gulf is highly variable, and strongly dependent on the prevail ing wind conditions and increases towards the inner part of the Gulf. Due to the penetrat ion of the less saline waters from the Gulf of Oman, into the Arabian Gulf, the salinity of the Arabian Gulf was lower than that of the creeks except the creek of Sharjah (Fig. 3) . Sharjah creek had an average sal inity value almost simi lar to open waters in the Arabian Gulf due to the effect of less-saline waters discharged inside the creek from a number of sewage outfal ls.
Transparency As the transparency of seawater is dependent on
the amount of suspended matter which is mainly controlled by pollution, prevail ing wind, wide

228 INDIAN J. MAR. SCI.. VOL.. 28, SEPTEMBER 1 999
"-01 e c: CII � X 0 10 '0 CII .=: o .::1 8 i5 e � 6 c: CII L.. IV CL � 4 IV L..
I-
� 2
o
,.,,� '0 50 eX � c: 40 IV
III
o� 30 CII L.. ::J . ..... IV :u. 20 I-CL e
� 10 r-
� Off - Shore waters
� Ras At - K h aimah water C reek
. I : - : -: I Umm At- Quwain water C reek
o At-Sha rjah water C reek
_ Abu - Dhabi water C reek "-0'1 - 3 e
� c: /U e CII
"0 c: - 2 �
-
>. x o
Iii u .01 o o
II)
S a t ih i ty Transparency
Fig. 3-Comparison between the average values of hydrographic parameters for the offshore and di fferent creek waters during 1 993- 1 994.
variations in Secchi disc readings were found (Table 1). In general, the seawater in the area was more transparent during the winter season (4.8 1 m) than the summer season (3 .95 m) (Fig. 4) . This might
' be attributed to an increase in turbidity caused mainly by increased phytoplankton abundance in summer favored by a rise in water temperatures4• 1 O• On the other hand, regional variations in the Secchi djsc readings indicated the presence of relatively clear water at off-shore stations whereas, low transparency conditions prevailed in the innermost part of Sharjah creek. This can be attributed to a high turbidity caused by high plankton density and high levels of sewage pollution. According to SharaflO much higher plankton density and chlorophyll concentrations were measured in the innermost stations of Sharjah creek compared to offshore &tatiqns. The average Secchi disc read.ings for-different. creeks were much lower than open waters (Fig. 3).
Hydrogen ion concentration The pH of seawater is influenced by a combination
of factors, of which the principal ones are photosynthetic actlVlty, dissolved oxygen conc�ntrations and seW<lge 'Yastewaters. General ly, the 'average pH values of surface and bottom water (8. 1 3 and 8. i 2). were similar due to the shallowness of the area arid turbulence of the water column as well C\S the effect of sewage wastewaters discharged inside
o o
c O 9 � � >. � x "0 o C "0 � B QI QI > "0
O c .� � 7 o >--: � E
� IV �.i5. 6 c 0 QI -... 0 [ :0 1iI "O 5 C c � IV
I-
� 4 2
1
*-x Transpare n cy ( m ) '--. Surface pH va lues .- - - -. Bottom pH values � Surface ,DO v a lues ( m g / l l A--i Bottom DO values ( mg / l ) e_ Surface BOD va l ues I m g/ l ) - Bottom BOD values ( m g/ l )
:::-::--·---• .,::::::- --!::-:::::I _ __ _ _ _ _ a ______ •
O N D J F H A H J J A S 1 993 1 994 Honths
Fig. 4-Average monthly variations of pH. transparency (m). dissolved oxygen (mg/I). and biological oxygen demand (mg/I) during 1 993- 1 994.

SHRIADH & AL-GHAIS: ENVIRONMENTAL CHARACfERISTlCS OF UAE WATERS 229
the creeksl l- 1 3 • However, maximum seasonal average pH value of 8.23 observed in the winter season (Fig. 4) . Whereas, the minimum seasonal average value (8.01 ) was observeq in the summer season due to the oxidation of organic materials which results in CO2 generation. Moreover, the low pH values recorded in the summer season were accompanied by a relative decrease in the concentrations of dissolved oxygt!n. Emara et al.4 found low pH levels in less oxygenated Arabian Gulf waters. Very limited regional variations in pH were observed during the period of study. Except for Sharjah creek, the pH values inside the creeks were more or less similar to the pH values of open waters (Fig. 3).
Dissolved oxygen Dissolved oxygen showed broad variations (Table
1 ) . It varied from 3.63 to 9.02 mg/1. In general, the average values of dissolved oxygen were more or less similar at the surface (5.98 mg/I) and bottom waters (5.80 mg/I) due to mixing of the water, and the effect of sewage waste waters discharged inside the creeks loaded with high amounts of organic materials and floating at the surface 1 1 . 1 3 • The water of the area (Fig. 4) was more oxygenated (6.35 mg/I) during the winter season (December-May) and less oxygenated (5 .40
mg/I) during the summer season (June-November) . The high values recorded in the winter season were due to an increase in solubility of oxygen with the decrease in the temperature and water agitation. The relative decrease during the summer season was due to the rise of water temperature, and increased rate of decomposition at higher temperature. Insignificant differences were observed between concentrations of dissolved oxygen inside the creeks and the Arabian Gulf waters (Fig. 3). By comparison, the levels of dissolved oxygen in the seawater of Kuwait'4 varied from 5 .92 to 9.69 mg/I with an average value of 7.46 mg/1.
Biological oxygen demand B iological oxygen demand fluctuated between 0.5
and 6.60 mg/l (Table 1 ). The seasonal average values of BOD were more or less similar in the winter (December-May) and the summer (June-November) seasons ( 1 .36 and 1 .24 mg/I). Vertical distribution of BOD, on the other hand, showed more or less similar values at surface water ( 1 .39 mg/I) and bottom water ( 1 .2 1 mg/I) due to the shallowness of the area, and turbulence of the water column. A comparison
� between the BOD levels in the seawater inside the creeks with open seawater indicated higher values in the former than off�shore waters (Fig. 3) due to the more sewage and microorganisms pollution inside the creeks particularly inside the creek of Sharjah, which is subjected to huge quantities of sewage waste· waters from a number of outfal ls" · ' � . According to ECPH report", 1 mg/I BOD is a characteristic of nearly pure water. Water is considered fairly pure with a BOD of 3 mg/I and of doubtful purity when the BOD values reach 5 mg/1 . A comparison between these levels with those of the present study showed that the annual average BOD values for the area amounting to 1 .30 mg/I is indicative of fairly pure water in the area of study.
Ammonia Ammonia showed wide variations (Table I ) .
Vertical distribution of ammonia revealed no distinct
....... .... '" CI :::I, � '"
L. .... :z � '" ..c:; 0-1/1 0 ..c:; 0..
�
4
3
2
-- Surface nitrate v a l ues(pg at/I ) ........... -.. Botton nitrate v alues ( }J g at/ I ) )!--� Surface s i l i cate values ( }Jg at/ l ) 11--11 Botton . s i l i c ate values ( }Jg at/ I ) - Surf a ce phosphate values (}Jg at/ I ) - - - - - Botton phosphate values ( Jlg at/ I )
-- Surface ammonia value·s ( }Jg a t/ I )
4 0--•.• -..... Bottom a mmonia v alues ( }Jg at/ I ) - Surface nitri t e vahJes ( }Jg at/ \ ) - - - - - Bottom n i t� ite ·v.alues ( }J!fat! l )
� 3 .3-'" ·c � 2 E
<
8 _
....... .... '" 6 g:
... .... ", 4 =
Vl
2
8
... 4 := 1:
:z:
O��������������O o N 0 J F M .A M · J J A S-
1 9 93 1 994 Monlhs
Fig. 5-Average monthly variations of nfltrient salts (�g-at11) during ·1 993 - 1 99!.

230 INDIAN 1. MAR. SCI., VOL., 28, SEPTEMBER 1 999
0.6
" :. '0 .4 IV C'I � QJ .... ...
......
Z 0 . 2
o
� ro
.&: cVI o
.&: Q..� 2 -
" Z ......
ro C'I �, <LI .... � 1
-0-z
� ro c o E E
<
� O ff.-·Shore waters
� Ras AI-Khaimah Creek
A mmon i a N itrite
Q U m m At- Quwain Creek
c:J AI - Sh arj a h Cre,ek
_ Abu - Dh abi C reek
N i trate Phosph a te S i l i c a t e
1 5
10 -" V'l ..... ro c:n :::J.. QJ .... ro u
5 .-
V'I
o
Fig, 6-Comparison between the average values of nutrient salts (Jlg-atfl) for the offshore and different creek waters during 1 993- 1 994,
patterns of distribution. The difference between average concentrations at the surface and bottom layers was not significant (Table I ) . However, higher concentrations were measured in the summer (JuneNovember) than the winter (December-May) seasons (Fig_ 5) . The higher values measured in the summer season (June-November) were principally due to the oxidation of organic materials particularly inside the creeks where they receive increasing quantities of waste waters from several outlets in addition to the waste from hundreds of boats"- 1 3 • This is supported by the relative decrease in oxygen contents (5 .40 mg/I) during the summer season. The lower values were measured in the winter season (December-May) and attributed to a decrease in the rate of oxidation of these organic materials at the low water temperature (24.6°C). This is supported by the high oxygen contents (6.35 mgll) during the winter season. A comparison between concentrations of ammonia inside the creeks and open seawater (Fig. 6) indicated a general tendency for ammonia to decrease in a seaward direction due to dilution .
Nitrite
Nitrite exhibited wide variations (Table I ) . Vertical distribution of nitrite showed irregular patterns particularly inside the creeks. It is of importance to note that there could be many reasons behind this i rregularity. However, the most obvious reasons were the shallowness of the area, the influence of pol lution and turbulence of the water column " - 1 3 • In general, the surface and bottom waters in the investigated area had simi lar levels of nitrite (Table I ) . Moreover, distribution patterns of nitrite indicated simi lar average concentrations during summer and winter months. Regional variat ions, on the other hand, indicated h igh concentration in the Sharjah creek which is subjected to man-made interferences through dumping of domestic wastewaters. The highest nitrite average regional value was a result of the oxidation of organic materials originating mainly from these domestic wastewaters, and was accompanied by higher concentrations of biological oxygen demand (5 .40 mg/I) compared to other areas. Except for

S HRIADH & AL-GHAIS: ENVIRONMENTAL CHARACfERISTICS OF UAE WATERS 23 1
Table 2-Atomic ratios N: P: Si at different parts along the Arabian Gulf Coast of the United Arab Emirates
Parameters Abu-Dhabi Area
. Inorganic nitrogen 4.38 (Ilg-atll)
Inorganic phosphorus 0.46 (Ilg-atll)
Inorganic silicon 6.74
(Ilg-atll)
Atomic ratio 1 :9.5: 1 6.6
P: N: Si
Sharjah creek, average values in the creeks were close to that of open seawater at the Arabian Gulf (Fig. 6).
Nitrate The average concentrations of nitrate showed
generally higher values at the surface compared to bottom waters (Table I ) due to nitrification
16 •
processes . Moreover, lower values were measured in the summer season compared to the winter season (Fig. 5) due to an increase in nitrate uptake by phytoplankton which was abundant in the Summer Season4• 1O• Except for Sharjah creek, the average concentrations of nitrate inside the creeks were nearly similar to offshore waters. A tendency for nitrate to decrease in a seaward direction was observed in the seawater of Sharjah (Fig. 6). The higher concentrations of nitrate in Sharjah waters were due to the highest rate of nitrate regeneration from
. . I 1 1 - 1 1 d I k . 1 0 orgamc matena s . , an zoop an ton excretIOn .
Phosphate Phosphate showed wide variations with similar
levels at the surface and bottom layers during the period of study (Table I ). Seasonal variations indicated high values and a maximum average value in the winter season (December-May). Whereas low values and a low minimum average value were observed in the summer season (Fig. 5). The decrease of phosphate in the summer season (June-November) was presumably related to the increase in the rate of uptake by phytoplankton which was more abundant in the summer season 10. Except for Sharjah creek, the average values of phosphate inside the creeks were close to offshore waters.
Sharjah Umm al- Ras al-Khaimah Area Quwain Area Area
4.7 1 4.09 3.52
1 .36 0.46 0.36
8.42 6.98 5 .60
1 :3.5 :6.0 1 :8.9: 1 5 .2 1 :9.80: 1 5 .6
Silicate Si licate showed broad variations with higher levels
at the . bottom compared to surface waters (Table I ) may be due to the release of silicate from bottom sediments l6 and utilization of sil icate in the euphotic zone by organisms such as diatoms 10. Seasonal variations indicated insignificant differences between the average values in the summer and winter season (Fig. 5). Except for Sharjah creek, the average values inside the creeks were close to off-shore waters (Fig. 6) .
N: P: S atomic ratios The atomic ratio of N: P: Si were similar in Abu
Dhabi, Umm al-Quwain, and Ras al-Khaimah areas, but with a lower value in Sharjah waters (Table 2) . Except for the ratio of Sharjah, the ratio of Si : P in other areas was close to normal ( I : 1 6) , while the ratio of N:P was generally below 1 0 due to the effect of disposal of either improperly or partially treated municipal waste water particularly inside Sharjah creek where the N:P:Si ratio was very far from the normal ratio ( I : 1 6: 1 6) . In various parts of the Gulf, there was no available data concerning the mentioned ratio except of Emara et al. 6, who stated that nitrogen is the l imiting element in the Qatar waters.
Based on this study, it became clear that the discharge of industrial and municipal wastewater has affected the quality of the seawater, which was more clear in the creek of Sharjah, as manifested by the high levels of biological oxygen demand and the elevation of nutrient salts leading to damaging effects on both inshore ecosystems, fisheries and recreational facilities. It is, therefore, highly recommended to prevent the discharge of sewage pollution inside these semi-enclosed areas, especially inside Sharjah creek.

232 INDIAN J. MAR. SCI. , VOL., 28, SEPTEMBER 1 999
Once these measures have been taken, the creek of Sharjah will undergo a self purifying cycle.
References I Kuronuma K, Trans Tokyo Un iv, Fish, No I ( 1 974) 1 1 8.
2 Grasshoff K, UNESCO Rep Mar Sci, 26 ( 1 976) 39.
3 Brewer P G & Dyressen D, Prog Oceanog 1 4 ( 1 985) 4 1 .
4 Emara H I , EI-Samra M I & EI-Deeb K Z, Bull Nat [nst Oceanogr & Fish Arab Republic of Egypt, 1 5 ( 1 989) I .
5 APHA, Standard methods for examination of water and wastewater, I 51h ed, (American Public Health Association, Washington DC), 1 980, pp 1 1 93.
6 Grasshoff K, Methods of sea water analysis, (Verlag Chemie, Weinheim, New York), 1 976, pp 3 1 7.
7 White A W & Barwani M A, A survey of the trucial states fisheries resources with reference to the sultanate of Oman /969- /97/- A report submitted to Trucial States Councial, Dubai, 1 97 1 , pp 40.
8 Jacob R G & Zarba M A, Annllal Research Report, ( Kuwait Institute for Scientific Research, Kuwait), 1 98 1 , 1 0 I .
9 Galt J A, Payton D 1.., Torgirrron, G M & Glen W UNESCO RL1J Mar Sci, 28 ( 1984) 55.
1 0 Sharaf A G, Annual Research Report, ( Desert and Marine Environment Research Center, UAE). 1 995, pp 32.
I I Hassan E S, Banat I M , Shair S A & Abu-Hilal A H, i Fae Sci, U A E, 5 ( 1 993) 9 1 .
1 2 Hassan E S, Banat I M , EI-Shahawi S & Abu-Hilal A H, i Fac Sci, U A E, 8 ( 1 995) 9 1 .
1 3 Hassan E S , Banat 1 M, AI-Shehawy M S & Abu-Hilal A H, i Aquatic_Ecosystem Health, S ( 1 996) 73.
1 4 Jacob R G, Anderlini V C, Zarba M A & Mohammed 0 S,
Annual Research Report, ( Kuwait Institute for Scient i fic
Research, Kuwait), 1 982, 1 4 1 . 1 5 Environmental Control and Public Health (ECPH), Water
analyses slandards and treatment, (Eyro and Spottiswoode Ltd, USA), 1 975, pp 1 3 1 .
1 6 Chester R, Marine geochemislI)' ( Academic Press Inc,
London) 1 990, pp 272.