Embed Size (px)
Citation preview
Accelerometer Transverse Sensitivity Measurement Using Planar Orbital Motion
Robert D. Sill, PCB Piezotronics Inc.
951 Calle Negocio, Suite A San Clemente, CA 92673
949 429 5259 x23
Eric J. Seller, The Modal Shop 3149 E. Kemper Rd.
Cincinnati, OH 45241 (513) 351-9919
Abstract
An apparatus for the measurement of accelerometer transverse sensitivity is described in which a plate constrained to planar motion by air bearing pads is driven in a circular orbital motion by two orthogonally placed shakers. The paper discusses similar measurements made with a resonant rod, which is shown to suffer rotational accelerations which contribute to errors if the seismic center of sensitivity of the accelerometer is not on the centerline of the rod. The constraint to planar motion is shown to eliminate this source of error. In addition, by gathering measurements in all transverse directions during an orbit, the method has advantages in speed over techniques using one dimensional motion, as described in working drafts of ISO 16063-31 “Methods for the calibration of vibration and shock transducers - Part 31: Testing of transverse vibration sensitivity”.
Introduction
An accelerometer is intended to measure acceleration in one precisely defined direction. Most commonly, that direction is perpendicular to its mounting surface, which is the convention used in this paper. Ideally, there would be no response to accelerations in the other possible directions, whether they are in the plane parallel to the mounting surface, or whether they are angular accelerations about any of the three orthogonal directions. Although by symmetry most designs have insignificant sensitivity to angular accelerations, sensitivity to the other two linear axes of motion can be significant, and are attributed to a misalignment of the accelerometer’s actual sensitive axis from the desired direction. As shown in Figure 1, the misalignment of the sensitivity vector can generate significant components in these other directions. The result is a potential error if these transverse accelerations exist during use of the accelerometer. Measurement of this transverse sensitivity is the topic of this paper. The effect of misalignment similarly applies to the source of acceleration from shakers used in the measurement of accelerometer performance. Slight misalignment of the desired direction of linear motion, as well as angular accelerations in any of the axes, can result in significant components of motion in unwanted “cross-axis” directions. Controlling these other degrees of freedom is the main focus of this development.

Figure 1. Accelerometer coordinates and sensitivity vectors. The vector of maximum sensitivity S in this example is tilted by angle φ from the ideal vertical (z axis) direction, and decomposes to three orthogonal parts Sx, Sy and Sz. The z axis component Sz is the value normally reported as the accelerometer sensitivity. Absolute transverse sensitivity Ta is composed of the Sx and Sy components of S. Transverse inputs in the direction θ will produce maximum transverse output, and inputs in the xy plane at θ ± 90° would theoretically produce no output. By convention in this paper, the plane is defined by the transducer mounting surface, and the x axis is arbitrarily assigned in this example to be the direction of the transducer connector.
The maximum absolute transverse sensitivity Ta and its direction θ are given by Ta2 = Sx2 + Sy2 θ = tan-1 (Sy / Sx) Ta is defined in units of the transducer sensitivity, for example mV per m/s2. However, transverse sensitivity is generally reported as a relative value, a ratio with respect to the reported sensitivity. More commonly it is calculated as the percentage ratio Tr = 100 Ta / Sz. This ratio is also commonly known as “crosstalk”, a term used interchangeably with relative transverse sensitivity in this paper. The geometric requirements to minimize transverse sensitivity in the manufacture of an accelerometer are very demanding, and consequently a large number of transducers have a value of crosstalk between 1 to 3%, and for some designs even up to 5%. Often this is not the most significant source of uncertainty in measurements in the field, and as such the accuracy with which transverse sensitivity needs to be known is usually not stringent. Many existing methods of crosstalk measurement, mentioned in the discussion below, may be adequate. However, many applications of accelerometers demand crosstalk of less than 1% for acceptable results, particularly measurements involving large simultaneous transverse and/or rotational acceleration inputs. These conditions are common for shock accelerometers that have low sensitivities. The apparatus described in this paper was designed for testing such transducers. Necessarily, this requires a combination of high input accelerations and low error sources. Summarizing the basic error sources, the output from a transducer channel might be given by Vo = (Az Sz + A xy Ta + Vn) Gain + Vdaq In this equation the principal and transverse accelerations are Az and A xy, respectively, in the coordinate axes of the Sensor Under Test (SUT). The noise from the SUT is Vn, and errors downstream of the gain in the data acquisition channel are lumped in Vdaq. For the remainder of this paper, the gain and noise sources will be ignored, (despite the fact that noise will entirely dominate the measurement if crosstalk is close to the ideal value of zero). Gain and noise are mentioned here to remind the reader that 1) gain would
be used if outputs are insufficient compared to data acquisition noise, and 2) large values of acceleration are necessary if accelerometer noise is large or sensitivity is small. As in any measurement of sensitivity to an input, uncertainties in the input source should be much smaller than the desired combined uncertainty. To accurately measure 1% crosstalk, the goal was to create a shaker system which would introduce less than 0.1% transverse motion (Axy / Az < 0.001). Before the apparatus of this paper is described, its evolution is highlighted through a discussion of other methods.
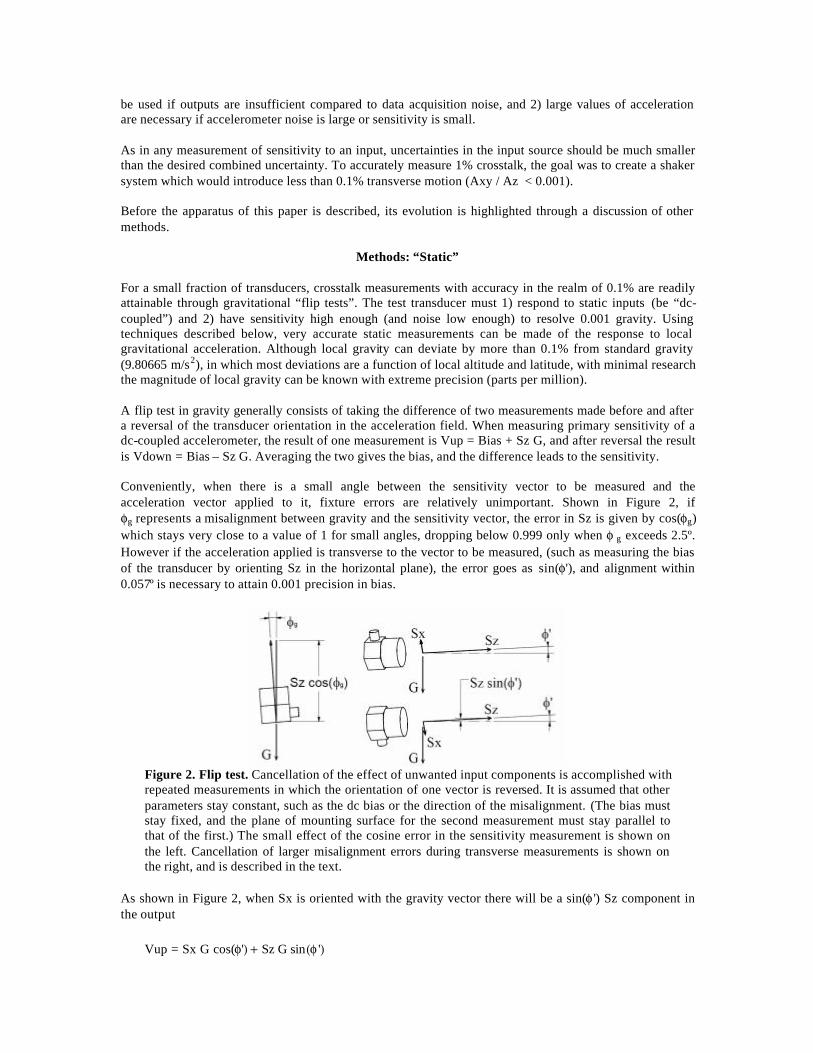
Methods: “Static” For a small fraction of transducers, crosstalk measurements with accuracy in the realm of 0.1% are readily attainable through gravitational “flip tests”. The test transducer must 1) respond to static inputs (be “dc-coupled”) and 2) have sensitivity high enough (and noise low enough) to resolve 0.001 gravity. Using techniques described below, very accurate static measurements can be made of the response to local gravitational acceleration. Although local gravity can deviate by more than 0.1% from standard gravity (9.80665 m/s2), in which most deviations are a function of local altitude and latitude, with minimal research the magnitude of local gravity can be known with extreme precision (parts per million). A flip test in gravity generally consists of taking the difference of two measurements made before and after a reversal of the transducer orientation in the acceleration field. When measuring primary sensitivity of a dc-coupled accelerometer, the result of one measurement is Vup = Bias + Sz G, and after reversal the result is Vdown = Bias – Sz G. Averaging the two gives the bias, and the difference leads to the sensitivity. Conveniently, when there is a small angle between the sensitivity vector to be measured and the acceleration vector applied to it, fixture errors are relatively unimportant. Shown in Figure 2, if φg represents a misalignment between gravity and the sensitivity vector, the error in Sz is given by cos(φg) which stays very close to a value of 1 for small angles, dropping below 0.999 only when φ g exceeds 2.5º. However if the acceleration applied is transverse to the vector to be measured, (such as measuring the bias of the transducer by orienting Sz in the horizontal plane), the error goes as sin(φ'), and alignment within 0.057º is necessary to attain 0.001 precision in bias.
Figure 2. Flip test. Cancellation of the effect of unwanted input components is accomplished with repeated measurements in which the orientation of one vector is reversed. It is assumed that other parameters stay constant, such as the dc bias or the direction of the misalignment. (The bias must stay fixed, and the plane of mounting surface for the second measurement must stay parallel to that of the first.) The small effect of the cosine error in the sensitivity measurement is shown on the left. Cancellation of larger misalignment errors during transverse measurements is shown on the right, and is described in the text.
As shown in Figure 2, when Sx is oriented with the gravity vector there will be a sin(φ ') Sz component in the output
Vup = Sx G cos(φ') + Sz G sin(φ ')

If the SUT is rotated 180º about its z axis, and the misalignment stays constant, the output component due to the transverse output is reversed, but that due to Sz is unchanged
Vdown = –Sx G cos(φ') + Sz G sin(φ ')
Taking the difference cancels the Sz term, and neglecting the error due to cos(φ') gives Sx = (Vup – Vdown)/ (2 G) A similar pair of measurements, rotating the SUT 90º from the previous positions, would give the y component. These techniques are useful in virtually all the methods described in this paper, particularly to cancel effects of misalignment. But many transducers have inadequate sensitivities for this to be used with gravity, particularly the shock accelerometers for which the apparatus in this paper was developed. Another alternative, again for dc-coupled transducers, is to use a centrifuge to develop high centripetal accelerations, as shown in Figure 3.
Figure 3. Centrifuge Testing. The plate of a centrifuge spinning at constant angular velocity ω (radian/second) creates acceleration on a SUT mounted at radius R equal to ω2R, directed toward the center of rotation. Although the magnitude stays constant, the direction of the acceleration rotates. Because the transducer is attached to the rotating plate, its coordinates rotate as well, so the applied acceleration stays fixed with respect to the transducer coordinates. Therefore, like gravitational techniques, the measurement of transverse sensitivity on a centrifuge requires separate measurements for the two components Sx and Sy, reorienting the SUT by 90º between tests.
In both the gravitational and centrifuge methods, the acceleration magnitude is static and would be measured only by a transducer which responds to static inputs. The requirements for stable bias are very demanding for good accuracy using these static methods. Thermally induced bias shifts can cause significant errors if the equipment warms during what can be a lengthy series of high speed tests.
Methods: Dynamic – Single Axis of Acceleration
The majority of laboratory accelerometers are based on piezoelectric sensing. Inherently they cannot respond to static inputs, and therefore are “ac-coupled”. They mu st be tested with dynamic techniques. Generally, sinusoidal vibration is used, allowing the noise suppression advantages of digital or analog tracking filters. They are usually driven with electrodynamic shakers. [There are yet other dynamic techniques, but less practical. Shock is by its nature difficult to control, so is not considered here as a source of excitation for transverse sensitivity. If extreme amplitudes are needed,

stingers vibrated at resonance can provide large input. Careful attention must be paid to avoid transverse resonant modes. Such tests can be extraordinarily loud and unpleasant to perform, and will not be further discussed. Also not included in this discussion is the complicated system sometimes used to place another high speed rotating table on a centrifuge, putting the SUT on its axis, subjecting it to a variation at the second rotating frequency of the main centripetal acceleration.] The primary difficulties in using high frequency shakers for transverse testing are related to 1) the very small displacements to which they are capable, particularly at high frequencies, 2) inadequate lateral stiffness to prevent transverse motion, and 3) rocking modes that occur due to asymmetries in the support and the drive forces. The SUT may be far from the center of the shaker armature, a distance L, and so out where the SUT is mounted any x or y axis angular acceleration of the armature αxy would cause transverse linear accelerations of A xy = L α xy A design approach to combat these difficulties is to use a large displacement with a well-guided platform. Air bearing shakers have excellent suppression of cross-axis motion (squeeze film displacements are typically on the order of micrometers), but the shakers tend to be massive and therefore limited in acceleration amplitude. The bearing and guide shown in Figure 4 constrain the motion to one direction. Again, some mechanism is needed to rotate the SUT through its z axis, to obtain enough data to resolve the orthogonal transverse components.
Figure 4. Guided table configuration. When operated at low frequencies an air bearing long stroke shaker provides an excellent approximation to single degree of motion. The transducer sensitive axis is oriented perpendicular to the shaker axis, and some provision is made to make two measurements of the transducer, one rotated 90º with respect to the other, to get the two components of transverse sensitivity. Depicted in the sketch is a motorized rotational stage, mounted ideally with its axis normal to the acceleration. As in the previously described methods, it is possible that axis is misaligned, and the flip technique could cancel the effect of tilt of the rotational stage. Note however that such cancellation only works if the tilt stays constant, that is, if the mounting plane stays parallel throughout all the measurements.
High frequency shakers with lighter armatures can develop much higher accelerations. But just as it is difficult to manufacture a transducer with very low transverse sensitivity, there are similar difficulties in manufacturing shakers with low transverse motion. Most such shakers will have frequencies at which significant transverse motions occur, often exceeding the 30% suggested as the maximum value for shakers used in secondary calibrations in ISO 16063-22 [3]. At some well-defined frequencies, and with careful attention to balance and cable placement, the best shakers can attain cross-axis motion of one or two percent [2]. If these transverse motions were stable, the cancellation techniques of flipping can be used. If however the phase and/or amplitude of the transverse components vary during the test and are unstable relative to primary motion Az, no cancellation is possible. Such a shaker could only be used for basic confirmation of approximate values of SUT crosstalk, and uncertainty in crosstalk would be at least as large as the cross-axis motion of the shaker.

But if the transverse motion is stable, cancellation can be performed by taking the difference of results with orientations #1 and #2 shown in Figure 5.
V1 = Az Sx + Axy Sz V2 = – Az Sx + Axy Sz
It would be possible to perform cancellation with the position #3 as well, averaging the result with V1 to again cancel the Sz term.
V3 = Az Sx – Axy Sz However to perform the flip from #1 to #3 changes the SUT position on the shaker, which could change armature motion. In all cases it would be important to pay careful attention not to change the balance of the shaker between the tests, which would invalidate the cancellation if the motion changed. It is good practice to maintain axisymmetric loading on such shakers in all uses. Attention to cable routing and possibly the use of balancing counterweights may be needed. Note that these voltages should be considered phasor results, taking into account the phase θ' and θ'' of the two measurements with respect to the standard in the shaker. Subtracting one voltage from the other would then entail converting each to the complex form and combining vectorially.
V1(z) = a + jb, where a = V1cos(θ') and b = V1sin(θ') V2(z) = c + jd, where c = V2cos(θ'') and d = V2sin(θ '') and
V1– V2 = (a – c) +j(b – d) One indication that cancellation is invalid, (that the relationship between acceleration components is not stable), is that the imaginary part j of the combination has a non-zero amplitude.
Figure 5. Correction schemes for canceling effects of cross-axis motion. A high frequency shaker is depicted with a fixture aligning the transducer sensitive axis perpendicular to the shaker axis. If the shaker has a stable transverse component Axy, in this case depicted in the worst case aligned with the sensitive axis Sz in orientation #1, cancellation is accomplished by flipping the SUT transverse component with a rotation of 180º about the SUT’s z axis (#2) or the x axis (#3).
Methods: Two Axes of Acceleration – Resonant Rod
Crosstalk measurements on a linear shaker become slow and expensive with the need for multiple measurements and complex calculations. An interesting and different approach is shown in Figure 6. Mounting the SUT axially to the tip of a cantilevered rod and driving it laterally can provide two axes of

transverse motion. The longitudinal stiffness of the rod limits z axis motion to the necessary degree. The centripetal accelerations created by a circular orbit are similar to those in the centrifuge, but without z axis rotation to the SUT. By this way it is possible to move the acceleration vector through all the possible directions in the xy plane of the transducer’s coordinate axes. All the measurements theoretically can be taken in one cycle of the vibration. This was implemented by Dosch with a cantilevered circular rod driven by piezoelectric benders, resulting in a significant advancement in accuracy and speed [1].
Figure 6. Resonant rod dynamics. The tip of a cantilever rod can be forced into a circular orbit by driving it in x and y axes with the appropriate amplitudes and phase, and significant amplitudes can be achieved by driving at the bending resonance frequency. (The deflection of the tip is depicted in multiple overlaid positions, exaggerated for clarity). Similar to the centrifuge of Figure 3, centripetal acceleration magnitude is ω2R, but in this case the transducer does not rotate about the z axis. In the course of one cycle the accelerometer is subjected to transverse accelerations in all directions in its mounting plane. The acceleration varies with respect to the transducer coordinates with frequency ω, therefore this technique is useful for ac-coupled transducers. One weakness of the technique is that there is a tilt φ associated with the bending about the x and y axes, which results in angular accelerations α = φ ω2. For accelerometers with no angular acceleration sensitivity, and with centers of sensitivity in the central axis of the rod, no errors will result. However, as shown to the right, if the center of sensitivity is offset from the center of the rod by an eccentricity e, the angular acceleration will convert that offset to a linear acceleration in the z axis. The primary sensitivity of the accelerometer will respond to that motion, resulting in an error in the transverse sensitivity measurement, as discussed in the text.
The resonant rod bends but does not stretch appreciably, moving the SUT along a surface of a sphere with radius of approximately 2L/3. (The 2/3 factor comes from the relationship of displacement and tilt, see below.) For the SUT mounted with its sensitive axis aligned with the center of the rod, there is no error due to the tilt (provided the SUT has no angular sensitivity). The tilt puts a small component of the sensitive axis in the direction of the centripetal acceleration (that is, the tip is in tension as it whips around the orbit). This component of acceleration, like that in the centrifuge, is static in magnitude if the orbit is circular, having constant angular velocity. The angular velocity that causes centripetal acceleration changes sinusoidally if the path is non-circular. (The most extreme case is where the rod sweeps through a plane that includes its original resting position, such as driving only in the x or y direction.) Since the centripetal acceleration is related to the square of the angular velocity, squaring a sinusoid causes a doubling of frequency. The z axis component then appears as

a second harmonic. Neither of these situations is necessarily a problem in measuring transverse output, since the dc or the second harmonic is easily filtered out the of sinusoidal output. However, the tilt causes a dynamic acceleration at the frequency of vibration if the sensitive axis is not on the centerline, as shown in the right side of Figure 6. This error, being at the fundamental vibration frequency, cannot be eliminated with a filter. The following is an estimate of the error caused by the tip bend angle and an eccentric center of sensitivity, using simple static formulae for cantilevers. First are the relationships for the tilt and the displacement of the cantilever:
φ = W L2 / (2 E I) R = W L3 / (3 E I)
Cantilever length is given as L, tip bend angle φ, displacement R (usually termed y in the handbooks). Side load W, Moment of inertia I and Young’s modulus E eventually cancel out. The desired transverse acceleration Axy is due to centripetal acceleration, α is the angular acceleration about the x and y axes, and an erroneous crosstalk is introduced by the z axis linear acceleration Az due to eccentricity e
Axy = R ? 2 α = φ ? 2 Az = e α = e φ ? 2 Az/Axy = e φ / R = 3 e / (2L)
It is not unusual to have e = 2 mm, and for a typical value of L=170 mm, this apparent crosstalk, actually due to z axis motion, would be greater than 1%. This can be an unacceptable error source that can only be avoided, if using the resonant rod method, with knowledge of the eccentricity and accurate fixturing to center the sensitivity.
Methods: Planar Orbital Motion As demonstrated above, the dynamics and fixturing of the orbital technique would be greatly simplified if the transducer were constrained to planar motion, so that it would move without tilting. In the apparatus described in this paper, shown in the photograph of Figure 7, the SUT is mounted on a horizontal flat plate that is driven in its plane by two shakers. The shaker directions are positioned 90º apart, connected to the plate with long slender stingers. The plate is ~100 mm square with three added 50 mm diameter lobes equally spaced on a ~150 mm circle . Clamping the lobes on the top and bottom surfaces are three pairs of air-bearing pads, constraining the plate to planar motion. This is a kinematic constraint, since a plane is defined by three points. Each pad is attached to a spherical swivel mount, so pad positions self adjust to the correct angle. Each pad is 40 mm in diameter and given approximately 200 kPa (30 psi) pressurized air. The squeeze film generates a maximum “lift-off” force when the gap between the porous graphite to the plate nears zero, and the force falls off approximately 75% over 10 µm of displacement in the normal direction [4]. With pads on the top and bottom this represents an extremely stiff spring resisting z axis motion. Vertical range of motion during operation is estimated to be no more that 5 µm , and typical orbit is at least 5 mm in diameter, satisfying the 1000-to-1 ratio required for the desired 0.1% quality of motion. The shakers can displace as much as 20 mm, and can be driven in many ways: 1) x only, 2) y only, 3) x and y in phase to get linear motion in angles set by the ratio x/y, or 4) in a quadrature arrangement (one 90º out of phase relative to the other) in an orbit. The frequency of operation is a compromise between the competing needs of increasing acceleration level and maintaining amplitude so the displacement is at least 1000 times larger than the possible z axis motion. Stingers from the shakers to the plate are long and slender, ~300 mm long and ~3 mm diameter, to allow sufficient bending so as not to damage the shakers with transverse loads. Each shaker and the central support of the plate is on its own pedestal. In an early prototype all components were on one structure, but forces from the shakers were found to couple into the bearing pads. The preferred arrangement is having each pedestal independently attached to the floor.
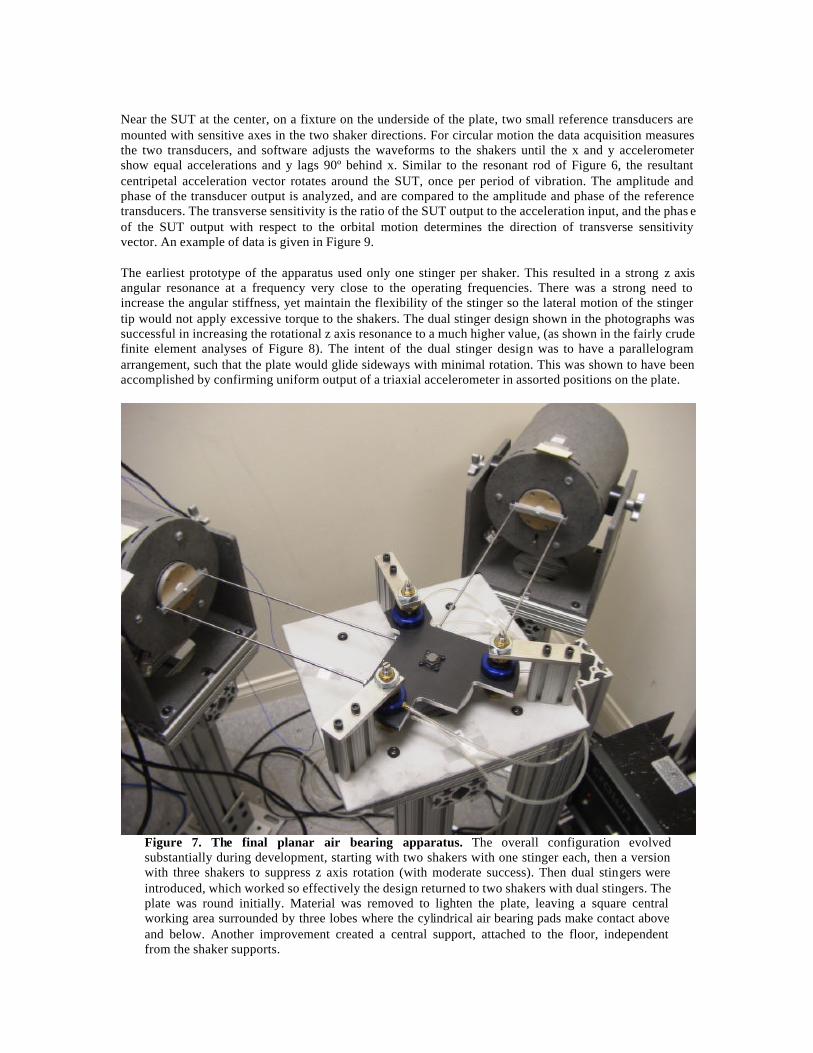
Near the SUT at the center, on a fixture on the underside of the plate, two small reference transducers are mounted with sensitive axes in the two shaker directions. For circular motion the data acquisition measures the two transducers, and software adjusts the waveforms to the shakers until the x and y accelerometer show equal accelerations and y lags 90º behind x. Similar to the resonant rod of Figure 6, the resultant centripetal acceleration vector rotates around the SUT, once per period of vibration. The amplitude and phase of the transducer output is analyzed, and are compared to the amplitude and phase of the reference transducers. The transverse sensitivity is the ratio of the SUT output to the acceleration input, and the phas e of the SUT output with respect to the orbital motion determines the direction of transverse sensitivity vector. An example of data is given in Figure 9. The earliest prototype of the apparatus used only one stinger per shaker. This resulted in a strong z axis angular resonance at a frequency very close to the operating frequencies. There was a strong need to increase the angular stiffness, yet maintain the flexibility of the stinger so the lateral motion of the stinger tip would not apply excessive torque to the shakers. The dual stinger design shown in the photographs was successful in increasing the rotational z axis resonance to a much higher value, (as shown in the fairly crude finite element analyses of Figure 8). The intent of the dual stinger design was to have a parallelogram arrangement, such that the plate would glide sideways with minimal rotation. This was shown to have been accomplished by confirming uniform output of a triaxial accelerometer in assorted positions on the plate.
Figure 7. The final planar air bearing apparatus. The overall configuration evolved substantially during development, starting with two shakers with one stinger each, then a version with three shakers to suppress z axis rotation (with moderate success). Then dual stingers were introduced, which worked so effectively the design returned to two shakers with dual stingers. The plate was round initially. Material was removed to lighten the plate, leaving a square central working area surrounded by three lobes where the cylindrical air bearing pads make contact above and below. Another improvement created a central support, attached to the floor, independent from the shaker supports.

Figure 8. Finite Element Analysis. The result in 8a models an early prototype with only one connecting “stinger” per shaker, showing the low frequency z axis rotation which contaminated results with that configuration. The dual stinger approach increased that resonance an order of magnitude, well out of the operating range, shown in 8d. The shape of the normal in-plane operation is shown in 8b, and one of the many out-of-plane higher modes of stinger resonance is shown in 8c, again well out of operating range. The uniformity of motion in normal operation was confirmed experimentally. The suppression of z axis rotation resulted in linear accelerations uniform within approximately 1% across the plate.

Figure 9. Prototype Control Software. This screen capture is from a test at 40 Hz and 15 G. At the top left the user enters the gain used in the SUT channel, and the Sz sensitivity, so relative Transverse Sensitivity can be calculated. The user also establishes the reference direction of the SUT (such as a side connector), with respect to the coordinate system of the plate, to calculate the angle of transverse sensitivity. The time domain data on the left shows the output of two reference accelerometers and the amplified SUT. The central polar plot is the SUT output as a function of angular position of the orbit. On the right is a Lissajous plot of the two reference accelerometer signals showing some distortion of the acceleration orbit. All plots shown are unfiltered, although the final numerical values displayed on the lower right are the result of Discrete Fourier Transforms at the drive frequency, in each case essentially finding the best fit of the fundamental frequency to the data. The control software ramps up and adjusts the shakers, makes the measurement, and ramps down in less than 10 seconds. The sequence could be optimized further.
Results
The data shown in Figure 9 are fairly typical, showing the low noise present with the use of air bearing pads. Other systems with sliding interfaces or geartrains typically have much higher high noise levels, and are heavily dependent on filters. The standard deviation of the transverse sensitivity values of the SUT shown is about 3 uV/G at 15 G test level, or about 0.01%, and for the angle, standard deviation was about 0.3º. This is a fairly high sensitivity unit compared to the shock accelerometers for this system was developed (~0.2 mV/G). The standard deviation of crosstalk measurements for that type was about 0.2%, and for the angle of sensitivity, ~1º. The source of the distortion shown in Figure 9 is not entirely understood. Whereas it should have been a circle of 15 G radius, the y axis is seen to miss by about 10%, truncating at positive (when pulling the plate to the shaker) and peaking when negative (when the stingers were in compression). It was anticipated that

buckling of the stingers would be a source, but it is puzzling that x and y axes display much different levels of distortion yet are apparently mechanically identical. The effect on sensitivity is expected to be negligible due to the efficiency of the Discrete Fourier Transform used to extract the fundamental sinusoids from all waveforms. Angle seems more susceptible to distortion than sensitivity; that is, its values had greater scatter. In addition the manual estimation and entry of orientation of the reference direction is prone to more error. As further example of the performance of the new apparatus, results with three transducers are listed, with comparison to the resonant rod technique as well as a gravitational turnover. The three transducers represent classes of SUTs, those that have conventional single point stud attachment, adhesive mount, and a dc coupled high sensitivity device with non-centered sensitivity that was also tested with a gravitational flip test. As expected, the best agreement with the resonant rod technique came from the stud mounted transducer. Also not surprisingly, multiple tests with the small adhesively mounted device displayed a scatter inversely proportional to the operator’s skill at applying the adhesive. The high sensitivity dc coupled transducer gave superior agreement with gravity tests, since it has a less well-defined position of its sensitive axis, leading to errors due to the tilt of the resonant rod. Planar Orbital Resonant Rod Tr angle Tr angle Model serial # (%) (º) (%) (º) 353B02 11659 1.72 254 1.54 245 ICP®, ½” hex, 10-32 mount, ~20mV/G 352C22 66457 1.74 32 2.13 64 ICP®, 0.25”, adhesive mount, ~10mV/G 3701G3FA3G 5586 0.47 -26 0.88 135 dc coupled, eccentric center of sensitivity “ “ 0.34 -21 gravitational “flip test”, ~1V/G
Conclusions The planar orbital apparatus provides fast and accurate transverse sensitivity measurements, and avoids many of the disadvantages of other transverse sensitivity techniques. For those transducers that can be tested reliably on different systems, agreement in sensitivity appears to be within 0.2%. One principal advantage of the technique is that the acceleration vector can be driven in any direction in the plane, so all transverse measurements can be made with only one mounting. Another advantage is that the planar motion avoids the errors due to angular accelerations in high frequency shakers and the resonant rod techniques. Disadvantages may include distortions during the circular orbit. This needs more investigation to determine the mechanical cause and potential solutions, as well as to determine how this contributes to errors. The air bearing constrains the motion to the xy plane with minimal z axis rotations, so that the entire plate experiences the same linear accelerations. It should be possible to test many transducers simultaneously.
Acknowledgments The authors wish to thank Kevin Sill for his assistance with the prototype hardware, and Gaeton Briseno for implementing the software.
References [1] Dosch, Jeffrey J; Lally, David M., “Automated Testing of Accelerometer Transverse Sensitivity”, available as Article Reprint AR-69 from PCB Piezotronics, Inc., www.pcb.com. [2] Dosch, Jeffrey J, “Air Bearing Shaker for Precision Calibration of Accelerometers”, available as Article Reprint AR-83 from PCB Piezotronics, Inc., www.pcb.com. [3] ISO 16063-21, Methods for the calibration of vibration and shock transducers — Part 21: Vibration calibration by comparison to a reference transducer. [4] New Way Air Bearings, www.newwayairbearings.com


![Transverse-Spin and Transverse-Momentum Effects in High ... · arXiv:1011.0909v1 [hep-ph] 3 Nov 2010 Transverse-Spin and Transverse-Momentum Effects in High-Energy Processes Vincenzo](https://img.dokumen.tips/doc/110x75/5fe72148dd320764757b53e4/transverse-spin-and-transverse-momentum-eiects-in-high-arxiv10110909v1-hep-ph.jpg)


