Embed Size (px)
Citation preview
TECHNICAL NOTE | August 2015 | 1
TECHNICAL NOTE
AQUEDUCT PROJECTED WATER STRESS COUNTRY RANKINGSBY TIANYI LUO, ROBERT YOUNG, AND PAUL REIG
CONTENTSExecutive Summary....................................................... 1
Introduction................................................................... 2
Methodology ................................................................. 3
Results .......................................................................... 4
Limitations .................................................................... 4
Appendix........................................................................6
Endnotes ......................................................................15
Suggested Citation: Luo, T., R. Young, P. Reig. 2015. “Aqueduct Projected Water Stress Country Rankings.” Technical Note. Washington, D.C.: World Resources Institute. Available online at: www.wri.org/publication/aqueduct-projected-water-stress-country-rankings
Technical notes document the research or analytical methodology underpinning a publication, interactive application, or tool.
EXECUTIVE SUMMARYChanges in climate, economic development, urbaniza-tion, and population growth will impact water availability around the world. To prepare for these changes, decision-makers need to consider future scenarios of global water supply and demand. Investors, policymakers, companies, and development organizations can use such projected estimates to quantify future impact, hedge risks, and adapt to changes at relevant scales. For certain decisions and analysis, the national scale may be important, and to the best of our knowledge, no up-to-date, country-level projections currently exist in the public domain.
WRI’s Aqueduct Water Stress Projections,1 released in June, 2015, allow users to analyze different future demand and supply scenarios at a sub-catchment level, based on the latest data from the Intergovernmental Panel on Climate Change (IPCC) 5th Assessment Report (AR5). In the current analysis, we utilize a spatial aggregation methodology2 to bring the sub-catchment scale Aqueduct Water Stress Projections up to the country scale.
These global country-level projections are best suited to making comparisons among countries for the same year, as well as among decades and scenarios for the same region. As with Aqueduct’s previous projections and coun-try rankings, these country-level future scenarios might not be as accurate as those using higher resolution data or more localized scenarios. These indicators also should not be seen as predictions, but rather as potential outcomes under specific climate and socio-economic trajectories, which are subject to uncertainties. Nor do the indicators attempt to account for existing governance and invest-
2 |
The scenarios in this report are based on a combination of rep-resentative concentration pathways and shared socio-economic pathways from IPCC 5th Assessment Report, which are used to project estimates of future water supply and demand.
REPRESENTATIVE CONCENTRATION PATHWAYS (RCPS) are scenarios of the increase in radiative forcing through 2100. These drive the climate factors in the General Circulation Models from CMIP5.
▪ RCP8.5 is a “business-as-usual” scenario of relatively unconstrained emissions. Temperatures increase 2.6–4.8°C by 2100 relative to 1986–2005 levels.
▪ RCP4.5 represents a “cautiously optimistic” scenario. Temperatures rise 1.1–2.6°C by 2100.
SHARED SOCIOECONOMIC PATHWAYS (SSPS) are scenarios of socioeconomic drivers.
▪ SSP2 is a “business-as-usual” scenario.
▪ SSP3 is a “pessimistic” scenario with higher population growth, lower GDP growth, and a lower rate of urbaniza-tion.
These pathways were combined into overall “optimistic” (RCP4.5 and SSP2), “business-as-usual” (RCP8.5 and SSP2), and “pessimistic” (RCP8.5 and SSP3) scenarios.
Source: Luck, M., M. Landis, F. Gassert. 2015. “Aqueduct Water Stress Projections: Decadal Projections of Water Supply and Demand Using CMIP5 GCMs.” Technical Note. Washington, D.C.: World Resources Institute. Available online at: http://www.wri.org/publication/aqueduct-water-stress-projections.
Box 1 | IPCC Scenariosment in the water sector. These country-level water stress projections are intended to provide useful information about potential future water situations that can help drive improved water management at the international scale. The full results of all scenarios are available at: http://www.wri.org/resources/data-sets/aqueduct-projected-water-stress-country-rankings.
INTRODUCTIONThis analysis follows the methodology used in Gassert et al.3 to calculate country rankings of baseline water stress, seasonal and inter-annual variability, flood occurrence, and drought severity for the year 2010. We employ a spatially weighted aggregation methodology that brings Aqueduct’s sub-catchment risk estimates up to the country scale. This method generates rankings of water stress and other indica-tors for all water users as well as sector-specific rankings for agricultural, domestic, and industrial users.
Aqueduct’s country-level indicators are valuable when it comes to national risk benchmarking and comparison, and have already proven their usability through their incor-poration into the evaluation models of companies like MSCI Inc., and analyses and databases of organizations like the World Economic Forum and FAO (AQUASTAT). International organizations and financial institutions also need such indicators, because many water-related political, international aid, and investment decisions are made across political or administrative boundaries.4 By aggregating these data to the national level, the indicators bridge this gap, enabling investors to consider water stress across their entire portfolio, and other users to make consistent comparisons across multiple countries at the same time.
While the Gassert et al. country rankings provide informa-tion on current water risk, there is a growing demand for information that projects future global water supply and demand scenarios. Both private and public sectors see the need to plan for potential changes in water availability caused by climate change and economic development in the coming decades.5
In this analysis, we calculate projected water stress infor-mation for countries from the sub-catchment scale Aque-duct Water Stress Projections. WRI’s Aqueduct Water Stress Projections, released in June 2015, are based on the latest data from the Intergovernmental Panel on Climate Change (IPCC), and allow users to analyze different future demand and supply scenarios at a sub-catchment level.
They provide estimates of water stress, demand, supply, and seasonal variability for the years 2020, 2030, and 2040, targeted toward decadal scale planning, adapta-tion, and investment.6 The projections in the current paper are based on the Aqueduct framework, and account for upstream-downstream interactions and spatial relation-ships between human activities and water resources.7 The resulting country water stress projections include thirty-six datasets that look at three time periods—2020, 2030, and 2040—and three combined climate and socio-economic scenarios—optimistic, business-as-usual, and pessimistic (Box 1) from IPCC. Total water stress levels for each country are provided, along with water stress exposed by domestic, industrial, and agricultural sectors.
TECHNICAL NOTE | August 2015 | 3
AQUEDUCT PROJECTED WATER-STRESS COUNTRY RANKINGS
Table 1 | Aqueduct Water Stress Thresholds
CATEGORY SCORE RATIO OF WITHDRAWALS TO AVAILABLE WATER (PERCENT)
Low 0–1 <10
Low to medium 1–2 10–20
Medium to high 2–3 20–40
High 3–4 40–80
Extremely high 4–5 >80
We hope that these datasets, which take into account the relative impact of climate and socio-economic changes on water availability, can help international organizations, businesses, and financial institutions to take steps to miti-gate risks and more effectively adapt to plausible future climate change and water demand scenarios.
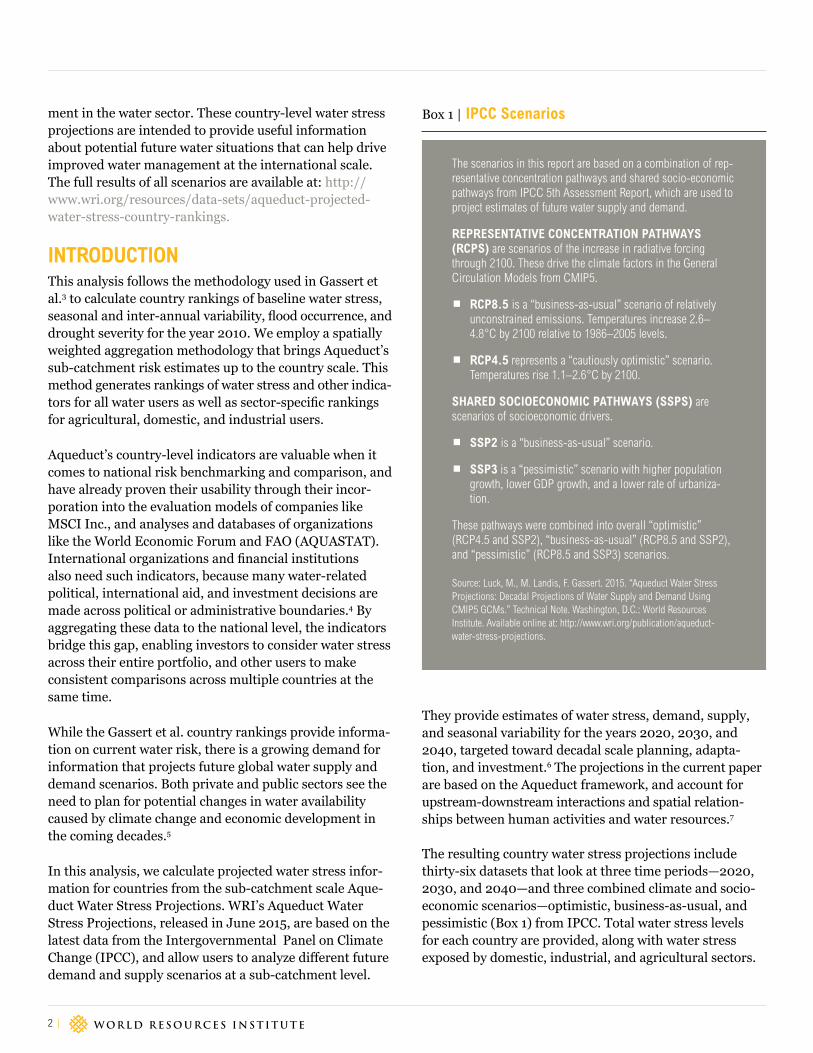
METHODOLOGYWe followed the aggregation method in Gassert et al., 2013, which took three spatially explicit inputs (Fig-ure 1)—source indicators, gridded weights, and target regions—and calculated a spatially weighted average of source-indicator values for each target region. For each scenario under each future year, water stress was used as the source indicator. Water stress is defined as the ratio between total water withdrawals and available renewable surface water at a sub-catchment level. Higher scores on the scale from 0 to 5 correspond to greater competition among water users relative to available surface water resources (Table 1).
Gridded water-withdrawal datasets were chosen as weights because they indicate where human demand for water is the highest. This technique gives greater weight to the areas where socioeconomic dependency on water resources is most critical. Gridded withdrawals were further divided into three sectors (agricultural, domestic, and industrial) to allow us to measure each sector’s exposure to water stress.
For example, the domestic water withdrawals datasets identify areas where households and others drawing from municipal sources are projected to use water; these data are used as a weight to measure the exposure of domestic water users to water stress. Thus, country-level baseline water stress, weighted by domestic withdrawals, can be interpreted to show which countries have the most or least stressed domestic sectors. The same approach is used for agricultural and industrial withdrawals.
Within each target region, values of the source indicators were resampled into grids to match the cell size of weight-ing grids. The weighted average (sr) was then computed by multiplying the resampled source indicator grids (sp)
Figure 1 | Source Indicators—Water Stress (A), Gridded Weights—Withdrawal Distribution (B), and Target Regions—Countries (C)
A
B
C
4 |
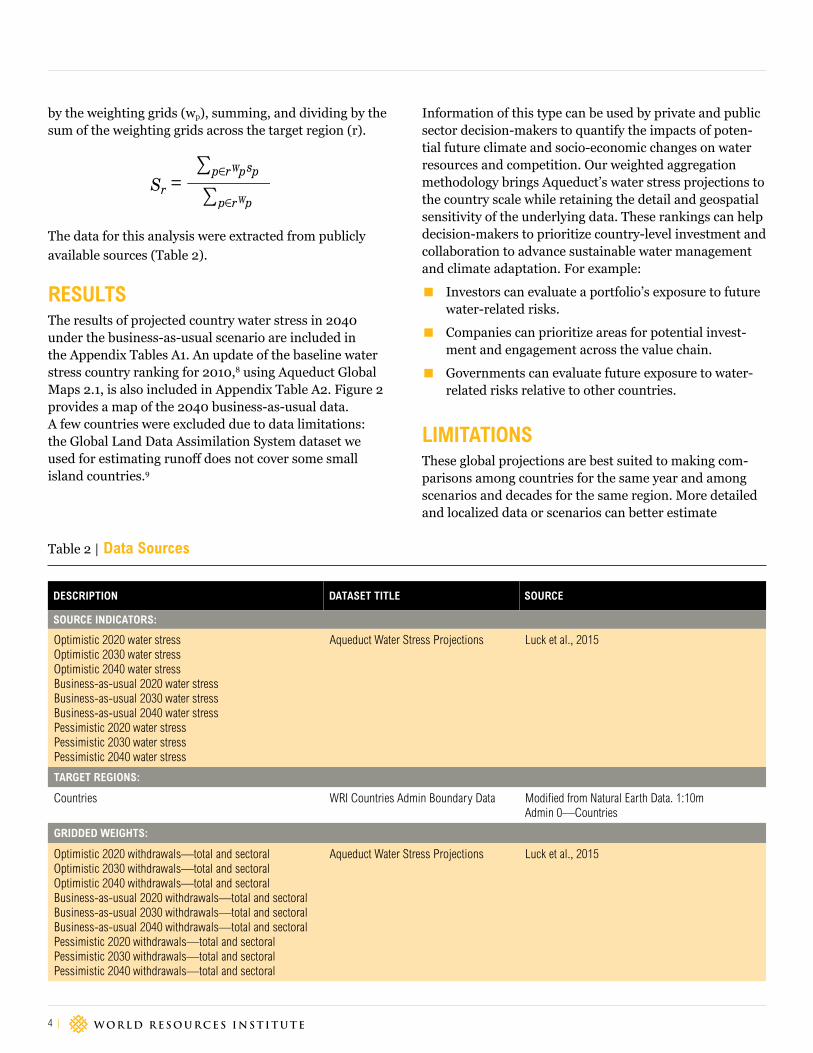
by the weighting grids (wp), summing, and dividing by the sum of the weighting grids across the target region (r).
The data for this analysis were extracted from publicly available sources (Table 2).
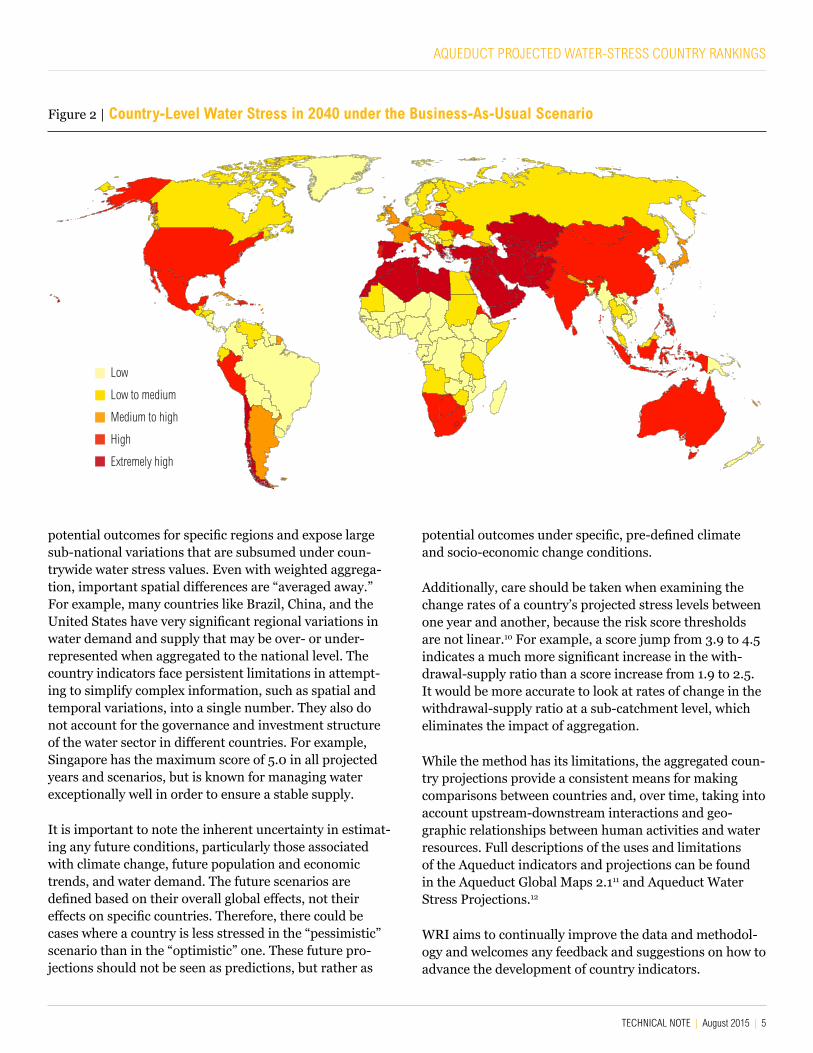
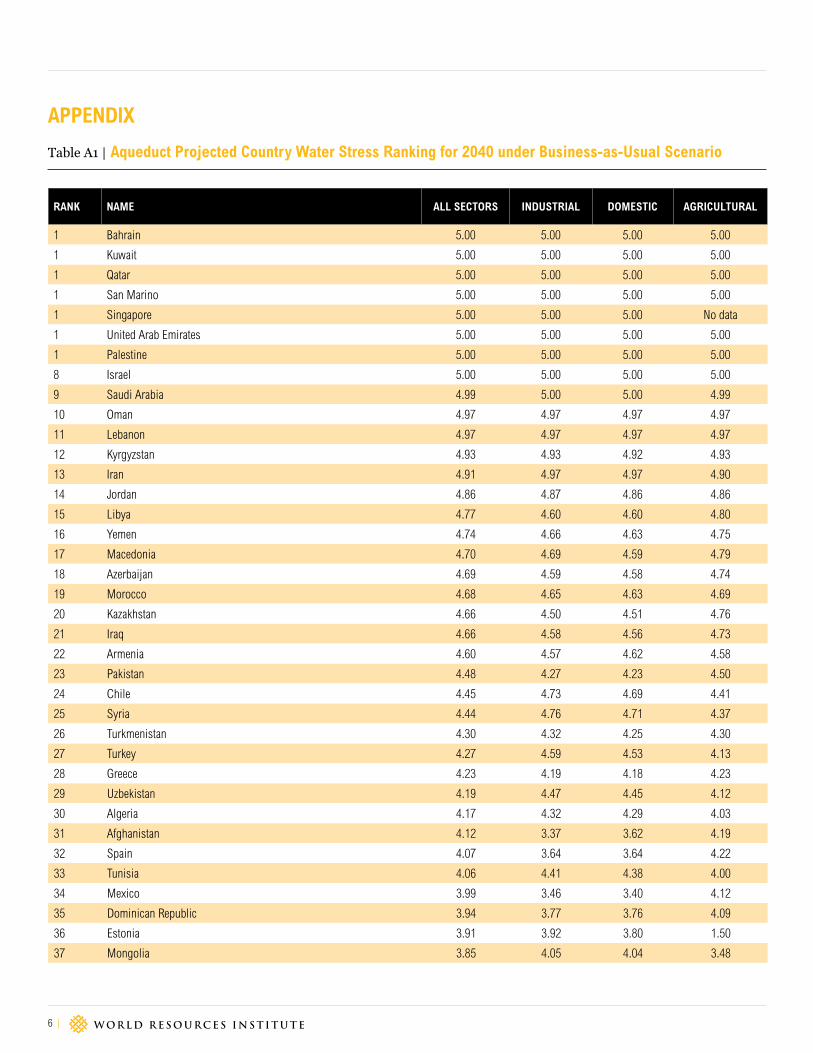
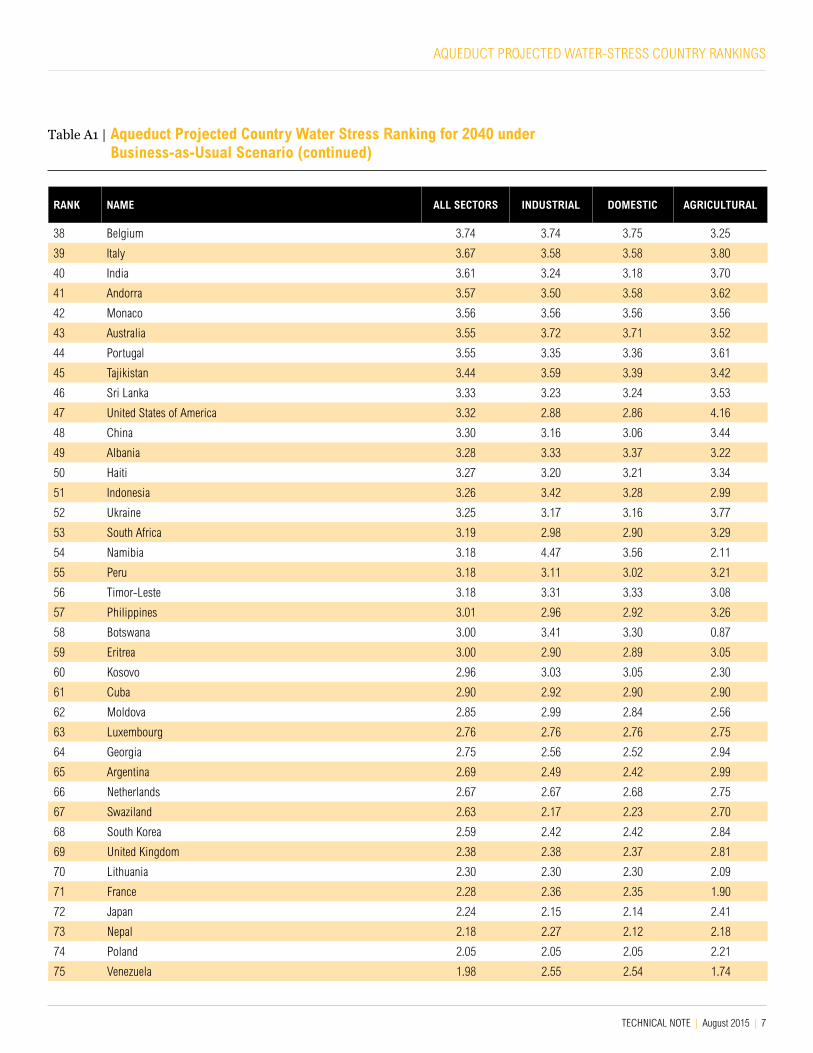
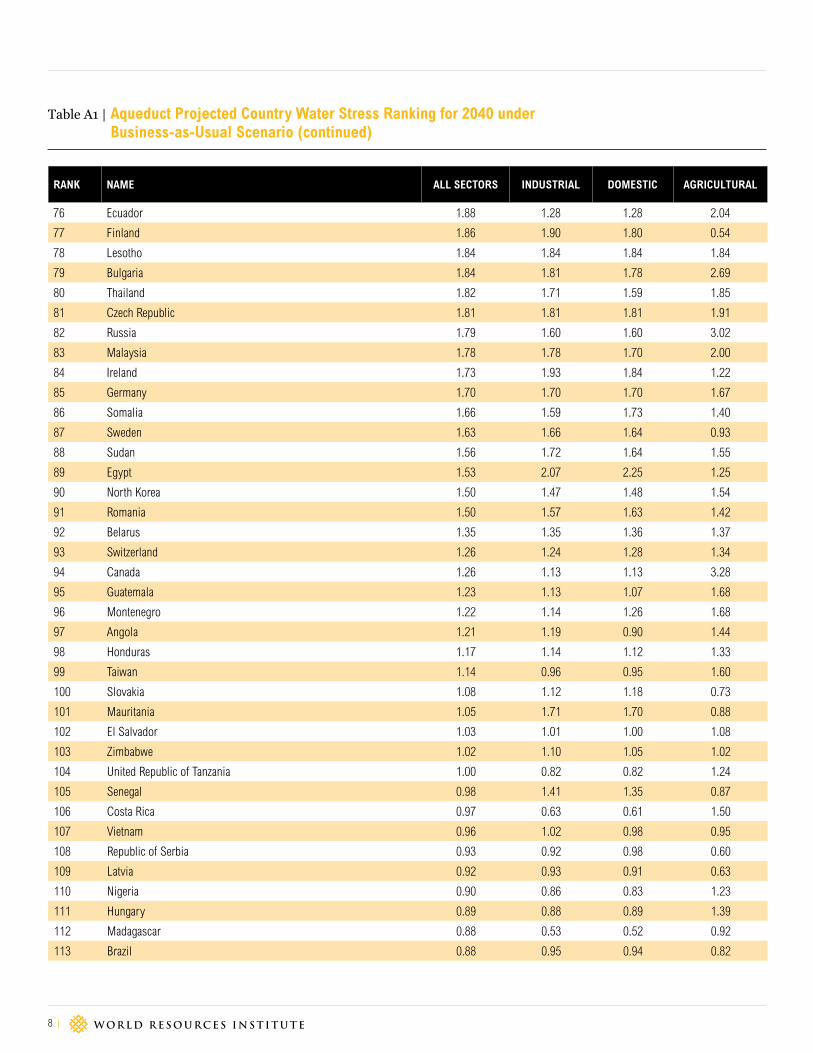
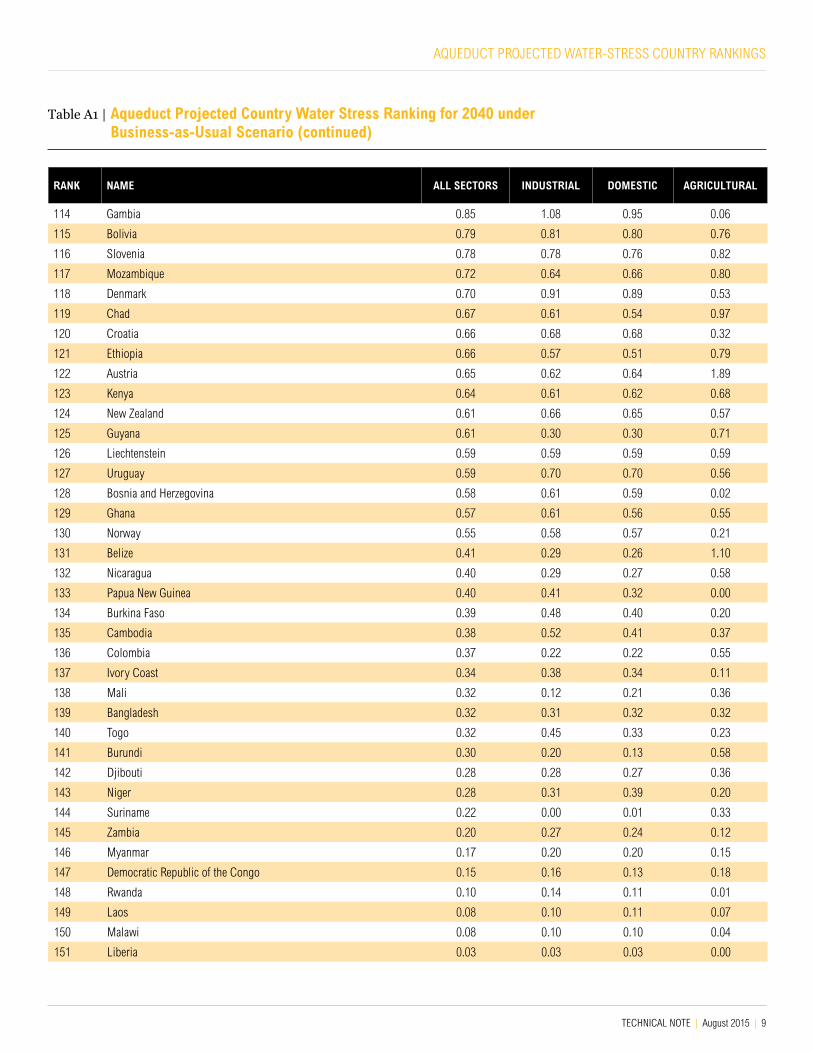
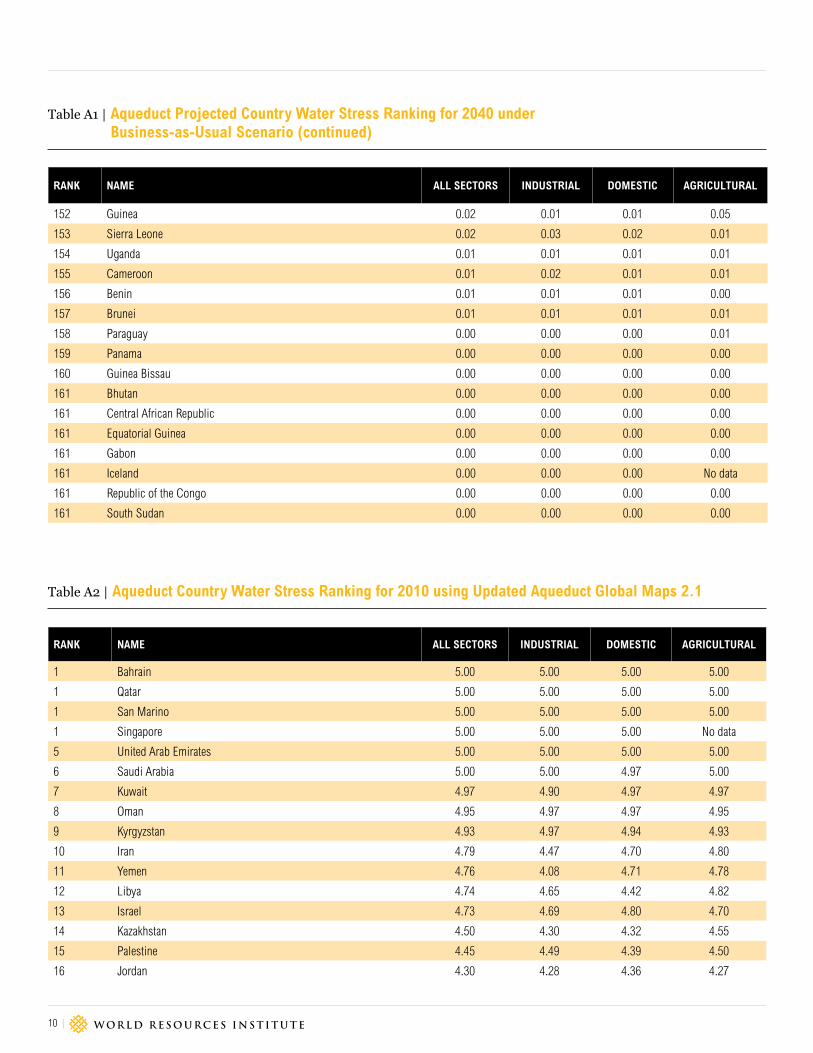
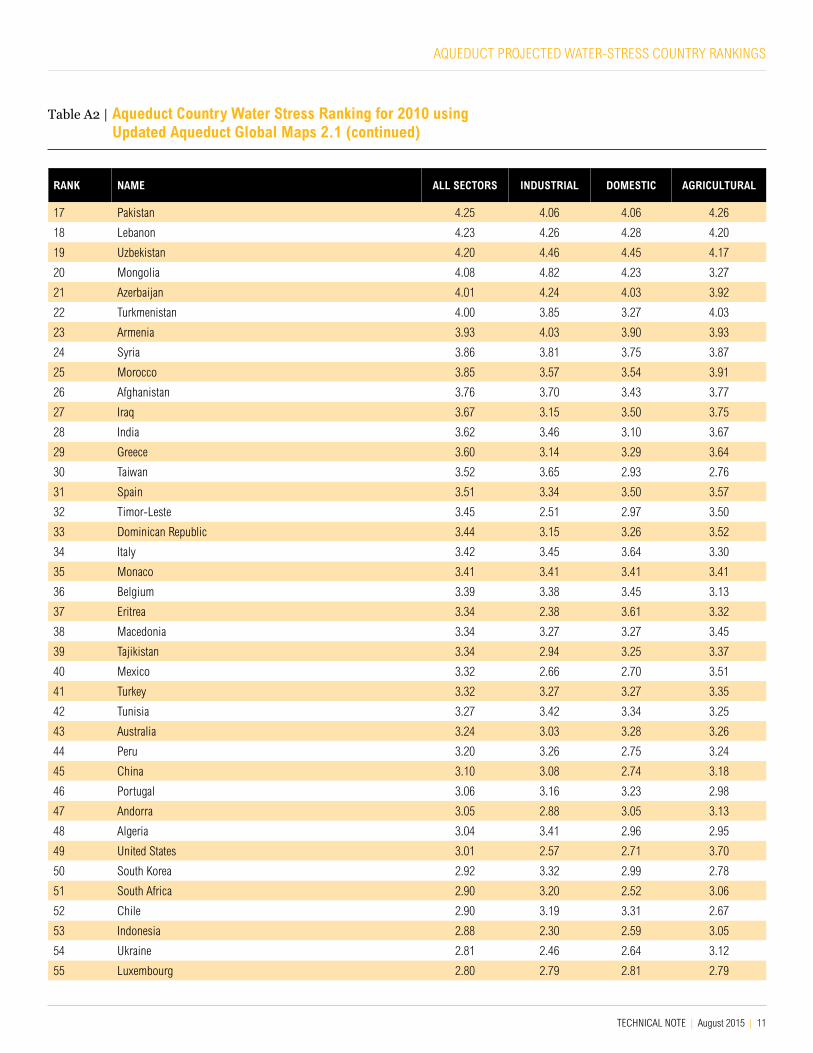
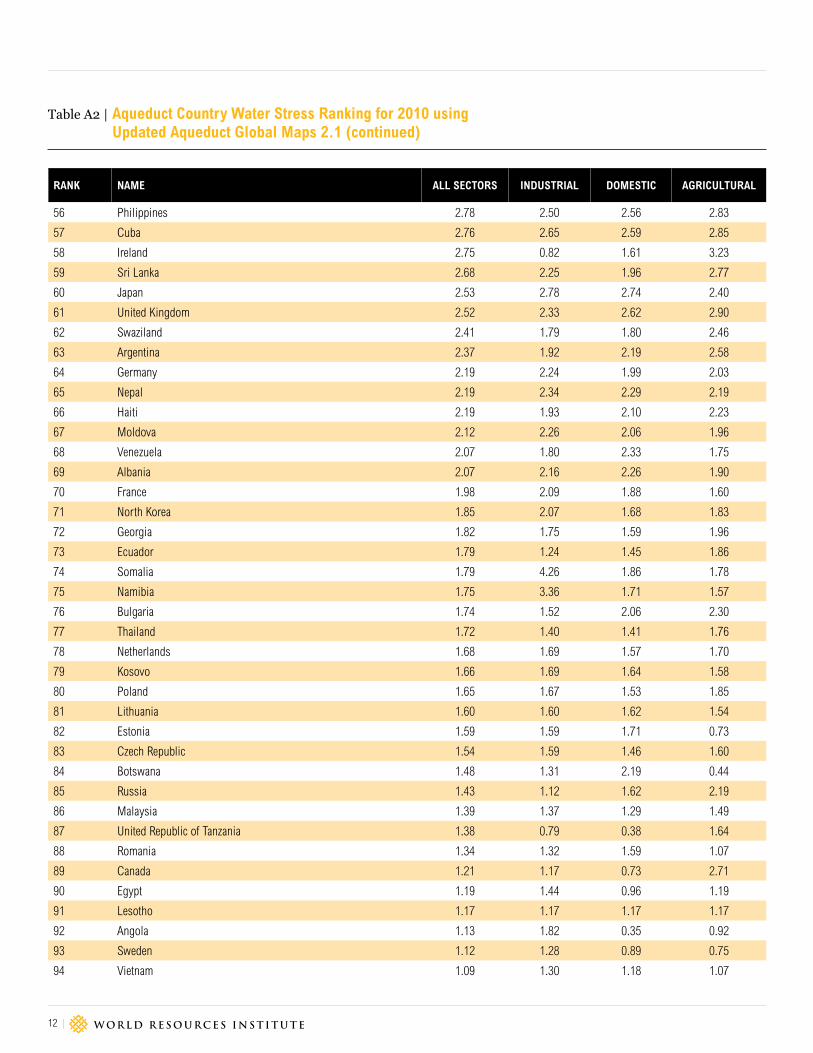
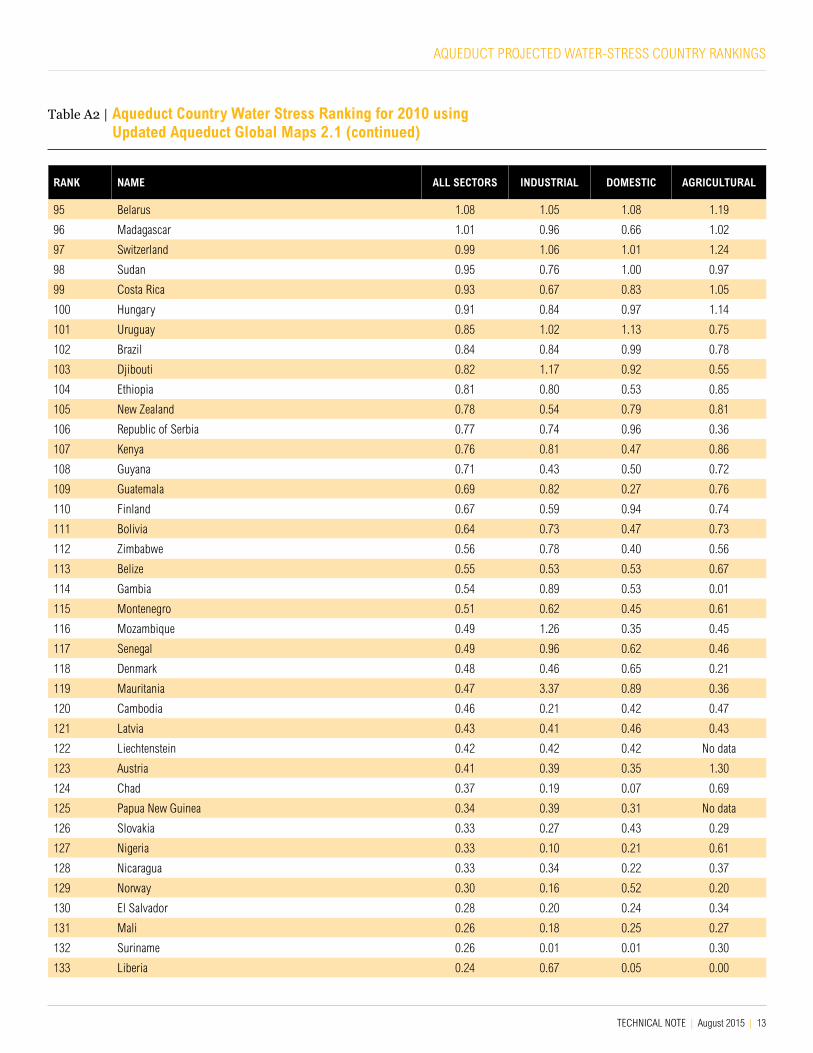
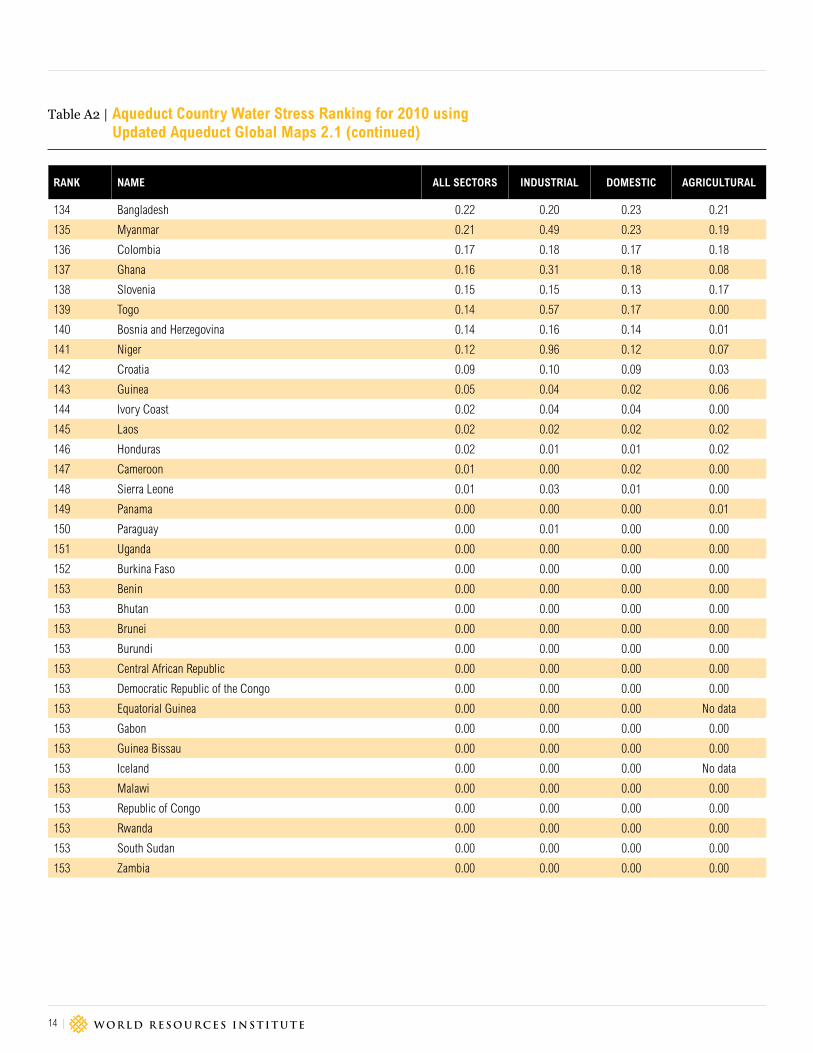
RESULTSThe results of projected country water stress in 2040 under the business-as-usual scenario are included in the Appendix Tables A1. An update of the baseline water stress country ranking for 2010,8 using Aqueduct Global Maps 2.1, is also included in Appendix Table A2. Figure 2 provides a map of the 2040 business-as-usual data. A few countries were excluded due to data limitations: the Global Land Data Assimilation System dataset we used for estimating runoff does not cover some small island countries.9
DESCRIPTION DATASET TITLE SOURCE
SOURCE INDICATORS:
Optimistic 2020 water stressOptimistic 2030 water stressOptimistic 2040 water stressBusiness-as-usual 2020 water stressBusiness-as-usual 2030 water stressBusiness-as-usual 2040 water stressPessimistic 2020 water stressPessimistic 2030 water stressPessimistic 2040 water stress
Aqueduct Water Stress Projections Luck et al., 2015
TARGET REGIONS:
Countries WRI Countries Admin Boundary Data Modified from Natural Earth Data. 1:10m Admin 0—Countries
GRIDDED WEIGHTS:
Optimistic 2020 withdrawals—total and sectoralOptimistic 2030 withdrawals—total and sectoralOptimistic 2040 withdrawals—total and sectoralBusiness-as-usual 2020 withdrawals—total and sectoralBusiness-as-usual 2030 withdrawals—total and sectoralBusiness-as-usual 2040 withdrawals—total and sectoralPessimistic 2020 withdrawals—total and sectoralPessimistic 2030 withdrawals—total and sectoralPessimistic 2040 withdrawals—total and sectoral
Aqueduct Water Stress Projections Luck et al., 2015
Table 2 | Data Sources
Information of this type can be used by private and public sector decision-makers to quantify the impacts of poten-tial future climate and socio-economic changes on water resources and competition. Our weighted aggregation methodology brings Aqueduct’s water stress projections to the country scale while retaining the detail and geospatial sensitivity of the underlying data. These rankings can help decision-makers to prioritize country-level investment and collaboration to advance sustainable water management and climate adaptation. For example:
▪ Investors can evaluate a portfolio’s exposure to future water-related risks.
▪ Companies can prioritize areas for potential invest-ment and engagement across the value chain.
▪ Governments can evaluate future exposure to water-related risks relative to other countries.
LIMITATIONSThese global projections are best suited to making com-parisons among countries for the same year and among scenarios and decades for the same region. More detailed and localized data or scenarios can better estimate
TECHNICAL NOTE | August 2015 | 5
AQUEDUCT PROJECTED WATER-STRESS COUNTRY RANKINGS
potential outcomes for specific regions and expose large sub-national variations that are subsumed under coun-trywide water stress values. Even with weighted aggrega-tion, important spatial differences are “averaged away.” For example, many countries like Brazil, China, and the United States have very significant regional variations in water demand and supply that may be over- or under-represented when aggregated to the national level. The country indicators face persistent limitations in attempt-ing to simplify complex information, such as spatial and temporal variations, into a single number. They also do not account for the governance and investment structure of the water sector in different countries. For example, Singapore has the maximum score of 5.0 in all projected years and scenarios, but is known for managing water exceptionally well in order to ensure a stable supply.
It is important to note the inherent uncertainty in estimat-ing any future conditions, particularly those associated with climate change, future population and economic trends, and water demand. The future scenarios are defined based on their overall global effects, not their effects on specific countries. Therefore, there could be cases where a country is less stressed in the “pessimistic” scenario than in the “optimistic” one. These future pro-jections should not be seen as predictions, but rather as
Figure 2 | Country-Level Water Stress in 2040 under the Business-As-Usual Scenario
Low
Low to medium
Medium to high
High
Extremely high
potential outcomes under specific, pre-defined climate and socio-economic change conditions.
Additionally, care should be taken when examining the change rates of a country’s projected stress levels between one year and another, because the risk score thresholds are not linear.10 For example, a score jump from 3.9 to 4.5 indicates a much more significant increase in the with-drawal-supply ratio than a score increase from 1.9 to 2.5. It would be more accurate to look at rates of change in the withdrawal-supply ratio at a sub-catchment level, which eliminates the impact of aggregation.
While the method has its limitations, the aggregated coun-try projections provide a consistent means for making comparisons between countries and, over time, taking into account upstream-downstream interactions and geo-graphic relationships between human activities and water resources. Full descriptions of the uses and limitations of the Aqueduct indicators and projections can be found in the Aqueduct Global Maps 2.111 and Aqueduct Water Stress Projections.12
WRI aims to continually improve the data and methodol-ogy and welcomes any feedback and suggestions on how to advance the development of country indicators.
6 |
APPENDIX
RANK NAME ALL SECTORS INDUSTRIAL DOMESTIC AGRICULTURAL
1 Bahrain 5.00 5.00 5.00 5.00
1 Kuwait 5.00 5.00 5.00 5.00
1 Qatar 5.00 5.00 5.00 5.00
1 San Marino 5.00 5.00 5.00 5.00
1 Singapore 5.00 5.00 5.00 No data
1 United Arab Emirates 5.00 5.00 5.00 5.00
1 Palestine 5.00 5.00 5.00 5.00
8 Israel 5.00 5.00 5.00 5.00
9 Saudi Arabia 4.99 5.00 5.00 4.99
10 Oman 4.97 4.97 4.97 4.97
11 Lebanon 4.97 4.97 4.97 4.97
12 Kyrgyzstan 4.93 4.93 4.92 4.93
13 Iran 4.91 4.97 4.97 4.90
14 Jordan 4.86 4.87 4.86 4.86
15 Libya 4.77 4.60 4.60 4.80
16 Yemen 4.74 4.66 4.63 4.75
17 Macedonia 4.70 4.69 4.59 4.79
18 Azerbaijan 4.69 4.59 4.58 4.74
19 Morocco 4.68 4.65 4.63 4.69
20 Kazakhstan 4.66 4.50 4.51 4.76
21 Iraq 4.66 4.58 4.56 4.73
22 Armenia 4.60 4.57 4.62 4.58
23 Pakistan 4.48 4.27 4.23 4.50
24 Chile 4.45 4.73 4.69 4.41
25 Syria 4.44 4.76 4.71 4.37
26 Turkmenistan 4.30 4.32 4.25 4.30
27 Turkey 4.27 4.59 4.53 4.13
28 Greece 4.23 4.19 4.18 4.23
29 Uzbekistan 4.19 4.47 4.45 4.12
30 Algeria 4.17 4.32 4.29 4.03
31 Afghanistan 4.12 3.37 3.62 4.19
32 Spain 4.07 3.64 3.64 4.22
33 Tunisia 4.06 4.41 4.38 4.00
34 Mexico 3.99 3.46 3.40 4.12
35 Dominican Republic 3.94 3.77 3.76 4.09
36 Estonia 3.91 3.92 3.80 1.50
37 Mongolia 3.85 4.05 4.04 3.48
Table A1 | Aqueduct Projected Country Water Stress Ranking for 2040 under Business-as-Usual Scenario
TECHNICAL NOTE | August 2015 | 7
AQUEDUCT PROJECTED WATER-STRESS COUNTRY RANKINGS
RANK NAME ALL SECTORS INDUSTRIAL DOMESTIC AGRICULTURAL
38 Belgium 3.74 3.74 3.75 3.25
39 Italy 3.67 3.58 3.58 3.80
40 India 3.61 3.24 3.18 3.70
41 Andorra 3.57 3.50 3.58 3.62
42 Monaco 3.56 3.56 3.56 3.56
43 Australia 3.55 3.72 3.71 3.52
44 Portugal 3.55 3.35 3.36 3.61
45 Tajikistan 3.44 3.59 3.39 3.42
46 Sri Lanka 3.33 3.23 3.24 3.53
47 United States of America 3.32 2.88 2.86 4.16
48 China 3.30 3.16 3.06 3.44
49 Albania 3.28 3.33 3.37 3.22
50 Haiti 3.27 3.20 3.21 3.34
51 Indonesia 3.26 3.42 3.28 2.99
52 Ukraine 3.25 3.17 3.16 3.77
53 South Africa 3.19 2.98 2.90 3.29
54 Namibia 3.18 4.47 3.56 2.11
55 Peru 3.18 3.11 3.02 3.21
56 Timor-Leste 3.18 3.31 3.33 3.08
57 Philippines 3.01 2.96 2.92 3.26
58 Botswana 3.00 3.41 3.30 0.87
59 Eritrea 3.00 2.90 2.89 3.05
60 Kosovo 2.96 3.03 3.05 2.30
61 Cuba 2.90 2.92 2.90 2.90
62 Moldova 2.85 2.99 2.84 2.56
63 Luxembourg 2.76 2.76 2.76 2.75
64 Georgia 2.75 2.56 2.52 2.94
65 Argentina 2.69 2.49 2.42 2.99
66 Netherlands 2.67 2.67 2.68 2.75
67 Swaziland 2.63 2.17 2.23 2.70
68 South Korea 2.59 2.42 2.42 2.84
69 United Kingdom 2.38 2.38 2.37 2.81
70 Lithuania 2.30 2.30 2.30 2.09
71 France 2.28 2.36 2.35 1.90
72 Japan 2.24 2.15 2.14 2.41
73 Nepal 2.18 2.27 2.12 2.18
74 Poland 2.05 2.05 2.05 2.21
75 Venezuela 1.98 2.55 2.54 1.74
Table A1 | Aqueduct Projected Country Water Stress Ranking for 2040 under Business-as-Usual Scenario (continued)
8 |
RANK NAME ALL SECTORS INDUSTRIAL DOMESTIC AGRICULTURAL
76 Ecuador 1.88 1.28 1.28 2.04
77 Finland 1.86 1.90 1.80 0.54
78 Lesotho 1.84 1.84 1.84 1.84
79 Bulgaria 1.84 1.81 1.78 2.69
80 Thailand 1.82 1.71 1.59 1.85
81 Czech Republic 1.81 1.81 1.81 1.91
82 Russia 1.79 1.60 1.60 3.02
83 Malaysia 1.78 1.78 1.70 2.00
84 Ireland 1.73 1.93 1.84 1.22
85 Germany 1.70 1.70 1.70 1.67
86 Somalia 1.66 1.59 1.73 1.40
87 Sweden 1.63 1.66 1.64 0.93
88 Sudan 1.56 1.72 1.64 1.55
89 Egypt 1.53 2.07 2.25 1.25
90 North Korea 1.50 1.47 1.48 1.54
91 Romania 1.50 1.57 1.63 1.42
92 Belarus 1.35 1.35 1.36 1.37
93 Switzerland 1.26 1.24 1.28 1.34
94 Canada 1.26 1.13 1.13 3.28
95 Guatemala 1.23 1.13 1.07 1.68
96 Montenegro 1.22 1.14 1.26 1.68
97 Angola 1.21 1.19 0.90 1.44
98 Honduras 1.17 1.14 1.12 1.33
99 Taiwan 1.14 0.96 0.95 1.60
100 Slovakia 1.08 1.12 1.18 0.73
101 Mauritania 1.05 1.71 1.70 0.88
102 El Salvador 1.03 1.01 1.00 1.08
103 Zimbabwe 1.02 1.10 1.05 1.02
104 United Republic of Tanzania 1.00 0.82 0.82 1.24
105 Senegal 0.98 1.41 1.35 0.87
106 Costa Rica 0.97 0.63 0.61 1.50
107 Vietnam 0.96 1.02 0.98 0.95
108 Republic of Serbia 0.93 0.92 0.98 0.60
109 Latvia 0.92 0.93 0.91 0.63
110 Nigeria 0.90 0.86 0.83 1.23
111 Hungary 0.89 0.88 0.89 1.39
112 Madagascar 0.88 0.53 0.52 0.92
113 Brazil 0.88 0.95 0.94 0.82
Table A1 | Aqueduct Projected Country Water Stress Ranking for 2040 under Business-as-Usual Scenario (continued)
TECHNICAL NOTE | August 2015 | 9
AQUEDUCT PROJECTED WATER-STRESS COUNTRY RANKINGS
RANK NAME ALL SECTORS INDUSTRIAL DOMESTIC AGRICULTURAL
114 Gambia 0.85 1.08 0.95 0.06
115 Bolivia 0.79 0.81 0.80 0.76
116 Slovenia 0.78 0.78 0.76 0.82
117 Mozambique 0.72 0.64 0.66 0.80
118 Denmark 0.70 0.91 0.89 0.53
119 Chad 0.67 0.61 0.54 0.97
120 Croatia 0.66 0.68 0.68 0.32
121 Ethiopia 0.66 0.57 0.51 0.79
122 Austria 0.65 0.62 0.64 1.89
123 Kenya 0.64 0.61 0.62 0.68
124 New Zealand 0.61 0.66 0.65 0.57
125 Guyana 0.61 0.30 0.30 0.71
126 Liechtenstein 0.59 0.59 0.59 0.59
127 Uruguay 0.59 0.70 0.70 0.56
128 Bosnia and Herzegovina 0.58 0.61 0.59 0.02
129 Ghana 0.57 0.61 0.56 0.55
130 Norway 0.55 0.58 0.57 0.21
131 Belize 0.41 0.29 0.26 1.10
132 Nicaragua 0.40 0.29 0.27 0.58
133 Papua New Guinea 0.40 0.41 0.32 0.00
134 Burkina Faso 0.39 0.48 0.40 0.20
135 Cambodia 0.38 0.52 0.41 0.37
136 Colombia 0.37 0.22 0.22 0.55
137 Ivory Coast 0.34 0.38 0.34 0.11
138 Mali 0.32 0.12 0.21 0.36
139 Bangladesh 0.32 0.31 0.32 0.32
140 Togo 0.32 0.45 0.33 0.23
141 Burundi 0.30 0.20 0.13 0.58
142 Djibouti 0.28 0.28 0.27 0.36
143 Niger 0.28 0.31 0.39 0.20
144 Suriname 0.22 0.00 0.01 0.33
145 Zambia 0.20 0.27 0.24 0.12
146 Myanmar 0.17 0.20 0.20 0.15
147 Democratic Republic of the Congo 0.15 0.16 0.13 0.18
148 Rwanda 0.10 0.14 0.11 0.01
149 Laos 0.08 0.10 0.11 0.07
150 Malawi 0.08 0.10 0.10 0.04
151 Liberia 0.03 0.03 0.03 0.00
Table A1 | Aqueduct Projected Country Water Stress Ranking for 2040 under Business-as-Usual Scenario (continued)
10 |
RANK NAME ALL SECTORS INDUSTRIAL DOMESTIC AGRICULTURAL
152 Guinea 0.02 0.01 0.01 0.05
153 Sierra Leone 0.02 0.03 0.02 0.01
154 Uganda 0.01 0.01 0.01 0.01
155 Cameroon 0.01 0.02 0.01 0.01
156 Benin 0.01 0.01 0.01 0.00
157 Brunei 0.01 0.01 0.01 0.01
158 Paraguay 0.00 0.00 0.00 0.01
159 Panama 0.00 0.00 0.00 0.00
160 Guinea Bissau 0.00 0.00 0.00 0.00
161 Bhutan 0.00 0.00 0.00 0.00
161 Central African Republic 0.00 0.00 0.00 0.00
161 Equatorial Guinea 0.00 0.00 0.00 0.00
161 Gabon 0.00 0.00 0.00 0.00
161 Iceland 0.00 0.00 0.00 No data
161 Republic of the Congo 0.00 0.00 0.00 0.00
161 South Sudan 0.00 0.00 0.00 0.00
Table A1 | Aqueduct Projected Country Water Stress Ranking for 2040 under Business-as-Usual Scenario (continued)
Table A2 | Aqueduct Country Water Stress Ranking for 2010 using Updated Aqueduct Global Maps 2.1
RANK NAME ALL SECTORS INDUSTRIAL DOMESTIC AGRICULTURAL
1 Bahrain 5.00 5.00 5.00 5.00
1 Qatar 5.00 5.00 5.00 5.00
1 San Marino 5.00 5.00 5.00 5.00
1 Singapore 5.00 5.00 5.00 No data
5 United Arab Emirates 5.00 5.00 5.00 5.00
6 Saudi Arabia 5.00 5.00 4.97 5.00
7 Kuwait 4.97 4.90 4.97 4.97
8 Oman 4.95 4.97 4.97 4.95
9 Kyrgyzstan 4.93 4.97 4.94 4.93
10 Iran 4.79 4.47 4.70 4.80
11 Yemen 4.76 4.08 4.71 4.78
12 Libya 4.74 4.65 4.42 4.82
13 Israel 4.73 4.69 4.80 4.70
14 Kazakhstan 4.50 4.30 4.32 4.55
15 Palestine 4.45 4.49 4.39 4.50
16 Jordan 4.30 4.28 4.36 4.27
TECHNICAL NOTE | August 2015 | 11
AQUEDUCT PROJECTED WATER-STRESS COUNTRY RANKINGS
RANK NAME ALL SECTORS INDUSTRIAL DOMESTIC AGRICULTURAL
17 Pakistan 4.25 4.06 4.06 4.26
18 Lebanon 4.23 4.26 4.28 4.20
19 Uzbekistan 4.20 4.46 4.45 4.17
20 Mongolia 4.08 4.82 4.23 3.27
21 Azerbaijan 4.01 4.24 4.03 3.92
22 Turkmenistan 4.00 3.85 3.27 4.03
23 Armenia 3.93 4.03 3.90 3.93
24 Syria 3.86 3.81 3.75 3.87
25 Morocco 3.85 3.57 3.54 3.91
26 Afghanistan 3.76 3.70 3.43 3.77
27 Iraq 3.67 3.15 3.50 3.75
28 India 3.62 3.46 3.10 3.67
29 Greece 3.60 3.14 3.29 3.64
30 Taiwan 3.52 3.65 2.93 2.76
31 Spain 3.51 3.34 3.50 3.57
32 Timor-Leste 3.45 2.51 2.97 3.50
33 Dominican Republic 3.44 3.15 3.26 3.52
34 Italy 3.42 3.45 3.64 3.30
35 Monaco 3.41 3.41 3.41 3.41
36 Belgium 3.39 3.38 3.45 3.13
37 Eritrea 3.34 2.38 3.61 3.32
38 Macedonia 3.34 3.27 3.27 3.45
39 Tajikistan 3.34 2.94 3.25 3.37
40 Mexico 3.32 2.66 2.70 3.51
41 Turkey 3.32 3.27 3.27 3.35
42 Tunisia 3.27 3.42 3.34 3.25
43 Australia 3.24 3.03 3.28 3.26
44 Peru 3.20 3.26 2.75 3.24
45 China 3.10 3.08 2.74 3.18
46 Portugal 3.06 3.16 3.23 2.98
47 Andorra 3.05 2.88 3.05 3.13
48 Algeria 3.04 3.41 2.96 2.95
49 United States 3.01 2.57 2.71 3.70
50 South Korea 2.92 3.32 2.99 2.78
51 South Africa 2.90 3.20 2.52 3.06
52 Chile 2.90 3.19 3.31 2.67
53 Indonesia 2.88 2.30 2.59 3.05
54 Ukraine 2.81 2.46 2.64 3.12
55 Luxembourg 2.80 2.79 2.81 2.79
Table A2 | Aqueduct Country Water Stress Ranking for 2010 using Updated Aqueduct Global Maps 2.1 (continued)
12 |
Table A2 | Aqueduct Country Water Stress Ranking for 2010 using Updated Aqueduct Global Maps 2.1 (continued)
RANK NAME ALL SECTORS INDUSTRIAL DOMESTIC AGRICULTURAL
56 Philippines 2.78 2.50 2.56 2.83
57 Cuba 2.76 2.65 2.59 2.85
58 Ireland 2.75 0.82 1.61 3.23
59 Sri Lanka 2.68 2.25 1.96 2.77
60 Japan 2.53 2.78 2.74 2.40
61 United Kingdom 2.52 2.33 2.62 2.90
62 Swaziland 2.41 1.79 1.80 2.46
63 Argentina 2.37 1.92 2.19 2.58
64 Germany 2.19 2.24 1.99 2.03
65 Nepal 2.19 2.34 2.29 2.19
66 Haiti 2.19 1.93 2.10 2.23
67 Moldova 2.12 2.26 2.06 1.96
68 Venezuela 2.07 1.80 2.33 1.75
69 Albania 2.07 2.16 2.26 1.90
70 France 1.98 2.09 1.88 1.60
71 North Korea 1.85 2.07 1.68 1.83
72 Georgia 1.82 1.75 1.59 1.96
73 Ecuador 1.79 1.24 1.45 1.86
74 Somalia 1.79 4.26 1.86 1.78
75 Namibia 1.75 3.36 1.71 1.57
76 Bulgaria 1.74 1.52 2.06 2.30
77 Thailand 1.72 1.40 1.41 1.76
78 Netherlands 1.68 1.69 1.57 1.70
79 Kosovo 1.66 1.69 1.64 1.58
80 Poland 1.65 1.67 1.53 1.85
81 Lithuania 1.60 1.60 1.62 1.54
82 Estonia 1.59 1.59 1.71 0.73
83 Czech Republic 1.54 1.59 1.46 1.60
84 Botswana 1.48 1.31 2.19 0.44
85 Russia 1.43 1.12 1.62 2.19
86 Malaysia 1.39 1.37 1.29 1.49
87 United Republic of Tanzania 1.38 0.79 0.38 1.64
88 Romania 1.34 1.32 1.59 1.07
89 Canada 1.21 1.17 0.73 2.71
90 Egypt 1.19 1.44 0.96 1.19
91 Lesotho 1.17 1.17 1.17 1.17
92 Angola 1.13 1.82 0.35 0.92
93 Sweden 1.12 1.28 0.89 0.75
94 Vietnam 1.09 1.30 1.18 1.07
TECHNICAL NOTE | August 2015 | 13
AQUEDUCT PROJECTED WATER-STRESS COUNTRY RANKINGS
RANK NAME ALL SECTORS INDUSTRIAL DOMESTIC AGRICULTURAL
95 Belarus 1.08 1.05 1.08 1.19
96 Madagascar 1.01 0.96 0.66 1.02
97 Switzerland 0.99 1.06 1.01 1.24
98 Sudan 0.95 0.76 1.00 0.97
99 Costa Rica 0.93 0.67 0.83 1.05
100 Hungary 0.91 0.84 0.97 1.14
101 Uruguay 0.85 1.02 1.13 0.75
102 Brazil 0.84 0.84 0.99 0.78
103 Djibouti 0.82 1.17 0.92 0.55
104 Ethiopia 0.81 0.80 0.53 0.85
105 New Zealand 0.78 0.54 0.79 0.81
106 Republic of Serbia 0.77 0.74 0.96 0.36
107 Kenya 0.76 0.81 0.47 0.86
108 Guyana 0.71 0.43 0.50 0.72
109 Guatemala 0.69 0.82 0.27 0.76
110 Finland 0.67 0.59 0.94 0.74
111 Bolivia 0.64 0.73 0.47 0.73
112 Zimbabwe 0.56 0.78 0.40 0.56
113 Belize 0.55 0.53 0.53 0.67
114 Gambia 0.54 0.89 0.53 0.01
115 Montenegro 0.51 0.62 0.45 0.61
116 Mozambique 0.49 1.26 0.35 0.45
117 Senegal 0.49 0.96 0.62 0.46
118 Denmark 0.48 0.46 0.65 0.21
119 Mauritania 0.47 3.37 0.89 0.36
120 Cambodia 0.46 0.21 0.42 0.47
121 Latvia 0.43 0.41 0.46 0.43
122 Liechtenstein 0.42 0.42 0.42 No data
123 Austria 0.41 0.39 0.35 1.30
124 Chad 0.37 0.19 0.07 0.69
125 Papua New Guinea 0.34 0.39 0.31 No data
126 Slovakia 0.33 0.27 0.43 0.29
127 Nigeria 0.33 0.10 0.21 0.61
128 Nicaragua 0.33 0.34 0.22 0.37
129 Norway 0.30 0.16 0.52 0.20
130 El Salvador 0.28 0.20 0.24 0.34
131 Mali 0.26 0.18 0.25 0.27
132 Suriname 0.26 0.01 0.01 0.30
133 Liberia 0.24 0.67 0.05 0.00
Table A2 | Aqueduct Country Water Stress Ranking for 2010 using Updated Aqueduct Global Maps 2.1 (continued)
14 |
Table A2 | Aqueduct Country Water Stress Ranking for 2010 using Updated Aqueduct Global Maps 2.1 (continued)
RANK NAME ALL SECTORS INDUSTRIAL DOMESTIC AGRICULTURAL
134 Bangladesh 0.22 0.20 0.23 0.21
135 Myanmar 0.21 0.49 0.23 0.19
136 Colombia 0.17 0.18 0.17 0.18
137 Ghana 0.16 0.31 0.18 0.08
138 Slovenia 0.15 0.15 0.13 0.17
139 Togo 0.14 0.57 0.17 0.00
140 Bosnia and Herzegovina 0.14 0.16 0.14 0.01
141 Niger 0.12 0.96 0.12 0.07
142 Croatia 0.09 0.10 0.09 0.03
143 Guinea 0.05 0.04 0.02 0.06
144 Ivory Coast 0.02 0.04 0.04 0.00
145 Laos 0.02 0.02 0.02 0.02
146 Honduras 0.02 0.01 0.01 0.02
147 Cameroon 0.01 0.00 0.02 0.00
148 Sierra Leone 0.01 0.03 0.01 0.00
149 Panama 0.00 0.00 0.00 0.01
150 Paraguay 0.00 0.01 0.00 0.00
151 Uganda 0.00 0.00 0.00 0.00
152 Burkina Faso 0.00 0.00 0.00 0.00
153 Benin 0.00 0.00 0.00 0.00
153 Bhutan 0.00 0.00 0.00 0.00
153 Brunei 0.00 0.00 0.00 0.00
153 Burundi 0.00 0.00 0.00 0.00
153 Central African Republic 0.00 0.00 0.00 0.00
153 Democratic Republic of the Congo 0.00 0.00 0.00 0.00
153 Equatorial Guinea 0.00 0.00 0.00 No data
153 Gabon 0.00 0.00 0.00 0.00
153 Guinea Bissau 0.00 0.00 0.00 0.00
153 Iceland 0.00 0.00 0.00 No data
153 Malawi 0.00 0.00 0.00 0.00
153 Republic of Congo 0.00 0.00 0.00 0.00
153 Rwanda 0.00 0.00 0.00 0.00
153 South Sudan 0.00 0.00 0.00 0.00
153 Zambia 0.00 0.00 0.00 0.00
TECHNICAL NOTE | August 2015 | 15
AQUEDUCT PROJECTED WATER-STRESS COUNTRY RANKINGS
ENDNOTES1. Luck, M., M. Landis, F. Gassert. 2015. “Aqueduct Water Stress Projec-
tions: Decadal Projections of Water Supply and Demand Using CMIP5 GCMs.” Technical Note. Washington, D.C.: World Resources Institute. Available online at: wri.org/publication/aqueduct-water-stress-projections.
2. Gassert, F., P. Reig, T. Luo, and A. Maddocks. 2013. “Aqueduct Country and River Basin Rankings: A Weighted Aggregation of Spatially Distinct Hydrological Indicators.” Working paper. Washington, D.C.: World Resources Institute. Available online at: http://www.wri.org/publication/aqueduct-country-river-basin-rankings.
3. Gassert, F., P. Reig, T. Luo, and A. Maddocks. 2013. “Aqueduct Country and River Basin Rankings: A Weighted Aggregation of Spatially Distinct Hydrological Indicators.” Working paper. Washington, D.C.: World Resources Institute. Available online at: http://www.wri.org/publication/aqueduct-country-river-basin-rankings.
4. For example, according to MSCI staff, most companies report their assets at the country or regional scale, rendering sub-catchment data unusable.
5. Detlef P. van Vuuren et al. 2011. “The Use of Scenarios as the Basis for Combined Assessment of Climate Change Mitigation and Adaptation.” Global Environmental Change 21 (2): 575–91, doi:10.1016/j.gloenv-cha.2010.11.003.
6. Luck, M., M. Landis, F. Gassert. 2015. “Aqueduct Water Stress Projections: Decadal Projections of Water Supply and Demand Using CMIP5 GCMs.” Technical Note. Washington, D.C.: World Resources Institute. Available online at: wri.org/publication/aqueduct-water-stress-projections.
7. Gassert, F., M. Landis, M. Luck, P. Reig, and T. Shiao. 2014. “Aqueduct Global Maps 2.1.” Working Paper. Washington, D.C.: World Resources Institute. Available online at: http://www.wri.org/publication/aqueduct-global-maps-21.
8. Gassert, F., P. Reig, T. Luo, and A. Maddocks. 2013. “Aqueduct Country and River Basin Rankings: A Weighted Aggregation of Spatially Distinct Hydrological Indicators.” Working paper. Washington, D.C.: World Resources Institute. Available online at: http://www.wri.org/publication/aqueduct-country-river-basin-rankings.
9. National Aeronautics and Space Administration (NASA), Global Land Data Assimilation System Version 2 (GLDAS-2). Goddard Earth Sci-ences Data Information Services Center, 2012.
10. Gassert, F., M. Luck, M. Landis, P. Reig, and T. Shiao. 2014. “Aque-duct Global Maps 2.1: Constructing Decision-Relevant Global Water Risk Indicators.” Working Paper. Washington, D.C.: World Resources Institute. Available online at: http://www.wri.org/publication/aqueduct-globalmaps-21-indicators.
11. Ibid.
12. Luck, M., M. Landis, F. Gassert. 2015. “Aqueduct Water Stress Projec-tions: Decadal Projections of Water Supply and Demand Using CMIP5 GCMs.” Technical Note. Washington, D.C.: World Resources Institute. Available online at: http://www.wri.org/publication/aqueduct-water-stress-projections.
ABOUT WRI World Resources Institute is a global research organization that turns big ideas into action at the nexus of environment, economic opportunity and human well-being.
Our ChallengeNatural resources are at the foundation of economic opportunity and human well-being. But today, we are depleting Earth’s resources at rates that are not sustainable, endangering economies and people’s lives. People depend on clean water, fertile land, healthy forests, and a stable climate. Livable cities and clean energy are essential for a sustainable planet. We must address these urgent, global challenges this decade.
Our VisionWe envision an equitable and prosperous planet driven by the wise manage-ment of natural resources. We aspire to create a world where the actions of government, business, and communities combine to eliminate poverty and sustain the natural environment for all people.
Our ApproachCOUNT ITWe start with data. We conduct independent research and draw on the latest technology to develop new insights and recommendations. Our rigorous analysis identifies risks, unveils opportunities, and informs smart strategies. We focus our efforts on influential and emerging economies where the future of sustainability will be determined.
CHANGE ITWe use our research to influence government policies, business strategies, and civil society action. We test projects with communities, companies, and government agencies to build a strong evidence base. Then, we work with partners to deliver change on the ground that alleviates poverty and strength-ens society. We hold ourselves accountable to ensure our outcomes will be bold and enduring.
SCALE ITWe don’t think small. Once tested, we work with partners to adopt and expand our efforts regionally and globally. We engage with decision-makers to carry out our ideas and elevate our impact. We measure success through government and business actions that improve people’s lives and sustain a healthy environment.
ABOUT THE AUTHORSTianyi Luo is an Associate with the Aqueduct Project at WRI, where he manages data analytics and GIS analysis.
Contact: [email protected]
Robert Young is a Stanford University MAP Sustainable Energy Fellow with the Aqueduct Project at WRI.
Contact: [email protected]
Paul Reig is an Associate with the Aqueduct Project at WRI, where he leads the design and development of the Aqueduct Water Risk Atlas.
Contact: [email protected]
Copyright 2015 World Resources Institute. This work is licensed under the Creative Commons Attribution 4.0 International License. To view a copy of the license, visit http://creativecommons.org/licenses/by/4.0/
10 G Street, NE | Washington, DC 20002 | www.WRI.org
ACKNOWLEDGMENTSThis publication was made possible thanks to the ongoing support of the World Resources Institute Water Program, Aqueduct Alliance, Natural Capital Declaratio n (Global Canopy Programme and United Nations Envi-ronmental Programme Finance Initiative), German International Coopera-tion (GIZ) and German Federal Ministry for Economic Cooperation and Development (BMZ). The authors would like to thank the following people for providing invaluable insight and assistance: Francis Gassert, Betsy Otto, Charles Iceland, Laura Malaguzzi Valeri, and Daryl Ditz as well as Julie Moretti and Hyacinth Billings for graphic support and final editing. For their technical guidance and feedback during the development of the Aqueduct Projected Water Stress Country Rankings, the authors would also like to thank:
Johannes Friedrich, World Resources InstituteMengpin Ge, World Resources InstituteCyrus Lotfipour, MSCI Inc.


![Aqueduct en[1]](https://img.dokumen.tips/doc/110x75/557e9f8ed8b42a1d048b535e/aqueduct-en1.jpg)


![Aqueduct el[1]](https://img.dokumen.tips/doc/110x75/557ea115d8b42ac5658b47e0/aqueduct-el1.jpg)