Embed Size (px)
Citation preview

AQR Capital Management, LLC
Two Greenwich Plaza
Greenwich, CT 06830
p: +1.203.742.3600 | w: aqr.com
Covered Calls
And Their Unintended Reversal Bet
May 8, 2014
Private and Confidential
Prepared Exclusively for
Nomura Global Quantitative Equity Conference
Disclosures
1
The information set forth herein has been obtained or derived from sources believed by AQR Capital Management, LLC (“AQR”) to be reliable. However, AQR does not make any
representation or warranty, express or implied, as to the information’s accuracy or completeness, nor does AQR recommend that the attached information serve as the basis of
any investment decision. This document has been provided to you solely for information purposes and does not constitute an offer or solicitation of an offer, or any advice or
recommendation, to purchase any securities or other financial instruments, and may not be construed as such. This document is intended exclusively for the use of the person to
whom it has been delivered by AQR and it is not to be reproduced or redistributed to any other person. This document is subject to further review and revision. For one-on-one
presentation use only. Past performance is not a guarantee of future performance.
This presentation is not research and should not be treated as research. This presentation does not represent valuation judgments with respect to any financial instrument, issuer, security or sector that may be described or referenced herein and does not represent a formal or official view of AQR.
The views expressed reflect the current views as of the date hereof and neither the speaker nor AQR undertakes to advise you of any changes in the views expressed herein. It should not be assumed that the speaker or AQR will make investment recommendations in the future that are consistent with the views expressed herein, or use any or all of the techniques or methods of analysis described herein in managing client accounts. AQR and its affiliates may have positions (long or short) or engage in securities transactions that are not consistent with the information and views expressed in this presentation.
The information contained herein is only as current as of the date indicated, and may be superseded by subsequent market events or for other reasons. Charts and graphs provided herein are for illustrative purposes only. The information in this presentation has been developed internally and/or obtained from sources believed to be reliable; however, neither AQR nor the speaker guarantees the accuracy, adequacy or completeness of such information. Nothing contained herein constitutes investment, legal, tax or other advice nor is it to be relied on in making an investment or other decision.
There can be no assurance that an investment strategy will be successful. Historic market trends are not reliable indicators of actual future market behavior or future performance of any particular investment which may differ materially, and should not be relied upon as such. Target allocations contained herein are subject to change. There is no assurance that the target allocations will be achieved, and actual allocations may be significantly different than that shown here. This presentation should not be viewed as a current or past recommendation or a solicitation of an offer to buy or sell any securities or to adopt any investment strategy.
The information in this presentation may contain projections or other forward‐looking statements regarding future events, targets, forecasts or expectations regarding the strategies described herein, and is only current as of the date indicated. There is no assurance that such events or targets will be achieved, and may be significantly different from that shown here. The information in this presentation, including statements concerning financial market trends, is based on current market conditions, which will fluctuate and may be superseded by subsequent market events or for other reasons. Performance of all cited indices is calculated on a total return basis with dividends reinvested.
The investment strategy and themes discussed herein may be unsuitable for investors depending on their specific investment objectives and financial situation. Please note that changes in the rate of exchange of a currency may affect the value, price or income of an investment adversely.
Neither AQR nor the speaker assumes any duty to, nor undertakes to update forward looking statements. No representation or warranty, express or implied, is made or given by or on behalf of AQR, the speaker or any other person as to the accuracy and completeness or fairness of the information contained in this presentation, and no responsibility or liability is accepted for any such information. By accepting this presentation in its entirety, the recipient acknowledges its understanding and acceptance of the foregoing statement.
0
25
50
75
100
125
150
175
200
0 25 50 75 100 125 150 175 200
Pa
yo
ff
Index Value
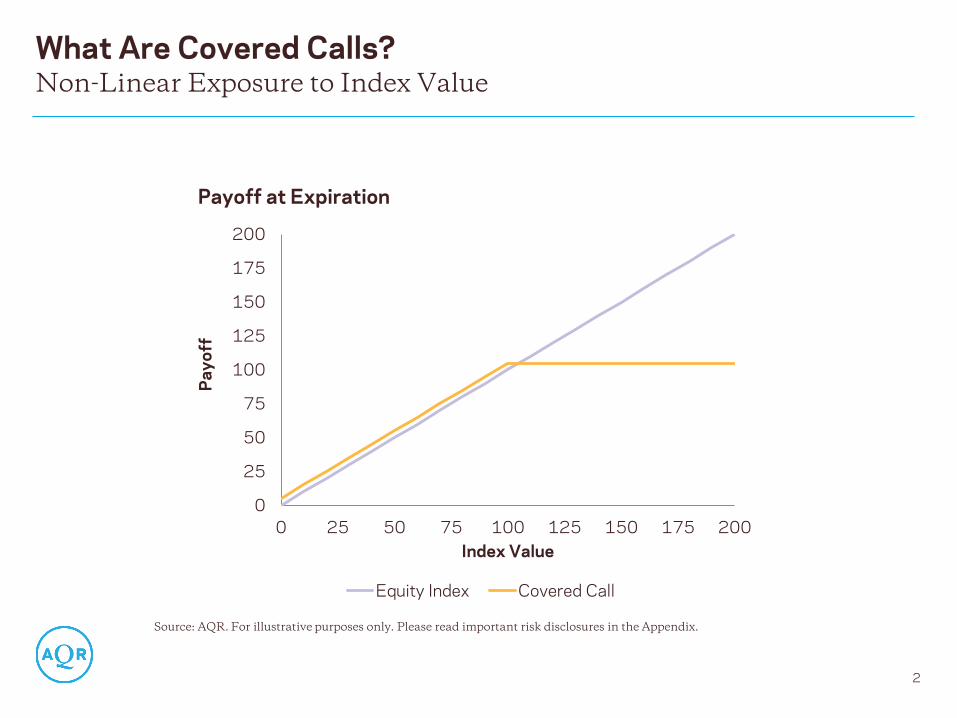
Payoff at Expiration
Equity Index Covered Call
What Are Covered Calls?
2
Non-Linear Exposure to Index Value
Source: AQR. For illustrative purposes only. Please read important risk disclosures in the Appendix.

0
25
50
75
100
125
150
175
200
0 25 50 75 100 125 150 175 200
Pa
yo
ff
Index Value
Payoff at Expiration
Equity Index Covered Call
What Are Covered Calls?
3
Covered Calls Alter Three Portfolio Characteristics
Source: AQR. For illustrative purposes only. Please read important risk disclosures in the Appendix.
Selling Call Option Introduces Short Volatility Exposure
Selling Call Option Introduces Equity Timing Exposure
Selling Call Option Reduces Equity Exposure

Timing Bet Grows as Time Passes … and Then Resets
4
Example: S&P 500 Index At-the-Money Covered Call
Source: AQR. Typical Covered Call Approach is an AQR backtest replicating the CBOE S&P 500 BuyWrite Index.
Index exposures are calculated according to the Black Scholes model. Hypothetical data has certain inherent
limitations, some of which are disclosed in the Appendix hereto.
0%
10%
20%
30%
40%
50%
60%
70%
80%
90%
100%
Jul-13 Aug-13 Sep-13 Oct-13 Nov-13
Ind
ex
Ex
po
su
re
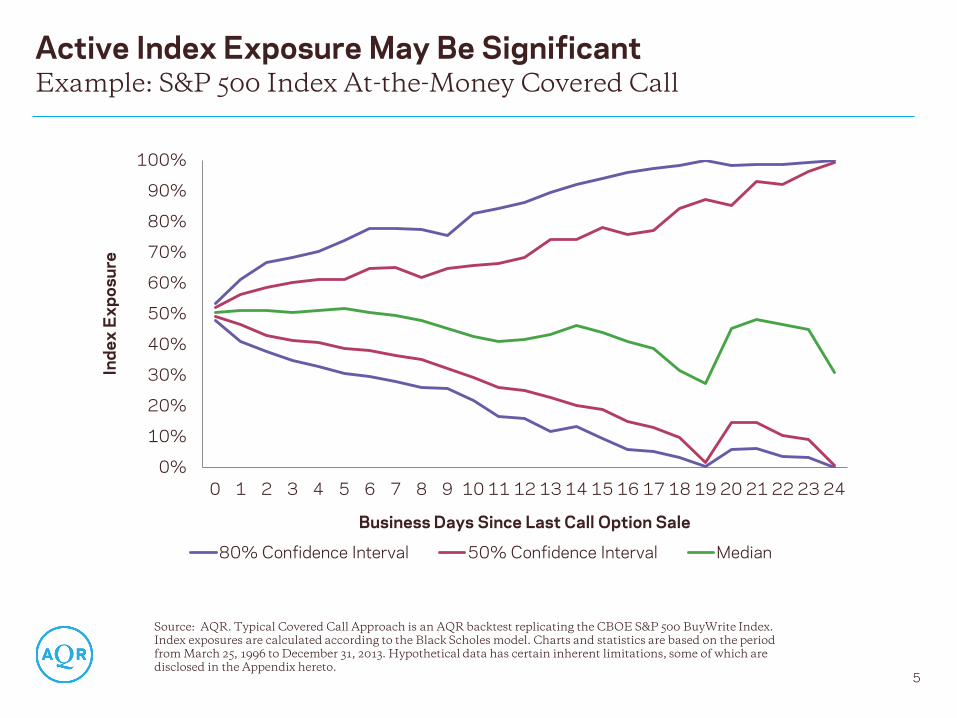
Active Index Exposure May Be Significant
5
Example: S&P 500 Index At-the-Money Covered Call
Source: AQR. Typical Covered Call Approach is an AQR backtest replicating the CBOE S&P 500 BuyWrite Index.
Index exposures are calculated according to the Black Scholes model. Charts and statistics are based on the period
from March 25, 1996 to December 31, 2013. Hypothetical data has certain inherent limitations, some of which are
disclosed in the Appendix hereto.
0%
10%
20%
30%
40%
50%
60%
70%
80%
90%
100%
0 1 2 3 4 5 6 7 8 9 10 11 12 13 14 15 16 17 18 19 20 21 22 23 24
Ind
ex
Ex
po
su
re
Business Days Since Last Call Option Sale
80% Confidence Interval 50% Confidence Interval Median

A Covered Call Bets on Equity Reversals
6
Exposure to Reversal Increases as Expiration Nears
Source: AQR. For illustrative purposes only. Please read important risk disclosures in the Appendix.
-10%
0%
10%
20%
30%
40%
50%
60%
70%
80%
90%
100%
90 92 94 96 98 100 102 104 106 108 110
Ind
ex
Ex
po
su
re
Index Value
1 Month to Expiry 1 Week to Expiry 1 Day to Expiry

A Covered Call Bets on Equity Reversals
7
We Compare Index Exposure to Historical Index Returns
Source: AQR. Returns are for the period from March 25, 1996, to December 31, 2013. Regression is estimated over the
same period. The t-statistics estimated for the two regression coefficients are obtained using the bootstrap resampling
technique due to the unusual overlapping nature of the data. Past performance is not a guarantee of future returns.
Please read important risk disclosures in the Appendix.
0%
10%
20%
30%
40%
50%
60%
70%
80%
90%
100%
-40% -30% -20% -10% 0% 10% 20% 30% 40%
Ind
ex
Ex
po
su
re
S&P 500 Return Since Last Call Option Sale
Intercept Index
Return R2
Coefficient 50% -6.7 74.2%
(t-statistic) (241.0) (-30.6)

Does Active Exposure Forecast Equity Index Returns?
8
Regression Indicates No Statistical Significance
Source: AQR. Returns are for the period from March 25, 1996, to December 31, 2013. Regression is estimated over the same period. The t-statistics estimated
for the two regression coefficients are obtained using the bootstrap resampling technique due to the unusual overlapping nature of the data.
Reversal component of the Typical Covered Call Approach is an AQR backtest replicating the CBOE S&P 500 BuyWrite Index. The replicated BuyWrite Index
differs from the CBOE S&P 500 BuyWrite Index because the CBOE Index writes new call positions on expiry dates using VWAP of intraday prices and our
replicated index writes new call positions using reported closing midpoint prices.
Hypothetical data has certain inherent limitations, some of which are disclosed in the Appendix hereto
Intercept Active Equity
Exposure R2
Coefficient 2.6 bps 5.6 (bps) 0.01%
(t-statistic) (1.4) (0.6)
-5%
0%
5%
10%
15%
20%
1996 1998 2000 2002 2004 2006 2008 2010 2012
Cumulative Returns of Hypothetical Reversal Component

Risk Managed Covered Calls

AQR Color
Palette
AQR Cyan
Auxiliary Palette
Investment Philosophy
10
AQR Seeks to Reduce Exposure to Uncompensated Risks
Source: AQR. For illustrative purposes only. Please read important disclosures in the Appendix.
Typical Covered Call Approach
Multiple risks embedded in one portfolio
AQR Portfolio
Equity Risk Premium
Volatility Risk Premium
Equity Risk Premium
Volatility Risk Premium
AQR Approach
AQR seeks to eliminate unintended risks and target intended risks
? Equity Market Timing

AQR Color
Palette
AQR Cyan
Auxiliary Palette
Investment Philosophy
11
AQR Seeks to Reduce Exposure to Uncompensated Risks
Typical Covered Call Approach (Simulations)
Multiple risks embedded in one portfolio
S… AQR Approach (Simulations)
AQR seeks to eliminate unintended risks and target intended risks
Total1 Equity Risk
Premium
Volatility Risk
Premium
Equity Market Timing
Annualized Excess Return
5.7% 3.2% 1.9% 0.6%
Annualized Volatility
11.6% 8.3% 2.0% 4.9%
Sharpe Ratio
0.50 0.39 0.95 0.12
Total Equity Risk
Premium Enhanced
VRP
Annualized Excess Return
5.8% 3.2% 2.6%
Annualized Volatility
9.3% 8.3% 2.1%
Sharpe Ratio
0.62 0.39 1.25
Source: AQR. Typical Covered Call Approach is an AQR backtest replicating the CBOE S&P 500 BuyWrite Index. AQR’s Approach is a proprietary AQR
backtest, gross of transaction costs, in excess of short-term interest rates. The results shown do not include advisory fees or transaction costs; if such
fees and expenses were deducted the performance would be lower. Statistics are calculated over the period from March 25, 1996, to December 31, 2013.
Hypothetical data has certain inherent limitations, some of which are disclosed in the Appendix hereto. Please read important disclosures in the
Appendix. Past performance is not a guarantee of future results.
1The replicated BuyWrite Index differs from the CBOE S&P 500 BuyWrite Index because the CBOE Index writes new call positions on expiry dates
using VWAP of intraday prices and our replicated index writes new call positions using reported closing midpoint prices.

AQR Color
Palette
AQR Cyan
Auxiliary Palette
Investment Philosophy
12
Potential Benefits to Investing in Covered Calls
• Collect equity risk premium
• Collect volatility risk premium
• Achieve equity-like returns with lower volatility
Potential Benefits to Covered Calls
• Targeted allocation to equity and volatility risk premia
• Removal of unintended equity market timing exposure
• Robust portfolio management of options exposures
Potential Benefits to AQR Approach

AQR Color
Palette
AQR Cyan
Auxiliary Palette
Investment Approach
13
Managing Equity Risk Premium Exposure
0%
20%
40%
60%
80%
100%
0 5 10 15 20
Ind
ex
Ex
po
su
re
Business Days since Rebalance
80% Confidence Interval 50% Confidence Interval
Median
0%
20%
40%
60%
80%
100%
0 5 10 15 20
Ind
ex
Ex
po
su
re
Business Days since Rebalance
80% Confidence Interval 50% Confidence Interval
Median
Typical Covered Call Approach (Simulations)
Exposure to market timing is higher as expiration nears
AQR Approach (Simulations)
Through daily hedging, AQR maintains a constant equity exposure
Source: AQR. Typical Covered Call Approach is an AQR backtest replicating the CBOE S&P 500 BuyWrite Index.
Index exposures are calculated according to the Black-Scholes model. AQR’s Approach is a proprietary AQR backtest.
Charts and statistics are based on the period from March 25, 1996, to December 31, 2013. Hypothetical data has certain
inherent limitations, some of which are disclosed in the Appendix hereto. Please read important disclosures in the
Appendix.

AQR Color
Palette
AQR Cyan
Auxiliary Palette
Investment Approach
14
Managing Volatility Risk Premium Exposure
25 20 15 10 5
Sh
ort
Vo
lati
lity
Ex
po
su
re
Business Days to Expiry
80% Confidence Interval 50% Confidence Interval
Median
25 20 15 10 5
Sh
ort
Vo
lati
lity
Ex
po
su
re
Business Days to Expiry
80% Confidence Interval 50% Confidence Interval
Median
Typical Covered Call Approach (Simulations)
Volatility risk premium exposure varies significantly
AQR Approach (Simulations)
Volatility risk premium exposure is more stable due to portfolio construction of options positions
Source: AQR. Typical Covered Call Approach is an AQR backtest replicating the CBOE S&P 500 BuyWrite Index.
Gamma exposure is calculated according to the Black-Scholes model. AQR’s Approach is a proprietary AQR backtest.
Charts and statistics are based on the period from March 25, 1996, to December 31, 2013. Hypothetical data has certain
inherent limitations, some of which are disclosed in the Appendix hereto. Please read important disclosures in the
Appendix.

AQR Color
Palette
AQR Cyan
Auxiliary Palette
Portfolio Characteristics
15
AQR Approach Had Smaller Drawdowns in Simulated Performance
Sources: S&P 500 Index, CBOE S&P 500 BuyWrite Index, and AQR’s Approach is a proprietary AQR backtest, gross of
transaction costs, in excess of short-term interest rates. Charts are based on the period from March 25, 1996, to
December 31, 2013. Hypothetical data has certain inherent limitations, some of which are disclosed in the Appendix
hereto. Please read important disclosures in the Appendix.
-60%
-50%
-40%
-30%
-20%
-10%
0%
1996 1998 2000 2002 2004 2006 2008 2010 2012 2014
S&P 500 Index CBOE S&P 500 BuyWrite Index AQR Approach (Simulations)

AQR Color
Palette
AQR Cyan
Auxiliary Palette
Portfolio Characteristics
16
Seeks Equity-Like Returns With Lower Risk
S&P 500 CBOE S&P 500 BuyWrite Index
AQR Approach (Simulations)
Annualized Log Excess Return 4.4% 3.8% 5.1%
Annualized Volatility 16.7% 11.6% 9.3%
Sharpe Ratio 0.26 0.33 0.55
Maximum Drawdown -61.7% -43.0% -34.0%
S&P 500 CBOE S&P 500 BuyWrite Index
AQR Approach (Simulations)
Correlation to S&P 500 0.90 0.98
Beta to S&P 500 0.64 0.54
Alpha to S&P 500 0.7% (t=0.6) 2.3% (t=5.3)
Tracking Error to S&P 500 9.1% 9.3%
S&P 500 CBOE S&P 500 BuyWrite Index
AQR Approach (Simulations)
Alpha to CBOE BuyWrite Index -0.7% (t=0.6) 2.3% (t=2.3)
Tracking Error to CBOE BuyWrite Index 9.1% 5.8%
Source: S&P 500 Index, CBOE S&P 500 BuyWrite Index, and AQR’s Approach is a proprietary AQR backtest, gross of
transaction costs, in excess of short-term interest rates. The results shown do not include advisory fees or transaction
costs; if such fees and expenses were deducted the performance would be lower. Charts are based on the period from
March 25, 1996 to December 31, 2013. Hypothetical data has certain inherent limitations, some of which are disclosed
in the Appendix hereto. Please read important disclosures in the Appendix. Past performance is not a guarantee of
future results.

AQR Color
Palette
AQR Cyan
Auxiliary Palette
Portfolio Characteristics
17
Seeks Equity-Like Returns With Lower Risk
Cumulative Returns
-25%
0%
25%
50%
75%
100%
125%
150%
1996 1998 2000 2002 2004 2006 2008 2010 2012
S&P 500 Index CBOE S&P 500 BuyWrite Index AQR Approach (Simulations)
Source: S&P 500 Index, CBOE S&P 500 BuyWrite Index, and AQR’s Approach is a proprietary AQR backtest, gross of
transaction costs, in excess of short-term interest rates. The results shown do not include advisory fees or transaction
costs; if such fees and expenses were deducted the performance would be lower. Charts are based on the period from
March 25, 1996 to December 31, 2013. Hypothetical data has certain inherent limitations, some of which are disclosed
in the Appendix hereto. Please read important disclosures in the Appendix. Past performance is not a guarantee of
future results.

Conclusion

AQR Color
Palette
AQR Cyan
Auxiliary Palette
Conclusion
19
AQR Advantage
• Industry thought leaders
• Widely published in top academic/professional journals
• Substantial, practical experience in all aspects of portfolio and risk management
Experience and Research
• Proprietary enhancements to traditional covered call strategies
• Unique framework for combining risk premia
Philosophy and Process
• Robust process for portfolio optimization and rebalancing
• Direct-to-market, liquidity-providing execution capabilities; low transaction costs
• Risk management integral to the investment process
Implementation and Trading
Conclusion
20
Relevant AQR Papers

Presenter Biography
21
Roni Israelov, Ph.D., Vice President
Roni oversees AQR’s short-term systematic futures trading strategy and the management of related
portfolios. Separately, he also manages AQR’s volatility trading strategies. Prior to AQR, he was a
research analyst in the quantitative equities strategies group at Lehman Brothers. He shared the
Graham & Dodd Award for the paper “International Diversification Works (Eventually)” published in
Financial Analysts Journal. Roni earned a B.S. in mechanical engineering from Georgia Institute of
Technology, an M.S. in mathematical risk management from Georgia State University, and an M.S. in
finance and a Ph.D. in financial economics from Carnegie Mellon University.

AQR Color
Palette
AQR Cyan
Auxiliary Palette
Disclosures
22
This document has been provided to you solely for information purposes and does not constitute an offer or solicitation of an offer or any advice or recommendation to purchase any securities or other
financial instruments and may not be construed as such. The factual information set forth herein has been obtained or derived from sources believed to be reliable but it is not necessarily all-inclusive and
is not guaranteed as to its accuracy and is not to be regarded as a representation or warranty, express or implied, as to the information’s accuracy or completeness, nor should the attached information
serve as the basis of any investment decision. This document is intended exclusively for the use of the person to whom it has been delivered and it is not to be reproduced or redistributed to any other
person. This document is subject to further review and revision.
There is no guarantee, express or implied, that long-term return and/or volatility targets will be achieved. Realized returns and/or volatility may come in higher or lower than expected. Past performance
is not a guarantee of future performance.
Hypothetical performance results (e.g., quantitative backtests) have many inherent limitations, some of which, but not all, are described herein. No representation is being made that any fund or account
will or is likely to achieve profits or losses similar to those shown herein. In fact, there are frequently sharp differences between hypothetical performance results and the actual results subsequently
realized by any particular trading program. One of the limitations of hypothetical performance results is that they are generally prepared with the benefit of hindsight. In addition, hypothetical trading
does not involve financial risk, and no hypothetical trading record can completely account for the impact of financial risk in actual trading. For example, the ability to withstand losses or adhere to a
particular trading program in spite of trading losses are material points which can adversely affect actual trading results. The hypothetical performance results contained herein represent the application
of the quantitative models as currently in effect on the date first written above and there can be no assurance that the models will remain the same in the future or that an application of the current models
in the future will produce similar results because the relevant market and economic conditions that prevailed during the hypothetical performance period will not necessarily recur. There are numerous
other factors related to the markets in general or to the implementation of any specific trading program which cannot be fully accounted for in the preparation of hypothetical performance results, all of
which can adversely affect actual trading results. Discounting factors may be applied to reduce suspected anomalies. This backtest’s return, for this period, may vary depending on the date it is run.
Hypothetical performance results are presented for illustrative purposes only. n addition, our transaction cost assumptions utilized in backtests , where noted, are based on AQR's historical realized
transaction costs and market data. Certain of the assumptions have been made for modeling purposes and are unlikely to be realized. No representation or warranty is made as to the reasonableness of
the assumptions made or that all assumptions used in achieving the returns have been stated or fully considered. Changes in the assumptions may have a material impact on the hypothetical returns
presented.
Gross performance results do not reflect the deduction of investment advisory fees, which would reduce an investor’s actual return. For example, assume that $1 million is invested in an account with the
Firm, and this account achieves a 10% compounded annualized return, gross of fees, for five years. At the end of five years that account would grow to $1,610,510 before the deduction of management
fees. Assuming management fees of 1.00% per year are deducted monthly from the account, the value of the account at the end of five years would be $1,532,886 and the annualized rate of return
would be 8.92%. For a 10-year period, the ending dollar values before and after fees would be $2,593,742 and $2,349,739, respectively. AQR’s asset based fees may range up to 2.85% of assets
under management, and are generally billed monthly or quarterly at the commencement of the calendar month or quarter during which AQR will perform the services to which the fees relate. Where
applicable, performance fees are generally equal to 20% of net realized and unrealized profits each year, after restoration of any losses carried forward from prior years. In addition, AQR funds incur
expenses (including start-up, legal, accounting, audit, administrative and regulatory expenses) and may have redemption or withdrawal charges up to 2% based on gross redemption or withdrawal
proceeds. Please refer to the Fund’s Private Offering Memoranda and AQR’s ADV Part 2A for more information on fees. Consultants supplied with gross results are to use this data in accordance with
SEC, CFTC, NFA or the applicable jurisdiction’s guidelines.
There is a risk of substantial loss associated with trading commodities, futures, options, derivatives and other financial instruments. Before trading, investors should carefully consider their financial
position and risk tolerance to determine if the proposed trading style is appropriate. Investors should realize that when trading futures, commodities, options, derivatives and other financial instruments
one could lose the full balance of their account. It is also possible to lose more than the initial deposit when trading derivatives or using leverage. All funds committed to such a trading strategy should be
purely risk capital.
The CBOE S&P 500 BuyWrite Index (BXM) is a benchmark index designed to track the performance of a hypothetical buy-write strategy on the S&P 500 Index. The BXM is a passive total return index
based on (1) buying an S&P 500 stock index portfolio, and (2) "writing" (or selling) the near-term S&P 500 Index (SPXSM) "covered" call option, generally on the third Friday of each month. The SPX call
written will have about one month remaining to expiration, with an exercise price just above the prevailing index level (i.e., slightly out of the money). The SPX call is held until expiration and cash settled, at
which time a new one-month, near-the-money call is written.
The S&P 500 Index is the Standard & Poor’s composite index of 500 stocks, a widely recognized, unmanaged index of common stock prices.