Embed Size (px)
Citation preview

‘Public Sector Pay Premium’
Fact or Fiction?
A report for Unison
Date: February 2013
From
Incomes Data Services

‘Public Sector Pay Premium’ – Fact or Fiction?
2
Contact Details
Name: Adam Elston Title: Senior Project Manager Telephone: 020 7422 4926 E-mail: [email protected] Address: Incomes Data Services, Finsbury Tower, 103-105
Bunhill Row, London EC1Y 8LZ This report was researched and written by Incomes Data Services (IDS) on behalf of Unison The authors of this report are: Alastair Hatchett Rupert Griffin Jon Taylor Adam Cohen

‘Public Sector Pay Premium’ – Fact or Fiction?
3
Contents
1 EXECUTIVE SUMMARY ................................................................................................................... 5
2 INTRODUCTION ............................................................................................................................... 7
3 AVERAGE WEEKLY EARNINGS ACROSS THE ECONOMY .......................................................... 9
4 EARNINGS DISTRIBUTIONS ARE DIFFERENT ............................................................................ 11
5 DIFFERENT OCCUPATIONAL GROUPS IN OFFICIAL STATISTICS ........................................... 13
6 THE DIFFERENT CHARACTERISTICS OF THE PUBLIC AND PRIVATE SECTORS................... 15 6.1 WEAKNESSES OF ASHE AND LFS FOR MEASURING PUBLIC AND PRIVATE SECTOR PAY .......................... 15 6.2 ASHE .......................................................................................................................................... 16 6.3 LFS .............................................................................................................................................. 17
7 PROBLEMS WITH ‘COMPARATORS’ ........................................................................................... 18
8 ATTEMPTS TO COMPARE PUBLIC AND PRIVATE SECTOR PAY ............................................ 20 8.1 WHAT IS REGRESSION? ....................................................................................................................... 21 8.2 SWANSEA UNIVERSITY’S ROBUSTNESS CHECK OF THE IFS PUBLIC-PRIVATE PAY ESTIMATES.............. 22 8.3 METHODOLOGICAL PROBLEMS WITH REGRESSION? ......................................................................... 23 8.4 HOW SUITABLE ARE THE VARIABLES? ............................................................................................ 24 8.5 MISSING VARIABLES ..................................................................................................................... 24 8.6 RESPONSIBILITY LEVELS NOT PROPERLY ACCOUNTED FOR .............................................................. 25 8.7 IS REGRESSION THE BEST TECHNIQUE FOR COMPARING PUBLIC AND PRIVATE SECTOR PAY? ................... 26
9 CONCLUSION ............................................................................................................................... 28
10 APPENDIX ..................................................................................................................................... 30 10.1 DIFFERENCES IN SKILL LEVELS ...................................................................................................... 30 10.2 GENDER PROFILES OF THE WORKFORCES ....................................................................................... 33 10.3 PROPORTIONS OF WOMEN EMPLOYEES IN PARTS OF THE PUBLIC SECTOR ........................................ 34 10.4 AGE AND EXPERIENCE .................................................................................................................. 35 10.5 DIFFERING LEVELS OF QUALIFICATIONS .......................................................................................... 37 10.6 ORGANISATION SIZE ..................................................................................................................... 38

‘Public Sector Pay Premium’ – Fact or Fiction?
4
Graphs Graph 1: Average weekly earnings by sector at November 2012 ............................................................... 10 Graph 2: Public sector earnings distribution ................................................................................................ 11 Graph 3: Private sector earnings distribution .............................................................................................. 11 Graph 4: Occupational composition of ASHE sample in NE, London and the UK at April 2011 ............. 14 Graph 5: Public v private salaries by IDS job level & sector ....................................................................... 27 Graph 6: Skills mix, public vs private sector 2011........................................................................................ 32 Graph 7: Mean hourly earnings by age in the public sector and private sector, April 2011, UK ............. 35 Tables
Table 1 Average Weekly Earnings November 2012 ....................................................................................... 9 Table 2 Summary of different regression findings since July 2011 ........................................................... 20 Table 3 Comparison of variables measured and findings between IFS and Swansea University analysis ........................................................................................................................................................................ 23 Table 4 Percentage of employees by skill level, April 2011, UK ................................................................ 30 Table 5 Percentage of employees by skill level, April 2002, UK ............................................................... 31 Table 6 Percentage of female employees by skill level, April 2011, UK .................................................... 33 Table 7 Proportions of female employees in the public sector ................................................................. 34 Table 8 Proportions of jobs in the public and private sectors in which the employee was in the same job for at least one year at the time of the 2011 and 2012 ASHE surveys ................................................ 36 Table 9 Percentage of employees by highest qualification, four quarter average 2011, UK ................... 37

‘Public Sector Pay Premium’ – Fact or Fiction?
5
1 Executive Summary
It is not the case that all public sector workers earn more than all private sector workers. Nor
is it the case that all public sector workers have counterparts in the private sector.
Comparisons between earnings for jobs in the public sector and earnings for jobs in the
private sector have to be done with care and precision. Like must be compared with like.
Average pay in each sector reflects the different mix of jobs and skills in each sector. There
may be a difference in the average for each sector but any difference does not necessarily
establish a ‘pay premium’.
The private and public sectors are different in a number of respects. The private sector
employs 80 per cent of all employees in the UK economy. It is not an undifferentiated whole
but contains a variety of sectors, from finance to construction to manufacturing to retail and
distribution. It has the largest number of the highest paid people in the economy but also
has the largest number of the lowest paid people.
By contrast, the public sector, with 20 per cent of all employees, has a very different
occupational, skill and gender mix to that of the private sector. It has a higher proportion of
professional employees and contains a much higher proportion of women workers - around
two-thirds of all public sector employees are women.
These substantial differences in income levels and occupational characteristics mean that
average pay in any one sector will reflect all the complexity of skill mix, qualification,
experience, responsibility, gender and seniority in each sector. This makes it even harder to
draw simple comparisons. A number of organisations including the Office for National
Statistics, Policy Exchange and the Institute for Fiscal Studies have tried to compare public
and private sector pay using ‘regression analysis’ to account for the different characteristics
of each workforce.
Although initial comparisons put the public/private sector pay difference at around 8 per
cent, as more variables have been included in the regression models, to better take account
of differences between the two sectors, estimated differences between the public and private
sector have dropped sharply. Some recent comparisons have even suggested that the
estimated differences are in favour of the public sector.

‘Public Sector Pay Premium’ – Fact or Fiction?
6
Additionally, many key factors that determine public and private sector wage differences
cannot be properly accounted for by the two main public data sets used to compare public
and private sector wages, ASHE and the LFS. These include experience and responsibility
levels. It is not at all clear that a regression analysis that adequately takes into account all
variables would show public sector wages to be above private sector wages.
Also, recent research in the US has highlighted that regression comparisons based on what
is known as a comparison of ‘log wages’ can significantly overstate wage differences between
the public and private sector (in favour of the private sector). This is because public sector
wages are much less dispersed than the private sector. All the regressions looked at in this
IDS report compare log wages.
Both the Annual Survey of Hours and Earnings (ASHE) and the Labour Force Survey (LFS)
used to compare public and private sector earnings have a number of weaknesses and
drawbacks. ASHE does not include the self-employed and the LFS is self-reported and is in
many cases answered by proxy. Additionally, neither the LFS or ASHE adequately take into
account bonus payments, pension contributions and non cash benefits such as company car
allowances and private healthcare.
Bonuses, for example, are an important factor in earnings levels but because ASHE data
presents a snapshot of earnings in April each year, it underestimates the impact of bonuses,
typically paid between December and March and which are much more prevalent in the
private sector.
IDS’s own pay benchmarking and the pay benchmarking of other organisations, which is
specifically designed to compare roles of like responsibility in similar organisations,
consistently find that rather than a public sector ‘pay premium’, wages in the public sector
are below wages in the private sector for comparable roles.
‘Public Sector Pay Premium’ – Fact or Fiction?
7
2 Introduction
The idea of a public sector ‘pay premium’ is a recent invention. Since around 2009/10, the
idea of a ‘pay premium’ has been used to claim that all public sector workers earn more than
all private sector workers. It has also been used to claim that all public sector workers earn
more than their ‘counterparts’ in the private sector.
In reality there is no pay premium for those working in the public sector. It is not the case that
all public sector workers earn more than all private sector workers. Nor is it the case that
public sector workers all have counterparts in the private sector. There is no equivalent of the
public sector operating in the private sector.
Previous research published by the ONS had shown that earnings’ growth in the period from
2000 to 2008 had run neck and neck between the public and private sectors, perhaps with a
marginal advantage to the private sector. So the claimed emergence of a huge pay premium
in favour of the public sector came as a surprise, particularly the newspaper headlines1
claiming that public sector workers were ‘more than 40 per cent better off’ than employees
in the private sector.
The fact is that comparisons between earnings in the public sector and earnings in the
private sector have to be done with care and precision. Like must be compared with like. It is
well established that average pay in each sector reflects the different mix of jobs and skills in
each sector so why would anyone compare averages and draw inappropriate conclusions?
There may be a difference in the average for each sector but any difference does not
establish a pay premium.
Critics of the public sector are often rather blind to the nature of pay and employment in the
private sector. The private sector employs 80 per cent of all employees in the UK economy. It
has the largest number of the highest paid people in the economy – in finance and business
services - and the largest number of the lowest paid people – in retail, hotels, restaurants,
care services and cleaning.
High salaries in the private sector are not just commanded by the top directors and senior
managers in banking, finance and business services. The UK has a substantial share of
higher paid people in multi-national corporations many of which are in sectors such as the
airlines, aviation manufacturing, the defence industries, the car industry, chemicals and 1 See http://www.telegraph.co.uk/news/politics/8501369/Workers-in-the-public-sector-are-more-than-40pc-better-off.html and http://www.telegraph.co.uk/finance/jobs/9697750/Public-sector-workers-earn-86-more-a-week-than-private-sector.html

‘Public Sector Pay Premium’ – Fact or Fiction?
8
pharmaceuticals and oil and energy. In addition there are large numbers of highly paid
professionals in accountancy, the law, information technology and professional engineering.
In addition to these highly paid groups, the private sector has a large number of employees
in the lower paying industries, particularly in wholesaling, retail and hotels and restaurants, a
sector with around 6.6 million workers, close to 23 per cent of all employees. Many of these
employees work at or just above the National Minimum Wage and many work part-time.
By contrast, the public sector, with 20 per cent of all employees, has a very different
occupational, skill and gender mix to that of the private sector. It has a higher proportion of
professional employees, a higher proportion of graduates as a consequence, and contains a
much higher proportion of women workers - around two-thirds of all public sector employees
are women, with much higher proportions in the NHS, teaching and in local government.
These substantial differences in income levels and occupational characteristics mean that
average pay in any one sector will reflect all the complexity of skill mix, qualification,
experience, responsibility, gender and seniority in each sector. It makes it even harder to
draw simple comparisons.
Furthermore, some of the earnings data in the Annual Survey of Hours and Earnings and the
Labour Force Survey are not robust enough to make a detailed comparison of the public and
private sectors. For instance, ASHE underestimates the impact of bonuses, other non-cash
benefits and does not include the self employed, which include many of the highest private
sector wage earners. Meanwhile, the LFS is self reported, often by proxy and includes many
low earners in the public sector, which are in reality working for private sector contractors.
‘Public Sector Pay Premium’ – Fact or Fiction?
9
3 Average Weekly Earnings across the economy
Looking at the ONS series on Average Weekly Earnings (AWE) we can examine average
earnings in the larger sections of the economy rather than simply looking for a public/private
sector split. The AWE measure gives the average earnings for all employees in a particular
sector. Each large sector has a weight in the whole based on the number of employees
working in the sector, as shown in the table below.
Some 20 per cent of employees work in the finance and business services sector - exactly the
same as the proportion of employees working in the public sector. Yet average weekly
earnings in finance and business services are £611 compared with £476 in the public sector.
So, clearly there is a pay advantage to working in banking and finance rather than in public
services but no-one refers to this as a finance sector ‘pay premium’.
Table 1 Average Weekly Earnings November 2012 Sector £pw Proportion of UK
employees % Finance & business services 611 20Manufacturing 545 9Construction 542 4Private sector 468 79Public sector (excl. nationalised banks) 476 20Public sector (incl. nationalised banks) 487 21Wholesale/retail/hotels/restaurants 309 23Source: ONS

‘Public Sector Pay Premium’ – Fact or Fiction?
10
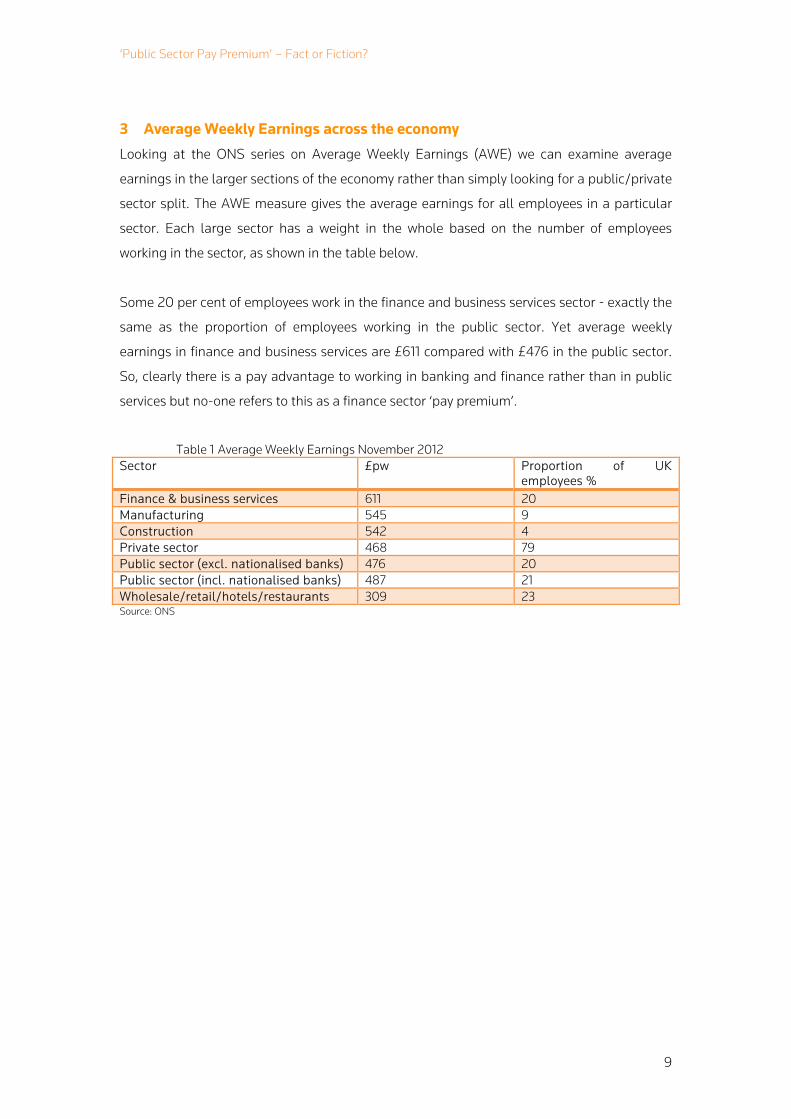
Graph 1: Average weekly earnings by sector at November 2012
What the AWE figures, above, do show is that average weekly earnings in finance and
business services, manufacturing and construction are well ahead of the public sector.
However, average weekly earnings in the private sector as a whole are lower than the public
sector (excluding the nationalised banks). The main reason for this is that the lower-paying
sector of wholesale, retail, hotels and restaurants, with average weekly earnings of £309, has
23 per cent of employment and exerts a strong downward pressure on the average for the
whole of the private sector.
A further point is that while the ONS has two definitions for the public sector, including or
excluding the nationalised banks, it does not show a series for the private sector including
the nationalised banks. Were it to do so then the private sector average would be raised
closer to the public sector average.
A third point is that the current figures are significantly distorted by the re-classification in
June 2012 of 196,000 staff in FE and sixth form colleges from the public sector to the private
sector. Because this group of employees were earning below the average in the public sector,
their exit raised the average in the public sector and in fact lowered the average in the private
sector.

‘Public Sector Pay Premium’ – Fact or Fiction?
11
4 Earnings distributions are different
We can also illustrate how the overall earnings distributions for the public and private
sectors are really rather different. Using data from ASHE we can create bar charts showing
the proportion of full-time employees at each earnings level, in £10 intervals. We can then
compare the findings.
In the private sector, the average earnings figures are heavily influenced by the very large
number of employees in lower-paying jobs at one end, particularly among women
employees, and the much higher proportion of higher-paying jobs to the right of the bar
chart. By comparison, the distribution of earnings in the public sector is more in the
intermediate range.
Graph 2: Public sector earnings distribution
Graph 3: Private sector earnings distribution
Source: ASHE 2011,ONS

‘Public Sector Pay Premium’ – Fact or Fiction?
12
At the lower end of the distribution there is a pay gap in favour of the public sector and a pay
difference in favour of the private sector at the higher end.
The pay gap in favour of the public sector is not about comparing like with like jobs. It is
largely due to the private sector having a huge number of jobs paid at or close to the
National Minimum Wage at the bottom of the wage distribution. This has been exacerbated
in the past decade with the large degree of outsourcing of lower skill jobs from the public to
the private sectors, so there are now fewer low skilled employees in the public sector.

‘Public Sector Pay Premium’ – Fact or Fiction?
13
5 Different occupational groups in official statistics
By examining the earnings figures by industrial sector we begin to get to grips with a key
issue – each major industrial segment of the economy has quite different occupational
groups within it. There is not an equivalent of the public sector operating in the private sector
which is paid less. It is a simple point, but nonetheless seems not to be understood by the
advocates of the public sector ‘pay premium’.
Advocates of the public sector ‘pay premium’ make a strange assumption that all roles in the
public sector have ‘counterparts’, as they call them, in the private sector, when in general
they do not. There are around 1.5 million employees working in the NHS and there is not an
equivalent group in the private sector, nor is there an equivalent school system with 500,000
teachers in the private sector.
The finance and business services sector employs a wide range of people from cashiers to IT
professionals to accountants and top bankers. Manufacturing companies employ
professional engineers, chemists, technicians, craft-workers and semi-skilled engineering
staff. The construction industry employs planners, architects, crane drivers and electricians.
The retail and hospitality sector employs shop staff, distribution drivers and bar staff.
By contrast, around 50 per cent of public sector employees are professional and associate
professionals in role such as doctors, nurses, midwives, teachers, social workers and police
officers. The earnings for some of these groups tend to be in the middle to higher end of the
pay distribution because they are professional roles requiring degree-level qualifications and
this tends to raise the average earnings of the sector.
Graph 4: shows that the occupational structure of the public and private sector earnings
figures contained in the Annual Survey of Hours and Earnings (ASHE) in each region varies
significantly. Different proportions of higher or lower paid occupations in any sample will
produce correspondingly high or low median or average earnings figures. In the North East,
for example, over a third of the private sector sample is in three of the lowest paid
occupations: sales and customer service; process, plant and machine operatives and
elementary, compared with just 5.6 per cent in the public sector. In contrast, the higher paid
occupations are represented more heavily in the public sector in the North East than in the
private sector. These sample differences alone are sufficient to explain why public sector
earnings overall appear to be higher in the North East than in the private sector.

‘Public Sector Pay Premium’ – Fact or Fiction?
14
Graph 4: Occupational composition of ASHE sample in NE, London and the UK at April 2011
(Source: ECR/ONS)

‘Public Sector Pay Premium’ – Fact or Fiction?
15
6 The different characteristics of the public and private sectors
Previous research by both IDS and the ONS2 has focussed on different occupational profiles
in the private and public sectors. A key point which is raised in this research is that the
composition of both the private and the public sectors has changed over recent years and
this has to be taken into account. For example, a large swathe of lower-paid and unskilled
work has been outsourced from the public to the private sector. This has been on such a
large scale that it has raised the average level of earnings in the public sector while
simultaneously lowering the average in the private sector.
A detailed analysis of the differences between the public and private sector can be found in
the appendix to this report. Some of the main findings are that:
The public sector has a much higher proportion of higher-skilled jobs, with 59 per
cent of employees in the high skill and upper middle skill categories compared to 49
per cent in the private sector
Some two-thirds of the public sector workforce are women, many of whom are
employed in professional roles. In the NHS, the largest employer in the UK, around
81 per cent of the 1.1 million non-medical roles are performed by women.
The public sector has a higher proportion of older employees. Earnings generally
tend to increase with age and experience. These older employees tend to be in long-
term careers as doctors, teachers, nurses, midwives and social workers
The public sector workforce has a higher proportion of people with a degree or an
equivalent qualification, 40 per cent in April 2011 compared with 25 per cent in the
private sector
6.1 Weaknesses of ASHE and LFS for measuring public and private sector pay
These substantial differences in income levels and occupational characteristics mean that
average pay in any one sector will reflect all the complexity of skill mix, qualification,
experience, responsibility, gender and seniority in each sector. It makes it even harder to
draw simple comparisons. Furthermore, the earnings data in the Annual Survey of Hours and
Earnings (ASHE) and the Labour Force Survey (LFS) come with their own attendant
weaknesses and drawbacks.
2 See ‘Public and private sector earnings: fact and fiction’, IDS Pay Report no. 1075, July 2011; ‘Public and private sector pay – an impossible comparison’, IDS Executive Compensation Review no. 372, February 2012; ‘Estimating differences in public and private sector pay’, ONS, 2012

‘Public Sector Pay Premium’ – Fact or Fiction?
16
6.2 ASHE
The data from ASHE is a snapshot of earnings in April each year, collected through a 1 per
cent sample of employee jobs through PAYE tax records. As a result, the more the data is
subdivided by sector, occupation, region, gender and so on, the more it changes each year
due to sampling variations and the less reliable it is.
Moreover, within ASHE, there are a number of different measures of ‘average’ pay. The ONS’
chosen headline figure is median gross weekly earnings, but series are also available for
hourly pay and annual pay, with or without incentive pay or bonuses, each of which is
published as an average as well as a median figure. The comparative figures within these can
vary surprisingly widely depending on what is being examined. Each of these series come
with their own strengths and weaknesses, and there is no ‘right’ measure that is perfect for
comparison between sectors. However, if a researcher is looking for evidence to support a
pre-determined contention, there is enough choice within ASHE that they can usually find it.
The ASHE outcomes present a snapshot of earnings in April each year. Because of this, the
data underestimates the impact of bonuses, which are typically paid between December and
March each year, and are much more prevalent in the private sector. It also does not take
account of other non-cash benefits, such as employer pension contributions, company car
allowances and private health insurance, among other things.
Because it is based on PAYE records, ASHE does not include the self-employed, an
expanding group that grew by almost 6 per cent to 4.2 million individuals in the two years to
November 2012. This includes a large number of mid-range earners in roles such as
carpentry, plumbing or taxi driving, but also many of the highest-earning individuals in
private enterprise, including lawyers, independent consultants and entrepreneurs among
other professions.
Lastly, comparing ASHE data by public and private sectors is made even more difficult
because the public sector data includes employees at financial institutions such as RBS and
Lloyds Group that were wholly or partly nationalised following the financial crisis of 2008. As
publicly-owned bodies, these employees appear in the public sector count, but are actually in
traditionally private-sector businesses, that are run in a private sector style and are expected
to return to the private sector as soon as possible.

‘Public Sector Pay Premium’ – Fact or Fiction?
17
6.3 LFS
The Labour Force Survey data is collected through a survey of UK households, covering
around 100,000 individuals in the most-recently released figures. The LFS is a useful social
indicator and provides the main source of data for employment figures, but has significant
flaws when used for in-depth comparison of earnings figures.
Firstly, the survey is conducted through questioning individuals face to face or over the
telephone rather than through data reported by employers through the payroll, and this self-
reporting element introduces a larger margin for error. Furthermore, the survey can be
completed by proxy, meaning that in around a third of cases, members of a household are
estimating the earnings of other individuals in the household. This enhances the margin for
error.
Another weakness of the LFS is that the survey participants are somewhat self-selecting. The
questionnaire is not compulsory to complete, and the response rate has declined
significantly over the last 13 years. In the three months to November 1999, the LFS covered
around 60,000 households, and more than 140,000 individuals. In the three months to
September 2012, it covered 42,655 households, and just under 100,000 individuals. The
lowest response rates are recorded in inner and outer London, where pay is typically higher
than the rest of the country3.
A third problem with the LFS is the reliability of its data on the division between public and
private sectors. The survey contains a question on the sector in which individuals work, but
the self-reported nature of the data again causes problems. The ONS looked at the reliability
of its Annual Population Survey, which is derived from the LFS, and reported that it gave a
figure for total public sector employment that was around 1 million people, or 15 per cent
higher, than its other sources:
‘Estimates of the number of people working in the public sector from the [Annual Population
Survey] are generally much higher than ONS’s official quarterly estimates of [public sector
employment]. This is partially because many people who work within public sector premises,
whilst being employed by private sector organisations, will classify themselves as working in
the public sector, for example cleaners or security guards employed by a contractor to work
at public sector premises.’4
3 Labour Force Survey Performance and Quality Monitoring Report July to September 2012, ONS, released 14 November 2012. 4 A Brief Guide to Sources of Public Sector Employment Statistics’, ONS information note, 11 January 2011.

‘Public Sector Pay Premium’ – Fact or Fiction?
18
7 Problems with ‘comparators’
One of the peculiar aspects of those who claim to have discovered a public sector ‘pay
premium’ is the belief that all public sector occupations have private sector ‘counterparts’.
Reports by the think-tank Policy Exchange5 into public and private sector earnings looked at
various job categories within ASHE and compared public sector average earnings for each
occupation with the equivalent figure for the private sector.
According to Policy Exchange, some 288 jobs in ASHE are ‘comparable categories’ of which
167 (58 per cent) show higher average earning in the public than the private sector on the
measure the think tank used. However, an ONS occupational classification is not in itself any
guarantee that jobs are being compared on a like with like basis. For example, one of the
occupations highlighted by Policy Exchange in their report is that of ‘sports and leisure
assistant’, showing a higher average earnings level in the public sector workforce. From this,
we might assume that these figures compare earnings for employees in gyms and leisure
centres and show that those run by councils pay higher wages for similar skills than those
run by private operators.
But this would be not just an oversimplification but is also demonstrates a naïve approach to
the labour market and the complexity of ONS job classifications. A closer look shows that the
ONS code for sports and leisure assistants’ covers no less than 57 separate job titles. These
include gym assistant, pool attendant and lifeguard, but also job titles as diverse as
professional gambler, croupier, golf caddie, master of ceremonies, wardrobe mistress, and a
range of jobs in museums, such as educational assistants and guides.
This demonstrates that the notion of ‘comparable jobs’ is harder to measure than some
commentators might think. The presence of museum workers in this category demonstrates
a wider point – that even within the same occupational category, workers in differing sectors
may be doing entirely different jobs requiring different skill sets.
Another occupational category highlighted by Policy Exchange is that of ‘primary and
nursery education teaching professionals’. According to their chosen measure, median
annual pay for this employee group was £33,140 in the public sector and only £21,159 in the
private sector. But this grouping of primary school teachers, who are predominantly
employed in the public sector, with nursery school teachers, who are predominantly
employed in the private sector, makes any attempt to compare and contrast public and
5 Policy Exchange- ‘Public and private sector terms, conditions and the issue of fairness’, Holmes & Oakley, May 2011& ‘Further analysis on the public sector premium’, Oakley, November 2011

‘Public Sector Pay Premium’ – Fact or Fiction?
19
private sector earnings practically meaningless. In no way are we comparing like with like.
They are not ‘counterparts’ as they have different skills and qualifications.
Even if nursery and primary school workers were perfectly balanced between the public and
private sectors, a look at the job titles included in this occupational category reveals that it
lumps together all teaching professionals including head teachers, regular teachers and
dance lecturers, and even monks and nuns attached to religious primary schools.
Examining the average earnings of a group including nursery teachers, primary school heads
and affiliated monks and nuns may well provide a useful snapshot of aggregate earnings in
pre-secondary education. It is emphatically not useful, however, for comparing earnings
between the public and the private sectors, since no attempt is made to give weight to the
numbers of employees in different jobs.
Similar difficulties arise with teaching at secondary levels and above. Analysis of earnings in
the private sector would have to separate out those teachers in the leading ‘public’ schools,
those with accommodation in boarding schools and the earnings of those in so-called
language schools above shops on Oxford Street in central London.
ASHE occupational categories may provide a means of benchmarking across groups of
employees, but cannot be used to compare sectors in which the categories have different
compositions, different job titles, different skill sets and different responsibilities.

‘Public Sector Pay Premium’ – Fact or Fiction?
20
8 Attempts to compare public and private sector pay
Given the differing characteristics of the public and private sectors, various organisations
have undertaken what is called a regression analysis in order to determine the ‘true’ public-
private sector pay difference. Organisations undertaking regression analysis of public and
private sector pay include: the ONS, the Institute for Fiscal Studies, Policy Exchange, as well
as researchers at Swansea University, and recently the economist David Blanchflower. A
summary of their findings is given in the table below:
Table 2 Summary of different regression findings since July 2011 Regression Date
published Dataset Difference
Original ONS regression model July 2011 ASHE 9.1*Original ONS regression model March 2012 ASHE 9.0**Original ONS regression model adjusted for bonuses Nov 2012 ASHE 7.2Updated ONS regression model Nov 2012 ASHE 7.3Updated ONS regression model including organisation size Nov 2012 ASHE 2.2Policy Exchange November
2011 LFS 8.9
Institute for Fiscal Studies 2012 February 2012
LFS 8.3
Institute for Fiscal Studies 2013 February 2013
LFS 5.2
Swansea University female public/private difference (Actual hours)
June 2012 LFS 6.0
Swansea University female public/private difference (Usual hours)
June 2012 LFS 5.3
Swansea University male public/private difference (Actual hours)
June 2012 LFS -2.0
Swansea University male public/private difference (Usual hours)
June 2012 LFS -4.1
David Blanchflower Dec 2012 LFS -2.0*7.8 per cent including LFS adjustment for qualifications **8.2 per cent including LFS adjustment for qualifications Source: IDS
It is significant to notice that different regression analyses give different results. Although the
initial regression analysis by the ONS6, IFS7 and Policy Exchange8 gave similar findings,
putting the public/private difference at between 7.8 per cent and 9.1 per cent, since then a
number of other regression analyses have found that the supposed differences between the
public and private sector are much lower.
This includes the ONS themselves who subsequently adjusted their analysis to better take
into account the impact of bonuses on pay levels. When the ONS supplemented salary data
from ASHE, with bonus data from the Average Weekly Earnings series (AWE), the ONS found
6 ‘Estimating differences in public and private sector pay’, ONS, 2011 7 Institute for Fiscal Studies- ‘IFS Green Budget’, Chapter 5: Public Sector Pensions and Pay, Emerson & Jin, February 2012 8 ibid

‘Public Sector Pay Premium’ – Fact or Fiction?
21
that the public/private difference dropped from 9.0 per cent to 7.2 per cent. However, more
significantly, when the ONS adjusted for organisation size, it was found that the difference
between the sectors dropped to just 2.2 per cent.
These findings are supported by other estimates. When academics at Swansea University
undertook a regression they found that for men, looking at usual hours worked, wages in the
private sector were actually 4.1 per cent higher than in the public sector. A recent regression
by the former monetary policy committee economist David Blanchflower found that private
sector workers earned 2 per cent more than public sector workers.
Such research suggests that actual differences between the sectors might be much lower
than the original 7-9 per cent range estimated by the ONS, IFS and Policy Exchange and
widely quoted by the Treasury. In fact, subsequent regressions suggest that private sector
wages might even be higher than public sector wages.
8.1 What is regression?
Regression is a statistical technique that takes account of the impact of various variables on
something. For instance, if we want to measure differences in pay between the public and
private sector, these differences might be because one sector is simply paid more than the
other, but it might also be because of different age structure in one sector or the other;
higher qualification levels in one sector or the other; or a different gender balance.
What a regression analysis tries to do is strip away the differences caused by the additional
factors and find out precisely what the difference in wages is purely by virtue of someone
being in the public sector rather than the private sector. I.e., it tries to find out what someone
of exactly the same age, with exactly the same skill levels, with exactly the same
qualifications and so forth would be paid if they worked in one sector rather than the other.
And yet despite trying to control for these factors, researchers have produced different
findings. The reason for this is that the outcome of a regression analysis will depend on how
you do it, what variables are controlled for and how suitable the data is for undertaking a
regression analysis.

‘Public Sector Pay Premium’ – Fact or Fiction?
22
8.2 Swansea University’s robustness check of the IFS public-private pay estimates
In June of 2012, academics at Swansea University published a robustness check of the IFS’s
analysis of public and private sector wage differences. Although the IFS had controlled for
age, education, qualifications and region, they had not controlled for a number of other
factors which research had shown to affect earnings. These included job tenure, organisation
size, occupation, the impact of working part-time and managerial responsibility.
What the research from Swansea University found, not unsurprisingly, was that when
additional variables known to impact pay were controlled for, the findings changed. For
example, rather than the average male public sector wage being 8.9 per cent more than the
private sector as the IFS’s variables would suggest, using Swansea’s full specification of
variables suggests that for men, the average wage in the private sector is 2.0 per cent higher
than the public sector.
Fuller details of Swansea’s findings are found in the table below, and show how the findings
are affected using different methodologies, and by specifying different variables. This
includes an estimate based on usual hours worked rather than actual hours worked. This is
because research has found that actual hours worked can over-inflate the hourly earnings
figure – in part because actual hours do not properly take into account holiday pay. Using
usual hours worked, Swansea found that the pay difference changed from 7.1 per cent more
for men in the public sector to 4.1 per cent more for men in the private sector. Not included in
the table is the effect of union membership, which Swansea found lowered public sector
wages in comparison to the private sector.

‘Public Sector Pay Premium’ – Fact or Fiction?
23
Table 3 Comparison of variables measured and findings between IFS and Swansea University analysis IFS specification IFS plus qualification
& regions Swansea 'full' specification'*
Variables measured Age, age squared, age left full time education
Age, age squared, age left full time education, highest qualification, region
Age, age squared, age left full time education, highest qualification, region, all qualifications, job tenure, plant size, occupational controls, part time/full time, managerial responsibility, ethnicity*
Difference: Actual hours, women (%)
16.0 11.2 6.0
Difference: Actual hours, men (%)
9.1 5.3 -2.0
Difference: Usual hours, women (%)
15.7 10.5 5.3
Difference: Usual hours, men (%)
7.4 3.1 -4.1
*Union membership not included as this reduces the sample size, but including this variable also reduces any pay differences further (Source: Swansea University/IDS)
8.3 Methodological problems with regression?
Recent research from the United States Congressional Budget Office9 on pay differences
between the public and private sector has found that most regressions can significantly
overstate the differences between public and private sector workers due to the methodology
that they use. Because the wages of public sector employees are substantially less dispersed
than similar workers in the private sector the research suggests that it is not valid to use a
statistical method to compare what is known as ‘log wages’ (the logarithm of public and
private sector wages).
Using an alternative regression methodology to log linear regression, the CBO found that
federal wages were 2 per cent above private sector wages compared to a typical 14 to 19 with
log linear regressions. The CBO attributes such variations largely to this different approach
to regression. This has an important bearing on the reliability of estimates of public private
differences in the UK, as all the estimates that have been undertaken are based on a
comparison of log linear wages.
Additionally, Swansea University highlights that other differences between the two sectors,
particularly around choice of which sector to work in may similarly skew any findings. As the
research states, ‘If decisions around whether to work or not and whether to seek work in the
public or private sector are not random, OLS estimates may be biased and may give a
misleading impression of the correct regional public/private sector wage differential.’
9 See ‘Comparing Wages in the Federal Government and the Private Sector’ The Congressional Budget Office, January 2012

‘Public Sector Pay Premium’ – Fact or Fiction?
24
8.4 How suitable are the variables?
The findings from Swansea pose an important problem for calculating public and private
sector wage levels. It shows that the results of comparisons depend on both the variables
being controlled for, and also technical choices such as which measure of hours is to be used.
But how suitable are the available variables themselves for use as part of a regression
analysis? For example, experience is a variable which is commonly controlled for as it
impacts on wages. However, the Labour Force Survey does not directly measure experience.
Instead researchers take the age at which someone left full-time education, and combine
this with a person’s age. They do this to determine a ‘proxy variable’ which stands in for a
measure of how much experience a person has.
But such a proxy has a number of drawbacks. Particularly, it does not take into account time
spent outside of the labour market. This could be due to periods of unemployment or long-
term illness, or it could be for child-rearing or other reasons. Given that many women leave
the labour market for extended periods to raise children and that there are a higher
proportion of women in the public sector than men, it raises the question of whether such a
proxy for experience accurately represents experience, particular across genders.
And yet time spent within the labour market, is only one measure of experience. Equally
important is the experience a person has in their current profession and current role. While
both ASHE and the Labour Force Survey are able to measure job tenure, they are unable to
measure the length of time someone has been in their current profession – how long they
have been a teacher or a lawyer or an airline pilot. This is important as it measures the
impact on wages of an individual who has changed career.
8.5 Missing variables
Examples such as the issues over how to accurately measure experience, highlight a key
problem with using regression. As stated before, the findings from any regression model
depend on the factors controlled for in the model. If a factor that impacts on pay differentials
in the public and private sector is not included in the analysis, then the findings from any
analysis will not truly represent wages in the public and private sector.
This fact is echoed by the ONS, who state that10, ‘there may be other factors not
collected...that if controlled for would affect the pay difference between the public sector
and private sector.’ The ONS go on to say that due to the difficulty of calculating the
public/private sector pay gap, their estimate, ‘is exactly that – an estimate of the pay gap
10 See ‘Estimating differences in public and private sector pay’, ONS, 2012

‘Public Sector Pay Premium’ – Fact or Fiction?
25
rather than an authoritative measure of the difference in the average earnings of the public
sector and the private sector.’
Variables which are likely to impact on pay, which have been controlled for in analyses in
other countries, but have not been factored into to any of the IFS, Policy Exchange and ONS
analyses include:
Ethnicity: Different ethnic groups are likely to face different barriers to entry into the
public and private sector workforce
Citizenship: Similarly non-UK citizens will be able to access the public and private
sector labour market in different ways (probably across genders too).
Size of urban area/travel to work area: In the private sector, rural areas are less likely
to attract large employers, which are known to pay more, as there will be an overall
shortage of labour. Likewise, employers requiring a pool of highly skilled workers e.g.
IT/Technology firms are less likely to locate away from major population centres. In
contrast, many public sector roles will be spread more evenly across the population.
8.6 Responsibility levels not properly accounted for
One factor more than any other though is missing from most attempts to compare public
sector wages - the responsibility level of a role. Workers with more responsibility levels are
likely to have higher wages than workers with lower levels of responsibility. In fact
responsibility is such a key variable, that for benchmarking organisations such as IDS, along
with skill level, it is one of the major determinants of appropriate wage levels for a given job.
Given that there is a higher proportion of public sector workers in professional occupations,
and that in the private sector there are higher proportions of elementary occupations and
manual operative occupations, any failure to properly factor in responsibility level will have
an important impact on the results of any comparison between the two sectors.
But the two main public datasets (ASHE and LFS) have only a very limited ability to factor in
responsibility level because it is not something that is extensively surveyed by them. The LFS
asks whether a respondent is a manager, supervisor or neither, and also whether the
respondent has the authority to hire or dismiss employees, while ASHE asks a simple yes/no
question: “did the employee have direct supervisory or managerial control of any other
employee(s)?” This however does not give an indication of whether someone has
responsibility for managing lots of people or just a few people, and it does not ask about the
seniority of those managed, both of which are key indicators of level of managerial
responsibility.

‘Public Sector Pay Premium’ – Fact or Fiction?
26
Knowing the exact number of employees managed or how senior they are, are themselves
only limited parts of an employee’s overall responsibility levels. Someone might have
responsibility for the lives of other people, as in the case of doctors, nurses and paramedics;
others might have responsibility for giving high level or highly important advice as in the case
of lawyers, business advisors or senior civil servants. Yet none of these measures of
responsibility are picked up by ASHE or the LFS.
8.7 Is regression the best technique for comparing public and private sector pay?
As has been outlined, there a number of methodological shortcomings with comparing
public and private sector pay through regression, and a close analysis suggests that
regression techniques can provide misleading figures into pay differences between the public
and private sectors.
In part, these drawbacks are because the regression techniques lump together, without
distinction, occupations as diverse as teachers, private sector managers, cleaners, nurses,
bankers, aerospace engineers, train drivers and shop assistants. But it is also because the
data that regression is based on is unable to compare what is most fundamental - roles with
a similar span or responsibility, requiring a similar level of skills in organisations of a
comparable size.
Such an analysis is what HR professionals do when they benchmark roles between different
organisations. And such benchmarking is undertaken following a complex analysis of the job
description of a role and what a particular role involves on a day to day basis. It is also why
major private sector organisations make extensive use of benchmarking, rather than looking
solely at the wage levels of occupations in publicly available datasets.
As can be seen in the graph below, using data from the IDSPay.co.uk database and based on
our own job evaluation methodology, an alternative picture of public and private sector pay
differences emerges. This shows that while public sector pay at the lower responsibility levels
is higher than in private sector services (but not manufacturing), it falls further and further
behind at higher responsibility levels. The problem with the current regression approaches is
that they compare broad occupational sectors that take no account of the more complex
factors shaping the distribution of earnings within an occupation.

‘Public Sector Pay Premium’ – Fact or Fiction?
27
Graph 5: Public v private salaries by IDS job level & sector
Source: IDSPay.co.uk
0
20,000
40,000
60,000
80,000
100,000
120,000
140,000
Level 1 Level 2 Level 3 Level 4 Level 5 Level 6 Level 7 Level 8 Level 9 Level 10
Public v private salaries by IDS job level & sector
Public sector Manufacturing Private sector services

‘Public Sector Pay Premium’ – Fact or Fiction?
28
9 Conclusion
As this report has shown it is not the case that all public sector workers earn more than all
private sector workers. Nor is it the case that public sector workers all have counterparts in
the private sector. There is no equivalent of the public sector operating in the private sector.
The fact is that comparisons between earnings in the public sector and earnings in the
private sector have to be done with care and precision. Like must be compared with like. The
different characteristics in each sector need to be taken into account before drawing any
conclusions. And likewise, it needs to be recognised that huge sectors of the private sector,
including finance and business services, manufacturing and construction all have higher
average earnings than the public sector. In reality, it is the large amount of low paid private
sector workers in wholesale, retail, hospitality and catering/restaurants that bring the
aggregate wages of the private sector below the public sector.
But where comparisons between the public and private sector have been made, they have
not been made with care and precision. When estimating a public/private sector wage
differential for 2011/12 of 5.2 per cent, the Institute of Fiscal Studies stated in its recent
Green Budget11, that:
“It is possible that these numbers are capturing unobserved differences between
public and private sector workers, and therefore do not reflect a true pay ‘premium’
per se.”
And yet such calculations have informed the evidence in the Treasury’s submissions to the
public sector pay review bodies, and so it is vital that the estimates accurately reflect levels of
public and private sector pay.
Meanwhile, the alternative approach to public and private sector comparisons, the approach
which genuinely does compare like with like – pay benchmarking – is rarely mentioned
within the context of the debate on public and private sector pay. It does not generate
newspaper headlines, and yet it is the most reliable way of comparing pay levels between
organisations of similar size and roles of similar responsibility. And consistently, IDS’s own
extensive benchmarking data and the data from other major benchmarking organisations
find that rather than a public sector pay premium, wages in the public sector are below
wages in the private sector for comparable roles.
11 See: Institute for Fiscal Studies- ‘IFS Green Budget 2013’, Chapter 6: Public spending and Pay, Rowena Crawford, Jonathan Cribb and Luke Sibieta, February 2013.

‘Public Sector Pay Premium’ – Fact or Fiction?
29
As our analysis has shown, most public/private sector pay comparisons are not factoring in,
or are unable to factor in, many of the most important variables known to affect wage
differences between the public and the private sector. Additionally, many of the most recent
comparisons, factoring in some of these additional variables, are showing a sharp drop in the
differences between public and private sector pay. Some even suggest that public sector
wages are lower than private sector ones. This shows that at the very least, until there is a
more thorough understanding of the methodological drawbacks of the comparisons, the
findings need to be used with much more care and caution than they are being used at the
moment.

‘Public Sector Pay Premium’ – Fact or Fiction?
30
10 Appendix
10.1 Differences in skill levels
The ONS has carried out research12 into the different levels of skill within the public and
private sectors which produce some striking results. It has also compared the skill levels in
2002 and compared these with 2011 and the results show some remarkable changes over a
quite short period of time.
The ONS analysis classifies jobs from low skill to high skill for each sector. It shows a much
larger percentage of workers in the two highest skill groups in the public sector compared
with the private sector. Overall, some 59 per cent of public sector employees are classified as
either high skill or upper middle skill compared with 59 per cent of private sector employees.
As the public sector is made up of a more skilled workforce than the private sector, on
average public sector pay would be expected to show a difference, though skill level is not
the only factor involved.
Table 4 Percentage of employees by skill level, April 2011, UK Skill level Public sector
% in sector Private sector % in sector
High skill 31 26Upper middle 29 23Lower middle 32 36Low skill 8 15Source: ASHE, ONS
If we compare the skills picture in 2011 with that of 2002 we see some very substantial
changes, particularly in the low skilled category. Over the decade we saw large-scale
outsourcing of lower paid jobs from the public sector to the private sector and the scale of
this is revealed if we compare the ONS data for 2002 and 2011.
12 See ONS ‘Estimating Differences in Public and Private Sector Pay at the National and Regional Level’, November 2012

‘Public Sector Pay Premium’ – Fact or Fiction?
31
Table 5 Percentage of employees by skill level, April 2002, UK Skill level Public sector
% in sector Private sector % in sector
High skill 23 23Upper middle 30 24Lower middle 35 40Low skill 12 13Source: ASHE, ONS
The ONS data shows that in 2002, the earliest year available with skills data on the same
basis as 2011, around 12 per cent of public sector employees were employed in low skill
occupations compared with around 13 per cent in the private sector. A comparison with 2011
shows that the proportion of low skill jobs in the public sector declined to 8 per cent while it
grew to 15 per cent in the private sector.
Meanwhile, between 2002 and 2011, the percentage of employees with high skills in the
public sector grew from 23 per cent to 31 per cent. By contrast, the percentage of employees
with high skills in the private sector grew much less, from 23 per cent to 26 per cent.
Over the time period average pay in the public sector will have risen because a smaller
proportion of workers are now employed in low-skilled jobs. By contrast, average pay in the
private sector is reduced as the low-skill jobs that were previously carried out in the public
sector are incorporated into the private sector.

‘Public Sector Pay Premium’ – Fact or Fiction?
32
Graph 6: Skills mix, public vs private sector 2011
Source: ONS

‘Public Sector Pay Premium’ – Fact or Fiction?
33
10.2 Gender profiles of the workforces
One of the most profound differences between the public and the private sector workforces is
that the public sector is dominated by women workers, with around 66 per cent of employees
being female, and an even higher proportion in the National Health Service. By contrast, the
ratio is almost reversed in the private sector, where 41 per cent of employees are female.
It is well known that women employees in the public sector earn considerably more, on
average, than female employees in the private sector. But this has nothing to do with any
notion of a public sector ‘pay premium’. It is due to the different jobs that are typically carried
out by women in the public and private sectors.
In the private sector, the female-dominated roles tend to be lower-skilled and significantly
lower paid, including the five ‘c’s of catering, cleaning, cashiering, clerical work and caring. In
the public sector, by contrast, female-dominated roles include caring and clerical work but
there is also a high proportion of women employed in professional, higher paid occupations,
such as teaching and nursing. This difference in skills is shown in the following table.
Table 6 Percentage of female employees by skill level, April 2011, UK Skill level Public sector
% in sector Private sector % in sector
High skill 28 19Upper middle 26 15Lower middle 38 51Low skill 8 15Source: ASHE, ONS

‘Public Sector Pay Premium’ – Fact or Fiction?
34
10.3 Proportions of women employees in parts of the public sector
While the proportion of women employees in the public sector is around 66 per cent, it varies
across the sector with the highest proportions being found in the NHS, teaching and in local
government. The table below shows these proportions. Most of the available data for this
table is based on 2010 and 2011 before substantial cuts to the workforce, but the proportions
will not have altered greatly.
Table 7 Proportions of female employees in the public sector Employee group Proportion of female
employees Total workforce Reference period
Police offices in England and Wales
26.2 139,586 FTS 12 months to 31 March 2011
Police staff 68.6 94,146FTE* 12 months to 31 March 2011
Nursery and primary school teachers**
85.9 196,300 FTE November 2010
Secondary school teachers
60.2 195,600 FTE November 2010
Teaching assistants** 93.7 213,900 FTE November 2010 Civil Service 53.3 434,980 Quarter 1, 2012 Local government (E&W)
75.9 2,012,200 Quarter 4, 2011
NHS – Medical and Dental Staff
42.7 99,394 September 2011
NHS – All non-medical staff
80.9 1,083,637 September 2011
*Includes PCSOs
**Teachers & teaching assistants in local authority maintained and academy schools in England only
Source: IDS
‘Public Sector Pay Premium’ – Fact or Fiction?
35
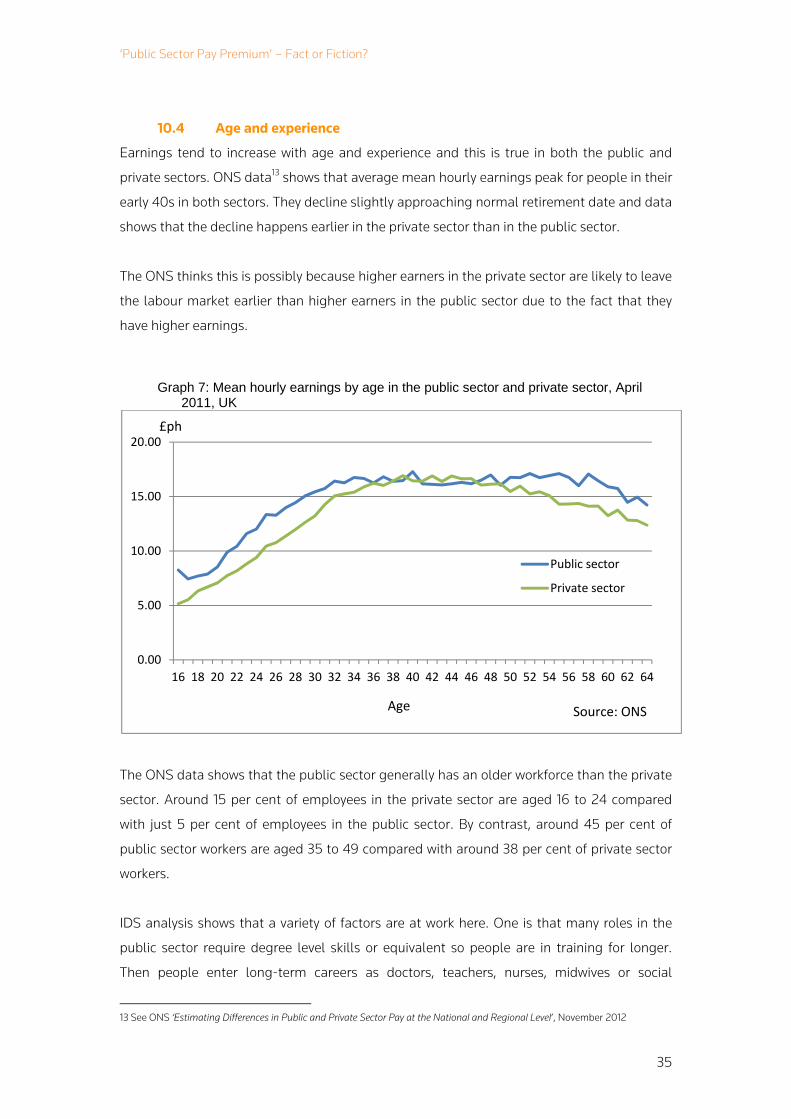
10.4 Age and experience
Earnings tend to increase with age and experience and this is true in both the public and
private sectors. ONS data13 shows that average mean hourly earnings peak for people in their
early 40s in both sectors. They decline slightly approaching normal retirement date and data
shows that the decline happens earlier in the private sector than in the public sector.
The ONS thinks this is possibly because higher earners in the private sector are likely to leave
the labour market earlier than higher earners in the public sector due to the fact that they
have higher earnings.
Graph 7: Mean hourly earnings by age in the public sector and private sector, April 2011, UK
The ONS data shows that the public sector generally has an older workforce than the private
sector. Around 15 per cent of employees in the private sector are aged 16 to 24 compared
with just 5 per cent of employees in the public sector. By contrast, around 45 per cent of
public sector workers are aged 35 to 49 compared with around 38 per cent of private sector
workers.
IDS analysis shows that a variety of factors are at work here. One is that many roles in the
public sector require degree level skills or equivalent so people are in training for longer.
Then people enter long-term careers as doctors, teachers, nurses, midwives or social
13 See ONS ‘Estimating Differences in Public and Private Sector Pay at the National and Regional Level’, November 2012
0.00
5.00
10.00
15.00
20.00
16 18 20 22 24 26 28 30 32 34 36 38 40 42 44 46 48 50 52 54 56 58 60 62 64
Public sector
Private sector
£ph
Age Source: ONS

‘Public Sector Pay Premium’ – Fact or Fiction?
36
workers. As many of these people are professional women workers their longer career
trajectories are important is terms of household incomes.
An insight into different levels of staff turnover in the public and private sectors was recently
provided by the ONS14 in its analysis of earnings growth for those who had not changed jobs
between April 2011 and April 2012. For this group of workers, earnings grew by 3.8 per cent
in the private sector and by 2.8 per cent in the public sector, much higher rates of growth
than for all workers which was close to 1.5 per cent in each sector.
The table below shows the proportions of full-time and part-time staff in the public and
private sector who stayed in the same job or moved to a different job in the ASHE surveys for
2011 and 2012. It shows that 80 to 90 per cent of employees remain in post. It also shows a
tendency for public sector employees to stay in post in greater proportions, consistent with
professional workers having longer careers. There are a higher proportion of part-time
workers in the private sector changing jobs, many of whom will be in the lower paying
sectors.
Table 8 Proportions of jobs in the public and private sectors in which the employee was in the same job for at least one year at the time of the 2011 and 2012 ASHE surveys
2011 2012 % same job % different
job % same job % different
job Public sector Full-time 87.8 12.2 89.7 10.3 Part-time 84.5 15.5 86.4 13.6Private sector Full-time 82.9 17.1 82.4 17.6
Part-time 74.0 26.0 73.4 26.6Source: Ashe, ONS
14 Presentation by ONS, November 2012

‘Public Sector Pay Premium’ – Fact or Fiction?
37
10.5 Differing levels of qualifications
Employees with higher levels of qualifications tend to earn more than employees with lower
levels of qualifications. Using Labour Force Survey data, and taking an average over the four
quarters of 2011, the ONS estimates15 that 40 per cent of employees in the public sector had
a degree or an equivalent qualification, compared with 25 per cent in the private sector. A
higher qualified workforce would, on average, receive higher pay than a less qualified
workforce. It would therefore be expected that, on average, the higher level of qualifications
in the public sector would lead to higher average earnings in the public sector compared to
the private sector.
The ONS previously found16, when comparing employees who have a degree or an equivalent
qualification, that those in the public sector earned around 5.7 per cent less than those in the
private sector on average in 2010.
Table 9 Percentage of employees by highest qualification, four quarter average 2011, UK Qualification Public sector Private sector Degree or equivalent 40 25Higher education 14 8GCE A level of equivalent 19 25GCSE grades A-C or equivalent 18 24Other qualifications 6 11No qualifications 3 7Source ONS, LFS
15 ‘Estimating differences in public and private sector pay’, ONS, 2012 16 ‘Estimating differences in public and private sector pay’, ONS, July 2011

‘Public Sector Pay Premium’ – Fact or Fiction?
38
10.6 Organisation size
As the ONS stated in their recent report17 exploring public and private sector earnings
differences, there are important differences between the size of organisations in the public
and private sectors. The ONS explains that there is a great deal of academic work which
shows that large organisations tend to pay more than small organisations. This is attributed
to several factors such as working conditions, responsibility and unionisation. IDS would add
that larger organisations in the private sector tend to be leaders in their industrial sector and
are possibly multi-national companies in sectors such as oil production, petrochemicals,
pharmaceuticals, banking, insurance, precision engineering, car manufacture, aviation and
engineering construction.
The ONS explains that organisation size is important as public sector employees tend to be
concentrated in large organisations with at least 500 employees, whereas for the private
sector some 49 per cent of employees are in organisations of 500 employees or more but 51
per cent are in organisations with fewer than 500 employees.
The ONS says that across the economy, employees in large organisations with 500 or more
employees earned, on average, 24.9 per cent more than those working in organisations with
fewer than 500 employees in the UK in 2011. A further finding in the latest ONS analysis is
that the pay difference is quite different at the lower end of the pay distribution compared to
the higher end.
17 See ONS ‘Estimating Differences in Public and Private Sector Pay at the National and Regional Level’, November 2012