Embed Size (px)
Citation preview

www.intertek.com1
April 2012Intertek Presentation

www.intertek.com2
This presentation contains certain forward-looking statements with respect to the financial condition, results, operations and business of Intertek Group plc. These statements and forecasts involve risk and uncertainty because they relate to events and depend upon circumstances that will occur in the future. There are a number of factors that could cause actual results or developments to differ materially from those expressed or implied by these forward-looking statements and forecasts. Nothing in this presentation should be construed as a profit forecast.
April 2012
Cautionary statement regarding forward-looking statements

www.intertek.com3
The Global Quality Partner
Origins back to 1885
Floated 2002, entered FTSE 100 in 2009
Market Capitalisation £4bn
2011 Sales £1.7bn, Operating Profit £281m
9% Average FY Organic Revenue growth 2002-11

www.intertek.com4
Investment Proposition
Strong structural growth drivers
High barriers to entry
Low customer penetration, high market fragmentation
Balanced portfolio (industries, geographies & customers)
Emerging market exposure
Low capital intensity, flexible cost structure
Highly cash generative
www.intertek.com5
0
1,000
2,000
2002 2003 2004 2005 2006 2007 2008 2009 2010 2011 2012 2013 2014 2015 2016 2017 2018 2019 2020 2021 2022
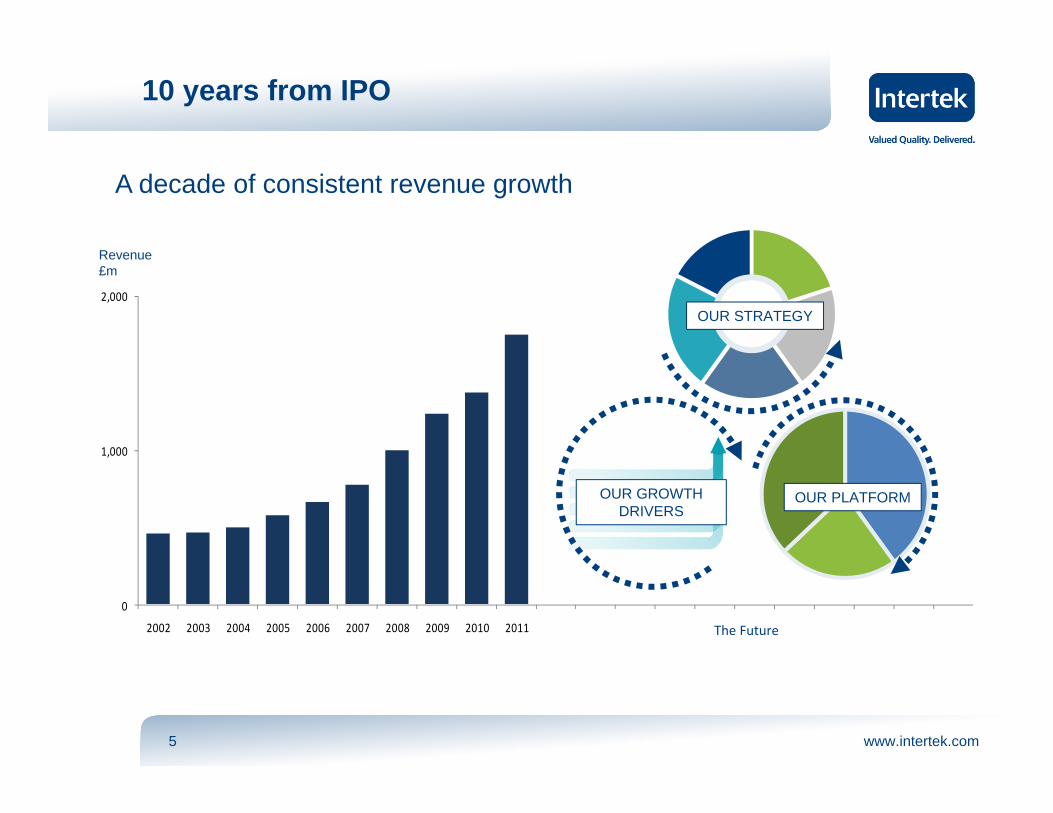
10 years from IPO
A decade of consistent revenue growth
Revenue£m
OUR GROWTH DRIVERS
OUR PLATFORM
OUR STRATEGY
The Future

www.intertek.com6 6
We areElectrical engineersChemistsMechanical engineersMedical doctorsConsultantsBiologistsInspectorsGeologistsAdvisors to GovernmentAuditors
Our people

www.intertek.com7
Supporting our customers in their global tradeOur organisation The industries we operate in What we doOur organisation What we doThe industries we operate in
Our organisation Industries we operate inOur organisation Industries we operate in Services
Testing
Inspection
Certification
Auditing
Outsourcing
Advisory
Training
Quality Assurance
Commodities
Industry & Assurance
Consumer Goods
Commercial & Electrical
Chemical & Pharma
Aerospace & AutomotiveBuilding ProductsChemicalConsumer Goods & RetailersElectrical & ElectronicEnergyFood & AgricultureGovernment & InstitutionsIndustrialIT & TelecomMedical & PharmaceuticalPetroleumTextile, Apparel & FootwearToys, Games & Hardlines
30,000 employees
Inte
rtek
as O
neQuality Services

www.intertek.com8
What we do for our customers
SupportTheir products and processes in their global trade in all
quality related aspects
Protect
Reduce financial, operational,
reputational and environmental risks
Speed to MarketCut lead times
and costs without compromising qualitysafety or environment

www.intertek.com9
R&D Performance Performance Issues/Returns/
Recalls
Certification -Compliance(Tech, Env, Social)
Production Distribution
End userSupply/Value Chain
Our Strategy: Target the entire supply chain
Training
Advisory
Certification
Auditing
InspectionOutsourcing
QualityAssurance
Testing
CSR

www.intertek.com10
What is Quality?
Our Strategy: Target all Quality aspects

www.intertek.com11
45%45%10%Required 3rd Party
Obligation – In house/Outsourced
Voluntary
Regional statutory>$100bn
TIC Industry Total > $200bn
Global supply chain
>$100bn
TIC Industry Composition

www.intertek.com12
For the twelve months to 31 December 2011
Revenue £1,749m + 27% at actual+ 8.3% at constant organic(2)
Operating profit(1) £281.1m + 24% at actual+ 9.6% at constant organic(2)
Operating profit margin(1) 16.1% – 50bps at actual+ 20bps at constant organic(2)
Profit before tax(1) £260.1m + 23%
Diluted EPS(1) 107.2p + 20%
Operating cash flow(1) £314.8m + 14%
Financial Highlights
(1) Before separately disclosed items; see slide 6 and appendix slide 35 for further information
(2) Growth excluding acquisitions at constant exchange rates

www.intertek.com13
Commodities 30% 24%
Industry & Assurance 27% 18%
Consumer Goods 18% 38%
Commercial & Electrical 17% 16%
Chemicals & Pharma 8% 4%
Divisional Mix
% of Group Revenue
% of Group Profit
Commodities
Industry & Assurance
Consumer Goods
Commercial & Electrical
Chemicals & Pharma

www.intertek.com14
Enduring Growth Drivers
1 Global Trade & Emerging Market Trade Growth
2 Market Drivers in our Industries
3 Network & Service Expansion
4 Outsourcing & Consulting Services
5 Industry Consolidation

www.intertek.com15
What
MarketDrivers
RegulationQuality, Safety and
Environmental standards
Supply Chain Changes
Shifting cycles, sourcing and complexity
New TechnologiesInnovation and product variety
Energy Growth & Diversity
Capex and Opex
End-User Quality Expectations & Diversity
Developed and emerging economies
Market Drivers in our Industries

www.intertek.com16
Global Trade: The Future?
Forecast Shipped Container Volumes (million TEUs)
Rate of growth in TEU Volume from 2010-30
ASIAUSA
EUROPE
Asia-USA
27
26
Asia-Europe
130
Intra-Asia
Asia -Australasia
10
Europe-Asia
25
USA-Asia
32
3
3
Intra-North America
18
Intra-Europe
USA-Europe
6
7
6
7
310% - 410%
>410%
200% - 310%
Based on Goldman Sachs Equity Research
310% - 410%
>410%
LATAM
17
6
Intra-LATAM
Asia - LATAM
8
USA-LATAM 3

www.intertek.com17
End-User Quality Demand in 2020
Source: Bain & Company
$10trillion extra
consumer spend from growth markets
1.3billion new consumers
$1trillion on
innovations for thenext big thing$5
trillion by ‘soft’ innovators onproduct variety
www.intertek.com18
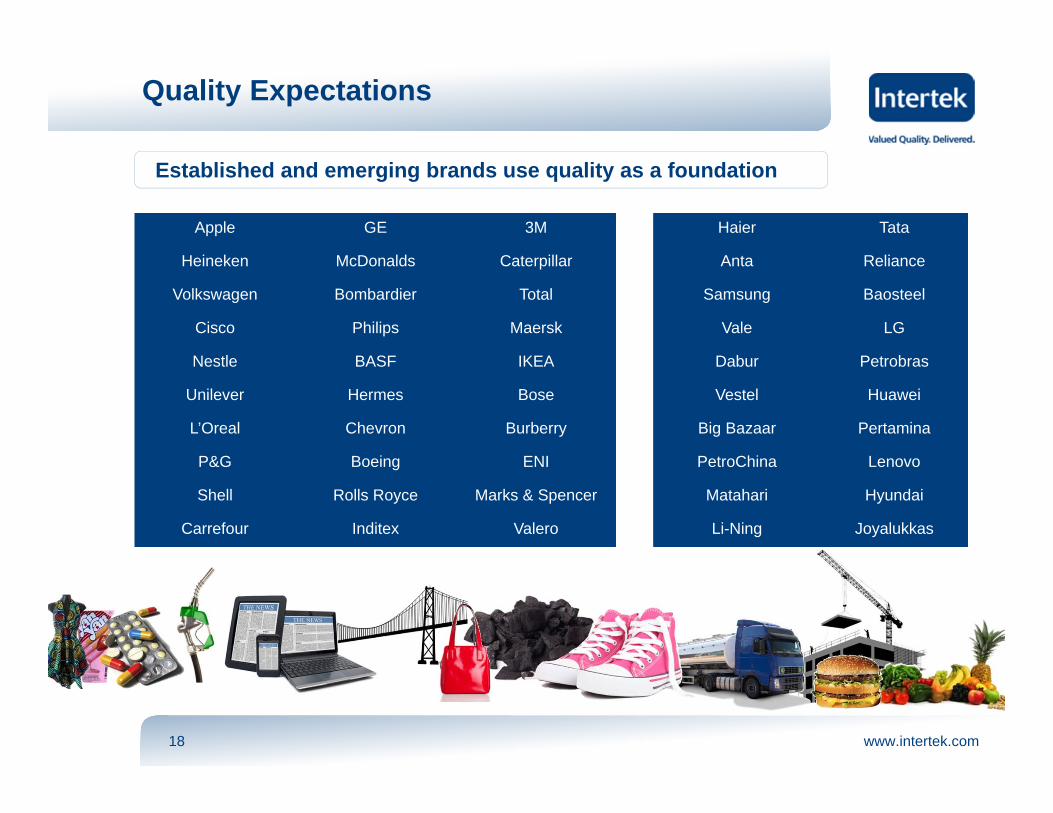
Quality Expectations
Established and emerging brands use quality as a foundation
Apple GE 3M
Heineken McDonalds Caterpillar
Volkswagen Bombardier Total
Cisco Philips Maersk
Nestle BASF IKEA
Unilever Hermes Bose
L’Oreal Chevron Burberry
P&G Boeing ENI
Shell Rolls Royce Marks & Spencer
Carrefour Inditex Valero
Haier Tata
Anta Reliance
Samsung Baosteel
Vale LG
Dabur Petrobras
Vestel Huawei
Big Bazaar Pertamina
PetroChina Lenovo
Matahari Hyundai
Li-Ning Joyalukkas

www.intertek.com19 1
Industry consolidation
Widen the portfolio• Complementary services
We are an acquisitive company; our strategy is:
Increase scale• Service lines/industries
Leverage synergies• Group wide rollout
R&D • New expertise
Track record – Acquisitions since IPO in 2002
Annual average for in-fills: £54m spend on 8 acquisitionsOne strategic deal: Moody for £450m in 2011

www.intertek.com20
Moody Acquisition
• Purchased April 2011
• Large and complex acquisition
• Management structures integrated
Industry Services87% Revenue
System Certification13% Revenue
£450m acquisition
2,500+ People 60 Countries, 80 Offices

www.intertek.com21
Moody Acquisition Performance
Revenue History
• Performing ahead of expectations
• Strategic growth platform created
• Strong global customer demand
• Good cultural fit
• Key staff retained
• Locations consolidating0
100
200
300
400
2008 2009 2010 2011
£m
Margin % 14.3 14.4 11.3 12.0
8 months: 12.8
Pre-Acquisition
+ 15%Organic
www.intertek.com22
Summary
• Resilient business model
• Full year Moody in 2012 (8 months 2011)
• High single digit organic growth average
• Margin progression
• Industry consolidation

www.intertek.com23
Summary
GLOBAL TRADE
MARKET DRIVERS
NETWORK & SERVICE
OUTSOURCING & CONSULTING
INDUSTRY CONSOLIDATION
QUALITY
COMMODITIES& MATERIALS
RETAIL & MANUFACTURED
PRODUCTS
INDUSTRY ASSETS

www.intertek.com24
Appendix

www.intertek.com25
Revenue by Region
Americas
EMEA
Asia Pacific
32%
36%32%
Emerging Markets
34%

www.intertek.com26
1,374
1,749
112
268 (5)
1,2001,2501,3001,3501,4001,4501,5001,5501,6001,6501,7001,7501,800
2010
Org
anic
Acq
uisi
tions FX
2011
£m
1,374
1,749
277
57 2212 7
1,2001,2501,3001,3501,4001,4501,5001,5501,6001,6501,7001,7501,800
2010 I&A
Com
mod
ities
C&
E
CG
C&
P
2011
£m
Revenue Growth
+ 27.3%Actual rates
+ 8.3%Constant
rates

www.intertek.com27
Five Year Performance 2007 to 2011
Revenue Adjusted Operating Profit(1)
1,749
500
800
1,100
1,400
1,700
2,000
2007 2008 2009 2010 2011
£m
281
0
50
100
150
200
250
300
2007 2008 2009 2010 2011
£m23% CAGR 23% CAGR
107
0
30
60
90
120
2007 2008 2009 2010 2011
Pence
Adjusted Diluted EPS(1)
22% CAGR
(1) Before separately disclosed items

www.intertek.com28
Margin Enhancement Programme
• Underlying margin increase of 20bps in 2011
• Moody integration cost savings; £6m per annum from 2012
• Finance and IT outsourcing; £10m per annum from 2014
• Operational margin improvement and Intertek as One
• Economies of Scale

www.intertek.com29
Divisional Performance Summary
£m @ constant exchange
Revenue Margin
FY 11 ChangeOrganic change FY 11 Change
Organic change
Commodities 530.2 12.0% 11.9% 12.6% 110bps 110bps
Industry & Assurance 468.6 145.5% 7.5% 10.9% 230bps (60)bps
Consumer Goods 315.7 5.0% 4.8% 33.7% (130)bps (120)bps
Commercial & Electrical 291.0 8.7% 8.7% 15.2% 100bps 100bps
Chemicals & Pharma 143.9 5.5% 3.9% 8.9% 30bps 120bps
Group Total 1,749.4 27.8% 8.3% 16.1% (40)bps 20bps
FY 2011

www.intertek.com30
• Continued strong performance in Minerals and Government Trade Services
• Good demand for oil cargo and analytical testing driven by growth economies
• North America improving
Commodities
FY 11 Performance Developments
• Continued network and service expansion
• Emerging economies continuing to drive demand for commodities and product quality
£m @ constant exchange FY 11 Change
Organicchange
Revenue 530.2 12.0% 11.9%
Operating profit 67.0 22.8% 22.9%
Margin 12.6% 110bps 110bps
Outlook
• £24m invested in laboratories, equipment and network expansion
• Expansion of additive services, Minerals facilities in Asia and Africa

www.intertek.com31
£m @ constant exchange FY 11 Change
Organicchange
Revenue 468.6 145.5% 7.5%
Operating profit 50.9 208.5% (0.6)%
Margin 10.9% 230bps (60)bps
Industry & Assurance
• New growth platform in energy sector
• Benefitting from structural recovery
• Moody delivering ahead of plan
• Agri difficult first half; Food good performance
FY 11 Performance Developments
Add chart
• Increased energy sector investment in energy assets and diversification
• Portfolio of complementary services across infrastructure spectrum
• Further consolidation of global contracts
• Good Food opportunities
• Acquisitions in UK & Chile
• New global client contracts in Industry & Business Assurance
Outlook

www.intertek.com32
£m @ constant exchange FY 11 Change
Organicchange
Revenue 315.7 5.0% 4.8%
Operating profit 106.3 1.1% 1.2%
Margin 33.7% (130)bps (120)bps
Consumer Goods
• H1: HK and coastal China flat with textile industry rapid upsizing and downsizing
• H2: Improved growth and margin in Textiles
• Good demand in Auditing and Health & Beauty
FY 11 Performance
• Quality and safety demand increasing in growth economies
• Sustainability creating new opportunities
• Product variety and technological innovation by major global brands
• Higher brand awareness among emerging market consumers
Outlook
Developments
• New service innovations and network expansion: Guatemala, Bangladesh, Vietnam, Cambodia, Turkey
• Acquisition: Product lifecycle analysis in Europe

www.intertek.com33
£m @ constant exchange FY 11 Change
Organicchange
Revenue 291.0 8.7% 8.7%
Operating profit 44.1 15.7% 15.7%
Margin 15.2% 100bps 100bps
Commercial & Electrical
• Good growth with excellent performance in high tech areas
• Strong performance in China
• H2 margin lower due to investments
• Technology innovations for better energy usage and communications
• Network and capability enhancement
• Technical standards increasing in new technology areas eg medical & lighting
• China producing more high-value, high-tech products
FY 11 Performance Developments
Outlook
• Organic capital investment of >£20m and business development to drive growth
• Value-adding services
www.intertek.com34
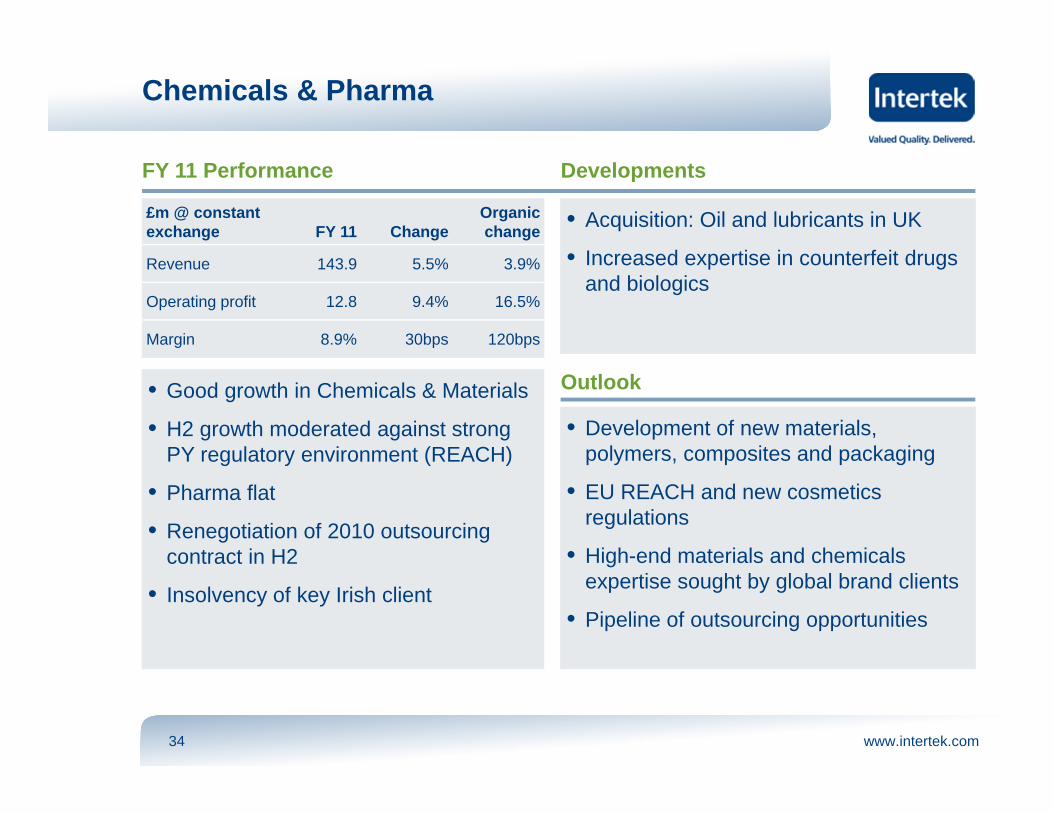
£m @ constant exchange FY 11 Change
Organicchange
Revenue 143.9 5.5% 3.9%
Operating profit 12.8 9.4% 16.5%
Margin 8.9% 30bps 120bps
Chemicals & Pharma
• Good growth in Chemicals & Materials
• H2 growth moderated against strong PY regulatory environment (REACH)
• Pharma flat
• Renegotiation of 2010 outsourcing contract in H2
• Insolvency of key Irish client
• Development of new materials, polymers, composites and packaging
• EU REACH and new cosmetics regulations
• High-end materials and chemicals expertise sought by global brand clients
• Pipeline of outsourcing opportunities
FY 11 Performance Developments
Outlook
• Acquisition: Oil and lubricants in UK
• Increased expertise in counterfeit drugs and biologics

www.intertek.com35
• Adjusted cash flow from operations £315m
• Capex £81m, 4.6% of revenue
• 5 acquisitions for £460m
• Net debt: EBITDA of 1.6
• Interest charge £21m
• Adjusted effective tax rate at 28%
Financing, Tax & Investment
2012-1513%
2016+87%
Funding Maturity Profile
• £0.9bn facilities
• 50% Bond: 50% Bank
• Maturity profile strong

www.intertek.com36
Profit Before Tax & Separately Disclosed Items
£m @ actual exchange rates 2011 2010
Adjusted operating profit (1) 281.1 227.5
Separately disclosed items:
Amortisation of acquisition intangibles (25.3) (12.9)
Acquisition transaction and integration costs (14.1) (5.3)
Restructuring costs – Business Process Outsourcing (7.7) -
Claims and settlements - (2.8)
Statutory operating profit 234.0 206.5
Net interest expense (21.0) (16.6)
Profit before tax 213.0 189.9
(1) Before separately disclosed items

www.intertek.com37
Taxation
£m @ actual exchange rates 2011 2010
Profit before tax 213.0 189.9
Tax (61.9) (50.9)
Profit after tax 151.1 139.0
Reported tax rate 29.1% 26.8%
Effective tax rate on adjusted operating profit 28.2% 26.7%

www.intertek.com38
+14%
Operating Cash Flow
£m @ actual exchange rates 2011 2010
Operating Profit before changes in working capital and provisions 329.1 282.3
Changes in working capital:
Inventory (2.1) (1.3)
Debtors and prepayments (34.8) (32.5)
Creditors and accruals (3.5) 22.9
Cash generated from operations 288.7 271.4
Separately disclosed items – cash flow 26.1 5.3
Adjusted cash flow from operations 314.8 276.7

www.intertek.com39
+20%
Free Cash Flow
£m @ actual exchange rates 2011 2010
Operating cash flow 288.7 271.4
Net interest (20.3) (14.5)
Taxation (53.4) (61.7)
Net capital expenditure (79.0) (65.1)
Free cash flow 136.0 130.1
Separately disclosed items – cash flow 26.1 5.3
Adjusted free cash flow 162.1 135.4

www.intertek.com40
Dividend Increased by 20%
• Full year dividend of 33.7p, up 20%
• Full year pay-out of £54m
• Strong and consistent record of dividend growth
• Dividend cover of 3.2
Full Year Dividend Per Share

www.intertek.com41
Net Debt
£m @ actual exchange rates 2011 2010
Borrowings 762.6 386.7
Cash (181.9) (217.0)
Net debt 580.7 169.7
Net debt to EBITDA (Proforma 12mths Moody) 1.6x 0.6x

www.intertek.com42
Liquidity Position
£m @ actual exchange rates 2011 2010
Debt facilities 911.2 722.9
Borrowings (762.6) (386.7)
Undrawn committed borrowing facilities 148.6 336.2
Cash 181.9 217.0
Liquid funds 330.5 553.2

www.intertek.com43
Currency Analysis
Local currency to GBP 2011 2010
USD 3.5% 1.60 1.55
CNY 1.1% 10.35 10.47
EUR 1.7% 1.15 1.17
HKD 3.7% 12.47 12.00
AUD 9.0% 1.55 1.69
CAD 1.0% 1.59 1.60
Revenue By Currency
USD, CNY & HKD~ 55%
GBP & EUR~ 19%
Other~ 26%