Embed Size (px)
Citation preview
July 28, 2021
BSE Limited
Phiroze Jeejeebjoy Towers
Dalal Street
Mumbai 400 001
Scrip Code: 532622
Dear Sir / Madam
GATEWAY DlSTRIPARKS LTD.
Subject: Investor Presentation
Please find attached the Investor presentation - June 2021
Kindly take the information on record.
Thanking You,
Yours faithfully,
For GATEWAY DISTRIPARKS LIMITED
~ Company Secretary
GATEWAY DISTR[PARKS LIMITED
National Stock Exchange of India Ltd.
Exchange Plaza, C-1, Block G,
Bandra Kurla Complex, Bandra (East)
Mumbai - 400051
Trading Symbol: GDL
Regd. Office: Sector 6, Dronagiri. Taluka Uran. District Raigad, Navi Mumbai - 400 707. Maharashtra, India T +91 22 2724 6500 F +91 222724 6538 E [email protected] W www.gateway-distriparks.com
CIN L74899MH1994PLC164024
1
Investor Presentation
July 2021
Gateway Distriparks Ltd.
Safe Harbor
This presentation and the accompanying slides (the “Presentation”), which have been prepared by Gateway Distriparks Limited (the “Company”), have beenprepared solely for information purposes and do not constitute any offer, recommendation or invitation to purchase or subscribe for any securities, and shallnot form the basis or be relied on in connection with any contract or binding commitment what so ever. No offering of securities of the Company will bemade except by means of a statutory offering document containing detailed information about the Company.
This Presentation has been prepared by the Company based on information and data which the Company considers reliable, but the Company makes norepresentation or warranty, express or implied, whatsoever, and no reliance shall be placed on, the truth, accuracy, completeness, fairness andreasonableness of the contents of this Presentation. This Presentation may not be all inclusive and may not contain all of the information that you mayconsider material. Any liability in respect of the contents of, or any omission from, this Presentation is expressly excluded
Certain matters discussed in this Presentation may contain statements regarding the Company’s market opportunity and business prospects that areindividually and collectively forward-looking statements. Such forward-looking statements are not guarantees of future performance and are subject toknown and unknown risks, uncertainties and assumptions that are difficult to predict. These risks and uncertainties include, but are not limited to, theperformance of the Indian economy and of the economies of various international markets, the performance of the industry in India and world-wide,competition, the company’s ability to successfully implement its strategy, the Company’s future levels of growth and expansion, technologicalimplementation, changes and advancements, changes in revenue, income or cash flows, the Company’s market preferences and its exposure to market risks,as well as other risks. The Company’s actual results, levels of activity, performance or achievements could differ materially and adversely from resultsexpressed in or implied by this Presentation. The Company assumes no obligation to update any forward-looking information contained in this Presentation.Any forward-looking statements and projections made by third parties included in this Presentation are not adopted by the Company and the Company isnot responsible for such third party statements and projections.
2
3
Business Overview
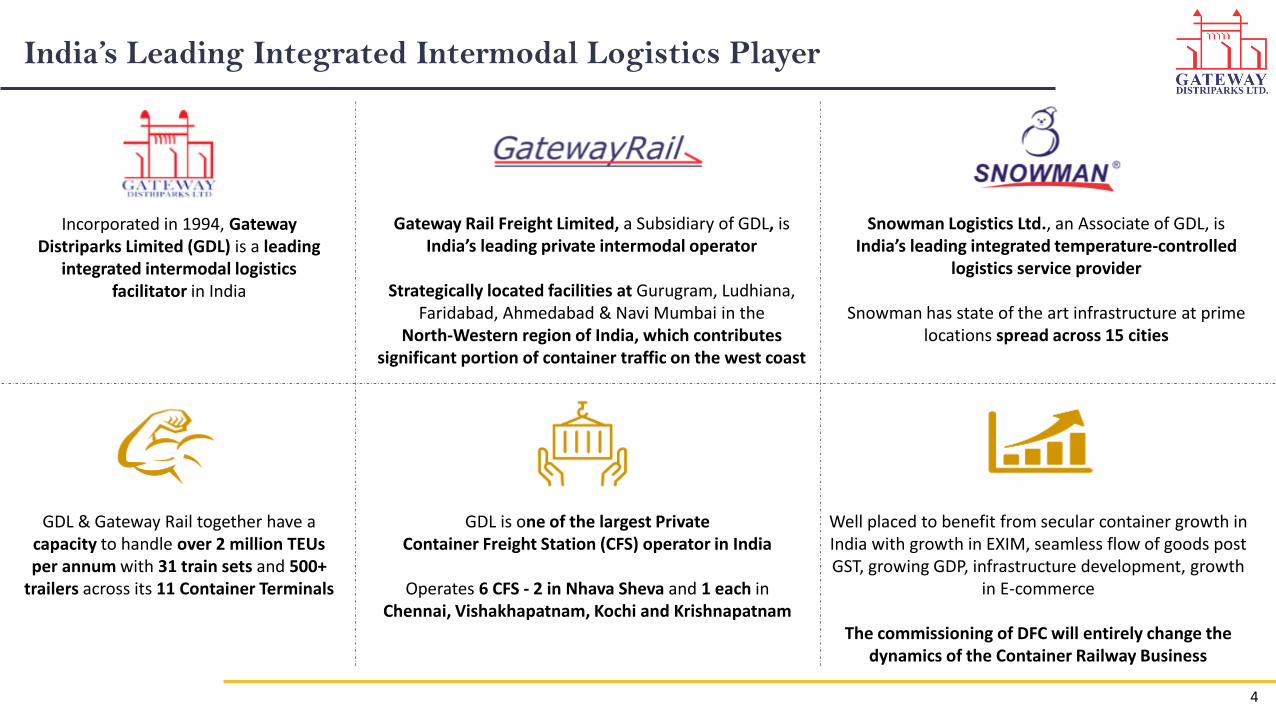
India’s Leading Integrated Intermodal Logistics Player
Incorporated in 1994, Gateway Distriparks Limited (GDL) is a leading
integrated intermodal logistics facilitator in India
Gateway Rail Freight Limited, a Subsidiary of GDL, isIndia’s leading private intermodal operator
Strategically located facilities at Gurugram, Ludhiana, Faridabad, Ahmedabad & Navi Mumbai in the
North‐Western region of India, which contributes significant portion of container traffic on the west coast
GDL & Gateway Rail together have a capacity to handle over 2 million TEUs per annum with 31 train sets and 500+
trailers across its 11 Container Terminals
Snowman Logistics Ltd., an Associate of GDL, is India’s leading integrated temperature-controlled
logistics service provider
Snowman has state of the art infrastructure at prime locations spread across 15 cities
Well placed to benefit from secular container growth in India with growth in EXIM, seamless flow of goods post GST, growing GDP, infrastructure development, growth
in E-commerce
The commissioning of DFC will entirely change the dynamics of the Container Railway Business
GDL is one of the largest Private Container Freight Station (CFS) operator in India
Operates 6 CFS - 2 in Nhava Sheva and 1 each in Chennai, Vishakhapatnam, Kochi and Krishnapatnam
4

Business Overview
Gateway Distripark - CFS Gateway Rail – Railway linked ICDs
GDL operates 6 Container Freight Stations(CFS) in Nhava Sheva, Chennai,Vishakhapatnam, Kochi and Krishnapatnam
CFS offer transportation, storage, Bonded &General warehousing, empty handling &storage, refer containers and several ValueAdded Services (VAS)
7,00,000 TEU total capacity at Key ports which serves as Gateway to India
Gateway Rail Freight Limited (GRFL) is a subsidiary ofGateway Distriparks Limited
India’s leading private intermodal operator, provides railtransportation service between its 4 Inland ContainerDepots (ICD) at Gurgaon, Faridabad, Ludhiana,Ahmedabad and Navi Mumbai terminal for various ports
Operates regular container train service from theseICDs/Dry Ports to the maritime ports at Nhava Sheva,Mundra and Pipavav, transporting EXIM as well asdomestic containers
Revenue Stream– Handling & Transport– Terminal Services– Warehousing &– Others VAS
Revenue Stream– Rail Freight– Terminal Handling & Storage charges– Road Freight
5
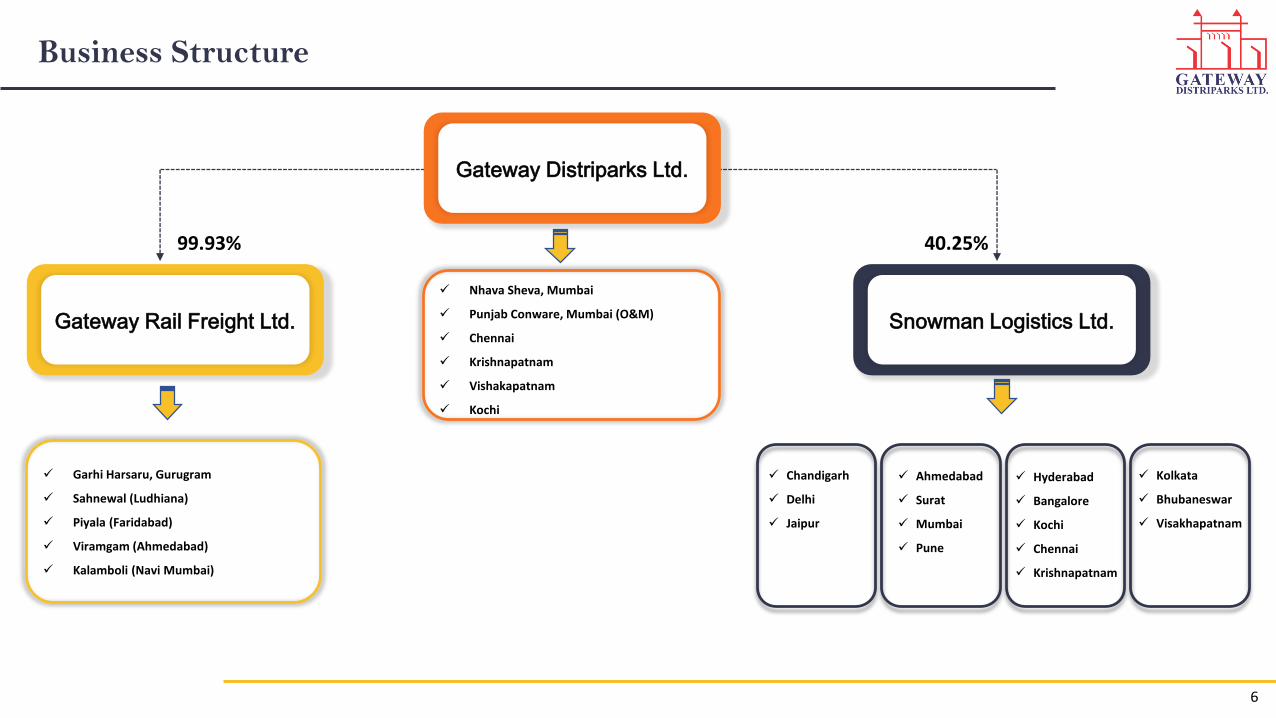
Gateway Distriparks Ltd.
Gateway Rail Freight Ltd. Snowman Logistics Ltd.
99.93% 40.25%
Nhava Sheva, Mumbai
Punjab Conware, Mumbai (O&M)
Chennai
Krishnapatnam
Vishakapatnam
Kochi
Garhi Harsaru, Gurugram
Sahnewal (Ludhiana)
Piyala (Faridabad)
Viramgam (Ahmedabad)
Kalamboli (Navi Mumbai)
Chandigarh
Delhi
Jaipur
Ahmedabad
Surat
Mumbai
Pune
Hyderabad
Bangalore
Kochi
Chennai
Krishnapatnam
Kolkata
Bhubaneswar
Visakhapatnam
Business Structure
6
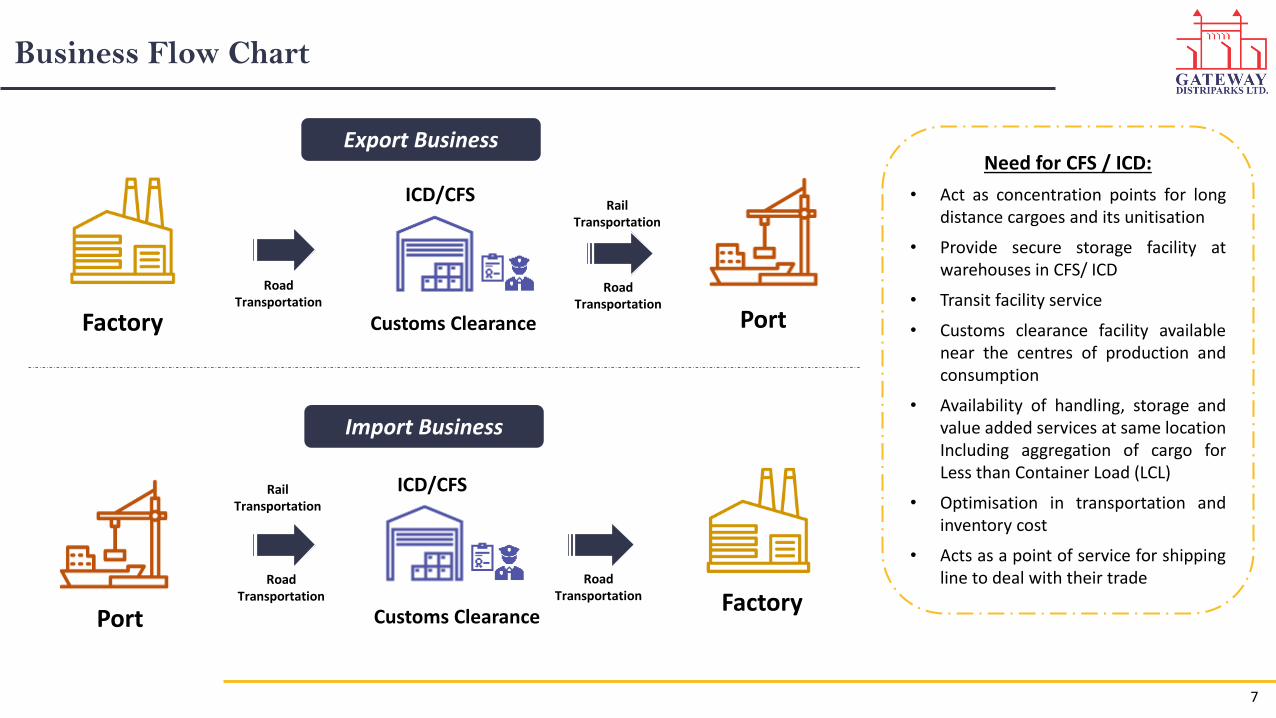
Business Flow Chart
Need for CFS / ICD:
• Act as concentration points for longdistance cargoes and its unitisation
• Provide secure storage facility atwarehouses in CFS/ ICD
• Transit facility service
• Customs clearance facility availablenear the centres of production andconsumption
• Availability of handling, storage andvalue added services at same locationIncluding aggregation of cargo forLess than Container Load (LCL)
• Optimisation in transportation andinventory cost
• Acts as a point of service for shippingline to deal with their trade
Rail Transportation
Road Transportation
Road Transportation
Road Transportation
Road Transportation
Rail Transportation
Export Business
Import Business
ICD/CFS
Factory Customs Clearance Port
FactoryPort Customs Clearance
ICD/CFS
7
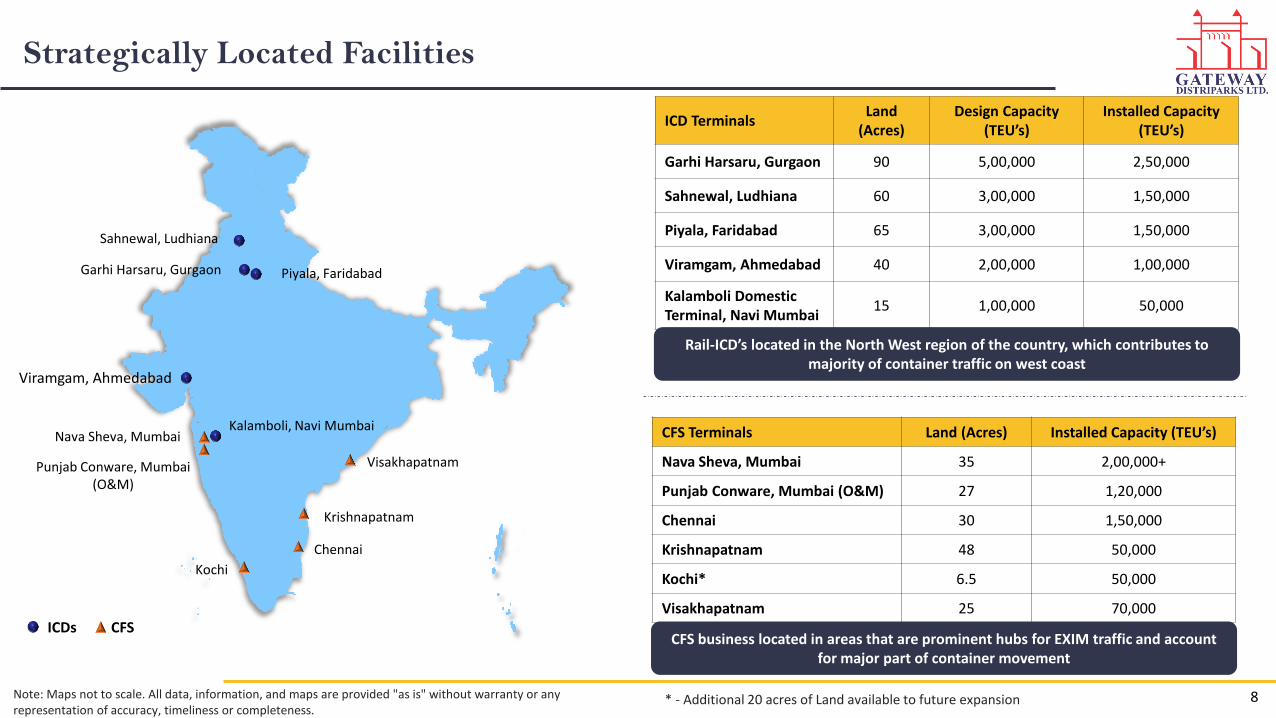
Strategically Located Facilities
* - Additional 20 acres of Land available to future expansion
CFS Terminals Land (Acres) Installed Capacity (TEU’s)
Nava Sheva, Mumbai 35 2,00,000+
Punjab Conware, Mumbai (O&M) 27 1,20,000
Chennai 30 1,50,000
Krishnapatnam 48 50,000
Kochi* 6.5 50,000
Visakhapatnam 25 70,000
ICD TerminalsLand
(Acres)Design Capacity
(TEU’s)Installed Capacity
(TEU’s)
Garhi Harsaru, Gurgaon 90 5,00,000 2,50,000
Sahnewal, Ludhiana 60 3,00,000 1,50,000
Piyala, Faridabad 65 3,00,000 1,50,000
Viramgam, Ahmedabad 40 2,00,000 1,00,000
Kalamboli Domestic Terminal, Navi Mumbai
15 1,00,000 50,000
Rail-ICD’s located in the North West region of the country, which contributes to majority of container traffic on west coast
CFS business located in areas that are prominent hubs for EXIM traffic and account for major part of container movement
Garhi Harsaru, Gurgaon
Sahnewal, Ludhiana
Piyala, Faridabad
Kochi
Chennai
Nava Sheva, MumbaiKalamboli, Navi Mumbai
Punjab Conware, Mumbai (O&M)
Krishnapatnam
Visakhapatnam
Viramgam, Ahmedabad
ICDs CFS
Note: Maps not to scale. All data, information, and maps are provided "as is" without warranty or any representation of accuracy, timeliness or completeness.
8
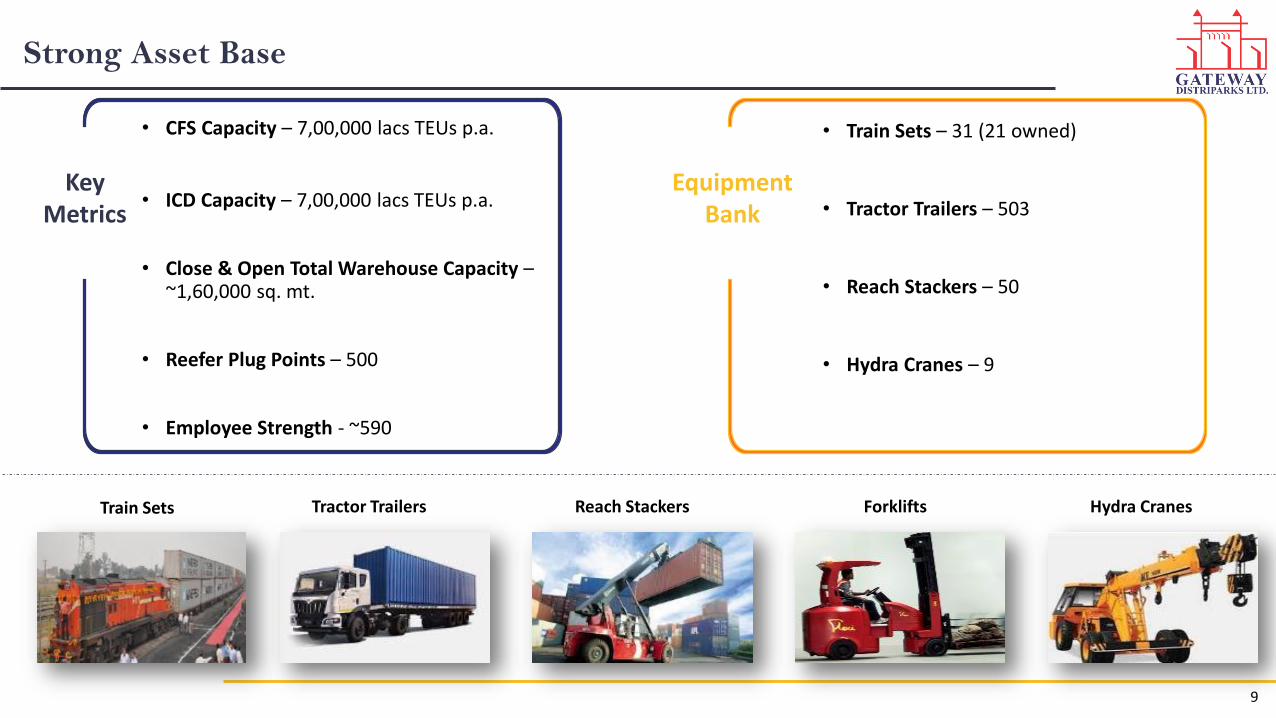
Strong Asset Base
• Train Sets – 31 (21 owned)
• Tractor Trailers – 503
• Reach Stackers – 50
• Hydra Cranes – 9
Key Metrics
• CFS Capacity – 7,00,000 lacs TEUs p.a.
• ICD Capacity – 7,00,000 lacs TEUs p.a.
• Close & Open Total Warehouse Capacity –~1,60,000 sq. mt.
• Reefer Plug Points – 500
• Employee Strength - ~590
Equipment Bank
Tractor Trailers Reach Stackers Forklifts Hydra CranesTrain Sets
9
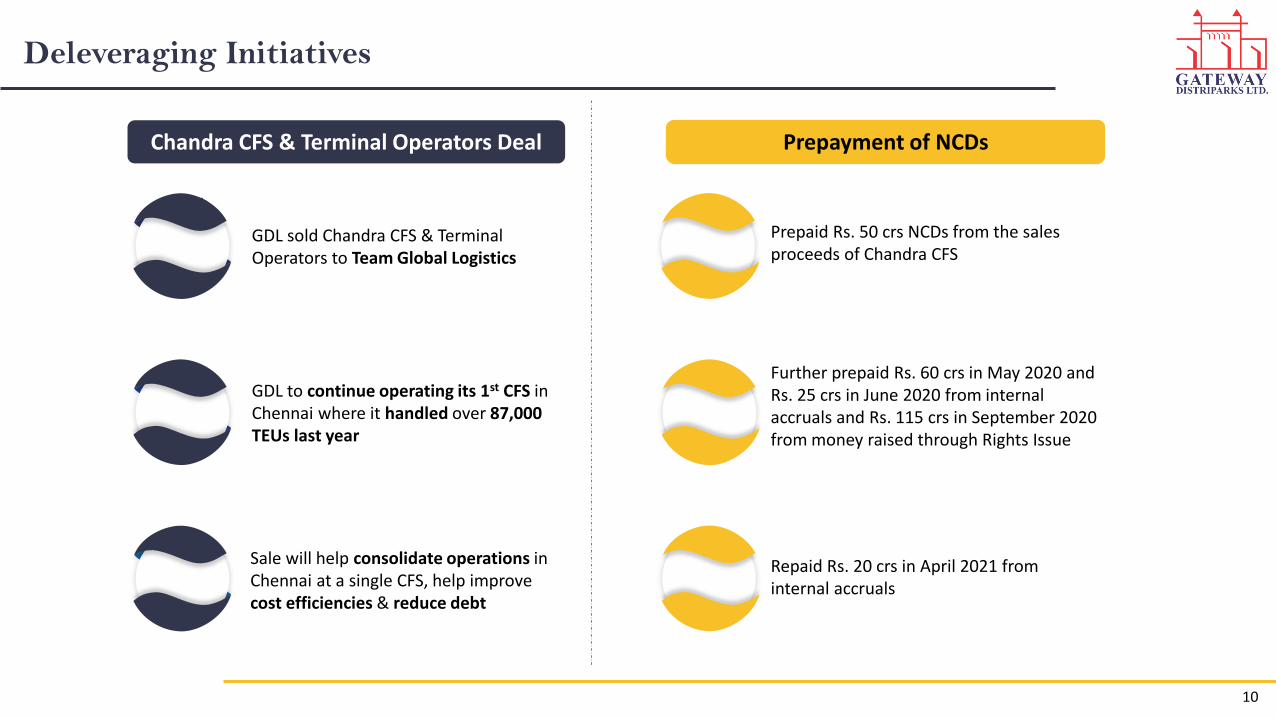
Deleveraging Initiatives
Prepaid Rs. 50 crs NCDs from the sales proceeds of Chandra CFS
Further prepaid Rs. 60 crs in May 2020 and Rs. 25 crs in June 2020 from internal accruals and Rs. 115 crs in September 2020 from money raised through Rights Issue
Repaid Rs. 20 crs in April 2021 from internal accruals
Prepayment of NCDsChandra CFS & Terminal Operators Deal
GDL sold Chandra CFS & Terminal Operators to Team Global Logistics
GDL to continue operating its 1st CFS in Chennai where it handled over 87,000 TEUs last year
Sale will help consolidate operations in Chennai at a single CFS, help improve cost efficiencies & reduce debt
10
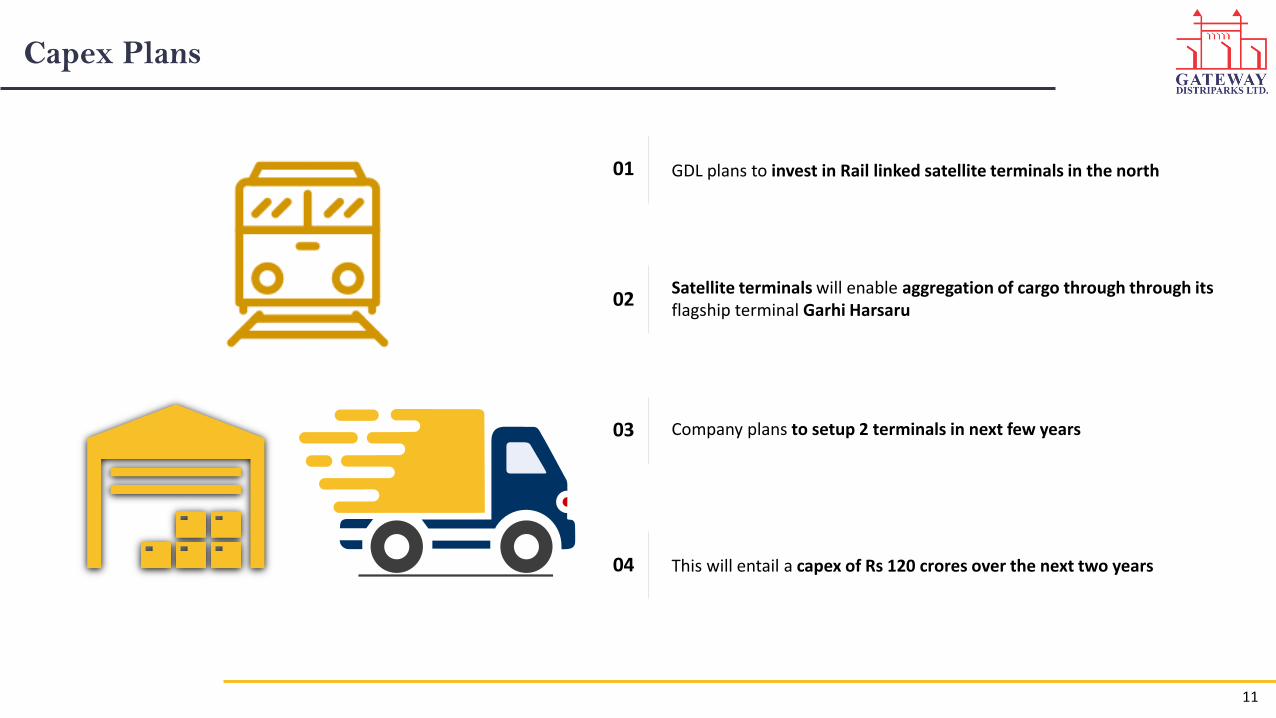
Capex Plans
GDL plans to invest in Rail linked satellite terminals in the north01
Satellite terminals will enable aggregation of cargo through through its flagship terminal Garhi Harsaru
02
Company plans to setup 2 terminals in next few years03
This will entail a capex of Rs 120 crores over the next two years04
11
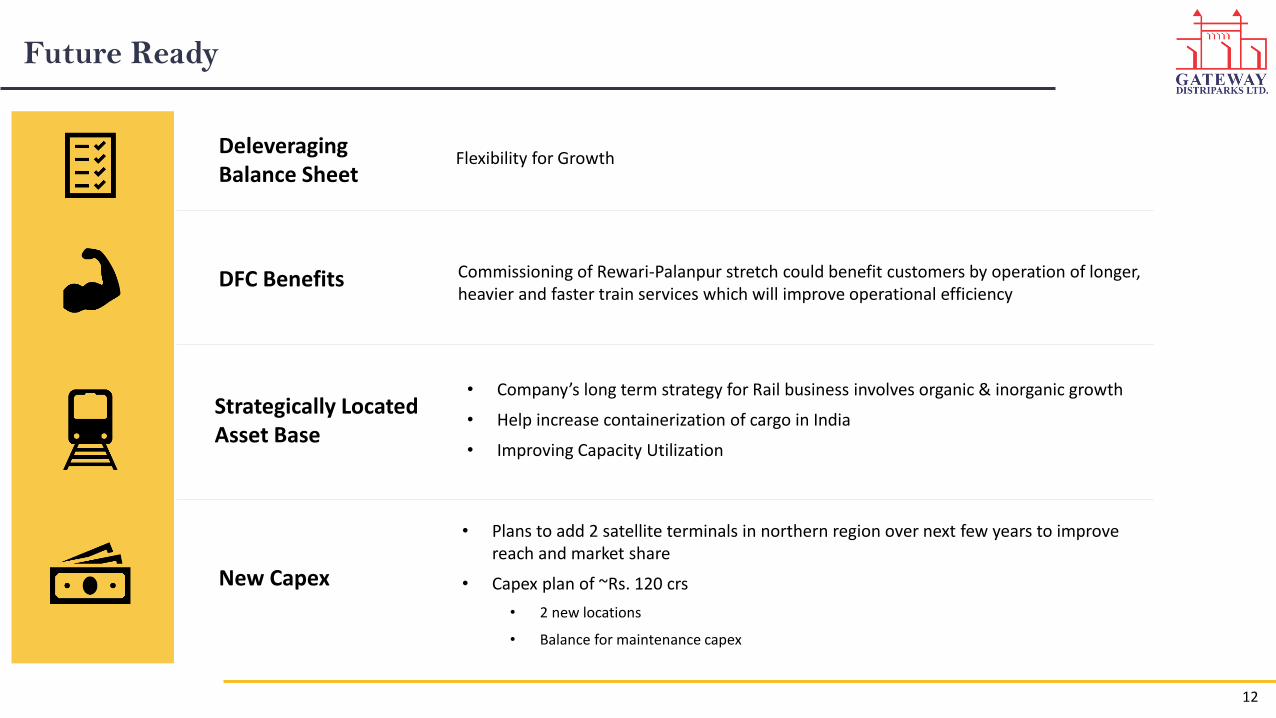
Future Ready
DFC Benefits Commissioning of Rewari-Palanpur stretch could benefit customers by operation of longer, heavier and faster train services which will improve operational efficiency
Strategically Located Asset Base
New Capex
• Company’s long term strategy for Rail business involves organic & inorganic growth
• Help increase containerization of cargo in India
• Improving Capacity Utilization
• Plans to add 2 satellite terminals in northern region over next few years to improve reach and market share
• Capex plan of ~Rs. 120 crs
• 2 new locations
• Balance for maintenance capex
Deleveraging Balance Sheet
Flexibility for Growth
12
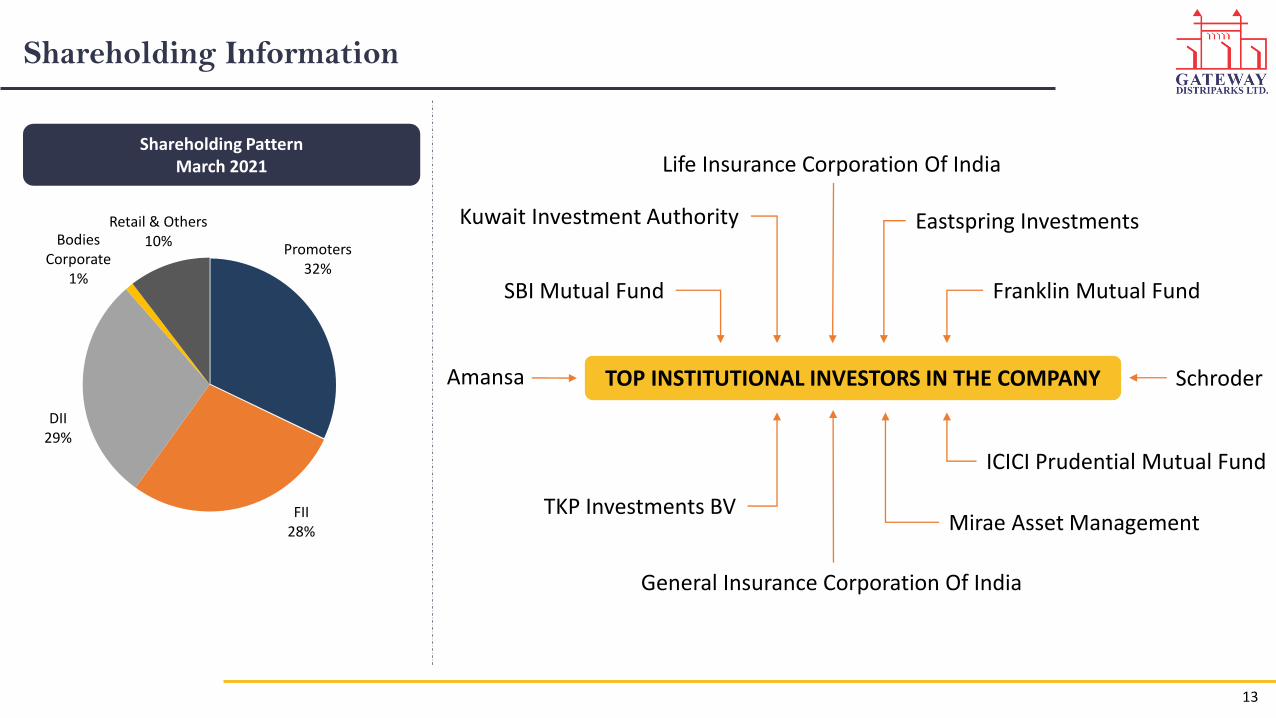
Shareholding Information
Promoters32%
FII28%
DII29%
Bodies Corporate
1%
Retail & Others10%
Shareholding PatternMarch 2021
TOP INSTITUTIONAL INVESTORS IN THE COMPANY
Life Insurance Corporation Of India
General Insurance Corporation Of India
Amansa Schroder
Kuwait Investment Authority Eastspring Investments
TKP Investments BVMirae Asset Management
SBI Mutual Fund Franklin Mutual Fund
ICICI Prudential Mutual Fund
13

Promoter Group
Mr. Prem Kishan Dass GuptaChairman And Managing Director
Mr. Ishaan GuptaJoint Managing Director
Mrs. Mamta GuptaNon-Executive Director
Mr. Samvid GuptaNon-Executive Director
14
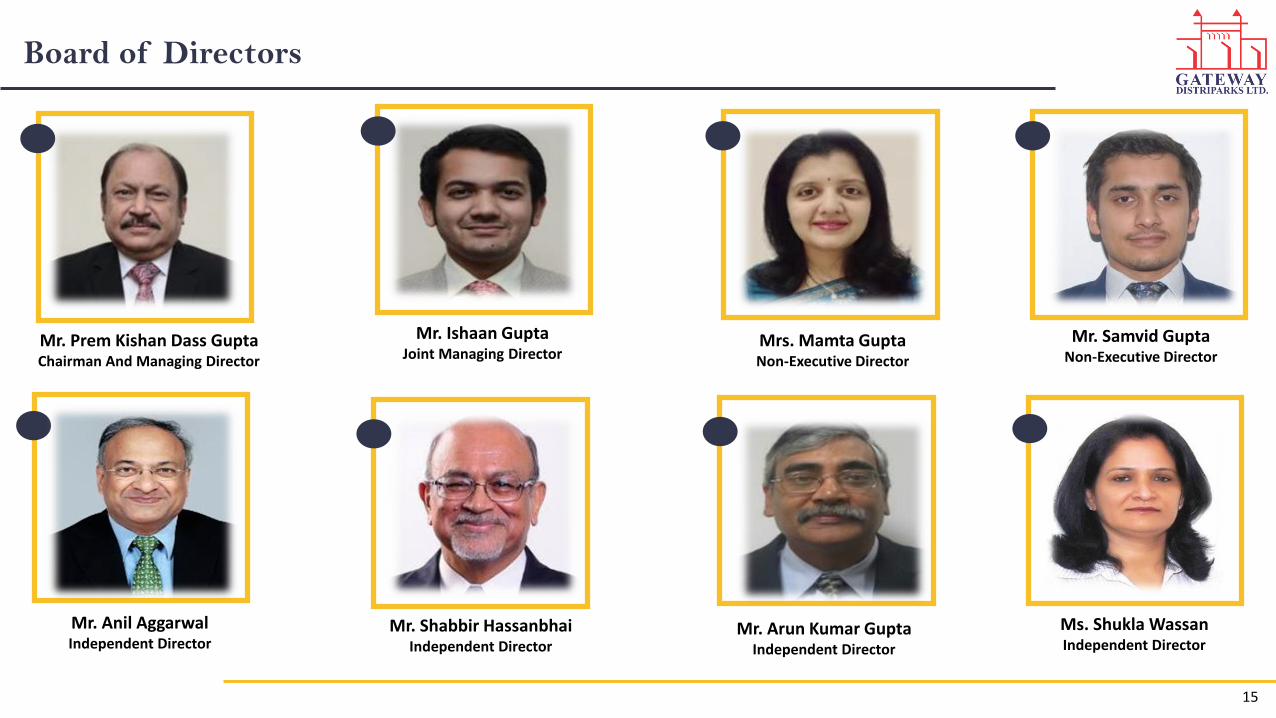
Board of Directors
Mr. Prem Kishan Dass GuptaChairman And Managing Director
Mr. Ishaan GuptaJoint Managing Director
Mrs. Mamta GuptaNon-Executive Director
Mr. Anil AggarwalIndependent Director
Mr. Arun Kumar GuptaIndependent Director
Mr. Shabbir HassanbhaiIndependent Director
Mr. Samvid GuptaNon-Executive Director
Ms. Shukla WassanIndependent Director
15
Rail linked Inland Container Depot (ICD) Business
16
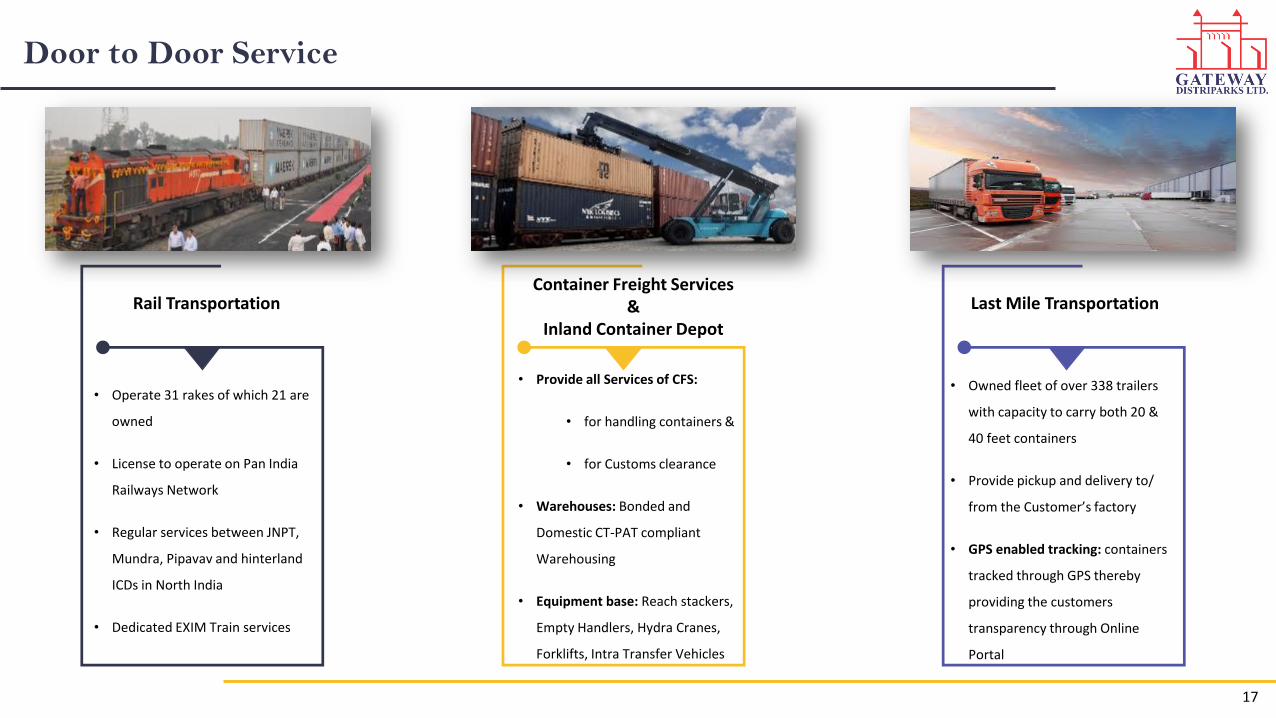
Door to Door Service
Rail Transportation
• Operate 31 rakes of which 21 are
owned
• License to operate on Pan India
Railways Network
• Regular services between JNPT,
Mundra, Pipavav and hinterland
ICDs in North India
• Dedicated EXIM Train services
• Provide all Services of CFS:
• for handling containers &
• for Customs clearance
• Warehouses: Bonded and
Domestic CT-PAT compliant
Warehousing
• Equipment base: Reach stackers,
Empty Handlers, Hydra Cranes,
Forklifts, Intra Transfer Vehicles
• Owned fleet of over 338 trailers
with capacity to carry both 20 &
40 feet containers
• Provide pickup and delivery to/
from the Customer’s factory
• GPS enabled tracking: containers
tracked through GPS thereby
providing the customers
transparency through Online
Portal
Container Freight Services&
Inland Container Depot
Last Mile Transportation
17
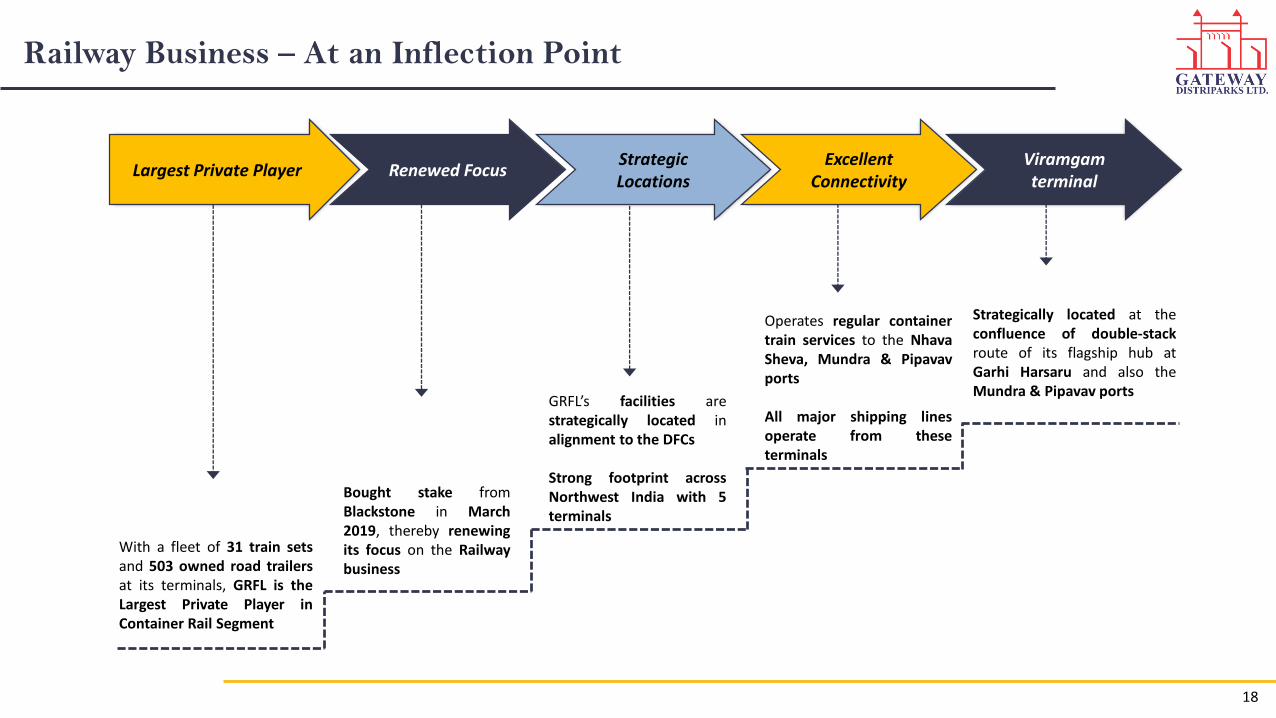
Railway Business – At an Inflection Point
Largest Private Player Renewed FocusStrategicLocations
ExcellentConnectivity
Viramgamterminal
With a fleet of 31 train setsand 503 owned road trailersat its terminals, GRFL is theLargest Private Player inContainer Rail Segment
Strategically located at theconfluence of double-stackroute of its flagship hub atGarhi Harsaru and also theMundra & Pipavav ports
Operates regular containertrain services to the NhavaSheva, Mundra & Pipavavports
All major shipping linesoperate from theseterminals
GRFL’s facilities arestrategically located inalignment to the DFCs
Strong footprint acrossNorthwest India with 5terminals
Bought stake fromBlackstone in March2019, thereby renewingits focus on the Railwaybusiness
18
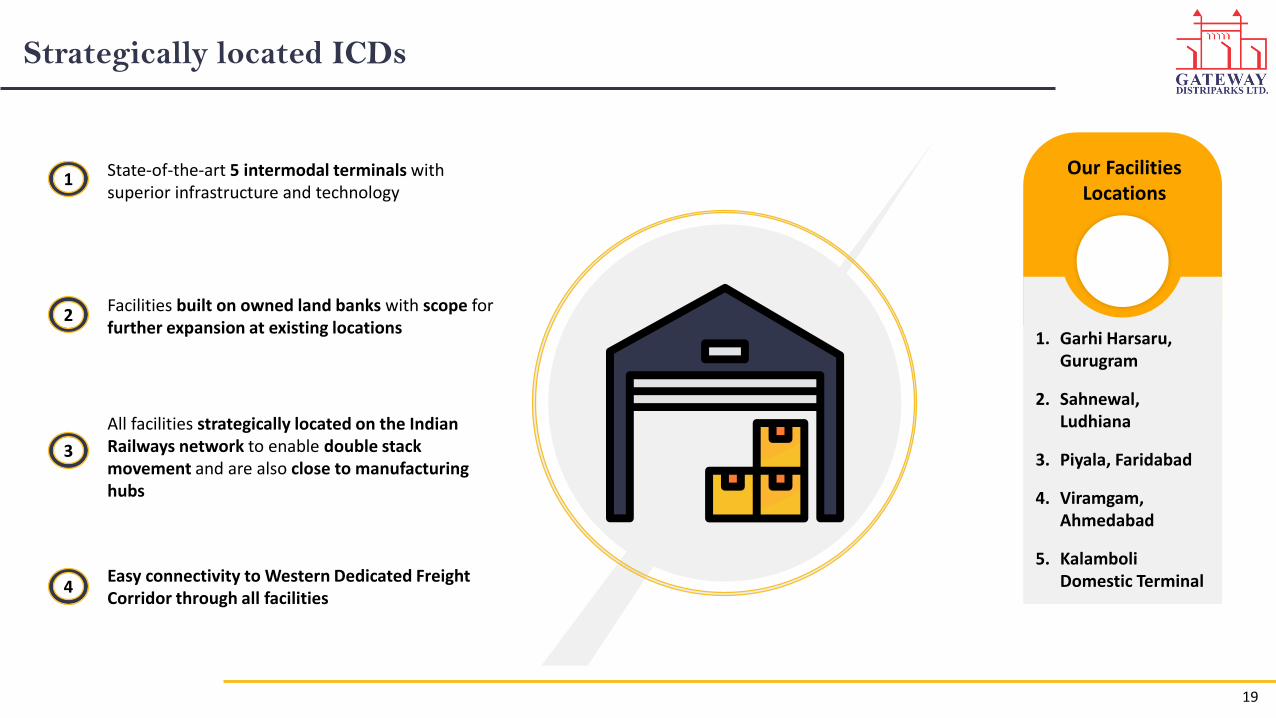
Strategically located ICDs
State-of-the-art 5 intermodal terminals with superior infrastructure and technology
1
Facilities built on owned land banks with scope for further expansion at existing locations
2
All facilities strategically located on the Indian Railways network to enable double stack movement and are also close to manufacturing hubs
3
Easy connectivity to Western Dedicated Freight Corridor through all facilities
4
Our Facilities Locations
1. Garhi Harsaru, Gurugram
2. Sahnewal, Ludhiana
3. Piyala, Faridabad
4. Viramgam, Ahmedabad
5. KalamboliDomestic Terminal
19
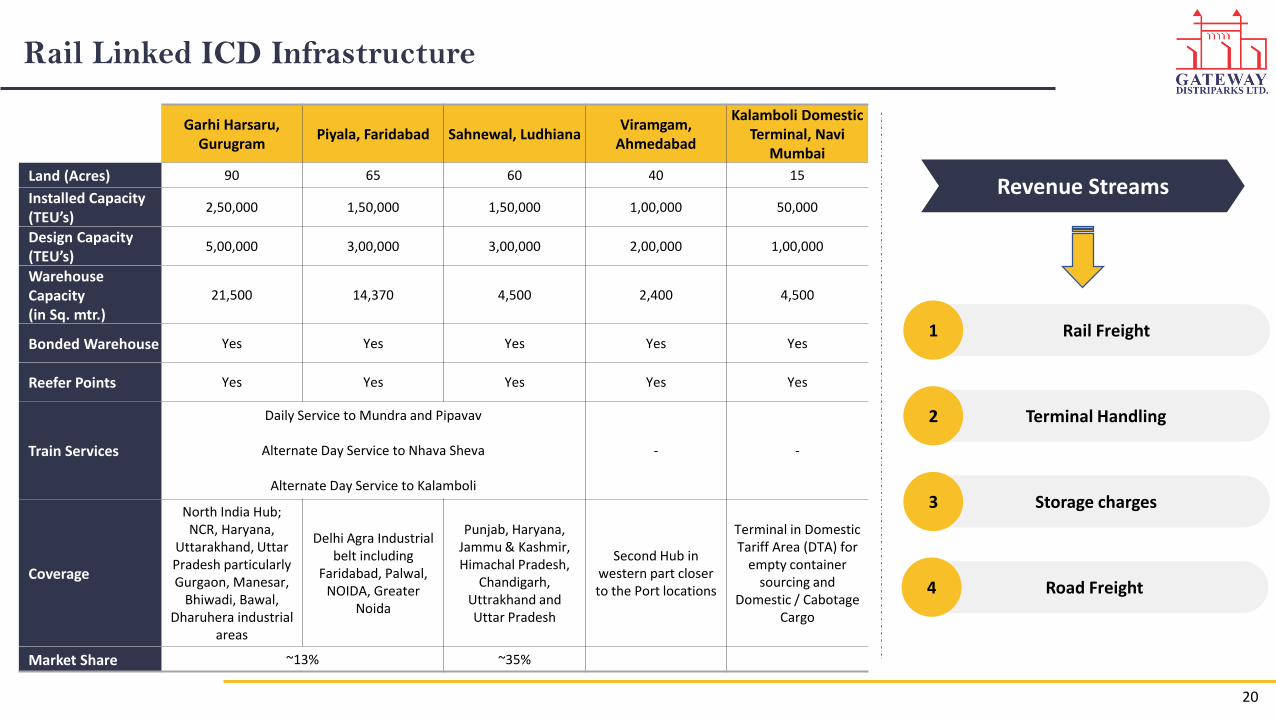
Rail Linked ICD Infrastructure
Garhi Harsaru, Gurugram
Piyala, Faridabad Sahnewal, LudhianaViramgam,
Ahmedabad
Kalamboli Domestic Terminal, Navi
Mumbai
Land (Acres) 90 65 60 40 15
Installed Capacity (TEU’s)
2,50,000 1,50,000 1,50,000 1,00,000 50,000
Design Capacity(TEU’s)
5,00,000 3,00,000 3,00,000 2,00,000 1,00,000
Warehouse Capacity(in Sq. mtr.)
21,500 14,370 4,500 2,400 4,500
Bonded Warehouse Yes Yes Yes Yes Yes
Reefer Points Yes Yes Yes Yes Yes
Train Services
Daily Service to Mundra and Pipavav
Alternate Day Service to Nhava Sheva
Alternate Day Service to Kalamboli
- -
Coverage
North India Hub; NCR, Haryana,
Uttarakhand, Uttar Pradesh particularly Gurgaon, Manesar,
Bhiwadi, Bawal, Dharuhera industrial
areas
Delhi Agra Industrial belt including
Faridabad, Palwal, NOIDA, Greater
Noida
Punjab, Haryana, Jammu & Kashmir, Himachal Pradesh,
Chandigarh, Uttrakhand and Uttar Pradesh
Second Hub in western part closer to the Port locations
Terminal in Domestic Tariff Area (DTA) for
empty container sourcing and
Domestic / Cabotage Cargo
Market Share ~13% ~35%
Revenue Streams
Rail Freight1
Terminal Handling2
Storage charges3
Road Freight4
20
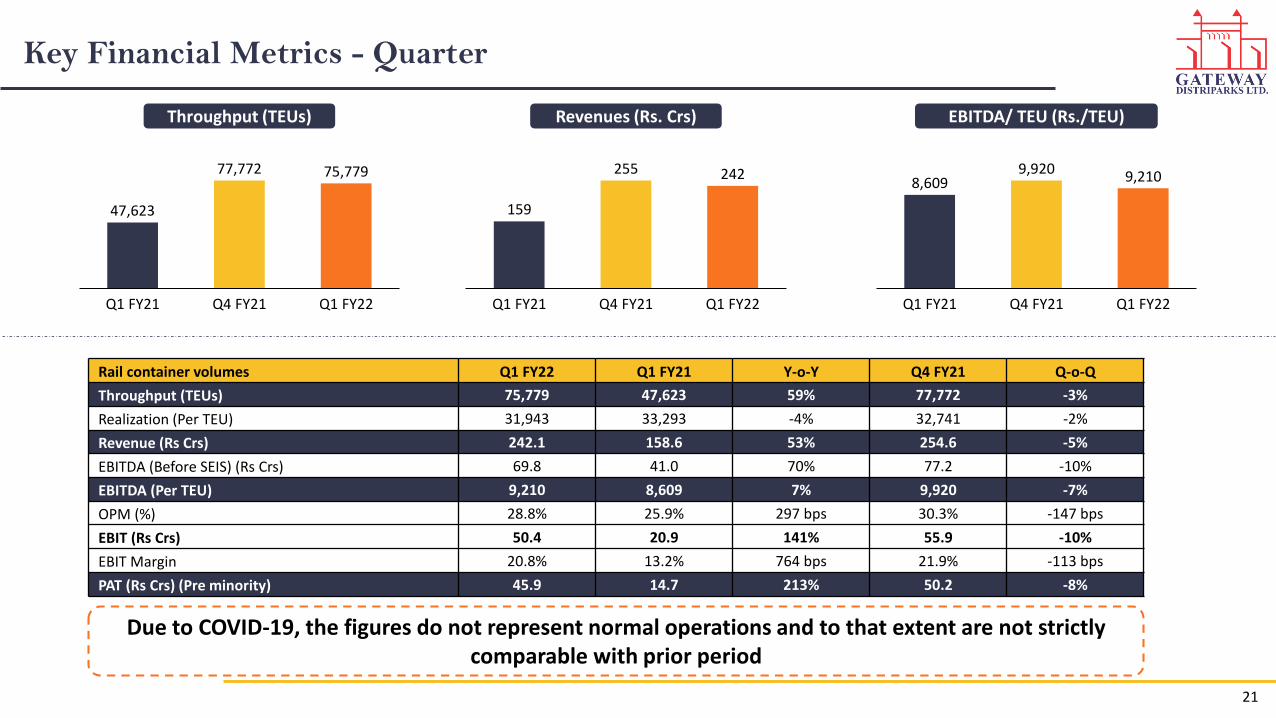
Key Financial Metrics - Quarter
Rail container volumes Q1 FY22 Q1 FY21 Y-o-Y Q4 FY21 Q-o-Q
Throughput (TEUs) 75,779 47,623 59% 77,772 -3%
Realization (Per TEU) 31,943 33,293 -4% 32,741 -2%
Revenue (Rs Crs) 242.1 158.6 53% 254.6 -5%
EBITDA (Before SEIS) (Rs Crs) 69.8 41.0 70% 77.2 -10%
EBITDA (Per TEU) 9,210 8,609 7% 9,920 -7%
OPM (%) 28.8% 25.9% 297 bps 30.3% -147 bps
EBIT (Rs Crs) 50.4 20.9 141% 55.9 -10%
EBIT Margin 20.8% 13.2% 764 bps 21.9% -113 bps
PAT (Rs Crs) (Pre minority) 45.9 14.7 213% 50.2 -8%
47,623
77,772 75,779
Q1 FY22Q1 FY21 Q4 FY21
Throughput (TEUs)
159
255 242
Q1 FY21 Q4 FY21 Q1 FY22
Revenues (Rs. Crs)
8,6099,920 9,210
Q1 FY21 Q1 FY22Q4 FY21
EBITDA/ TEU (Rs./TEU)
Due to COVID-19, the figures do not represent normal operations and to that extent are not strictly comparable with prior period
21

Key Financial Metrics – FY21
Rail container volumes FY21 FY20 Y-o-Y
Throughput (TEUs) 2,48,504 2,57,030 -3%
Realization (Per TEU) 32,832 33,794 -3%
Revenue (Rs Crs) 815.9 868.6 -6%
EBITDA (Before SEIS) (Rs Crs) 221.5 187.6 18%
EBITDA (Per TEU) 8,913 7,299 22%
OPM (%) 27.1% 21.6% 555 bps
EBIT (Rs Crs) 140.2 105.9 32%
EBIT Margin 17.2% 12.2% 499 bps
PAT (Rs Crs) (Pre minority) 118.1 91.2 29%
2,57,030 2,48,504
FY20 FY21
Throughput (TEUs)
869 816
FY20 FY21
Revenues (Rs. Crs)
7,2998,913
FY20 FY21
EBITDA/ TEU (Rs./TEU)
Due to COVID-19, the figures do not represent normal operations and to that extent are not strictly comparable with prior period
22
23
Dedicated Freight Corridor (DFC)
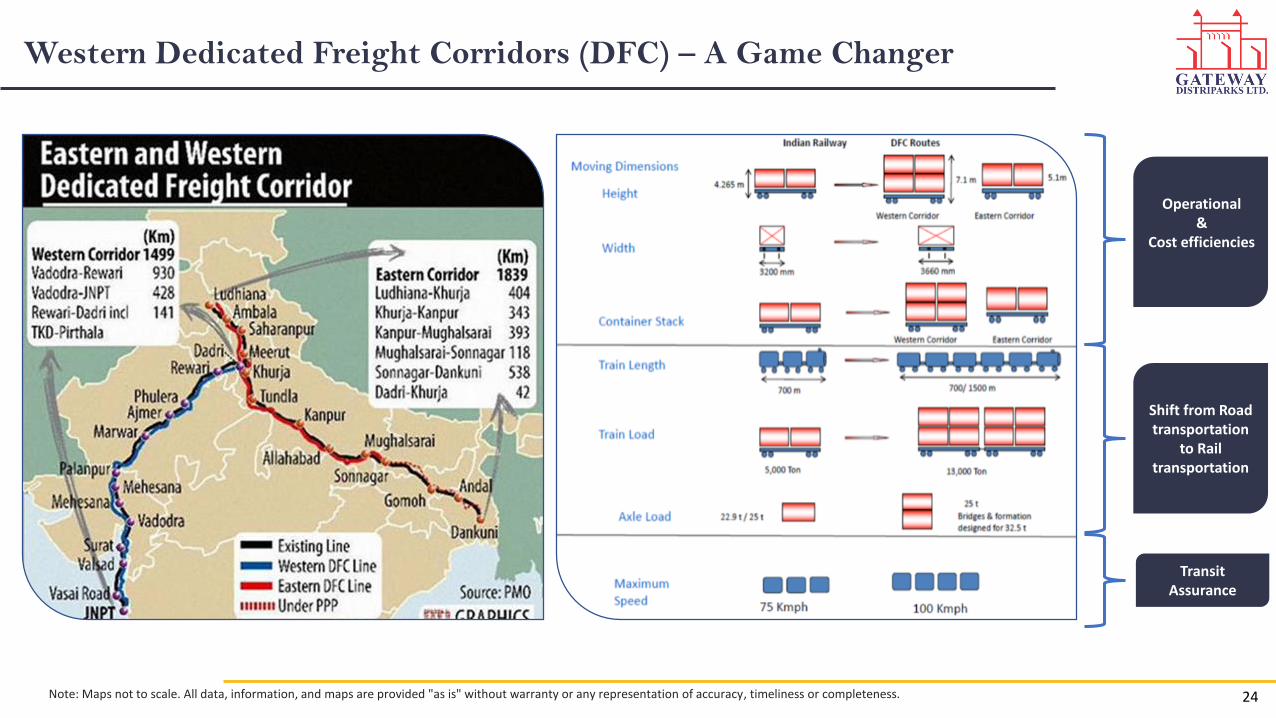
Shift from Road transportation
to Rail transportation
Transit Assurance
Western Dedicated Freight Corridors (DFC) – A Game Changer
Note: Maps not to scale. All data, information, and maps are provided "as is" without warranty or any representation of accuracy, timeliness or completeness.
Operational&
Cost efficiencies
24
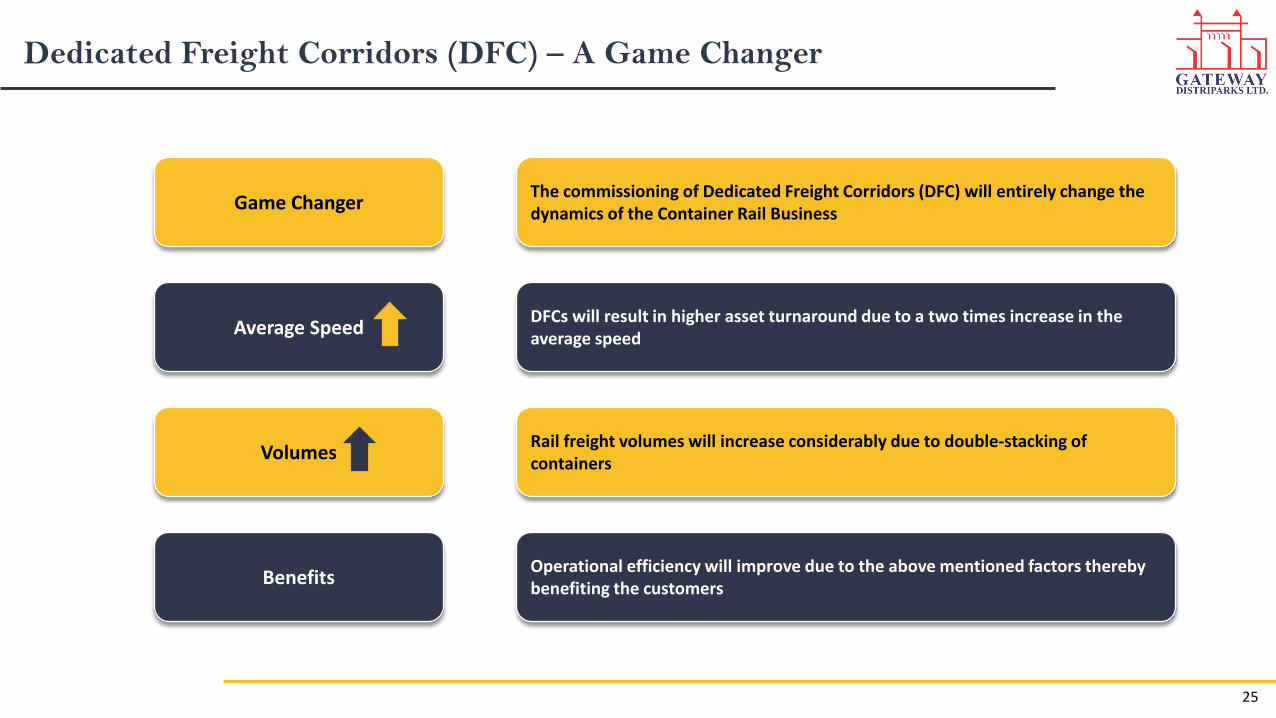
Dedicated Freight Corridors (DFC) – A Game Changer
The commissioning of Dedicated Freight Corridors (DFC) will entirely change the dynamics of the Container Rail Business
DFCs will result in higher asset turnaround due to a two times increase in the average speed
Rail freight volumes will increase considerably due to double‐stacking of containers
Operational efficiency will improve due to the above mentioned factors thereby benefiting the customers
Game Changer
Average Speed
Volumes
Benefits
25
Garhi Harsaru, Gurgaon
Sahnewal, Ludhiana
Asaoti, Faridabad
Viramgam, AhmedabadMundra Port
Pipavav Port
JNPT Port
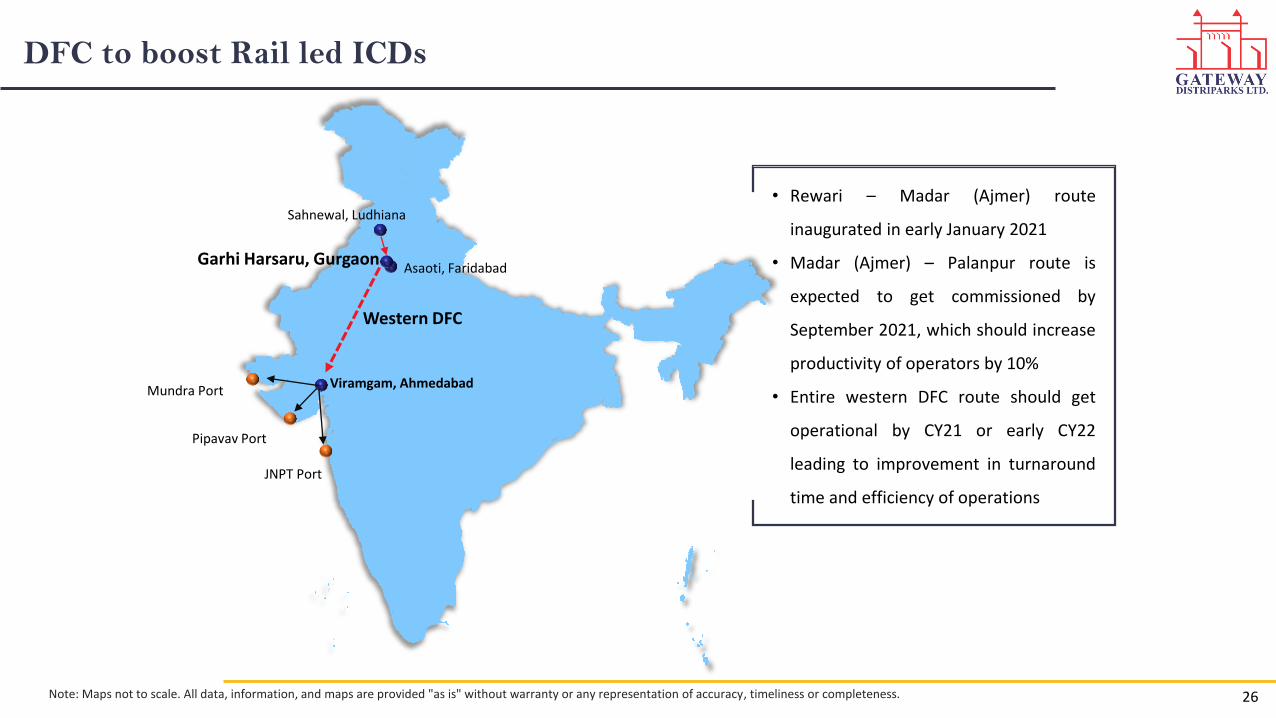
DFC to boost Rail led ICDs
Note: Maps not to scale. All data, information, and maps are provided "as is" without warranty or any representation of accuracy, timeliness or completeness.
• Rewari – Madar (Ajmer) route
inaugurated in early January 2021
• Madar (Ajmer) – Palanpur route is
expected to get commissioned by
September 2021, which should increase
productivity of operators by 10%
• Entire western DFC route should get
operational by CY21 or early CY22
leading to improvement in turnaround
time and efficiency of operations
Western DFC
26

27
Container Freight Station (CFS)Business

Service offerings
Transportation
• Fleet of over 115 trailers with
capacity to carry both 20 & 40 feet
containers
• Fast evacuation of containers from
port
• Provide pickup & delivery to/ from
the port and factory
• GPS enabled tracking of
containers, thereby increasing
operational efficiency
• RFID enabled Bonded, Domestic
and empty container yards
• Custom clearance of EXIM
containers
• Container maintenance & repair
facilities
• Equipment: Reach stackers,
Empty Handlers, Hydra Cranes,
Intra Transfer Vehicles
• General, Bonded and Domestic
CT-PAT Compliant warehousing
• Racking facilities available with
adequate forklift equipment
• Inventory Management
• Customized solutions like Variable
Pressure Clamp Forklifts, Garment
on Hangar, Palletizing /unitizing
and Shrink Wrapping
Container Freight Station Warehousing
28
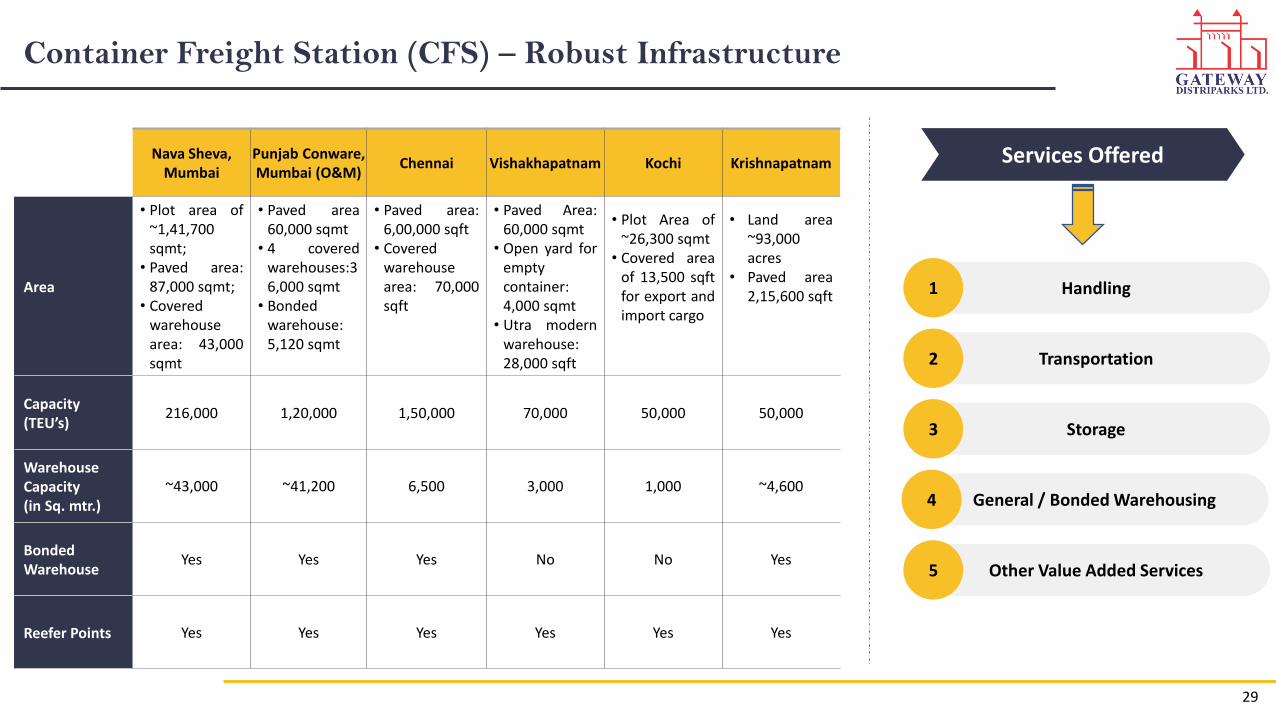
Container Freight Station (CFS) – Robust Infrastructure
Nava Sheva, Mumbai
Punjab Conware, Mumbai (O&M)
Chennai Vishakhapatnam Kochi Krishnapatnam
Area
• Plot area of~1,41,700sqmt;
• Paved area:87,000 sqmt;
• Coveredwarehousearea: 43,000sqmt
• Paved area60,000 sqmt
• 4 coveredwarehouses:36,000 sqmt
• Bondedwarehouse:5,120 sqmt
• Paved area:6,00,000 sqft
• Coveredwarehousearea: 70,000sqft
• Paved Area:60,000 sqmt
• Open yard foremptycontainer:4,000 sqmt
• Utra modernwarehouse:28,000 sqft
• Plot Area of~26,300 sqmt
• Covered areaof 13,500 sqftfor export andimport cargo
• Land area~93,000acres
• Paved area2,15,600 sqft
Capacity(TEU’s)
216,000 1,20,000 1,50,000 70,000 50,000 50,000
Warehouse Capacity(in Sq. mtr.)
~43,000 ~41,200 6,500 3,000 1,000 ~4,600
Bonded Warehouse
Yes Yes Yes No No Yes
Reefer Points Yes Yes Yes Yes Yes Yes
Services Offered
Handling1
Transportation2
Storage3
General / Bonded Warehousing4
Other Value Added Services5
29
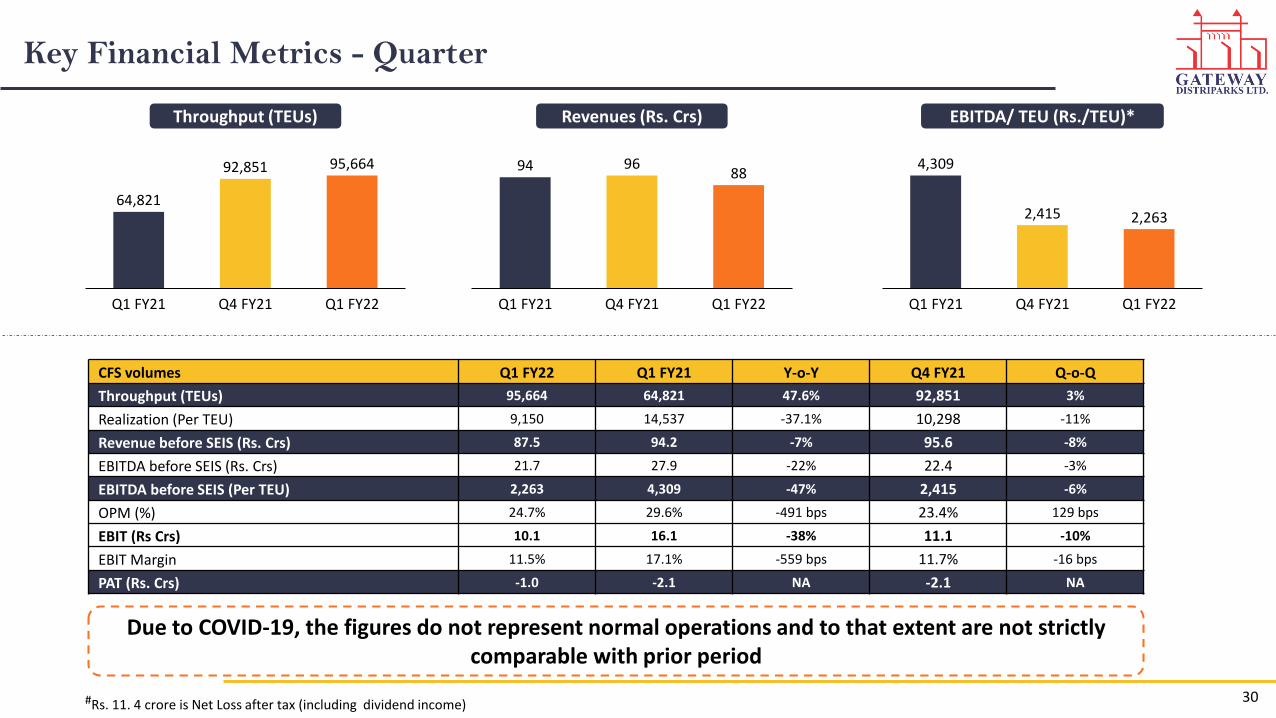
Key Financial Metrics - Quarter
CFS volumes Q1 FY22 Q1 FY21 Y-o-Y Q4 FY21 Q-o-Q
Throughput (TEUs) 95,664 64,821 47.6% 92,851 3%
Realization (Per TEU) 9,150 14,537 -37.1% 10,298 -11%
Revenue before SEIS (Rs. Crs) 87.5 94.2 -7% 95.6 -8%
EBITDA before SEIS (Rs. Crs) 21.7 27.9 -22% 22.4 -3%
EBITDA before SEIS (Per TEU) 2,263 4,309 -47% 2,415 -6%
OPM (%) 24.7% 29.6% -491 bps 23.4% 129 bps
EBIT (Rs Crs) 10.1 16.1 -38% 11.1 -10%
EBIT Margin 11.5% 17.1% -559 bps 11.7% -16 bps
PAT (Rs. Crs) -1.0 -2.1 NA -2.1 NA
64,821
92,851 95,664
Q1 FY21 Q1 FY22Q4 FY21
Throughput (TEUs)
94 9688
Q1 FY22Q1 FY21 Q4 FY21
Revenues (Rs. Crs)
4,309
2,415 2,263
Q1 FY21 Q4 FY21 Q1 FY22
EBITDA/ TEU (Rs./TEU)*
Due to COVID-19, the figures do not represent normal operations and to that extent are not strictly comparable with prior period
30#Rs. 11. 4 crore is Net Loss after tax (including dividend income)

Key Financial Metrics – FY21
CFS volumes FY21 FY20 Y-o-Y
Throughput (TEUs) 3,20,012 3,95,152 -19%
Realization (Per TEU) 11,357 9,326 22%
Revenue before SEIS (Rs. Crs) 363.5 368.5 -1%
EBITDA before SEIS (Rs. Crs) 101.0 82.1 23%
EBITDA before SEIS (Per TEU) 3,156 2,078 52%
OPM (%) 27.8% 22.3% 551 bps
EBIT before SEIS (Rs Crs) 54.8 40.3 36%
EBIT Margin (before SEIS) 15.1% 10.9% 415 bps
PAT (Rs. Crs) -17.6 23.7 NA
3,95,152
3,20,012
FY21FY20
Throughput (TEUs)
369 363
FY21FY20
Revenues (Rs. Crs)*
2,078
3,156
FY20 FY21
EBITDA/ TEU (Rs./TEU)*
Due to COVID-19, the figures do not represent normal operations and to that extent are not strictly comparable with prior period
*Excludes SEIS income Rs.54.8 Crores in 9MFY20 31#Rs. 13.6 crore is Net Loss after tax (including dividend income)
32
Snowman Logistics Ltd.

Service offerings
Warehousing
• 35 Temperature controlled warehouses
across 15 cities with separated chambers to
maintain different temperature ranges;
battery operated reach trucks used with
racking systems
• Temperature range: -25°C to +25°C degrees
• ERP based FIFO system
• FSSAI Compliant, EU Certified
• Fulfilment centres for eCommerce clients
• Large fleet of owned vehicles for dedicated
distribution to/from cold stores
• Coverage of 4,400+ outlets in over 500
towns & cities
• GPS enabled Tracking
• Remote temperature monitoring
• Handling Operations
• Stuffing & Destuffing of Containers
• Cargo Segregation, Sorting, Kitting & Repacking
• Grading, Labelling
• Shrink Wrapping
• Export Palletisation
• Blast Freezing upto -40°C
• Returns handling
• Retail Inventory Management with Just-In-Time Deliveries
• Customised solutions for customers
Distribution Value Added Services
33
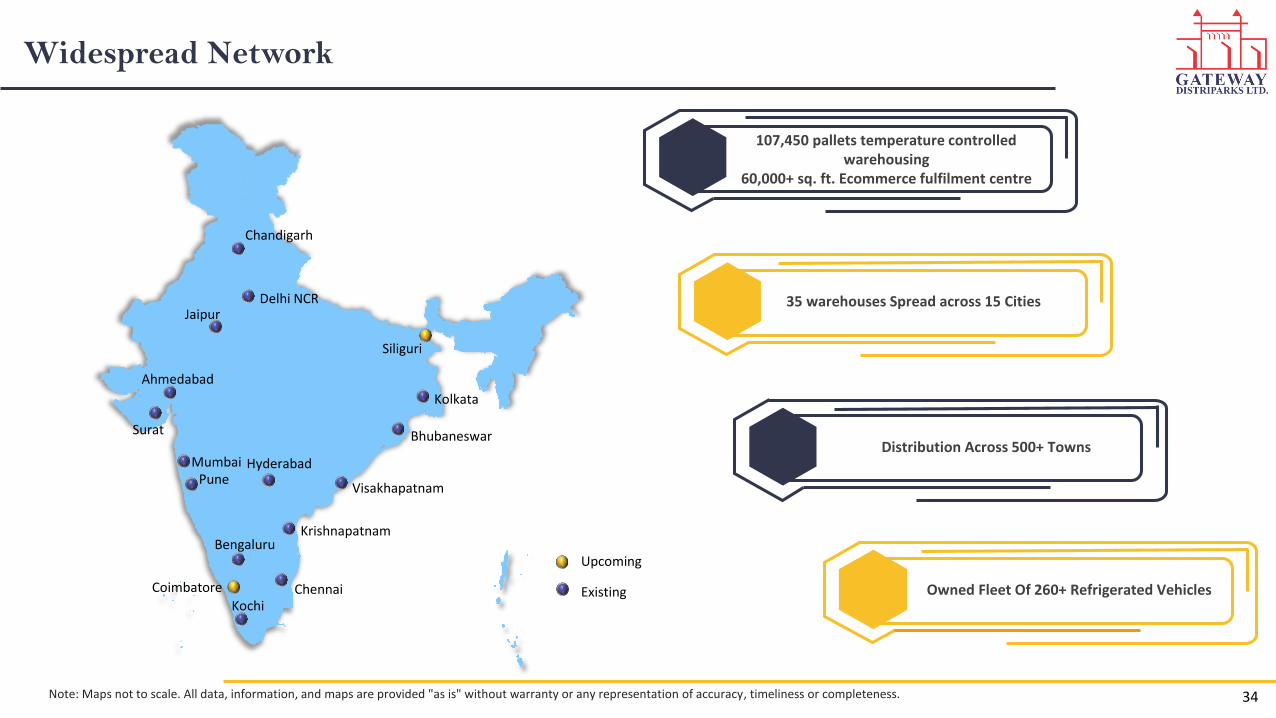
Widespread Network
Note: Maps not to scale. All data, information, and maps are provided "as is" without warranty or any representation of accuracy, timeliness or completeness.
107,450 pallets temperature controlled warehousing
60,000+ sq. ft. Ecommerce fulfilment centre
35 warehouses Spread across 15 Cities
Distribution Across 500+ Towns
Owned Fleet Of 260+ Refrigerated Vehicles
34
MumbaiPune
Surat
Ahmedabad
JaipurDelhi NCR
Chandigarh
Kochi
Bengaluru
Chennai
Krishnapatnam
Visakhapatnam
Bhubaneswar
Kolkata
Hyderabad
Siliguri
Coimbatore
Upcoming
Existing
Certifications
• Focus on Quality of Service
• Dedicated Quality Assurance team segregated into 4 regions
• App based walk-path checks conducted on daily basis & weekly basis by supervisors & branch managers
• Internal audits are conducted at every warehouse on a monthly basis
• Very Frequent External Audits
• Typically, more than 125 audits take place per year, both planned and unannounced
• Audits conducted from both professional quality certifying agencies as well as customers
• Quality Certifications
• All facilities certified with ISO 14001 (TUV-SUD), ISO22000 (TUV-SUD) and FSSAI
• In addition, specific locations have specialised certifications as required for various cargo profiles
• BRC (British Retail Consortium)
• EIA (Export Inspection Agency)
• MPEDA (Marine Products Export Development Authority)
• Drugs and Cosmetics Act, 1940
• Compliant with all International Guidelines, including:
• FSMS (Food Safety Management Systems)
• GWP (Good Warehousing Practice)
• GDP (Good Distribution Practice)
• Customs Rules and Regulations for bonded warehouses
• Other relevant industry standards
35

Varied category of products handled
c
PHARMACEUTICAL PRODUCTS
PROCESSED FOOD
FAST FOOD SUPPLY CHAIN
DAIRY PRODUCTS
SEAFOOD
MEAT
POULTRY
FRUITS
VEGETABLES
PHOTOFILMS/X-RAY
OTHER INDUSTRIAL GOODS
36
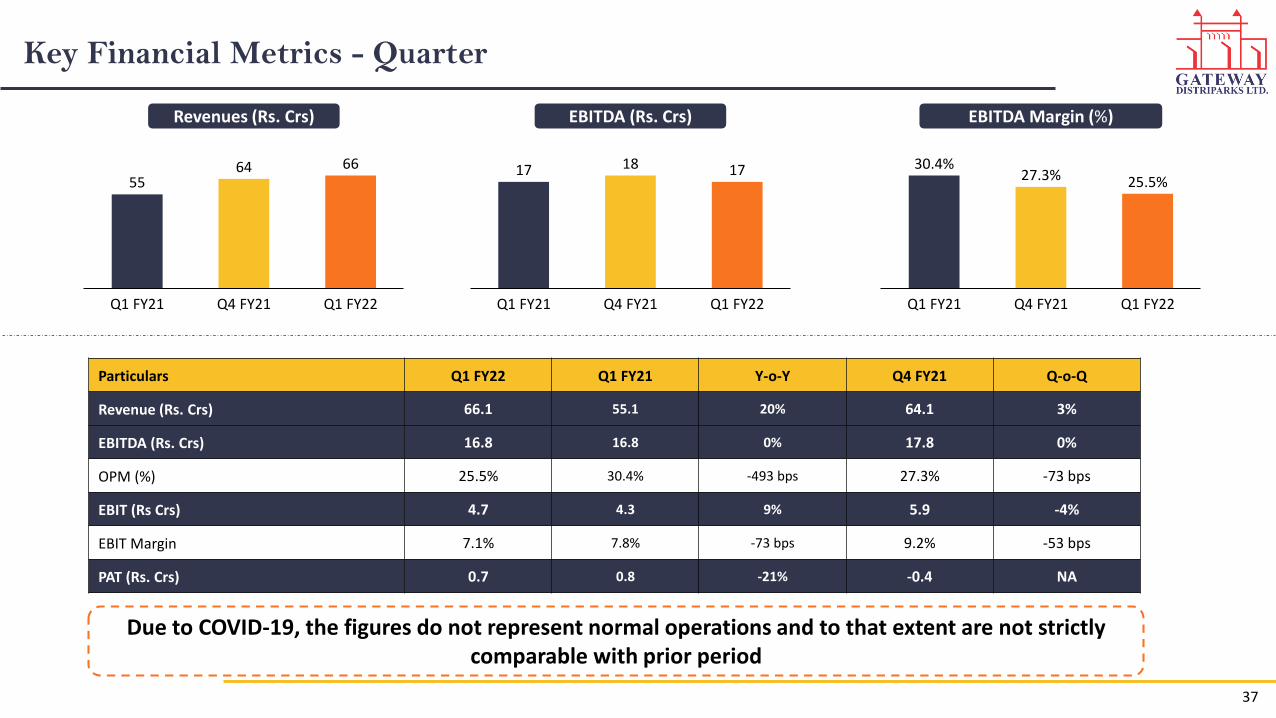
Key Financial Metrics - Quarter
5564 66
Q1 FY21 Q1 FY22Q4 FY21
Revenues (Rs. Crs)
17 18 17
Q1 FY22Q1 FY21 Q4 FY21
EBITDA (Rs. Crs)
27.3%
Q1 FY22Q1 FY21 Q4 FY21
25.5%30.4%
EBITDA Margin (%)
Particulars Q1 FY22 Q1 FY21 Y-o-Y Q4 FY21 Q-o-Q
Revenue (Rs. Crs) 66.1 55.1 20% 64.1 3%
EBITDA (Rs. Crs) 16.8 16.8 0% 17.8 0%
OPM (%) 25.5% 30.4% -493 bps 27.3% -73 bps
EBIT (Rs Crs) 4.7 4.3 9% 5.9 -4%
EBIT Margin 7.1% 7.8% -73 bps 9.2% -53 bps
PAT (Rs. Crs) 0.7 0.8 -21% -0.4 NA
Due to COVID-19, the figures do not represent normal operations and to that extent are not strictly comparable with prior period
37

Key Financial Metrics – FY21
240 237
FY21FY20
Revenues (Rs. Crs)
64 68
FY20 FY21
EBITDA (Rs. Crs)
FY21FY20
28.5%26.3%
EBITDA Margin (%)
Particulars FY21 FY20 Y-o-Y
Revenue (Rs. Crs) 237.1 240.2 -1%
EBITDA (Rs. Crs) 68.5 64.1 7%
OPM (%) 28.5% 26.3% 214 bps
EBIT (Rs Crs) 19.5 13.2 47%
EBIT Margin 8.2% 5.5% 271 bps
PAT (Rs. Crs) 0.1 -15.0 NA
Due to COVID-19, the figures do not represent normal operations and to that extent are not strictly comparable with prior period
38
Financial Performance
39
Due to COVID-19, the figures do not represent normal operations and to that extent are not
strictly comparable with prior period
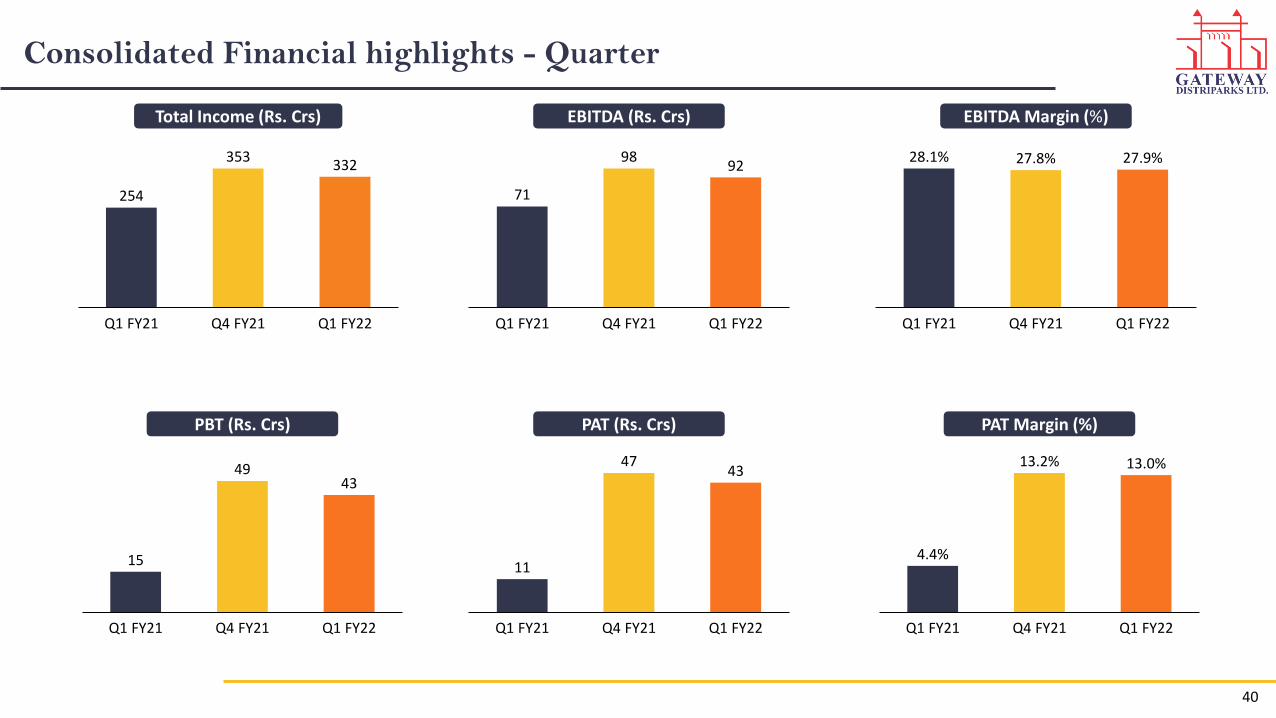
Consolidated Financial highlights - Quarter
254
353332
Q1 FY21 Q4 FY21 Q1 FY22
71
9892
Q1 FY21 Q4 FY21 Q1 FY22
27.9%
Q1 FY22Q4 FY21Q1 FY21
28.1% 27.8%
EBITDA Margin (%)
13.0%
Q1 FY21 Q4 FY21 Q1 FY22
4.4%
13.2%
PAT Margin (%)
11
4743
Q1 FY21 Q4 FY21 Q1 FY22
15
4943
Q1 FY21 Q4 FY21 Q1 FY22
Total Income (Rs. Crs) EBITDA (Rs. Crs)
PAT (Rs. Crs)PBT (Rs. Crs)
40
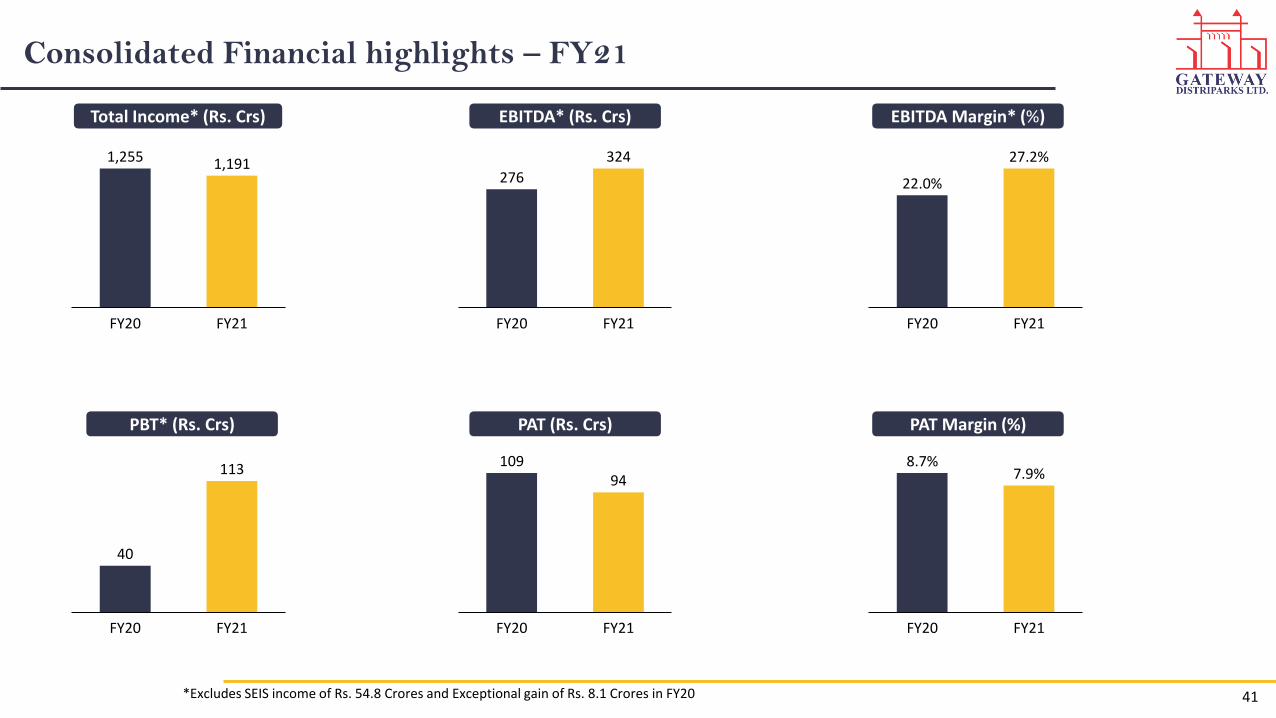
Consolidated Financial highlights – FY21
1,255 1,191
FY21FY20
276
324
FY21FY20
27.2%
FY20
22.0%
FY21
EBITDA Margin* (%)
7.9%
FY20 FY21
8.7%
PAT Margin (%)
10994
FY20 FY21
40
113
FY21FY20
Total Income* (Rs. Crs) EBITDA* (Rs. Crs)
PAT (Rs. Crs)PBT* (Rs. Crs)
*Excludes SEIS income of Rs. 54.8 Crores and Exceptional gain of Rs. 8.1 Crores in FY20 41

Consolidated Profit & Loss Statement
Particulars (Rs. Crs) Q1 FY22 Q1 FY21 Y-o-Y Q4 FY21 Q-o-Q
Revenue from Operations before SEIS Income 329.6 252.8 30% 350.3 -6%
Other Income 2.7 1.5 2.9
Total Income before SEIS Income 332.2 254.3 31% 353.1 -6%
Operating Expenses 203.3 144.5 210.9
Employee Expenses 15.8 12.6 20.9
Other Expenses 21.4 25.8 23.2
EBITDA before SEIS Income 91.8 71.4 29% 98.1 -6%
EBITDA Margin (%) 27.9% 28.1% -22 bps 27.8% 6 bps
Depreciation 32.5 33.4 32.1
EBIT before SEIS Income 59.3 38.0 56% 66.0 -10%
Finance Cost 16.0 23.0 17.4
Share of Profit/ (Loss) from Associate or JV 0.0 0.0 0.0
Profit before Tax before Exceptional Items & SEIS Income 43.4 15.0 188% 48.7 -11%
Profit before Tax Margin (%) 13.1% 5.9% 714 bps 13.8% -73 bps
Exceptional Gain / (Expenses) 0.0 0.0 0.0
SEIS Income 0.0 0.0 0.0
Profit before Tax 43.4 15.0 188% 48.7 -11%
Profit before Tax Margin (%) 13.1% 5.9% 714 bps 13.8% -73 bps
Tax 0.0 3.9 2.2
Profit After Tax 43.3 11.1 290% 46.5 -7%
PAT Margin (%) 13.0% 4.4% 867 bps 13.2% -12 bps
Share of net loss from profit / (Loss) associate accounted for using the equity method
0.3 0.3 -0.3
PAT for the period 43.6 11.5 281% 46.2 -5%
42
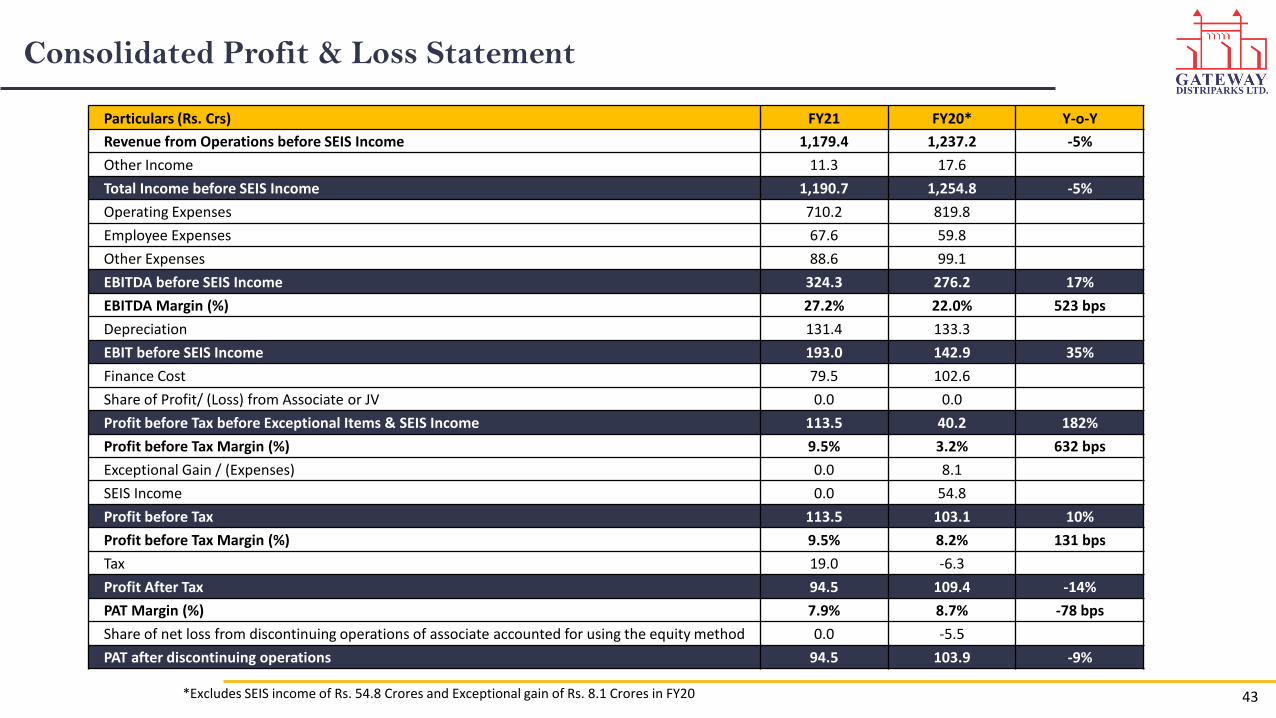
Consolidated Profit & Loss Statement
Particulars (Rs. Crs) FY21 FY20* Y-o-Y
Revenue from Operations before SEIS Income 1,179.4 1,237.2 -5%
Other Income 11.3 17.6
Total Income before SEIS Income 1,190.7 1,254.8 -5%
Operating Expenses 710.2 819.8
Employee Expenses 67.6 59.8
Other Expenses 88.6 99.1
EBITDA before SEIS Income 324.3 276.2 17%
EBITDA Margin (%) 27.2% 22.0% 523 bps
Depreciation 131.4 133.3
EBIT before SEIS Income 193.0 142.9 35%
Finance Cost 79.5 102.6
Share of Profit/ (Loss) from Associate or JV 0.0 0.0
Profit before Tax before Exceptional Items & SEIS Income 113.5 40.2 182%
Profit before Tax Margin (%) 9.5% 3.2% 632 bps
Exceptional Gain / (Expenses) 0.0 8.1
SEIS Income 0.0 54.8
Profit before Tax 113.5 103.1 10%
Profit before Tax Margin (%) 9.5% 8.2% 131 bps
Tax 19.0 -6.3
Profit After Tax 94.5 109.4 -14%
PAT Margin (%) 7.9% 8.7% -78 bps
Share of net loss from discontinuing operations of associate accounted for using the equity method 0.0 -5.5
PAT after discontinuing operations 94.5 103.9 -9%
43*Excludes SEIS income of Rs. 54.8 Crores and Exceptional gain of Rs. 8.1 Crores in FY20
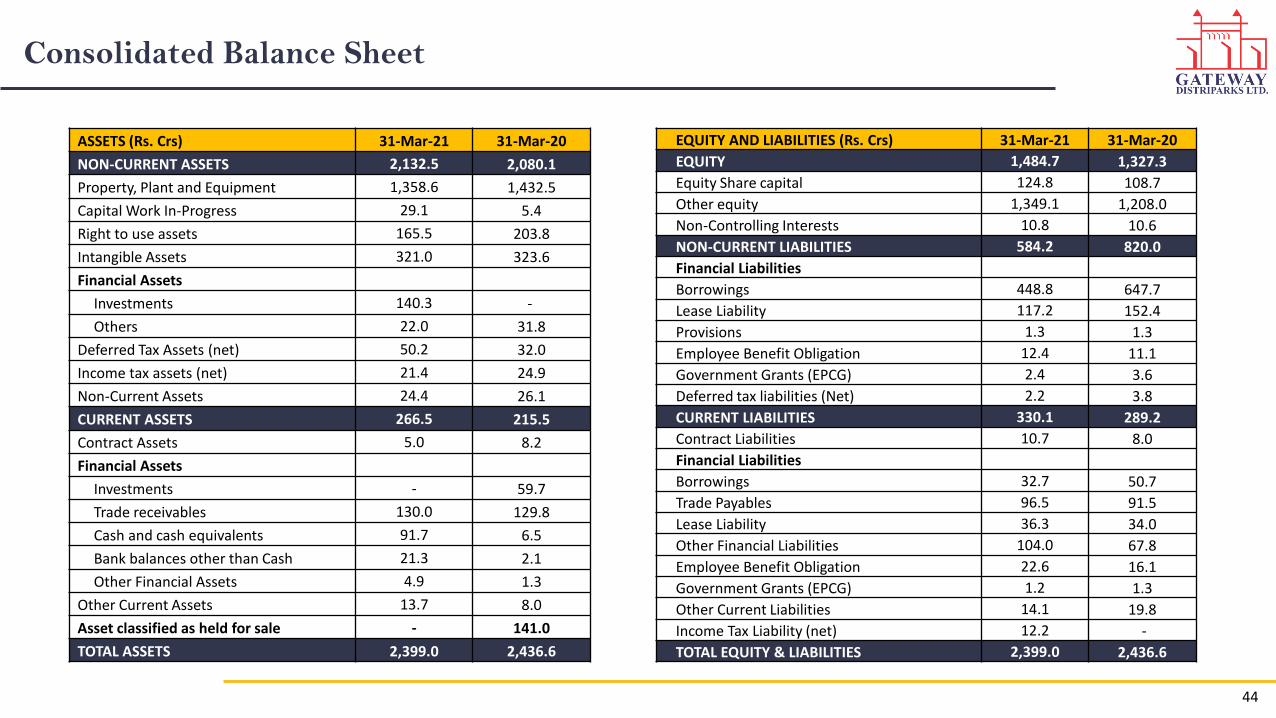
Consolidated Balance Sheet
44
ASSETS (Rs. Crs) 31-Mar-21 31-Mar-20
NON-CURRENT ASSETS 2,132.5 2,080.1
Property, Plant and Equipment 1,358.6 1,432.5
Capital Work In-Progress 29.1 5.4
Right to use assets 165.5 203.8
Intangible Assets 321.0 323.6
Financial Assets
Investments 140.3 -
Others 22.0 31.8
Deferred Tax Assets (net) 50.2 32.0
Income tax assets (net) 21.4 24.9
Non-Current Assets 24.4 26.1
CURRENT ASSETS 266.5 215.5
Contract Assets 5.0 8.2
Financial Assets
Investments - 59.7
Trade receivables 130.0 129.8
Cash and cash equivalents 91.7 6.5
Bank balances other than Cash 21.3 2.1
Other Financial Assets 4.9 1.3
Other Current Assets 13.7 8.0
Asset classified as held for sale - 141.0
TOTAL ASSETS 2,399.0 2,436.6
EQUITY AND LIABILITIES (Rs. Crs) 31-Mar-21 31-Mar-20
EQUITY 1,484.7 1,327.3
Equity Share capital 124.8 108.7
Other equity 1,349.1 1,208.0
Non-Controlling Interests 10.8 10.6
NON-CURRENT LIABILITIES 584.2 820.0
Financial Liabilities
Borrowings 448.8 647.7
Lease Liability 117.2 152.4
Provisions 1.3 1.3
Employee Benefit Obligation 12.4 11.1
Government Grants (EPCG) 2.4 3.6
Deferred tax liabilities (Net) 2.2 3.8
CURRENT LIABILITIES 330.1 289.2
Contract Liabilities 10.7 8.0
Financial Liabilities
Borrowings 32.7 50.7
Trade Payables 96.5 91.5
Lease Liability 36.3 34.0
Other Financial Liabilities 104.0 67.8
Employee Benefit Obligation 22.6 16.1
Government Grants (EPCG) 1.2 1.3
Other Current Liabilities 14.1 19.8
Income Tax Liability (net) 12.2 -
TOTAL EQUITY & LIABILITIES 2,399.0 2,436.6
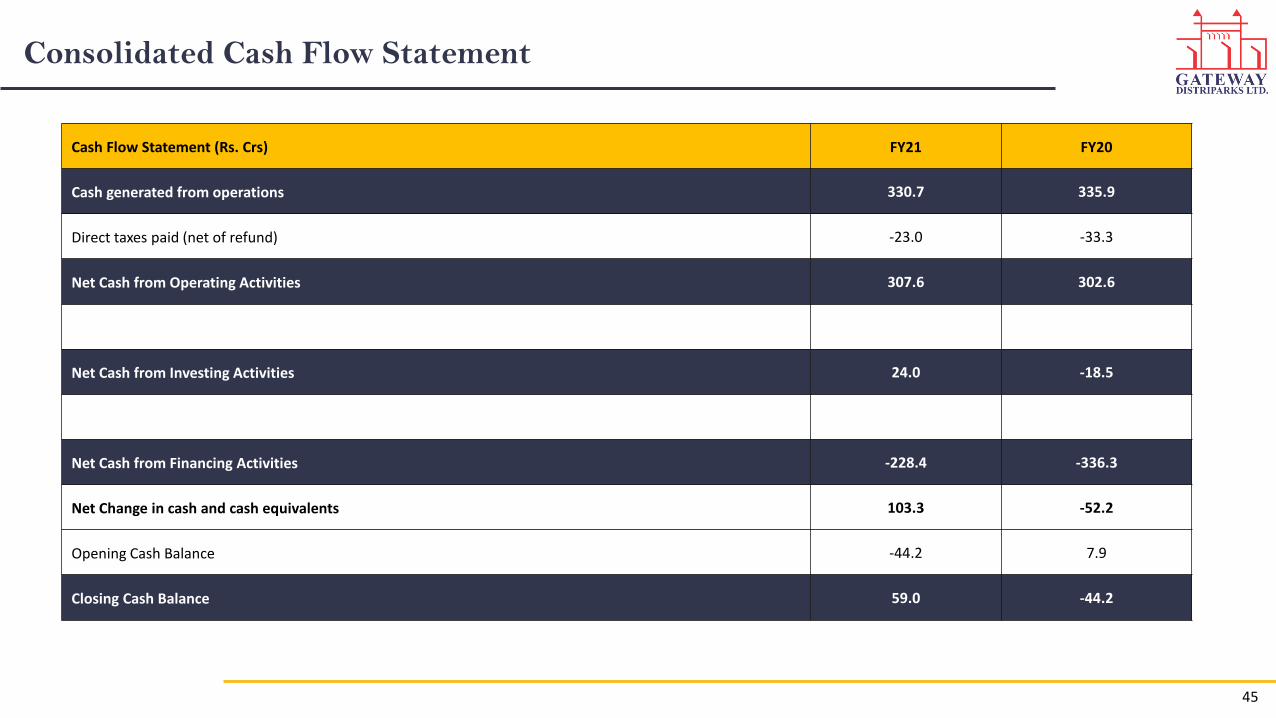
Consolidated Cash Flow Statement
Cash Flow Statement (Rs. Crs) FY21 FY20
Cash generated from operations 330.7 335.9
Direct taxes paid (net of refund) -23.0 -33.3
Net Cash from Operating Activities 307.6 302.6
Net Cash from Investing Activities 24.0 -18.5
Net Cash from Financing Activities -228.4 -336.3
Net Change in cash and cash equivalents 103.3 -52.2
Opening Cash Balance -44.2 7.9
Closing Cash Balance 59.0 -44.2
45
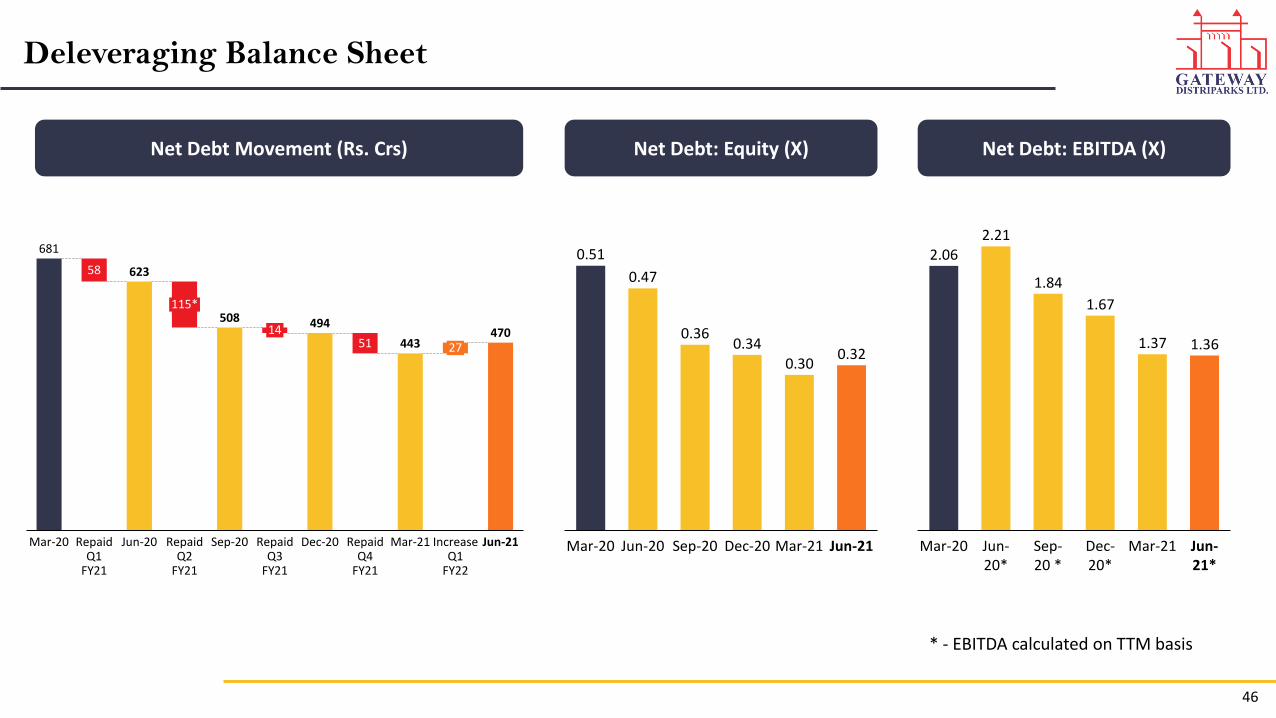
Deleveraging Balance Sheet
Net Debt Movement (Rs. Crs)
681
623
508 494
443470
58
5114
Mar-20
115*
Repaid Q1
FY21
Jun-20 Repaid Q2
FY21
Repaid Q3
FY21
Dec-20Sep-20 Repaid Q4
FY21
Mar-21
27
Increase Q1
FY22
Jun-21
0.51
0.47
0.360.34
0.300.32
Dec-20Mar-20 Jun-20 Sep-20 Jun-21Mar-21
Net Debt: Equity (X) Net Debt: EBITDA (X)
2.062.21
1.84
1.67
1.37 1.36
Mar-21Mar-20 Jun-20*
Sep-20 *
Dec-20*
Jun-21*
* - EBITDA calculated on TTM basis
46

Gross Debt Payment Schedule
65
280
50
55
55
55
24
183
39
59
46
28
Jun-21*
9
3
Repayment FY23
12
Repayment FY22 Repayment FY25Repayment FY24
10
Repayment FY26
1
Repayment FY27
48
121
104
84
66
66
Term Loan Vehicle loan NCD487
Rs. Crs
* - Excluding Cash Credit and Others** - NCD due of Rs. 20 Crores in FY22 already repaid on 7th April 2021
47
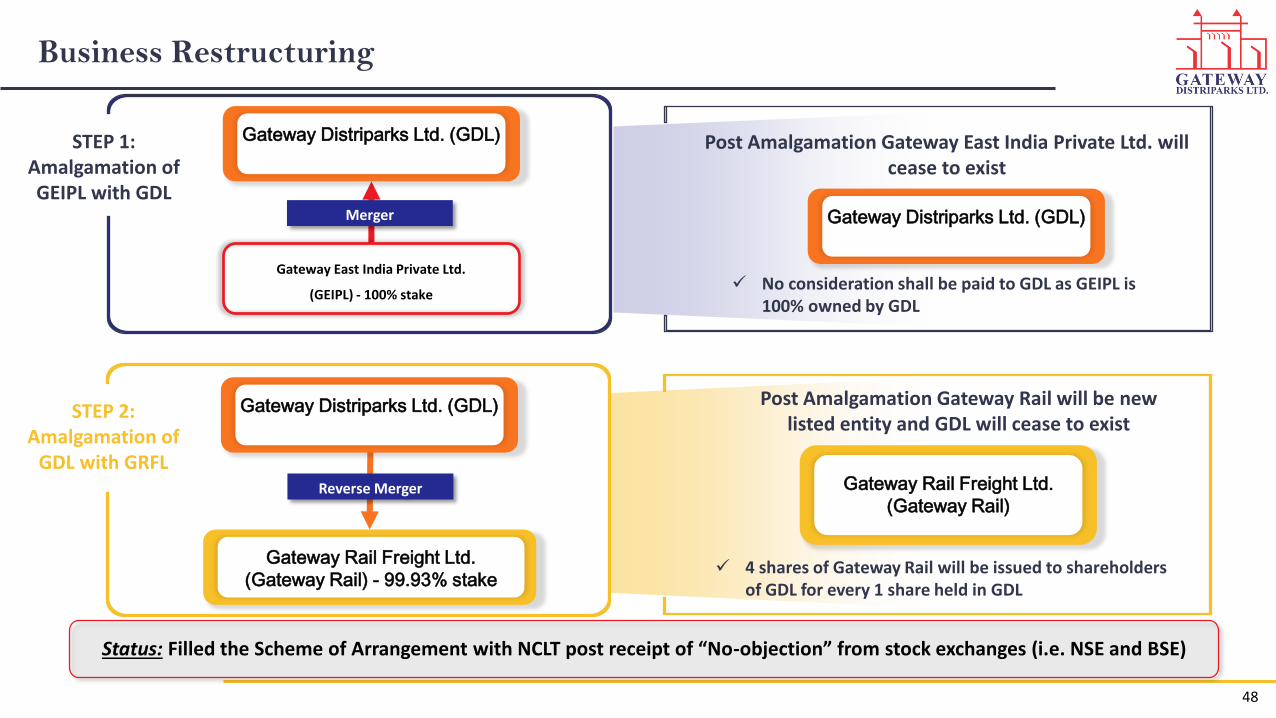
Business Restructuring
48
Merger
Gateway Distriparks Ltd. (GDL)
Gateway East India Private Ltd.
(GEIPL) - 100% stake
STEP 1:Amalgamation of GEIPL with GDL
Reverse Merger
STEP 2:Amalgamation of
GDL with GRFL
Gateway Rail Freight Ltd.
(Gateway Rail) - 99.93% stake 4 shares of Gateway Rail will be issued to shareholders
of GDL for every 1 share held in GDL
Gateway Distriparks Ltd. (GDL)
Gateway Distriparks Ltd. (GDL)
No consideration shall be paid to GDL as GEIPL is 100% owned by GDL
Post Amalgamation Gateway Rail will be new listed entity and GDL will cease to exist
Gateway Rail Freight Ltd.
(Gateway Rail)
Post Amalgamation Gateway East India Private Ltd. will cease to exist
Status: Filled the Scheme of Arrangement with NCLT post receipt of “No-objection” from stock exchanges (i.e. NSE and BSE)
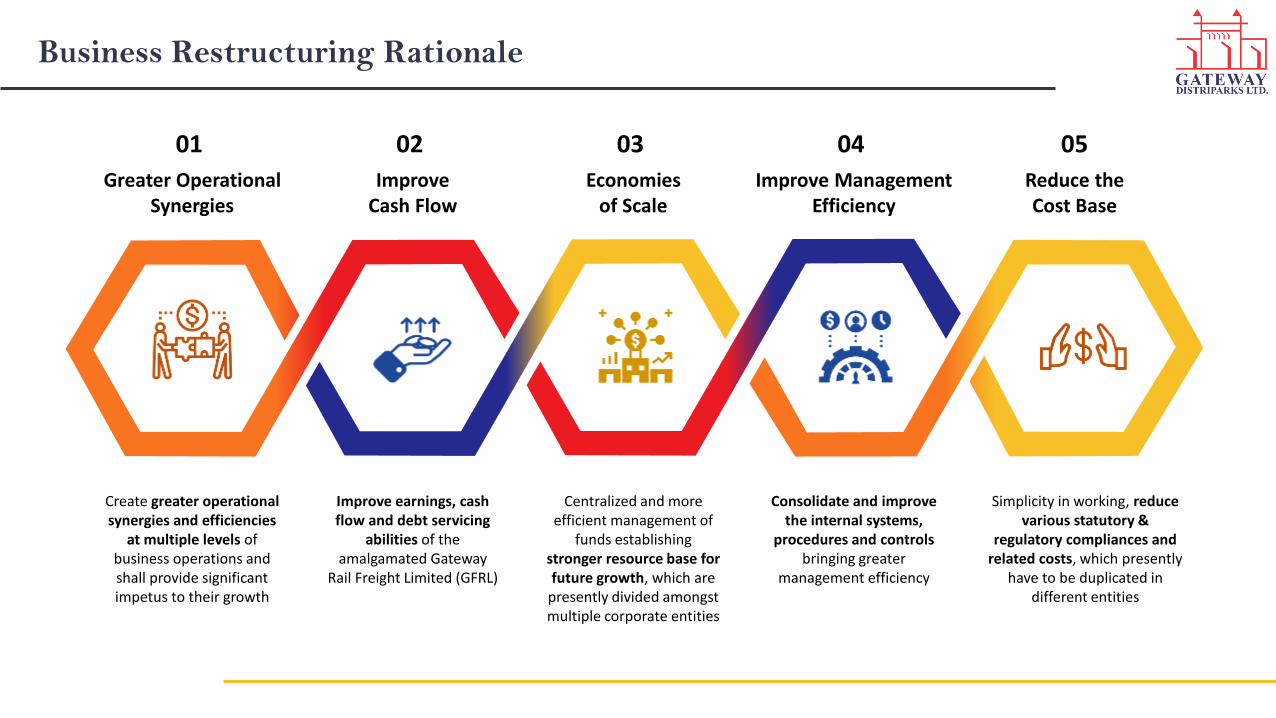
Business Restructuring Rationale
Greater Operational Synergies
Create greater operational synergies and efficiencies
at multiple levels of business operations and shall provide significant impetus to their growth
01
Improve Cash Flow
Improve earnings, cash flow and debt servicing
abilities of the amalgamated Gateway
Rail Freight Limited (GFRL)
02
Economies of Scale
Centralized and more efficient management of
funds establishing stronger resource base for future growth, which are
presently divided amongst multiple corporate entities
03
Improve Management Efficiency
Consolidate and improve the internal systems,
procedures and controls bringing greater
management efficiency
04
Reduce the Cost Base
Simplicity in working, reduce various statutory &
regulatory compliances and related costs, which presently
have to be duplicated in different entities
05

Financial Trends
* - Incl. Other Income; ** - Before Exceptional Item; ^ - Standalone + Gateway East India Pvt. Ltd. + Gateway Distriparks (Kerala) Ltd.
GatewayRail Freight Limited(GatewayRail)
743 763 789867 869
816
156 152 174 211 188 221
83 75 98139
87 119
FY16 FY17 FY18 FY19 FY20 FY21
Revenue
EBITDA*
PBT**
Gateway Distriparks
Limited^
387 386 387418 417
363
140118 106
155192
103
11086
66
111
63 -6
FY16 FY17 FY18 FY19 FY20 FY21
Revenue
EBITDA*
PBT**
50

Company : Investor Relations Advisors :
Gateway Distriparks Limited CIN - L74899MH1994PLC164024
Mr. Sandeep Kumar [email protected]
www.gateway-distriparks.com
Strategic Growth Advisors Pvt. Ltd.CIN - U74140MH2010PTC204285
Mr. Jigar Kavaiya / Mr. Parin [email protected] / [email protected]+91 9920602034 / +91 9930025733
www.sgapl.net
For further information, please contact
51