Embed Size (px)
Citation preview

The Agribusiness Project (TAP) Under Sub Agreement UAP-ISC-012-001-CNFA
Apricot
Value Chain Assessment Final Report
for the
Agribusiness Project
Adam Sendall
Masood Mir
Abdul Khabir
28th March, 2013
Submitted to:
CNFA, Inc.
1828 L Street, NW, Suite 710
Washington, DC 20036
202-296-3920 (tel)
202-296-3948 (fax)
www.cnfa.org
DISCLAIMER This study is made possible by the generous support of the American people through the United
States Agency for International Development (USAID). The contents are the responsibility of the
author and do not necessarily reflect the views of USAID or the United States Government.

Page 2 of 58
Acronyms & Abbreviations
ADB Asian Development Bank
AKRSP Aga Khan Rural Support Project
BDS Business Development Services
DoA Department of Agriculture
FEG Farmer Enterprise Groups
FTA Free Trade Area
GB Gilgit-Baltistan
GDP Gross Domestic Product
GI Geographical Indication
GoP Government of Pakistan
HACCP Hazard Analysis and Critical Control Points
IMAP International Markets Access Programme
ITC International Trade Centre
KKH Karakoram Highway
MARC Mountain Agricultural Research Council
m asl metres above sea level
MAFFA Mountain Area Fruit Farmer Association
NAASD Northern Areas Strategy for Sustainable Development
PKR Pakistan Rupee
PPP Public Private Partnerships
SAFTA South Asian Free Trade Area
SESGBC Socio-Economic Survey of Gilgit-Baltistan and Chitral
SESNAC Socio-Economic Survey of Northern Areas and Chitral
TA Technical Assistance
USAID United States Agency for International Development
VCP Value Chain Platforms
Exchange rate used: US$1 = PKR95
Page 3 of 58
Table of Contents
EXECUTIVE SUMMARY ....................................................................................................... 4
1.0 INTRODUCTION & OBJECTIVES .............................................................................. 6
1.1 The Agribusiness Project ............................................................................................ 6
1.2 Value-Chain Analysis of the Apricot Sector ............................................................... 6
2.0 METHODOLOGY ......................................................................................................... 6
3.0 BACKGROUND ............................................................................................................ 7
3.1 The Global Context ..................................................................................................... 7
3.2 The Pakistan Apricot Sector ........................................................................................ 7
3.3 The GB Apricot Supply Chain .................................................................................... 9
3.3.1 Spatial and volume commodity flows.................................................................. 9
3.3.2 Institutional commodity flows ........................................................................... 11
4.0 APRICOT SECTOR PERFORMANCE EVALUATION............................................ 13
4.1 Enabling Environment............................................................................................... 13
4.2 Production Segment .................................................................................................. 14
4.3 Processing Segment................................................................................................... 17
4.4 Trading Segment ....................................................................................................... 20
4.5 Summary Performance Evaluation............................................................................ 22
5.0 RECOMMENDATIONS .............................................................................................. 24
6.0 TIMELINE & BUDGET .............................................................................................. 28
ANNEXES
A Documents Reviewed
B Persons Met
C Performance Scoring Matrix
D Detailed Background Information

Page 4 of 58
EXECUTIVE SUMMARY
The objective of appraising the apricot value chain is to recommend specific interventions for
funding by the Agribusiness Project to strengthen the entire apricot sector and support
achievement of the project’s overall goal of broad-based economic growth, employment and
poverty alleviation through increased competitiveness of the horticulture value chain.
Interventions are expected to focus on integrating smallholder apricot producers into
commercial value chains and be driven by food processing and value-addition for all apricot
products.
Although Pakistan is a leading producer of apricot, most are consumed domestically and only
a minor proportion is exported fresh or dried. Global market trends for apricot include an
increasing trade in fresh fruit, whilst trade in dried apricot is stagnating. Nonetheless, there is
increased interest in dried apricot as an ingredient in health foods such as breakfast muesli
and cereal/fruit bars. Linked to the health factor is the use of organic certification as a
marketing tool.
Gilgit-Baltistan and Balochistan are the main apricot growing regions in Pakistan. This study
focused upon Gilgit-Baltistan. Located in the north, the region is isolated, the population
small and dispersed, the terrain harsh and weather conditions variable. Only 1% of the land
area is cultivated and average farm size is less than 1ha. Farming systems are subsistence
oriented; however, apricots make a significant contribution to on-farm incomes. Due to the
high perishability of apricot and distance from market, the majority of the harvest is dried on-
farm and sold through wholesalers in auction markets down-country. Quality is generally
poor and value low.
The appraisal judged the overall performance of the apricot sector as positive, although the
business environment was having a mixed enabling affect upon sector performance. Whilst
regulatory factors such as taxation and licensing were favourable, market related factors such
as infrastructure, market information and standards were unfavourable. As the Department of
Agriculture receives a tiny proportion of the Annual Development Budget, sector support
programmes are reliant upon donor funding.
Several performance constraints were identified in the production, processing and trading
components of the value chain, specifically with the technology, market structure and
availability of input ‘drivers’. These included the lack of improved commercial apricot
cultivars to produce high quality marketable fruit and the absence of packaging, cold storage
and refrigerated transport for trading in the high-value fresh apricot market. The export of
quality processed apricot products to overseas buyers has started on a small-scale; however,
creating additional export market linkages and satisfying quality standards is proving
challenging for processors. Recommendations to improve performance of the apricot sector
in Gilgit-Baltistan include the following:
1. Introduce, propagate and distribute improved commercial cultivars.
Improved commercial cultivars suitable for the fresh and dried market will first be identified.
It is then proposed to develop a strategy with the Mountain Agricultural Research Council in
Gilgit to rapidly propagate and distribute the improved varieties amongst clusters of Farmer
Enterprise Groups. This may include establishing a central clonal garden in Gilgit and
upgrading the Department of Agriculture nurseries in the target districts to bud/graft and

Page 5 of 58
propagate the improved apricot seedlings. To fast-track the process it is recommended some
budding/grating take place immediately, directly onto target farmers’ existing apricot trees.
2. Improve orchard management and on-farm processing skills of apricot producers.
Several major changes are required to upgrade current apricot production into a
commercially-oriented supply chain. Clusters of Farmer Enterprise Groups will be
established and trained on improved orchard management and post-harvest techniques.
Depending on whether the groups will be supplying the fresh or dried apricot market, shared
washing, grading, packing lines or drying equipment (e.g. solar tunnels) will be provided to
the clusters and located in central locations. The groups will be linked to processors and
traders, as described below.
3. Support product development for processed apricots.
Apricot can be used as a flavour ingredient in processed foods such as cereal/fruit bars,
yoghurts, ice-cream and cheese. Dried apricot can be packaged into small heat-sealed bags as
a healthy ready-to-eat snack. Lesser quality apricot can be processed into jams and juices. Oil
can be made from the discarded kernel of dried apricots. However, opportunities for product
development are largely limited to improving the quality, packaging and marketing of dried
apricot. Activities will include funding new product development, exposure trips to other
apricot processors, training and certification in food safety and quality management systems
(e.g. HAACP, ISO 22000) and gaining organic and Geographical Indication certification.
4. Promote market linkages for quality processed apricot (domestic and export).
The value-chain assessment concluded the least performing driver of the processing segment
was market structure, i.e. the number of processors and number of buyers. Processors found it
difficult to engage overseas buyers due to their small size and distance from market. It is
proposed to establish a Gilgit-Baltistan Fruit Processor Association as a platform for
promoting processed apricot products to high-value markets domestically and overseas. A
marketing strategy will be developed and may include carrying out trade missions and
attending trade fairs.
5. Develop cold-chain infrastructure for fresh fruit trading in Gilgit.
Gilgit is a hub for temperate fruit production in Pakistan (apricot, apple, grapes, pears,
peaches, cherry, etc.) and fresh fruit commands the highest prices. Construction of the
Karakoram Highway and improvements in storage and transport technologies now offers
opportunities for fresh fruit from Gilgit to be sold in down-country supermarkets and
exported to Dubai. A major strategic decision is whether to invest in a wholesale market or
support individual traders in Gilgit. Whilst a wholesale market has the potential to benefit
more stakeholders, individual traders are more likely to manage the investment sustainably.
Establishing a cold chain will firstly require providing washing, grading and packing
facilities to clusters of fruit producers. A central cold store in Gilgit town will then be
required to chill the fruit before transporting down-country in small refrigerated vans.
Establishing fresh fruit supply chains will require considerable work establishing producer
organisations and improving post-harvest skills. Consequently, this activity can only be
initiated after orchard management and on-farm processing skills of fruit producers have been
improved, as described above.
A tentative work plan has been developed for implementing the proposed interventions over
the next three and a half years, with an estimated budget of US$1,250,000.

Page 6 of 58
1.0 INTRODUCTION & OBJECTIVES
1.1 The Agribusiness Project The Agribusiness Project is a five-year project that commenced in November 2011, funded
by USAID and implemented by the Agribusiness Support Fund. The overall goal of the
project is to support improved conditions for broad-based economic growth, create
employment opportunities and contribute towards poverty alleviation through increased
competitiveness of horticulture and livestock value chains. The objectives of the project are
to:
strengthen the capacity in horticulture and livestock value chains to increase sales to
domestic and foreign markets;
strengthen the capacity of smallholders and farmer enterprises to operate
autonomously and effectively; and,
increase agriculture efficiency and productivity through adoption of new farming
techniques and technological innovation among targeted beneficiaries.
The project activities are organised into the following two components:
Technical Assistance (TA) for Capacity Building and Programme Support
Partnership Window Cost-Sharing Grants.
1.2 Value-Chain Analysis of the Apricot Sector The objective of appraising the apricot sector is to recommend specific interventions for
funding by the project to strengthen the entire apricot sector and support achievement of the
project’s overall objectives, as described above. The interventions will focus on integrating
smallholder apricot producers into commercial value chains and be driven by food processing
and value-addition for all apricot products.
2.0 METHODOLOGY
The methodology used during this assessment is based upon the rapid appraisal methodology
developed by the Food and Agriculture Organisation as described in the manual ‘Guidelines
for Rapid Appraisals of Agrifood Chain Performance in Developing Countries’.1 The
appraisal maximised the use of pre-existing studies and secondary data. Information gaps
were filled by a field visit to Gilgit-Baltistan, an apricot producing region in Pakistan, where
interviews were held with apricot farmers, traders, processors and exporters. Further
interviews were held with apricot traders in Islamabad. Documents reviewed and persons met
during the course of the appraisal are presented in Annexes A and B respectively.
To evaluate value chain performance, a ‘Performance Scoring Matrix’ is developed based
upon the major performance drivers. The six main performance drivers are: i) enabling
environment, ii) technology, iii) market structure, iv) coordination, v) firm management, and
vi) availability of inputs. Each ‘driver’ is made up of a cluster of constituting elements of
‘sub-factors’. For example, the ‘Enabling Environment’ driver will include elements of
policy, taxation, infrastructure, access to finance, trade agreements, etc. Each sub-factor is
then assessed for each segment of the chain, e.g. production, processing, trading.
1 Da Silva & Souza Filho (2007) Agricultural Management, Marketing and Finance Occasional Paper No 20,
FAO Rome.

Page 7 of 58
The relevance of each sub-factor is qualitatively evaluated by using a ‘Likert’ scale. The
judgment ranges from ‘Very Favourable’, when there is a significant positive contribution of
the sub-factor, to ‘Very Unfavourable’, when there are bottlenecks or even barriers to reach
or sustain performance. Intermediate conditions are classified as ‘Neutral’.
Each sub-factor is weighted with a value that indicates its capacity to influence the
performance driver to which it belongs. The column ‘Relevance’ is multiplied by the column
‘Weight’ to give an overall evaluation for each performance driver. The detailed Performance
Scoring Matrix for apricot is presented in Annex C. A synthesis of the matrix is presented
graphically as a means of drawing main conclusions in Section 4.
3.0 BACKGROUND
3.1 The Global Context Global apricot production is estimated at 3.8 million tonnes. Turkey is the world’s largest
producer, growing 676,000 tonnes of fresh apricot in 2011.2 The majority of apricots are
consumed in producing countries and approximately only 7% of production is traded (ITC).
The largest volumes of apricot exports are traded fresh. Fresh apricot exports have steadily
increased by 21% from 2008 to 2011. Although France is only the world’s seventh largest
producer of apricots, in 2011 it exported 31% of its harvest, which is 19% of total world
exports, making it the global leader. Correspondingly, fresh apricot imports have also
increased. Russia is the world’s leading importer, importing 24% of all fresh apricot traded
(ITC).
Although worth more in value than fresh apricot, dried apricot exports have slightly
decreased since 2008. As well as being the world’s largest producer of apricots, Turkey is the
leading exporter of dried apricots, exporting 62% of all world exports in 2011. Previously
Russia was the world’s largest importer; however, most recent statistics show imports more
than halved in 2011. Also, Kazakhstan rose from being a minor importer to a world leader in
the same year (ITC). Further detailed information on trade flows is presented in Annex D.
3.2 The Pakistan Apricot Sector
Production
Pakistan produces approximately 300,000 tonnes of fresh apricot, making it the world’s
fourth largest producer.3 Gilgit Baltistan (GB) and Balochistan are the two main apricot
growing regions in Pakistan, with GB alone producing 114,286 tonnes in 2007. Table 1
shows area planted and production in GB by district. Planting density is only 230 trees/ha,
which is much less than the recommended 750 trees/ha, due to apricots being planted around
field edges, rather than orchards. Average yields of fresh fruit are 38kg/tree which are good
considering the limited use of inputs, although yields of 50kg/tree can be achieved through
improved management.
2 FAOSTAT
3 Pakistan Bureau of Statistics and Northern Area Agricultural Statistics 2007

Page 8 of 58
Table 1: Apricot Production in GB (2007)
District Area Planted
(ha)
Production
(MT)
Gilgit 1,201 9,169
Hunza/Nagar 1,790 21,156
Ghizer 1,475 14,491
Astore 560 2,932
Diamer 537 1,194
Skardu 4,871 40,649
Ghanche 2,487 22,723
Total 12,921 114,286
Source: Northern Areas Agriculture Statistics 2007, DoA, Gilgit
Area planted and production is highest in Skardu and Ghanche districts, whilst production is
also high in Hunza/Nagar district. Astore and Diamer are the two lowest producing districts.
Figure 1 shows that 46% of the total apricot harvest is wasted, 49% are dried and 5% are
eaten fresh. For both fresh and dried apricot, roughly 40% is consumed at home and 60%
sold.
The structure of the apricot sector in GB reflects the previous geographical isolation from
markets, prior to construction of the Karakoram Highway (KKH). Most of the apricot trees
have been propagated by farmers themselves from a wide variety of naturally growing
cultivars indigenous to the area. This has resulted in much of the harvest being low quality,
unmarketable varieties and explains the high level of wastage. Furthermore, the limited local
market meant only enough apricot was harvested to satisfy local needs, with the remainder
being left to waste. Due to the seasonality of production and perishability of fresh apricot,
post-harvest drying became necessary for consumption at a later date.
Figure 1: Apricot Use
Source: Northern Areas Agriculture Statistics 2007, DoA, Gilgit
Trade
Exports of fresh apricot from Pakistan have decreased considerably since 2007, when
significantly more apricots were exported to UK and the Middle East (Saudi Arabia, Bahrain
and United Arab Emirates). In 2011, India, UK and USA accounted for 56% of exports.
Waste 46%
Fresh 5%
Dried 49%

Page 9 of 58
Pakistan is a very small fresh apricot exporter and accounts for only 0.06% of total world
exports (ITC).
Pakistan exports a larger amount of dried apricot than fresh apricot, with 51% exported to
Germany, UK and India in 2011. Nonetheless, exports of dried apricot have declined by 11%
since 2007. Pakistan is a very small dry apricot exporter and accounts for only 0.3% of total
world exports (ITC).
Imports of fresh apricot to Pakistan originate almost exclusively from Afghanistan. In 2011,
imports totalled 5,351 tons (ITC). Afghan apricots are imported through Peshawar and often
re-exported overland to India.
3.3 The GB Apricot Supply Chain GB is geographically isolated, the population small and dispersed, the terrain harsh and
weather conditions variable. Due to the mountainous terrain only 2% is cultivable, of which
about 1% is currently farmed. The remainder is left barren due to lack of irrigation. The
average landholding in GB is approximately 0.75ha per household.
On average 41% of household income is sourced on-farm with 59% sourced off-farm through
small business, seasonal labour or professional employment.4 Agricultural production is
mostly subsistence and only a small amount is marketed. In 2008, per capita income averaged
PKR29, 426, or just 49% of the national average.5
Wheat, maize and barley are important food crops with the majority being used for home
consumption. Fruit, nuts and vegetables such as potato are consumed and also sold to
generate cash income. Apricots are the most common fruit grown with an average 15 trees
per household. In Ghanche and Skardu districts, apricot sales account for over 70% of on-
farm income. Further detailed information on the agricultural and socio-economic conditions
of GB is presented in Annex D.
3.3.1 Spatial and volume commodity flows Figure 2 shows a volumetric chain map for GB apricots. Only 8% of apricot produced is
eaten fresh, nearly half as home consumption. Three thousand tonnes enter the market, 87%
of which is sold down-country with only 400t being sold locally.
For 60,500 tonnes of fresh apricots processed, 6,600 tonnes of dry apricot are produced.
Twenty-three per cent is kept for home consumption and 5,000 tonnes are sold on to the
market. Thirty per cent is sold locally in GB with 3,500 tonnes being sold down-country.
As most households have apricot trees themselves, the local market is very limited. Of the
dried apricot sold down-country, roughly 70% is sold in Rawalpindi.
4 SESNAC AKRSP, 2007
5 SESGBC, 2008

Page 10 of 58
Figure 2: Volumetric Chain Map of GB Apricots
Source: Based upon: Apex (2010) Commercial Potential of GB Apricot, SDC
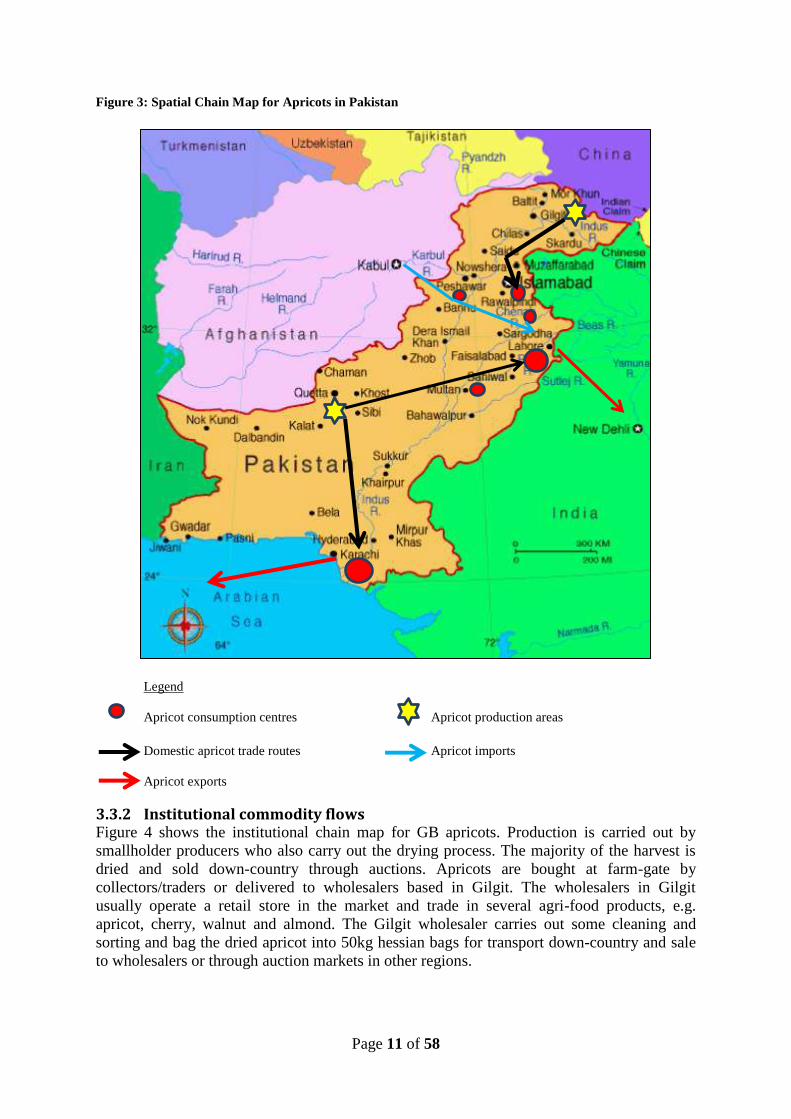
A spatial chain map for all apricot in Pakistan is shown in Figure 3. Main production centres
are Gilgit in the north and Balochistan in the south. The largest consumption centre is
Karachi (11.1 million population), although the Punjab cluster of Lahore, Faisalabad,
Rawalpindi and Islamabad has a combined population of 12.1 million. As such, the Gilgit
apricots supply the Punjab market, and the Balochistan apricots supply the Karachi market.
Gilgit apricots are competing with fresh apricots imported from Afghanistan, via Peshawar,
some of which are re-exported overland to India. Dried apricots exported to Europe mostly
originate from Balochistan and are shipped from Karachi.
Apricot production
66,000 t
Fresh apricot
5,500 t
Dried apricot
6,600 t
Home consumption
2,500 t
Sales
3,000 t
Home consumption
1,500 t
Sales
5,000 t
Sold in GB
400 t
Sold down-country
2,600 t
Sold in GB
1,500 t
Sold down-country
3,500 t
Page 11 of 58
Figure 3: Spatial Chain Map for Apricots in Pakistan
Legend
Apricot consumption centres Apricot production areas
Domestic apricot trade routes Apricot imports
Apricot exports
3.3.2 Institutional commodity flows Figure 4 shows the institutional chain map for GB apricots. Production is carried out by
smallholder producers who also carry out the drying process. The majority of the harvest is
dried and sold down-country through auctions. Apricots are bought at farm-gate by
collectors/traders or delivered to wholesalers based in Gilgit. The wholesalers in Gilgit
usually operate a retail store in the market and trade in several agri-food products, e.g.
apricot, cherry, walnut and almond. The Gilgit wholesaler carries out some cleaning and
sorting and bag the dried apricot into 50kg hessian bags for transport down-country and sale
to wholesalers or through auction markets in other regions.

Page 12 of 58
There are a few small processors in Gilgit who carry out additional transformation of the
dried apricot into a high-value product for export. Dried apricots are bought direct from
farmers, then cleaned and graded. The apricot is packed in Gilgit, transported overland to
Karachi and shipped in a container via Felixstowe to buyers in UK. Apricot oil processors
also buy the discarded kernel from farmers, extract the oil and package it for sale to
customers down-country.
Fresh apricot is often bought as a standing crop by a down-country ‘contractor’. The
contractor pays a lump sum to the farmer and then organises the harvest, packing and
transport of the apricot to auction markets down-country.
Figure 4: Institutional Chain Map of GB Apricots
Further detailed information on the GB apricot supply chain is presented in Annex D.
Overseas
processor/distributor
Smallholder Producers
Collector/Trader
(Commission)
Wholesaler
(Gilgit)
Wholesalers/auction
(down-country)
Domestic retailer
Processor /Exporter
(Gilgit)
Contractor
(buys standing crop)
Wholesaler auction
(down-country)
Domestic retailer
Processor
(Gilgit)
Domestic retailer
Fresh apricot Apricot oil
Dry apricot

Page 13 of 58
4.0 APRICOT SECTOR PERFORMANCE EVALUATION
The following ‘Likert’ graphs are based on the ‘Scoring Matrix’ found in Annex C. Each
‘driver’ has been given a rating between Very Favourable (VF) to Very Unfavourable (VU)6.
Five graphs have been produced. The enabling environment graph applies to all segments of
the apricot chain. Individual graphs have been prepared for the production, processing and
trading segments. Finally, a summary graph is presented indicating overall performance of
the apricot chain. Detailed information to support the performance ratings are found in Annex
D.
The graphs are supported by tables which provide additional detail on the sub-factors for each
driver. The ‘controllability’ columns indicate which stakeholder in the chain has control over
each sub-factor and therefore should be targeted to improve performance.
4.1 Enabling Environment Figure 5 indicates that overall, the business environment has a mixed enabling affect upon
performance of the apricot sector.
Figure 5: Performance Enabling Environment
The regional Government of GB has no agricultural policy and only a draft horticulture
policy. The DoA receives very little funding from the Annual Development Plan, hence
sector support programmes are dependent upon donor assistance. Therefore, policies and
sector support programmes are rated very unfavourable and unfavourable respectively.
The regulatory framework is favourable for private sector development. No company or
personal income taxes are levied in GB; trading or export licenses are not required and export
6 VF – Very Favourable, F – Favourable, N – Neutral, U – Unfavourable, VU – Very Unfavourable.
VF
N
U
VU
F

Page 14 of 58
procedures are reasonably straight forward. Investment and working capital loans are
available from the formal banking sector; therefore, the financing sub-factor is also rated
favourable.
Infrastructure is rated very unfavourable. Although the KKH has provided access to markets
in China and down-country Pakistan, trade volumes remain much less than expected. The
KKH is closed for three months during winter and suffers temporary closures from
landslides. When open, the journey from Gilgit to Islamabad can take up to four days, which
is not ideal for perishables such as apricot. Air transport is more unreliable due to frequent
inclement weather and plane cancellations.
Electricity is generated by hydro-power in GB. Demand is more than supply, resulting in
frequent load-shedding, which affects the capacity of processors using electric powered
machinery such as driers.
Pakistan has negotiated trade agreements with South Asia Free Trade Area (SAFTA) and
China, therefore this sub-factor is rated favourable. Free Trade Agreements (FTA) with other
major apricot importers, such as Europe, Russia or the Middle-East have yet to be brokered.
Market related sub-factors, such as market information and standards, are rated unfavourable.
There are no formal quality standards for apricot and very little market information available
in Gilgit. Due to the distance from final consumer markets, producers and local traders are
unaware of consumer needs and traders continue supplying poor quality and low-value
apricots to auction markets down-country.
4.2 Production Segment Figure 6 shows that overall performance of the production segment is negative. Although
market structure and coordination drivers are rated favourable and neutral respectively;
technology, firm management and availability of inputs drivers are all negative. Further
details on contributing sub-factors for each driver are described below.
Figure 6: Producer Segment Performance
Technology MarketStructure
Coordination FirmManagement
Availability ofInputs
VF
F
N
U
VU

Page 15 of 58
Technology
Table 2 rates the cultivar development sub-factor as very unfavourable. Most apricots
cultivated by farmers originate from a wide variety of naturally growing cultivars indigenous
to the area. Local cultivars typically have a high sugar and moisture content causing a short
shelf-life. Fruit quickly deteriorates after picking and bruises easily during transport.
Consequently, local varieties are not suitable for the fresh apricot market.
MARC is tasked with carrying out research and varietal trials and there are several DoA and
private fruit tree nurseries in every district. Budding, grafting and seedling propagation skills
are good; therefore, the seedling propagation sub-factor is rated favourable. The major
constraint is that research and development has focused on identifying higher performing
local varieties and the promotion of improved cultivation practices, rather than adaptive
research on new commercial varieties, particularly for the fresh apricot market. Therefore, the
research and development sub-factor is rated unfavourable.
There are few apricot orchards and trees are usually planted around field boundaries,
resulting in small amounts of production spread over a large area. Pruning is not carried out
and no inputs such as sprays and fertilisers are applied. Lack of orchard management results
in the production of misshapen, undersized fruit; often blemished by pest and disease and
contributes towards the high levels of wasted apricot (46%). Therefore the orchard
management skills sub-factor is rated very unfavourable. Due to the lack of pruning, trees are
overgrown and difficult to harvest. Fruit has to be ‘knocked’ off the tree causing bruising;
therefore, the harvest techniques sub-factor is rated unfavourable.
Due to the rapid deterioration and short shelf-life of the apricot after harvest, coupled with the
distance from market, primary processing of the apricot is undertaken on-farm. Apricot is
typically dried in the open and the kernel removed. Contamination with dust and dirt during
drying and storage is common; hence, processing and storage sub-factors are also rated
unfavourable.
The DoA receives a very small proportion of the Annual Development Plan budget;
consequently, ‘extension services and training’ to improve orchard management by farmers is
limited and this sub-factor is rated very unfavourable.
Table 2: Production – technology driver
Drivers & sub-factors Controllability
7 Relevance
8 Weight
Technology CF CG QC NC
Cultivar development ● VU 0.1
Seedling propagation ● F 0.1
Orchard management ● VU 0.2
Harvest techniques ● U 0.1
On-farm primary processing ● U 0.1
On-farm storage ● U 0.15
Extension services / training ● VU 0.15
Research & development ● U 0.1
7 CF – Controlled by firm; CG – Controlled by Government; QC – Quasi controllable; NC – Non-controllable.
8 VF – Very Favourable, F – Favourable, N – Neutral, U – Unfavourable, VU – Very Unfavourable.

Page 16 of 58
Market Structure
Overall, market structure is favourable for producers. There are over 100,000 apricot farmers
and roughly 50 apricot traders and wholesalers, providing a ratio of 2,000 farmers to one
buyer, ensuring a reasonable level of competition. Therefore, the number of producers and
buyers sub-factors is rated very favourable and favourable respectively in Table 3.
Most households in Gilgit grow apricot, and beyond access to land and finance, there are few
barriers to entry for producing apricot. Therefore this sub-factor is rated neutral.
Table 3: Production – market structure driver
Drivers & sub-factors Controllability Relevance Weight
Market Structure CF CG QC NC
Number of producers ● VF 0.3
Number of buyers ● F 0.4
Barriers to entry ● N 0.3
Coordination
The large number of farmers, producing small amounts of apricot necessitates some form of
organisation to supply markets. Farmer groups have been established and extended families
traditionally market their apricots together. Therefore, horizontal integration between farmers
is good and the producer group sub-factor in Table 4 is rated favourable.
Beyond bulking produce for sale, the groups do not offer any other services as they are not
linked to a larger association that could provide loans, training, marketing, etc. Therefore the
effectiveness of groups sub-factor is rated neutral. The groups also do not have any long-term
supply agreements with buyers, for that reason this sub-factor is rated as unfavourable.
Table 4: Production – coordination driver
Drivers & sub-factors Controllability Relevance Weight
Coordination CF CG QC NC
Presence of producer groups in
production areas
●
F 0.3
Effectiveness of services
provided by producer groups ●
N 0.4
Use of long-term binding
agreements with buyers ●
U 0.3
Farm Management
Farm size is very small and production is firstly oriented towards food crop production, e.g.
wheat and maize, for home consumption. Due to the previous isolation from markets, cash
incomes are mostly sourced off-farm. This has resulted in a lack of motivation and innovation
for commercial agricultural production and these sub-factors are rated very unfavourable in
Table 5. Apricots are not viewed as a highly profitable cash crop and little attention is paid to
monitoring or controlling quality; therefore, this sub-factor is rated unfavourable.
Due to the small-scale of production, planning and leading sub-factors are rated favourable.
Labour is provided by family members and little organisation is required; therefore, staffing
and organising sub-factors are rated neutral.

Page 17 of 58
Table 5: Production – firm management driver
Drivers & sub-factors Controllability Relevance Weight
Firm Management CF CG QC NC
Planning ● F 0.25
Organising ● N 0.25 Staffing ● N 0.1 Leading / directing ● F 0.1 Controlling / monitoring ● U 0.1 Motivation ● VU 0.1 Innovation ● VU 0.1
Availability of Inputs
As described above, certified seedlings of improved cultivars are not available in GB;
therefore, this sub-factor is rated very unfavourable in Table 6. Due to extreme terrain and
climate only 2% of land in GB is cultivatable and apricot is often planted on marginal land;
therefore, the land sub-factor is rated very unfavourable. Apricot requires irrigation and only
half the cultivable area is actually cultivated due to lack of irrigation, hence this sub-factor is
rated unfavourable.
Although farmers do not use sprays and fertilisers for apricot production, these inputs are
available; therefore, this sub-factor is rated favourable. Similarly, the labour sub-factor is
rated favourable, even though farmers rely on family labour for apricot production.
There are no cold storage facilities in GB, a constraint for marketing fresh apricot. Therefore,
this sub-factor is rated unfavourable. Agricultural loans are available from the formal banking
sector or several micro-finance institutions; therefore, the finance sub-factor is rated
favourable.
Table 6: Production – availability of inputs driver
Drivers & sub-factors Controllability Relevance Weight
Availability of Inputs CF CG QC NC
Seedlings ● VU 0.2
Sprays & fertilisers ● F 0.1
Irrigation ● U 0.15
Land ● VU 0.2
Storage ● U 0.15
Labour ● F 0.1
Finance ● F 0.1
4.3 Processing Segment The processing segment refers to entrepreneurs who carry out supplementary processing, for
further value addition. These products are often exported to higher value markets overseas.
Figure 7 shows that overall, performance of the processing segment is positive. All drivers
are favourable except market structure as there are so few processors and buyers for value-
added apricot products. Further details on contributing sub-factors for each driver are
described below.

Page 18 of 58
Figure 7: Processor Segment Performance
Technology
Processing, packaging and storage technologies are all rated favourable in Table 7. Improved
technologies for drying using sulphur, solar tunnels or electrical driers are available. Pulping
machinery for juices and cold-presses for oil are available. Packaging technologies such as
tetrapack, heat-sealed bags and vacuum packs are available.
Although processing, packaging and storage technologies are obtainable in Pakistan, there are
very few entrepreneurs investing in the technologies to develop new value-added apricot
products in GB. Furthermore, no research and development for processed apricot products is
carried out in Pakistan; therefore, this sub-factor is rated unfavourable.
Table 7: Processing – technology driver
Drivers & sub-factors Controllability Relevance Weight
Technology CF CG QC NC
2.2 Processing (off-farm)
Processing technology ● F 0.3
Packaging ● F 0.2
Storage technology ● F 0.3
Research & development ● U 0.2
Market Structure
Market structure is the only processing driver to be rated unfavourable. Table 8 shows the
number of processors and number of buyers sub-factors are both rated unfavourable.
Most processors seek markets overseas as it is perceived the domestic market in Pakistan will
not pay price premiums for processed apricot products. Overseas buyers do not have a
presence in GB; therefore making market linkages is heavily reliant on the tenacity of the
individual processor/exporter. As there are few buyers, there are few processors and as there
are few processors, there are few buyers, creating an unfavourable market structure.
Beyond market linkages and investment capital there are few barriers to entry; therefore, this
sub-factor is rated neutral.
Technology MarketStructure
Coordination FirmManagement
Availability ofInputs
VF
F
N
U
VU

Page 19 of 58
Table 8: Processing – market structure driver
Drivers & sub-factors Controllability Relevance Weight
Market Structure CF CG QC NC
Number of processors ● U 0.3
Number of buyers ● U 0.4
Barriers to entry ● N 0.3
Coordination
Due to the lack of overseas buyers, processors compete for customers and there is no
collaboration, or horizontal integration, between processors to fulfil larger orders and access
bigger markets. Therefore this sub-factor is rated unfavourable in Table 9. However,
processors do have agreements with suppliers and buyers, therefore these sub-factors are
rated favourable.
Table 9: Processing – coordination driver
Drivers & sub-factors Controllability Relevance Weight
Coordination CF CG QC NC
Collaboration between processors
to access markets ● U 0.2
Use of contracts or binding
agreements with suppliers ● F 0.4
Use of contracts or binding
agreements with buyers ● F 0.4
Firm Management
The processors are entrepreneurs, most of whom are educated, and operate other established
businesses. As such they possess good management skills and all sub-factors are rated
favourable in Table 10.
Table 10: Processing – firm management driver
Drivers & sub-factors Controllability Relevance Weight
Firm Management CF CG QC NC
Planning ● F 0.3
Organising ● F 0.3 Staffing ● F 0.05 Leading / directing ● F 0.05 Controlling / monitoring ● F 0.1 Motivation ● F 0.1 Innovation ● F 0.1
Availability of Inputs
Apricots are widely available in GB and it is estimated 46% of production is not utilised;
therefore, the availability of raw materials sub-factor is rated favourable in Table 11.
Processing machinery, labour and finance are also available; therefore, these sub-factors are
likewise rated favourable.
Packaging and storage technologies for dried processed apricot are available in GB;
therefore, these sub-factors are rated favourable. However, reliable electricity supply is a big
constraint due to load shedding and this sub-factor is rated very unfavourable.

Page 20 of 58
Table 11: Processing – availability of inputs driver
Drivers & sub-factors Controllability Relevance Weight
Availability of Inputs CF CG QC NC
Raw materials - apricots ● F 0.2
Machinery ● F 0.2
Power / electricity ● VU 0.2
Packaging ● F 0.1
Storage ● F 0.1
Labour ● F 0.1
Finance ● F 0.1
4.4 Trading Segment The trading segment refers to the traditional wholesale traders who carry out the bulking and
transport functions, buying dried apricot in Gilgit and selling to wholesalers and auction
markets down-country. This segment also includes fresh apricot bought as a standing crop
from farmers.
Figure 8 shows that overall, performance of the trading segment is positive, with the
exception of the availability of inputs driver. Further details on contributing sub-factors for
each driver are described below.
Figure 8: Trader Segment Performance
Technology
The handling and storage of dried apricot is adequate and cold storage technologies are
available in Pakistan, even though there are no facilities in GB. Therefore, this sub-factor is
rated favourable in Table 12. Air travel is unreliable and the KKH to Islamabad suffers
temporary closures. However, small refrigerated vans can make the journey in 14 hours,
much quicker than the large trucks used by haulage companies. Therefore, the transport sub-
factor is rated favourable. Due to the extensive mobile phone network, the communication
sub-factor is rated very favourable.
Technology MarketStructure
Coordination FirmManagement
Availability ofInputs
VF
F
N
U
VU

Page 21 of 58
Table 12: Trading – technology driver
Drivers & sub-factors Controllability Relevance Weight
Technology CF CG QC NC
Handling & storage ● F 0.3
Communication ● F 0.3
Transport ● F 0.4
Market Structure
Table 13 shows the market structure for trading is favourable. There are numerous buyers and
sellers creating a competitive market environment. A license is not required for small-scale
trading and beyond access to finance, there are no barriers to entry.
Table 13: Trading – market structure driver
Drivers & sub-factors Controllability Relevance Weight
Market Structure CF CG QC NC
Number of traders ● F 0.3
Number of buyers ● F 0.4
Barriers to entry ● F 0.3
Coordination
Whilst there is little horizontal coordination between competing wholesalers, there is a
certain amount of vertical coordination in the supply chain. For example, Gilgit wholesalers
will advance cash to smaller traders to source apricot. There is also coordination between
wholesalers in Gilgit supplying apricot to wholesalers down-country, who in return may
supply the Gilgit wholesalers with products to sell up-country, such as walnuts in China.
Therefore, the collaboration sub-factor is rated favourable in Table 14.
Traders do not have any long-term binding agreements with suppliers or buyers. All orders
are one-off transactions, therefore the supplier/buyer contract sub-factors are rated neutral.
Table 14: Trading – coordination driver
Drivers & sub-factors Controllability Relevance Weight
Coordination CF CG QC NC
Collaboration between traders to
access markets ● F 0.2
Use of contracts or binding
agreements with suppliers ● N 0.4
Use of contracts or binding
agreements with buyers ● N 0.4
Firm Management
Traditional traders typically strive to achieve the highest margins by buying at the lowest
price and selling at the highest price. Very little attention is paid to product differentiation
and quality aspects to achieve price premiums; therefore, the innovation sub-factor is rated
unfavourable in Table 15. Due to the lack of long-term contracts with suppliers and buyers,
as described above, the planning sub-factor is rated neutral. However, other aspects of firm
management, such as organising, staffing, leadership, monitoring and motivation sub-factors
are all rated favourable.

Page 22 of 58
Table 15: Trading – firm management driver
Drivers & sub-factors Controllability Relevance Weight
Firm Management CF CG QC NC
Planning ● N 0.3
Organising ● F 0.3 Staffing ● F 0.05 Leading / directing ● F 0.05 Controlling / monitoring ● F 0.1 Motivation ● F 0.1 Innovation ● U 0.1
Availability of Inputs
Apricots are widely available, mobile phone and internet services are easily obtainable,
labour is available on a permanent and seasonable basis and finance services are provided by
both formal and informal banking institutions. Therefore, these sub-factors are all rated
favourable.
Even though packaging materials and cold storage technologies for fresh fruit are obtainable
down-country, they are not available in GB. This is preventing development of the fresh fruit
market; therefore, these sub-factors are rated very unfavourable in Table 16. Small
refrigerated vans used for transporting ice-cream are also suitable for the rapid transport of
fresh fruit, but not used by traders in GB; therefore, the transport sub-factor is also rated very
unfavourable.
Table 16: Trading – availability of inputs driver
Drivers & sub-factors Controllability Relevance Weight
Availability of Inputs CF CG QC NC
Product - apricots ● F 0.3
Packaging ● VU 0.1
Storage ● VU 0.1
Transport ● VU 0.2
Information & communication
technology
● F 0.1
Labour ● F 0.1
Finance ● F 0.1
4.5 Summary Performance Evaluation The Enabling Environment graph in Figure 5 indicates improvements are necessary in
agricultural policy to guide public and private investment and sector support programmes to
develop the temperate fruit industry in GB. Improvements are also necessary with the
provision of up to date and useful market information to inform producers, processors and
traders what types of apricot products consumers want and what they are willing to pay more
for. When striving to meet market requirements, the use of ‘standards’ is an effective means
of improving quality.
A performance summary of the apricot sector is presented in Figure 9. The majority of
drivers are positive. Nonetheless, the graph highlights the areas where most improvement is
needed.

Page 23 of 58
Figure 9: Summary Apricot Sector Performance
Figure 9 confirms the biggest constraint to performance of the apricot sector is the technology
driver for the production segment. The introduction of commercial cultivars, suitable for the
fresh fruit market, with good transportation characteristics is fundamental to development of
the sector. Other factors such as orchard management and post-harvest practices must also be
addressed.
The market structure driver is the biggest constraint to performance of the processing
segment. Most processors seek markets overseas and making market linkages is heavily
reliant on the tenacity of the individual processor/exporter. As there are few buyers, there are
few processors and as there are few processors, there are few buyers, creating an
unfavourable market structure. If the processing segment is to grow, a diversification strategy
is necessary to develop new products and new markets.
The availability of inputs driver is negative for both production and trading segments. If
down-country trade in higher-value fresh apricots is to develop, facilities for packing, cold
storage and refrigerated transport will be necessary. As GB is a hub for temperate fruit in
Pakistan, such infrastructure has the potential to benefit the whole horticulture sector, not just
apricot.
Technology MarketStructure
Coordination FirmManagement
Availability ofInputs
Production
Processing
Trading
VF
F
N
U
VU

Page 24 of 58
5.0 RECOMMENDATIONS
5a) Introduce, propagate and distribute improved commercial cultivars
Rationale & proposed strategy:
Most apricot varieties cultivated by farmers originate from a wide variety of naturally growing
cultivars indigenous to the area. Up to 46% of the crop is wasted as the fruit is low quality and
unmarketable. Local cultivars typically have a high sugar and moisture content causing a short shelf-
life. Fruit quickly deteriorates after picking and bruises easily during transport. Consequently, local
varieties are not suitable for the fresh apricot market.
In partnership with MARC, it is proposed to firstly identify potential commercial varieties that are
suitable for drying and supplying the fresh market and develop a strategy for quickly distributing
improved seedlings amongst farmers. This may include developing a clonal garden with MARC that
can provide improved budding and grafting material for distribution amongst DoA and private
nurseries. The nurseries will then propagate improved seedlings for distribution to farmers in the
medium term.
To expedite the process in the short-term, it is recommended budding is carried out directly on the
existing trees of target farmers who are members of FEGs.
Potential impact:
Six-hundred farmers will be directly targeted by the project and provided with improved planting
materials. It is expected wastage will be reduced from 46% to 10%, representing a 34% increase in
sales. Based upon calculations in Table 14, this would increase farm household incomes by
US$29/year. There will also be multiplier income effects on other chain stakeholders such as
processors and traders.
Once established, the nurseries will supply all apricot farmers in the region with improved seedling as
indirect beneficiaries, creating widespread impact in the long-term.
Source of finance
Research & development grant
Estimated Cost:
US$50,000
Priority:
Short-term (over next 12 months)
Further Study Required
Identify suitable cultivars.
Develop strategy for quickly distributing improved seedlings amongst farmers.
5b) Improve orchard management and on-farm processing skills of apricot producers
Rationale & proposed strategy:
Due to GBs previous isolation, farming systems are typically subsistence oriented. Apricot production
is carried out around field edges and no inputs are used or pruning carried out. Traditional on-farm
drying is unhygienic producing a low quality and low value product.
To implement the supply chain improvements described in the other recommendations described
below, several major changes must be made in the production segment, in addition to introducing
improved varieties. These include:
i) establishing apricot orchards and apricot producer groups that can collectively produce a
collateral mass of apricot to attract buyers and qualify investment in shared infrastructure,
ii) improving irrigation in apricot orchards, e.g. drip irrigation schemes,
iii) training on pruning, fertiliser use and pest/disease management,
iv) training on improved harvesting to reduce bruising and extend shelf-life for fresh apricot,
v) provision of solar drying tunnels and training in sulphuring technique for dried apricots, and

Page 25 of 58
vi) provision of washing, grading & packing facilities for fresh apricots. Systems will also have to
be put in place to manage the shared infrastructure and facilitate supply chain linkages to
processors and traders.
Potential impact:
Forty FEGs will be established with a total of 600 members. In addition to the increased income from
reduced wastage, as described above in 5a), farmers will receive a higher price for producing better
quality dried and fresh apricot. High quality dried apricot can receive a 20% premium on poor quality.
Based upon calculations in Table 14 and including increased volumes from reduced wastage, farm
household income will increase by a total US$43/year. There will also be multiplier income effects on
other chain stakeholders such as processors and traders.
Source of finance
FEG support grants
Support to FEG clusters and farmer associations
Support to individual farmers
Agriculture extension services grant
Estimated Cost:
US$420,000
Priority:
Medium-term (over next 18 months)
Further Study Required
Identify clusters of target apricot FEGs.
5c) Support product development for processed apricots
Rationale & proposed strategy:
Most GB apricot is dried on-farm and sold through wholesalers and auction markets down-country as
a low-quality undifferentiated product fetching low prices. A few entrepreneurs have developed new
products, such as apricot oil from the kernel discarded during the drying process, or high quality dried
apricot for export overseas.
Apricot can be used as a flavour ingredient in processed foods such as cereal/fruit bars, yoghurts, ice-
cream and cheese. Dried apricot can be packaged into small heat-sealed bags as a healthy ready-to-eat
snack. Poor quality apricot can be processed into jams and juices.
Apricot oil is a niche product and without any unique qualities has to compete with the myriad other
oils available on the market. The preparation of apricot into cereal/fruit bars and yogurt etc. is usually
undertaken by processors in the consuming country. Pulping fresh apricot into juices is usually a
means of using waste from the fresh apricot industry. As such, prices paid for the waste apricot are
very low. However, there may be opportunities to produce apricot jam. Opportunities for product
development are largely limited to improving the quality, packaging and marketing of dried apricot
and seeking new markets for the dried apricot, which is covered under 5d) below. Meeting
international standards is important for the export market and many processor/exporters have suffered
difficulties meeting SPS requirements and quality standards demanded by buyers.
Quality improvement is the basis for increasing the value of dried apricot and requires training
farmers in improved post-harvest practices. The ‘Mountain Fresh’ business model is a good example
of how dedicated supply chains can be established with farmer groups. Apricot is viewed as a health
food; therefore, organic certification has some potential to add value. Certification for ‘Geographical
Indication’ (GI) may also add value as ‘Hunza’ apricots are well known in Pakistan. GI can be used
on products that have a specific geographic origin and possess qualities or a reputation that are
intrinsically due to that place of origin.
It is proposed the Project funds new product development with a core group of processors in
conjunction with market linkage activities described under 5d). The Project would fund:
i) machinery, equipment and training required for developing new products,

Page 26 of 58
ii) exposure trips to other apricot processors,
iii) training and certification in food safety and quality management systems (e.g. HAACP, ISO
22000) and
iv) organic and GI certification costs.
Potential impact:
The Project will target 20 processors. Based on calculations in Table 15, gross margins will be
increased from PKR5/kg to PKR10/kg for improved processed products. If an average processor
produces 50 tonnes/year, this represents an increase in income of US$2,632/year per processor.
Source of finance
Enterprise development grant
Estimated Cost:
US$260,000
Priority:
Medium-term (over next 24 months)
Further Study Required
Identify target group of 20 processors.
Scoping survey to identify new products and potential buyers (in conjunction with 7d)
5d) Promote market linkages for quality processed apricot (domestic and export)
Rationale & proposed strategy:
The value-chain assessment that showed the biggest weakness of the processing segment was market
structure, i.e. the number of processors and number of buyers. Processors found it difficult to engage
overseas buyers due to their small size and distance from market.
It is proposed a Fruit Processor Association is established as a platform for promoting GB processed
apricot products overseas and domestically. Through increased collaboration between processors,
larger orders will be achieved and several products will be made available through one portal.
Marketing and promotion costs will be shared across the association and Gilgit fruit products will be
marketed as a brand.
Potential market linkages include: i) overseas processors using apricot as an ingredient for cereal/fruit
bars, cheese, yoghurt, ice-cream, jams etc. ii) chains of health food shops, and iii) foreign and
domestic supermarkets / convenience stores selling ready-to-eat dried apricots.
The Project will fund establishment costs of the association and support development and
implementation of a marketing strategy. This may include carrying out trade missions and attending
trade fairs.
Potential impact:
The project will target 20 processors. If average sales/processor is doubled from 50 tonnes/year to 100
tonnes/year and price/kg is doubled as described under 5c) above, total income is increased by
US$7,895/year for each processor.
The Association will be open to all fruit processors in GB, and therefore has the potential for
widespread impact in the long-term.
Source of finance
Support to business associations
Estimated Cost:
US$160,000
Priority:
Long-term (over next 30 months)
Further Study Required
Identify new buyers overseas.
Identify high-value domestic buyers and distributors.
Consultation with processors to assess interest in establishing a Fruit Processor Association.
Scoping survey to identify products in demand from potential buyers (in conjunction with 5c)

Page 27 of 58
5e) Develop cold-chain infrastructure for fresh fruit trading in Gilgit
Rationale & proposed strategy:
Gilgit is a hub for temperate fruit production in Pakistan (apricot, apple, grapes, pears, peaches, cherry
etc.) and fresh fruit commands premium prices. Apricots have traditionally been dried in GB due to
the previous isolation from markets. However, after construction of the KKH and improvements in
storage and transport technologies, the marketing of fresh fruit from Gilgit to down-country Pakistan
and overseas is now a possibility. Developing cold storage and refrigerated transport infrastructure
would produce benefits for all fresh fruits, not just apricot, and also off-season vegetables.
Local apricot varieties have a high Brix Value (sugar content), rendering them unsuitable for long
distance transport, due to short shelf life. Therefore, commercial apricot varieties suited for transport
with a long shelf-life, must first be introduced, as described in 5a) above. Potential high-value markets
must also be identified. For example, there are regular air links to Dubai from Islamabad.
Opportunities for supplying large fresh apricot retailers in major cities can also be explored, e.g.
Metro.
A major strategic decision is whether to invest in a wholesale market or support individual traders in
Gilgit. Whilst a wholesale market has the potential to benefit more stakeholders, individual traders are
more likely to manage the investment sustainably. This decision needs to be made by the Project
through discussions with traders and potential wholesale market managers, e.g. local Government in
Gilgit or an association of fruit traders.
The FEG clusters will need to be provided with washing, grading and packaging facilities. Suitable
protective packaging materials for fresh produce must also be introduced. These centralised facilities
will require management by a producer association and charges made for cost recovery.
A central cold store in Gilgit town is necessary to chill the fruit down to 0.5°C before transport down-
country. Apricot can be kept in cold storage for up to three weeks. Small refrigerated vans used by
Nestlé to bring ice-cream to Gilgit have proved effective, as they can make the journey from
Islamabad much quicker than the larger lorries.
Establishing fresh fruit supply chains will require considerable work – introducing commercial
varieties, improving farmer post-harvest skills and establishing producer organisations. For this
reason, this activity is given a medium-term priority, allowing the Project to carry out much of the
preparatory work, through other activities as described above, beforehand.
Potential impact:
Approximately 40 traders would benefit from the cold chain. Each trader would sell 60 tonnes of
apricot to retailers at PKR60/kg compared to PKR40/kg previously received from auction markets,
increasing incomes by US$12,632/year.
The cold chain infrastructure can be used for all fresh produce, not just apricot, so has the potential for
widespread impact in the long-term.
Source of finance
Support to FEG clusters, farmer associations,
business associations and cooperatives.
Estimated Cost:
US$410,000
Priority:
Long-term (over next 30 months)
Further Study Required
Identify suitable fresh fruit traders to support.
Identify suitable fresh fruit buyers to link with – market survey in Dubai and with down-country
supermarkets.
Consultation to decide on implementation strategy – wholesale market or individual traders.
Identify most suitable cold storage and fresh fruit trading technology.

Page 28 of 58
6.0 TIMELINE & BUDGET
Activity / Year Year 2 Year 3 Year 4 Year 5
Quarter 2 3 4 1 2 3 4 1 2 3 4 1 2 3 4
a) Introduce, propagate and distribute improved commercial cultivars
Develop distribution strategy with
MARC.
Identify and purchase commercial
cultivars.
Establish clonal garden with MARC.
Bud/graft onto FEG trees.
Upgrade nurseries.
b) Improve orchard management and on-farm processing skills of apricot producers
Identify potential clusters of apricot
FEGs.
Establish FEG.
FEG management training.
Establish orchards.
Training orchard management.
Provide drying equipment.
Training post-harvest practices.
Establish links with buyers.
c) Support product development for processed apricots
Scoping survey to identify new
processed apricot products.
Exposure trips to other processors.
Provide equipment/training to
produce new products.
Training and certification in food
safety and quality management
systems.
Organic and GI certification.

Page 29 of 58
d) Promote market linkages for quality processed apricot (domestic and export)
Identify potential domestic and
overseas buyers.
Establish GB Fruit Processors
Association.
Develop marketing strategy.
Attend trade missions/fairs.
Implement marketing strategy.
e) Develop infrastructure for fresh fruit trading in Gilgit
Identify fresh fruit traders to partner
with.
Identify fresh fruit buyers – domestic
& export.
Prepare implementation strategy –
wholesale market or individual trader.
Provide washing/grading/packing line
to FEG clusters.
Train FEG in harvest,
washing/grading/packing techniques.
Establish central cold store and
refrigerated transport facilities in
Gilgit.
Train traders on cold chain
management.

Page 30 of 58
Activity / item Budget (US$)
a) Introduce, propagate and distribute improved commercial
cultivars
Improved seedlings and establishment of MARC clonal garden
10 x upgraded DoA nurseries @ $2,000
Training FEG and fast-track budding/grafting
Sub-total
25,000
20,000
5,000
50,000
b) Improve orchard management and on-farm processing skills
of apricot producers
40 x orchard establishment @ $2,000
40 x FEG training
600 x drying equipment @ $500
Sub-total
80,000
40,000
300,000
420,000
c) Support product development for processed apricots
Processing equipment
Exposure trips
Training
Certification
Sub-total
40,000
100,000
20,000
100,000
260,000
d) Promote market linkages for quality processed apricot
(domestic and export)
Establish Fruit Processor Association
Trade missions/fairs
Marketing & promotion
Sub-total
10,000
100,000
50,000
160,000
e) Develop infrastructure for fresh fruit trading in Gilgit
1 x cold store and associated equipment
20 x washing, grading, packing units @ $5,000
10 x refrigerated vans @ $15,000
Training
Sub-total
100,000
100,000
150,000
10,000
360,000
TOTAL 1,250,000

Page 31 of 58
ANNEXES

Page 32 of 58
Annex A: Documents Reviewed
AKRSP (2010) Basic Study on Horticulture Sector in Gilgit Baltistan, JICA
Apex (2010) Commercial Potential of GB Apricot, SDC
ASF (2012) Annual Work Plan 2012/2013, USAID
ASF (2012) Participatory Rapid Horticulture Appraisal Report, Gilgit-Baltistan
ASF (2013) Scoping Statement for Environmental Assessment, USAID
ASF (2012) The Agribusiness Project: Annual Progress Report 2011/2012, USAID
ASF (2013) The Agribusiness Project: Quarterly Report Oct-Dec 2012, USAID
Chemonics (2011) Dried Apricot: Kyrgyz Republic, USAID
Harutyunyan G (2012) Apricot Value Chain in Armenia, Shen NGO
Hashmi & Shafiullah (2003) Agriculture and Food Security: Northern Areas, IUCN Pakistan
Knowles R (2012) Horticulture Value Chain Assessment, CNFA
Ministry of Food & Agriculture (Undated) Horticulture Policy: Gilgit-Baltistan (Draft)
NUDHA (2008) Apricots in Afghanistan, Intercooperation
World Bank (2011) Gilgit Baltistan Economic Report

Page 33 of 58
Annex B: Persons Met
Name Designation Location
Sher Ghazi
Akbar Shah
Muhammad Iqbal
Malik Miskeen
Javed Akhtar
Sher Baz Khan
Shafiullah
Izhar Ali Hunzai
Qurban Ali
Meharban Karim
Sher Jahan
Emad Ahmed
Chief Executive, Mountain Fruits Ltd
CEO, Hashwan Traders
Apricot farmer
Private nursery owner
Deputy Director, Department of Agriculture
MD, Hunza Oil Industries
Director, Mountain Agricultural Research
Council
CEO, Karakoram Natural Resources Ltd
Vice President, Gilgit-Baltistan Chamber of
Commerce
Dried apricot and apricot oil exporter
Director, Water Management, Gilgit DoA
CEO, Botanica Organo
Gilgit
Gilgit
Gilgit
Gilgit
Gilgit
Gilgit
Gilgit
Islamabad
Islamabad
Islamabad
Islamabad
Islamabad

Page 34 of 58
Annex C: Performance Scoring Matrix
Drivers & sub-factors Controllability Relevance Weight Drivers
evaluation
CF CG QC NC
1. Enabling Environment ●
Policies ● U -1 0.2 -0.2
Taxes ● VF 2 0.1 0.2
Licensing ● F 1 0.05 0.05
Infrastructure ● VU -2 0.2 -0.4
Export procedures ● F 1 0.1 0.1
Market information ● VU -2 0.05 -0.1
Financing ● F 1 0.05 0.05
Trade agreements ● F 1 0.05 0.05
Sector support programmes ● U -1 0.1 -0.1
Standards ● U -1 0.1 -0.1
Total 1 -0.45
2. Technology
2.1 Production
Cultivar development ● VU -2 0.1 -0.2
Seedling propagation ● F 1 0.1 0.1
Orchard management ● VU -2 0.2 -0.4
Harvest techniques ● U -1 0.1 -0.1
On-farm primary processing ● U -1 0.1 -0.1
On-farm storage ● U -1 0.15 -0.15
Extension services / training ● VU -2 0.15 -0.3
Research & development ● U -1 0.1 -0.1
Total 1 -1.25
2.2 Processing (off-farm)
Processing equipment ● F 1 0.3 0.3
Packaging ● F 1 0.2 0.2
Storage technology ● F 1 0.3 0.3
Research & development ● U 0 0.2 0
Total 1 0.8
2.3 Trading
Handling & storage ● F 1 0.3 0.3
Communication ● F 1 0.3 0.3
Transport ● F 1 0.4 0.4
Total 1 1
3. Market Structure
3.1 Production
Number of producers ● VF 2 0.3 0.6
Number of buyers ● F 1 0.4 0.4
Barriers to entry ● N 0 0.3 0
Total 1 1
3.2 Processing
Number of processors ● U -1 0.3 -0.3
Number of buyers ● U -1 0.4 -0.4
Barriers to entry ● N 0 0.3 0
Total 1 -0.7
3.3 Trading
Number of traders ● F 1 0.3 0.3
Number of buyers ● F 1 0.4 0.4
Barriers to entry ● F 1 0.3 0.3
Total 1 1

Page 35 of 58
Drivers & sub-factors Controllability Relevance Weight Drivers
evaluation
4. Coordination
4.1 Production
Presence of producer groups in
production areas
●
F 1 0.3 0.3
Effectiveness of services
provided by producer groups ●
N 0 0.4 0
Use of long-term binding
agreements with buyers ●
U -1 0.3 -0.3
Total 1 0
4.2 Processing
Collaboration between processors
to access markets ● U -1 0.2 -0.2
Use of contracts or binding
agreements with suppliers ● F 1 0.4 0.4
Use of contracts or binding
agreements with buyers ● F 1 0.4 0.4
Total 1 0.6
4.3 Trading
Collaboration between traders to
access markets ● F 1 0.2 0.2
Use of contracts or binding
agreements with suppliers ● N 0 0.4 0
Use of contracts or binding
agreements with buyers ● N 0 0.4 0
Total 1 0.2
5. Firm Management
5.1 Production
Planning ● F 1 0.25 0.25
Organising ● N 0 0.25 0 Staffing ● N 0 0.1 0 Leading / directing ● F 1 0.1 0.1 Controlling / monitoring ● U -1 0.1 -0.1 Motivation ● VU -2 0.1 -0.2
Innovation ● VU -2 0.1 -0.2
Total 1 -0.15
5.2 Processing
Planning ● F 1 0.3 0.3
Organising ● F 1 0.3 0.3 Staffing ● F 1 0.05 0.05 Leading / directing ● F 1 0.05 0.05 Controlling / monitoring ● F 1 0.1 0.1 Motivation ● F 1 0.1 0.1 Innovation ● F 1 0.1 0.1
Total 1 1
5.3 Trading
Planning ● N 0 0.3 0
Organising ● F 1 0.3 0.3 Staffing ● F 1 0.05 0.05 Leading / directing ● F 1 0.05 0.05 Controlling / monitoring ● F 1 0.1 0.1 Motivation ● F 1 0.1 0.1 Innovation ● U -1 0.1 -0.1
Total 1 0.5
6. Availability of Inputs
6.1 Production
Seedlings ● VU -2 0.2 -0.4

Page 36 of 58
Drivers & sub-factors Controllability Relevance Weight Drivers
evaluation
Sprays & fertilisers ● F 1 0.1 0.1
Irrigation ● U -1 0.15 -0.15
Land ● VU -2 0.2 -0.4
Storage ● U -1 0.15 -0.15
Labour ● F 1 0.1 0.1
Finance ● F 1 0.1 0.1
Total 1 -0.8
6.2 Processing
Raw materials - apricot ● F 1 0.2 0.2
Machinery ● F 1 0.2 0.2
Power / electricity ● VU -2 0.2 -0.4
Packaging ● F 1 0.1 0.1
Storage ● F 1 0.1 0.1
Labour ● F 1 0.1 0.1
Finance ● F 1 0.1 0.1
Total 1 0.4
6.3 Trading
Product ● F 1 0.3 0.3
Packaging ● VU -2 0.1 -0.2
Storage ● VU -2 0.1 -0.2
Transport ● VU -2 0.2 -0.4
Information & communication
technology
● F 1 0.1 0.1
Labour ● F 1 0.1 0.1
Finance ● F 1 0.1 0.1
Total 1 -0.2

Page 37 of 58
Annex D: Detailed Background Information
PAKISTAN Pakistan is a lower-middle income country and has the sixth largest population in the world.
Basic socio-economic data is presented in Table a) below.
Table a): Pakistan Socio-Economic Data 2011
Population
Population growth
Life expectancy
176.7 million
1.8%
65 years
Gross National Income per capita
GDP growth
Inflation
US$1,120
2.9%
11.9%
Population living below the poverty line
Urbanisation
22% (2006)
37%
Source: World Bank, 2011
Sector contributions towards Gross Domestic Product (GDP) is shown in Figure a). The
agriculture sector contributes just under a quarter of GDP with growth of 2.4% in 2011. This
exceeded industry sector growth of only 0.7% but is less than service sector growth of 4.5%.9
Figure a): Pakistan Sector Contribution to GDP
Source: ADB 2011
GILGIT-BALTISTAN Gilgit-Baltistan (GB) is a self-governed region in the north of Pakistan. Since partition, the
governance system has undergone several transitions and in late 2009 the Government of
Pakistan (GoP) granted the region ‘Provincial equivalent status’ with a full set of institutional
reforms to bring it at par with other provinces.
The region is geographically isolated, the population small and dispersed, the terrain harsh
and weather conditions variable. GB borders Wakhan province of Afghanistan to the north,
Xingjian province of China to the northeast, and Indian administered Jammu and Kashmir to
the southeast. To the south, GB borders Pakistan administered Azad Jammu and Kashmir.
Figure b) shows a map of GB and its seven districts, which cover a total area of 72,496km².
The population of GB was estimated at 1,115,687 in 2007, with over half the population
living in Gilgit and Skardu districts.
9 ADB, 2011
Agriculture 22%
Industry 25%
Services 53%

Page 38 of 58
Figure b): Gilgit-Baltistan Map
Source: AKRSP (2010) Basic Study on Horticulture Sector in Gilgit Baltistan, JICA
Much of the landscape is mountainous with most settlements located between 1,000 and
3,000m above sea-level, although several of the highest peaks reach over 8,000m. Annual
rainfall is between 100 and 500mm with most streams, rivers and irrigation schemes
originating from glaciers and snow melt. There are four agro-climatic zones, based upon
altitude, as shown in Table b). The climate is temperate with temperatures ranging from -
30°C in winter to +47
°C in summer.
Table b): GB Agro-Climatic Zones
Zone Characteristics
Double cropping zone <1,900m asl. Typically winter wheat followed by
maize.
Intermediate zone
1,900 – 2,300m asl. Marginal double cropping zone
through use of short-season crops and early maturing
varieties e.g. wheat/barley and vegetables. Main
apricot growing zone.
Single cropping zone 2,300 – 3,000m asl. Typically barley or vegetables.
Alpine pasture >3,000m asl. No cultivation.
Source: AKRSP (2010) Basic Study on Horticulture Sector in Gilgit Baltistan, JICA
Table c) shows land-use in GB. Due to the mountainous terrain only 2% is cultivable, of
which about 1% is currently farmed. The remainder is left barren due to lack of irrigation.
The average landholding in GB is approximately 0.75ha per household.
Table c): GB Land Use
Land Type Area (‘000ha) Percentage of Total Area

Page 39 of 58
Mountains/Lakes/Rivers/Glaciers 4,810 66
Forest 646 9
Pasture 1,646 23
Cultivated Area 58 1
Cultivable barren lands 90 1
Total 7,250 100
Source: NASSD, 2003
Table d) shows agricultural production in GB. Wheat, maize and barley are important food
crops with the majority being used for home consumption. Fruit, nuts and vegetables such as
potato are consumed and also sold to generate cash income.
Table d): Agricultural Production in GB
Crop Area (ha) Production (T)
Fruit & nuts
Wheat
Maize
Barley
Vegetables
25,012
17,090
17,685
5,281
10,109
169,373
36,835
47,010
9.851
153,017
Source: GB DoA statistics 2008
On average 41% of household income is sourced on-farm with 59% sourced off-farm through
small business, seasonal labour or professional employment.10
Agricultural production is
mostly subsistence and only a small amount is marketed. In 2008, per capita income averaged
PKR29, 426, or just 49% of the national average.11
Figure c) shows contribution shares of farm income. The largest share of farm income is
derived from crops (48%), including cereals and horticulture. The vast majority of crop
income originates from horticulture (83%), of which 60% is fruit such as apricot, apples,
mulberry, cherry and grapes.
10
SESNAC AKRSP, 2007 11
SESGBC, 2008

Page 40 of 58
Figure c): Percentage Share of Farm Income
Source: SESGBC, 2008
APRICOT: THE GLOBAL CONTEXT
Production Figure d) shows the production of fresh apricots for the ten largest producers by quantity.
Turkey is the world’s largest producer, growing 676,000 tonnes of fresh apricot in 2011. As
seen in Figure e), production has remained much the same between 2008 and 2011 at around
3.8 million tonnes/year.
Figure d): Apricot Production 2011
Source: FAOSTAT
National statistics for Pakistan must be understood within the political context. Due to GB’s
political status, national statistics have not included GB figures. Figure d) above states
Pakistan produced a total of 189,000 tonnes and the Pakistan Bureau of Statistics states
Balochistan region alone produced 176,000 tonnes of apricot in 2010/11. As GB produces in
excess of 100,000 tonnes this would put Pakistan as the fourth largest apricot producer in the
world, instead of sixth.
0 20 40 60 80 100
Livestock
Forest
Crops
Cereals
Horticulture
Vegetables
Fruit
All farm
Horticulture
Crop
0
100,000
200,000
300,000
400,000
500,000
600,000
700,000
800,000
Ton
ne
s
Country

Page 41 of 58
Consumption Consumption figures for apricot are not available; therefore, consumption trends are assumed
from production, export and import figures, as shown in Figure e). As total world production
has remained at about 3.8 million tonnes and export/imports remained at around 250,000
tonnes, it can be assumed global apricot consumption has remained more or less stagnant
since 2008.
Figure e): Assumed Apricot Consumption
Source: FAOSTAT and ITC data
Trade Flows Apricots are traded fresh, dried, canned, or processed into products such as jams and juices.
From Figure e) above it can be seen the majority of apricots are consumed by producing
countries and approximately only 7% of production is traded.
Fresh Apricot
The largest volumes of apricots traded are fresh apricots. Table e) shows that exports have
steadily increased by 21% from 2008 to 2011. Although France is only the world’s seventh
largest producer of apricots, in 2011 it exported 31% of its harvest, which is 19% of total
world exports, making it the global leader. France, Spain, Turkey and Uzbekistan accounted
for 53% of total fresh apricot exports.
Table e): Fresh Apricot Exports (Tons)
Year/Country 2008 2009 2010 2011
World
France
Spain
Turkey
Uzbekistan
209,797
29,155
35,658
22,101
9,781
250,374
60,327
40,901
18,446
15,211
253,215
47,812
29,157
25,845
21,552
253,267
48,650
31,456
28,489
26,629
Source: ITC
Table f) shows that fresh apricot imports have steadily increased since 2008 by 24%. Russia
is the largest importer and in 2011 accounted for 24% of world imports. Russia, Germany and
Italy together accounted for 50% of the world’s imports.
0
500,000
1,000,000
1,500,000
2,000,000
2,500,000
3,000,000
3,500,000
4,000,000
4,500,000
2007 2008 2009 2010 2011
Ton
ne
s
Year
Production
Export/Import

Page 42 of 58
Table f): Fresh Apricot Imports (Tons)
Year/Country 2008 2009 2010 2011
World
Russia
Germany
Italy
Kazakhstan
210,980
57,779
36,943
16,267
251
251,796
58,481
45,588
32,983
327
250,221
54,850
45,702
16,059
4,663
261,737
61,915
44,280
23,781
17,682
Source: ITC
Dried Apricot
Although worth more in value than fresh apricot, dried apricot exports have slightly
decreased since 2008. As well as being the world’s largest producer of apricots, Turkey is the
leading exporter, exporting 62% of all world exports in 2011 (see Table g).
Table g): Dried Apricot Exports (Tons)
Year/Country 2008 2009 2010 2011
World
Turkey
Tajikistan
Uzbekistan
Kazakstan
147,028
98,178
26,403
2,999
0
152,440
101,234
32,233
4,315
21
144,487
92,687
29,847
5,580
0
146,649
90,321
23,544
9,407
5,394
Source: ITC
Table h) shows that imports of dried apricots have also decreased since 2008. Previously
Russia was the world’s largest importer; however, most recent statistics show imports more
than halved in 2011. Also, Kazakhstan rose from being a minor importer to a world leader in
the same year. Although also declining, traditional American and British markets have
remained comparatively stable over recent years.
Table h): Dried Apricot Imports (Tons)
Year/Country 2008 2009 2010 2011
World
Kazakhstan
Russian Federation
USA
UK
150,441
96
46,686
14,588
11,345
151,488
742
48,768
15,238
10,069
147,374
3,597
44,815
13,499
9,865
138,256
24,876
18.364
13,715
9,050
Source: ITC
Processed Apricot
Table i) shows that exports of processed apricot have fluctuated over recent years but have
increased slightly in 2011, when Spain, Greece and South Africa exported 50% of the world’s
processed apricots.
Table i): Processed Apricot Exports (Tons)
Year/Country 2008 2009 2010 2011
World
Spain
Greece
South Africa
China
131,940
19,913
16,102
25,386
20,458
116,528
20,354
8,626
22,839
15,948
121,312
17,785
17,189
22,226
15,507
138,368
24,496
23,010
20,291
18,783
Source: ITC

Page 43 of 58
Table j) shows imports of processed apricots have slightly decreased since 2008. France,
Germany and Netherlands imported 52% of the world’s processed apricots in 2011. Although
traditional European markets have remained comparatively steady, Russian imports have
decreased by 41% since 2008.
Table j): Processed Apricot Imports (Tons)
Year/Country 2008 2009 2010 2011
World
France
Germany
Netherlands
Russian Federation
163,580
38,774
33,844
8,933
17,032
136,743
33,296
32,349
8,521
7,271
146,609
36,787
34,702
10,539
9,889
160,214
36,993
34,295
12,590
10,107
Source: ITC
Current Market Trends
Increasing trade in fresh apricot
From the statistics presented above it can be seen that whilst trade in dried and processed
apricot is stagnating or even declining, trade in fresh apricot is increasing. Trade in fresh
apricot has increased through improvements in cold-chain and transport technology.
Processing into pre-prepared health snacks
Dried apricots are increasingly being mixed with other ingredients to produce health products
such as pre-prepared apricot yoghurt and cereal/fruit bars.
Use of ‘Organic certification’ as a marketing tool
Apricot is often regarded as a health food. As such, there is also consumer interest in organic
certified products. Certification can be used as a marketing tool to differentiate against
similar competitor’s products and in some cases gain a price premium.
THE PAKISTAN APRICOT SECTOR
Enabling Environment
Government policy
The National Agriculture Policy (2009-14) follows a two-pronged strategy: a) increased
agricultural growth through bringing additional area under cultivation at the farm and country
level; and, b) modernising agriculture through farm mechanisation, crop diversification,
value-addition, and promotion of latest agricultural technologies.
At present, the GB Department of Agriculture does not have an agricultural policy and
receives less than 2% of the funds allocated to the Annual Development Plan.12
Nonetheless,
the GB Department of Agriculture has prepared a draft Horticulture Policy which seeks to
‘transform the horticulture sector into a viable, sustainable, profitable, market driven and
export-based horticulture industry’.
12
World Bank (2011) Gilgit Baltistan Economic Report

Page 44 of 58
Policy objectives include:13
Establish a demand driven Research System and strengthen the Agriculture Extension
Department
Develop a reliable crop forecasting and market information system
Extend and improve the quality of infrastructure, particularly in production areas
Establish certified fruit nurseries, seed production, and processing centers
Establish modern pack-house and cold chain infrastructure
Develop supply chains that provide availability of required quantity and quality inputs
in a timely manner
Increase productivity through the sustainable use of soil, climate, and human
resources and minimize the pre- and post-harvest losses
Promote public-private sector partnership throughout the value chain
Establish a Horticulture Development Board
Establish a Horticulture Germplasm Unit
Regulatory framework
Licenses
Licenses are not required for small-scale trading or for exporting. However, exporting
companies must be tax registered and members of the local Chamber of Commerce.
Taxes
GB is designated a tax-free zone and no company or personal income taxes are levied.
Nonetheless, value-added and export taxes are applied.
Infrastructure
Transport
GB has a total 4,997km of road, providing a road density of 0.06km/km², the lowest in
Pakistan, although road length per million people is the second highest in Pakistan.14
About
27%, or 1,361km, are sealed asphalted roads, with the remaining 3,636km being unsealed
shingle roads.
Much of the sealed road belongs to the Karakoram Highway (KKH). The KKH is 1,200km
long and runs from Islamabad north through Gilgit, past the Sost Dry Port, crosses over into
China at the Khunjerab Pass, and finally reaches Kashgar in the Xinjiang Autonomous
Region of China. A map of the KKH is shown in Figure f).
Major investments have also been made in the Sost Dry Port (SDP), which lies on the KKH
about 90km from the border with China, and provides facilities for trans-shipment and
inspection.
13
Ministry of Food & Agriculture (Undated) Horticulture Policy: Gilgit-Baltistan (Draft) 14
World Bank (2011) Gilgit Baltistan Economic Report

Page 45 of 58
Figure f): KKH Highway
In terms of Pakistan's exports to China, shipments through GB constituted only 1.5% of all
exports, while 83% of exported goods left from Karachi.15
The KKH is closed for three
months of the year during winter, and additional closures due to landslides are common. The
opening of Babusar-Naraan road is expected to improve road access to Islamabad. Armed
hijacking along the KKH is not unknown, further dissuading many people from travelling
overland in favour of flying.
GB has air links with Islamabad through airports at Gilgit and Skardu. Weather permitting,
daily flights are operated exclusively by Pakistan International Airlines.
Power
Although main district towns have been electrified through hydro-schemes, coverage is
limited in rural areas. The reliance on hydro-power can mean disrupted supply in the winter
as there is less glacial melt to run the turbines. Average installed capacity per capita (kW per
thousand) in GB is less than the Pakistan average and less of the GB population has access to
electricity (47%) than other provinces.16
Although the cost of electricity is subsidised, load-
shedding is common, causing daily disruption to power-based industries.
Communication
Gilgit Town has good mobile phone and internet access to the rest of the world.
15
World Bank (2011) Gilgit Baltistan Economic Report 16
World Bank (2011) Gilgit Baltistan Economic Report
Page 46 of 58
Research, development and extension services17
Currently, the GB Department of Agriculture (DoA) has over 500 staff with a central
directorate in Gilgit and offices in all the district headquarters. One field staff provides
extension services to approximately 600 farmers. However, outreach is severely hampered by
lack of operational budget.
The DoA has 49 nurseries across the districts and approximately 149,000 seedlings are
distributed to farmers each year. Food Processing Units have been established in Gilgit and
Skardu to train farmers in the preservation and processing of fruits.
The Mountain Agricultural Research Centre (MARC) is a Federal agency responsible for
adaptive research and varietal improvement of crops and livestock, including apricot.
Promising fruit tree varieties are disseminated through DoA nurseries.
In addition to The Agribusiness Project, the only other sector support programme for apricot
in GB is the JICA funded fruit project.
Finance18
GB has 105 formal banks, 19 microfinance institutions and 4,486 informal financial
institutions such as cooperative societies. Commercial banks in GB offer several financial
products including (i) Agriculture Development loans: long term loans for the purchase of
machinery and other components; and (ii) Agriculture production loans: small loans offered
to the farmers for purchase of seed, fertilizers and pesticides.
Trade agreements
Pakistan has been a member of the World Trade Organisation since 1995 and is also a
member of the South Asian Free Trade Area (SAFTA). Other SAFTA members include
Bangladesh, Bhutan, India, Maldives, Nepal and Sri Lanka. In 2006 Pakistan signed a Free
Trade Agreement (FTA) with China.
Pakistan does not have an FTA with Russia or the European Union, who are major importers
of apricot products. Previously, Pakistan did export apricot to the Middle East and an FTA
with the Gulf Cooperation Council, many of whom are members of the Arab League, is in the
final stages of negotiation.
Standards and Technical Barriers to Trade
There are no Pakistan ‘standards’ for apricots; however, there is a Codex standard for dried
apricots (Codex No: 130-1981). The Department of Plant Protection is responsible for
implementing Sanitary and Phyto-Sanitary measures for plant materials through its
quarantine outposts and issues Phyto-Sanitary Certificates according to the requirements and
trade agreements signed with the importing countries. However, some countries do not accept
this certification and testing is carried out in the importing country.
Certification
Third party voluntary certification, such as GlobalGAP, Hazard Analysis & Critical Control
Point (HACCP), Fair Trade and organic, is available in Pakistan.
17
AKRSP (2010) Basic Study on Horticulture Sector in Gilgit Baltistan, JICA 18
AKRSP (2010) Basic Study on Horticulture Sector in Gilgit Baltistan, JICA

Page 47 of 58
Apricot Production
Pakistan
Apricot production for Pakistan is shown in Figure g). These statistics do not include GB
production, which is shown in Table k). Since 2007, production has steadily declined in
Pakistan due to a decrease in area planted (from 31,256ha in 2007 to 29,634ha in 2011) and
declining yields (from 7,684kg/ha fresh fruit in 2007 to 6,392kg/ha in 2011).19
Figure g): Pakistan Apricot Production 2007-11
Source: FAOSTAT
Gilgit-Baltistan
It is estimated there are a total of 2,971,935 apricot trees in GB and apricots are the most
common fruit grown with an average 15 trees per household.20
The second most popular fruit
is apple with an average 5 trees per household.
Table k) shows area planted and production by district. Planting density is only 230 trees/ha,
which is much less than the recommended 750 trees/ha, due to apricots being planted around
field edges, rather than orchards. Average yields of fresh fruit are 38kg/tree which is good
considering the limited use of inputs, although yields of 50kg/tree can be achieved through
improved management.
19
FAOSTAT 20
SESGBC, 2008
0
50,000
100,000
150,000
200,000
250,000
300,000
2007 2008 2009 2010 2011
Ton
ne
s
Year

Page 48 of 58
Table k): Apricot Production in GB (2007)
District Area Planted
(ha)
Production
(MT)
Gilgit 1,201 9,169
Hunza/Nagar 1,790 21,156
Ghizer 1,475 14,491
Astore 560 2,932
Diamer 537 1,194
Skardu 4,871 40,649
Ghanche 2,487 22,723
Total 12,921 114,286
Source: Northern Areas Agriculture Statistics 2007, DoA, Gilgit
Area planted and production is highest in Skardu and Ghanche districts, whilst production is
also high in Hunza/Nagar district. Astore and Diamer are the two lowest producing districts.
Figure h) shows the contribution of apricot sales to farm household income by district. As
Gilgit is the regional capital, it is unsurprising only 20% of income is from apricots, as there
are other income generating opportunities available. In Ghanche and Skardu districts, apricot
sales account for over 70% of farm household income.
Figure h): Apricot Contribution to Household Income
Source: AKRSP (2010) Basic Study on Horticulture Sector in Gilgit Baltistan, JICA
Figure i) shows that 46% of the total apricot harvest is wasted, 49% are dried and 5% are
eaten fresh. For both fresh and dried apricot, roughly 40% is consumed at home and 60%
sold.
The structure of the apricot sector in GB reflects the previous geographical isolation from
markets, prior to construction of the KKH. Most of the apricot trees have been propagated by
farmers themselves from a wide variety of naturally growing cultivars indigenous to the area.
This has resulted in much of the harvest being low quality, unmarketable varieties and
explains the high level of wastage. Furthermore, the limited local market meant only enough
0 20 40 60 80 100
Gilgit
Hunza/Nagar
Ghizer
Astore
Diamer
Skardu
Ghanche
% contribution to household income
Dis
tric
t
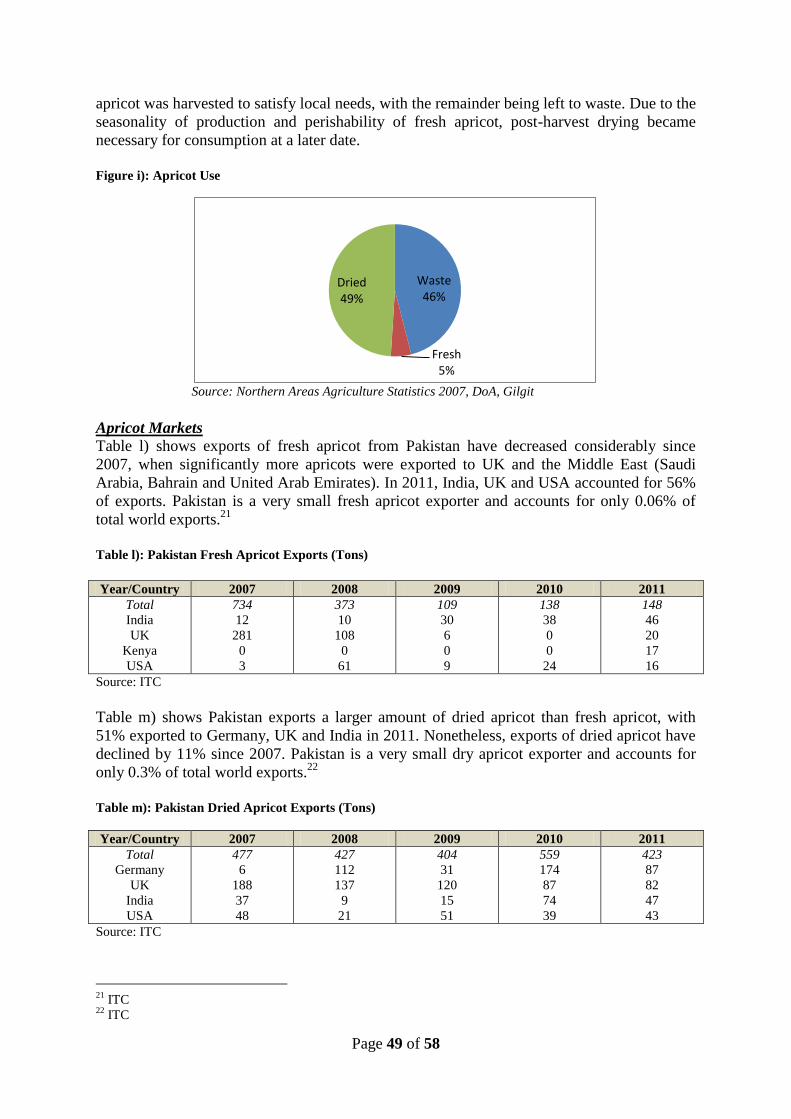
Page 49 of 58
apricot was harvested to satisfy local needs, with the remainder being left to waste. Due to the
seasonality of production and perishability of fresh apricot, post-harvest drying became
necessary for consumption at a later date.
Figure i): Apricot Use
Source: Northern Areas Agriculture Statistics 2007, DoA, Gilgit
Apricot Markets Table l) shows exports of fresh apricot from Pakistan have decreased considerably since
2007, when significantly more apricots were exported to UK and the Middle East (Saudi
Arabia, Bahrain and United Arab Emirates). In 2011, India, UK and USA accounted for 56%
of exports. Pakistan is a very small fresh apricot exporter and accounts for only 0.06% of
total world exports.21
Table l): Pakistan Fresh Apricot Exports (Tons)
Year/Country 2007 2008 2009 2010 2011
Total
India
UK
Kenya
USA
734
12
281
0
3
373
10
108
0
61
109
30
6
0
9
138
38
0
0
24
148
46
20
17
16
Source: ITC
Table m) shows Pakistan exports a larger amount of dried apricot than fresh apricot, with
51% exported to Germany, UK and India in 2011. Nonetheless, exports of dried apricot have
declined by 11% since 2007. Pakistan is a very small dry apricot exporter and accounts for
only 0.3% of total world exports.22
Table m): Pakistan Dried Apricot Exports (Tons)
Year/Country 2007 2008 2009 2010 2011
Total
Germany
UK
India
USA
477
6
188
37
48
427
112
137
9
21
404
31
120
15
51
559
174
87
74
39
423
87
82
47
43
Source: ITC
21
ITC 22
ITC
Waste 46%
Fresh 5%
Dried 49%
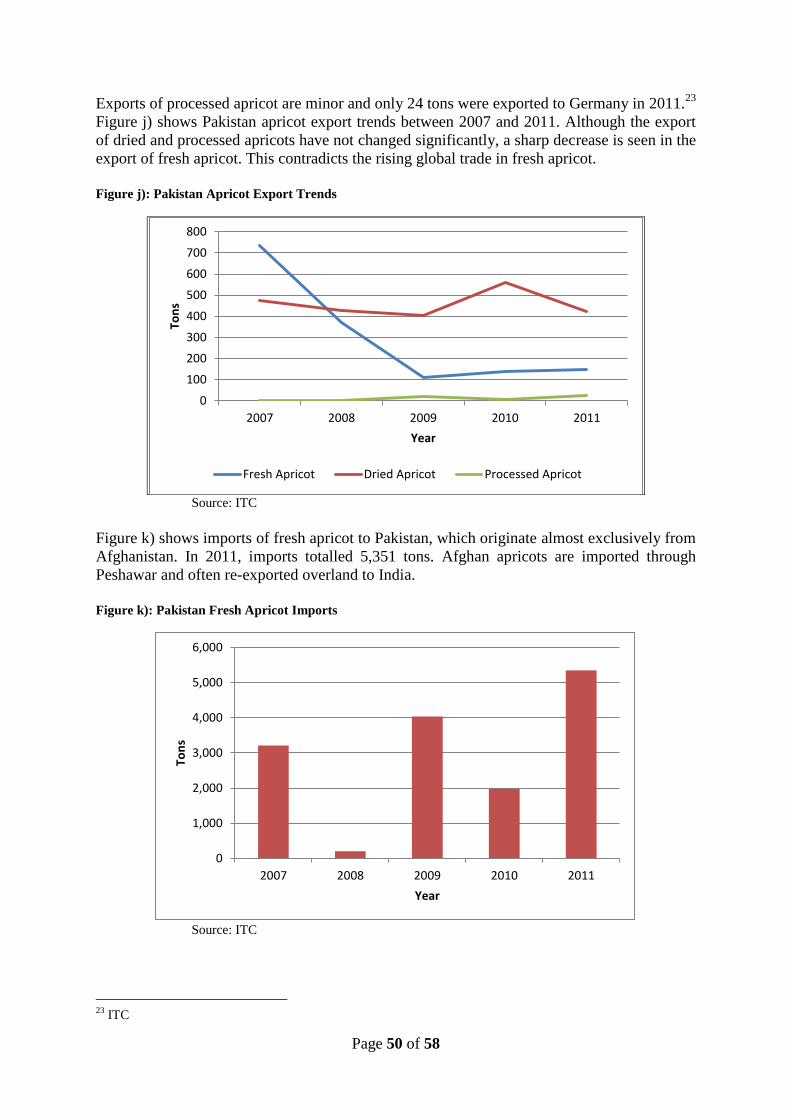
Page 50 of 58
Exports of processed apricot are minor and only 24 tons were exported to Germany in 2011.23
Figure j) shows Pakistan apricot export trends between 2007 and 2011. Although the export
of dried and processed apricots have not changed significantly, a sharp decrease is seen in the
export of fresh apricot. This contradicts the rising global trade in fresh apricot.
Figure j): Pakistan Apricot Export Trends
Source: ITC
Figure k) shows imports of fresh apricot to Pakistan, which originate almost exclusively from
Afghanistan. In 2011, imports totalled 5,351 tons. Afghan apricots are imported through
Peshawar and often re-exported overland to India.
Figure k): Pakistan Fresh Apricot Imports
Source: ITC
23
ITC
0
100
200
300
400
500
600
700
800
2007 2008 2009 2010 2011
Ton
s
Year
Fresh Apricot Dried Apricot Processed Apricot
0
1,000
2,000
3,000
4,000
5,000
6,000
2007 2008 2009 2010 2011
Ton
s
Year

Page 51 of 58
THE GB APRICOT SUPPLY CHAIN
Innate and market related commodity characteristics
Approximately 28 apricot varieties or cultivars are found in GB with different characteristics
regarding size, colour, sweetness and early/late maturity. Most local varieties have a Brix
Value of 14°Bx indicating high sugar content, causing a rapid deterioration after harvest and
a shelf-life of only eight hours. 24
The Charmagaz variety has white flesh and is eaten fresh.
Otherwise the Shakanda, Hobbi and Halman varieties have a tougher yellow skin, preferred
for drying.
Dried apricot is typically sold ‘split’ with the seed removed. They can also be sold ‘whole’
with the seed squeezed out, or as ‘halves’.
Apricot is a seasonal crop with harvest taking place in June, July and August. Higher prices
are paid for early and late maturing varieties. Fruiting is also determined by altitude with
apricots ripening earlier in the lower double cropping zone and later in the higher single
cropping zone.
Spatial and volume commodity flows
Figure l) shows a volumetric chain map for GB apricots. Only 8% of apricot produced is
eaten fresh, nearly half as home consumption. Three thousand tonnes enter the market, 87%
of which is sold down-country with only 400t being sold locally.
For 60,500 tonnes of fresh apricots processed, 6,600 tonnes of dry apricot are produced.
Twenty-three per cent is kept for home consumption and 5,000 tonnes are sold on to the
market. Thirty per cent is sold locally in GB with 3,500 tonnes being sold down-country.
As most households have apricot trees themselves, the local market is very limited. Of the
dried apricot sold down-country, roughly 70% is sold in Rawalpindi.
Figure l): Volumetric Chain Map of GB Apricots
Source: Based upon: Apex (2010) Commercial Potential of GB Apricot, SDC
24
Apex (2010) Commercial Potential of GB Apricot, SDC
Apricot production
66,000 t
Fresh apricot
5,500 t
Dried apricot
6,600 t
Home consumption
2,500 t
Sales
3,000 t
Home consumption
1,500 t
Sales
5,000 t
Sold in GB
400 t
Sold down-country
2,600 t
Sold in GB
1,500 t
Sold down-country
3,500 t

Page 52 of 58
A spatial chain map for all apricot in Pakistan is shown in Figure m). Main production
centres are Gilgit in the north and Balochistan in the south. The largest consumption centre is
Karachi (11.1 million population), although the Punjab cluster of Lahore, Faisalabad,
Rawalpindi and Islamabad has a combined population of 12.1 million. As such, the Gilgit
apricots supply the Punjab market, and the Balochistan apricots supply the Karachi market.
Gilgit apricots are competing with fresh apricots imported from Afghanistan, via Peshawar,
some of which are re-exported overland to India. Dried apricots exported to Europe mostly
originate from Balochistan and are shipped from Karachi.
Figure m): Spatial Chain Map for Apricots in Pakistan
Legend
Apricot consumption centres Apricot production areas
Domestic apricot trade routes Apricot imports
Apricot exports

Page 53 of 58
Institutional commodity flows
Figure n) shows the different institutional chain maps for GB apricots. Production is carried
out by smallholder producers who also carry out the drying process. The majority of the
harvest is dried and sold down-country through auctions. Apricots are bought at farm-gate by
collectors/traders or delivered to wholesalers based in Gilgit. The wholesalers in Gilgit
usually operate a retail store in the market and trade in several agri-food products, e.g.
apricot, cherry, walnut and almond. The Gilgit wholesaler carries out some cleaning and
sorting and bag the dried apricot into 50kg hessian bags for transport down-country and sale
to wholesalers or through auction markets in other regions (See map above).
There are a few small processors in Gilgit who carry out additional transformation of the
dried apricot into a high-value product for export. Dried apricots are bought direct from
farmers, then cleaned and graded. The apricot is packed in Gilgit, transported overland to
Karachi and shipped in a container via Felixstowe to buyers in UK. Apricot oil processors
also buy the discarded kernel from farmers, extract the oil and package it for sale to
customers down-country.
Fresh apricot is often bought as a standing crop by a down-country ‘contractor’. The
contractor pays a lump sum to the farmer and then organises the harvest, packing and
transport of the apricot to auction markets down-country.
Figure n): Institutional Chain Map of GB Apricots
GROSS MARGINS AND EMPLOYMENT Estimates of gross margins and employment generated by apricots are calculated below.
Roughly 100,000 farm households produce apricot for market from June to August. Apricot
is only one crop cultivated on a farm and only one fruit of many processed and traded. None
Overseas
processor/distributor
Smallholder Producers
Collector/Trader
(Commission)
Wholesaler
(Gilgit)
Wholesalers/auction
(down-country)
Domestic retailer
Processor /Exporter
(Gilgit)
Contractor
(buys standing crop)
Wholesaler auction
(down-country)
Domestic retailer
Processor
(Gilgit)
Domestic retailer
Fresh apricot Apricot oil
Dry apricot

Page 54 of 58
of the chain stakeholders are totally dependent on apricot as a source of income or
employment.
Fresh apricot
Fresh apricot retails for PKR60/kg (US$0.63/kg), compared to PKR180/kg for dried apricot.
However it takes approximately 6kg of fresh apricot to make 1kg of dried apricot and the
opportunity cost of dried apricot is PKR360/kg (6 x PKR60). Therefore fresh apricot fetches
the highest price in real terms.
Dried apricot
In 2012, farm-gate prices fluctuated between PKR80-140/kg (US$0.84-1.47/kg) for good
quality dried apricot, although poor quality prices can be as low as PKR45/kg. Based upon
supply, prices are highest early and late season. As no inputs are used for apricot production,
costs are negligible. Labour is required for harvest and drying but this is carried out by family
members at no cash cost. A conservative farm household income for apricot production is
calculated in Table n), based upon harvesting 15 trees with 46% wastage and selling for the
lowest price.
Table n): Farm Income from Dried Apricot
Farm Income
15 trees x 38kg/tree = 570kg fresh apricot
Deduct 46% wastage (263kg) = 307kg
Drying: 6kg fresh to 1kg dried apricot = 51kg dried apricot
Farm-gate price of PKR80/kg = Income PKR4,080 (US$43)
There are approximately 50 apricot traders in GB employing approximately 200 staff. Prices
received by traders for dried apricot delivered to Rawalpindi fluctuated between PKR100-
160/kg (US$1.05-1.68/kg) for good quality dried apricot in 2012. A gross margin for traders
is shown in Table o).
Table o): Gross Margin for Domestic Dry Apricot Traders
Income:
1kg dried apricot = PKR100
Costs:
Dried apricot from farmer = PKR80/kg
Transport Gilgit to Rawalpindi = PKR5/kg
Labour – sort and bag = PKR10/kg
Sub-total costs = PKR95/kg
Gross Margin = PKR5/kg
Although margins per kilogramme are small, the larger traders may sell 200 tonnes of apricot
in a season providing a gross margin of PKR1,000,000 (US$10,526).
Apricot Oil
There are two commercial apricot oil processors in GB, employing 10 staff and producing
approximately 20,000 litres of oil per annum. A gross margin for apricot oil processing is
presented in Table p).

Page 55 of 58
Table p): Gross Margin for Apricot Kernel Oil
Income:
1 litre apricot oil = PKR800
Costs:
2.5kg dried apricot kernel from farmer @ = PKR180/kg = PKR45025
Transport Gilgit to Lahore = PKR6/litre
Labour – press and pack = PKR24/litre
Sub-total costs = PKR480/kg
Gross Margin = PKR320/litre
Table q) shows the total value of fruits produced in GB. Although apricot has a lower unit
value than other fruit, gross income is more because of the volume produced. Total apricot
income for GB in 2007 was estimated at PKR579,860,000 (US$6,103,789).
Table q): Total Value of Fruits Produced in GB (‘000 PKR)
Fruit Production
(Tonnes)
Average Farm-Gate Price
(PKR/kg)
Value
(‘000 PKR)
Apricot 108,588 5.34 579,860
Apple 19,054 21.20 403,945
Grapes 6,413 30.21 193,737
Pears 2,579 24.45 63,057
Peaches 3,308 14.58 48,231
Pomegranate 4,287 59.52 255,162
Cherry 2,256 94.30 212,741
Walnut 5,992 90.00 539,280
Almond 1,700 120.00 204,000
Total 2,500,012
Source: AKRSP (2010) Basic Study on Horticulture Sector in Gilgit Baltistan, JICA
Based upon the above figures, apricot income distribution is estimated in Figure o). Farmers
capture 96% of the income for apricot, which is very high and shows the importance of
apricot for farm household income in GB.
Figure o): Apricot Income Distribution
25
2.5kg kernel makes 1litre oil
Farmers 96%
Traders 3%
Oil processors
1%

Page 56 of 58
VALUE ADDITION ACTIVITIES
Exchange
There is no wholesale auction market for fruit in Gilgit. Prices are negotiated between the
farmer and the buyer and are based upon apricot prices in wholesale auction markets down-
country. Gilgit wholesalers deduct costs and profit margin from the down-country price to
arrive at the farmer price.
There are no market information services but farmers in Gilgit are increasingly able to find
price information from wholesale markets down-country via mobile phone.
Processing
Apricot processing in GB is limited to drying and is carried out by farmers as an initial means
of preserving the fruit. Additional processing is also carried out by some exporters to improve
quality and meet international standards. A by-product of drying apricots is the extraction of
oil from the discarded kernel. Figure p) shows the process of transforming fresh apricot into
high quality dry apricot for export and also the process of extracting oil from the discarded
kernel.
Dried Apricot
Primary processing is undertaken on-farm. Apricot is typically sun-dried on roof-tops for a
three day period. The stone is traditionally removed by splitting the apricot, with the apricot
turned inside-out and dried for a further 2-3 days. Contamination with dust and dirt is
common during this process. To produce whole fruits, the stone can be squeezed out.
The drying process can be improved through treating the apricot with sulphur dioxide.
Sulphuring kills bacteria, retains the bright orange colour and extends shelf-life. The apricots
once dried are sorted with any defects such as ruptured, unripe or off-colour fruits, for
discard. The apricots are then bagged into 30kg bags for sale to processors.
At this point traditional wholesale traders will carry out some grading before re-bagging the
apricot into 50kg bags for transport by truck down-country. However, processors will carry
out further washing of the apricot, followed by solar or electric drying. Final quality control
is carried out through grading and the apricot oiled to improve appearance. The top quality
apricots are then packed into 15kg cartons prior to export.
Apricot Oil
The apricot seed is dried and the shell removed by farmers. The shell is used as fuel for
cooking. The remaining kernel is sold to processors and put through a cold-press to extract
the oil. Once the oil has been extracted, the residual cake can be used as a livestock feed. The
oil is left to settle for 2-3 days and the sediment removed to leave the pure oil. The oil is
poured into 250, 500 or 1,000ml bottles and mostly sold to a pharmaceutical company in
Lahore to manufacture livestock vaccines. Other uses are as a cooking ingredient and beauty
treatment, e.g. body oil/soap/shampoo.

Page 57 of 58
Figure p): Dried Apricot and Kernel Processing
Storage and Transport Refrigerated transport can be hired from Islamabad but there are no refrigerated storage
facilities in GB. Dried apricot does not require any specialised storage apart from being dry,
clean and pest free. Traders have their own basic warehouses for bulking up and temporary
storage of produce prior to transporting it down country. Transport is often contracted from
the several haulage contractors based in Gilgit.
Fresh Apricot
De-stoned
Sun-dry 3 days / sulphuring
Kernel
Sorted
Sun-dry 2-3 days
Rejects -ruptured,
unripe, black fruit
Bagged (30kg)
ON-FARM
Washing
Grading
Solar / electric
drying
Packing
(15kg cartons)
Oiling
PROCESSORS
Oil
Shelled
Dried
Cold press
Packing into 250,
500 & 1,000ml
bottles
Sedimentation
2-3 days

Page 58 of 58
INTRA-FIRM ORGANISATION
Farmers
There are approximately 100,000 farmers in GB producing apricots. The Aga-Khan Rural
Support Project (AKRSP) has supported the establishment of Mountain Area Fruit Farmer
Associations (MAFFA) which has improved horizontal integration between producers for
bulking up produce and accessing markets.
Traditionally, individual farmers will group together through family clans to bulk up produce
for sale. However, unless repaying loans, farmers do not have supply contracts with traders
and will sell to the trader offering the best price.
Collectors/small traders
There are approximately 35 collectors/small traders who buy from individual farmers at farm-
gate. They will often be advanced money by a wholesaler and receive a commission on the
amount of apricot bought from farmers and supplied to the wholesalers.
Wholesalers
There are approximately 15 wholesalers in Gilgit who source apricot direct from farmers or
through collectors/small traders as described above. Wholesalers sometimes develop long-
term relationships with farmers and advance them cash in the winter, in return for the apricot
harvest the following summer.
Gilgit wholesalers will supply around three wholesalers in down-country markets. Down-
country wholesalers will place individual orders with Gilgit wholesalers. Long-term supply
contracts are not common. In times of glut, Gilgit wholesalers will send apricot to the auction
market to be sold via a commission agent.
To avoid trucks returning empty to Gilgit there is some reciprocal trading between Gilgit and
down-country wholesalers. For example Gilgit wholesalers will sell apricot to the down-
country wholesaler and the down-country wholesaler will sell walnut to the Gilgit wholesaler
for export to China.
Specifically for the fresh fruit market, there are wholesale contactors who buy the standing
crop of apricot and pay a lump sum to the farmer for the whole harvest. The contractor hires
labour to harvest the apricot, packs it in 12kg wooden boxes and transports it to auction
markets down-country for sale. No sorting or grading is carried out, resulting in poor quality
and low prices.
Processors/exporters
Processors/exporters seek to produce a high quality product for export to high-value markets.
Processors will invest in training farmers to improve harvest and drying, often providing
inputs such as drying trays. Due to this investment, the processors develop a long-term
relationship with the farmers. Similarly, the processors develop long-term agreements and
supply contracts with overseas buyers. Although vertical integration is evident for processors,
there is very little horizontal collaboration between processors to access new markets.