Embed Size (px)
Citation preview

Successful Strategy Performance reflects balanced portfolio structure
2016
2
Disclaimer
Some statements and estimates in this material may represent expectations about future events or results that involve risks and uncertainties known and unknown. There is no guarantee that the events or results referred to in these expectations will occur.
These expectations are based on present assumptions and analyses from the viewpoint of our management, based on their experience, the macroeconomic environment, market conditions in the energy sector and our expected future results, many of which are not under Cemig’s control.
Important factors that can lead to significant differences between actual results and projections about future events or results include Cemig’s business strategy, Brazilian and international economic conditions, technology, Cemig´s financial strategy, changes in the energy sector, hydrological conditions, conditions in the financial markets, uncertainty regarding future results of operations, plans and objectives as well as other factors. Because of these and other factors, our actual results may differ significantly from those indicated in or implied by these statements.
The information and opinions contained herein should not be understood as a recommendation to potential investors and no investment decision should be based on the truthfulness, or completeness as of the date hereof of this information or these opinions. None of Cemig’s professionals nor any of their related parties or representatives shall have any liability for any losses that may result from the use of the content of this presentation.
To evaluate the risks and uncertainties as they relate to Cemig, and to obtain additional information about factors that could lead to different results from those estimated by Cemig, please consult the section on Risk Factors included in our Formulário de Referência filed with the Brazilian Securities Commission – CVM, and in Form 20-F filed with the U.S. Securities and Exchange Commission – SEC.
All figures are in BR GAAP.

3
Brazil’s Leading Power Utility
Integrated Power Utility in Brazil
#1
+23%
Growth in EBITDA 2008-15
#4 (2)
Market cap US$ 3.2(1) B.
Leading consolidator
Role in industry
In the Power Industry since 1952 (1) As of November 10th, 2016 (2) In the Brazilian Energy Industry

4
Cemig: Strength in Numbers
Power plants 109
Total installed capacity 8.1 GW
Power Transmission lines 9,500 km
Electricity Distribution lines 532,000 km
79 27 1 2

5
● Based in State of Minas Gerais, controlling shareholder – Assets in 23 Brazilian states
● Strong financial profile: – 3Q16 Net revenues: R$14.1 B EBITDA: R$2.5 B – 3Q15 Net revenues: R$16,1 B EBITDA: R$4.5 B
● Highest liquidity in the sector
– listed on 3 stock exchanges New York, São Paulo, Madrid – More than 120,000 shareholders in more than 40 countries – Average Daily Trading Volume in 2016, up to September 30th
R$54.1M in Bovespa and US$9.7M in NYSE
● Solid dividend policy – Minimum 50% payout ratio – Every two years, may pay extra dividends, if cash conditions permit
● Shareholder Structure:
Cemig at a Glance
O t he r s t ock ho lde rs
ON – 51% PN – 0% ON – 16% PN – 94% PN – 3% ON –13% ON – 20% PN – 3%
BN D ESPA R AG C En e r g i a S . A .

6
Cemig is Uniquely Positioned
The Brazil advantage
An Emerging Powerhouse Economy
Latin American economy #1
Ranking of economy in world(1) #9
GDP growth 2016(2) -3.31%
GDP 2015 R$5.9 Trillion
Population 206 M
(1) World Bank (2) Brazil’s Central Bank Focus Report, November 04st 2016

7
Cemig is Uniquely Positioned
Unmatched scale
Largest Integrated Utility in Brazil
Power Generation
Power Generation (under construction)
Power Transmission
Power Transmission (under construction)
Electricity Distribution
Cemig “Free Consumer” Clients
Wind Power Generation
Natural Gas Distribution
Telecom Backbone Provider
Integrated Power Utility in Brazil #1
Electricity Distributor
#1 Largest Power Transmission
Group
#1 Largest Power
Generation Group
#3
23 states
Presence in
PB
AM
AC
RO
PA MA
RR AP
PI
CE RN
PE
AL
SE BA
TO
MT
GO
MS SP
PR
SC
RS
ES
RJ
MG DF

8
4.172
592 1.045
-854
Generation Transmission Distribution Others
Diversified portfolio
Cemig is Uniquely Positioned
Diversified, Low Risk Business Portfolio
3.791
774
1.570
245
Breakdown of Ebitda
Most of the revenues are inflation protected
2015 2014

9
Leader in Renewable Hydro Power Energy
Power Generation by Source
Renewable Leader
World2014
Brazil2016
Cemig2016
44%
28%
2%
11%
2%
17% 64%
95%
28%
6% 3%
Fossil Source Fuels Nuclear Hydro Others
Source: EPE [BEN 2011 – Preliminar Results and IEA [Key World EnergyStatistics-2010]

10
Best-in-Class Corporate Governance
Strong governance
Minas Gerais, controlling shareholder – a positive influence
• One of fastest growing, investor-friendly states in Brazil
• Growth and profitability interest aligned with minority shareholders
• 7 from a total of 15 members are appointed by minority shareholders
Pro-market corporate bylaws include
• Minimum 50% dividend payout
• Capex limited to 40% of EBITDA
• Net debt limited to 2.5x EBITDA
• Net debt limited to 50% of total cap.
Leader in sustainability
• Only Latin American utility in DJSI – Dow Jones since 1999
• Included in the ISE – Bovespa Sustainability Index since 2005
Present in the Global Dow Index
Minas Gerais

11
R$ million
EBITDA Margin: 16%
EBITDA
2.512
4.238
5.186
6.382
4.954
3.009
2012 2013 2014 2015 LTM
Sept/16
LTM - Last twelve months

12
2,700
641
4,272*
3.104 3.137
2.492
947
2012 2013 2014 2015 LTM
R$ million
Net Income
Net Margin: 5%
Sept/16
LTM - Last twelve months *Includes non-recurring gain of R$1,572 million with the CRC´s (Accounts receivable from Minas Gerais State government) anticipated settlement.

13
Dividend Yield (%)
Attractive and Secure Dividend Payout
89
106
53
142
25 25
73
50
2011 2012 2013 2014 2015 in 2016
Paid Average Policy
12,4
22,0
9,2
23,5
4,6
5,7
2011 2012 2013 2014 2015 in 2016
Dividend Payout
(% of Net Income)

14
Net debt to EBITDA 4.53x
Debt in foreign currency(*) 0.2%
Net Revenue – sept/16 R$14.1B
Cash on hand R$2.7B
Strong Balance Sheet to Support Growth
*Net of financial hedging

15
3.997 4.205
4.755 5.097
5.382
3.235 3.404 3.849
4.126 4.357
2016 2017 2018 2019 2020
EBITDA Guidance – 2015/2019
Figures in constant 2016 currency
Main assumptions
- Average annual market growth rate of 1.7% GT and 2.6% D (2017-2020)
- Creation of seven SPV to operate the plants of the 2015 Concessions Auction (‘Lot D’)
- Considers Jaguara and São Simão up to June 2016, and Miranda up to December 2016
- Excludes benefits from indemnities received from expired generation concession contracts
- Value revision of transmission indemnity considering rules set by Mining and Energy Ministry (impact
on financial revenue/expenses)
2016 2017 2018 2019 2020
>4
<2.5
Net debt / Ebitda

16
Cemig - consolidated debt profile
R$ million
Leverage – %
73%
25%
1% 1%
CDI
IPCA
URTJ
RGR/Others
• Total net debt: R$ 13.6 bn
• Maturities timetable – Average tenor: 2.3 years
• Roll over of R$ 716 million in Oct/16 - Cemig D
• Payment of R $ 659 million in Oct/16 - Cemig GT
$ 176 of 2016, $ 328 of 2017 and $ 155 from 2018
Main indexors
Cost of debt – %
4,51 4,55 5,03 4,50 3,74 5,58 5,33 5,22
9,81 10,32 11,74
13,88 14,28 15,13 15,67 15,82
2012 2013 2014 set/15 2015 mar/16 jun/16 set/16
Real Nominal
Net debt
Stockholders’ equity + Net debt
Net debt
Ebitda
50,7
43,8
47,4
50,5 48,4 48,9
2014 set/15 2015 mar/16 jun/16 set/16
1,80 1,67 2,40 4,39 5,26 4,53
Highlights

17
Cemig GT – debt profile
R$ million
Total net debt: R$8.2 billion
Maturities timetable – Average tenor: 1.6 years Main indexors
Cost of debt – % Leverage – %
Net debt
Stockholders’ equity + Net debt
Net debt
Ebitda
84%
15%
1%
CDI
IPCA
OUTROS
3.233
2.698
1.724
161 329 314 324 28
2016 2017 2018 2019 2020 2021 2022 2023 emdiante
5,09 4,66 5,37 4,19 4,35 3,66
5,05 5,22 5,40
11,14 10,76 12,11
13,42 13,63 14,41 14,77 15,15 15,41
2012 2013 2014 jun/15 set/15 2015 mar/16 jun/16 set/16
Real Nominal
63,8
48,3 54,1
60,8 58,6 60,2
2014 set/15 2015 mar/16 jun/16 set/16
1,36 1,15 1,30 2,97 3,26 3,13
Roll over of R$ 716 million in Oct/16

18
Cemig D – debt profile
R$ million
Total net debt: R$5.4 bilhões
Maturities timetable – Average tenor: 3.1 years Main indexors
Cost of debt – % Leverage – %
Net debt
Stockholders’ equity + Net debt
Net debt
Ebitda
59%
40%
1%
CDI
IPCA
RGR/Outros
763
1.621 1.816
925
715
490
217
660
2016 2017 2018 2019 2020 2021 2022 2023 emdiante
5,19 4,40 4,79 4,68 4,01 6,04 5,55 4,85
9,56 9,98 11,47
14,24 14,31 15,68 16,45 16,46
2012 2013 2014 set/15 2015 mar/16 jun/16 set/16
Real Nominal
69,4 69,4 70,4 66,5 65,4 65,6
2014 set/15 2015 mar/16 jun/16 set/16
3,90 4,51 6,10 5,58 6,17 6,59
Payment of R $ 659 million in Oct/16 $ 176 of 2016, $ 328 of 2017 and $ 155 from 2018 Balance of 2016 will be fully paid

19
Solid fundamentals assured by excellent financial management, stable profitability, strong cash generation and robust corporate governance.
Superior credit capacity
A(bra) Cemig H, Cemig GT and Cemig D
Baa1.br Cemig H, Cemig GT and Cemig D National Scale
B1 Cemig H, Cemig GT and Cemig D Global Scale
brBBB+ Cemig H, Cemig GT and Cemig D National Scale
B+ Global Scale Cemig H, Cemig GT and Cemig D
Investment Grade Speculative Grade
AAA AA+ AA AA- A+ A A- BBB+ BBB BBB- BB+ BB BB- B+ B B- CCC CC C RD/D
National Scale
Grau de Investimento Grau Especulativo
Aaa Aa1 Aa2 Aa3 A1 A2 A3 Baa1 Baa2 Baa3 Ba1 Ba2 Ba3 B1 B2 B3 Caa1 Caa2 Caa3 Ca C
Grau de Investimento Grau Especulativo
AAA AA+ AA AA- A+ A A- BBB+ BBB BBB- BB+ BB BB- B+ B B- CCC+ CCC CCC- CC C D
In November 2016

20
Leading power utility in Brazil
Consistent profitable track record
Sound Balance Sheet
Powerful drivers fueling growth
Strong Dividend Policy
World Leader in Sustainability
Why Invest in Cemig

21
Brunei
Japan
India
Malaysia
Singapore
South Korea
Taiwan
China
ASIA
Australia
New Zeland
OCEANIA
North America
Canada
USA
South America
Argentina
Brazil
Chile
Uruguay
Central America
Bahamas
Bermuda
Cayman islands
EUROPE
Austria
Belgium
Denmark
France
Finland
Germany
Guernsey
Greece
Holland
Ireland
Italy
Malta
Jersey
Liechtenstein
Luxembourg
Norway
Portugal
Spain
Sweden
Switzerland
UK
South Africa
Africa
UAE
Kuwait
Oman
Saudi Arabia
Middle East
Strong shareholders base assures liquidity
Average daily trading volume of shares in 2016
Bovespa: R$54.1 million NYSE: US$9.7 million
Shares traded on 3 stock exchanges
Over 120,000 stockholders in more than 40 countries
NYSE (2015)
CIG US$ 3.1billion CIG.C US$ 1.5 million
BOVESPA (2015)
CMIG4 R$ 10.9 billion CMIG3 R$ 232 million
LATIBEX (2015)
XCMIG € 25.3 million

22
ADR outstanding approximately 22% of total shares and 34% of PN shares 1 ADR = 1 share in Bovespa ON shares have voting rights
Our shareholder diversity provides a global business
management vision focused on sustainability of the company's
activities
Listed in major stock exchanges
BOVESPA (Brazil) ,NYSE (USA) and LATIBEX (Spain)
Total Shares
Total shares 1,258,841 thousand
Common - ON 420,764 thousand
Preferred - PN 838,076 thousand
Free float 826,957 thousand (98,7%)
ADR CIG 284,918 thousand
Free float 206,187 thousand(49%)
ADR CIG.C 462 thousand
Share nominal value = R$5.00
The blend of shareholders provides long term perspective
ON
33% PN
67%
51%
20%
27%
2% ON
MG government AGC Energia SA
Local Investors International Investors
3%
25%
72%
PN

23
CEMIG GT - Ebitda Guidance – 2016/2017
Source: Cemig. Figures in constant 2016 currency
-
200
400
600
800
1.000
1.200
1.400
1.600
1.800
2.000
2016 2017
2016 2017
Upper limit 1,646 1,937
Lower limit 1,333 1,568

24
CEMIG D - Ebitda Guidance – 2016/2017
Constant June 2015 R$ million
Source: Cemig.
-
200
400
600
800
1.000
1.200
1.400
1.600
1.800
2016 2017
2016 2017
Upper limit 1,448 1,578
Lower limit 1,173 1,277

25
Brazilian National Grid: projections made in 2015 for 2015 –19
Source: PMO ( Monthly Operation Program), May 2016. Analysis made by Cemig considering a GDP growth rate forecast of 1.36% in the
2016-2020 period (1st four-month revision,2016). Information provided from May to December during the first year.
2016 2017 2018 2019 2020
Surplus (%) 18,9% 18,6% 18,3% 16,2% 15,3%
Surplus 12.137 12.504 12.744 11.708 11.695
Reserve 1.911 1.819 2.356 2.550 2.642
Thermal 16.333 16.900 16.923 17.062 20.726
Wind / Bio 5.635 5.582 6.587 7.912 7.968
Hydro 54.260 57.132 58.875 59.222 59.338
Market 64.091 67.110 69.641 72.487 76.337
-
10.000
20.000
30.000
40.000
50.000
60.000
70.000
80.000
90.000
MW
-avera
ge

26
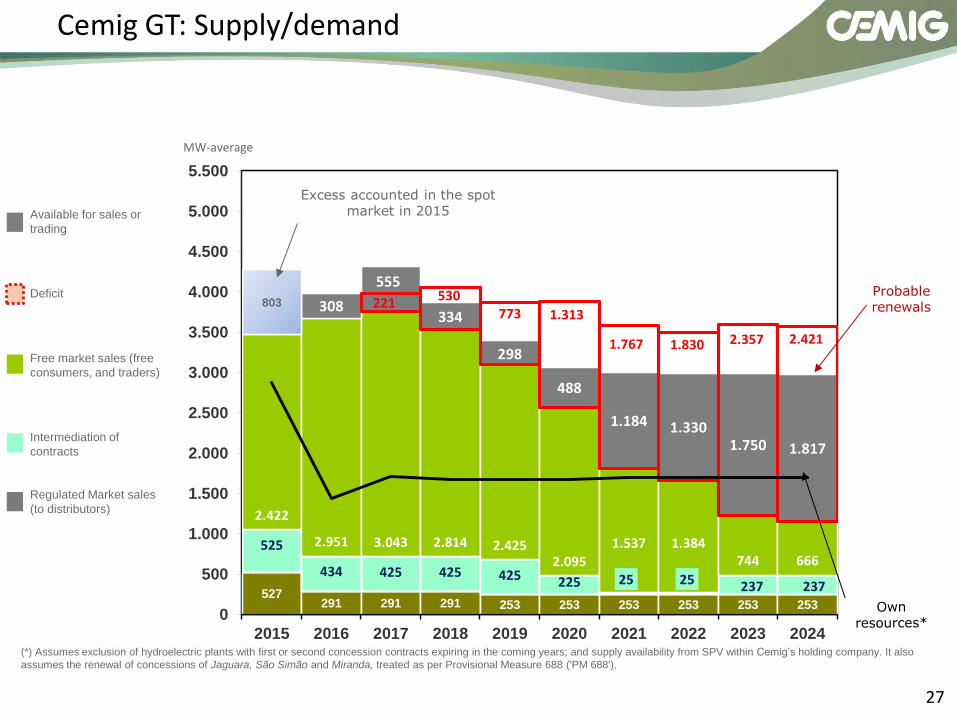
Cemig GT: Supply/demand
527 291 291 291 253 253 253 253 253 253
525
434 425 425 425 225 25 25 237 237
2.422 2.951 3.043 2.814
2.425
2.095 1.537
1.384 744 666
308 9
638 784 1.204 1.271
803
211
248
58
221
530 773 1.313
1.767 1.830 2.357 2.421
0
500
1.000
1.500
2.000
2.500
3.000
3.500
4.000
4.500
5.000
5.500
2015 2016 2017 2018 2019 2020 2021 2022 2023 2024
MW average
Probable renewals
Available for sales or
trading
Deficit
Free market sales (free
consumers, and traders)
Intermediation of
contracts
Regulated Market sales
(to distributors)
Excess accounted in the spot market in 2015
(*) Assumes exclusion of the Hydroelectric Plants of which the first or second concession periods expire in coming years; and supply availability from SPV within Cemig’s holding company.
27
527 291 291 291 253 253 253 253 253 253
525
434 425 425 425 225 25 25 237 237
2.422
2.951 3.043 2.814 2.425 2.095
1.537 1.384 744 666
308
555
334
298
488
1.184 1.330 1.750 1.817
803 221 530 773 1.313
1.767 1.830 2.357 2.421
0
500
1.000
1.500
2.000
2.500
3.000
3.500
4.000
4.500
5.000
5.500
2015 2016 2017 2018 2019 2020 2021 2022 2023 2024
MW-average
Cemig GT: Supply/demand
Probable renewals
Available for sales or
trading
Deficit
Free market sales (free
consumers, and traders)
Intermediation of
contracts
Regulated Market sales
(to distributors)
Excess accounted in the spot market in 2015
(*) Assumes exclusion of hydroelectric plants with first or second concession contracts expiring in the coming years; and supply availability from SPV within Cemig’s holding company. It also
assumes the renewal of concessions of Jaguara, São Simão and Miranda, treated as per Provisional Measure 688 ('PM 688').

28
MW-average 2015 2016 2017 2018 2019 2020 2021 2022 2023 2024
Own generation 2,393 1,438 1,050 1,018 1,018 1,017 1,016 1,014 1,014 1,014
Availability from SPV 0 10 128 128 128 128 156 156 156 156
Purchased 1,358 2,102 2,165 1,748 1,285 1,145 1,256 1,250 1,031 1,021
Total supply: 3,752 3,550 3,343 2,893 2,431 2,290 2,428 2,421 2,201 2,191
Sales: Free Market 2,422 2,951 3,043 2,814 2,425 2,095 1,537 1,384 744 666
Sales: Regulated Market 527 291 291 291 253 253 253 253 253 253
Total demand: 2,949 3,242 3,334 3,105 2,678 2,348 1,790 1,637 997 919
Balance available 803 308 9 -211 -248 -58 638 784 1,204 1,271
Hydroelectric supply As per MP 688
0 0 546 546 546 546 546 546 546 546
Balance available 803 308 555 334 298 488 1,184 1,330 1,750 1,817
Position as of March 31, 2016
Cemig GT: Supply/demand

29
Source: Cemig. Figures in constant 2016 currency
Average prices and the GSF (Generation Scaling Factor)
192 187 194 187 177
0,96 0,98
0,96
0,98
1,03
0,80
0,85
0,90
0,95
1,00
1,05
-
50
100
150
200
250
300
350
400
2016 2017 2018 2019 2020
Preço Médio GSFAverage price
30
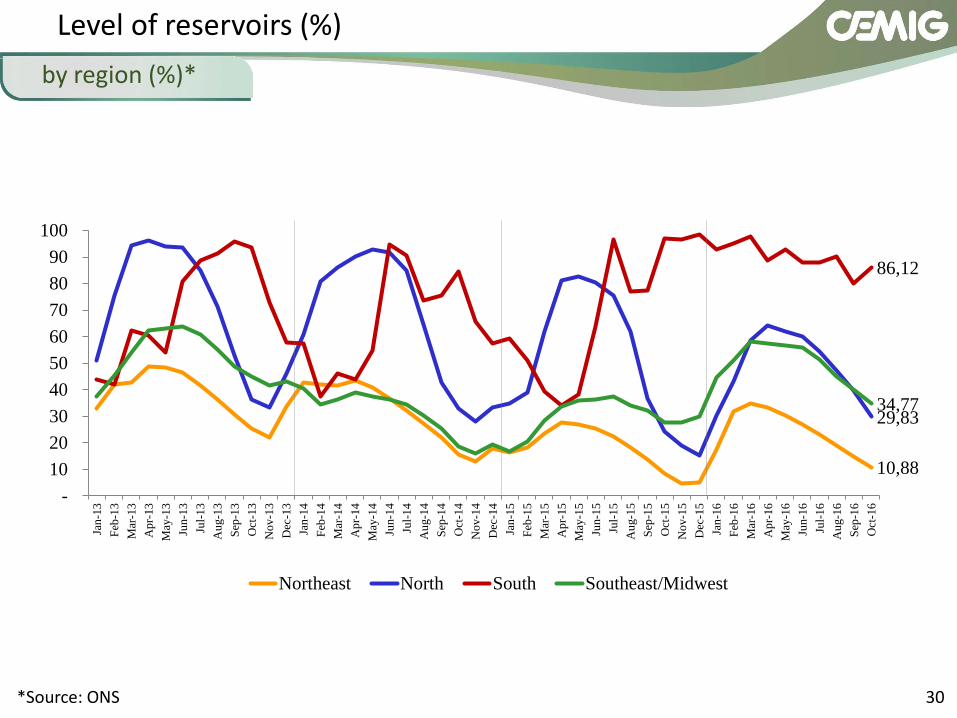
10,88
29,83
86,12
34,77
-
10
20
30
40
50
60
70
80
90
100
Jan
-13
Feb
-13
Mar
-13
Ap
r-13
May
-13
Jun-1
3
Jul-
13
Au
g-1
3
Sep
-13
Oct
-13
No
v-1
3
Dec
-13
Jan
-14
Feb
-14
Mar
-14
Ap
r-14
May
-14
Jun-1
4
Jul-
14
Au
g-1
4
Sep
-14
Oct
-14
No
v-1
4
Dec
-14
Jan
-15
Feb
-15
Mar
-15
Ap
r-15
May
-15
Jun-1
5
Jul-
15
Au
g-1
5
Sep
-15
Oct
-15
No
v-1
5
Dec
-15
Jan
-16
Feb
-16
Mar
-16
Ap
r-16
May
-16
Jun-1
6
Jul-
16
Au
g-1
6
Sep
-16
Oct
-16
Northeast North South Southeast/Midwest
Level of reservoirs (%)
by region (%)*
*Source: ONS

31
Minas Gerais state - Main Rivers and Plant

32
200,21 163,94
260,92
655,52
280,35
109,84
0
100
200
300
400
500
600
700
800
900
jan
/12
fev/
12
mar
/12
abr/
12
mai
/12
jun
/12
jul/
12
ago
/12
set/
12
ou
t/1
2n
ov/
12
dez
/12
jan
/13
fev/
13
mar
/13
abr/
13
mai
/13
jun
/13
jul/
13
ago
/13
set/
13
ou
t/1
3n
ov/
13
dez
/13
jan
/14
fev/
14
mar
/14
abr/
14
mai
/14
jun
/14
jul/
14
ago
/14
set/
14
ou
t/1
4n
ov/
14
dez
/14
jan
/15
fev/
15
mar
/15
abr/
15
mai
/15
jun
/15
jul/
15
ago
/15
set/
15
ou
t/1
5n
ov/
15
dez
/15
jan
/16
fev/
16
mar
/16
abr/
16
mai
/16
jun
/16
jul/
16
ago
/16
set/
16
ou
t/1
6
Brazil: electricity spot price - monthly average (R$/MWh)
Monthly average spot price, R$/MWh 2012 average 2013 average 2014 average 2015 average 2016 average
Spot price

33
2nd maturity:
# Type Plant Expiry of
concession Installed
capacity (MW) firm output
(average MW) Historic cost 09.30.2015
Deemed Cost 09.30.2015
1 HPP Volta Grande Feb/2017 380 229
TOTAL 2nd renewal 380 229
1st maturity:
# Type Plant Expiry of
concession Installed
capacity (MW) firm output
(average MW)
1 HPP São Simão Jan/2015 1,710 1,281
2 HPP Jaguara Aug/2013 424 336
3 HPP Miranda Dec/2016 408 202
TOTAL 1st renewal 2,542 1,819
Contracts maturing of generation plants

34
Plant Installed capacity
(MW) firm output
(MW)
Três Marias 396,0 239,0
Salto Grande 102,0 75,0
Itutinga 52,0 28,0
Camargos 46,0 21,0
Piau 18,0 13,5
Gafanhoto 14,0 6,7
Peti 9,4 6,2
Tronqueiras 8,5 3,4
Joasal 8,4 5,2
Martins 7,7 1,8
Cajuru 7,2 3,7
Ervália 7,0 3,0
Neblina 6,5 4,7
Coronel Domiciano 5,0 3,6
Paciência 4,1 2,4
Marmelos 4,0 2,7
Dona Rita 2,4 1,0
Sinceridade 1,4 0,4
Total 699,6 421,3
Concession Grant Fee: total of R$ 2.26 billion
1st tranche (65%): January 4, 2016 – R$ 1.47 billion
2nd tranche (35%): in up to 180 days – R$ 779 million
Total of 18 plants with installed capacity of of 699.57 MW
(Assured energy 421.3 MW)
100% of the physical offtake guarantee to go to the Regulated
Market from January 1 to December 31, 2016;
as from January 1, 2017 this reduces to 70%.
Revenue received by Cemig GT for provision of the service:
R$ 498.6 million/year
Comprises: Fee for Management of Generation Assets (‘GAG’);
and Yield on Concession Grant Fee (‘RBO’).
Cemig further expects to receive payment for its electricity
generation assets not yet amortized or not depreciated.
Cemig GT won Lot D in the Auction held in November 2015

35
# Plant Location Expiry of concession
1 EBTE – LT Juína-Brasnorte Mato Grosso out/38
2 ETEP – LT Tucuruí – Vila do Conde Pará jun/31
3 ENTE – LTs Tucuruí – Marabá – Açailândia Pará/Maranhão dez/32
4 ERTE – LT Vila do Conde – Santa Maria Pará dez/32
5 EATE – LT Tucuruí – Presidente Dutra Pará jun/31
6 ECTE – LT Campos Novos – Blumenau Santa Catarina nov/30
7 STC – LT Barra Grande Santa Catarina jun/36
8 Lumitrans – LT Machadinho Santa Catarina jul/34
9 ESDE – LT Barbacena2-Juiz de Fora 1 (Projeto em andamento) Minas Gerais nov/39
10 TSN Goiás/ Bahia dez/30
11 Munirah Bahia fev/34
12 Gtesa Pernambuco/ Paraíba jan/32
13 Patesa Rio Grande do Norte dez/32
14 NVT Maranhão/Distrito Federal dez/30
15 ETAU Santa Catarina/Rio G. do Sul dez/32
16 ETEO São Paulo mai/30
17 Brasnorte Mato Grosso mar/38
18 STE Rio Grande do Sul dez/32
19 ATE Paraná/São Paulo fev/34
20 ATE II Tocantins/Piauí/Bahia mar/35
21 ATE III Tocantins/Pará mar/36
22 São Gotardo (Projeto em andamento) Minas Gerais ago/42
23 Transchile – LT Charrua – Nueva Temuco Chile mai/28
24 Centroeste de Minas – LT Furnas – Pimenta Minas Gerais mar/35
25 Rede Básica Minas Gerais jul/15
26 Sub-Estação – SE Itajubá – 3 Minas Gerais out/30
27 Transleste – LT Irapé – Montes Claros Minas Gerais fev/34
28 Transudeste – LT Itutinga – Juiz de Fora Minas Gerais mar/35
29 Transirapé – LT Irapé – Araçuaí Minas Gerais mar/35
TBE
Taesa
Others
Contracts maturing of transmission facilities

36
Losses

Investor Relations
Phone Number: (55-31) 3506-5024
Fax: (55-31) 3506-5025
Email: [email protected]
Website: http://ri.cemig.com.br