Embed Size (px)
Citation preview

October 2018
INVESTOR PRESENTATION

2
Disclaimer
• This presentation was prepared by REN – Redes Energéticas Nacionais, SGPS, S.A. (“REN”) merely for informative purposes and is not andshould not be construed as an offer to sell or buy, a solicitation, a recommendation or an invitation to purchase or subscribe any securities. Thisdocument does not intend to be totally or partially the basis of any investment decisions or to provide all comprehensive information to bereviewed by any prospective investor and its addressees must conduct their own investigations as deemed necessary should they decidewhether to trade or not in any securities.
• All the information contained in this presentation is based on public information disclosed by REN and on information from other crediblesources which were not subject to independent review by REN.
• Thus, these statements are not guarantees of future performance and are subject to factors, risks and uncertainties that could cause theassumptions and beliefs upon which the forwarding looking statements were based to substantially differ from the expectation predictedherein.
• This presentation does not constitute an offer to sell, or a solicitation of offers to purchase or subscribe for, securities in the United States.The securities referred to herein have not been, and will not be, registered under the Securities Act of 1933, as amended, and may not beoffered, exercised or sold in the United States absent registration or an applicable exemption from registration requirements. There is nointention to register any portion of the offering in the United States or to conduct a public offering of securities in the United States.
• The information contained herein shall not constitute an offer to sell or the solicitation of an offer to buy or subscribe for, nor shall there beany sale of the securities referred to herein, in any jurisdiction in which such offer, solicitation or sale would be unlawful. Investors must neitheraccept any offer for, nor acquire or subscribe for, any securities to which this document refers, unless they do so on the basis of theinformation contained in the applicable prospectus published or offering circular distributed by the Company.
• In addition, this communication is only being distributed to, and is only directed at persons who (i) have professional experience in mattersrelating to investments who fall within the definition of “investment professionals” in Article 19(5) of the Financial Services and Markets Act2000 (Financial Promotion) Order 2005, as amended (the “Order”), or (ii) are high net worth entities, and other persons to whom it maylawfully be communicated, falling within Article 49(2) of the Order (all such persons together being referred to as “relevant persons”). Anyinvestment or investment activity to which this communication relates will only be available to and will only be engaged in with, relevantpersons. Any person who is not a relevant person must not act or rely on this document or any of its contents.

3
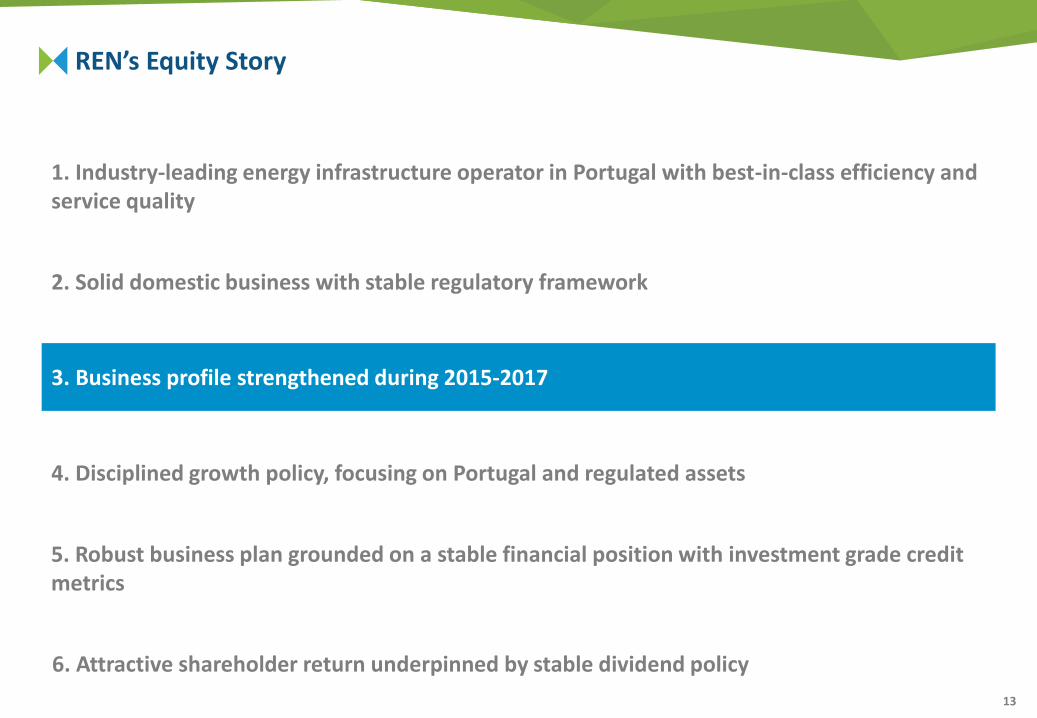
REN’s Equity Story
1. Industry-leading energy infrastructure operator in Portugal with best-in-class efficiency and service quality
2. Solid domestic business with stable regulatory framework
3. Business profile strengthened during 2015-2017
4. Disciplined growth policy, focusing on Portugal and regulated assets
5. Robust business plan grounded on a stable financial position with investment grade credit metrics
6. Attractive shareholder return underpinned by stable dividend policy

4
REN has a 70-year track record as a leading energy infrastructure operator in Portugal
1994: Incorporated under the name of REN – Rede Eléctrica Nacional, S.A. as a result of EDP’s business unit spin-off
Sep. 2006: REN acquired natural gas assets (transportation, LNG terminal and underground storage facilities) as a result of unbundling from Galp
Natural gas 40-year concession granted
Feb. 2012: 2nd repriva-tization phase
State Grid of China 25%
Oman Oil 15%
Jun. 2014: 2nd repriva-
tization phase concluded with sale of 11% stake held by the Portuguese state
Jul. 2007: 1st reprivatizationphase
Jul. 2007: New electricity concession until 2057
1947: REN has its origins in CNE (National Electricity Company)
1976: Foundation of EDP resulting from the merger of companies existing at the time
May 2015: Acquisition of Galp NG underground storage assets
Jun. 2000: 50-year concession to operate electric transmission network is granted
Nov. 2000: Portuguese State acquired a 70% stake
Oct. 2017: REN acquires 100% of EDPG from EDP for €530M, entering in the gas distribution business
1947 - 74 … 1994 … 2000 …. 2006 2007 … 2012 2013 2014 2015 2016 2017
Dec. 2017: Capital increase of €250M
Feb. 2017: REN acquires 42.5% of Electrogas from ENEL in Chile for $180M

5
In Portugal, REN is the sole electricity and natural gas TSO and holds the second-largest natural gas distribution concession
GenerationTransmission
(Sole TSO)
Distribution Supply
Regulated Activities
ImportsDistribution
SupplyLNG
TerminalTransportation Storage
Sole TSO (concession until 2046)
Transportation of high-pressure natural gas and overall technical management of the system
Reception, storage and regasification of LNG and underground storage of natural gas
In October 2017, REN acquired thesecond-largest gas distribution network, which concession lasts in 2047
Sole Transmission System Operator (TSO)
Transmission of high voltage electricity and overall technical management of the system
Concession until 2057
(Sole TSO) (1 of 11 concessions)
Regulated Activities
Electricity
Natural Gas
6
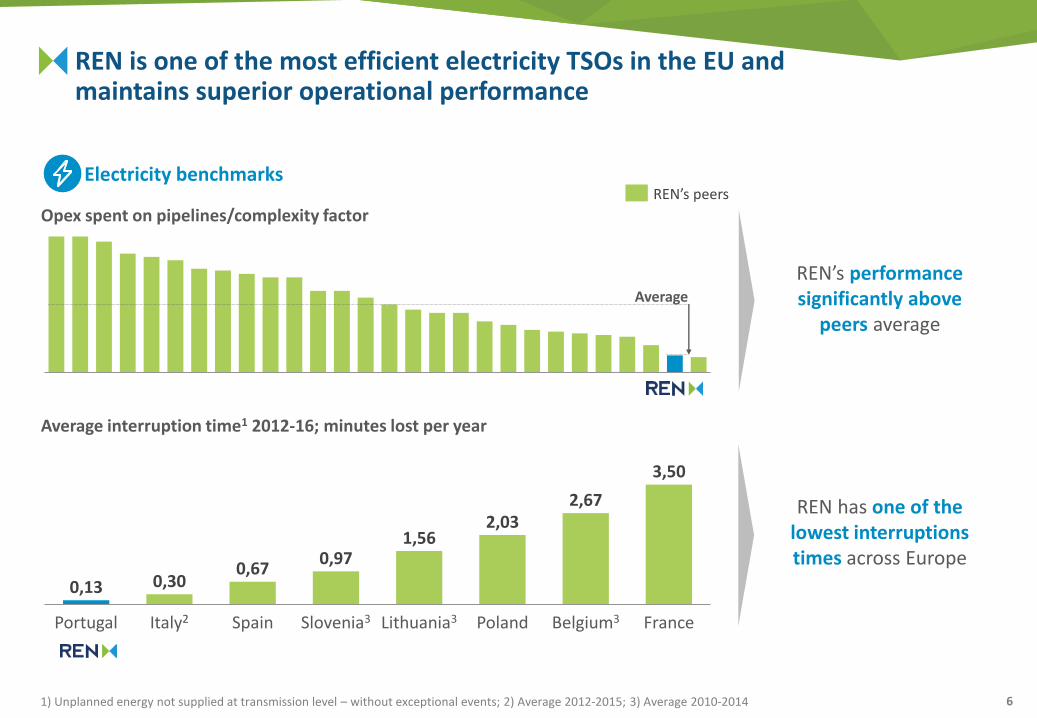
REN is one of the most efficient electricity TSOs in the EU and maintains superior operational performance
Average
0,13 0,300,67
0,971,56
2,032,67
3,50
FrancePolandPortugal Italy2 Slovenia3Spain Belgium3Lithuania3
REN’s peersElectricity benchmarks
Opex spent on pipelines/complexity factor
Average interruption time1 2012-16; minutes lost per year
REN’s performance significantly above
peers average
REN has one of the lowest interruptions times across Europe
1) Unplanned energy not supplied at transmission level – without exceptional events; 2) Average 2012-2015; 3) Average 2010-2014

7
Similarly to electricity, REN's natural gas transmission business is well-ranked among international peers regarding efficiency
Average
Average
Source: Gas Transmission Benchmarking Initiative 2017; LNG Receiving Terminals Benchmarking 2017
REN is ranked in the first quartile at the Gas
Transmission Benchmarking Initiative
REN’s LNG Terminal is the most efficient facility at the LNG
Receiving Terminals Benchmarking
Natural gas benchmarksREN’s peers
Opex spent on pipelines/complexity factor
LNG terminal costs/complexity factor

8
25,0%
12,0%
7,0%5,3%5,0%4,8%
2,1%
0,6%
38,3%
Since the 2014 reprivatisation, REN has a stable shareholder base and robust governance and control measures
Other Investors
1) Aug 2018Source: REN
Shareholder structure1 Board composition
In line with best practices, REN also has special committees in place (Remuneration, Corporate Governance and Nomination and Appraisal committees) and, as supervision bodies, the Audit Committee (fully independent) and Statutory Auditor
3EXECUTIVE
COMMITTEE
3AUDIT
COMMITTEE
(INDEPENDENT)
2INDEPENDENT
5OTHER
13 BOARD
MEMBERS
23%

9
REN’s Equity Story
1. Industry-leading energy infrastructure operator in Portugal with best-in-class efficiency and service quality
2. Solid domestic business with stable regulatory framework
3. Business profile strengthened during 2015-2017
4. Disciplined growth policy, focusing on Portugal and regulated assets
5. Robust business plan grounded on a stable financial position with investment grade credit metrics
6. Attractive shareholder return underpinned by stable dividend policy
10
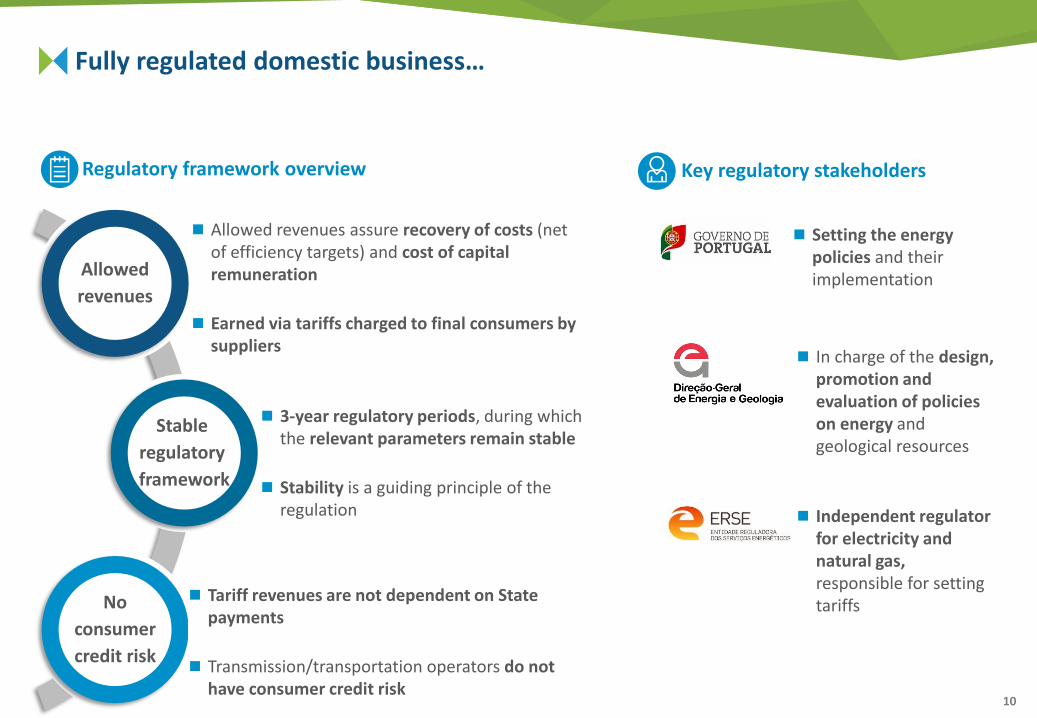
Fully regulated domestic business…
Regulatory framework overview Key regulatory stakeholders
Allowed revenues assure recovery of costs (net of efficiency targets) and cost of capital remuneration
Earned via tariffs charged to final consumers by suppliers
Allowed
revenues
Stable
regulatory
framework
No
consumer
credit risk
Tariff revenues are not dependent on State payments
Transmission/transportation operators do not have consumer credit risk
3-year regulatory periods, during which the relevant parameters remain stable
Stability is a guiding principle of the regulation
Setting the energy policies and their implementation
In charge of the design, promotion and evaluation of policies on energy and geological resources
Independent regulator for electricity and natural gas, responsible for setting tariffs

11
… with a transparent and stable return mechanism linked to the 10-year Portuguese bond yield…
Electricity Transmission RoR (2018-20) Natural Gas RoR (2016-19)
Note: Rates of return are pre-taxSource: ERSE
2014Base RoR evolution
2015 2016 2017
7.76% 5.99% 6.13% 6.33%
Base RoR indexed to the average Portuguese government 10-Y bond yields, with a fixed floor (4.50%) and cap (9.50%)
RoR starting point was set at 5.50%, for a 2.70% 10Y bond yield yearly average, and it is adjusted annually
Base RoR indexed to the average Portuguese government 10-Y bond yields, with a fixed floor (5.40% to GNT, 5.70% to GND) and cap (9.00% to GNT, 9.30% to GND)
RoR starting point was set at 5.90% to GNT and 6.20% to GND, for a 2.78% 10Y bond yield yearly average, and it is adjusted annually
5,90%
Cap:
9.30%
Floor:
5.70%
Average 10-Y Portuguese OT’S Yield
RoR
2.78%1.532% 10.532%
9.3%
5.7%
9.0%
5.4%
9.00%
5.40%
GN Distribution
GN Transmission
6,20%
Base RoR 2014
7.48%
2015
7.20%GásT
GásD
2016
6.70%
2017
6.02%
6.32%
1H18
5.52%
5.82%
1H18
5.18%
9.50%9.50%
4.50%4.50%

12
… resulting in a solid domestic business with stable financial performance
Average RAB (€M) EBITDA (€M)
Capex (€M) Net Income (€M)
20162014 2015 2017
20172014 20162015
163
240
171
2014 20172015 2016
505 490 476
113 116 100 126
-25 -26
201720162015
-25
2014
-26
Net income incl. extraordinary levy
Extraordinary levy
138 142 126
Net income excl. extraordinary levy
3,529 3,580 3,5373,925 487
156152
13
REN’s Equity Story
1. Industry-leading energy infrastructure operator in Portugal with best-in-class efficiency and service quality
2. Solid domestic business with stable regulatory framework
3. Business profile strengthened during 2015-2017
4. Disciplined growth policy, focusing on Portugal and regulated assets
5. Robust business plan grounded on a stable financial position with investment grade credit metrics
6. Attractive shareholder return underpinned by stable dividend policy

14
During 2015-2017, REN successfully strengthened its business profile
First international investment
Investment in natural gas distribution in Portugal
Capital increase
Investment grade in the three major rating agencies

15
Shareholder structure
Electrogas overview
On February 7th 2017, REN acquired 42.5% of Electrogas from Enel
Electrogas operates a (i) a 165.6 km natural gas and a (ii) 20.5 km diesel oil pipeline
The only gas pipeline connecting Quintero’s regasification terminal to Chile’s largest population centre (Santiago)
Established long-term take-or-pay gas transportation contracts
Key customers comprise blue-chip electricity generators, industrial companies and major local gas distribution players
Impact on REN (2017)
42.5%
42.5%15%
(state-owned)
In 2017, REN completed its first international investment through the acquisition of Electrogas
Acquisition price ($M) 180
9.1
6.0
Dividends received (€M)
EBITDA1 (€M)
1) Including one-off costs of 1.2€M

16
As expected, REN holds a relevant influence on Electrogas' decisions and the company delivered a good financial and operational performance during 2017
Electrogas governance Operational performance (2017) Financial performance (2017)
Turnover ($M)
EBITDA ($M)
Net Income ($M)
Maintenance of 100% pipeline availability for the 5th consecutive year
Maximum historical gas transportvolumes (3,649 Mm3)
Exports to Argentina for the second time
New firm transport contracts with Enel (250,000m3/day) and with Metrogas (1Mm3/day)
REN has appointed two members to the Board of Directors of Electrogas, namely Gonçalo Morais Soares as chairman and João Faria Conceição as Executive Director
Gonçalo Soares
Chairman
Thomas KellerLippold
Vice-Chairman
João ConceiçãoDirector
Alfredo delCarril Caviglia
Director
Juan Eduardo VásquezDirector
2017
19
2016
18+7%
320%
32
3636+1%

17
The acquisition of REN Portgás allowed REN to diversify its domestic business into natural gas distribution
On October 4th 2017, REN completed the acquisition of 100% of EDPG (subsequently renamed REN Portgás) from EDP
Second-largest gas distribution concession in Portugal
Provides services in the coastal region of Northern Portugal
Operates under a 40-year concession contract (ending in January 2048)
Colder weather compared to Portugal as whole, resulting in higher energy demand
REN Portgás overview Key indicators (2017)
Acquisition price (€M) 530
EBITDA (€M) 42
Network length (km) 4,794
Distributed gas (TWh) 7.2
Transmission network Distribution network Natural gas area of influenceConnection points (#) 352,786
Significant growth potential driven by…
1 2 3Concession covers 21.7% of total households1 in Portugal (vs. 20.4% for Lisboagás’ concession)
Low penetration rates compared to other concession regions: 26.4% gas penetration rate2 vs. 45.3% for Lisboagás
Source: Company information, Pordata and ERSE1) Calculated as the number of households in the concession area divided by the total number of households in Portugal2) Calculated as connection points divided by number of households, within the respective concession area

18
The acquisition multiple was the lowest among recent comparable transactions
EV / EBITDA multiple
14.8x
EDPG 1
15.7x
11.5x
Naturgas Madrileña Red de GasGalp Gás Natural Distribuição
11.0x
Median of comparable transactions 14.8x
(March 2017) (July 2016) (April 2015)
Additionally, the Share Purchase Agreement helps protect REN against post transaction risks
Source: Press releases, corporate presentations and REN1) 2016 values

19
Portgás’ integration into REN’s Group as well as its performance in line with planned
20172016
447 455
+2%
4842
20172016
-13%
Average RAB (€M)
EBITDA (€M)
Financial performance Integration status
EBITDA reduction due to regulatory review with
impact on RoR reduction Portgás will continue to work as an independent
business unit, as required by law
REN has appointed a new Board of Directors, adding two of its own seasoned managers (the President and one Director) to the existing CEO and CFO
Organizational structure
In line with expected, REN will be migrating IT support systems and other support functions until the first half of 2019
REN recently launched new Portgás’ brand
Migration of shared services
Implementation of new branding

20
New businesses allowed REN to offset the decrease in domestic transmission businesses
4553,580
2014 2015 2016
3,470
2017
3,529 3,537
3,925
+13%
Average RAB (€M) EBITDA (€M)
42
20152014 2016
69
473
505490
476487
5216
2017 Pro-forma2
20171
+10%
Decrease in transmission businesses driven by lower returns on regulated assets due to lower 10Y PGB yields and RAB decrease
Electrogas Portgás
1) As reported. Includes 3 months of Portgás’ consolidation2) Including 12 months of Portgás’ consolidation

21
Additionally, REN took advantage both of its credit rating as investment grade and the favourable market conditions to optimize its financial costs
BBB
Baa3
BBB-
First Portuguese companywith investment grade
rating in the 3 main rating agencies
REN’s rating
2014 2015 2016 2017
3,2%
4,7%
4,1%
2,5%
TSO2REN TSO1 TSO3
REN decreased its average cost of debt at a faster pace than other European TSOs
20172014 2015
111
2016
131
9173
-58(-44%)
Average cost of debt
Financial costs (€M)
REN already captured the effect
of interest rates decrease on financial
costs, anticipating future losses due to
RoR decrease

22
Consequently, REN was able to achieve its business plan targets
BUSINESS PLAN
2015-2018
ACTUAL RESULTS
FY2017
International investment
Cost of debt
Capex
RAB
Financial metrics
Debt and credit metrics
Diversify by investing in selected number of international projects
First international investment completed (Electrogas in Chile)
1.0% decrease in average cost of debt (4.7% in 2014)
2.5%
€175M-€200M per yearAverage of €189M per year
for 2015-2017
Stable at c. €3.5B €3,925M
EBITDA €450M–€460M
Net Income €120M–€130M
EBITDA €487M
Net Income €126M
Net Debt stable at c. €2.5B Investment-grade credit metrics
Net Debt of €2,756M Investment-grade credit metrics
Dividend Stable at €0.171 per share €0.171 per share

23
REN’s Equity Story
1. Industry-leading energy infrastructure operator in Portugal with best-in-class efficiency and service quality
2. Solid domestic business with stable regulatory framework
3. Business profile strengthened during 2015-2017
4. Disciplined growth policy, focusing on Portugal and regulated assets
5. Robust business plan grounded on a stable financial position with investment grade credit metrics
6. Attractive shareholder return underpinned by stable dividend policy
24
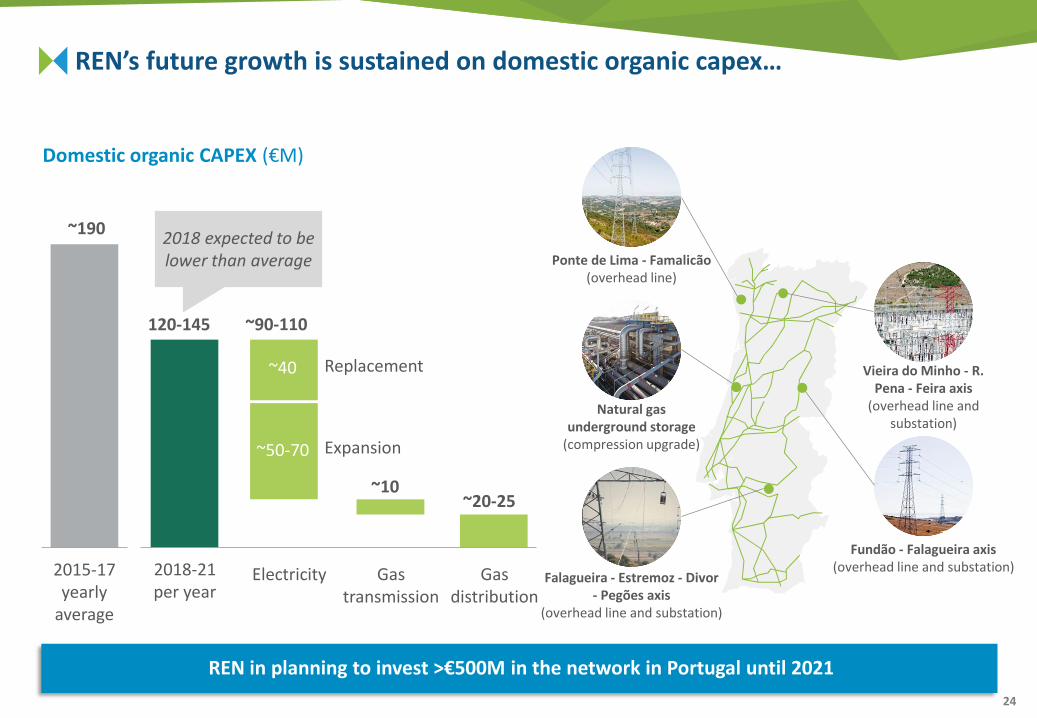
REN’s future growth is sustained on domestic organic capex…
REN in planning to invest >€500M in the network in Portugal until 2021
2015-17yearly
average
~190
2018-21per year
120-145
Gas transmission
~10
Gas distribution
~20-25
Electricity
~90-110
~40
~50-70
Replacement
Expansion
Domestic organic CAPEX (€M)
Falagueira - Estremoz - Divor - Pegões axis
(overhead line and substation)
Vieira do Minho - R. Pena - Feira axis
(overhead line and substation)
Fundão - Falagueira axis (overhead line and substation)
Ponte de Lima - Famalicão (overhead line)
Natural gas underground storage
(compression upgrade)
2018 expected to be lower than average
25
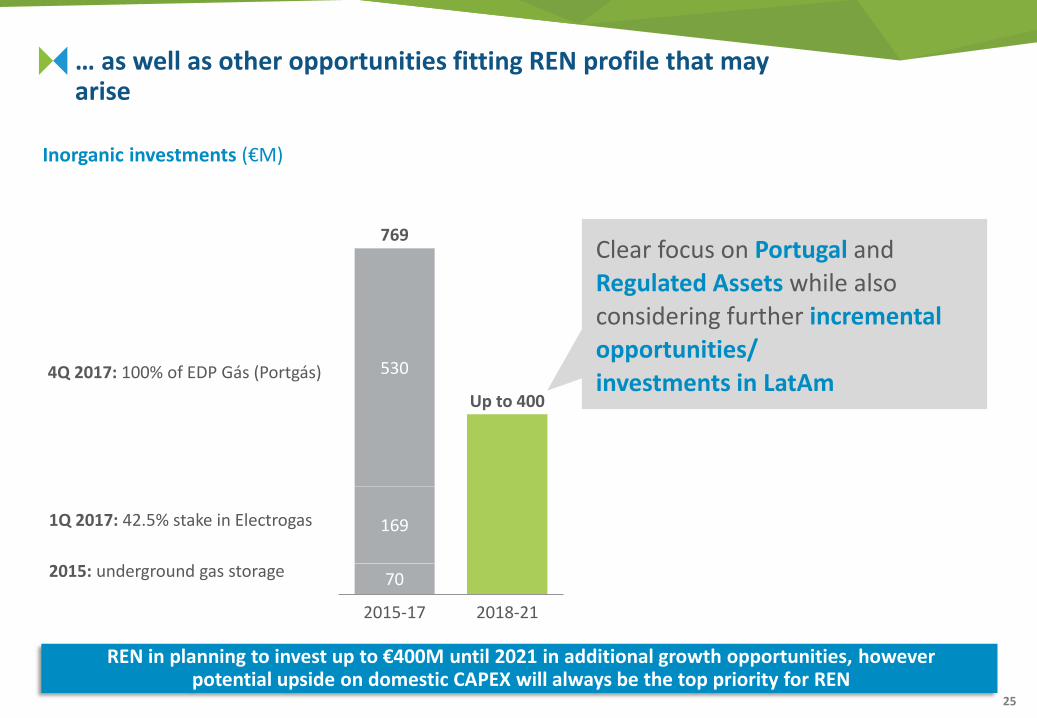
… as well as other opportunities fitting REN profile that may arise
Inorganic investments (€M)
1Q 2017: 42.5% stake in Electrogas
2015: underground gas storage
4Q 2017: 100% of EDP Gás (Portgás)
REN in planning to invest up to €400M until 2021 in additional growth opportunities, however potential upside on domestic CAPEX will always be the top priority for REN
Clear focus on Portugal and
Regulated Assets while also considering further incremental opportunities/
investments in LatAmUp to 400
2018-21
530
769
169
70
2015-17

26
Total asset base will remain stable
0.12 0.33
Electricity: 2.4
Gas: 1.1
3.5
2.2-2.3
0.9-1.0
0.49
3.6-3.7
2.3
1.1
Portgás: 0.46
3.9
0.33Holdings (€ Bn)
Average RAB1 (€ Bn)
Total assets (€ Bn)
€400 Mnup to
2014 2018-212017
Total asset base
3.6
1) Historical costs; 2) REE and HCB; 3) REE, HCB and Electrogas
4.2 4.2-4.3

27
REN’s Equity Story
1. Industry-leading energy infrastructure operator in Portugal with best-in-class efficiency and service quality
2. Solid domestic business with stable regulatory framework
3. Business profile strengthened during 2015-2017
4. Disciplined growth policy, focusing on Portugal and regulated assets
5. Robust business plan grounded on a stable financial position with investment grade credit metrics
6. Attractive shareholder return underpinned by stable dividend policy

28
REN has a stable credit profile with investment grade credit metrics
1) Fixed/variable rates: 61%/39%; 2) Adjusted by interest accruals and hedging on yen denominated debt; 3) European Investment Bank4) Cash and bank deposits and undrawn committed credit facilities that are available to cover all funding needs for at least the following two years
5%
16%
64%
15%
2 745
2019Total gross debt2
2018 2020 >2021
-86
-382
-395
-1,882
Gross debt maturity profile (1H 2018, €M) Gross debt funding sources1 (1H 2018)
BBB Baa3 BBB-
4.75 years (1H 2018)
Maturity slightly extended by taking advantage of market conditions
2.5 years (1H 2018)
REN’s goal is to maintain its liquidity over two years4
Stable outlook Stable outlook Positive outlook(April 2018) (April 2017) (October 2017)
Commercial paper Banks Bonds EIB
The three major rating agencies have been reaffirming REN’s rating as investment grade
3

29
Debt management priorities are focused on cost of debt optimization and net income protection
Protect net income
Optimize cost of debt
Fixed vs. floating rates
Maturity
Tools
Liquidity buffer
Allows for flexibility to grow while ensuring performance
30
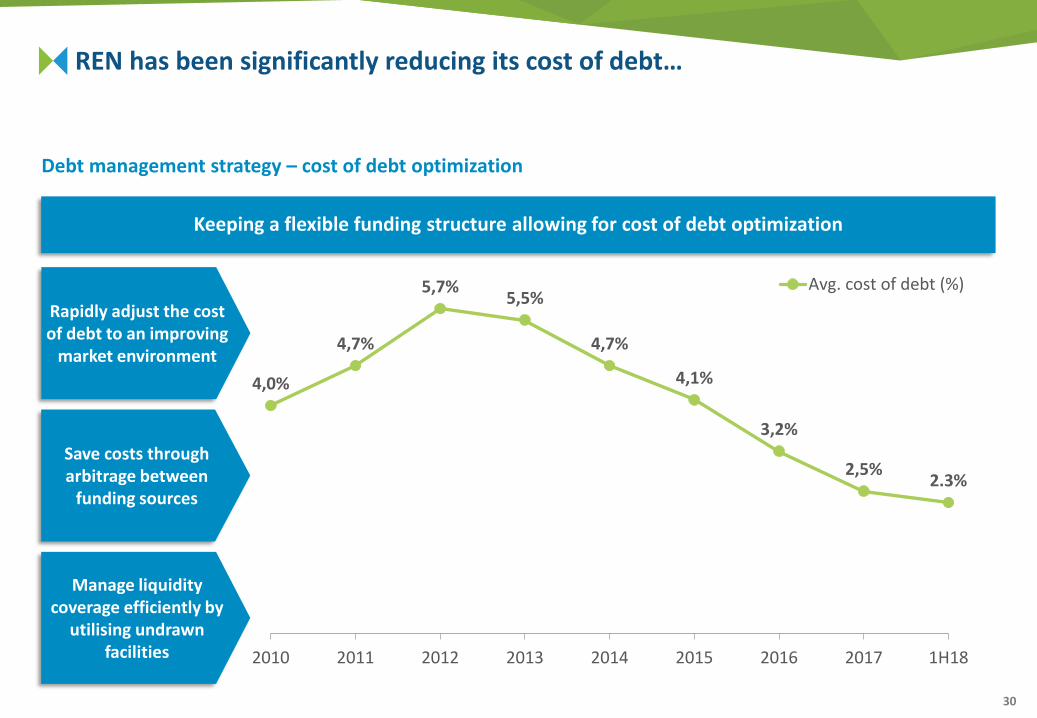
REN has been significantly reducing its cost of debt…
Debt management strategy – cost of debt optimization
Keeping a flexible funding structure allowing for cost of debt optimization
Rapidly adjust the cost of debt to an improving
market environment
Save costs through arbitrage between
funding sources
Manage liquidity coverage efficiently by
utilising undrawn facilities
4,0%
4,7%
5,7%5,5%
4,7%
4,1%
3,2%
2,5%2.3%
2010 2011 2012 2013 2014 2015 2016 2017 1H18
Avg. cost of debt (%)

31
… and has been successfully protecting its net income by aligning debt management with its regulated revenues profile
Adjust the cost of debt to a changing RoR leading to a stable spread between cost and return, and consequently, to less volatility in results
Debt management strategy – net income protection
110 120 121121 138 142 126
Locking in costs at very low rates
Benefiting from the spread to RoR floor or
from future potential for RoR increase
Close alignment of debt maturities with the
regulatory cycles
7,4% 7,6%
9,6%
8,1% 7,8%
6,0% 6,1% 6,3%
5,2%
4,0%4,7%
5,7% 5,5%4,7%
4,1%3,2%
2,5% 2,3%
2010 2011 2012 2013 2014 2015 2016 2017 1H18
Electricity base RoR (%) Avg. cost of debt (%) Net Income1 (€M)
1) Excluding extraordinary levy
152 53

32
REN’s performance going forward is expected to remain strong with credit metrics consistent with investment grade rating
EBITDA (€M)
Net income (€M)
Free Cash Flow before inorganic investment and dividends1 (€M)
Net debt (€B)
FFO/Net debt
11.7% 11-12%
REN’s performance Net debt and credit metrics
1. FCF before inorganic growth and dividends = EBITDA cash - Delta working capital - Taxes - Organic capex - Net interest paid + Dividends received
484 475-500
110-115144
2015-17 yearly average
2018-21 per year
170-175~135
2.7-2.9
2018-212017 EOY
2.8
33
REN’s Equity Story
1. Industry-leading energy infrastructure operator in Portugal with best-in-class efficiency and service quality
2. Solid domestic business with stable regulatory framework
3. Business profile strengthened during 2015-2017
4. Disciplined growth policy, focusing on Portugal and regulated assets
5. Robust business plan grounded on a stable financial position with investment grade credit metrics
6. Attractive shareholder return underpinned by stable dividend policy
34
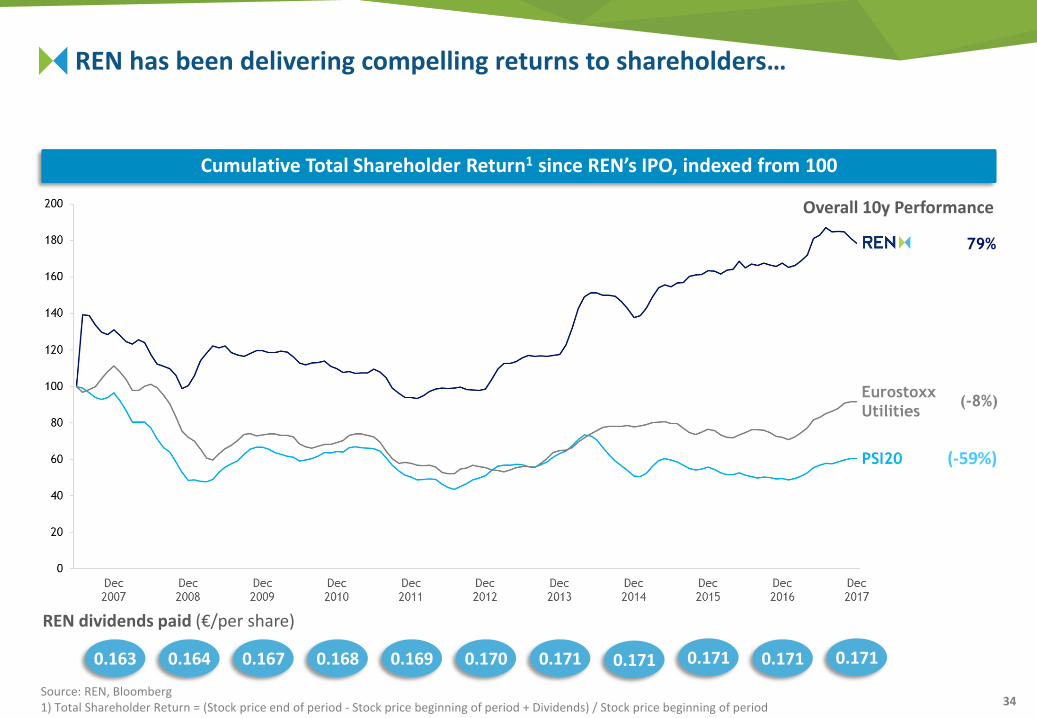
REN has been delivering compelling returns to shareholders…
Cumulative Total Shareholder Return1 since REN’s IPO, indexed from 100
Source: REN, Bloomberg1) Total Shareholder Return = (Stock price end of period - Stock price beginning of period + Dividends) / Stock price beginning of period
0.163 0.164 0.167 0.168 0.169 0.170 0.171 0.171 0.171 0.171
REN dividends paid (€/per share)
Overall 10y Performance
79%
(-59%)
Eurostoxx
Utilities
PSI20
(-8%)
0.171

35
… supported by REN's stable dividend per share
REN Dividend per share (€)
0,171 0,171 0,171 0,171
2018E 2019E 2020E 2021E
Source: Factset, Company information
Dividend yield – June 2018 (%)
7,1
4,8
6,0
5,3
5,8
3,0
4,7
TSO2
TSO1
EuroStoxx Utilities
TSO3
TSO4
TSO5
0,171
Avg 2015-17
High sustainability given REN’s capacity of generating cash flow
One of the highest dividend yields in the industry

Visit our web site at www.ren.pt or contact us:
Ana Fernandes – Head of IR
Alexandra Martins
Telma Mendes
Av. EUA, 55
1749-061 Lisboa
Telephone: +351 210 013 546
REN’s IR & Media app:
Thank you