Embed Size (px)
Citation preview
Applying Lean Service Concepts to the
Fault Reporting, Analysis, and Corrective
Action System
A Case Study at an Engineering Firm
DANIEL GRÖNQVIST
Degree project in
Industrial Management
Stockholm, Sweden 2013
Applying Lean Service Concepts to the FaultReporting, Analysis, and Corrective Action
System: A Case Study at an Engineering Firm
Daniel Gronqvist
Master of Science Thesis INDEK 2013:173KTH Industrial Engineering and Management
Industrial ManagementSE-100 44 STOCKHOLM
Master of Science Thesis INDEK 2013:173
Applying Lean Service Concepts to the Fault Reporting, Analysis, and Corrective Action
System: A Case Study at an Engineering Firm
Daniel Grönqvist Approved
2013-11-15 Examiner
Mats Engwall Supervisor
Jonatan Freilich Commissioner
Classified Contact person
Björn Offerman
Abstract
As a general rule, companies have focused most of their improvement initiatives in manufacturing and operations, leaving their internal service processes behind. This study presents a Fault Reporting, Analysis, and Corrective Action System (FRACAS) process, which is underperforming in terms of lead time. The process is studied in detail and the people who work with it were interviewed to find out how they think the process inhibits their work. The contribution this study makes is that it provides an example of what lean FRACAS could mean. The studied process presents itself as non-compliant with what the employees wish from such a process. This in turn causes these employees to underperform since they think that the process does not seem to provide value to neither themselves nor the customers. Keywords: Lean service, internal service, FRACAS, process improvement, continuous improvement
Abstract
As a general rule, companies have focused most of their improvement initiatives in man-ufacturing and operations, leaving their internal service processes behind. This studypresents a Fault Reporting, Analysis, and Corrective Action System (FRACAS) processwhich is underperforming in terms of lead time. The process is studied in detail and thepeople who work with it were interviewed to find out how they think the process inhibitstheir work. The contribution this study makes is that it provides an example of whatlean FRACAS could mean. The studied process presents itself as non-compliant withwhat the employees wish from such a process. This in turn causes these employees tounderperform since they think that the process does not seem to provide value to neitherthemselves nor the customers.
Keywords: Lean service, internal service, FRACAS, process improvement, continuousimprovement
3
Contents
Acknowledgements 6
Acronyms 7
1 Introduction 81.1 Empirical Context . . . . . . . . . . . . . . . . . . . . . . . . . . . 101.2 Objective and Research Question . . . . . . . . . . . . . . . . . . . 111.3 Delimitations . . . . . . . . . . . . . . . . . . . . . . . . . . . . . . 11
2 Methodology 122.1 Empirical Background . . . . . . . . . . . . . . . . . . . . . . . . . 132.2 Research Design . . . . . . . . . . . . . . . . . . . . . . . . . . . . . 142.3 Validity and Limitations . . . . . . . . . . . . . . . . . . . . . . . . 17
3 Theoretical Concepts 193.1 Process Theory . . . . . . . . . . . . . . . . . . . . . . . . . . . . . 193.2 Lean and Internal Service . . . . . . . . . . . . . . . . . . . . . . . 253.3 Failure Reporting, Analysis, and Corrective Action System . . . . . 313.4 Summary . . . . . . . . . . . . . . . . . . . . . . . . . . . . . . . . 35
4 Current Process 364.1 Input . . . . . . . . . . . . . . . . . . . . . . . . . . . . . . . . . . . 374.2 Process . . . . . . . . . . . . . . . . . . . . . . . . . . . . . . . . . . 384.3 Output . . . . . . . . . . . . . . . . . . . . . . . . . . . . . . . . . . 41
5 Problems Associated with the Current Process 445.1 Input . . . . . . . . . . . . . . . . . . . . . . . . . . . . . . . . . . . 445.2 Process . . . . . . . . . . . . . . . . . . . . . . . . . . . . . . . . . . 485.3 Output . . . . . . . . . . . . . . . . . . . . . . . . . . . . . . . . . . 515.4 Other Issues . . . . . . . . . . . . . . . . . . . . . . . . . . . . . . . 52
6 Improving the Process 546.1 Input . . . . . . . . . . . . . . . . . . . . . . . . . . . . . . . . . . . 546.2 Process . . . . . . . . . . . . . . . . . . . . . . . . . . . . . . . . . . 566.3 Output . . . . . . . . . . . . . . . . . . . . . . . . . . . . . . . . . . 586.4 Summary of Improvements . . . . . . . . . . . . . . . . . . . . . . . 59
7 Discussion 617.1 Limitations and Further Research . . . . . . . . . . . . . . . . . . . 63
8 Conclusion 64
References 65
4
List of Figures
1 Illustration of the context and focus . . . . . . . . . . . . . . . . . . 102 Hermeneutic spiral . . . . . . . . . . . . . . . . . . . . . . . . . . . 133 Representation of a process’s three parts . . . . . . . . . . . . . . . 204 Types of processes in an organization . . . . . . . . . . . . . . . . . 205 The process improvement cycle . . . . . . . . . . . . . . . . . . . . 306 Continuous Improvement processes . . . . . . . . . . . . . . . . . . 307 The FRACAS process . . . . . . . . . . . . . . . . . . . . . . . . . 328 Representation of the FRACAS process and objective . . . . . . . . 339 Flowchart of the CAR process . . . . . . . . . . . . . . . . . . . . . 3910 Distribution of CARs older than 28 days caused by Supplier . . . . 4511 Boxplot of resolution times for three active projects . . . . . . . . . 4712 Workflow for correct labels . . . . . . . . . . . . . . . . . . . . . . . 4813 Workflow for incorrect labels . . . . . . . . . . . . . . . . . . . . . . 4814 Circle of interest, knowledge, and incentive for CAR . . . . . . . . . 5315 Model for classifying case frequency and impact . . . . . . . . . . . 5516 The new process . . . . . . . . . . . . . . . . . . . . . . . . . . . . 5717 The process improvement cycle . . . . . . . . . . . . . . . . . . . . 59
List of Tables
1 Research gap representation . . . . . . . . . . . . . . . . . . . . . . 92 Interview breakdown . . . . . . . . . . . . . . . . . . . . . . . . . . 163 Quantitative data collected . . . . . . . . . . . . . . . . . . . . . . . 174 Barriers to process improvement . . . . . . . . . . . . . . . . . . . . 255 CO instruction for new CAR . . . . . . . . . . . . . . . . . . . . . . 376 CM instruction for new CAR . . . . . . . . . . . . . . . . . . . . . 387 CR instruction for new CAR . . . . . . . . . . . . . . . . . . . . . . 408 CO instruction for approved CAR . . . . . . . . . . . . . . . . . . . 419 CAR ownership flow . . . . . . . . . . . . . . . . . . . . . . . . . . 4310 Improvement suggestions . . . . . . . . . . . . . . . . . . . . . . . . 60
5
Acknowledgements
Detta examensarbetet, precis som alla andra, markerar slutet pa en lang resa. Skri-vandet har involverat manga manniskor till vilka jag ar skyldig ett stort tack:
Bjorn Offerman och Patrik Karlsson – mina handledare pa foretaget for deras hjalpoch tillganglighet
Jonatan Freilich – Min handledare pa KTH for hans vagledning och stora intressefor att hjalpa till
Robin Harding och Markus Johansson – For standigt samarbete och kritik
Per och Elisabeth Gronqvist – Mina foraldrar, for allt deras stod
Jag vill ocksa tacka alla andra studenter pa TINEM-programmet for allt ideutbyteoch kollektivt stod, samt Lars Uppvall och Par Blomkvist som programansvarigafor deras engagemang och intresse for oss studenter.
6
Acronyms
BD Business Development
CAR Corrective Action Request
CI Continuous Improvement
CM CAR Manager
CO CAR Owner
CR CAR Resolver
ERP Enterprise Resource Planning
FRACAS Fault Reporting, Analysis, and Corrective Action System
FRB Failure Review Board
JIT Just-in-time
NC Nonconformance
NCR Nonconformance Report
NNVA Necessary but Non-Value Adding
NVA Non-Value Adding
PAP Parts Approval Process
PDCA Plan-Do-Check-Act
PQA Project Quality Assurance
QA Quality Assurance
SEAP Supplier Evaluation and Approval Process
SQA Supplier Quality Assurance
TPS Toyota Production System
TQM Total Quality Management
VA Value Adding
VSM Value Stream Mapping
WCC Warranty Customer Coordinator
7

1 Introduction
Companies are generally bad at applying their own improvement strategies to theirinternal service processes (Maleyeff, 2006). The numerous operations strategy ini-tiatives that have been mentioned in research are usually limited to shop floorapplications (Fullerton et al., 2013). Just-in-time (JIT), Total Quality Manage-ment (TQM), Six Sigma, and most commonly, lean manufacturing is and has beenthe go-to approach to production in today’s business climate for many years now(Burton and Boeder, 2003; Shah and Ward, 2003; Cottyn et al., 2011, for example).There is much to be gained from applying the lean production ideas to the supportprocesses inside an organization, called internal service processes, (Maleyeff, 2006)since poor service usually means that most problems are recurrent (Radnor andJohnston, 2012).
Recurrent problems can be eliminated by identifying the root cause and implement-ing corrective actions, which is the goal of Fault Reporting, Analysis, and CorrectiveAction System (FRACAS). FRACAS is a theoretical concept of an internal servicethat tracks all types of issues. It has the goal of setting cost-reducing directivesin the short term improving quality in the long term (Cota and Gullo, 2013). Aninternal service is a process that is carried out inside an organization and pro-vides support for the core business activity, for instance performance tracking. Theessence of this particular internal service is that it records many different types ofdata for any type of faults or nonconformities and analyzes that data to providegrounds for actions to be taken in order for the fault not to happen again. FRA-CAS is fairly common tool in technologically advanced industries and involve manydifferent functions and roles in an organization (Lee et al., 2010). That also meansthat there are a number of issues attached to this tool for improvement. Complexorganizational channels for interaction and different objectives for different businessfunctions can affect the performance of the tool (Hallquist and Schick, 2004) whichcauses limited performance.
Existing research on FRACAS has a main focus on the different aspects of the theoryitself, rather than how to improve an application of it using existing improvementstrategies. On the one hand there is a research gap concerning lean FRACAS. Onthe other hand, there is much research on internal service and and lean service,which are the two concepts that contribute to understanding the causes of theproblems in the Corrective Action Request (CAR) process. Combining all of thatis what makes this study unique and presents an idea of lean FRACAS. To beclassified as an internal service, one of the main deliverables must be information(Johnston, 2008). Internal services have many common characteristics (Maleyeff,2006) and using lean to improve service performance has been shown to decreaseservice lead times (Swank, 2003).
8
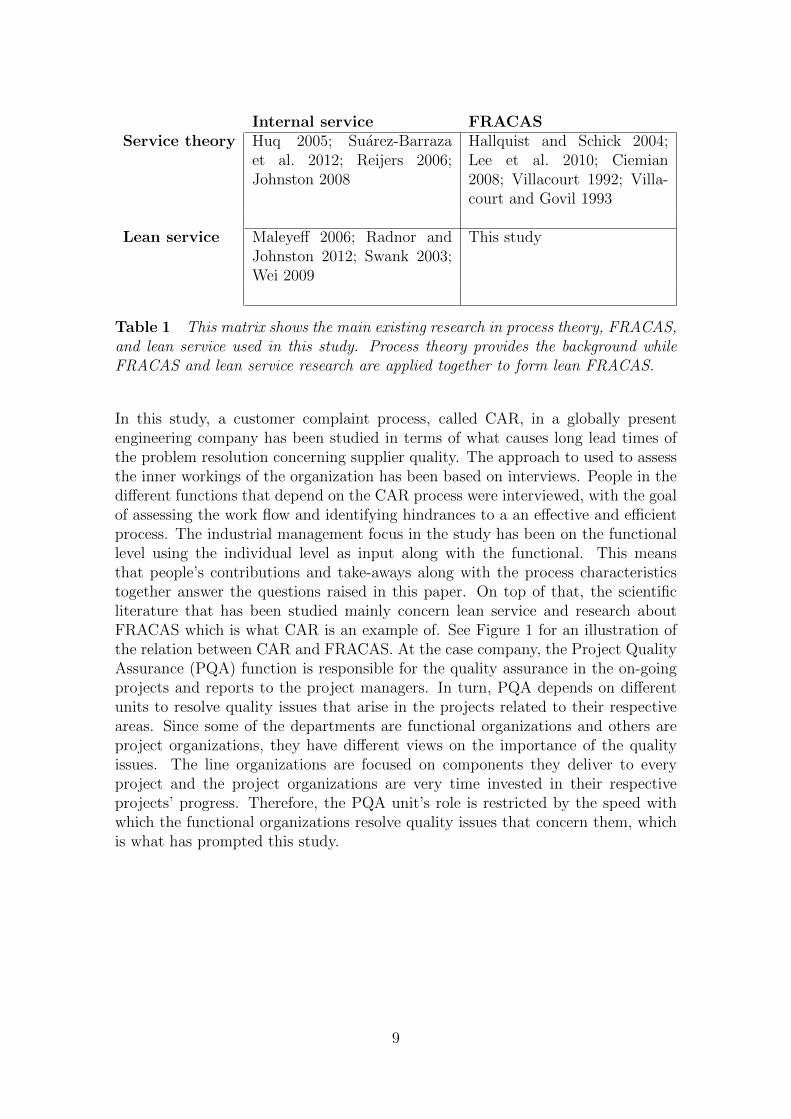
Internal service FRACASService theory Huq 2005; Suarez-Barraza
et al. 2012; Reijers 2006;Johnston 2008
Hallquist and Schick 2004;Lee et al. 2010; Ciemian2008; Villacourt 1992; Villa-court and Govil 1993
Lean service Maleyeff 2006; Radnor andJohnston 2012; Swank 2003;Wei 2009
This study
Table 1 This matrix shows the main existing research in process theory, FRACAS,and lean service used in this study. Process theory provides the background whileFRACAS and lean service research are applied together to form lean FRACAS.
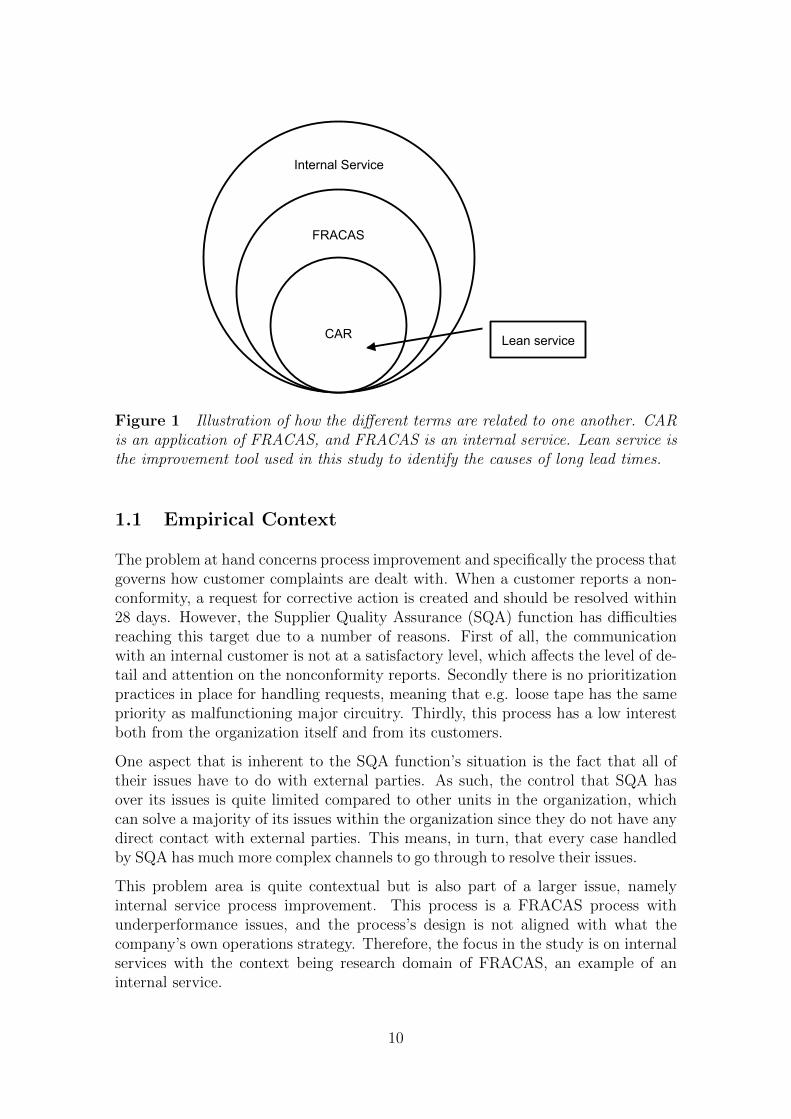
In this study, a customer complaint process, called CAR, in a globally presentengineering company has been studied in terms of what causes long lead times ofthe problem resolution concerning supplier quality. The approach to used to assessthe inner workings of the organization has been based on interviews. People in thedifferent functions that depend on the CAR process were interviewed, with the goalof assessing the work flow and identifying hindrances to a an effective and efficientprocess. The industrial management focus in the study has been on the functionallevel using the individual level as input along with the functional. This meansthat people’s contributions and take-aways along with the process characteristicstogether answer the questions raised in this paper. On top of that, the scientificliterature that has been studied mainly concern lean service and research aboutFRACAS which is what CAR is an example of. See Figure 1 for an illustration ofthe relation between CAR and FRACAS. At the case company, the Project QualityAssurance (PQA) function is responsible for the quality assurance in the on-goingprojects and reports to the project managers. In turn, PQA depends on differentunits to resolve quality issues that arise in the projects related to their respectiveareas. Since some of the departments are functional organizations and others areproject organizations, they have different views on the importance of the qualityissues. The line organizations are focused on components they deliver to everyproject and the project organizations are very time invested in their respectiveprojects’ progress. Therefore, the PQA unit’s role is restricted by the speed withwhich the functional organizations resolve quality issues that concern them, whichis what has prompted this study.
9
Lean service
Internal Service
FRACAS
CAR
Figure 1 Illustration of how the different terms are related to one another. CARis an application of FRACAS, and FRACAS is an internal service. Lean service isthe improvement tool used in this study to identify the causes of long lead times.
1.1 Empirical Context
The problem at hand concerns process improvement and specifically the process thatgoverns how customer complaints are dealt with. When a customer reports a non-conformity, a request for corrective action is created and should be resolved within28 days. However, the Supplier Quality Assurance (SQA) function has difficultiesreaching this target due to a number of reasons. First of all, the communicationwith an internal customer is not at a satisfactory level, which affects the level of de-tail and attention on the nonconformity reports. Secondly there is no prioritizationpractices in place for handling requests, meaning that e.g. loose tape has the samepriority as malfunctioning major circuitry. Thirdly, this process has a low interestboth from the organization itself and from its customers.
One aspect that is inherent to the SQA function’s situation is the fact that all oftheir issues have to do with external parties. As such, the control that SQA hasover its issues is quite limited compared to other units in the organization, whichcan solve a majority of its issues within the organization since they do not have anydirect contact with external parties. This means, in turn, that every case handledby SQA has much more complex channels to go through to resolve their issues.
This problem area is quite contextual but is also part of a larger issue, namelyinternal service process improvement. This process is a FRACAS process withunderperformance issues, and the process’s design is not aligned with what thecompany’s own operations strategy. Therefore, the focus in the study is on internalservices with the context being research domain of FRACAS, an example of aninternal service.
10
1.2 Objective and Research Question
This study aims to use lean production lessons to investigate what is causing poorperformance in a FRACAS process and to suggest improvements according to thelessons from the lean production’s service application. This application of leanis called lean service. Expanding on that the objective is, through a high on-sitepresence at the case company, to make sense of why the process is underperforming.Making sense of the process here means to outline how the process works comparedto how it is designed to work and to use people’s opinions of how the process designaffects them negatively. These negative parts of the process are then presentedwith improvement suggestions based on the operations strategy primarily used atthe case company, lean, as mentioned earlier.
The research question in this thesis is: How can lean service be used to identify areasfor improvement in a FRACAS process in order to increase performance?
The objective and research question have been reached by studying the FRACASapplication called CAR. The investigation in this study takes into account the ‘soft’aspects of the CAR process, such as the employees’ perception of the process’susefulness, as well as ‘hard’ aspects in terms of the design of the process.
1.3 Delimitations
As stated before, this study focuses on two things: process design and employees’perception as seen through a lean service looking glass. This means that the factthat functions other than the SQA where the CAR process works quite well havenot been studied, but the fact that it works well is discussed.
Only internal aspects will be considered for the analysis, that is, things pertainingto the process itself. External issues like supplier contracts and relationships, as wellas local resources like people, are not part of the study although such aspects have aclear involvement in the process’s performance due to the nature of networks.
11

2 Methodology
This thesis is an in-depth study; it will take into account the complexities thatsurround the CAR process and its people. Depth is a basic criterion in order tobe sensitive to the subtleties and nuances of in what way people perceive a process(Kempster and Cope, 2010). These subtleties and nuances are here provided byauthor presence in the case company’s office for a majority of the time for theduration of this study. In order to understand the studied process, CAR, throughoutall of its stages, people who work in the roles that are affected by the work processwere interviewed to create a holistic understanding of the process flow and howpeople feel and think about the process.
The case study method has been used due to the fact that the problem at handhas many contextual conditions, whereby a case study method is appropriate (Yin,2009). As stated in the Introduction, this study aims to identify barriers to adequateprocess performance, or in other words, why the process is underperforming in thesupplier function at the case firm. Quantitative data and qualitative data togetherillustrate the dynamics at play for a process’s performance level since contextualconditions affect both the customer focus and individual practices (Sousa, 2003).Because of the depth of the study, individual work habits and opinions, which aredifficult to measure, play a large role (Batt, 2012). This calls for interviews wherethe interviewee can speak freely about how they work with just enough guidanceto keep the interview on topic.
The study methodology is based on an inductive approach, which means that thecontext warrants the theory. The trail of understanding here follows a hermeneuticspiral in terms of understanding-as-you-go, see Figure 2. The research is inter-preted and developed as the holistic picture emerges. In other words, the study’smethod is built around the concept that understanding the thesis holistically willbe determined by reference to individual parts and understanding the individualparts is determined by reference to the whole, thereby evolving the understandingof the problem throughout progression of the research through iterations of knowl-edge processing. Essentially, details are understood thanks to knowing the wholepicture, and the whole picture is understood thanks to the knowledge given by thedetails. This then creates a spiral where deeper understanding is achieved progres-sively by understanding each of the two entities, details versus the whole picture,a little at a time.
12

Figure 2 The hermeneutic spiral model for achieving deeper understanding.
This section explains and presents the methods used. First the empirical back-ground is presented with a description of the case company, the studied work pro-cess, and the functional units that are involved in the process. After that theresearch design is described, and finally the study’s validity and sources are pre-sented.
2.1 Empirical Background
This study has taken place inside a corporate environment and this section aims topresent that environment and the work processes that have been examined as partof the study. First of all, a short description of the case company is presented toput it in perspective. Secondly a short description of FRACAS as the governingtheoretical basis as directed by the central organization is described. This subsectionalso includes a description of the CAR work process, which aims to introduce whatthe process is and does while the findings from the study of the process is presentedin Section 4.
Case Company
The company in which this study has been performed is part of a subdivision of aglobal engineering corporation located in the middle region of Sweden. The corpo-ration employs about 70,000 people worldwide and has its headquarters in NorthAmerica. The corporation designs, manufactures, sells, and services its products intwo different industries. The subdivision in which this study has been performed em-ploys about 3,000 people and designs propulsion systems which are sold to mainlyinternal customers, and will be called “ENGINEERING CORP” throughout thethesis.
ENGINEERING CORP has a tool for reporting incoming warranty and noncon-formity claims, CAR, which the people who manage the quality assurance in thevarious projects rely on for information and status. However, this tool was seeinglonger lead times and backlogs rendering it less useful for the quality assurance
13
managers. In particular, cases that have to do with suppliers tend to take long toresolve thanks to the fact that more parties than ENGINEERING CORP and thecustomers have to be involved. In addition to that, the unit laden with handlingCARs that have to do with suppliers has limited time dealing with these cases,causing the cases to pile up and not be resolved.
This thesis suggestion came into existence due to the fact that the quality assurancemanagers thought that the resolution time needs to be shortened in order for themto do their job.
FRACAS at ENGINEERING CORP
The directive for the CAR process is FRACAS, which outlines the requirementsfor handling failures in all processes of ENGINEERING CORP’s all organizationalunits. The directive is in place to increase the reliability and maintainability forcurrent and future projects, track the performance based on corrective actions,contribute to lessons learned, and provide qualitative and quantitative historicaldata. These outputs are achieved from input in the form of nonconformance reports,repair reports from customer and the own organization, customer requirements,ENGINEERING CORP requirements, and contracts requirements.
This governing process ensures that monitoring is performed on products in service,failures and non-performance is documented and analyzed, and that corrective ac-tions are defined and implemented according to an implementation plan. This wasput in place to increase life-cycle cost performance of a certain system or function,ensure a way of systematic knowledge management and transfer between existingand future projects, and to see to that environmental concerns and requirementsand safety standards are being proactively covered.
2.2 Research Design
The research was designed as the work at the case company went on. This sectionbegins with a description of the process of how the methodology was carried out,and the subsequent sections describe the different elements of the method. Thesection is concluded with a short discussion on validity and the sources used in thestudy.
Research Process
The study started with an undefined objective. The desired outcome was the onlyexpressed purpose of the study and that outcome was to “improve the CAR reso-lution time” by the PQA managers. To support the original thesis idea drafted byENGINEERING CORP, a couple of facts were presented to illustrate some ideas forreasons as to why the CAR process was not reaching its target of 28 days resolutiontime. These ideas were:
14
• Low quality on the communication between ENGINEERING CORP and itslargest internal customer, making it difficult to be on the same page concerninghow to report and handle nonconformities
• All cases that become CARs have the some prioritization – there is no differ-entiation between cases
• There is a lack of resources in the SQA unit making it hard to address all thecases that come in
• Neither the customers, the suppliers, nor the organization itself express anyinterest in handling the CARs better.
In order to narrow down the scope and find a suitable theme to work towards, inter-views and informal talks with experienced professionals at ENGINEERING CORPwere used. It was clear that what was expected from the company was a combina-tion of qualitative and quantitative analysis of the situation with recommendationsfor how to proceed to improve it. Other than that, no other constraints or wisheswere expressed. The initial period was therefore mostly used to get to know peopleand the situation through a high presence at the company office.
Studying and gathering data for the CAR process had two parts: internal docu-mentation and interviews. Starting by studying internal documentation about theconcerned processes and learning who does what, was the first part of the research,and through it knowledge was gained about how the process is dealt with versushow it is meant to be dealt with. Secondly, interviews were held with key individu-als who are either directly involved in the process, or part of supporting functions.After the data gathering, the information was analyzed and compiled so that allconcerns and reflections about why the process is being underperformed was out-lined. Following the analysis, a literature study focused at the strategic elementsat work at ENGINEERING CORP, i.e. lean production,lean service and FRACASwas conducted. This work process of studying the literature after conducting thestudy is part of an inductive study method. After the literature study, conceptslearned were adapted to fit the objective of this study and make up the suggestedprocess improvements.
Interviews
The aim of the interviews was to gather data on the individual level of the processin order to analyze it to find what constitutes the barriers to adequate performance.In order for the interviewees to express what they think is most important regardingtheir work with CARs, the interviews will be semi-structured to a degree dependingon who is being interviewed (Collins and Hussey, 2009). People in the followingroles have been interviewed:
• CAR Resolver (CR)
• CAR Manager (CM)
15
• CAR Owner (CO)
• Business development
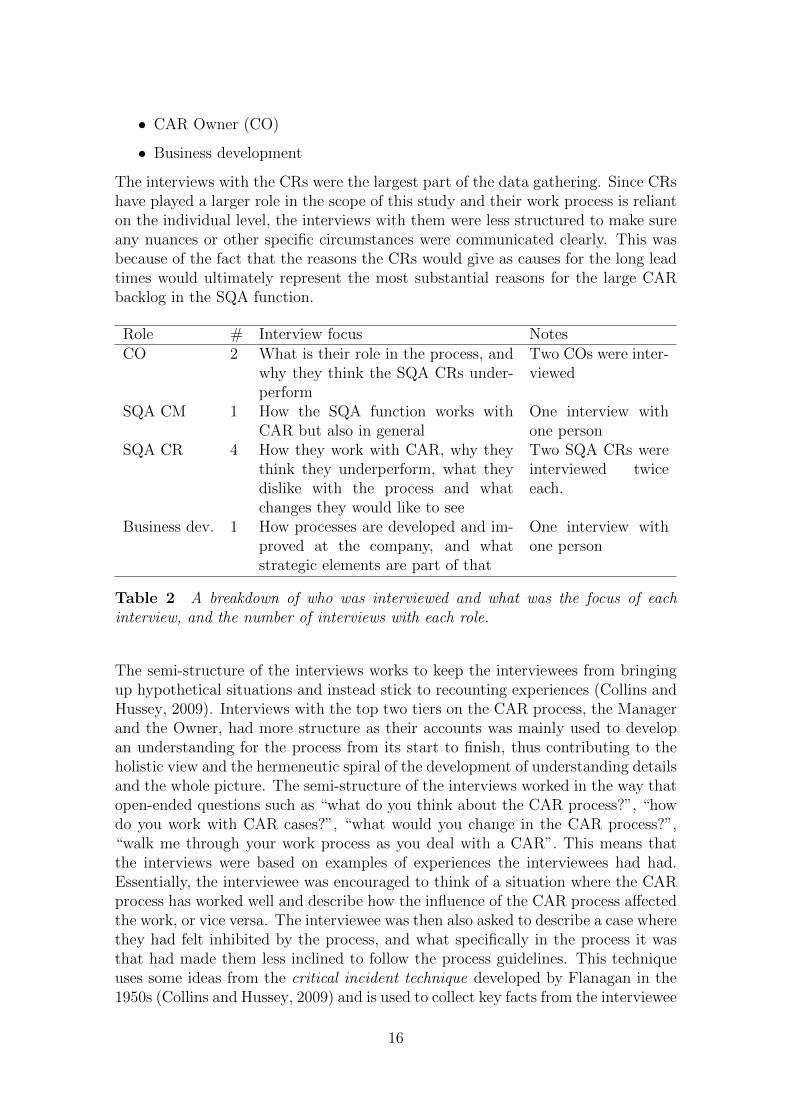
The interviews with the CRs were the largest part of the data gathering. Since CRshave played a larger role in the scope of this study and their work process is relianton the individual level, the interviews with them were less structured to make sureany nuances or other specific circumstances were communicated clearly. This wasbecause of the fact that the reasons the CRs would give as causes for the long leadtimes would ultimately represent the most substantial reasons for the large CARbacklog in the SQA function.
Role # Interview focus NotesCO 2 What is their role in the process, and
why they think the SQA CRs under-perform
Two COs were inter-viewed
SQA CM 1 How the SQA function works withCAR but also in general
One interview withone person
SQA CR 4 How they work with CAR, why theythink they underperform, what theydislike with the process and whatchanges they would like to see
Two SQA CRs wereinterviewed twiceeach.
Business dev. 1 How processes are developed and im-proved at the company, and whatstrategic elements are part of that
One interview withone person
Table 2 A breakdown of who was interviewed and what was the focus of eachinterview, and the number of interviews with each role.
The semi-structure of the interviews works to keep the interviewees from bringingup hypothetical situations and instead stick to recounting experiences (Collins andHussey, 2009). Interviews with the top two tiers on the CAR process, the Managerand the Owner, had more structure as their accounts was mainly used to developan understanding for the process from its start to finish, thus contributing to theholistic view and the hermeneutic spiral of the development of understanding detailsand the whole picture. The semi-structure of the interviews worked in the way thatopen-ended questions such as “what do you think about the CAR process?”, “howdo you work with CAR cases?”, “what would you change in the CAR process?”,“walk me through your work process as you deal with a CAR”. This means thatthe interviews were based on examples of experiences the interviewees had had.Essentially, the interviewee was encouraged to think of a situation where the CARprocess has worked well and describe how the influence of the CAR process affectedthe work, or vice versa. The interviewee was then also asked to describe a case wherethey had felt inhibited by the process, and what specifically in the process it wasthat had made them less inclined to follow the process guidelines. This techniqueuses some ideas from the critical incident technique developed by Flanagan in the1950s (Collins and Hussey, 2009) and is used to collect key facts from the interviewee
16

and is a quite rigorous interview method in the semi-structured category. While theinterview method used here is less structured than Flanagan’s method, the idea ofextracting information from specific events, i.e. examples, is inspired by it.
The questions to the interviewees were of mixed nature. As previously mentioned,questions regarding specific examples are part of the interviews, but also hypo-thetical and probing questions. The hypothetical element was used so that theinterviewee could describe an ideal state for the CAR process in terms of how itcould be a more natural and enjoyable part of their daily work tasks.
Quantitative Data Collection
The quantitative data that has been collected in this study comes from the softwaresystem where the CARs are tracked. This data has mainly been used to supportqualitative data, as is common in inductive qualitative studies (Barratt et al., 2011).The information that is tracked in the system is presented in Table 3.
Data field Example valueResponsible CR [Name]Created by CO [Name]Managed by CM [Name]Customer [Company Name]NCR Cause e.g. ‘Supplier’, ‘Manufacturing’Project [Name of project]Creation date [Day, Month, and Year]Action required by date [Day, Month, and Year]Status e.g. ‘Open ’, ‘On-going’, ‘Closed’Days open Present day - Creation dateDays to close Closing date - Creation date
Table 3 The collected quantitative data fields with examples of what is tracked.
The data from this source has been used to illustrate certain points that the numberscan contribute to. As mentioned above, the purpose of this minor quantitative datacollection is to build and support the arguments that come from the qualitativedata analysis.
2.3 Validity and Limitations
Data is generally divided into quantitative and qualitative. Quantitative data usu-ally has a high degree of reliability, while qualitative data usually has a high degreeof validity (Collins and Hussey, 2009). The reason for this is that quantitative datacan be reproduced and and analyzed objectively while qualitative data depends oncontextual variables and has a certain time element which is not always possible toreproduce.
17
In order to achieve validity in this study, the interpretations from the interviewswith the CRs were checked back with them to ensure that nothing used in the studywas a result of misinterpretation. All interviews have been recorded to provideconfirmability. The recordings also work as a way to revisit the interviews at alater stage when the general understanding of circumstances surrounding what wasdiscussed at the interviews is better; the hermeneutic spiral at work. Since thisstudy has a very low degree of ambiguous definitions that impact the scope, externalvalidity can be seen as less relevant.
The primary sources for this research are the interviews, which have been held withkey individuals as described before. The interview data was then be supported usingquantitative data from the various statistical data sources available internally.
The secondary sources used in this study are made up of internal documentationat ENGINEERING CORP that describe the CAR and FRACAS processes anddirectives. These documents are where the information about the process designs,aims, goals and other details about the processes can be found.
The limitations, or bias, in this study is the fact that the commissioner of thestudy, the PQA function, is a stakeholder in the process. Their position on whatthe process should produce and the importance of that can affect the angle of theproblem definition. Basically the PQA function is dependent on data completenessin order to track their projects’ progress, quality issues on a larger scale in order tokeep track of the general project quality levels, and perform their duties towardsclients. This means that they have a different incentive to require CAR usage. Thislimitation’s impact was limited by studying the internal process documentation andsimply by being aware of the stakeholder’s position.
18
3 Theoretical Concepts
The aim of the theoretical context section is to present the findings from the liter-ature review that are either used to analyze the findings or to provide backgroundknowledge or context. The first subsection begins with a description of what aprocess is, with the purpose of providing a context for lean service, one of the keyconcepts used in this study when it comes to process improvement. The third andfinal subsection presents the continuous improvement scheme FRACAS, which iswhat the CAR process is an example of.
3.1 Process Theory
A process can be seen as having a supplier and a customer and is itself a work flowcarried out by its members. One definition of a process is “a limited amount ofcoordinated activities that together have a determined purpose”1 (Sorqvist, 2004,p. 101) forming a network of ‘work packages’ that create a flow of work and informa-tion. A process is charaterized by the following properties (Sorqvist, 2004):
Processes have a start and a finishA process is made up of delimited activities which means that it has a deter-mined beginning and end. This does not mean that either of these need to beinternal to the organization.
Processes have customers and suppliersProcesses may have both external and internal suppliers and customers.
Processes are repetitiveIn itself, a process is repeated with a certain frequency. If a process is notrepetitive it is more suitably described as a project.
Processes describe flows in the orginazationProcess oriented firms put focus on the fact that processes describe sequences,networks, and flows of activities and work packages that are carried out in theorganization.
Processes create customer valueCustomers are a part of the process and the objective of the process is tocreate value for them. As mentioned, customers can be both internal andexternal.
Processes have purposes and objectivesProcesses exist because there is a demand for them. These demands are thegrounds for a process’s purpose and objective.
1Freely translated from the Swedish: “[en process ar en] begransad mangd av samordnadeaktiviteter som tillsammans har ett bestamt syfte” (Sorqvist, 2004, p. 101).
19

Roles in a Process
As shown in Figure 3 there are three roles in a process: The customer, the producer,and the supplier (Sorqvist, 2004). This way of looking at a process flow is central tothe process orientation. When a person’s work is needed for a task, that person isthe supplier and the person performing the task acts as the producer. This is thendelivered to the next person in line who uses the product created by the producerand is thus the customer. These roles shift as the focus changes; the producerbecomes the supplier to the customer, and the customer becomes the producer,who in turn will be the supplier of a new producer, their customer.
Suppliers
ProducerProcess
Customers
Figure 3 Representation of a process’s three parts containing the three roles: cus-tomer, producer, and supplier. Adapted from Sorqvist (2004, p. 103)
Types of Processes
Commonly processes are divided into different classes. These classes are businessprocesses, support processes, and management processes (Gardner, 2004). Businessprocesses are processes that directly create value to an external party, meaning thoseprocesses which the organization is measured by as well as exist for and its visionand mission are based around (Sorqvist, 2004). It also relies on an external partyfor its input and thus both begin and end with external party.
Businessprocesses
Customerneed
Support processes
Managementprocesses
Customervalue
Figure 4 Types of processes in an organization. A customer need is satisfied bya chain of business processes, which in turn are supported by support processes andmanaged by management processes. Adapted from Gardner (2004, p. 30).
20
Support processes exist to ensure that the core activities function and flow efficientlyand effectively. Some support processes are specific to the organization while othersare commonly found throughout the business world. This fact makes support pro-cesses likely candidates for outsourcing (Gardner, 2004). Some examples of supportprocesses are accounting, human resources, quality assurance and control, IT, andlegal services. As such, the CAR process is a support process.
Management processes gives the organization direction and governance (Sorqvist,2004). As the name entails, these processes are typically conducted to the majorityby senior officers and managers in includes activities such as development and de-ployment of strategies, plans, and goals, and business development. Managementprocesses are also the guidance for creating and conducting business and supportprocesses (Gardner, 2004).
Processes can be broken down and defined in different ways. Some organizationstend to have a simple way of defining their processes to the most part within ex-isting functions, thereby creating functional processes. Other organizations seek toemploy more cross-functional processes, which are more radical in nature. Further-more, processes can be defined on a detailed operative level or a strategic level andidentified from a customer perspective or a production perspective (Sorqvist, 2004).Moreover a process can be broken down in to smaller parts in order to illustratea hierarchy within each process. For example, a process can comprise a numberof sub-processes each of which have some associated activities. These activities arethen made up of individual work tasks.
Why Process Orientation?
It is widely argued by researchers that a process orientation is beneficial to in-creased competitive advantage instead of more archaic setups such as hierarchicaland functional orientations (Reijers, 2006). There is a strong link between non-financial performance and business process orientation, which is indirectly linkedto increased financial performance (Skrinjar, Bosilj-Vuksic and Indihar-Stemberger,2008).
There are plentiful reasons as to why process oriented businesses are common inlarge organizational contexts. One of the larger reasons is due to the fact thatmost firms in modern times find large improvement opportunities in the interfacesbetween different units, divisions, and functions. Some common advantages toemploying process orientation are (Sorqvist, 2004):
• Achieve a comprehensive impression of employees’ work
• Improved customer focus
• Improved improvement capability
• Increased change stability
• Possibility to simplify complex organizations
21
• Facilitates learning from and comparing to other activities and parties
• Requires good leadership
The process-focused organization has empirical support of delivering better resultsdue to improved customer satisfaction (Frei et al., 1999). Since customer satisfac-tion is commonly referred to as a direct contributor to market value and returns,process orientation is a certain business improvement element (Reijers, 2006). Inaddition, the size of an organization plays a large role in how customer satisfactionis created. Small firms tend to be more reliant on their few employees, since eachand every one of them contribute to a higher percentage of their firm’s results,therefore have very flexible and customized ways of dealing with their customersindividually based on the preference of each employee. By comparison, large firmshave better customer complaints management processes (Gustafsson et al., 2003).However, customer satisfaction is different from customer value delivered. Value isa more powerful measurement of performance than satisfaction since the latter isan emotional response to the perception of received value and therefore a measureof perceptions about past value delivered. This means that an unsatisfactory eventhas to take place before it can be measured. If value is instead measured, futuresatisfaction is measured (Gardner, 2004).
Non-Value Adding Work
There are a few concepts associated with process work: time, value contribution,and variation (Gardner, 2004). When a process is studied in-depth, for instanceby using Value Stream Mapping (VSM) where every sub-process, activity, and taskbelonging to a process, a significant amount of time us usually found to be non-valuecreating, i.e. waste. This waste usually comes from one of the concepts.
It is sometimes useful to classify the importance of activities involved in a process.While the process time spent on a work object may be active rather than passive,not all work is creating value. There are three different degrees of value creatingactivities: Value Adding (VA), Necessary but Non-Value Adding (NNVA), andNon-Value Adding (NVA), or waste work (Hines and Rich, 1997).
tprocess =∑
tVA +∑
tNNVA +∑
tNVA
NNVA is work that is required for the value adding work and is sometimes difficultto identify but commonly includes the following activities: maintaining control,performing checks, and coordinating work (Gardner, 2004). Since NNVA is requiredremoving that kind of activity is difficult and usually means that the process needsto be reengineered from the ground up. However, NVA activities can under normalcircumstances be done away with without any repercussions for the process.
Variation is a challenge for a process since it threatens the standardization aspectthat is inherent to processes in general, as a process is usually defined as something
22
that is repeated. There two types of causes of variation, common and special.Common cause variation is a natural part of any process and can be predicted tocreate results within a certain range. Common causes can normally be identifiedbut elimination of them have little effect on the end result of the process (Sorqvist,2004). Special cause variation is driven by external or intermittent events thatdisrupt the process in various ways. These events are not natural part of a processand create unpredictable results which can drive the process out of control (Gardner,2004).
Process Knowledge
Understanding of processes is directly correlated with their performance and im-provement potential. While no process will ever reach any sort of perfection, nordo any operate in total ignorance, there is a lot to be gained from moving towardsperfection (Slack and Lewis, 2011). It is between these extremes that the potentialfor improvement exists, where managers try to optimize and improve in order tomaintain or improve process performance.
A process has inputs x = [x1, x2, . . . , xn] and outputs y = [y1, y2, . . . , yn], and theoutput is a function of the inputs:
y = f(x)
Having process knowledge means that this function of inputs is understood and anyalterations to the function can be foreseen, measured, and controlled. Bohn (1994)presents an eight-step scale for assessing process knowledge ranging from ‘com-plete ignorance’ through different measurement and assessment stages to ‘completeknowledge’.
Stage 1: Complete ignoranceNobody in the process knows what the process entails, or what the meaningof having processes is. Any noticed or unnoticed phenomenon is disregardedas a random disturbance to the process’s output.
Stage 2: AwarenessThe process’s existence is known and its relevance might be recognized. It isnot possible to use this knowledge in the process, but it can be investigatedin order to get to the next stage. Moving from stage to stage is often donethrough serendipity, by making analogies to unrelated process or by usingknowledge from outside the organization.
Stage 3: MeasurementLike the previous stage, there is knowledge of the existence of a significantprocess that can be measured with some effort, but not controlled. However,despite the fact that it cannot be controlled, the process can be changed toaccommodate exploitation of the uncontrollable effects.
Stage 4: Control of the meanAt this stage, the control is possible, but at a crude level. In other words, there
23
is knowledge of how to control the mean bringing about some stabilization tothe process. Previously exogenously viewed variables can now be manipulatedas control variables. This stage also facilitates easier further process learning,since controlled experiments can now be performed.
Stage 5: Process capabilityThis process refers to the control of the variance. At the previous level onlythe mean could be controlled, but now the range, or the different disturbancesthat affect the input, can be controlled as well. That is, knowledge of the inputx is a process in itself and is now recognized. This means that there is noneed to ‘reinvent’ the wheel when activities are repeated.
Stage 6: Know-howProcess characterization, or know-how, entails that managers know how vari-ables affect the output when changes to the variable are made. This meansthat the process can now be fine-tuned and optimized and feedback controlcan be implemented to further increase the quality of the output throughproviding useful information for improvement.
Stage 7: Know-whyAt the know-why stage, the process knowledge is on a scientific level with non-linear and interaction effects with other variables. At this stage, optimizationcan now take place with a high effectiveness due to the knowledge of saidinteraction effects.
Stage 8: Complete knowledgeThis stage is not reachable in practice, as it means that all possible variablesare known and how they are related and interact. There is an exact expressionfor y = f(x) meaning all inputs and outputs are known and feed-forwardcontrol can be practiced.
Barriers to Process Improvement
An organizational process can be improved in various ways. Most improvements toprocesses are very small, but improvements nonetheless. Other improvements arevery large, such as completely overhauling an existing process. These two typesof improvements can be referred to as continuous improvement and breakthroughimprovement (Slack and Lewis, 2011). The former is also known as kaizen andsuch initiatives can range in scope and structure from unstructured small changesto scheduled improvement meetings involving the entire organization (Angelis andFernandes, 2012). Breakthrough improvement is based on innovation and concernsimprovements that dramatically changes the way in which an operation works.(Slack and Lewis, 2011).
Process improvement is not always straight forward and easily implementable.There are various barriers in processes which have been identified as hindrancesto the development of better practices. These barriers need to be identified and
24
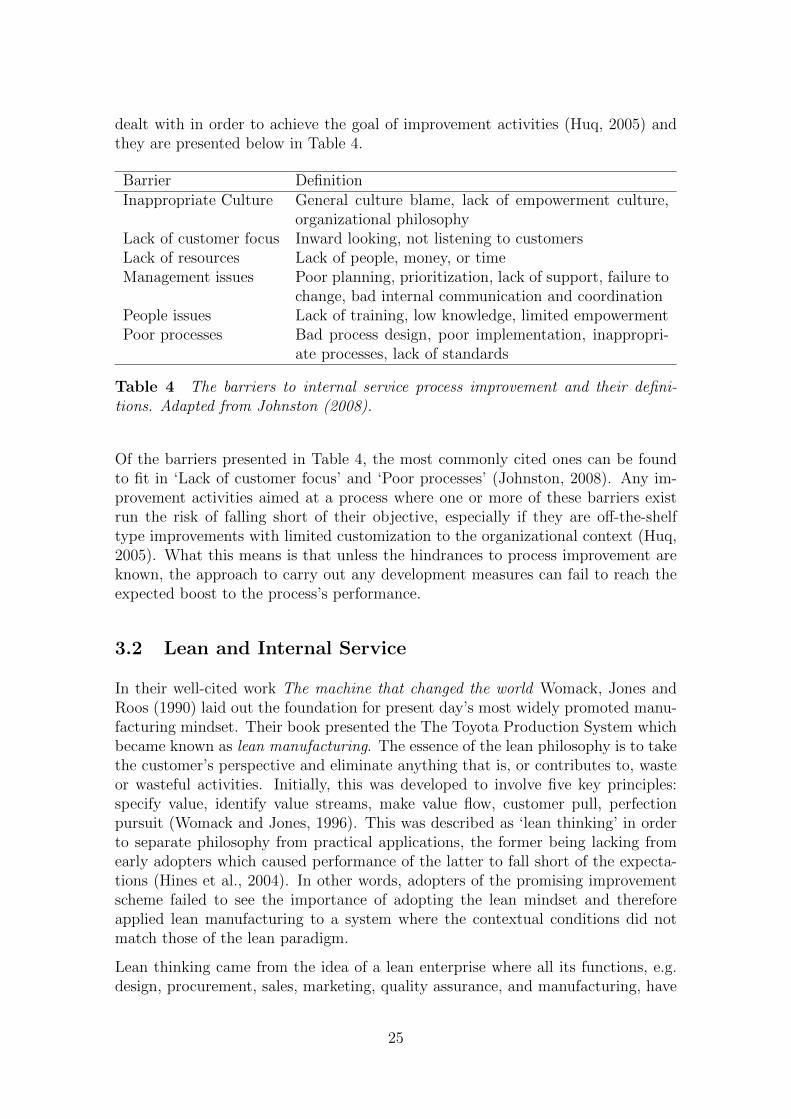
dealt with in order to achieve the goal of improvement activities (Huq, 2005) andthey are presented below in Table 4.
Barrier DefinitionInappropriate Culture General culture blame, lack of empowerment culture,
organizational philosophyLack of customer focus Inward looking, not listening to customersLack of resources Lack of people, money, or timeManagement issues Poor planning, prioritization, lack of support, failure to
change, bad internal communication and coordinationPeople issues Lack of training, low knowledge, limited empowermentPoor processes Bad process design, poor implementation, inappropri-
ate processes, lack of standards
Table 4 The barriers to internal service process improvement and their defini-tions. Adapted from Johnston (2008).
Of the barriers presented in Table 4, the most commonly cited ones can be foundto fit in ‘Lack of customer focus’ and ‘Poor processes’ (Johnston, 2008). Any im-provement activities aimed at a process where one or more of these barriers existrun the risk of falling short of their objective, especially if they are off-the-shelftype improvements with limited customization to the organizational context (Huq,2005). What this means is that unless the hindrances to process improvement areknown, the approach to carry out any development measures can fail to reach theexpected boost to the process’s performance.
3.2 Lean and Internal Service
In their well-cited work The machine that changed the world Womack, Jones andRoos (1990) laid out the foundation for present day’s most widely promoted manu-facturing mindset. Their book presented the The Toyota Production System whichbecame known as lean manufacturing. The essence of the lean philosophy is to takethe customer’s perspective and eliminate anything that is, or contributes to, wasteor wasteful activities. Initially, this was developed to involve five key principles:specify value, identify value streams, make value flow, customer pull, perfectionpursuit (Womack and Jones, 1996). This was described as ‘lean thinking’ in orderto separate philosophy from practical applications, the former being lacking fromearly adopters which caused performance of the latter to fall short of the expecta-tions (Hines et al., 2004). In other words, adopters of the promising improvementscheme failed to see the importance of adopting the lean mindset and thereforeapplied lean manufacturing to a system where the contextual conditions did notmatch those of the lean paradigm.
Lean thinking came from the idea of a lean enterprise where all its functions, e.g.design, procurement, sales, marketing, quality assurance, and manufacturing, have
25

work processes and communication channels that are designed to remove all waste-ful activities (Womack and Jones, 1994). Although the focus of lean has been onmanufacturing with 75 % of scientific articles about lean is focused on it (Wei, 2009)today’s service heavy-economy with, for instance, 80 % of the U.S. economy repre-sented by services. Therefore, there is a separate but similar application of lean onservices referred to as lean service. In essence, lean service applies a manufacturingview on a service and identifies wasteful activities just like in manufacturing. Thereis some criticism to this idea, since it can be argued that the the difference betweenservice and manufacturing is too large the applicability of lean manufacturing onservices is very limited (Seddon et al., 2011). Since the CAR process is classifiedas an internal service, this section talks about the characteristics of such processesand how to make them lean.
Internal service and lean service are thoroughly researched and provide great toolsto make intra-company improvements. Johnston (2008) outlines the barriers ofservices and how they affect the perceptions of the service value to the employees,the main implication of which is that the bi-directionality of internal services oftencarries with it a delusion of provision. This delusion makes people think that whatthey deliver is better than what they receive, which obstructs the improvementprocess since people think that they are not the ones that need to improve. Inthe case of internal services, Maleyeff (2006) infers that the main deliverable isinformation and that cross-functional cooperation is required, while internal servicesare rarely seen neither as of high value nor urgent. However, Suarez-Barraza et al.(2012) indicate that there is no clear distinction of what lean service means inpractice, since services can be entirely context driven. This means that what islean internal service in one process, not necessarily translates to a different internalservice process. The implication of this is that lean internal service in one type ofprocess may not directly be able to be applied to another, making a generalizedlean internal service concept difficult.
Internal Service Characteristics
Internal services differ from many other types of processes and have some structuralsimilarities (Maleyeff, 2006): task variability, process flows through multiple func-tions, lots of information exchanges, many reviews by managers or experts, costsand benefits are hidden, no explicit incentive for urgency, and difficulties to stream-line to all involved parties. Firstly an internal service is always about informationexchange and the quality of it. As a result of information being the most importantdeliverable there is usually a high degree of focus on what medium the informationis delivered in or on how the information is shared. This is a more direct adaption ofhow lean manufacturing work in a production process, and a better idea for internalservice systems is instead to focus the attention on the information itself, how it isformatted or the quality of it in general.
Separate from what processes that start and end with external customers entail,such as manufacturing where a raw material is transformed into a product, internal
26

services usually have high variability. This can manifest itself both in terms ofprocessing times as well as variability in what the service should deliver (Maleyeff,2006). This means that standard lean manufacturing components such as ‘tacttime’, where production is set to keep a certain rhythm, is incompatible with internalservices. Instead, a lean service should exploit the advantages of an employee, e.g.flexibility, intelligence, and experience.
In any usual internal service there are numerous business functions involved (John-ston, 2008). For instance, financial service might collect information from the sales,legal, and marketing functions in order to analyze investments. As a result of themany involved functions, improvements to the process require a cross-functionalteam of people to make any measurable improvements to the process. This makesfor a great possibility to use a Kaizen methodology to make changes to the processwith the support of top management to make any changes the Kaizen team sees aneed for.
Information exchange and management reviews both pose risks of waste in a process.For one, any extra step in a process is usually considered as waste, but handoffsof information also risks distorting the data due to differences in interpretation.On top of that, management or technical reviews, such as quality approvals oraccuracy checks, are extra costs and and a possible bottleneck activity. One of thecomponents of lean manufacturing is empowerment (Suarez-Barraza et al., 2012)and therefore review activities are not appropriate parts of a lean process.
Since most internal service processes are not paid for explicitly and usually produceintangible outputs while value to customers is multidimensional (Maleyeff, 2006).For instance, the value of a document created by an internal service process is notonly valued at what is in the document, but also in the communication betweencolleagues for troubleshooting and mutual learning. On top of that, costs are usuallyonly shown as overhead, therefore they are hidden from detailed executive oversightand only visible when looked at as a whole.
As a further structural implication of the way internal service processes work, thereis rarely an outspoken feeling of urgency even when it is needed by the internalcustomer (Maleyeff, 2006). This can be attributed to the fact that people in the theprocess are unaware of how the same process affects other people that are part of it.Usually, a simple, but thorough and realistic, process flow map can be appreciatedby the individuals in the process, since the designed process map usually indicatesan ideal state, while the real process looks and behaves differently due to localcontingencies (Bonaccorsi et al., 2011). Lean manufacturing in a factory settingusually deals with creating a motivator for urgency by setting up visual displays –either physical or on a computer screen – that enables everyone to see the status ofall activities in a process, and that way people can see the relative priority of tasksthat need their attention (Maleyeff, 2006).
Last, and an important aspect of contingency theory, is the issue of having a one-size-fits-all mindset when it comes to these internal services. As a result of thevariability of tasks in a process of this kind, along with the cross-functionality and
27
other structures listed in this section, a contingency element in the design of internalservice processes is required (Maleyeff, 2006). Contingency theory maintains thata process needs to take local dependencies into account in order to achieve whatthe process’s objectives are, and these dependencies can differ depending on whichfunctional unit performs the process (Sousa and Voss, 2008).
Lean Thinking
The manufacturing discipline of make-to-stock changed the way things are donewith the entrance of Japanese make-to-order and superior management as studiedin the Toyota Corporation in the 1980s when it was seen that the Japanese com-pany outperformed their Western counterparts by twice the productivity and had ahundred times less quality defects (Piercy and Rich, 2009). This production systemwas referred to as “lean production” (Womack et al., 1990) and builds on five prin-ciples that would be employed when undergoing a lean transformation (Womackand Jones, 1996):
1. Value. Identifying what customers need.
2. The value stream. A visual representation of of how value is added and deliv-ered, and then used to find wasteful activities.
3. Flow. Strive for awareness in how the value stream works, and ensure aseamless flow.
4. Pull. Only deliver what is demanded instead of having buffers and stocks.
5. Perfection. Keep improving the processes and strive for a perfect process.
Lean practices have always been primarily about reducing waste (Womack et al.,1990). Since the ideal state is perfection it is by definition unreachable, howeverthat does not mean that there is a reason to stop trying to achieve it. As mentionedin Section 3.1 there are three types of activities in a process: Value Adding (VA),Non-Value Adding (NVA), and Necessary but Non-Value Adding (NNVA). In a leanservice process there are said to be seven categories of NVA activities (Maleyeff,2006):
• Delays. Items in queues or waiting to be transmitted.
• Mistakes. Errors that cause redoing work, or quality concerns.
• Reviews. Checking work for correctness or quality level.
• Movements. Physical transport of people or documents.
• Duplication. Activities performed more than once or by the wrong party.
• Processing inefficiencies. Ineffective use of process resources.
• Resource inefficiencies. Wasting the available resources.
28
All of these listed categories of waste add no value to a customer and are there-fore agents of unnecessary costs. Employing these seven design steps has beenshown to improve service processes in terms of cost, quality, and lead time (Swank,2003).
Making an Internal Service Process Lean
What it is that makes a process lean is not something that is easy to define otherthan reducing the different kinds of waste. However, there are some practical stepsto take in order to improve a process. As mentioned before, the main objective oflean thinking is to find what the customer values and remove whatever activitiesthat do not contribute to that. To achieve reduced waste in a service process it isimportant to standardize procedures, remove process loop-backs, evening out taskburdens, segregating complexity, and posting performance results (Swank, 2003).Procedure standardization refers to having some work pattern to follow even thoughthe work itself varies, such as making sure that other people can take over workstarted by others if necessary. Loop-backs are essentially reviews and should not benecessary in a lean process because of the added benefit of empowerment (Suarez-Barraza et al., 2012). Evening out work entails making sure that there is an evendistribution of work between people who have the competence to perform it. Com-bined with complexity segregation, i.e. categorizing work according to priority andresource need, work distribution should strive to have no underworked or over-worked individuals (Swank, 2003). Lastly, displaying how a process is doing andwhat is needed can add an element of urgency while facilitating knowledge of whatthe internal process customer needs to do their job (Maleyeff, 2006).
There is a great opportunity to seize from combining the operations, internal-focused side with the service, customer-focused side to achieve a better grasp ofthe intricacies that involve the two when combined (Johnston, 2008). From aninternal service perspective, such an initiative can provide both customer and in-ternal efficiency at the same time. However in practice, one or the other is usuallyprevailing. In a study on New Public Management in the United Kingdom govern-ment it was suggested that too much customer focus compromises the process focus(Radnor and Johnston, 2012). Basically, the effectiveness of a process can impactthe efficiency of the process negatively. Therefore there is an improvement cyclein service processes where the focus on the customer reduces the efficiency of theprocess, and when the efficiency is improved the effectiveness lags behind in turn,see Figure 5 for a representation. There are two drivers in this context: the marketand the efficiency. Efficiency looks towards reducing costs within a process for thesake of returns to shareholders and the market driver refers to understanding thecustomer’s needs.
29

Figure 5 The improvement cycle illustrating the shifting focus to achieve sustain-able processes. Adapted from Radnor and Johnston (2012).
Continuous Improvement
Continuous Improvement (CI), also known as Kaizen, is a company-wide initiativeto improve process performance, product or service quality Schweitzer and Aurich(2010). It is a key to sustained competitive advantage and an important componentin lean thinking, TQM and Six Sigma (Angelis and Fernandes, 2012; Womack et al.,1990). Sprung from the Japanese Toyota Production System, later to be called leanproduction, where the workers would have weekly meetings to improve their work,along with statistical quality control and Walter A. Stewhart’s Plan-Do-Check-Act (PDCA) that surfaced in the 1920s, CI is a step-by-step method for processdevelopment to increase productivity (Zangwill and Kantor, 1998).
Figure 6 Representation of Continuous Improvement processes. Source:Schweitzer and Aurich (2010)
Checklists
In general, most improvement methods are somewhat associated with tasks that arerepeated continuously. While proactive improvements are generally to be preferreddue to the fact that they minimize costs, eliminate of effects, and create competitiveadvantage, reactive improvements are more common (Sorqvist, 2004). This is a
30
fairly simple idea, and it has been shown to apply even for complex processes (Slackand Lewis, 2011).
Gawande (2010) reminds readers that checklists have high value in many profes-sional areas, such as aviation, law, and health care. Most interestingly, he recountsthe initiative to have nurses in a hospital critical care unit observe that medicalteams took all the five steps that are suggested to be taken to reduce infectionsfrom the use of intravenous central lines. It turned out that the medical teamsmissed one or more steps about a third of the time. Therefore nurses were empow-ered to have the authority to stop a procedure if one or more steps were missed,and ask the doctors if the central lines should be reviewed. This made the way forchecklists in this complex operating setting.
Complex processes, often sinking under the weights of facts, are sometimes seen as inneed of complex improvement schemes to reach any kind of performance increase.However, a simple process like checklists can greatly reduce errors and refittingsand should not be disregarded as unfit tools when a process has a high degree ofcomplexity.
3.3 Failure Reporting, Analysis, and Corrective Action Sys-tem
Reliability is one of the main quality performance dimensions (Forker, 1997) andcan be defined as the ability of a component or system to perform according torequirements for a specific period of time (Lee et al., 2010). FRACAS is a man-agement tool with the purpose of identifying and correcting shortcomings in orderto prevent recurrence (U.S. Dept of Defense, 1998), providing historical data forstatistical analysis (Lee et al., 2010) and ultimately increase quality and perfor-mance. This forms a closed loop with improvements introduced in every iteration,see Figure 7.
31
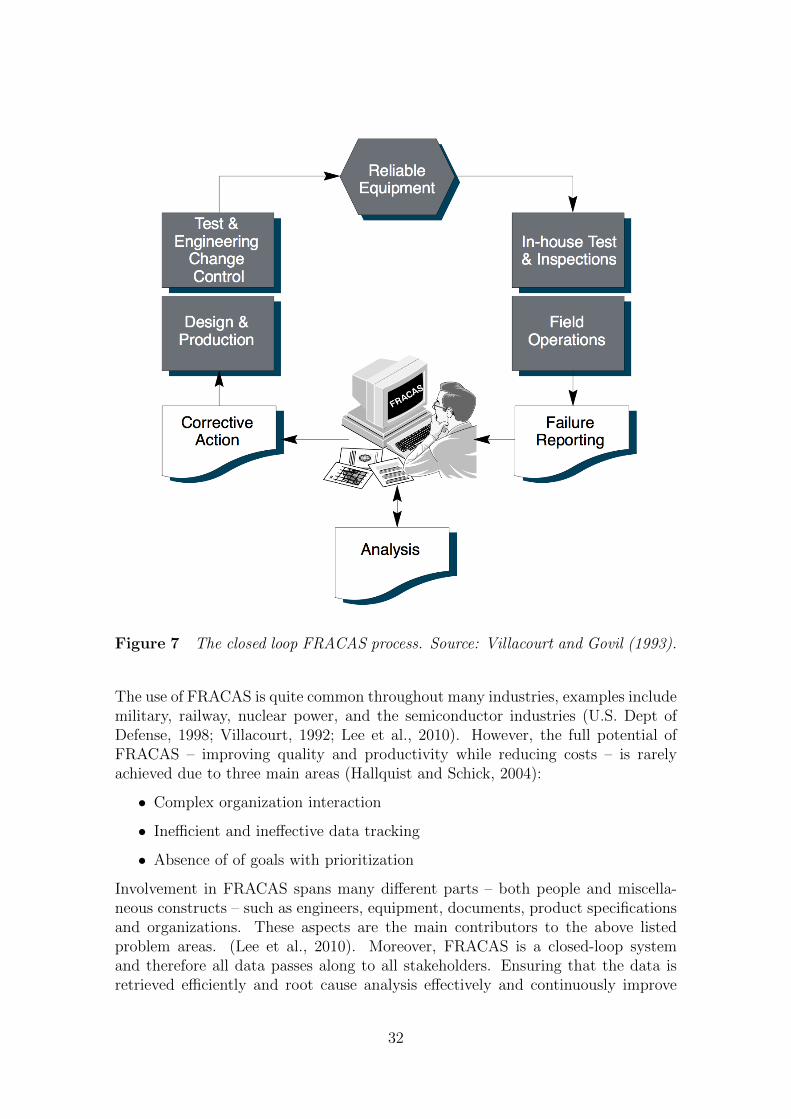
Figure 7 The closed loop FRACAS process. Source: Villacourt and Govil (1993).
The use of FRACAS is quite common throughout many industries, examples includemilitary, railway, nuclear power, and the semiconductor industries (U.S. Dept ofDefense, 1998; Villacourt, 1992; Lee et al., 2010). However, the full potential ofFRACAS – improving quality and productivity while reducing costs – is rarelyachieved due to three main areas (Hallquist and Schick, 2004):
• Complex organization interaction
• Inefficient and ineffective data tracking
• Absence of of goals with prioritization
Involvement in FRACAS spans many different parts – both people and miscella-neous constructs – such as engineers, equipment, documents, product specificationsand organizations. These aspects are the main contributors to the above listedproblem areas. (Lee et al., 2010). Moreover, FRACAS is a closed-loop systemand therefore all data passes along to all stakeholders. Ensuring that the data isretrieved efficiently and root cause analysis effectively and continuously improve
32
performance, a Failure Review Board (FRB) works as the closing link in the closed-loop system. The FRB feeds the analyzed information back to the originatingfunction where it forms the basis for improvement activities. The FRACAS closed-loop system works thanks to the fact that it involves both the customer and thesupplier throughout the process (Villacourt, 1992).
Ideal Versus Real World Process
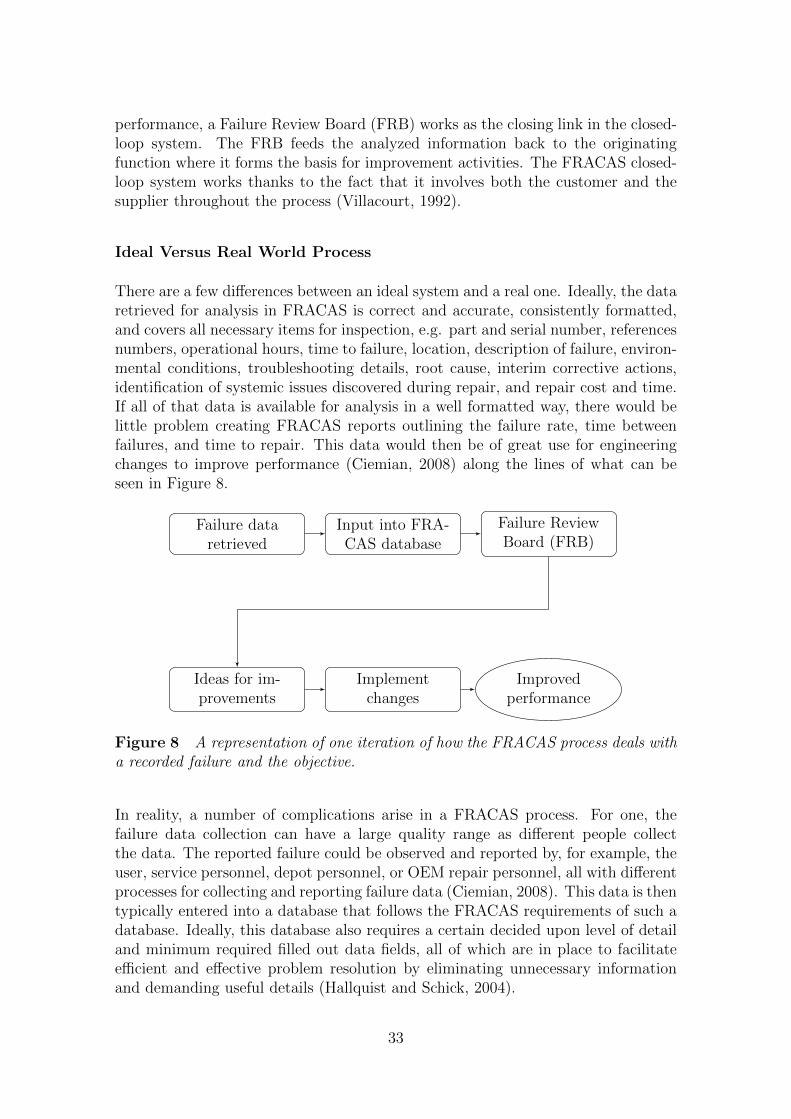
There are a few differences between an ideal system and a real one. Ideally, the dataretrieved for analysis in FRACAS is correct and accurate, consistently formatted,and covers all necessary items for inspection, e.g. part and serial number, referencesnumbers, operational hours, time to failure, location, description of failure, environ-mental conditions, troubleshooting details, root cause, interim corrective actions,identification of systemic issues discovered during repair, and repair cost and time.If all of that data is available for analysis in a well formatted way, there would belittle problem creating FRACAS reports outlining the failure rate, time betweenfailures, and time to repair. This data would then be of great use for engineeringchanges to improve performance (Ciemian, 2008) along the lines of what can beseen in Figure 8.
Failure dataretrieved
Input into FRA-CAS database
Failure ReviewBoard (FRB)
Ideas for im-provements
Implementchanges
Improvedperformance
Figure 8 A representation of one iteration of how the FRACAS process deals witha recorded failure and the objective.
In reality, a number of complications arise in a FRACAS process. For one, thefailure data collection can have a large quality range as different people collectthe data. The reported failure could be observed and reported by, for example, theuser, service personnel, depot personnel, or OEM repair personnel, all with differentprocesses for collecting and reporting failure data (Ciemian, 2008). This data is thentypically entered into a database that follows the FRACAS requirements of such adatabase. Ideally, this database also requires a certain decided upon level of detailand minimum required filled out data fields, all of which are in place to facilitateefficient and effective problem resolution by eliminating unnecessary informationand demanding useful details (Hallquist and Schick, 2004).
33
Complex Organization Interaction
As with many administrative processes, communication and interaction can be alimitation in terms of efficiency and effectiveness as complex rules for communica-tion channels are formed. Since FRACAS is a closed-loop system, the informationcontained in the system is contributed by and made available to many differentbusiness functions in order to be effective. These functions are:
• Manufacturing
• Operations
• Sales and marketing
• Testing
• Failure Review Board
• Engineering
• Quality Assurance
• Customer Service
• Suppliers
Some of these listed functions may also require to be included at multiple points inthe FRACAS process. Because of this, and all of the different functions involved inthe process, communication and interaction can become quite complex which cancause delays the resolution time (Hallquist and Schick, 2004).
Lack of Prioritized Goals
Depending on the size of a project or program, the size of a FRACAS scheme differs(Ciemian, 2008), and that size has a direct correlation with how much time andeffort is allotted to designing a scheme. Usually, there are three main reasons forimplementing FRACAS:
1. Meeting customer requirements
2. Improving internal reliability
3. Improving the next generation of products
Depending on what function in an organization is responsible for developing a FRA-CAS scheme, these three reasons are valued differently. Because of resource con-straints, fully developed schemes are usually not used in favor of using softwarethat is already in use in the organization, such as Microsoft Excel or Access baseddatabases. In the common case, the FRACAS development ends here resulting inlow efficiency and poor cohesiveness (Hallquist and Schick, 2004). Much dependingon the fact that FRACAS is an internal service system, people generally do notrecognize the value and need of the initiative until much later in the life of the
34
program (Johnston, 2008). This affects this specific internal service process on theplanning stage as insufficient resources and attention is given to the developmentat the proper time (Hallquist and Schick, 2004). On the management level, thevision is to have a FRACAS initiative reduce the total number of quality issuesthroughout the organization. For managers, the initiative is meant to reduce thecosts of warranties given to customers, as well as yield reliability trends and otheritems for analysis.
These three different levels of expectations are not linked and in the common casethey are not discussed and given priorities. This causes insufficient finances torequire a cheap implementation while a lot of data input is expected while imple-menting too late in the project lifetime. To overcome these problems there shouldbe a FRACAS board whose purpose is to assign the different goals of the processwith priorities and implement it thereafter (Hallquist and Schick, 2004).
Ineffective and Inefficient Data Tracking
For a FRACAS initiative to gather useful data, the amount of data to input intothe system needs to be on a reasonable level. Not unusually, there are over 80 fieldsof data input when a failure is recorded (Hallquist and Schick, 2004). While thatdata may well be useful, the task of inputting it all causes many fields to be skippedand therefore the data will be incomplete. When a task requires more effort or timethan what an individual can bother with, the task will not be carried out fully orskipped completely (Emiliani, 1998). In terms of FRACAS schemes, this meansthat if too much data or the way the data is entered into the database can be tootime-consuming to carry out the task, resulting in a scheme that does not collectuseful data.
3.4 Summary
This section has presented the theoretical concepts that were used in the study.Most importantly, internal services have many similar characteristics and there-fore also barriers to performance improvements (Maleyeff, 2006; Johnston, 2008).However, these service processes’ performance can be improved by applying the con-cept of lean service, similar to lean production, by removing unnecessary activities(Swank, 2003; Suarez-Barraza et al., 2012; Radnor and Johnston, 2012). FRACASis an internal service process that exhibits many of the characteristics that make upinternal services, however in the case for this study, the CAR process involves exter-nal parties to a limited extent. Regardless, it can be viewed as an internal service toa large extent, since the majority of the process takes place within the organizationand the involvement of external parties is limited to the input of data.
35
4 Current Process
This section describes what the current process looks like and how it performs.The structure of this section is the repeated in Sections 5 and 6 and that structureis beginning at the inputs to the process, then the process itself, and finally theprocess’s output.
Typically, when a customer finds a nonconformity on delivered goods from ENGI-NEERING CORP, they file a Nonconformance Report (NCR). A CAR is generatedby an administrator, or CAR Owner (CO), at ENGINEERING CORP as a resultof that customer’s NCR. This means that only quality defects after shipping areconsidered for CARs, i.e. during a customer’s receiving inspection, manufacturing,testing, and commissioning. Faults found before shipping are not part of the CARprocess.
The intended resulting output of a CAR is that the error that caused the noncon-formance is permanently prevented from recurring through three steps:
• a root cause analysis,
• containment of the fault by inspection of all other identical parts,
• and finally a corrective action implementation plan.
A CAR document has a few relevant fields to be filled out. First of all, the causeof the nonconformance is filled out (e.g. supplier, engineering, manufacturing, orproject management). Next is a field that is used for immediate action to containthe problem, e.g. “sent replacement equipment” or “repaired on site”. This is alsothe section used for containment action as mentioned above. In order to eliminatethe problem from recurring there is a field to describe the root cause and then afield describing corrective actions and the implementation of them.
There are two main functional units worth mentioning in this study: Project Qual-ity Assurance (PQA) and Supplier Quality Assurance (SQA). They are both keystakeholders in the CAR process and in the study itself. The limitations of this ispresented in the Limitations subsection in Section 2.2. The PQA Managers makeup the supporting role in the project core team and, as the name entails, ensurethat project quality requirements are upheld. This means that when a customerreports a nonconformity, it is the PQA Manager who is their contact in the projectcore team and therefore the one who is most dependent on the CAR results. It isthis function that called for this study to be conducted. The SQA unit is a lineorganization and work in several projects at the same time. The responsibilities ofthe department are Parts Approval Process (PAP), CAR, Supplier Evaluation andApproval Process (SEAP), and supplier development. Currently, the PAP respon-sibilities take lots of time due to the travel associated with it, and therefore there issimply not enough resources or time to handle CARs. It is the SQA function thathandles CARs that are labeled as caused by ‘Supplier’.
36
4.1 Input
When a customer finds a product delivered by ENGINEERING CORP that is notcompliant with the quality agreements, they start the warranty complaint process bydrafting an NCR. This report can be prepared by people in numerous roles depend-ing on which customer and site is concerned. The report contains any informationthe drafter finds important for the claim except for if it is an Engineering ControlsDepartment device, which has a thorough checklist for what information needs tobe included in the NCR for a swift problem resolution. In the case for complaintshandled by the SQA function, which handles numerous components delivered byalmost as many suppliers, there are no requirements from the SQA function.
Creating the Corrective Action Request
The next step for the nonconformance complaint is to be processed by an War-ranty Customer Coordinator (WCC) on the site, if it is an internal customer, orat the headquarters if it is an external customer. This administrator then sets upthe CAR in the database by filling out the required fields, e.g. what componentis affected, batch number, symptoms observed and any other information providedby the NCR, as well as the nonconformance cause which usually depends on thecomponent. If it is a component not designed or manufactured by ENGINEER-ING CORP itself, but rather by a supplier, the nonconformance cause is set to‘Supplier’, which is the function this study is focused on. As the CAR is created,the WCC becomes the CO for it. In the special case when the nonconformancecause is ‘Supplier’, the WCC also sends a claim to the supplier that the faultymaterial to ENGINEERING CORP.
If the CO deems the NCR insufficient or does not fill all of the criteria on the Com-munication and Controls Department’s checklist, more information is requestedimmediately and the CAR status is set to ‘Pending Nonconformance (NC) Info Up-date’. This status is then updated to ‘Open’ once sufficient information is availableand assigned to the responsible CAR Manager (CM). In the cases where the cus-tomer performs a repair on the affected component a repair report is required to beattached to the CAR and the status is instead set to ‘Pending Repair Report’. Otherinstances require the affected component to be sent to an ENGINEERING CORPsite for investigation and repair, if the CO or customer thinks it is necessary, whichmeans the status should be set to ‘Pending Material’ while the component is intransit.
Event Current status Action New statusReceivenew NCR
None Create CAR, and if needed, requestmore NC info, repair report, or re-quest material
Open
Table 5 Instruction for COs when receiving a new CAR.
37
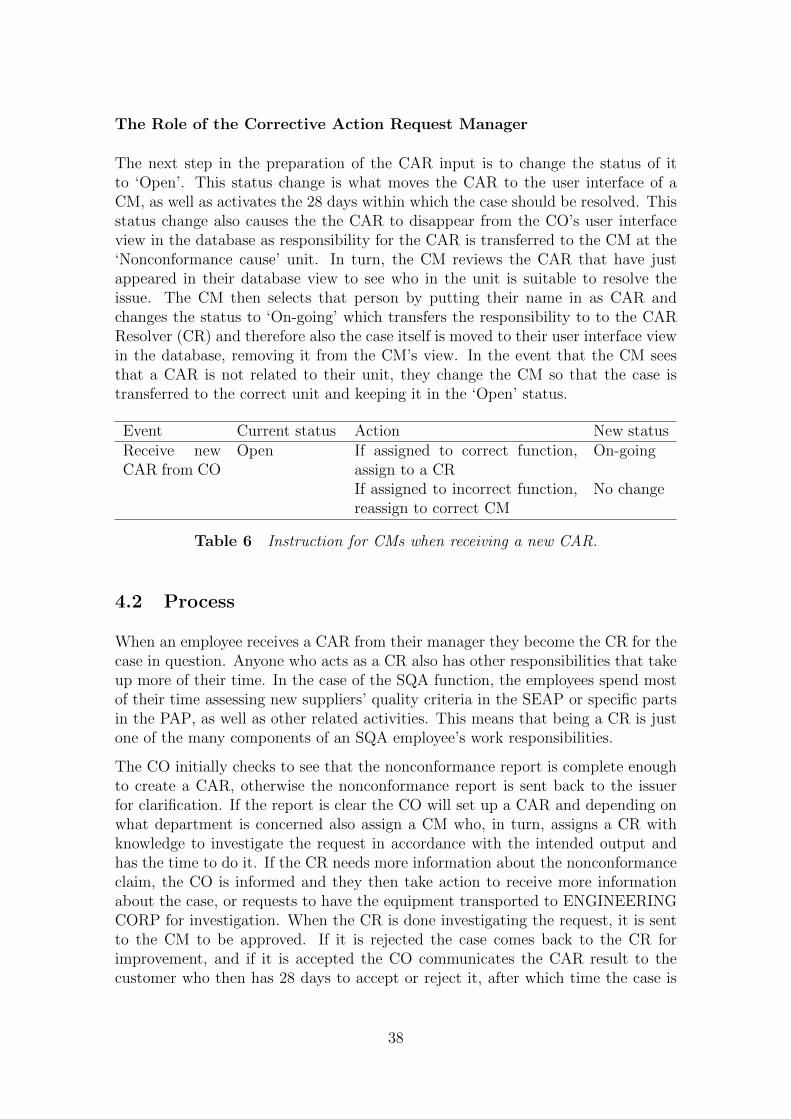
The Role of the Corrective Action Request Manager
The next step in the preparation of the CAR input is to change the status of itto ‘Open’. This status change is what moves the CAR to the user interface of aCM, as well as activates the 28 days within which the case should be resolved. Thisstatus change also causes the the CAR to disappear from the CO’s user interfaceview in the database as responsibility for the CAR is transferred to the CM at the‘Nonconformance cause’ unit. In turn, the CM reviews the CAR that have justappeared in their database view to see who in the unit is suitable to resolve theissue. The CM then selects that person by putting their name in as CAR andchanges the status to ‘On-going’ which transfers the responsibility to to the CARResolver (CR) and therefore also the case itself is moved to their user interface viewin the database, removing it from the CM’s view. In the event that the CM seesthat a CAR is not related to their unit, they change the CM so that the case istransferred to the correct unit and keeping it in the ‘Open’ status.
Event Current status Action New statusReceive newCAR from CO
Open If assigned to correct function,assign to a CR
On-going
If assigned to incorrect function,reassign to correct CM
No change
Table 6 Instruction for CMs when receiving a new CAR.
4.2 Process
When an employee receives a CAR from their manager they become the CR for thecase in question. Anyone who acts as a CR also has other responsibilities that takeup more of their time. In the case of the SQA function, the employees spend mostof their time assessing new suppliers’ quality criteria in the SEAP or specific partsin the PAP, as well as other related activities. This means that being a CR is justone of the many components of an SQA employee’s work responsibilities.
The CO initially checks to see that the nonconformance report is complete enoughto create a CAR, otherwise the nonconformance report is sent back to the issuerfor clarification. If the report is clear the CO will set up a CAR and depending onwhat department is concerned also assign a CM who, in turn, assigns a CR withknowledge to investigate the request in accordance with the intended output andhas the time to do it. If the CR needs more information about the nonconformanceclaim, the CO is informed and they then take action to receive more informationabout the case, or requests to have the equipment transported to ENGINEERINGCORP for investigation. When the CR is done investigating the request, it is sentto the CM to be approved. If it is rejected the case comes back to the CR forimprovement, and if it is accepted the CO communicates the CAR result to thecustomer who then has 28 days to accept or reject it, after which time the case is
38
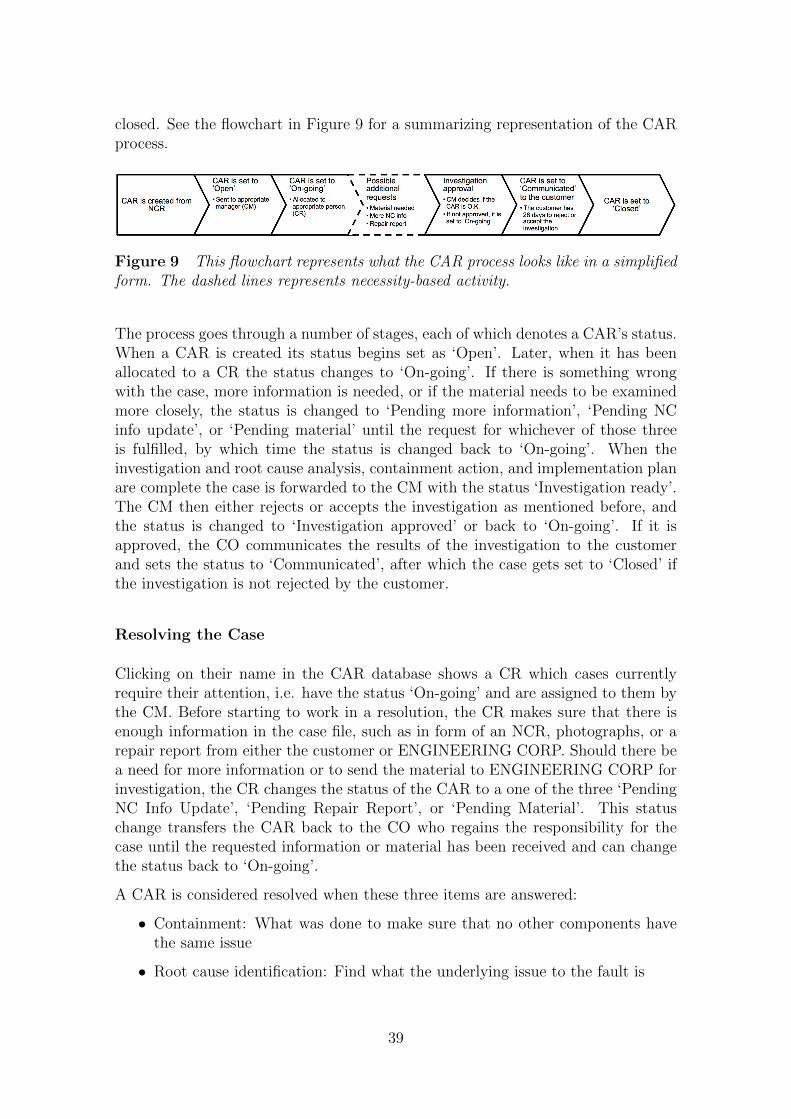
closed. See the flowchart in Figure 9 for a summarizing representation of the CARprocess.
Figure 9 This flowchart represents what the CAR process looks like in a simplifiedform. The dashed lines represents necessity-based activity.
The process goes through a number of stages, each of which denotes a CAR’s status.When a CAR is created its status begins set as ‘Open’. Later, when it has beenallocated to a CR the status changes to ‘On-going’. If there is something wrongwith the case, more information is needed, or if the material needs to be examinedmore closely, the status is changed to ‘Pending more information’, ‘Pending NCinfo update’, or ‘Pending material’ until the request for whichever of those threeis fulfilled, by which time the status is changed back to ‘On-going’. When theinvestigation and root cause analysis, containment action, and implementation planare complete the case is forwarded to the CM with the status ‘Investigation ready’.The CM then either rejects or accepts the investigation as mentioned before, andthe status is changed to ‘Investigation approved’ or back to ‘On-going’. If it isapproved, the CO communicates the results of the investigation to the customerand sets the status to ‘Communicated’, after which the case gets set to ‘Closed’ ifthe investigation is not rejected by the customer.
Resolving the Case
Clicking on their name in the CAR database shows a CR which cases currentlyrequire their attention, i.e. have the status ‘On-going’ and are assigned to them bythe CM. Before starting to work in a resolution, the CR makes sure that there isenough information in the case file, such as in form of an NCR, photographs, or arepair report from either the customer or ENGINEERING CORP. Should there bea need for more information or to send the material to ENGINEERING CORP forinvestigation, the CR changes the status of the CAR to a one of the three ‘PendingNC Info Update’, ‘Pending Repair Report’, or ‘Pending Material’. This statuschange transfers the CAR back to the CO who regains the responsibility for thecase until the requested information or material has been received and can changethe status back to ‘On-going’.
A CAR is considered resolved when these three items are answered:
• Containment: What was done to make sure that no other components havethe same issue
• Root cause identification: Find what the underlying issue to the fault is
39
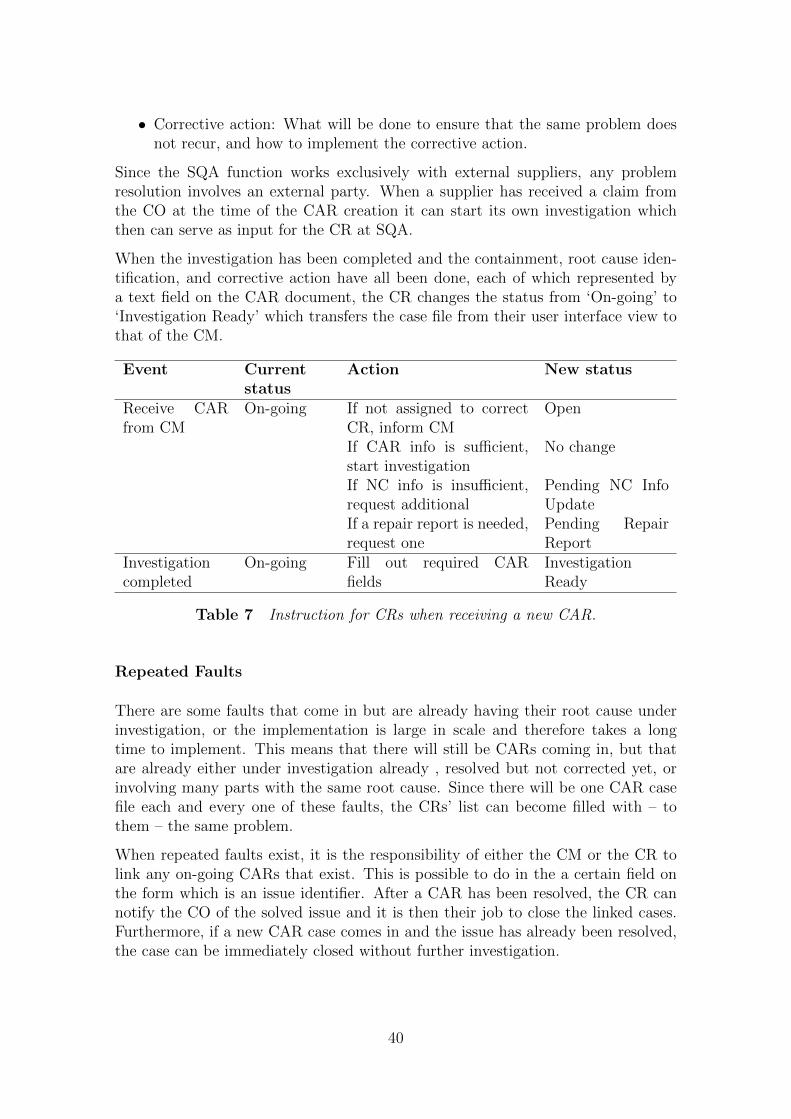
• Corrective action: What will be done to ensure that the same problem doesnot recur, and how to implement the corrective action.
Since the SQA function works exclusively with external suppliers, any problemresolution involves an external party. When a supplier has received a claim fromthe CO at the time of the CAR creation it can start its own investigation whichthen can serve as input for the CR at SQA.
When the investigation has been completed and the containment, root cause iden-tification, and corrective action have all been done, each of which represented bya text field on the CAR document, the CR changes the status from ‘On-going’ to‘Investigation Ready’ which transfers the case file from their user interface view tothat of the CM.
Event Currentstatus
Action New status
Receive CARfrom CM
On-going If not assigned to correctCR, inform CM
Open
If CAR info is sufficient,start investigation
No change
If NC info is insufficient,request additional
Pending NC InfoUpdate
If a repair report is needed,request one
Pending RepairReport
Investigationcompleted
On-going Fill out required CARfields
InvestigationReady
Table 7 Instruction for CRs when receiving a new CAR.
Repeated Faults
There are some faults that come in but are already having their root cause underinvestigation, or the implementation is large in scale and therefore takes a longtime to implement. This means that there will still be CARs coming in, but thatare already either under investigation already , resolved but not corrected yet, orinvolving many parts with the same root cause. Since there will be one CAR casefile each and every one of these faults, the CRs’ list can become filled with – tothem – the same problem.
When repeated faults exist, it is the responsibility of either the CM or the CR tolink any on-going CARs that exist. This is possible to do in the a certain field onthe form which is an issue identifier. After a CAR has been resolved, the CR cannotify the CO of the solved issue and it is then their job to close the linked cases.Furthermore, if a new CAR case comes in and the issue has already been resolved,the case can be immediately closed without further investigation.
40
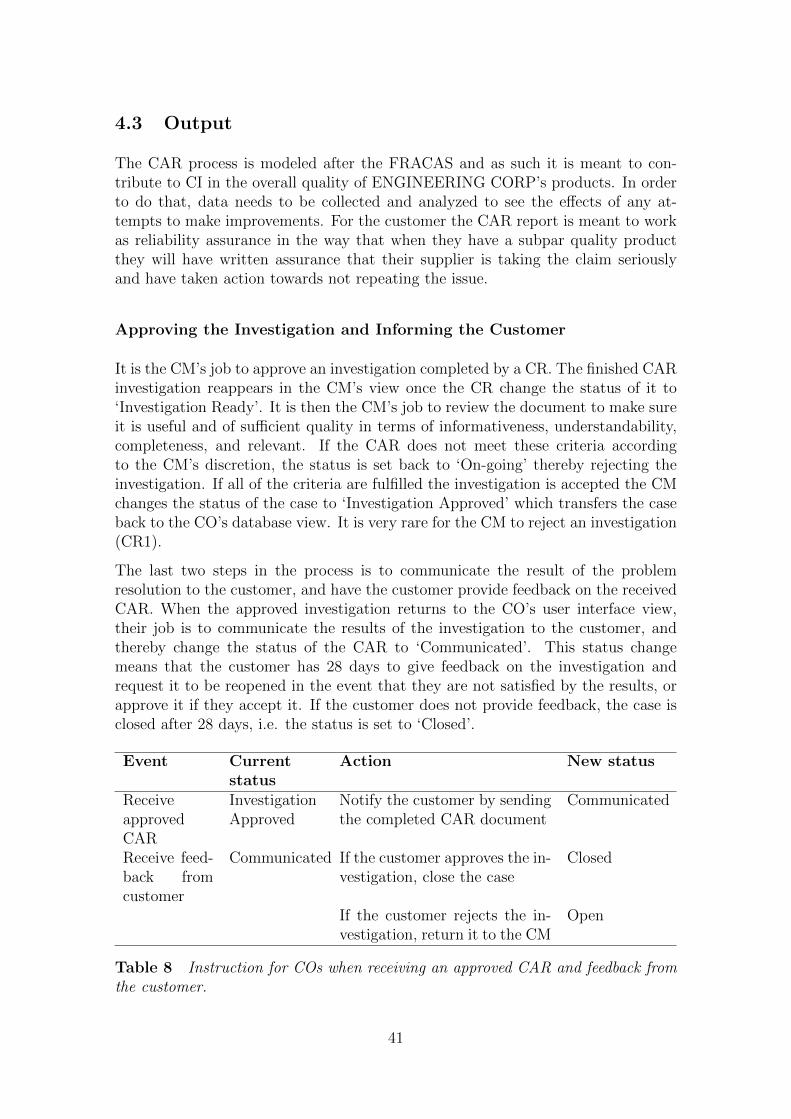
4.3 Output
The CAR process is modeled after the FRACAS and as such it is meant to con-tribute to CI in the overall quality of ENGINEERING CORP’s products. In orderto do that, data needs to be collected and analyzed to see the effects of any at-tempts to make improvements. For the customer the CAR report is meant to workas reliability assurance in the way that when they have a subpar quality productthey will have written assurance that their supplier is taking the claim seriouslyand have taken action towards not repeating the issue.
Approving the Investigation and Informing the Customer
It is the CM’s job to approve an investigation completed by a CR. The finished CARinvestigation reappears in the CM’s view once the CR change the status of it to‘Investigation Ready’. It is then the CM’s job to review the document to make sureit is useful and of sufficient quality in terms of informativeness, understandability,completeness, and relevant. If the CAR does not meet these criteria accordingto the CM’s discretion, the status is set back to ‘On-going’ thereby rejecting theinvestigation. If all of the criteria are fulfilled the investigation is accepted the CMchanges the status of the case to ‘Investigation Approved’ which transfers the caseback to the CO’s database view. It is very rare for the CM to reject an investigation(CR1).
The last two steps in the process is to communicate the result of the problemresolution to the customer, and have the customer provide feedback on the receivedCAR. When the approved investigation returns to the CO’s user interface view,their job is to communicate the results of the investigation to the customer, andthereby change the status of the CAR to ‘Communicated’. This status changemeans that the customer has 28 days to give feedback on the investigation andrequest it to be reopened in the event that they are not satisfied by the results, orapprove it if they accept it. If the customer does not provide feedback, the case isclosed after 28 days, i.e. the status is set to ‘Closed’.
Event Currentstatus
Action New status
ReceiveapprovedCAR
InvestigationApproved
Notify the customer by sendingthe completed CAR document
Communicated
Receive feed-back fromcustomer
Communicated If the customer approves the in-vestigation, close the case
Closed
If the customer rejects the in-vestigation, return it to the CM
Open
Table 8 Instruction for COs when receiving an approved CAR and feedback fromthe customer.
41
Using the Data from the Process
In order to track the quality of on-going projects, for which they are responsible,the PQA employees use the CAR database output and analyses in their work.Moreover, since they are the point of contact for quality concerns that customersmight have, they are dependent on accurate information in the database in orderto communicate the progress to interested customers. Secondly, in order to achieveimproved quality in all processes, the output needs to be accurate and timely forany analysis to be fruitful. Since the CAR process is a FRACAS process, the closedloop system builds a ‘lessons learned’ knowledge bank for process improvementinitiatives.
It is these two items that make up the objectives of the whole CAR process. It isevident that all parties benefit from the process’s objectives, the customers contin-uously see higher quality as time progresses and ENGINEERING CORP createsknowledge for itself in how to improve processes and product quality to attract andretain customers. But, as the following section will present, the process has somelimitations when it comes to CAR in the SQA function, which inhibit the processfrom working as intended.
To illustrate how the ownership changes throughout the course of the CAR processsee Table 9 where each row represents a new step in the process. The frequentchanges of ownership is apparent here and the different statuses progression is clear.The table should be interpreted in the way that the status on each row is in thecolumn of the CAR role that can see the case in their database view.
42
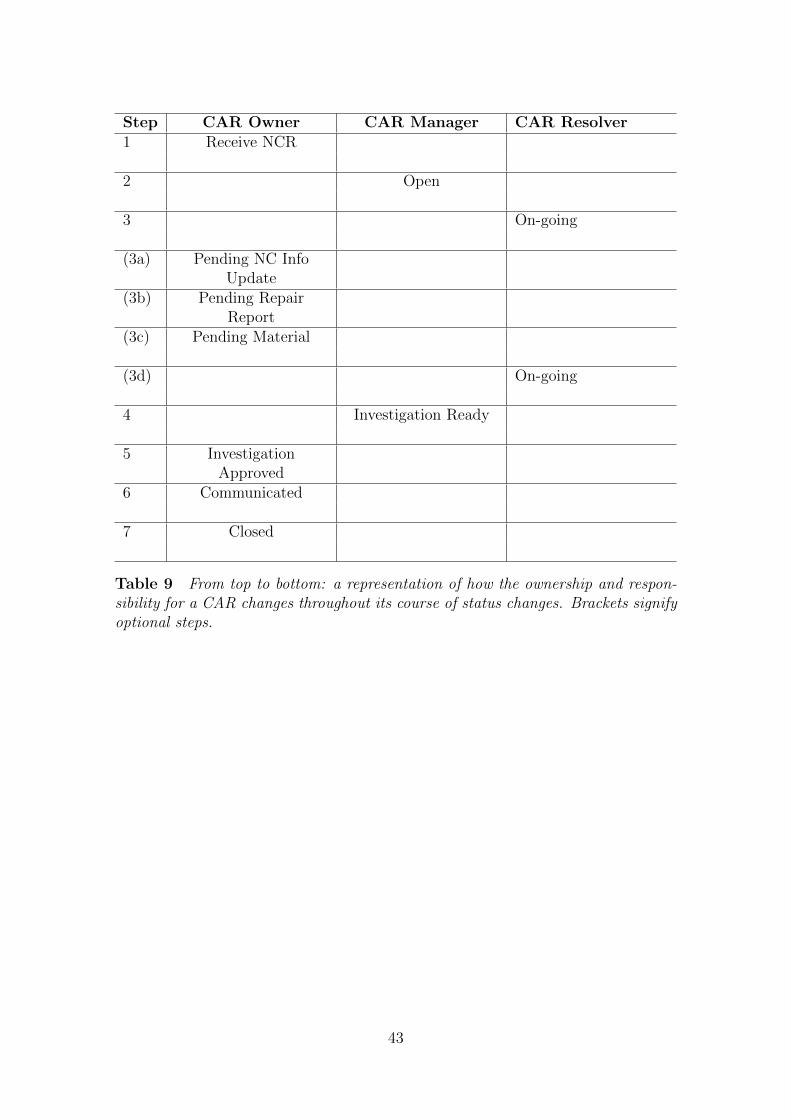
Step CAR Owner CAR Manager CAR Resolver1 Receive NCR
2 Open
3 On-going
(3a) Pending NC InfoUpdate
(3b) Pending RepairReport
(3c) Pending Material
(3d) On-going
4 Investigation Ready
5 InvestigationApproved
6 Communicated
7 Closed
Table 9 From top to bottom: a representation of how the ownership and respon-sibility for a CAR changes throughout its course of status changes. Brackets signifyoptional steps.
43
5 Problems Associated with the Current Process
This section presents all the issues the interviewees have expressed in the interviewsand quantitative information sources. As the interviewees are anonymous in thisstudy, they are referred to as their role plus a number, e.g. CR1 is CR numberone.
Many of the issues here are intertwined, but require different actions to improve.For example, most of the issues raised by the CRs involved unnecessary adminis-trative procedures that they think are discouraging to do. As an extension of that,the amount of administrative procedures needed for simple cases is the same aswhat is needed for larger, more complicated, cases. Moreover the customers areoften quite unaware of the CAR process which adds to their noncompliance withnonconformance reporting, resulting in longer lead times due to requests for moreinformation.
There are two types of factors presented by people in different roles in the CARprocess that increase the lead time for the cases resolved by the SQA function. Oneof the factors is the problems associated with waiting times when a CR cannot makeany progress, e.g. when customers take long to ship the affected material, or whenthe NCR needs to be clarified. The other type factor is the discouraging factors ofusing the database and the established difference between fault and CAR, whichmeans that the CRs as well as customers see problem resolving as separate fromthe CAR documentation instead of seeing the two as the same thing.
5.1 Input
This section presents the data from the interviews that point towards issues withthe inputs to the process. Interviewees have mentioned that NCRs are of varyingquality, either in terms of language when a translate software has been used orwhen the information in the NCR is insufficient, which poses a risk to extra timeneeded in order to start the issue investigation. The process depends on what theprocedures are used at the customer site in terms of the quality of the NCR but alsothe level of active CAR management. This site dependence can be shown to play asignificant part of the resolution time of an issue. Last in this section a part abouthow mistakes in the allocation of CARs, nonconformance cause change, affects theCRs work with problem resolving.
Nonconformance Reporting
Incomplete information in an NCR requires additional information from the theperson who wrote the report in order for the CR to get to work on the CAR.Whenever the initial information contained in a CAR is ambiguous or unsatisfactoryin any other way, the CR changes the status of the CAR to ‘Pending NC InfoUpdate’ which automatically changes the process ownership back to the CO as
44
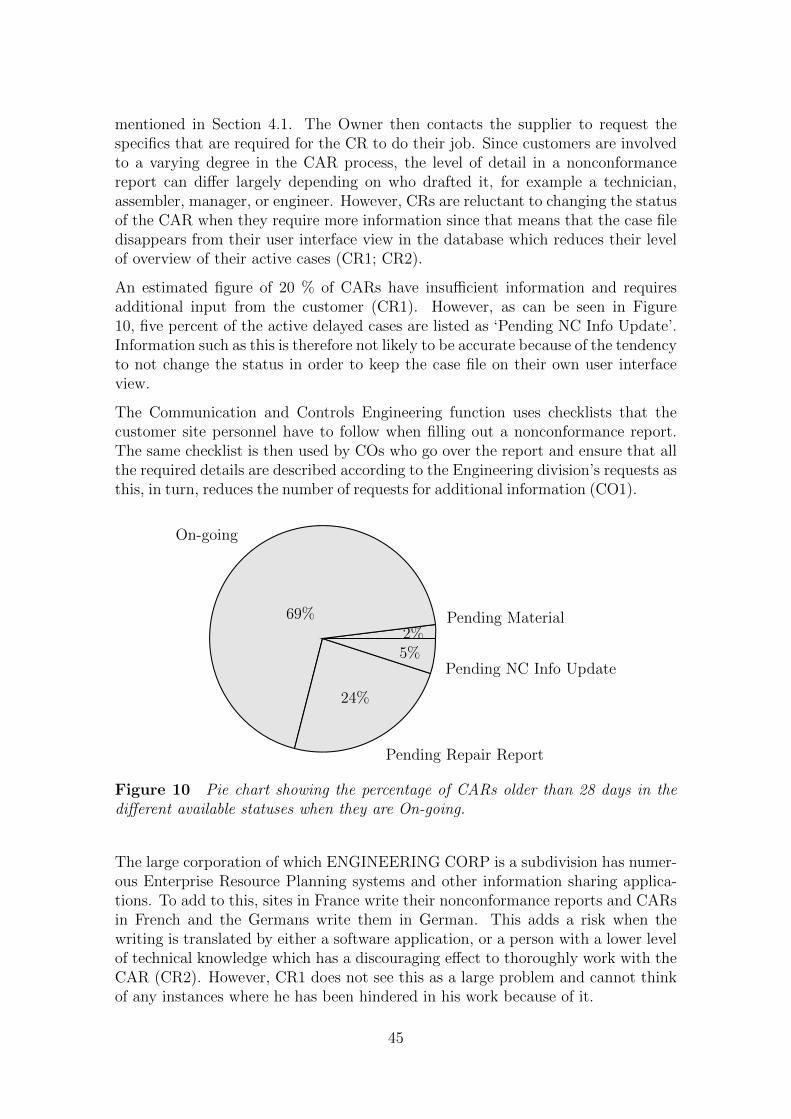
mentioned in Section 4.1. The Owner then contacts the supplier to request thespecifics that are required for the CR to do their job. Since customers are involvedto a varying degree in the CAR process, the level of detail in a nonconformancereport can differ largely depending on who drafted it, for example a technician,assembler, manager, or engineer. However, CRs are reluctant to changing the statusof the CAR when they require more information since that means that the case filedisappears from their user interface view in the database which reduces their levelof overview of their active cases (CR1; CR2).
An estimated figure of 20 % of CARs have insufficient information and requiresadditional input from the customer (CR1). However, as can be seen in Figure10, five percent of the active delayed cases are listed as ‘Pending NC Info Update’.Information such as this is therefore not likely to be accurate because of the tendencyto not change the status in order to keep the case file on their own user interfaceview.
The Communication and Controls Engineering function uses checklists that thecustomer site personnel have to follow when filling out a nonconformance report.The same checklist is then used by COs who go over the report and ensure that allthe required details are described according to the Engineering division’s requests asthis, in turn, reduces the number of requests for additional information (CO1).
Pending Material2%
On-going
69%
Pending Repair Report
24%
Pending NC Info Update5%
Figure 10 Pie chart showing the percentage of CARs older than 28 days in thedifferent available statuses when they are On-going.
The large corporation of which ENGINEERING CORP is a subdivision has numer-ous Enterprise Resource Planning systems and other information sharing applica-tions. To add to this, sites in France write their nonconformance reports and CARsin French and the Germans write them in German. This adds a risk when thewriting is translated by either a software application, or a person with a lower levelof technical knowledge which has a discouraging effect to thoroughly work with theCAR (CR2). However, CR1 does not see this as a large problem and cannot thinkof any instances where he has been hindered in his work because of it.
45
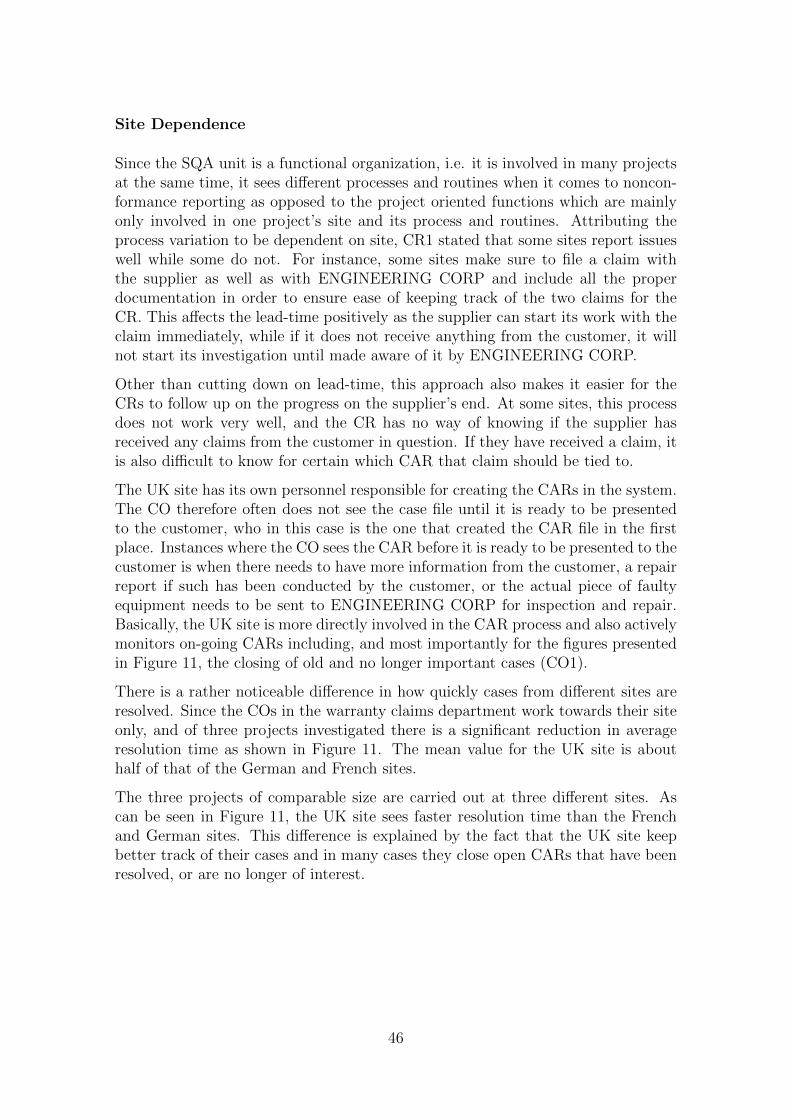
Site Dependence
Since the SQA unit is a functional organization, i.e. it is involved in many projectsat the same time, it sees different processes and routines when it comes to noncon-formance reporting as opposed to the project oriented functions which are mainlyonly involved in one project’s site and its process and routines. Attributing theprocess variation to be dependent on site, CR1 stated that some sites report issueswell while some do not. For instance, some sites make sure to file a claim withthe supplier as well as with ENGINEERING CORP and include all the properdocumentation in order to ensure ease of keeping track of the two claims for theCR. This affects the lead-time positively as the supplier can start its work with theclaim immediately, while if it does not receive anything from the customer, it willnot start its investigation until made aware of it by ENGINEERING CORP.
Other than cutting down on lead-time, this approach also makes it easier for theCRs to follow up on the progress on the supplier’s end. At some sites, this processdoes not work very well, and the CR has no way of knowing if the supplier hasreceived any claims from the customer in question. If they have received a claim, itis also difficult to know for certain which CAR that claim should be tied to.
The UK site has its own personnel responsible for creating the CARs in the system.The CO therefore often does not see the case file until it is ready to be presentedto the customer, who in this case is the one that created the CAR file in the firstplace. Instances where the CO sees the CAR before it is ready to be presented to thecustomer is when there needs to have more information from the customer, a repairreport if such has been conducted by the customer, or the actual piece of faultyequipment needs to be sent to ENGINEERING CORP for inspection and repair.Basically, the UK site is more directly involved in the CAR process and also activelymonitors on-going CARs including, and most importantly for the figures presentedin Figure 11, the closing of old and no longer important cases (CO1).
There is a rather noticeable difference in how quickly cases from different sites areresolved. Since the COs in the warranty claims department work towards their siteonly, and of three projects investigated there is a significant reduction in averageresolution time as shown in Figure 11. The mean value for the UK site is abouthalf of that of the German and French sites.
The three projects of comparable size are carried out at three different sites. Ascan be seen in Figure 11, the UK site sees faster resolution time than the Frenchand German sites. This difference is explained by the fact that the UK site keepbetter track of their cases and in many cases they close open CARs that have beenresolved, or are no longer of interest.
46
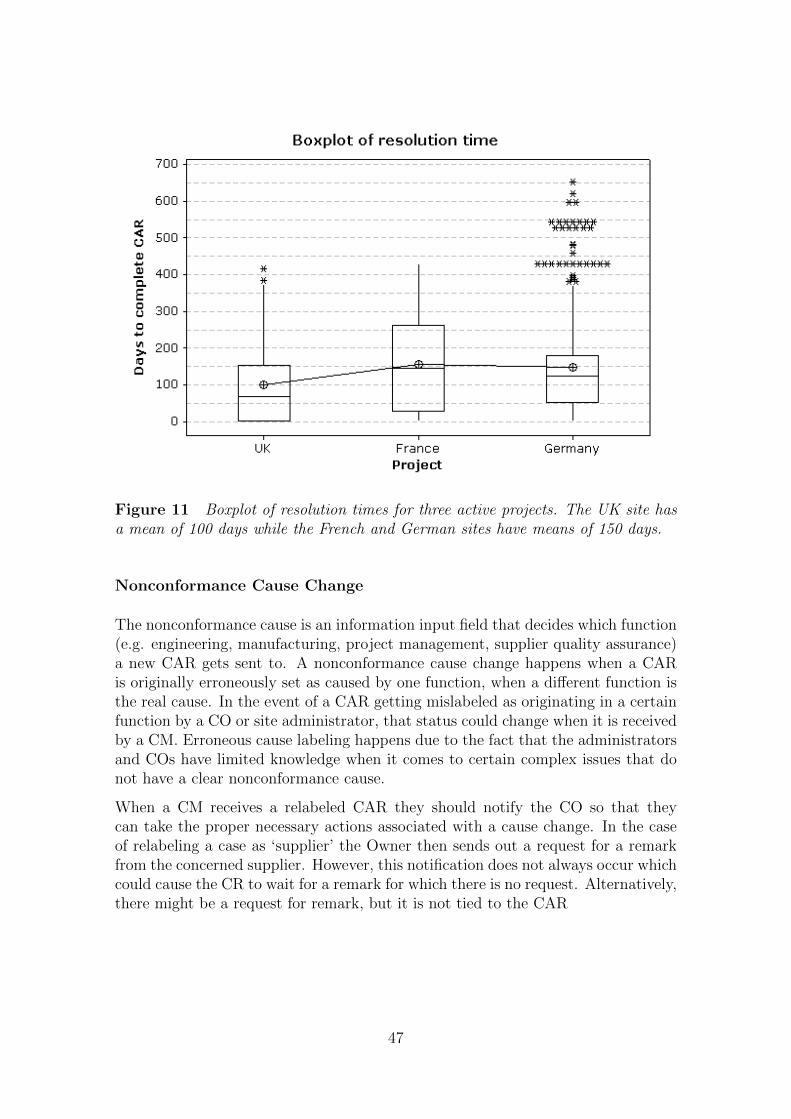
Figure 11 Boxplot of resolution times for three active projects. The UK site hasa mean of 100 days while the French and German sites have means of 150 days.
Nonconformance Cause Change
The nonconformance cause is an information input field that decides which function(e.g. engineering, manufacturing, project management, supplier quality assurance)a new CAR gets sent to. A nonconformance cause change happens when a CARis originally erroneously set as caused by one function, when a different function isthe real cause. In the event of a CAR getting mislabeled as originating in a certainfunction by a CO or site administrator, that status could change when it is receivedby a CM. Erroneous cause labeling happens due to the fact that the administratorsand COs have limited knowledge when it comes to certain complex issues that donot have a clear nonconformance cause.
When a CM receives a relabeled CAR they should notify the CO so that theycan take the proper necessary actions associated with a cause change. In the caseof relabeling a case as ‘supplier’ the Owner then sends out a request for a remarkfrom the concerned supplier. However, this notification does not always occur whichcould cause the CR to wait for a remark for which there is no request. Alternatively,there might be a request for remark, but it is not tied to the CAR
47
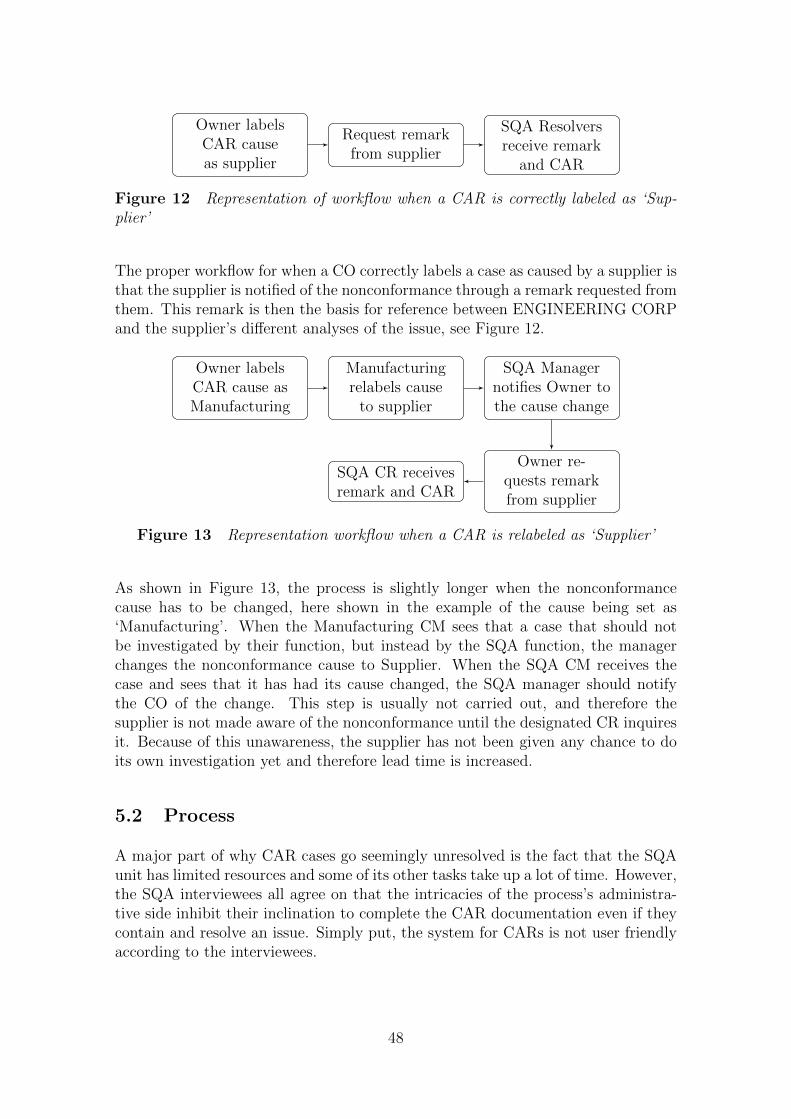
Owner labelsCAR causeas supplier
Request remarkfrom supplier
SQA Resolversreceive remark
and CAR
Figure 12 Representation of workflow when a CAR is correctly labeled as ‘Sup-plier’
The proper workflow for when a CO correctly labels a case as caused by a supplier isthat the supplier is notified of the nonconformance through a remark requested fromthem. This remark is then the basis for reference between ENGINEERING CORPand the supplier’s different analyses of the issue, see Figure 12.
Owner labelsCAR cause asManufacturing
Manufacturingrelabels cause
to supplier
SQA Managernotifies Owner tothe cause change
Owner re-quests remarkfrom supplier
SQA CR receivesremark and CAR
Figure 13 Representation workflow when a CAR is relabeled as ‘Supplier’
As shown in Figure 13, the process is slightly longer when the nonconformancecause has to be changed, here shown in the example of the cause being set as‘Manufacturing’. When the Manufacturing CM sees that a case that should notbe investigated by their function, but instead by the SQA function, the managerchanges the nonconformance cause to Supplier. When the SQA CM receives thecase and sees that it has had its cause changed, the SQA manager should notifythe CO of the change. This step is usually not carried out, and therefore thesupplier is not made aware of the nonconformance until the designated CR inquiresit. Because of this unawareness, the supplier has not been given any chance to doits own investigation yet and therefore lead time is increased.
5.2 Process
A major part of why CAR cases go seemingly unresolved is the fact that the SQAunit has limited resources and some of its other tasks take up a lot of time. However,the SQA interviewees all agree on that the intricacies of the process’s administra-tive side inhibit their inclination to complete the CAR documentation even if theycontain and resolve an issue. Simply put, the system for CARs is not user friendlyaccording to the interviewees.
48
User-friendliness of the Database
The database for CARs is used by the Resolvers only in conjunction with caseresolution, and as a user interface, it offers little flexibility and choice. The wayResolvers track and find the cases awaiting their attention is by opening the CARdatabase, sorting by CR, then clicking on their name which then lists all of thatperson’s active CARs. As mentioned, when a case belongs to a CR, it has ‘On-going’ as status. Consequently, this means that when a CR changes the statusto ‘Request more nonconformance information’ or ‘Request repair report’ the casedisappears from their view, making overview quite difficult (CR1; CR2).
To cope with the lack of visual representation and overview, CR1 uses a spreadsheetwith all the information from the cases in his view in the CAR database. He thensends this spreadsheet to different stakeholders where he has designated boxes forthe concerned supplier where they fill in actions taken or observations made bythem. This spreadsheet then allows the CR to keep track of status changes withoutcases exiting his view and in turn he reduces the level of administrative hindranceand the use of a database with limited functionality and for which he has limitedknowledge.
Repeated Faults
Some nonconformance problems resurface every once in a while, or a new problemgenerates numerous CARs, contributing to a longer list of problems when in realitythe problem is lone and the items affected is a plurality. This requires the CRto solve one problem, but manually close all of the open cases. An incident thatCR1 brought up was rust in a certain type of pipe, an issue that has been knownfor three years and has been resolved countless times. However, these cases aretreated and resolved individually using the same criteria as other, more severe,cases. This repetitive work is for obvious reasons not very stimulating for theCR, and therefore prefers to perform other duties instead once he knows that theappropriate compensation has been sent to the site that filed the nonconformancereport upon which the CAR is based (CR2).
CARs are created for each faulty component. If a component that is delivered tomany different sites turns out to have a systematic problem, and many differentparties file a claim, there will be one CAR per each of those claims. Since the reso-lution is the same for all of these CARs it would make sense to be able to just applythe same resolution to all of the concerned cases, but instead the system requiresindividual treatment for each case, which further complicates the administrativework required by the resolvers.
Categorization and Prioritization
All cases that come to the Resolvers’ attention have some kind of importance tomainly the customer. It could range from a halt in their operations to a need
49

to replace a part that failed in accordance with an accepted failure rate curve(PQA2).
Today, there is no difference indicated in the CAR database as to whether a caseaffects the . CR1 expressed a need for categorization of issues. Basically, when acase ends up in his pile of CARs to resolve there is no way to know beforehand howsevere the problem is, if it will require a lot of time, or if it is a frequently occurringissue. A specific idea that he would like to see implemented was the following, withthree different levels of workload required in order to resolve the issue.
• One-time fault
• Investigation requires maximum eight man-hours
• Full-scale investigation
These levels then had different reporting requirements. The first level, one-timefault, requires only a report that states if any action was necessary such as sendingnew parts, reimbursement, et cetera. The second level is for slightly more seriousissues that requires some more investigation with issue containment, root causeanalysis, and an implementation plan for the recommended course of action. Afull-scale investigation implies that the issue is large by comparison and needs alot of attention in order to be contained, find the root cause, and setup a plan todecrease the probability of recurrence.
The fact that there is no way to categorize CARs contributes to the unwillingness bythe SQA employees to work with them. One thing that CRs said was that frequentcases would come up as CARs needing to be resolved, when the impact of theseissues is small and the normal solution to the problem would commonly be to filea warranty claim and request replacement material or repair. Since these are quiteeasy solutions the CRs have mentioned that they see it as a waste of their time toupdate the CAR in the system, as the problem has already been attempted to beresolved numerous times, but the supplier has yet to implement any measures thatwould eliminate the root cause.
Inappropriate Culture
Inappropriate culture can undermine the effectiveness of a process. Corporate cul-ture is more powerful than directives and is ultimately what dictates employees’behavior when it comes to anything outside of designed routines. The data suggeststhat the corporate culture at ENGINEERING CORP allows for job responsibilitiesnot to be performed. One of the interviewees said that he does not work with CAR,even though it is part of his duties. This data suggests that the culture has someattributes which accepts this behavior. While it is possible that this fact is a prod-uct of priorities in a resource-scarce business function, the underlying issue of thatit takes place at all suggests that it is allowed by culture rather than directive.
Customers do not see their issues resolved on time. This is another thing thatrests on the culture environment where there is a lack of customer focus by the
50
individuals working with these issues. The process itself has a customer focus,but that focus is circumvented by the CRs as they choose not to comply with theprocess completely. Since the process has a customer focus, and the directive frommanagement is to comply with the process, it can be attributed to culture as ittakes place anyway.
The CAR process seems unimportant compared to the issue resolving. Combiningthe fact that the SQA CRs do not perform a set out duty with the disregardfor a response time suggests that they see the CAR process as unimportant andtherefore acceptable not to do. The CRs differentiate between resolving issues andperforming the CAR documentation of the issue, as explained by the interviewees.This complacency can be attributed to the corporate culture and contributes to thefeeling that customers do not require the information set out by the process design,and the process itself generates only extra work for the employees.
5.3 Output
As with most processes, CAR has its proponents and opponents. The people whoare reluctant to using CAR have ended up being unaware of many of the process’sfunctions and properties. One example that Resolvers keep addressing is the burdenof having to copy solutions to open CARs that have the same solution as somethingelse; this is something the COs have said they will do for the Resolvers.
Interviewees have expressed a general notion of the organization and its people beingquite ambitious, but the ambition to fully roll out all the solutions that are consis-tently being developed is lacking. In the CAR process, this is characterized by thefact that the process itself is developed without the presence of the Resolvers.
One of the main reasons for why the SQA employees do things that are not dictatedby the CAR process is because they do not see it as value adding to the customer.Cases that are still unresolved in to the CAR database, but in reality have beensolved, are a common occurrence. One CR said that he thinks his time is morevaluably spent performing other tasks (CR2). Due to the fact that the SQA functionhas many other more directly value-creating activities to perform, the fact that theCAR process mainly concerns information forwarding makes Resolvers prefer tomore tangible work tasks over formal reporting.
The interviewed CRs all agree that they have time issues which requires themto choose how to spend their time. “I cost a certain amount every hour, so Iprefer to do what I think adds the most value to both my employer and suppliers”(CR2). This quote summarizes quite well how the CRs see the value of their workwith CAR. There is a preference to solve problems and make sure that customershave products that perform according to requirements, whereas the CAR reportingprocess provides little value to the customer compared to the problem solving.When asked why CR2 does not fill out the CAR documents he responded that hegets more faults while spending time filling out CARs and that problems need hisattention more than documentation.
51
Problem solving and CAR reporting are two separate things (CR2). Whenever hehas resolved a fault, the formal report is an extra task that does not contribute tothe problem resolution and is therefore of lesser importance to both himself and thecustomer (CR2). Since he is good at resolving problems, on of his core competencesrequired for the job, drafting an additional report which also requires him to writein English is of low value.
The process customer is quite unclear to the CRs at SQA. Oftentimes when someonein the organization is dependent on a swift CAR resolution, they will communicatetheir need for one and are happy once the problem is resolved (CR1; CR2). Thismeans that since they do not request any CAR documentation, there is no imme-diate customer for that part of the process. As CR2 put it: “When the projectmanagers or PQA sees that a problem is resolved, they are most often happy. Butthe CAR is not filled out”. This notion carries with it the idea that the resolvedproblem is different from, and more valuable than, the CAR documentation.
5.4 Other Issues
The two main objectives of using a FRACAS process such as CAR are to improve theoverall quality in all operations and to collect and analyze data to identify possibleimprovement areas (Hallquist and Schick, 2004; Lee et al., 2010; Villacourt, 1992).As an effect of the CRs’ difference in procedures compared to those in the processdescription, CAR collects information that is not accurate. In order to attain thegoals of the FRACAS process, these concerns need addressing.
The non-use of the CAR database’s status change function, which the CRs prefernot to use in order to have cases stay on their own overview screen, inhibits theprocess improvement. Since the CAR process is a closed loop system and is relianton accurate information to function properly (Hallquist and Schick, 2004) accuracyis a key objective for the information input to the database. In the case madeby the CRs in this study, the non-use of status change functions in the databasemeans that the correct status is not mirrored by the status listed in the database,and durations for a case’s circulation among the statuses are inaccurate.
Customer requirements is a driver for action, but as mentioned in the case of CARthe customers are not aware of the contribution to their business CAR has. Sincecustomers are not involved in the process improvement, of which they are a majorstakeholder, managers (both the SQA CM and higher-up quality managers) showlittle interest in the process and instead focus their team’s efforts in different areaswhere they see a larger interest to perform well. In turn, this gives the SQA CRsless of an incentive to perform their duties in the CAR process. This creates acircle in which a mutual lack of understanding acts as a common denominator, asdepicted in Figure 14.
52
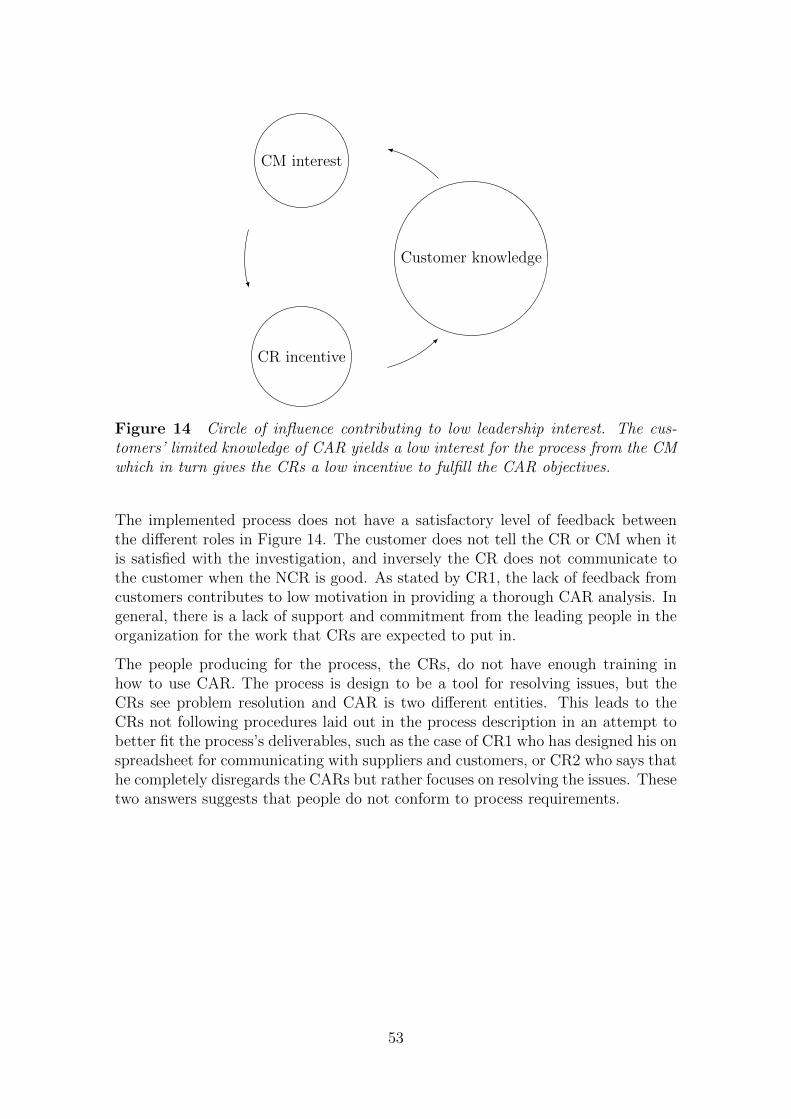
Customer knowledge
CM interest
CR incentive
Figure 14 Circle of influence contributing to low leadership interest. The cus-tomers’ limited knowledge of CAR yields a low interest for the process from the CMwhich in turn gives the CRs a low incentive to fulfill the CAR objectives.
The implemented process does not have a satisfactory level of feedback betweenthe different roles in Figure 14. The customer does not tell the CR or CM when itis satisfied with the investigation, and inversely the CR does not communicate tothe customer when the NCR is good. As stated by CR1, the lack of feedback fromcustomers contributes to low motivation in providing a thorough CAR analysis. Ingeneral, there is a lack of support and commitment from the leading people in theorganization for the work that CRs are expected to put in.
The people producing for the process, the CRs, do not have enough training inhow to use CAR. The process is design to be a tool for resolving issues, but theCRs see problem resolution and CAR is two different entities. This leads to theCRs not following procedures laid out in the process description in an attempt tobetter fit the process’s deliverables, such as the case of CR1 who has designed his onspreadsheet for communicating with suppliers and customers, or CR2 who says thathe completely disregards the CARs but rather focuses on resolving the issues. Thesetwo answers suggests that people do not conform to process requirements.
53
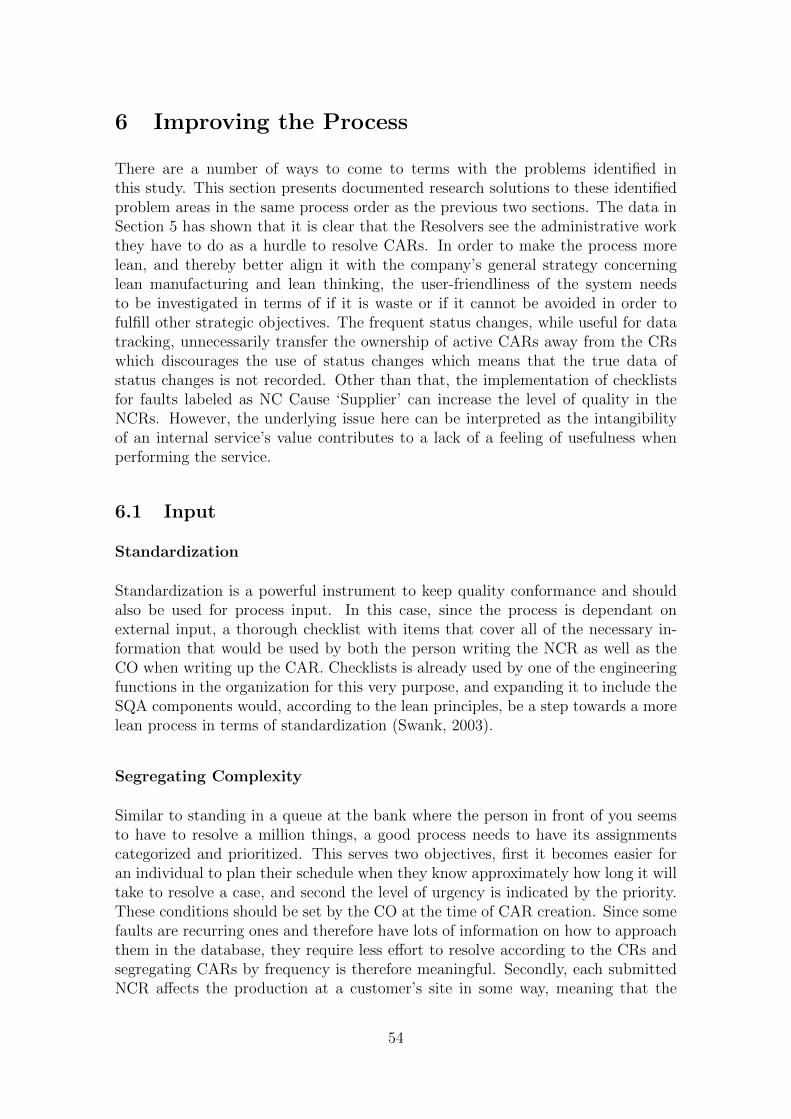
6 Improving the Process
There are a number of ways to come to terms with the problems identified inthis study. This section presents documented research solutions to these identifiedproblem areas in the same process order as the previous two sections. The data inSection 5 has shown that it is clear that the Resolvers see the administrative workthey have to do as a hurdle to resolve CARs. In order to make the process morelean, and thereby better align it with the company’s general strategy concerninglean manufacturing and lean thinking, the user-friendliness of the system needsto be investigated in terms of if it is waste or if it cannot be avoided in order tofulfill other strategic objectives. The frequent status changes, while useful for datatracking, unnecessarily transfer the ownership of active CARs away from the CRswhich discourages the use of status changes which means that the true data ofstatus changes is not recorded. Other than that, the implementation of checklistsfor faults labeled as NC Cause ‘Supplier’ can increase the level of quality in theNCRs. However, the underlying issue here can be interpreted as the intangibilityof an internal service’s value contributes to a lack of a feeling of usefulness whenperforming the service.
6.1 Input
Standardization
Standardization is a powerful instrument to keep quality conformance and shouldalso be used for process input. In this case, since the process is dependant onexternal input, a thorough checklist with items that cover all of the necessary in-formation that would be used by both the person writing the NCR as well as theCO when writing up the CAR. Checklists is already used by one of the engineeringfunctions in the organization for this very purpose, and expanding it to include theSQA components would, according to the lean principles, be a step towards a morelean process in terms of standardization (Swank, 2003).
Segregating Complexity
Similar to standing in a queue at the bank where the person in front of you seemsto have to resolve a million things, a good process needs to have its assignmentscategorized and prioritized. This serves two objectives, first it becomes easier foran individual to plan their schedule when they know approximately how long it willtake to resolve a case, and second the level of urgency is indicated by the priority.These conditions should be set by the CO at the time of CAR creation. Since somefaults are recurring ones and therefore have lots of information on how to approachthem in the database, they require less effort to resolve according to the CRs andsegregating CARs by frequency is therefore meaningful. Secondly, each submittedNCR affects the production at a customer’s site in some way, meaning that the
54
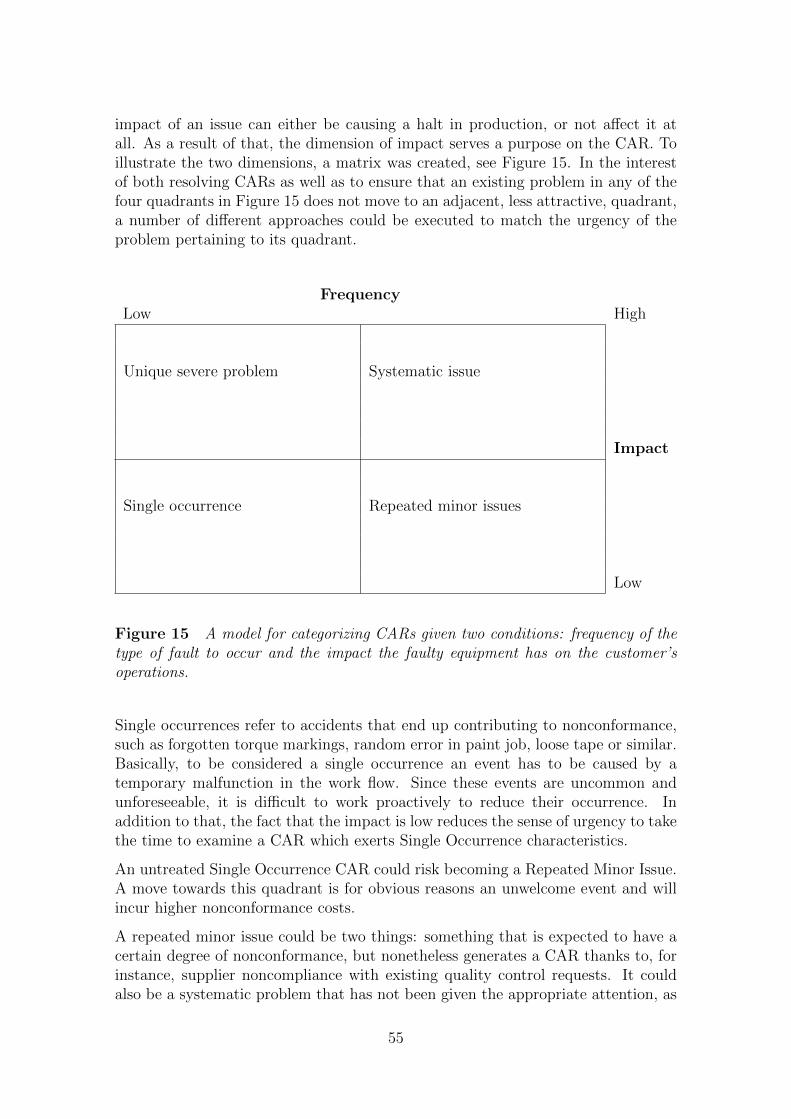
impact of an issue can either be causing a halt in production, or not affect it atall. As a result of that, the dimension of impact serves a purpose on the CAR. Toillustrate the two dimensions, a matrix was created, see Figure 15. In the interestof both resolving CARs as well as to ensure that an existing problem in any of thefour quadrants in Figure 15 does not move to an adjacent, less attractive, quadrant,a number of different approaches could be executed to match the urgency of theproblem pertaining to its quadrant.
FrequencyLow High
Unique severe problem Systematic issue
Impact
Single occurrence Repeated minor issues
Low
Figure 15 A model for categorizing CARs given two conditions: frequency of thetype of fault to occur and the impact the faulty equipment has on the customer’soperations.
Single occurrences refer to accidents that end up contributing to nonconformance,such as forgotten torque markings, random error in paint job, loose tape or similar.Basically, to be considered a single occurrence an event has to be caused by atemporary malfunction in the work flow. Since these events are uncommon andunforeseeable, it is difficult to work proactively to reduce their occurrence. Inaddition to that, the fact that the impact is low reduces the sense of urgency to takethe time to examine a CAR which exerts Single Occurrence characteristics.
An untreated Single Occurrence CAR could risk becoming a Repeated Minor Issue.A move towards this quadrant is for obvious reasons an unwelcome event and willincur higher nonconformance costs.
A repeated minor issue could be two things: something that is expected to have acertain degree of nonconformance, but nonetheless generates a CAR thanks to, forinstance, supplier noncompliance with existing quality control requests. It couldalso be a systematic problem that has not been given the appropriate attention, as
55

mentioned in the Single Occurrence section above.
A unique, severe, problem is something that there is no existing knowledge of howto solve and that requires immediate investigation. This type of issue requires across-functional task force that tirelessly works to resolve the costly issue.
A systematic issue is different from the unique, severe, problem in the way thatthere is knowledge of how to solve the issue thanks to the fact that the type of issuehas occurred before.
6.2 Process
Poor process implementation is one that all the interviewees mentioned items within,and some of the other issues previously presented in this section could belong underthis heading as well. These issues are looked upon and analyzed in terms of theircontribution to process implementation here. For one, on a basic level, the resultssuggest that a process designed to return a resolved case within 28 days but failsto do so is due to a poorly implemented process. Going beyond that, other itemsof poor process implementation are the complicated database interface, poor train-ing, no classification or prioritization, repeated issues that already have a solution,different sites having different procedures, and NC cause change procedure.
The complex and non-user friendly administrative system is evidently the largestobstacle for the CRs to fill out the database forms. The mentioned hindrancesare the difficulties associated with keeping a good overview for oneself. This limitsthe amount of personal responsibility and ownership associated with a CAR. Thedatabase is designed so that ownership is only maintained for parts of the time theCAR is active. The findings from this study suggest that this contributes to lowmotivation when it concerns carrying out the change of status from the CR’s ‘On-going’ to, for example, the CO’s ‘Pending material’ signifying shipping the faultyequipment to a repair site. This status change, which removes the CAR from theCR’s user interface in the database, contributes to the lack of feeling of ownershipand thereby the feeling that the process itself is a nuisance. The effect of going inand out of ownership in a CAR creates a disconnect between the CR, the issue, andthe CAR.
The CAR process does not facilitate a sufficient level of training for those involved inthe process. There are discrepancies between what the procedures are and what theSQA CRs know, which suggests that the training and communication of procedureupdates do not work as intended. This was exemplified by the findings where theCRs on the one hand were saying that the repeated cases require them to closethem all individually, when in actuality the laid out procedures say that the CRsshould resolve one of the repeated CARs and send the the resolution along withthe CAR reference numbers that have the same resolution to the responsible COfor administration. Similarly, the issue of nonconformance cause changes, wherethe COs stated that active cases that have been changed from one nonconformancecause to ‘Supplier’, suggests the training and communication are lacking as well as
56
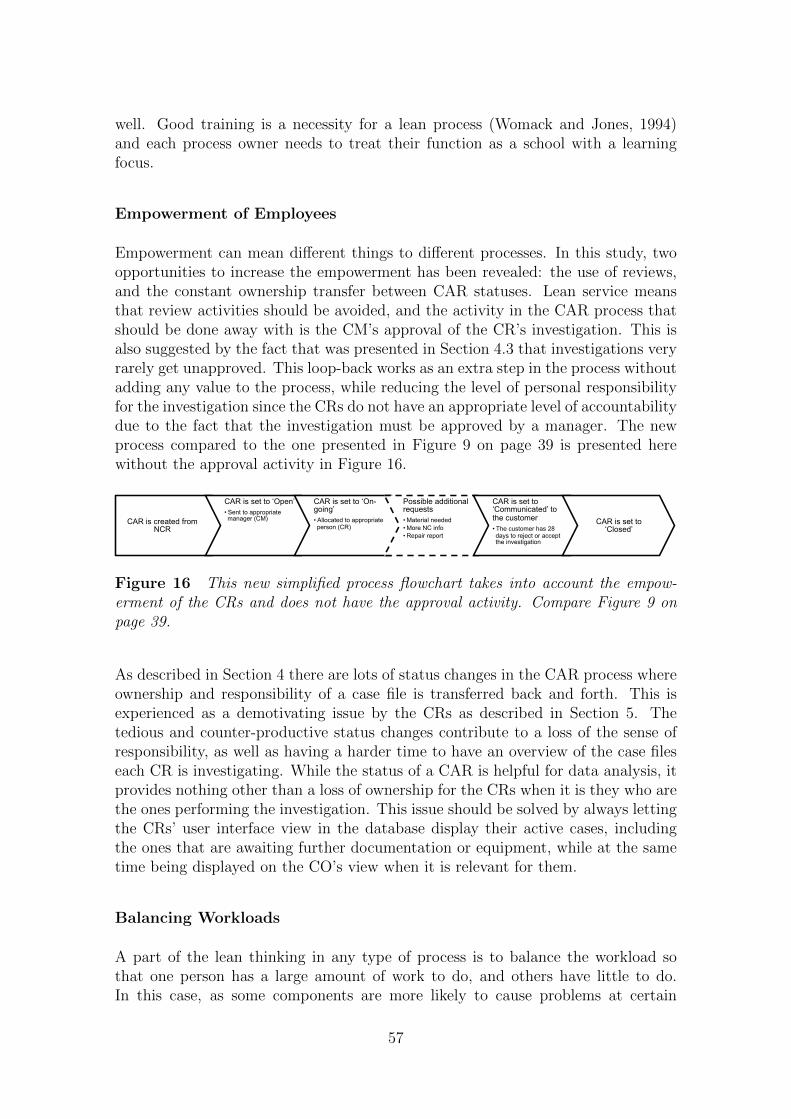
well. Good training is a necessity for a lean process (Womack and Jones, 1994)and each process owner needs to treat their function as a school with a learningfocus.
Empowerment of Employees
Empowerment can mean different things to different processes. In this study, twoopportunities to increase the empowerment has been revealed: the use of reviews,and the constant ownership transfer between CAR statuses. Lean service meansthat review activities should be avoided, and the activity in the CAR process thatshould be done away with is the CM’s approval of the CR’s investigation. This isalso suggested by the fact that was presented in Section 4.3 that investigations veryrarely get unapproved. This loop-back works as an extra step in the process withoutadding any value to the process, while reducing the level of personal responsibilityfor the investigation since the CRs do not have an appropriate level of accountabilitydue to the fact that the investigation must be approved by a manager. The newprocess compared to the one presented in Figure 9 on page 39 is presented herewithout the approval activity in Figure 16.
CAR is created from NCR
CAR is set to ‘Open’ • Sent to appropriate manager (CM)
CAR is set to ‘On-going’ • Allocated to appropriate person (CR)
Possible additional requests • Material needed • More NC info • Repair report
CAR is set to ‘Communicated’ to the customer • The customer has 28 days to reject or accept the investigation
CAR is set to ‘Closed’
Figure 16 This new simplified process flowchart takes into account the empow-erment of the CRs and does not have the approval activity. Compare Figure 9 onpage 39.
As described in Section 4 there are lots of status changes in the CAR process whereownership and responsibility of a case file is transferred back and forth. This isexperienced as a demotivating issue by the CRs as described in Section 5. Thetedious and counter-productive status changes contribute to a loss of the sense ofresponsibility, as well as having a harder time to have an overview of the case fileseach CR is investigating. While the status of a CAR is helpful for data analysis, itprovides nothing other than a loss of ownership for the CRs when it is they who arethe ones performing the investigation. This issue should be solved by always lettingthe CRs’ user interface view in the database display their active cases, includingthe ones that are awaiting further documentation or equipment, while at the sametime being displayed on the CO’s view when it is relevant for them.
Balancing Workloads
A part of the lean thinking in any type of process is to balance the workload sothat one person has a large amount of work to do, and others have little to do.In this case, as some components are more likely to cause problems at certain
57
time than others, a common pool of cases where anyone with the knowledge of theaffected component can resolve the case will alleviate some of the uneven workload.Especially useful for low impact cases, this approach also uses the fact that manyof the CRs have knowledge of components that are not their own, but may havebeen in the past. This would create a possibility for more work sharing whereappropriate.
Process Knowledge
Since process knowledge is linked to process performance (Slack and Lewis, 2011)it is useful to assess what the knowledge of a process’s activities and procedurestruly are. In the case of CAR there are obvious differences between what theprocedures are and what people do. The CAR process shows signs of being onthe fourth stage of Bohn’s (1994) process knowledge scale. That means that theprocess is well measured and controlled but needs to stabilize the interface andconditions between process activities and process products. An example of the lowlevel of process knowledge is given by the fact that the CRs are unaware of theprocess of having the COs handle CARs that have already been solved or are underinvestigation.
One of the main process knowledge issues is the fact that the CRs see CAR asdifferent from problem resolution when the intention is that they are meant to bethe same thing, CAR should be the tool to use for resolving problems. The feelingof disparity between the problem resolution and CAR is a contributor to the lowlevel of use of the process, and needs to be countered in order to fit the purpose ofthe process.
Improvements that go unknown by the process’s practitioners are no improvements.Increasing the process knowledge for the CRs is important to achieve any improve-ments to the process. Ideally, an improvement program of CI workshops where allthe SQA CRs can increase the process knowledge (Johnston, 2008) and knowledgeof other people’s roles in the process, as well as function as a forum for improvementsuggestions. Going back to the process knowledge scale, the data suggests that themean value of the CAR resolution time can be controlled but the CRs do not havethe knowledge of exactly how their work affects the development of the process.Essentially, the process knowledge should be shared to a larger extent with the CRsto reduce the gap in process knowledge between the COs and other managers inthe organization working with developing and reviewing the process.
6.3 Output
Customer Focus
The customer focus is misaligned with the customers’ own wishes. Even thoughthe process itself has a customer focus in terms of giving them accurate and concise
58
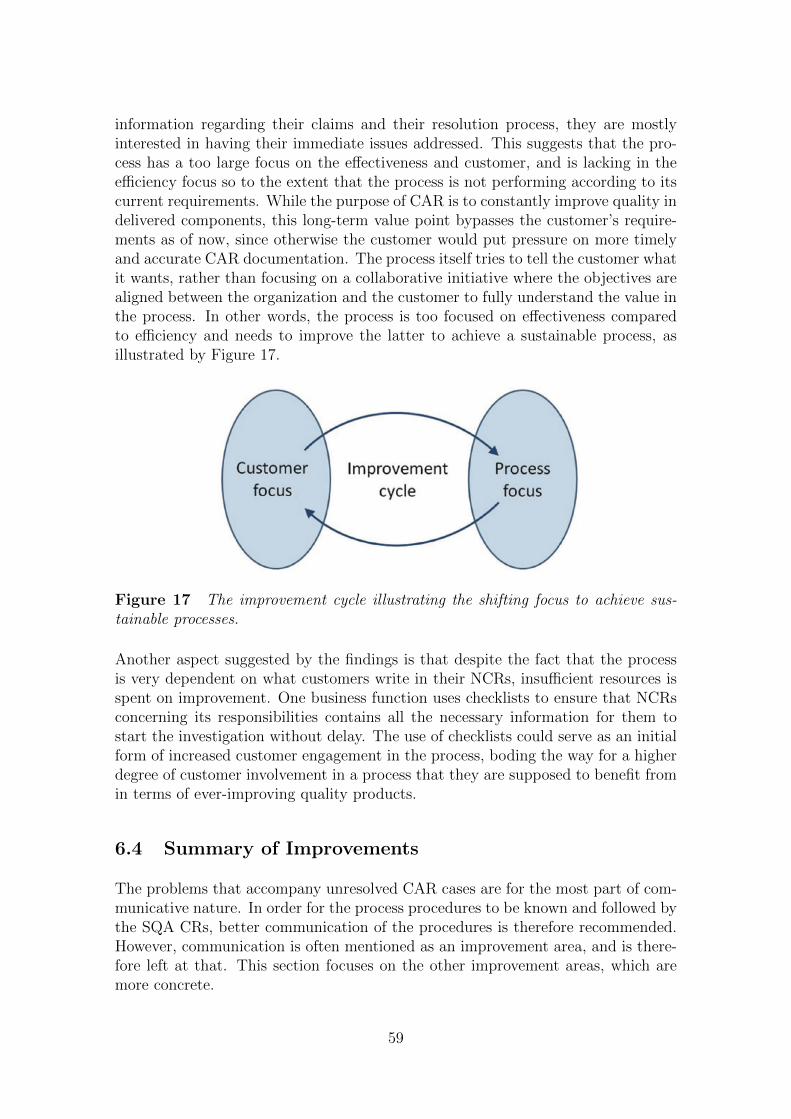
information regarding their claims and their resolution process, they are mostlyinterested in having their immediate issues addressed. This suggests that the pro-cess has a too large focus on the effectiveness and customer, and is lacking in theefficiency focus so to the extent that the process is not performing according to itscurrent requirements. While the purpose of CAR is to constantly improve quality indelivered components, this long-term value point bypasses the customer’s require-ments as of now, since otherwise the customer would put pressure on more timelyand accurate CAR documentation. The process itself tries to tell the customer whatit wants, rather than focusing on a collaborative initiative where the objectives arealigned between the organization and the customer to fully understand the value inthe process. In other words, the process is too focused on effectiveness comparedto efficiency and needs to improve the latter to achieve a sustainable process, asillustrated by Figure 17.
Figure 17 The improvement cycle illustrating the shifting focus to achieve sus-tainable processes.
Another aspect suggested by the findings is that despite the fact that the processis very dependent on what customers write in their NCRs, insufficient resources isspent on improvement. One business function uses checklists to ensure that NCRsconcerning its responsibilities contains all the necessary information for them tostart the investigation without delay. The use of checklists could serve as an initialform of increased customer engagement in the process, boding the way for a higherdegree of customer involvement in a process that they are supposed to benefit fromin terms of ever-improving quality products.
6.4 Summary of Improvements
The problems that accompany unresolved CAR cases are for the most part of com-municative nature. In order for the process procedures to be known and followed bythe SQA CRs, better communication of the procedures is therefore recommended.However, communication is often mentioned as an improvement area, and is there-fore left at that. This section focuses on the other improvement areas, which aremore concrete.
59

Since time management is very important for a resource-strained function like SQA,segregating complexity through classification and prioritization is important. Thiswould create the ability for CRs to not waste any time assessing if they have enoughtime to work on a certain case.
Problem Improvement suggestionLow NCR quality Standardization of NCRs according to checklists
Knowing which CAR tosolve, and when
Segregate complexity so that it is known if a prob-lem is unique and/or important to solve quickly
Unnecessary approvals Empowerment of employees to match the levelof personal responsibility for the SQA employees andto bridge the commitment to the customer with thecommitment to the process, as well as improving thedatabase to always show their active cases
Uneven distribution ofCARs
Balancing workloads and encourage more worksharing by, for instance, having a common pool ofCARs that anyone can work on
Employees do not followprocess guidelines
Inappropriate culture. Make sure that employeesfollow the process descriptions so as to not circumventthe objectives of the process
CRs know less than nec-essary about the process
Process knowledge. Include the employees directlyin the development of the process
Insufficient process focus The customer focus has taken too much room sothat the process has become inefficient as a result
Table 10 Summary of improvement suggestions.
Reaching higher process knowledge can also benefit from being applied outside theorganization. As can be seen here in Table 10, Low NCR quality does lies outsidethe organization to some degree, and is therefore a different challenge comparedto the internal issues. However, through increased process knowledge both insideand outside the organization, more supplier interest could be achieved which thenprovides a better chance to have suppliers engage more in the activity as they learnhow they benefit from it.
60
7 Discussion
This study has investigated the causes of poor process performance in a FRACASprocess in a global engineering corporation using principles from lean service, toprovide an initial foundation for lean FRACAS. The FRACAS process uses infor-mation about faults to implement corrective actions and to increase quality perfor-mance in a continuous cycle. This was done by studying the design and people’sperceptions of the CAR process in a large engineering corporation, an example ofFRACAS. This thesis accomplishes two things: first it suggests that FRACAS canbe classified as an internal service process and secondly, based on that, provides aninitial foundation for lean FRACAS in terms of how it could be designed and char-acteristics of the involved activities. While there is research on what lean internalservice is, FRACAS is a specific case and there are no cookie-cutter approaches tomake any internal service lean (Maleyeff, 2006) since such services can be entirelycontext driven (Suarez-Barraza et al., 2012) and therefore very different from oneanother. This Discussion presents how the study has contributed to knowledge interms of how it differs from previous research on FRACAS, and what the findingsmean for the concept of lean FRACAS. It also mentions criticism to the concept oflean service, and suggests further research and the limitations in the study.
Since the concept of FRACAS is theoretical and few companies successfully reap allthe benefits of it (Hallquist and Schick, 2004), most research on the topic is focusedon how to implement a process based on this concept (Lee et al., 2010). The resultsfrom this study show how FRACAS has been implemented in one organization, andthat the difficulties found are in line with previous research. This study differs fromthe other works on FRACAS in terms of using lean as an improvement tool, which,as mentioned before, enables a foundation for the concept of lean FRACAS.
The findings show that there are a number of factors that affect the process per-formance negatively. The main item of concern is the notion of disparity betweenfault and CAR, which was expressed by the CRs. This suggests that the long leadtimes can be explained to some extent by the fact that CAR is seen as secondaryto the investigation as opposed to seeing the investigation being a part of CAR.This idea of separation is solidified in a number of ways, such as CRs not followingprocedure regarding CAR status and ownership changes and the database’s lack ofuser-friendliness. In other words, these findings suggest that this FRACAS process,in its current state, is not compatible with the contingencies in the SQA function.Either because the process does not well accommodate those contingencies, or be-cause the knowledge level is lower than necessary in order to see the value in theprocess. As such, the case presented ample opportunity to use lean service processimprovement aimed at this internal service. In accordance with Maleyeff’s (2006)internal service structures, the FRACAS process in this study displays the com-mon structures for internal services, such as information as the main deliverable,cross-functionality, and hidden costs and benefits. This proves that FRACAS isan internal service by these measures. The difference in the case of CAR is theconnection with external parties, and therefore a thorough value stream assessmentis harder to achieve. In light of that, the improvements suggested in this study are
61
based on internal activities only, which restricts the effectiveness of the improve-ments. However, the investigated situation shows much room for local improvementto the activities that take place internally. These improvements are the basis forlean service, and are in line with existing practice (Swank, 2003). In addition, theFRACAS process in this case exhibits a clear case for how the customer focus canoverreach the wishes of the customer and that focus diminishes the focus on the pro-cess’s efficiency (Radnor and Johnston, 2012) by the fact the customers only wanttheir problems resolved and not excessive documentation. The customers’ positionon the FRACAS process and documentation is known by the CRs and thereforethey justify not performing the process as customer orientation.
There is little personal responsibility in terms of the FRACAS process, which makesincreasing employee empowerment a major concern for lean FRACAS. The constantstream of ownership transfer connected to the status changes in the process furtherestablishes the perception of CAR being separate from problem resolving activities.The implication of this is that when the problem is resolved and the customer ishappy, the CAR process poses as an extra work activity that offers no tangible valueto a customer, as opposed to taking on a new case and resolving that. Basically,on the one hand the CRs are in contact with suppliers and customers to resolvea problem, and on the other hand the case is taken away from them if they needmore information. Moreover, the obtrusive non-user-friendly database presents it-self as a tedious extra step of writing up a report that is more conclusive thanwhat is deemed necessary for the some cases. Basically, the process requires theCRs to follow procedures that reduce their level of personal responsibility, whichlowers the employee empowerment. For example, simple cases where the root causeis self-evident and an implementation plan is straightforward can make the CARdocumentation demotivating to fill out. In addition, the low process knowledge canbe attributed to the empowerment (Suarez-Barraza et al., 2012), since low respon-sibility sparks a low interest in participating in the process’s development. In fact,the results suggest that the perception of intangibility of an internal service’s value(Maleyeff, 2006) contributes to a lack of a feeling of usefulness when carrying outthe service.
The issues in the CAR process of organizational complexity, lack of prioritized goals,and ineffective and inefficient data tracking are consistent with research on FRA-CAS (Hallquist and Schick, 2004). Organizational complexity grows as the processitself expands to involve more people and information does not get communicatedeffectively to all the stakeholders of the process. This was shown by the fact thatCRs were unaware of some of the procedures in the process, such as how to dealwith repeated cases. The lack of prioritized goals were evident due to the CRs’opinion of problem resolving being one thing and CAR another. The SQA functionprioritizes keeping their external customers and suppliers happy, while the internalcustomers could not fully rely on the database that serves the purpose of trackingCARs. Lastly, ineffective and inefficient data tracking was a strongly worded andfrequently mentioned concern, and not changing the status of the CAR means thatinaccurate data is recorded. Furthermore the CAR process gets its data from differ-ent sources depending on site specific procedures for who records the failure data,
62
contributing to a non-ideal FRACAS process.
While there are opponents to the concept of lean service, the fact that there is noone definition of should also be considered. Seddon et al. (2011) argue that thepurpose of services are meant to absorb the variability that production creates, andlean sets out to remove the variability in services which in turn risks making bothprocesses too rigid and prone to large disturbances. But, considering the degree towhich lean service has been used here, perhaps the true value of lean service existsnot in viewing service as production. Instead the value lies in doing more, better,which ultimately is the vision for any organization. In this context, lean servicemeans to use the resources available in a suitable manner and give the resourcesthe tools they require.
7.1 Limitations and Further Research
This study comes with two main limitations. First, the internal-only perspectivelimits the whole overview of the process from how customers view and use theirreporting to enhance their gains based on their reports and cooperation. The sameis true for suppliers. Consequently, any changes made to the process involves thecustomers to some degree and the impact of that has not been addressed in thisstudy. Furthermore, the contextual contingencies on which these results are basedmakes it difficult to say that they are valid in general, however that is to be expectedfrom internal services. In order to set up general guidelines for lean FRACAS morecase studies are needed to find crossover points to make generalizations for theconcept.
Second, the results in this study are based on a very small number of people, in asmall functional unit of a large corporation. In order to validate the results further,a larger investigation is needed.
Additional studies to be carried out the continue this study is to set about an im-plementation of the changes proposed in this study, and measure their effectivenessto further contribute to the area of lean FRACAS. Another area to research is theresource variable in terms of lean internal service. This study does not considerresources as something that can be changed, however solely focusing on the impactof lean internal service or FRACAS on time or people requirements could shed morelight on the usefulness of lean service.
63
8 Conclusion
This thesis has investigated the performance problems in an application of FRACASin a large engineering corporation and shown how lean service and internal serviceprocess theory can be used to identify areas for improvement in a FRACAS process.Striving to fill a gap in lean FRACAS as a concept, the study has drawn on existingresearch on internal service and the FRACAS concept as a whole to find areas forimprovement according to lean service.
Through interviews with the employees at the case company on four different levelsof responsibility – administrators (CO), a manager (CM), specialists (CR), as wellas a business strategist (BD) – it was found that there were a number of differentfactors that lead the employees to avoid using the FRACAS database in the extentit was designed for. Basically, the system created a number of barriers to usabilityas employees found it difficult to track their own cases in a satisfactory manner.On top of that, there was no indication of what cases were more important thanothers, which caused the employees to treat pressing issues the same as non-criticalcases. There is compelling evidence that the studied process with a target of re-solving issues within 28 days is not well suited for a function that have externalparties on both ends. However, looking at the process as it is shows that the em-ployees were separating between FRACAS and problem resolving, the former beinga process they are not responsible to the customer in and the latter where they are.While sufficient knowledge of a process is required for totally empowered employ-ees, the findings here suggest that combining FRACAS with lean lessons such asempowerment of employees, segregation of complexity, balance of workloads, andstandardized input would pave the way towards lean FRACAS.
64
References
Angelis, J. and Fernandes, B. (2012), ‘Innovative lean: work practices and productand process improvements’, International Journal of Lean Six Sigma 3(1), 74–84.
Barratt, M., Choi, T. Y. and Li, M. (2011), ‘Qualitative case studies in opera-tions management: Trends, research outcomes, and future research implications’,Journal of Operations Management 29(4), 329–342.
Batt, P. J. (2012), ‘Measures and measurement: Process and practise’, IndustrialMarketing Management 41(3), 379–384.
Bohn, R. (1994), ‘Measuring and managing technological knowledge’, Sloan Man-agement Review Fall.
Bonaccorsi, A., Carmignani, G. and Zammori, F. (2011), ‘Service Value StreamManagement (SVSM): Developing Lean Thinking in the Service Industry’, Jour-nal of Service Science and Management 4, 428–439.
Burton, T. T. and Boeder, S. M. (2003), Lean Extended Enterprise: Moving Beyondthe Four Walls to Value Stream Excellence, J. Ross Publishing, Boca Raton.
Ciemian, M. (2008), Increasing the effectiveness of FRACAS, in ‘Reliability andMaintainability Symposium (RAMS)’.
Collins, J. and Hussey, R. (2009), Business Research, 3rd edn, Palgrave Macmillan,Basingstoke, Hampshire, UK.
Cota, E. V. and Gullo, L. (2013), FRACAS Improves Production Bottom Line, in‘Reliability and Maintainability Symposium (RAMS)’, Orlando, FL, pp. 1–5.
Cottyn, J., Van Landeghem, H., Stockman, K. and Derammelaere, S. (2011), ‘Amethod to align a manufacturing execution system with Lean objectives’, Inter-national Journal of Production Research 49(14), 4397–4413.
Emiliani, M. (1998), ‘Lean behaviors’, Management Decision 36(9), 615–631.
Forker, L. (1997), ‘Factors affecting supplier quality performance’, Journal of Op-erations Management 15, 243–269.
Frei, F., Kalakota, R., Leone, A. J. and Marx, L. M. (1999), ‘Process Variation asa Determinant of Bank Performance: Evidence from the Retail Banking Study’,Management Science 45(9), 1210–1220.
Fullerton, R. R., Kennedy, F. a. and Widener, S. K. (2013), ‘Management account-ing and control practices in a lean manufacturing environment’, Accounting, Or-ganizations and Society 38(1), 50–71.
Gardner, R. A. (2004), The Process-Focused Organization, Quality Press, Milwau-kee.
Gawande, A. (2010), The checklist manifesto: how to get things right, Profile Books,London.
65
Gustafsson, A., Nilsson, L. and Johnson, M. D. (2003), ‘The role of quality practicesin service organizations’, International Journal of Service Industry Management14(2), 232–244.
Hallquist, E. and Schick, T. (2004), Best Practices for a FRACAS Implementation,in ‘Reliability and Maintainability Symposium (RAMS)’, pp. 663–667.
Hines, P., Holweg, M. and Rich, N. (2004), ‘Learning to evolve: A review of contem-porary lean thinking’, International Journal of Operations & Production Manage-ment 24(10), 994–1011.
Hines, P. and Rich, N. (1997), ‘The seven value stream mapping tools’, InternationalJournal of Operations & Production Management 17(1), 46–64.
Huq, Z. (2005), ‘Managing change: a barrier to TQM implementation in serviceindustries’, Managing Service Quality 15(5), 452–469.
Johnston, R. (2008), ‘Internal service barriers, flows and assessment’, InternationalJournal of Service Industry Management 19(2), 210–231.
Kempster, S. and Cope, J. (2010), ‘Learning to lead in the entrepreneurial context’,International Journal of Entrepreneurial Behaviour & Research 16(1), 5–34.
Lee, J. H., Chan, S. I. and Jang, J. S. (2010), ‘Process-Oriented Development ofFailure Reporting, Analysis, and Corrective Action System’, International Jour-nal of Quality, Statistics, and Reliability 2010, 1–8.
Maleyeff, J. (2006), ‘Exploration of internal service systems using lean principles’,Management Decision 44(5), 674–689.
Piercy, N. and Rich, N. (2009), ‘Lean transformation in the pure service environ-ment: the case of the call service centre’, International Journal of Operations &Production Management 29(1), 54–76.
Radnor, Z. and Johnston, R. (2012), ‘Lean in UK Government: internal efficiencyor customer service?’, Production Planning & Control: The Management of Op-erations pp. 1–13.
Reijers, H. (2006), ‘Implementing BPM systems: the role of process orientation’,Business Process Management Journal 12(4), 389–409.
Schweitzer, E. and Aurich, J. (2010), ‘Continuous improvement of industrialproduct-service systems’, CIRP Journal of Manufacturing Science and Technol-ogy 3(2), 158–164.
Seddon, J., Donovan, B. O. and Zokaei, K. (2011), Rethinking lean service, inM. Macintyre, G. Parry and J. Angelis, eds, ‘Service Design and Delivery’,Springer, New York.
Shah, R. and Ward, P. T. (2003), ‘Lean manufacturing: context, practice bundles,and performance’, Journal of Operations Management 21, 129–149.
66
Slack, N. and Lewis, M. (2011), Operations Strategy, 3 edn, Pearson Education,Essex.
Sorqvist, L. (2004), Standiga forbattringar (Continuous Improvements) [inSwedish], 1:4 edn, Studentlitteratur.
Sousa, R. (2003), ‘Linking quality management to manufacturing strategy: an em-pirical investigation of customer focus practices’, Journal of Operations Manage-ment 21(1), 1–18.
Sousa, R. and Voss, C. (2008), ‘Contingency research in operations managementpractices’, Journal of Operations Management 26(6), 697–713.
Suarez-Barraza, M., Smith, T. and Dahlgaard-Park, S. M. (2012), ‘Lean Service: Aliterature analysis and classification’, Total Quality Management 23(4), 359–380.
Swank, C. (2003), ‘The lean service machine’, Harvard business review .
U.S. Dept of Defense (1998), ‘ELECTRONIC RELIABILITY DESIGN HAND-BOOK’.
Villacourt, M. (1992), Failure Reporting, Analysis And Corrective Action System InThe US Semiconductor Manufacturing Equipment Industry: A Continuous Im-provement Process, in ‘Electronics Manufacturing Technology Symposium, Thir-teenth IEEE/CHMT International’, pp. 111–115.
Villacourt, M. and Govil, P. (1993), Failure Reporting, Analysis and CorrectiveAction System, Sematech, Austin.ΩSkrinjar et al.
Skrinjar, R., Bosilj-Vuksic, V. and Indihar-Stemberger, M. (2008), ‘The impact ofbusiness process orientation on financial and non-financial performance’, BusinessProcess Management Journal 14(5), 738–754.
Wei, J. (2009), Theories and Principles of Designing Lean Service Process, in ‘6thInternational Conference on Service Systems and Service Management’, pp. 821–826.
Womack, J. P. and Jones, D. T. (1994), ‘From Lean Production to the Lean Enter-prise’, Harvard business review 72(2), 93–104.
Womack, J. P. and Jones, D. T. (1996), Lean Thinking, Simon and Schuster, NewYork.
Womack, J. P., Jones, D. T. and Roos, D. (1990), The Machine That Changed theWorld, Harper-Collins, New York.
Yin, R. (2009), Case Study Research: Design and Methods, 4th edn, Sage, ThousandOaks.
Zangwill, W. I. and Kantor, P. B. (1998), ‘Toward a Theory of Continuous Improve-ment and the Learning Curve’, Management Science 44(7), 910–920.
67

www.kth.se
Powered by TCPDF (www.tcpdf.org)