Embed Size (px)
Citation preview

Applied Thematic Research into Water Management, the Opium
Economy and Livestock:
Findings from the First Year of Farm and Household Monitoring
April 2009
Alan Roe
Afghanistan Research and Evaluation Unit
Case Study Series
Funding for this research was provided by the European Commission.

© 2009 Afghanistan Research and Evaluation Unit. All rights reserved. No part of this publication may be reproduced, stored in a retrieval system or transmitted in any form or by any means, electronic, recording or otherwise without prior written permission of the publisher, the Afghanistan Research and Evaluation Unit. Permission can be obtained by emailing [email protected] or by calling (+93)(0)799 608 548.
Editor: Katie Gustafson for AREU
Layout: Qasim Rasouli for AREU

About the Author
Alan Roe holds Research Adjunct with the School for Environmental Research at Charles Darwin University in Australia. He earned his PHD from Durham University and has since amassed 15 years of experience in applied agricultural and environmental research. He has worked extensively in the Arab world, but has also focused on Northern Australia and Afghanistan, where he served as Senior Research Manager for AREU’s Natural Resources Management team from 2005 until 2008.
About the Afghanistan Research and Evaluation Unit
The Afghanistan Research and Evaluation Unit (AREU) is an independent research organisation based in Kabul. AREU’s mission is to conduct high-quality research that informs and influences policy and practice. AREU also actively promotes a culture of research and learning by strengthening analytical capacity in Afghanistan and facilitating reflection and debate. Fundamental to AREU’s vision is that its work should improve Afghan lives.
AREU was established in 2002 by the assistance community working in Afghanistan. Its board of directors includes representatives from donors, the UN and other multilateral agencies, and NGOs. AREU has recently received funding from: the European Commission; the governments of Denmark (DANIDA), the United Kingdom (DFID), Switzerland (SDC), Norway and Sweden (SIDA); the United Nations High Commissioner for Refugees (UNHCR); the Government of Afghanistan’s Ministry of Agriculture, Irrigation and Livestock; the World Bank; UNICEF; the Aga Khan Foundation; and the United Nations Development Fund for Women (UNIFEM).

Afghanistan Research and Evaluation Unit
4
Acknowledgements
Thanks go to the research partners, German Agro-Action, the Danish Committee for Aid to Afghan Refugees, and the Water, Opium and Livestock research team at AREU, with Sharna Nolan as Senior Research Officer. Funding for the “Applied Thematic Research into Water Management, Livestock and the Opium Economy” was gratefully received from the European Commission. The research would not have been possible without the tolerance and understanding shown by the various Afghan communities where research was undertaken.
Alan Roe April 2009

Water, Opium and Livestock: Findings from the First Year of Farm and Household Monitoring
Table of Contents
Acronyms ............................................................................................ ii
Glossary ............................................................................................ iii
Executive Summary ................................................................................ v
1. Introduction ................................................................................... 1
2. The Monitoring System ...................................................................... 2
2.1 Why monitoring of farm systems? .................................................. 2
2.2 Research methods and tools ........................................................ 3
2.3 Data collection ........................................................................ 5
2.4 Archiving and managing data ....................................................... 7
2.5 Background to the agricultural year 2006 ........................................ 8
3. Land Tenure .................................................................................. 10
3.1 Conditions and terms of land tenure ............................................ 10
3.2 Discussion ............................................................................. 15
4. Water and Irrigation ........................................................................ 16
4.1 Access to water at WOL research sites ........................................... 16
4.2 Irrigation problems ................................................................. 21
4.3 Irrigation system maintenance .................................................... 23
4.4 Discussion ............................................................................. 24
5. Cropping and Cultivation ................................................................... 26
5.1 Cropping and cultivation ........................................................... 26
5.2 Fallowing land ........................................................................ 26
5.3 Crop inputs ........................................................................... 27
5.4 Crop yields ............................................................................ 31
5.5 Gross margins for crop production ................................................ 33
5.6 Seasonality in crop cash flows .................................................... 34
5.7 Discussion ............................................................................ 35
6. Livestock Production Systems .............................................................. 37
6.1 Herd and flock structures .......................................................... 37
6.2 Management inputs .................................................................. 41
6.3 Livestock production outputs ..................................................... 45
6.4 Livestock gross margins ............................................................ 47
6.5 Discussion ............................................................................ 48
7. Labour and Farming Livelihoods ........................................................... 50
7.1 Labour on farm ...................................................................... 50
7.2 Off-farm sources of income ........................................................ 53
7.3 Household food production, consumption and nutrition ...................... 55
7.4 A farm budget model ............................................................... 57 7.5 Targeting development interventions: Farm systems and household
food security ......................................................................... 59

Water, Opium and Livestock: Findings from the First Year of Farm and Household Monitoring
7.6 Discussion ............................................................................. 61
8. Summary of Main Findings .................................................................. 64
Annex 1: Cropping at research sites 2006 ..................................................... 66
Annex 2: Gross margins per hectare for production from important crops .............. 70
Annex 3: Change in small ruminant inventories during 2006 ............................... 74
Annex 4 : Mean daily feed rations per animal in sedentary herds (kg) ................... 74
Annex 5: Gross margin for livestock production adjusted for reported milk consumption ($USD) ................................................................. 75
Annex 6: Reported utilisation of external labour days on farm ........................... 75
Annex 7: Weekly acquisition and per capita consumption of key food types ...........77
Annex 8: Projected annual cash flow for the model farming household ($USD) ........77
Annex 9: Results of the regression analysis for farming household nutrition ............78
Bibliography ....................................................................................... 79
Recent Publications from AREU ................................................................. 81

Water, Opium and Livestock: Findings from the First Year of Farm and Household Monitoring
iii
Acronyms
AGCHO Afghanistan Geodesy and Cartography Head Office
AL Alternative Livelihoods (a pillar of the National Drugs Control Strategy)
ANDS Afghanistan National Development Strategy
ARD Agriculture and Rural Development
AREU Afghanistan Research and Evaluation Unit
CDC Community Development Council
EC European Commission
FAO Food and Agriculture Organisation of the United Nations
GAA German Agro-Action
GoA Government of Afghanistan
GPS Global Positioning System
I-ANDS Interim Afghanistan National Development Strategy
IWRM Integrated Water Resources Management
MAAH Ministry of Agriculture and Animal Husbandry
MAIL Ministry of Agriculture, Irrigation and Water
MCN Ministry of Counter Narcotics
MEW Ministry of Energy and Water
MRRD Ministry of Rural Rehabilitation and Development
NDF National Development Framework
NGO non-governmental organisation
NRVA National Risk and Vulnerability Assessment
PAL Project for Alternative Livelihoods
RBA River Basin Agency
SCWAM Supreme Council for Water Affairs and Management
UN United Nations
UNODC United Nations Office for Drugs and Crime

Afghanistan Research and Evaluation Unit
iv
USAID United States Agency for International Development
WOL Applied Thematic Research into Water Management, Livestock and the Opium Economy
WUA water users association
Glossary
Amlak lands department, MAIL
arbab village or community leader
band dam or diversion structure
buluk group of adjacent canals with water sharing agreements
firman royal decree
halal permissible under Islamic law (e.g. meat from livestock slaughtered according to Islamic practice)
hasher ab water sharing agreement
hashar community agreement (e.g. regarding labour for canal repair)
hawz traditional irrigation accumulation pool
juftgaw unit of irrigated land determined by the area a pair of oxen can plough daily
karez underground aqueduct dug into hillside to tap groundwater and channel it out onto the surface for utilisation
Khel A Pashtun tribal division
kok bashi water master of a secondary canal
Makhzans provincial court archives
mirab water master
shab-o-roz literally “day and night”, the traditional system of irrigation
shura traditional council of elders
urf customary law
wakil senior water master

Water, Opium and Livestock: Findings from the First Year of Farm and Household Monitoring
v
Executive Summary
This report provides a summary overview of the results from the first year of farm and household monitoring undertaken under the auspices of the EC funded project “Applied Thematic Research into Water Management, Livestock and the Opium Economy” (referred to hereafter as the WOL project). The overall objective of this project is to enhance the sustainability of Afghan rural livelihoods, by providing policymakers with recommendations for improving the effectiveness of agricultural policy and rural planning.
Farm and household monitoring was adopted as one of several complementary research tools utilised by the project team and so is not expected to be a stand-alone research action. Nevertheless, since the empirical evidence produced by farming monitoring has important policy relevance, some key findings are summarised in this report.
Building upon the findings of the WOL 2005 baseline survey, a seasonal data collection was initiated from 236 selected households across several provinces. This longitudinal data offers the advantage of capturing change in farm strategies, both through seasonal and longer-term cycles. Monitoring was designed to capture a wide range of farm and livelihood indicators, which could then be integrated with the results from other complementary research activities. By taking a holistic approach to farming systems and rural livelihoods, WOL research explores how opportunities and constraints in natural resources access and elsewhere in farm management can impact upon development opportunities and the broader rural economy.
As a note of caution, 2006 was a year when many parts of Afghanistan were afflicted by severe drought and this undoubtedly had a direct impact upon resource availability, farmer decision-making, agricultural productivity and markets. Consequently, the year cannot be considered as typical and 2006 monitoring findings should ideally be viewed in the context of a longer time sequence.
General findings
While Afghan agricultural policy currently emphasises strengthening the function of free markets for licit agricultural products, the evidence of WOL farm monitoring highlights the extent to which farming systems are embedded within informal institutions that mediate economic opportunity and farmer access to markets. Recorded systemic inequities in access to land, water, pasture, agricultural labour and off-farm economic opportunities may distort the capacity of some farmers to participate in agricultural growth.
With respect to land tenure systems, research findings show that up to a third of agricultural land may be cultivated under subordinate systems of tenure, although short-term seasonal fluctuations may to some extent mask this in wider statistics. Furthermore, WOL monitoring data indicates that sharecropping (the predominant form of subordinate land right) is most prevalent in the irrigated river valleys (where high value crops may be grown), and is less common elsewhere. Sharecropping agreements therefore have a major impact in shaping the distribution of crop incomes, with up to 80 percent of incomes from the sale of high value crops directed back to absentee landowners. These findings are clearly of importance in understanding how the economic benefits of planned growth in the horticultural subsector can be expected to percolate through the wider rural economy.

Afghanistan Research and Evaluation Unit
vi
Farm and household monitoring of irrigation water access characterise key differences between access to and management of water under irrigated (lower catchment) and semi-irrigated (upper catchment) systems: finding that in upper catchments where water flows are more limited in duration, farmers tend to be more innovative in accessing water from diverse sources. Although upper catchment irrigation rarely supports more than a single crop annually, there may be some potential to improve upon this if the efficiency of water management is increased. WOL data suggests that lower catchment irrigation systems are characterised by significant inequities between farmer access to water at the head and tail ends of canals. This is reflected both in crop diversity (the opportunity to grow high value crops) and in crop yields. Equally, data shows that downstream farmers carry a disproportionate share of the burden of undertaking canal repair maintenance, with the associated opportunity costs for that labour. Consequently, it is probable that under prevailing institutional conditions, economic growth in the horticultural subsector will likely be concentrated in specific locations, benefitting those who already command preferential access to resources.
Monitoring of crop production under rural Afghan conditions shows that during the drought year of 2006, levels of productivity were very low. However, data indicates that farmers may be detrimentally over-investing (over seeding and over fertilising) in some high value crops in the hope of improving crop returns, while under-investing in some lower value crops. There is clearly a need for further research into this issue to determine whether improved management of crop inputs might result in greater productivity. Furthermore, WOL data shows that licit high value crops tend to have high entry thresholds in terms of necessary access to water resources and cash for agricultural inputs. This suggests that many farmers, who lack preferential access to water or credit to invest, are excluded from growing them. By contrast, in 2006, farmers outside the best-irrigated areas could undertake the cultivation of opium poppy, and it was easy to find credit to cover the high costs associated with growing the crop. These findings highlight the importance of accessible agricultural credit to facilitate the sustainable transition from the opium economy to high value licit crops.
Investigation of livestock production systems indicates that (under the 2006 drought conditions) margins of production were generally low. However, data indicates that the livestock production that heavily utilised rangeland grazing resources seemed to achieve the best gross margins of production. In other words, farmers attempt to improve gross margins by reducing costs, rather than by increasing outputs, resulting in low input, low output systems in which animals rarely achieve their genetic potential. Nomads and farmers in rangeland areas also structure their herds most effectively to supply to markets, although there is anecdotal evidence of farmers of irrigated lands buying in lambs and kids in small numbers to add value by fattening and finishing (fattening for sale) for urban markets. However, because of the relative importance of domestic consumption of animal products under some sedentary systems of production, it is questionable whether monetary values alone represent the most appropriate measure of productivity
WOL data suggests that labour may constitute a constraint for many households, with women providing up to a third of all farm labour under some monitored production systems. Findings further show that during 2006 women contributed to household monetary incomes in half of all sampled households. Research further shows that there are qualitative differences in household access to off-farm waged employment to supplement farm production, with households farming in the most marginal and high-risk conditions receiving significantly less income than those in irrigated river valleys. Finally, monitoring of farming households also investigated the importance of farm production

Water, Opium and Livestock: Findings from the First Year of Farm and Household Monitoring
vii
for domestic consumption and found that overall, about 50 percent of food consumed on-farm was domestically produced, although the degree of subsistence varied between production systems. Nevertheless, under all production systems, the value of domestically produced foods represents a significant monetary value. Considering both farm (and off-farm) economic activities, WOL data demonstrates that farming households may achieve very low annual margins to buffer against shocks and risks. The agricultural calendar and farm cash flows mean that households are likely to face the most severe pressure at the end of the winter season.
Conclusions
Overall, the findings of this research highlight the need for policy and development programmes to address systemic inequities in resource access. Since access to resources is mediated through informal institutions, institutional reform and strengthening improving resource governance may help to redress the power asymmetries that have emerged in rural Afghanistan. Beyond the scope of this study, work conducted by the WOL project has investigated how these institutions function and perform.
Furthermore, data shows that different farming systems hold clearly distinct comparative advantages for growth, dependent upon local resource conditions and opportunities. Accordingly, there should be sensitivity to this in designing and implementing interventions to stimulate economic growth. A particular challenge related to this will be overcoming the tendency for government programmes to be established in the major irrigated valleys, which although logistically most accessible, and densely populated, will not always be the most logical site to support specialised production in more outlying areas.
Finally, WOL monitoring data emphasises that farm production to supply markets, farm production to supply households and off-farm earnings are deeply integrated in constructing rural livelihoods in Afghanistan. Although the relative importance of each of these components varies with individual household strategies, the current emphasis of policy fails to appreciate the valuable contribution that the production of food for domestic consumption makes to sustaining an agricultural sector in Afghanistan. Particularly in remote areas where access to markets may be irregular, opportunities for off-farm incomes limited and farm cash flows often in deficit, production for domestic supply will be integral to sustaining farming systems.

Afghanistan Research and Evaluation Unit
viii

Water, Opium and Livestock: Findings from the First Year of Farm and Household Monitoring
1
Introduction1.
The project entitled ”Applied Thematic Research into Water Management, the Opium Economy and Livestock” (WOL) is funded through a contract awarded to the Afghanistan Research and Evaluation Unit (AREU) by the European Commission. The purpose of the project is to:
... enhance the sustainability of Afghan rural livelihoods by providing policymakers with clear and accurate information on the use, management and role of natural resources (with specific focus on water, livestock and opium) within the agricultural economy.
The research is expected to provide evidence-based recommendations for improving the effectiveness of agricultural policy and rural programming and addressing the recognised lack of understanding about the ways in which rural livelihoods are constructed and respond to change.
AREU has undertaken research in several Afghan provinces, primarily focused on Nangarhar, Ghazni, Herat and Kunduz, in collaboration with two NGO partners, Danish Committee for Assistance to Afghan Refugees (DACAAR) and German Agro Action (GAA).
During the first year of research (2005-06), the research team conducted an extensive baseline survey. One goal of this survey was to establish a sampling frame for longitudinal monitoring of farming households around Afghanistan. The first section of this report describes how the team established longitudinal monitoring during the second year of WOL research (2006-07). The remaining sections of the report present an overview of the results of this monitoring exercise, with specific focus on results pertaining to land, irrigation water, cropping, livestock and livelihoods. A summary of key findings appears in the final section.
Afghanistan Research and Evaluation Unit
2
The Monitoring System2.
Longitudinal monitoring of agricultural systems and rural livelihoods is a widely practiced technique for data-gathering and research in developing countries. However, this is a difficult approach to use in Afghanistan due to the short time-frame of projects, logistical problems, insecurity and a fluid rural population. Nevertheless, the findings of a previous longitudinal study suggest that household monitoring will be an important tool for understanding trends in farming and rural livelihoods.1
The first section of this report outlines why and how the research team undertook this component of WOL research, with particular attention on the research methods and tools utilised.
Why monitoring of farm systems?2.1
The WOL project was established in response to the lack of systematic data-gathering on farming systems in Afghanistan.2 The data collected during the first years after the fall of the Taliban served primarily to inform the emergency and relief efforts addressing food insecurity.3 While these studies have produced valuable information describing household food security and resource conditions in rural areas, they are limited in their investigation of farming system function. Furthermore, due to random sampling, these annual and biannual surveys have not included repeat visits to track and explore change within individual households or communities.
The multi-year WOL project provided the opportunity for researchers to address some of these limitations through in-depth longitudinal studies. Indeed, WOL monitoring was designed to broadly complement national-scale surveys. While WOL monitoring lacks the representativeness and coverage of these wider surveys, its more detailed analysis holds the potential to help explain patterns of change identified by these “big picture” snapshots.
Longitudinal monitoring of farm inputs and outputs also allows an economic evaluation of production systems, something that has not been systematically attempted in recent years. The farm monitoring aspect of the WOL project is intended to corroborate various thematic studies, as the data-collection process has to some extent been informed by these studies. In addition, by collecting data on the management choices of various farmers and evaluating the outcomes of these, household monitoring can suggest the types of farm strategies that are most effective in achieving livelihood goals. Consequently, monitoring has utility in suggesting “best practice” in farming to achieve specific goals under various conditions.
1 See J. Grace and A. Pain, Rethinking Rural Livelihoods In Afghanistan (Kabul: Afghanistan Research and Evaluation Unit, 2004).
2 Problems associated with the availability of agricultural data in Afghanistan are discussed in“Water Management, Livestock and the Opium Economy: Annotated Bibliography” (Kabul: Afghanistan Re-saerch and Evaluation Unit, 2006) .
3 This data collection has taken the form of large scale annual or biannual sample surveys. These have included the World Food Program (WFP), “Vulnerability Analysis and Mapping (VAM) National Assessment 2000,” (Kabul: World Food Programme, 2000) the World Food Program, “Vulnerability Analysis and Mapping (VAM) National Assessment 2001,” (Kabul: World Food Programme, 2001) the World Food Program, “Vulner-ability Analysis and Mapping (VAM) National Assessment 2002,” (Kabul: World Food Programme, 2002) the World Food Program, “National Risk and Vulnerability Assessment (NRVA) 2003” (Kabul: World Food Program, 2003) and the World Food Program, “National Risk and Vulnerability Assessment (NRVA) 2005” (Kabul: World Food Program, 2005).

Water, Opium and Livestock: Findings from the First Year of Farm and Household Monitoring
3
Overall, the purpose of household monitoring is to improve understanding of farming systems and how these function through time. In keeping with the specific objectives of the WOL project, the research team placed emphasis on tracking the management of land, water and livestock, and on understanding the role of opium in rural livelihoods.
Research methods and tools 2.2
During the first year of WOL research, the team selected 20 primary research sites (defined as villages and their associated natural resources) from four provinces. These sites encompass the diversity of bio-physical, agricultural and socioeconomic conditions in Afghanistan. The baseline survey used a weighted sampling technique which covered between ten and 75 percent of the population at each research site. This generated statistically significant agricultural and socioeconomic profiles for each site.4
The researchers necessarily considered a number of factors when determining the optimal interval for repeat data collection. These included available staff resources, logistics and the prospect of respondent fatigue as a result of repeated visits. These practical concerns were considered against the need for the shortest possible monitoring interval to accurately track change. The team decided to monitor participating research sites at three-month intervals. It was anticipated that this monitoring strategy would be sensitive to seasonal change through the agricultural calender and be practically sustainable in all areas throughout the year while leaving sufficient team capacity to undertake other WOL research actions simultaneously. Monitoring ”rounds” to record data about farm function over the previous three months were planned for the end of the spring, summer, autumn and winter seasons.
The team estimated that they had the capacity to maintain seasonal data-collection if the monitoring group was restricted to about 200 farming households. Rather than select a random sub-sample of households at each research site it was decided to purposely select households that would in aggregate mirror the socioeconomic and agricultural profile of the site from which they had been drawn.5 In this way, although the monitoring groups of farming households were not statistically representative of the research site as a whole, they did reflect the incidence and distribution of assets and resources present in the wider community. Four variable indicators guided the selection of households: Land area under cultivation, ownership of sheep and goats, ownership of cattle and household asset status.6 Rather than select a random sub-sample of households at each research site, the team decided to select households that would in aggregate mirror the socioeconomic and agricultural profile of the site from which they had been drawn.7 In aggregate, the geometric means and measures of dispersion (standard deviations) for each sub-group replicated those of the wider community across all four variables. In this way, although the monitoring groups of farming households were not statistically representative of
4 For a fuller description and discussion of the baseline survey and its results see Alan Roe, “Water Ma -agement, Livestock and the Opium Economy: Baseline Survey” (Kabul: Afghanistan Research and Evaluation Unit , 2006).
5 At some research sites, monitoring groups would necessarily be very small, in some cases less than ten households. Selected randomly, these small samples could easily be unrepresentative of the broader re-search site community.
6 Household asset status was an arbitrary value assigned on the basis of household ownership of key non-productive assets. It can therefore be considered a proxy indicator for disposable income. See Roe, “Base-line Survey.”
7 At some research sites, monitoring groups would necessarily be very small, in some cases less than ten households. Selected randomly, these small samples could easily be unrepresentative of the broader re-search site community.

Afghanistan Research and Evaluation Unit
4
the research site as a whole, they reflected the incidence and distribution of assets and resources present in the wider community.
Using this approach, 214 households were identified to represent the 20 primary research sites. In the first year of WOL research, the team had also commenced working with two communities of nomadic pastoralists, the Khomari Khel and the Kutub Khel, to explore aspects of extensive livestock production and common property land access. A sample of these communities was included in the longitudinal monitoring. During 2006-07 the WOL project therefore monitored the agricultural and livelihood systems of 236 farming households (Table 1).
These households farmed under a variety of production conditions. Over half of all monitored households (56 percent) were in production sites dominated by irrigated
Province Research site Number of households Production system
Ghazni
Zala Qala 7 Semi-irrigated
Pyada Rah 2 Semi-irrigated
Qala-i-Naw 27 Irrigated
Turmai 11 Irrigated
Chechel Gumbad 6 Irrigated
Herat
Khalifa Rahmat 12 Rainfed
Tonian 13 Irrigated
Gawashk 10 Irrigated
Ghorak 7 Semi-irrigated
Sir Zar 12 Rainfed
Kunduz
Abdul Nazar 5 Rainfed
Alam Boy 4 Rainfed
Dana Haji 5 Irrigated
Wakil Jangal 19 Irrigated
Afghan Mazar 17 Irrigated
Nangarhar
Maruf China 11 Semi-irrigated
Sra Qala 11 Semi-irrigated
Khawaji 7 Semi-irrigated
Othar Khel 10 Semi-irrigated
Janikhel 18 Irrigated
NomadsKhomari Khel 12 Pastoral
Kutub Khel 10 Pastoral
Total 236
Distribution of households within monitoring groupTable 1:

Water, Opium and Livestock: Findings from the First Year of Farm and Household Monitoring
5
agriculture, usually in the lower catchments of river valleys. Fewer households (20 percent) were in sites where irrigation was irregular, seasonal or otherwise limited. These sites were more commonly found in elevated upper catchment areas and irrigated from limited-flow karez, wells or springs. Smaller still was the proportion of households dependent on rain-fed farming (14 percent). These sites tended to be found in remote rangeland areas with little or no access to water for irrigation purposes. The smallest proportion of households were those engaged in migratory pastoralism (Figure 1).
Data collection 2.3
AREU’s collaborating NGO partners, DACAAR and GAA, assisted in recruiting field teams to collect data from farmers and their households. Each provincial field team comprised a male and female researcher subject to the supervision of an NGO Research Support Officer (RSO). The WOL project team at AREU monitored nomadic pastoralists.
The baseline survey suggested to researchers that men and women held distinct specialist areas of knowledge relating to farm and household management. Male and female interviews were therefore differentiated into these areas of gender-based knowledge. Nevertheless (as with the baseline survey), data was always collected simultaneously from men and women during farm visits. Field teams were given thorough training on data collection, and their research findings were screened by their immediate RSO supervisors in the field and also prior to data-entry in Kabul. Kabul team members regularly evaluated the data-collection performance of researchers through site visits and formal evaluation exercises. These visits generated recommendations for continuous improvement in data collection. In addition to recording farmer testimony, Kabul team members corroborated reports through their own observations at the sites.
The monitoring aimed to assemble a dataset that captured farm resource access, agricultural inputs and outputs, management decisions, labour allocation and related household economics each season for two successive years. In order to ensure internal comparability, researchers collected data from farmers using structured questionnaire datasheets. They used three separate datasheets: one for male (heads of household)
Figure 1: The distribution of the monitoring group by farm production system

Afghanistan Research and Evaluation Unit
6
respondents; one for female (senior female or head of household) respondents; and a third to record farm-gate prices for local agricultural products, services and commodities for the period of the data collection.8
The researchers piloted these three datasheets prior to commencing data collection and modified them very slightly in response to farmer feedback after the first rounds of monitoring. They remained substantially unchanged throughout the period of monitoring. A summary of the main content of the three datasheets appears in Table 2.
It took a skilled researcher approximately 40 minutes to complete a datasheet with a research participant. The WOL project team judged this to be the most time a farmer could reasonably be expected to give to the research on any given day.
8 Commodity prices were gathered from local traders and dealers. Prices were gathered from three sep -rate sources and averaged.
Sections Data collected
Male datasheet
Water
Sources and quantity usedAmount received Irrigation maintenanceConflict over waterProblems with irrigation
Land Type of land and terms of tenure
Cropping
Cropping patternAgricultural inputs Crop production and yields Consumption/sale/storage of cropsMarketing of cropsCultivation problems
Livestock
Livestock inventoryChanges since last recordReasons for changeLivestock inputs Livestock outputsConsumption or sale of productsMain problems with livestock
Labour
Labour resourcesTasks on farmUse of external labourOff-farm waged labour and incomes
Female datasheet
Consumption
Household constitutionTypes and quantities of food consumedOrigins of food consumedInternal allocation of foods
Labour
Female labour on farmWomen’s farm decision-making Female work on dairy production Female work weaving for cash income
Natural resources Collection and use of wild plants
Collection and use of natural fuels
Market datasheet Farm gate prices All commodities produced or consumed
Main data collected through farm monitoringTable 2:

Water, Opium and Livestock: Findings from the First Year of Farm and Household Monitoring
7
The research team’s relationship with the participating communities and farmers was fundamental to establishing an effective system of monitoring. In spring 2006, members of the Kabul WOL team met with the provincial and district authorities of the areas where monitoring was planned. Although the team had held discussions prior to the baseline survey, they made further visits to community elders and leaders to explain the purpose of the proposed monitoring and to seek consent for the population’s participation. From the outset they emphasised that participation in the monitoring would not incur any direct benefits to communities and would place considerable demands on their time. Researchers again explained this to householders at the initial monitoring visits, when individual households were asked to participate.
As research teams found earning the good will and trust of communities was essential to sustaining the monitoring initiative. The teams went to great lengths to keep communities informed of progress and activities. In April and May 2007, at the end of the first year of monitoring, the WOL project team convened participating farmers for meetings in provincial capitals. The team presented some preliminary research results and updated participants about what project activities were occurring around the country and how the team was using the resulting information. These meetings also provided opportunities for research participants to meet with collaborating officials from the departments of Agriculture, Energy and Water and Rural Rehabilitation.
Archiving and managing data 2.4
The monitoring of farming households produces a steady flow of data requiring organisation, archiving and management. The WOL research team developed a relational database in Microsoft Access as a platform for receiving and organising data. The database offered a number of advantages for data management:
Data from male and female datasheets from the same household (as well as price • information relevant to that location or season) can be automatically linked.
The database architecture theoretically allows every variable in the dataset to be • related to every other variable.
Records can easily be manipulated to organise data by time, location or thematic • content.
The data may be examined at different levels of detail (e.g. to explore results • from the whole sample, the provincial level, single research sites or individual households).
The user interface is designed to facilitate easy entry and standardisation of data, • reducing the risk of errors.
Automatically updating, the database allows researchers to view incoming data, • cross-check ambiguous entries with field teams and make recommendations for improved data collection.
Users can run specific queries and produce reports on the entire dataset or specified • parts of it.
The database enables the export of data sets into other programs such as Excel, • SPSS and Genstat for further analysis.
The WOL project database was designed and built during the first year of farm monitoring. Kabul team staff received extensive training in database management and field teams

Afghanistan Research and Evaluation Unit
8
got introductory training so that they could take steps to minimise any ambiguities or problems with submitted datasheets. During the first year of monitoring, the Kabul research team received approximately 2,000 datasheets and entered all of this data into the database.
The following sections of this paper present some of the preliminary findings of WOL research during the year 2006-07. The paper explores issues of land management, water, cropping and livestock, and also offers a general discussion of farm economics and livelihoods.
Rather than provide random sets of data from the large quantity collected, this report presents research findings to address specific questions that arose during the first year of research. These questions were developed within the framework of the WOL project research objectives.
To place research findings in broader context, this section ends with a brief review of farming conditions during the period of the study.
Background to the agricultural year 20062.5
Late autumn and early winter 2005 brought near-normal precipitation to most parts of Afghanistan. This made farmers optimistic that they could expect a good agricultural season, as had occurred the previous year. Consequently, they invested widely in land and ploughed and seeded large areas of rainfed land. However, from January 2006, many parts of the country experienced a dry spell, with below-normal precipitation levels for the season as a whole. Through spring and summer there was scarcity of water for
Figure 2: Sample screenshot from the WOL database interface

Water, Opium and Livestock: Findings from the First Year of Farm and Household Monitoring
9
irrigation in many parts of the country, and crops were affected.9
Of the four provinces selected for WOL monitoring, only Kunduz had a good agricultural season in 2006. All other provinces experienced below-normal rainfall and scarcity of irrigation water. Nangarhar was particularly affected by drought.
Good precipitation came early at the end of 2006 and continued through the winter (2006-07) season. (The year 2007 was a good year for agriculture in Afghanistan.) All provincial research sites received above-average rainfall during November and December 2006.10
9 U.S. Geological Survey, “Agrometeorological Seasonal Bulletin 2005-2006,” http://afghanistan.cr.usgs.gov/documents.php?cat=1 (acccessed 19 April 2009).
10 U.S. Geological Survey, “Agrometeorological Seasonal Bulletin 2006-2007,” http://afghanistan.cr.usgs.gov/documents.php?cat=1 (accessed 19 April 2009).

Afghanistan Research and Evaluation Unit
10
Land Tenure 3.
The first year of WOL research highlighted access to land (whether private or common property) as underlying all other aspects of agricultural production and livelihoods in Afghanistan. Studies showed that access to land is regulated by informal institutions and customary mechanisms of tenure and suggested that at an intra-community level these remain functional. However, questions surrounding the equity of resource access were raised, particularly with regards to subordinate land rights such as share-cropping, leasing and mortgaging. Consequently, the option was raised of building upon customary systems of land tenure for a future national land administration.11
The preliminary year of WOL research raised important questions concerning the terms under which agricultural land is accessed and managed and the extent to which different forms of tenure may impact productivity and rural vulnerability.12 There were several key research questions:
What are the proportions of land cultivated under various forms of tenure? Do these • proportions differ through time or according to agro-ecological context?
Why is there such diversity in sharecropping arrangements? Is there evidence for a • relationship between sharecropping terms and the productive value of land?
Conditions and terms of land tenure 3.1
Preliminary findings from the WOL baseline survey indicated that between a quarter and a third of all land under cultivation at the primary research sites was managed under subordinate rights (lease, sharecrop or mortgage).13 However, the research did not provide data on what proportion of land fell into each of these categories and whether there are any marked trends in their distribution.
11 A. McEwen and S. Nolan, Water management, Livestock and the Opium Economy: Options for and Re -istration (Kabul: Afghanistan Research and Evaluation Unit, 2007).
12 Many of these questions were set out in Alan Roe, Water Management, Livestock and The Opium Eco -omy: Natural Resources Management, Farming Systems and Rural Livelihoods (Kabul: Afghanistan Research and Evaluation Unit, 2008).
13 Roe, Natural Resources Management.
Figure 3: Proportion of land under cultivation by various categories of tenure (n=214)
Water, Opium and Livestock: Findings from the First Year of Farm and Household Monitoring
11
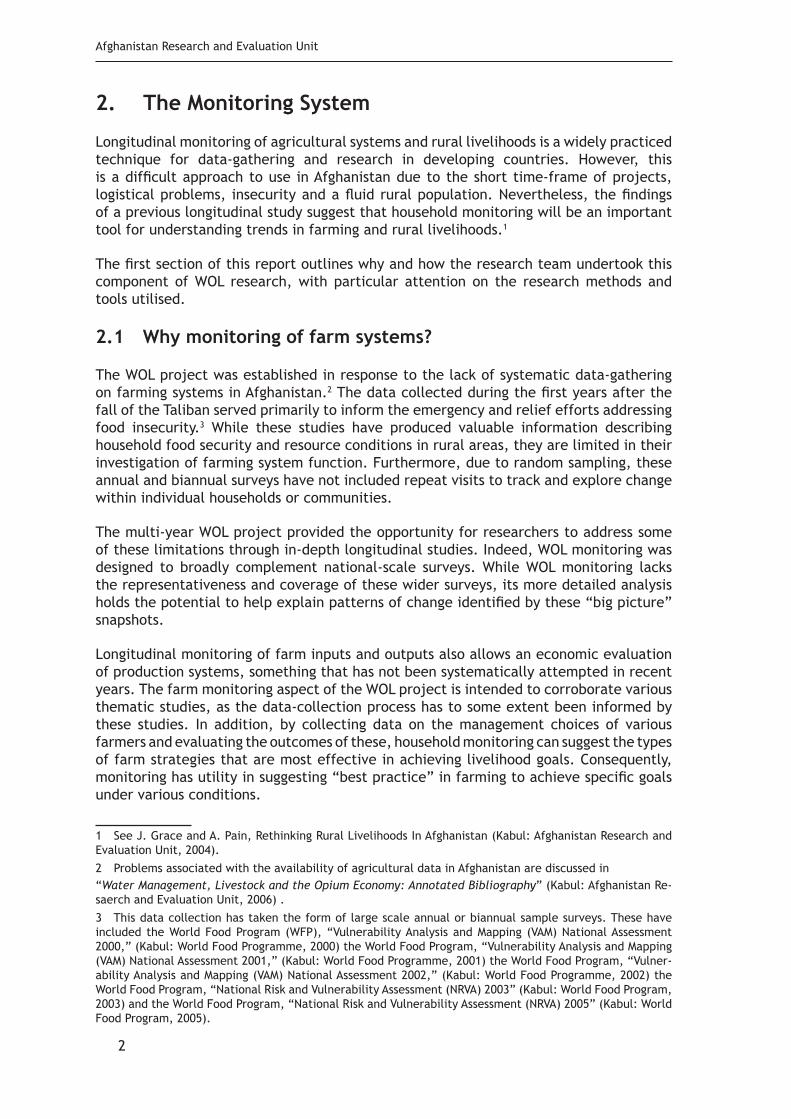
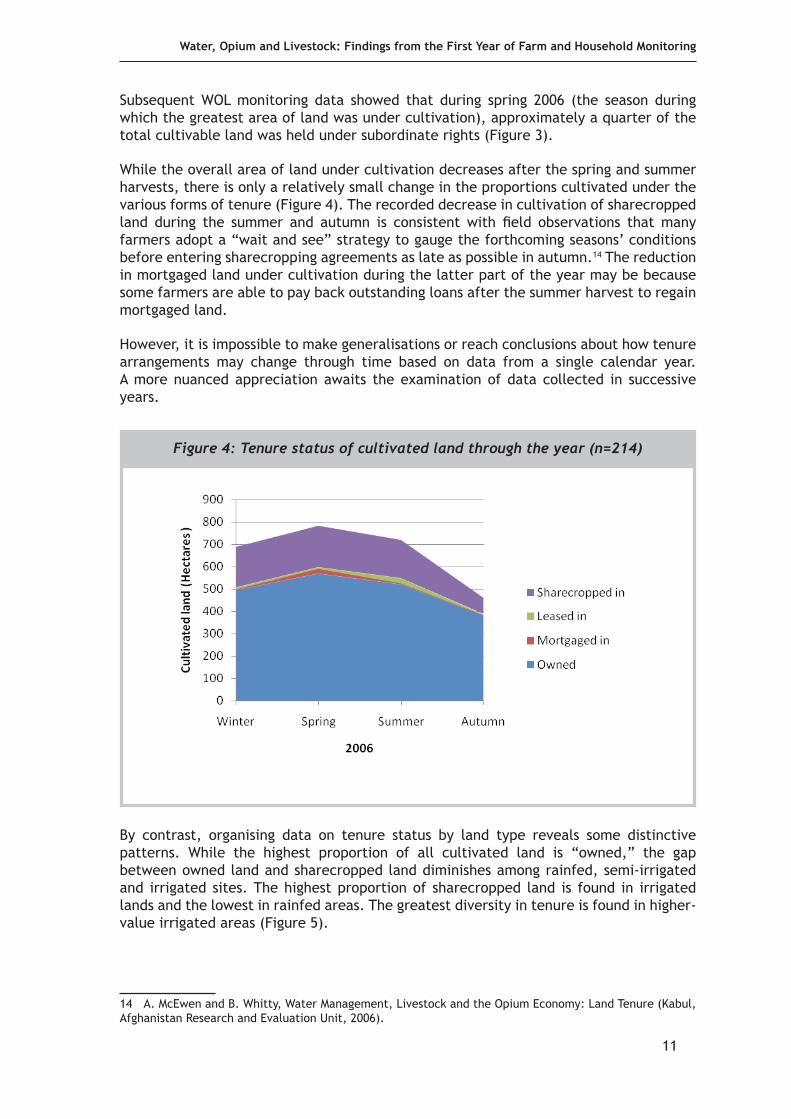
Subsequent WOL monitoring data showed that during spring 2006 (the season during which the greatest area of land was under cultivation), approximately a quarter of the total cultivable land was held under subordinate rights (Figure 3).
While the overall area of land under cultivation decreases after the spring and summer harvests, there is only a relatively small change in the proportions cultivated under the various forms of tenure (Figure 4). The recorded decrease in cultivation of sharecropped land during the summer and autumn is consistent with field observations that many farmers adopt a “wait and see” strategy to gauge the forthcoming seasons’ conditions before entering sharecropping agreements as late as possible in autumn.14 The reduction in mortgaged land under cultivation during the latter part of the year may be because some farmers are able to pay back outstanding loans after the summer harvest to regain mortgaged land.
However, it is impossible to make generalisations or reach conclusions about how tenure arrangements may change through time based on data from a single calendar year. A more nuanced appreciation awaits the examination of data collected in successive years.
By contrast, organising data on tenure status by land type reveals some distinctive patterns. While the highest proportion of all cultivated land is “owned,” the gap between owned land and sharecropped land diminishes among rainfed, semi-irrigated and irrigated sites. The highest proportion of sharecropped land is found in irrigated lands and the lowest in rainfed areas. The greatest diversity in tenure is found in higher-value irrigated areas (Figure 5).
14 A. McEwen and B. Whitty, Water Management, Livestock and the Opium Economy: Land Tenure (Kabul, Afghanistan Research and Evaluation Unit, 2006).
Figure 4: Tenure status of cultivated land through the year (n=214)

Afghanistan Research and Evaluation Unit
12
A plausible explanation for these differences highlights the relationship between tenure and risk in farming systems. Risks (particularly those related to water availability and drought) are generally higher in semi-irrigated areas than irrigated, and highest on rainfed land. Findings from the first year of WOL research indicate that rainfed farming is an inherently high-risk enterprise, while sharecropping as a land-acquisition strategy may be intended to help minimise risks to the farmer.15 The data further suggest that leasing of land (the highest risk land acquisition strategy) is confined to the irrigated river valleys. Mortgaged land (and subsequent cultivation) is most common in semi-irrigated upper catchments where the greatest land scarcity exists and is absent at the selected rainfed sites, where land is abundant but of low productive value.
Investigation of the relationship between sharecropping and land type may be advanced through consideration of the sharecropping terms landowners offer to farmers. Studies during the first year of WOL identified that the terms offered in sharecropping agreements (e.g. the final division of harvest) appear to vary according to a range of factors, including the respective contribution of inputs such as seed, labour and fertilisers; the condition of
15 Roe, Natural Resources Management.
Figure 5: Tenure status of cultivated land by farm type
Figure 6: Sharecropping terms by land type (n=81)

Water, Opium and Livestock: Findings from the First Year of Farm and Household Monitoring
13
the land resource; and the local demand for land. Researchers found that sharecropping agreements awarded farmers from between 25 to 80 percent of the final harvest.16
The research team recorded the participating farmers’ sharecropping terms for spring 2006 and organised them by land type (Figure 6). Although proportionately more land is sharecropped in irrigated river valleys than in semi-irrigated or rainfed areas, it appears that sharecropping terms are better for farmers of the latter.
Researchers explored the terms of sharecropping agreements for different types of land using one-way analysis of variance and (with α=0.05) found them to be statistically significant (F=47.7, p=>0.005). Post-hoc comparisons using the Tukey HSD test indicated that the sharecropping terms offered at irrigated and semi-irrigated sites differ statistically from those offered at rainfed sites (Table 3).
Table 3: Comparison between terms of sharecrop agreements on different land types
n Mean farmer share (%) Std. DevIrrigated 55 48.09 9.44
Semi-irrigated 10 46.20 13.70Rainfed 16 76.53 12.06
The next stage of this investigation involved considering if and how sharecropping terms might relate to specific categories of crops and the relative input contributions of owners and farmers. Unfortunately this could not be done statistically, because it is not possible with available data to link individual crops to the tenure status of specific parcels of land (many farmers simultaneously cultivate land under different types of tenure and individual parcels were not coded). Instead, Table 4 contrasts the three highest and three lowest reported sharecropping terms for each category of land and sets these in the context of the crops being cultivated at the same time. Organising the data in this way shows that sharecroppers appear to receive a lower proportion of the harvest when higher-value crops are being cultivated.
The least favourable terms were taken on by sharecroppers who were cultivating irrigated poppy, orchard crops and vegetables, while the most favourable terms were predominantly associated with the cultivation of cereal crops.
The first year of WOL research indicated that the terms of sharecroppper agreements also depend upon the relative contributions to agricultural inputs made by land owners and farmers. WOL monitoring data capture some of these differences with respect to four categories of agricultural inputs: Labour, seeds, fertilisers and ploughing.
16 McEwen and Whitty, Land Tenure.

Afghanistan Research and Evaluation Unit
14
Table 4: Contrasting high and low terms of sharecropping by crop and land types
Low share of harvest High share of harvest
Farmer (%) Crops cultivated
Village, Province
Farmer (%) Crops cultivated
Village, Province
Irrigated
33 Apples, plums, fodder, potatoes
Chechel Gunbad, Ghazni
60 Wheat, barley
Tonian, Herat
33 Plum, apples, potatoes
Chechel Gunbad, Ghazni
60 Wheat, barley, spices
Tonian, Herat
33 Plum, fodder, potatoes
Chechel Gunbad, Ghazni
60 Wheat, barley, pulses fodder
Gawashk, Herat
Semi-irrigated
20 Opium poppy, maize
Sra Qala, Nangarhar 50 Maize ,
cottonMaroof China, Nangarhar
33A p r i c o t , apple, fodder wheat
Zala Qala, Ghazni 60 Wheat Ghorak, Herat
33 A p p l e s , plums, wheat
Zala Qala, Ghazni 66 W h e a t ,
barley Ghorak, Herat
Rainfed
50 Chickpea, wheat
Sir Zar, Herat 83 Wheat, barley
Sir Zar, Herat
50 Water melon, melon
Abdul Nazar, Kunduz
86 Wheat Sir Zar, Herat
60 Barley Khalifat Rahmat, Herat
86 Wheat Sir Zar, Herat
Figure 7: Farmer contribution of agricultural inputs under recorded sharecropping agreements (100 percent for each category given as dotted lines)

Water, Opium and Livestock: Findings from the First Year of Farm and Household Monitoring
15
As might be expected, under most sharecropping agreements the farmer is usually responsible for labour and ploughing. The principle areas of negotiation between parties to the agreement appear to be seed and fertiliser. However, the data show that in nearly all recorded instances, sharecroppers on rainfed lands contribute all agricultural inputs. There is similarly a high level of farmer contribution associated with sharecropping on semi-irrigated lands. The main reported landowner contribution to sharecropping is the provision of seeds to farmers of irrigated land (Figure 8).
Discussion3.2
WOL farm and household monitoring advances understanding of land tenure arrangements in rural Afghanistan significantly beyond the findings of the first year of research and provides important new insights into farming systems and the rural economy.
The monitoring data are consistent with baseline survey estimates indicating that at WOL research sites up to a third of cultivated land may be worked under subordinate forms of land tenure. Previous estimates have suggested that a smaller proportion of land is cultivated under these subordinate forms of tenure.17
Furthermore, WOL data reveal a clear trend in the distribution of subordinate land rights, with sharecropping accounting for double the proportion of cultivated land in irrigated river valleys than under the higher-risk, lower-return conditions of semi-irrigation or rainfed farming.
Although sharecropping in irrigated areas may involve less risk to the farmer, it impacts the terms offered. For access to good quality irrigated land that allows the cultivation of high-value crops, farmers generally receive a relatively low share of the harvested crop and income. In contrast, although carrying much higher risks (and receiving lesser input contributions from landowners), sharecroppers in more marginal areas appear to receive a higher proportion of the final yield. These results hold implications for supporting rural livelihoods, particularly with respect to stated policy that prioritises the creation of value chains for high value horticultural crops.
According to this research, over a third of irrigated land at WOL research sites is cultivated under sharecropping agreements. Sharecroppers producing high-value crops generally receive between a third and a half of the harvest but are responsible for contributing the majority of the agricultural inputs to the land. Were the patterns identified at WOL research sites representative of the situation across Afghanistan, they would shape how wealth created from the cultivation and marketing of high value-crops disperses through the agricultural economy. Even assuming resource-poor households could access good-quality agricultural land to cultivate crops for market supply, sharecropping terms would direct the largest returns into the hands of landowners. By contrast, although a lower proportion of land is sharecropped in rainfed areas, research shows that these most vulnerable farmers would derive a greater direct benefit if farm returns could be improved at these sites.
17 NRVA data, derived from a national-scale sample, suggests a much smaller proportion of land (a -proximately 10 percent) is cultivated under subordinate rights. However, NRVA data makes no distinction between different types of land, and as data collection was undertaken during the summer, all sharecrop-ping agreements might not have been concluded. See National Surveillance System and Vulnerability Analy-sis Unit, National Risk and Vulnerability Analysis, (Kabul, Afghanistan Ministry of Rural Rehabilitation and Development/Central Statistic Office, 2005).
Afghanistan Research and Evaluation Unit
16
Water and Irrigation 4.
During the first year of WOL research, the team investigated the institutions and functions of irrigation systems at selected sites in Kunduz, Nangarhar, Ghazni and Herat. Studies demonstrated that although farmers may access water supplies from many types of sources, using diverse conveyance methods, the management of surface water usually lies in community hands. In small-scale upper catchment systems, water is often scarce but its management is not highly politicised, as it is often subject to the control of traditional leadership structures. In lower catchment areas, hydraulic boundaries may encompass the lands of multiple communities and management becomes more politically complex, so water is usually managed through a hierarchy of specialist mirabs (water bailiffs).18
Research indicated that scarcity and inequities in the supply of water were widespread through irrigation systems and could be linked to both the structural shortcomings of irrigation infrastructures themselves and to ineffective management. Important questions were raised to guide further research:
Are customary systems of water management fundamentally inequitable? Can this • be measured, and if so, who is benefitting?
How does irrigation water supply affect agricultural yields, crop choices and land • management? To what extent can the impact of irrigation efficiency be measured in livelihoods?
Access to water at WOL research sites 4.1
An appropriate point of departure for exploring patterns of irrigation water management and use is an investigation of how and where farmers are able to access water. Studies conducted during the first year of WOL research provided a broad but simplified characterisation of how farmers accessed water at each research site, based on anecdotal or single-visit reports. WOL farm monitoring now provides the opportunity to investigate how farmers are accessing irrigation water over time.
A useful overview will encompass an examination of differences in water access between irrigated sites in river valleys and semi-irrigated sites in the upper catchments. Unfortunately, comparable data were not collected in rainfed areas, where at some sites springs may irrigate small household gardens or where people practice water harvesting.
The data cited in Figures 8 and 9 describe the frequency with which farmers were using each category of water source during the 2006 monitoring year. Farmers sometimes draw upon different sources of water simultaneously or use multiple separate sources of the same type (e.g. irrigating land with water from separate canals). Figures 8 and 9 aggregate all reported uses of irrigation water sources by all farmers.
Cursory examination of the data highlights both similarities and differences in how irrigation water is accessed at each category of site. At both types of site, farmers draw on the highest number of different water sources during the peak irrigation season in spring, perhaps reflecting the relative abundance of water at that time. Furthermore,
18 J. Lee, “Water Management, Livestock and the Opium Economy: Social Water Management” (Kabul: Afganistan Research and Evaluation Unit, 2006); and I. McAllister Anderson, “Water Management, Livestock and the Opium Economy: Irrigation Systems” (Kabul: Afganistan Research and Evaluation Unit, 2006).

Water, Opium and Livestock: Findings from the First Year of Farm and Household Monitoring
17
the number of irrigation sources being used at both types of site diminishes into the drier summer and autumn as seasonal water scarcity sets in.
Comparing patterns of water access between irrigated and semi-irrigated sites reveals that farmers of semi-irrigated upper catchment areas draw upon a wider portfolio of water sources to meet their irrigation needs. In river valleys, farmers
appear more heavily reliant upon canal irrigation, supplemented by some irrigation from tube wells. Indeed, the data in Figures 8 and 9 show that the river valley farmers in the sample draw upon an average of 1.3 different sources of water during the spring season, while upper catchment farmers use 1.9 sources. This may reflect the greater permanance and reliability of canal irrigation water in river valleys. It is also worth noting that while approximately a fifth of river valley farms were still irrigating in autumn 2006, farmers at semi-irrigated sites were apparently unable to access irrigation water at that time.
Figure 8: Reported sources of irrigation water at irrigated sites (n=126)
Figure 9: Reported sources of irrigation water at semi-irrigated sites (n=45)

Afghanistan Research and Evaluation Unit
18
Having considered the sources of water used to irrigate farms, it is important to consider the absolute quantities of water available to farmers and how this amount varies over the agricultural year. Under traditional (shab o roz) water management systems the allocation of water to irrigators is regulated by two factors: the “irrigation interval” and the “irrigation period” (i.e. how often land receives a share of water and for how long).19 Recording these two variables allows estimation of the respective allocations received by individual farmers.20
WOL monitoring data collected over twelve months during 2006 clearly describe the seasonal cycle of irrigation water availability and scarcity throughout the agricultural year (Figure 10). An early peak in irrigation water availability may be related to early
19 Lee, “Social Water Management.”
20 These estimates are speculative and describe hours of allocation, not water volume. It is impossible to estimate actual quantities received by each farmer without physical measurement of unit/rates of flow, which was not attempted in the second year of research.
Figure 10: Reported irrigation across research sites through the year 2006
Figure 11: Semi-irrigated farm access to irrigation water (with Standard Deviations)

Water, Opium and Livestock: Findings from the First Year of Farm and Household Monitoring
19
winter precipitation that can fall as rain rather than snow and so enter river systems. There is also pressure for early irrigations when sowing some winter crops.
At WOL sites the principle period of irrigation occurred during the months of March, April and May as winter snows melted. Entering into the summer and autumn seasons, as water becomes increasingly scarce, access to irrigation water diminishes. Interpreting aggregate data from WOL monitoring is useful in identifying overall trends in water availability and comparing the dispersion in values for access to irrigation water through the year (Figure 11, Figure 12).
A comparison between farm irrigation at river valley (irrigated) sites and upper catchment (semi–irrigated) sites is instructive. During irrigation months, the mean allocations at semi-irrigated sites are only slightly lower than at irrigated sites. However, the measure employed describes time of allocation, not quantity (i.e. a tertiary canal in a river valley will probably discharge more than a hillside karez or spring).
Furthermore, data shows that farmers in river valleys enjoy more consistent access to water throughout the year, perhaps allowing a summer crop in some areas. Only during autumn months does water scarcity become critical. In contrast, farmers at semi-irrigated research sites apparently face a shortage of water through the summer as well as the autumn months. For many, a summer crop would be impossible.
The plotted dispersions of values at irrigated and semi-irrigated sites are high for both types of site, indicating large differences in access to water across different sites and possibly even within communities at the same site. In some calendar months, this dispersion of values appears widest at irrigated sites.
Studies undertaken during the first year of WOL research highlighted inequities across irrigation systems. Researchers postulated that inequities between the head and tail of irrigation systems could be attributed to two related factors: the hydraulic performance of canal structures and the management of water allocation throughout the system.21 Nevertheless, at the time that WOL irrigation studies were conducted there was little
21 Discussed in Roe, Natural Resources Management.
Figure 12: Irrigated farm access to irrigation water (with Standard Deviations)

Afghanistan Research and Evaluation Unit
20
empirical evidence to describe the attributes and extent of any inequities in Afghan irrigation systems.
Manipulation of data in the WOL database allows direct comparison of irrigation water flows, with land categorised as upstream, midstream or downstream on respective irrigation systems.22 This comparison can be seen in Figure 13, which, due to initial problems classifying the position of farms during the first year of monitoring, gives aggregate data for 2006 and 2007.
To best quantify the extent of these differences, mean values for irrigation at upstream, midstream and downstream sites appear in Table 5. Within the WOL monitoring sample group, farms located at upstream sites received more than twice the duration of irrigation flow than downstream farms.
Table 5: Mean irrigation allocation by position in system (aggregate data for 2006-07)
N Hours/day (Mean) Std. DevUpstream 80 2.16 3.99Midstream 216 1.7 3.00
Downstream 183 0.95 1.142
With empirical evidence to suggest that farm location within irrigation systems relates to differentiated access to irrigation water through the seasonal cycle, it is important to consider the impact of this on farm cultivation strategies and rural livelihoods. Assumptions that preferential access to water in Afghanistan is linked to the cultivation of high-value crops (and thus the possibility of production for market supply) have been widely supported with anecdotal evidence.
Because WOL data has not captured information on irrigation flows to individual parcels of land and individual crops, it is not possible to directly link irrigation flows to the
22 Farmers’ major and minor plots of land were categorised relative to their positions within the irrigation infrastructure (primary canal or other source of irrigation water, not location within catchment).
Figure 13: Comparing irrigation between upstream, midstream and downstream (aggregate data for 2006 and 2007)

Water, Opium and Livestock: Findings from the First Year of Farm and Household Monitoring
21
cultivation of specific high-value crops. However, crop diversity can be used to measure the inclusion of high-value and cash crops in farming strategies,23 and to indicate more diverse (and therefore resilient) farming systems. WOL monitoring data confirm a positive
relationship between irrigation water flows and crop diversity (Pearson correlation coefficient r=0.7395, n=51, p<0.005), most markedly during the summer season when water resources are most scarce (Figure 14). Section 4.5 includes a discussion of the impact on crop yields of farm position within an irrigation system.
Irrigation problems 4.2
Preliminary studies during the first year of WOL research highlighted some of the key problems and constraints on the conveyance of water to farmers’ land, which impact overall irrigation efficiency.24 Subsequent WOL farm monitoring provided an opportunity to investigate the incidence of these factors over time and across locations to determine their impact on farming systems.
Table 6: Reported incidence of key irrigation problems (2006)
Winter Spring Summer Autumn Total Labour
shortage39 94 139 9 281
Canals silted 99 114 126 12 351
Vegetation blocks canals
61 66 82 7 216
River erosion 27 38 76 2 143
Overall, the most frequently cited problems were insufficient water available from
23 Findings from the first year of WOL research suggest that Afghan farmers often prioritise cultivation for domestic supply. Therefore, high crop diversity usually indicates inclusion of high-value crops in the crop-ping pattern. See Roe, Natural Resources Management.
24 McAllister Anderson, “Irrigation Systems.”
Figure 14: Relationship between irrigation and crop diversity, summer 2006

Afghanistan Research and Evaluation Unit
22
source, silted canals and labour shortages. The data show that the highest incidence of these irrigation problems occurs during the summer following the spring floods when a second crop is sometimes cultivated under conditions of increasing water scarcity. In the autumn season, when there are few crops in the ground, the reported incidence of most irrigation problems diminishes.
First-year WOL studies suggested that the incidence of specific irrigation problems might be related to farm location within the irrigation system, but available monitoring data provide no clear evidence to support this (Figure 15). Most categories of irrigation problems appear to have been reported by farmers at diverse positions throughout irrigation systems. However, problems most often associated with upstream farms tend to be accusations of an ineffective mirab and illegal use of water by other users. Midstream farmers are more often troubled by problems affecting conveyance, notably damage to structures and blockage of canals by vegetation, especially in the summer season. The major problems reported by farmers at the tail end of irrigation systems were insufficient water and pollution from higher up the canal.
Farmer interpretations of what constitutes a “problem” is highly subjective and may be
Figure 15: Reported irrigation problems by position of farm on the system
Winter Spring Summer Autumn Total Canal bank
erosion24 69 79 4 176
Ineffective mirab 3 6 2 0 11
Theft of water
2 6 2 0 10
Canalpollution 37 62 53 6 158
Damage to structures
45 65 53 5 168
Insufficient water 64 110 152 30 356
Total 401 630 764 75

Water, Opium and Livestock: Findings from the First Year of Farm and Household Monitoring
23
linked to expectations and local farming practices. For example, WOL monitoring data indicates that while upstream farmers receive significantly more water than downstream, this difference is not reflected in local farmers’ perceptions of water scarcity. Likewise, although farmer labour on canal maintenance is significantly higher downstream than upstream, labour shortage was more frequently reported a problem in upstream areas.
Irrigation system maintenance4.3
During the first year of WOL studies, researchers found anecdotal evidence suggesting inequities in farmer contributions to irrigation system maintenance. Communities at the head of canals seemed to have little incentive to contribute labour to maintain the canal downstream from their own intakes. Thus, not only were tail-end farmers receiving less water than their upstream counterparts, but they had the strongest incentive to contribute labour along the entire length of the canal to ensure effective conveyance to their own land.25
WOL monitoring data provides empirical evidence for labour contributed to communal irrigation system maintenance. An average farmer from the sample (n=214) contributes approximately 37 days a year to maintaining canals or other community irrigation infrastructure. This total is exclusive of work maintaining his own system of gates and irrigation channels on-farm. This heavy labour requirement represents a major commitment of resources for most farmers. Moreover, these labour inputs are not required evenly throughout the year. At both irrigated lower catchment systems and semi-irrigated upper catchments, the peak demand for irrigation maintenance comes in the spring, the peak irrigation season, and diminishes thereafter (Figure 15). However, demand for labour appears to be more evenly spread through the year at sites where farmers irrigate from river valley canals. This is probably because irrigation continues for a longer period of the year.
The data indicates that on average, farmers at semi-irrigated sites contribute about 30 percent more labour to community irrigation maintenance (even if over a shorter period) than those at irrigated sites. This finding is consistent with the challenges of seasonal water scarcity at semi-irrigated sites and the need to exploit multiple sources
25 Lee, “Social Water Management.”
Figure 16: Seasonal inputs of labour into communal irrigation maintenance (n=80)

Afghanistan Research and Evaluation Unit
24
to maximise irrigation water access.
WOL monitoring data also clearly validates assumptions about inequities in the labour contributions made by upstream and downstream communities along irrigation systems (Table 7). With α=0.05, one way ANOVA confirms that farmer contribution to communal canal maintenance differs statistically according to farm position on irrigation system (F=5.43, p=0.005). Post hoc comparisons with the Tukey HSD test reveal that while labour at upstream farms differs from that at both midstream (p=0.030) and downstream (p=0.007), labour contributions to maintenance of irrigation at midstream and downstream farms does not differ significantly.
Among the WOL monitoring sample group, farmers at downstream locations contribute on average 24 days more labour each year than upstream farmers. Although there are generally higher labour inputs into irrigation maintenance at semi-irrigated sites, the overall dispersion of values is lower than at these sites, suggesting greater equity in labour inputs. The data therefore suggests that the largest inequities in labour contributions to irrigation maintenance (by farm position on the irrigation system) occur at rive valley (irrigated) sites.
Table 7: Mean seasonal labour contribution to irrigation maintenance by position in system
N Mean (days) Std. DevUpstream 79 7.32 6.56
Midstream 121 10.94 10.66
Downstream 60 13.64 13.08
Discussion4.4
WOL monitoring has provided empirical data to both corroborate (and in some cases challenge) the first year findings of WOL research and other widely held assumptions about irrigation systems in Afghanistan.
Monitoring data confirms that farmers at irrigated river valley sites receive a more consistent supply of water for irrigation than those in semi-irrigated areas. It also shows that at semi-irrigated sites farmers need to use more innovative and diversified strategies for accessing water, with a higher proportion of farmers drawing upon multiple water sources through the year. The challenge of accessing water under water-scarce conditions and through multiple infrastructures makes irrigation maintenance more labour-intensive in upper catchments.
While upper catchment systems are characterised by the greatest overall scarcity in water, the greatest differences in access to irrigation water is found in the irrigated river valleys. This is consistent with first-year findings that suggested the greatest inequities in water allocation occurred in long, low slope canal systems such as those found in river valleys. Furthermore, WOL monitoring during 2006 and 2007 provides clear corroborating evidence for inequities in water access according to position within an irrigation system; upstream farmers receive significantly more water than those situated downstream. Accordingly, data show that farmers at the lower end of irrigation systems are making significantly larger labour contributions to canal and system maintenance than those at the head of canals. This is also consistent with findings from the first year of WOL research.

Water, Opium and Livestock: Findings from the First Year of Farm and Household Monitoring
25
Access to irrigation water is found to correlate positively with cropping diversity, with the implication that inequitable allocations undermine farmers’ ability to increase livelihood security through diversification or engage with markets through the production of high-value licit crops. When considered in combination with the demonstrably heavier labour demands faced by downstream irrigators (and the opportunity costs of this) it is clear that structural inequities in access to water may profoundly affect agricultural productivity and livelihood security in farming households.
Finally, it is surprising that upstream farmers appear most critical of the institution of the mirab, and are most concerned about the illegal appropriation of water, since it is they who would appear to be the principal beneficiaries of recorded inequities in water distribution.

Afghanistan Research and Evaluation Unit
26
Cropping and Cultivation5.
Studies conducted during the first year of WOL research established a general cropping profile for each of the research sites,26 but there was no detailed examination of cropping systems. Nevertheless, findings indicated that inequity in access to natural resources was one of several factors affecting farmers’ cropping choices and consequently their ability to access markets with high-value crops.
These preliminary studies highlighted the necessity for a more detailed examination of farming practices to better understand farm economics at research sites. Key questions arising from the research included identifying the yields from and gross margins of production for crops under different conditions of production. This may help to determine best practices in farming.
Cropping and cultivation 5.1
Cropping patterns at individual research sites described in the first year baseline survey and in the second year of WOL monitoring were found to be similar (with the notable exception of poppy cultivation). Winter and summer cropping patterns from 2006 are summarised in Annex 1.
Overall, the data shows that the most diverse cropping is undertaken at irrigated river valley farms. Cropping patterns are consistent with the observation that farmers tend to cultivate food staples for household consumption before diversifying to higher-value crops for market supply. It is therefore safe to assume that sites with high crop diversity will have the greatest engagement with (licit) markets. At most sites, licit high-value crops account for a relatively small proportion of the cultivated area. The principal exception to this are the sites in Ghazni along the Jaghatoo river, where fruit orchards are the dominant form of land use. With good access to irrigation water, farmers there are able to maintain orchards and simultaneously intercrop with food staples or fodder crops for household consumption.
Many high-value crops at irrigated river valley sites are grown as part of a second annual crop (albeit on a reduced land area due to water scarcity). Summer cultivation is rare at semi-irrigated sites and impossible at rainfed sites unless they have access to some spring water. A discernable trend in cultivation at many irrigated sites is for cereals and food staples to be cultivated predominantly through the winter and cash crops to be planted in the second growing season.
Monitoring data from 2006 reveals an expansion and intensification of opium poppy cultivation across research sites in Nangarhar and its introduction to a site in Herat. Poppy in upper Achin district intensified from a 2005 maximum of 36 percent of cultivated area (Othar Khel) to totals of 100 percent and 89 percent (for Khawaji and Othar Khel respectively).
Fallowing land 5.2
Farm-monitoring data do not reveal whether agricultural land left uncultivated is being left purposely fallow because the farmer cannot afford the expense of agricultural inputs
26 See A. Fitzherbert, “Water Management Livestock and the Opium Economy: Livestock Husbandry” (K -bul: Afghanistan Research and Evaluation Unit, 2006); and also Roe, “Baseline Survey.”

Water, Opium and Livestock: Findings from the First Year of Farm and Household Monitoring
27
or because water is insufficient to irrigate his entire land holdings. However, WOL farmers reported “fallowing” approximately a quarter to a third of recorded cultivated area. The proportion of uncultivated land to cultivated rises in the autumn, consistent with the period of water scarcity. Monitoring data also show that fallowing was reported most widely at semi-irrigated sites, lending weight to the hypothesis that farmer’s choice to leave land uncultivated has more to do with water (or other resource scarcity) than an intention to manage land resources sustainably.
Crop inputs5.3
WOL monitoring identifies four major inputs into cropping systems. These are purchased seeds, fertiliser and pesticide treatments, land preparation and labour. WOL monitoring recorded the manner in which farmers made each of these inputs for various crops throughout the year, and also recorded prices of the necessary materials in each case.
Preliminary inspection of recorded seeding rates for some important field crops indicates that many crops are not being seeded to appropriate levels. The apparent under-seeding of several field crops is perhaps easier to understand than the over-seeding of sugar cane and onion (Table 8 over page)
The principle chemical fertilisers Afghan farmers use are DAP (Di Ammonium Phosphate), which has a 50 percent phosphorous content, and urea, with a 46 percent nitrogen content. Although potassium fertilisers (such as a potassium chloride) are recommended for optimal management of many varieties of crop, farmers participating in the monitoring did not report using these. There is also widespread use of livestock manure as an organic fertiliser.
Monitoring results indicate that farmer application of chemical fertilisers is almost wholly restricted to irrigated lands. Rates of chemical fertiliser application are highly varied, with the greatest inputs being allocated to the highest-value crops, and in some cases exceeding recommended levels of application (Table 9 over page).
Figure 17: Proportion of cultivated to uncultivated agricultural lands, 2006

Afghanistan Research and Evaluation Unit
28
Table 8: Recorded seed rates for some important field crops
Mean seed rate kg/hectare (Std Dev)
Crop N Irrigated Rainfed Recommended kg/hectare
Wheat 185 39.47 (13.84) 38.66 (124.55) 25-100
Barley 114 27.05 (15.93) 21.30 (10.82) 25-100
Maize 31 16.38 (9.32) 35-50
Poppy 7 31.46 (70.32) 1.4 7.5
Chick pea 26 6.25 11.05 (9.22) 50-100
Sesame 23 1.56 (0.60) 6-10
Pea 6 31 (22.59) 8 80-120
Cotton 13 8.61 (3.17) 7 10-12
Potato 50 301.72 (197.33) 250 (212.13) 1000-1500
Onion 17 193.36 (330.50) 45.09 (86.63) 6-8
Sugarcane 13 867.31 (616.73) 5-80
Alfalfa 109 6.97 (6.18) 11.40 (8.05) 25-30
Melon 12 0.76 (0.29) 0.75 (0.35) 0.5-1
Table 9: Fertiliser application rates for some important crops
N Urea kg/hectare (Std Dev)
DAP kg/hectare (Std Dev)
Recommended kg/hectare
Wheat 133 174.84 (324.87) 102.10 (100.86) 200:125
Barley 33 172.94 (133.46) 121.44 (91.30) 200:125
Apple 19 276.47 (164.46) 240.94 (179.58) 10:0
Plum 60 237.98 (149.34) 77.71 (129.41) 30:0
Potato 32 361.28 (407.40) 355.26 (377.64) 70:120
Onion 5 123.83 (69.12) 10.91 (38.19) 45:125
Sesame 11 118.07 (73.43) 127.78 (107.15) 65:125
Rice 13 275.37 (198.75) 176.28 (108.16) 90:125
Poppy 12 230.11 (160.17) 214.67 (138.54)
Sugarcane 13 382.78 (387.05) 223.06 (173.18) 500:250
Alfalfa 117 218.79 (167.71) 116.64 (137.12) 120:100
A good example of this variation in fertiliser application can be seen in the management of fruit orchards. Most farmers at research sites reported fertilising their orchards annually with equal quantities of nitrogen (urea) and phosphorous (DAP) fertilisers. However, it is generally acknowledged that after establishment, apple and stone fruit trees require only limited annual fertilisation, and indeed phosphorus may even harm crops if over-applied.27 Moreover, farmers do not apply potassium fertilisers that, depending on local soil conditions, might benefit the trees.
27 Christoph Kessel, “Fertilizing Stone Fruit (Peaches, Plums, Nectarines, Apricots, Cherries) and Pears,” http://www.omafra.gov.on.ca/english/crops/facts/tender_fert.htm, accessed 19 April 2009.

Water, Opium and Livestock: Findings from the First Year of Farm and Household Monitoring
29
Available evidence therefore suggests farmers may be maximising the use of chemical fertilisers in the expectation of increased yields without consideration of soil management and sustainability. The timing of crop fertiliser inputs varies according to the type of crop and the season of its cultivation. Paddy, for example, is only fertilised by farmers prior to planting in the spring, and perennial orchards are also fertilised just once, also during the spring. By contrast, land cultivated with cereal crops is normally treated with phosphorous (DAP) and a little nitrogen (urea) at time of planting, with continuing inputs of urea through the early growth of the crop. This management is consistent with recommended practice, even if the actual quantities of fertiliser applied by farmers is not. Some cereal, vegetable and fodder crops are cultivated in winter at some research sites and during the summer at others, hence the wide recorded distribution of inputs throughout the year (Figure 17).
Many of the higher-value crops grown by farmers in the WOL monitoring group are cultivated at irrigated sites during the second summer cultivation season. Accordingly, the peak for fertiliser inputs occurs when these crops are planted in the spring and, in the case of sugarcane, into the summer.
Monitoring data suggest that farmers’ use of herbicides and pesticides is largely restricted to perennial high-value crops (particularly orchards), which are treated in the spring before bearing fruit.
WOL farmers either utilise their own farm resources for ploughing or hire traction for land preparation off-farm. However, only a small proportion of farmers (18 percent) reported hiring traction. Even though WOL farmers normally invest most heavily in their higher-value crops this does not appear to hold true for ploughing, possibly because the area of land under high value crops is relatively small and so does not require hire of a tractor. The major use of hired traction was in preparation of land for rainfed winter
Figure 18: Seasonal timing for chemical fertilisation

Afghanistan Research and Evaluation Unit
30
wheat (mean 6.3 hours, Std Dev 9.29) and irrigated poppy (7.58 hours, Std Dev 13.61). Traction was also commonly hired for the irrigated summer cereals: barley, maize, millet and rainfed pulses such as chickpeas.
Additional workers are hired from outside the household when demand exceeds the household’s own labour capacity. Among the WOL monitoring farmers, demand for hired labour falls into two general categories: for land preparation and the harvesting of large areas of relatively low-value crops (often rainfed) or intensive management inputs into smaller areas of high-value crops.
An example of the former would be a farmer cultivating several hectares of rainfed wheat. When ripe the large area may need to be harvested and threshed quickly, which may exceed the labour capacity of the household. Higher-value crops may require more intensive management through their growth cycle (e.g. successive fertilser treatments, weeding, pruning and drying or processing post harvest). Examples of labour-intensive crops include poppy and orchard cultivation. When intensive labour inputs are required, even relatively small areas of these crops may require the seasonal hire of labour from outside the household.
At irrigated and semi-irrigated research sites, the peak period for hire of agricultural labour comes during the spring months of March, April and May. This encompasses the start of the main (winter crop) harvest and also the preparation of land for sowing the second crop. There is a particular demand for labour in orchards, where workers are needed to weed, prune and apply fertilser and pesticide. These demands for labour also coincide with peak labour inputs into livestock management and irrigation maintenance. On rainfed land, peak use of hired labour occurs earlier during the winter months, and is proportionately higher than at irrigated sites. At sites growing poppy, labour markets are dominated by the demand for crop management and harvest of opium. Otherwise there is little reported use of hired labour at semi-irrigated sites because cultivated areas tend to be very small.
Of all cultivated crops at WOL research sites, poppy receives the largest inputs of hired labour. Farmers’ reports suggest that they hire from 60 to 120 days of labour per hectare
Figure 19: Seasonal demand for hired labour for cropping (exclusive of poppy)

Water, Opium and Livestock: Findings from the First Year of Farm and Household Monitoring
31
annually, depending on the area of land under poppy cultivation and the size of the domestic labour pool.
All licit crops are less labour-intensive than poppy, with high-value horticultural and industrial crops accounting for between about ten and 15 days of hired labour per hectare. There is even less use of hired labour on food crops and staples (Table 10), except to assist in the harvest of large areas.
Table 10: Hired labour inputs by crop
n Hired labour (Total days)
Cultivated area (Ha)
Days/hectare
Wheat 152 1713 471 3.63
Barley 75 406 101.6 3.99
Apple 60 248 26.9 9.2
Plum 81 324 28.2 11.48
Maize 38 81 21.8 3.71
Cotton 11 49 8.2 5.97
Potato 50 267 21.6 11.85
Onion 5 542 45.4 11.9
Sugar cane 12 59 4.2 14.04
Alfalfa 87 46 27.8 1.65
Crop yields5.4
Farm monitoring data indicate that crop yields vary widely according to agro-ecological conditions of cultivation and farmer management inputs. In 2006 many farmers experienced low yields, especially for some high-value industrial and cash crops. This was consistent with the unfavourable growing conditions and water scarcity experienced in many areas that year.
Of the cereal crops, maize, which requires summer irrigation, experienced a very poor harvest, while wheat, barley and rice achieved quite reasonable yields compared to previous years.28 Yields from irrigated fodder crops such as alfalfa were quite good while farmers reported very poor yields from irrigated cotton, rainfed pulse and oilseed crops.
Overall, first year results from WOL monitoring suggest that Afghan farms are producing yields well below the potential for most crops cultivated,29 with the implication that management improvements could achieve further increases in productivity (Table 11).
WOL monitoring data has produced empirical evidence that monitored farms and sites in the upper parts of irrigation systems tend to receive a greater share of irrigation water than those further down (Section 3.1). The impact of this on farm yields is here considered with reference to the specific context of the Jaghatu River in Ghazni. The
28 Data on crop yields 2000-05 cited in Islamic Republic of Afghanistan’s Central Statistics Office, Afghan -stan Statistical Yearbook 2006, (Kabul: Central Statistics Office, 2006.)
29 Reported yields from WOL monitoring farms during 2006 were very much lower than those regularly achieved by farmers elsewhere in South Asia.

Afghanistan Research and Evaluation Unit
32
Jaghatu was selected because it is the only monitored area that allows comparison of crop yields at three sites along the length of the same water channel.
Table 11: Farmer reported yields for important crops (2006)
Crop Type NMean yield Kg/hectare (Std Dev)Irrigated Rainfed
Wheat 116 1792.9 (1749.88) 1411.10 (6269.18)
Barley 58 1685.5 (834.61) 803.21 (1013.32)
Maize 9 527.8 (204.32)
Rice 15 1902.4 (987.30)
Apple 4 5570 (3197.07)
Plum 9 1285 (580.20)
Sugarcane 3 27222 (40285.21)
Cotton 5 649.8 (182.31)
Poppy 15 26.90 (19.86)
Potato 20 6250 (8700.73)
Onion 4 4625 (3637.19)
Melon 4 4534.4 (5063.81)
Cucumber 4 6500 (2380.47)
Alfalfa 37 2675.7 (4864.35)
Many villages lie along the Jaghatu Valley, extracting water from the stream to irrigate a range of cereal, horticultural and high-value orchard crops. Table 12 compares mean yields for wheat (and seed rates) from farms at Chechel Gunbad, Turmai and Qala-i-Naw, situated at different positions along the stream.
Table 12: Reported mean wheat yields from sites along the Jaghatu stream, Ghazni
Site Distance from source (Km)
Mean Wheat yield (Kg/Ha) Std. Dev Seed rate
(Kg/Ha)C. Gunbad 3.91 2135 982.70 154
Turmai 8.81 1340.83 1465.77 216
Qala-i-Naw 15.05 1197.78 1092.02 232
Data show that in 2006, the highest mean yield for wheat was achieved at Chechel Gunbad, lying closest to the head of the stream. At Turmai and Qala-i-Naw, lying further downstream, farmers only achieved mean yields of 62 percent and 56 percent of this amount respectively. These differences in yield did not stem from differences in seed rates since the lowest seed rate was practiced upstream, and fertiliser application downstream was almost double that upstream. This evidence from the Jaghatu river is indicative of a trend towards higher yields at upstream farm sites and possibly lower input costs.
However, this trend is not unqualified, for with alpha set to 0.05, differences in yields were not proven to be statistically significant (ANOVA F=0.769, p=0.492).

Water, Opium and Livestock: Findings from the First Year of Farm and Household Monitoring
33
Gross margins for crop production5.5
Indicative gross margin calculations based upon 2006 data are set out in Annex 2. Due to the water scarcity experienced by farmers during the summer and autumn of 2006, gross margins for that year were to some extent atypical. However, the data provide a point of reference for comparing the relative gross margins for different crops. Of the licit crops, it is those generally regarded as being of higher value that generate the most income per hectare (Figure 19). Perhaps a more instructive way of reviewing crop performance is by considering revenues relative to farmer investment.
In 2006, melon crops flourished with very limited agricultural inputs, thus producing an excellent investment to return ratio. Potato and onion also achieved good returns on farmer investment, as did rice and orchard fruits. By contrast, 2006 was a bad year for the cultivation of summer maize, and even though alfalfa yields were quite good, high expenditure on inputs and low prices resulted in a poor investment to return ratio (Figure 20).
Thus, while in 2006 poppy produced the highest gross margin per hectare, it did not give the best rate of return against dollar investment. Apple, rice, plum, onion and melon all returned higher values relative to initial expenditure. However, with the exception of melon, each of these licit crops depend upon preferential access to irrigation water and other resources.
Perennial orchards, providing some of the best returns against investment, require irrigations throughout the year, something that is not always possible even in seasonally well-irrigated lands. Rice also produces good relative returns, but paddy requires heavy irrigation through the summer period of scarcity and so the cultivation of this crop is generally restricted to lands with the best access to irrigation water. Likewise, sugarcane requires frequent irrigations through the summer growing season. Farmers without secure access to summer irrigation water are therefore restricted to crops offering lower net returns.
Findings from WOL monitoring therefore show that crops offering the best returns to farmers usually have high “entry requirements,” either taking the form of natural
Figure 20: Gross margins of production per hectare for farm crops (2006)
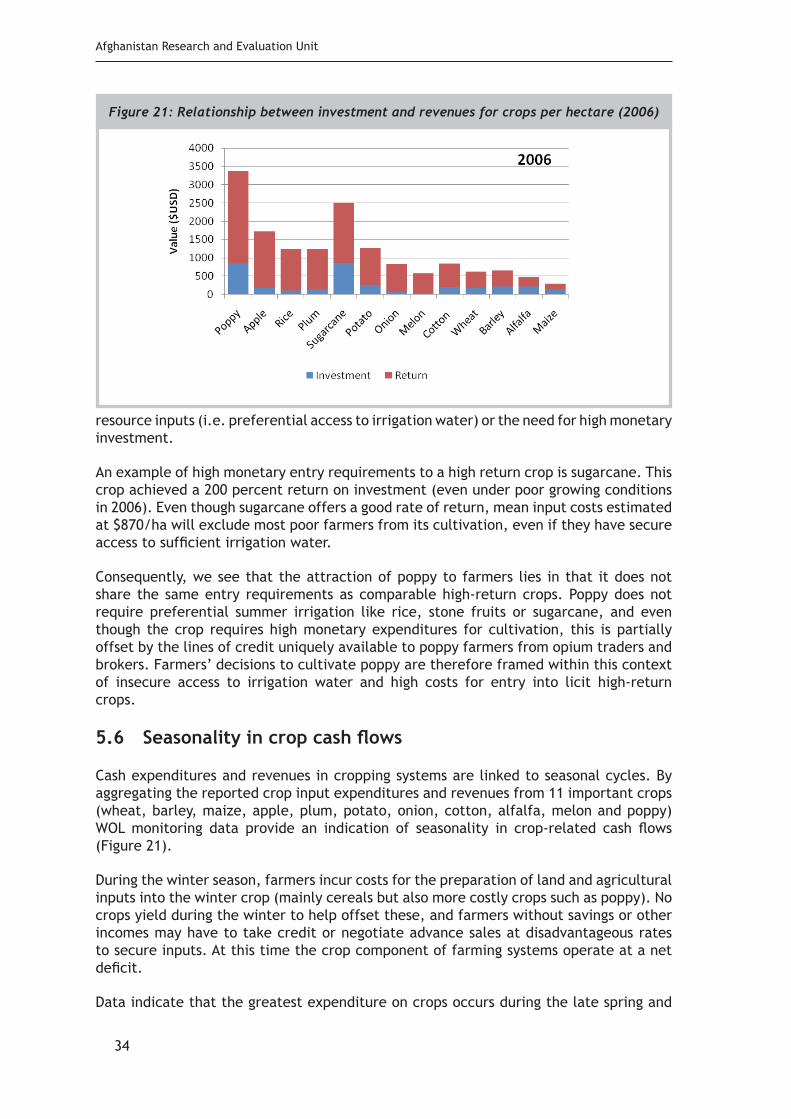
Afghanistan Research and Evaluation Unit
34
resource inputs (i.e. preferential access to irrigation water) or the need for high monetary investment.
An example of high monetary entry requirements to a high return crop is sugarcane. This crop achieved a 200 percent return on investment (even under poor growing conditions in 2006). Even though sugarcane offers a good rate of return, mean input costs estimated at $870/ha will exclude most poor farmers from its cultivation, even if they have secure access to sufficient irrigation water.
Consequently, we see that the attraction of poppy to farmers lies in that it does not share the same entry requirements as comparable high-return crops. Poppy does not require preferential summer irrigation like rice, stone fruits or sugarcane, and even though the crop requires high monetary expenditures for cultivation, this is partially offset by the lines of credit uniquely available to poppy farmers from opium traders and brokers. Farmers’ decisions to cultivate poppy are therefore framed within this context of insecure access to irrigation water and high costs for entry into licit high-return crops.
Seasonality in crop cash flows 5.6
Cash expenditures and revenues in cropping systems are linked to seasonal cycles. By aggregating the reported crop input expenditures and revenues from 11 important crops (wheat, barley, maize, apple, plum, potato, onion, cotton, alfalfa, melon and poppy) WOL monitoring data provide an indication of seasonality in crop-related cash flows (Figure 21).
During the winter season, farmers incur costs for the preparation of land and agricultural inputs into the winter crop (mainly cereals but also more costly crops such as poppy). No crops yield during the winter to help offset these, and farmers without savings or other incomes may have to take credit or negotiate advance sales at disadvantageous rates to secure inputs. At this time the crop component of farming systems operate at a net deficit.
Data indicate that the greatest expenditure on crops occurs during the late spring and
Figure 21: Relationship between investment and revenues for crops per hectare (2006)

Water, Opium and Livestock: Findings from the First Year of Farm and Household Monitoring
35
early summer, as winter crops are harvested. In areas where a second crop is possible, land must also be prepared for summer crops. WOL monitoring data suggest that spring and summer are also the seasons with the highest value of crop production. Although a larger area is cultivated through the winter (with the exception of poppy and some vegetables) this tends to be planted with lower-value staple crops. Consequently, it is summer crops that are most important for generating cash revenues. Not all farmers will necessarily sell at harvest; those with the resources to do so may store crops for later sale when market prices may be higher. Nevertheless, available WOL monitoring data show potential crop revenues during the spring and summer exceed expenditures.
Other than harvesting the last of the summer crops and preparations for the first of the winter crops, farmers make proportionately few inputs during the autumn season.
Discussion 5.7
WOL monitoring of crop management and production at 214 participating farms provides some important insights into the functioning of farming systems. Nevertheless, findings about agricultural practices from the 2006 monitoring data should be treated with caution because the year was in many respects atypical.
Data show that in areas where two cultivation seasons are possible, farmers mainly cultivate food staples through the winter and switch to higher-value crops (albeit on a reduced land area) for the summer season. Consequently, it is the summer (when water resources are scarce and inequities exacerbated) when many farms produce predominantly for market supply. This cycle of production is associated with a cash flow in which the major crop revenues are received in late summer and the major cropping expenses occur the previous season following two seasons of no or limited crop incomes. Poppy is one of a few winter crops grown predominantly for sale and thus holds the potential to smooth farm cash flows during periods of cash scarcity.
Evidence shows that in good years it may be possible to achieve good gross margins from the cultivation of cash crops (notably melon) under water-scarce or rainfed conditions. While rainfed and semi-irrigated farming have hitherto attracted little interest among those trying to stimulate agri-business in Afghanistan, this evidence of their productivity
Figure 22: Aggregate cash flows for 11 important farm crops (2006)

Afghanistan Research and Evaluation Unit
36
may inspire greater consideration of these methods.
WOL monitoring highlights possible sub-optimal management practices for some crops. For example, there seems to be a widespread perception among farmers that increasing chemical fertiliser applications will increase crop yields. Consequently we see that fertiliser applications are directed to higher-value crops sometimes in excess of requirements. This may leave considerable room for improvement in crop husbandry and shows the importance of extension, awareness-raising and education on crop management to ensure best-practices and sustainability in cultivation. There is a clear need for further study of crop-management practices to identify the effectiveness of current cropping systems.
Even taking into account the impact of water scarcity in 2006, monitoring data demonstrates that crop yields at monitored farms were well below yields achieved in neighbouring countries and far below potential. This suggests that crop management improvements may have the potential to increase productivity. Given the limited irrigable land resources in Afghanistan, increasing crop production to meet demand will likely depend on making more productive use of existing resources. WOL monitoring highlights the need for careful study of current cropping practices to determine how these can be improved.
Data further show that high-value crops have comparatively high entry thresholds in terms of both access to water resources and cash investment into inputs. While farmers with access to the best-irrigated lands have opportunity to cultivate crops bringing high net returns, the majority of farmers will be excluded from this possibility unless they grow an illicit crop. The research team also noted the impact of resource inequity in the cultivation of a crop along a waterway in Ghazni. Consistent with recorded inequities in irrigation water supply, WOL monitoring shows that upstream farmers may be able to produce up to 50 percent greater yields than those downstream along the same waterway.
In the face of these structural and resource inequities, the cultivation of opium poppy appears to be a strategy that farmers in semi-irrigated areas employ in an attempt to achieve comparable revenues from their land as the resource-wealthier farmers in irrigated river valleys.

Water, Opium and Livestock: Findings from the First Year of Farm and Household Monitoring
37
Livestock Production Systems6.
Studies conducted during the first year of WOL research highlighted the major features of livestock-production systems as practiced at research sites. Research characterised cattle ownership as serving primarily subsistence functions (dairy production for domestic consumption and farm traction in the case of bullocks). By contrast, sheep and goat herding was found to combine production for domestic supply with supply to markets and monetary values. Similarly, the management of cattle was mainly on-farm, with cows heavily reliant on cultivated fodder crops for feed, while sheep and goats made greater use of extensive grazing and pastures off-farm. Nevertheless, all livestock were found to be ultimately dependent on stored fodder through the winter months, which accounted for a major limitation upon production. Studies further indicated that production from livestock was well below potential for the breeds and that this was related to farmer practice of minimising production inputs to reduce costs. Researchers also found that farmer cash scarcity at key junctures in the productive cycle was preventing investment that could have improved offtake.
These studies highlighted potential problems in livestock production while emphasising the integrity of livestock for many types of farm production and their contribution to rural livelihoods. Key questions arose from the first year of WOL studies:
What is the productive performance of livestock under Afghan farm management?•
How do gross margins for production compare with other crops, land use and • production activities? What does this suggest about the allocation of cultivable land for fodder production?
Which forms of livestock production have the strongest potential for development • towards competitive market supply?
Herd and flock structures 6.1
WOL farm monitoring data facilitate the preliminary exploration of herd structures under different conditions of production. Research can provide important indicators for the
Figure 23: Cattle population structure

Afghanistan Research and Evaluation Unit
38
production objectives of farmers and their methods of managing the animals. As these livestock holdings change through time, the data on sedentary herd structures describe them as recorded in autumn 2006.
At that time a total of 390 cattle were owned by WOL monitoring group farmers, suggesting a mean ownership of about 1.8 animals per household. This is broadly consistent with the results of the previous year’s baseline survey,30 which recorded a mean ownership of 1.5 cattle per household (Std Dev 1.760). As determined by the baseline survey, the largest mean cattle holdings are at rainfed sites, with lower mean holdings recorded in irrigated sites and still lower at semi-irrigated sites. The recorded cattle population structure (with bulls and oxen constituting 27 percent of the adult herd) is unusual and indicative of the continuing importance of the animals for farm traction. This would appear to be particularly the case at remote rainfed sites where oxen were reported to constitute up to 45 percent of the cattle population. In contrast, at semi-irrigated sites bulls and oxen constitute only seven percent of the adult herd, suggesting that animal traction may be less important there. Parity in the ratio of male to female yearlings suggests that sales of male calves does not occur until into their second year (Figure 23).
The WOL farm monitoring group included a total of 1,463 sheep and goats, suggesting an average ownership of 6.8 animals. This indicates some herd growth since the previous year’s baseline survey, when a mean of 5.65 (Std Dev 11.313) was recorded for sedentary flocks.
Reported flock structures are interesting in several respects. Among the whole population of animals at all sedentary research sites and land types, there is approximate parity in sheep and goat numbers. This is consistent with a discernible trend in published statistics for a diminishing sheep-to-goat ratio, where previously sheep vastly outnumbered goats.31 In Afghanistan, sheep command higher monetary values, and so growing parity in sheep and goat numbers suggests herds are not structured to generate optimal monetary
30 First year survey findings are further discussed in Roe, Natural Resources Management.
31 In the early 1980s, goats constituted only about 13 percent of the national flock. See Central Statistic Office, “Afghan Statistical Yearbook 2006.”
Figure 24: Sheep and goat population structure (sedentary herders only)
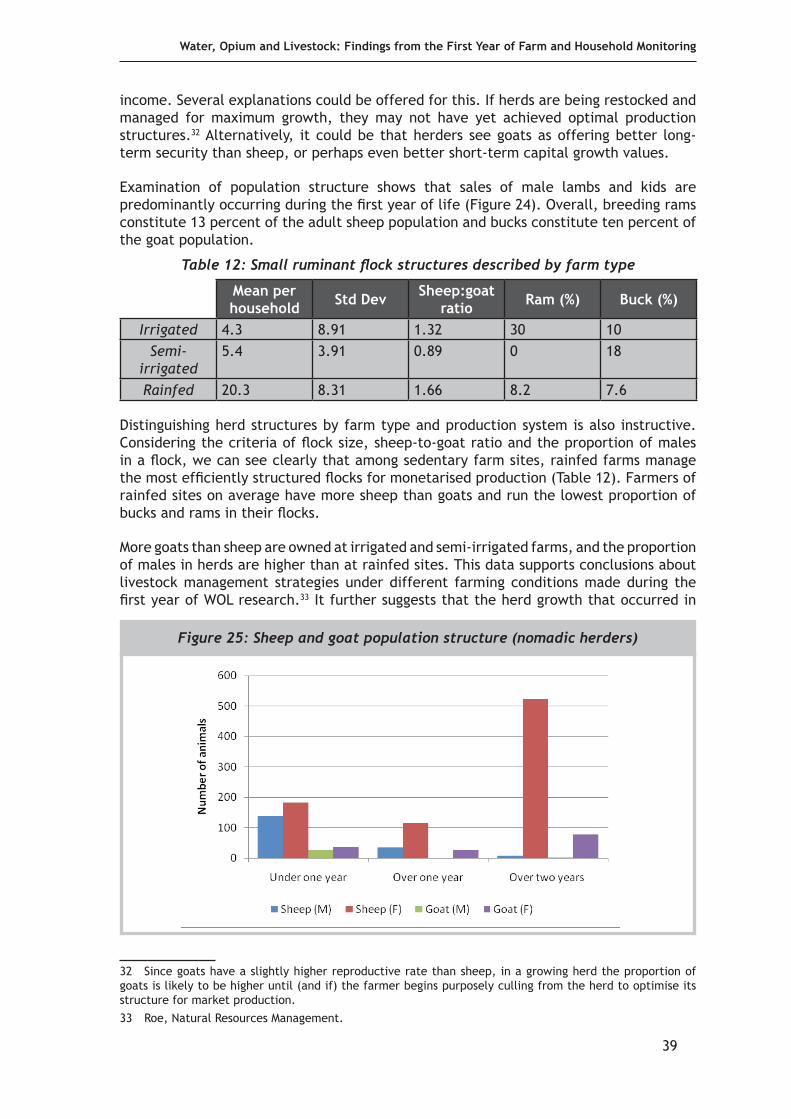
Water, Opium and Livestock: Findings from the First Year of Farm and Household Monitoring
39
income. Several explanations could be offered for this. If herds are being restocked and managed for maximum growth, they may not have yet achieved optimal production structures.32 Alternatively, it could be that herders see goats as offering better long-term security than sheep, or perhaps even better short-term capital growth values.
Examination of population structure shows that sales of male lambs and kids are predominantly occurring during the first year of life (Figure 24). Overall, breeding rams constitute 13 percent of the adult sheep population and bucks constitute ten percent of the goat population.
Table 12: Small ruminant flock structures described by farm type
Mean per household Std Dev Sheep:goat
ratio Ram (%) Buck (%)
Irrigated 4.3 8.91 1.32 30 10Semi-
irrigated 5.4 3.91 0.89 0 18
Rainfed 20.3 8.31 1.66 8.2 7.6
Distinguishing herd structures by farm type and production system is also instructive. Considering the criteria of flock size, sheep-to-goat ratio and the proportion of males in a flock, we can see clearly that among sedentary farm sites, rainfed farms manage the most efficiently structured flocks for monetarised production (Table 12). Farmers of rainfed sites on average have more sheep than goats and run the lowest proportion of bucks and rams in their flocks.
More goats than sheep are owned at irrigated and semi-irrigated farms, and the proportion of males in herds are higher than at rainfed sites. This data supports conclusions about livestock management strategies under different farming conditions made during the first year of WOL research.33 It further suggests that the herd growth that occurred in
32 Since goats have a slightly higher reproductive rate than sheep, in a growing herd the proportion of goats is likely to be higher until (and if) the farmer begins purposely culling from the herd to optimise its structure for market production.
33 Roe, Natural Resources Management.
Figure 25: Sheep and goat population structure (nomadic herders)

Afghanistan Research and Evaluation Unit
40
small ruminant populations during the 18 months following the WOL baseline survey was greatest at rainfed sites.
Unfortunately, directly comparable (autumn) data from herds managed by the nomadic Kutub Khel and Khomari Khel could not be collected, owing to security problems in Laghman province at that time. The closest comparable data were collected during the previous (summer) season.
Under nomadic management, sales of male lambs and kids mainly occurs during their first year of life, although some male yearlings are carried over into their second year for sale at a higher weight (Figure 24). Otherwise, flock structures under the management of Khomari Khel and Kutub Khel differ from those under sedentary management. In the first instance, nomadic flocks demonstrate a much higher sheep-to-goat ratio. Furthermore, both nomadic communities appear to maintain much lower numbers of breeding males in flocks, suggesting that pastoralists may prioritise productivity and off-take over herd security (Table 13). Together with the evidence of larger herd sizes, the data appear to confirm that herds under nomadic management are most effectively structured for commercial production and market supply.
Further indications of herder production goals come from flock inventories. An overview of small ruminant herd entries and exits at sedentary research sites shows clearly that births accounted for the most entries into flocks, overwhelmingly during the late winter and spring seasons. Purchases of new stock for herd growth or investment occurs in any season accept autumn (possibly to avoid the high cost of winter feeding).
Table 13: Small ruminant flock structures by nomadic community
Mean per household Std Dev Sheep:goat
ratio Ram (%) Buck (%)
Khomari Khel
31.6 11.20 2.23 0 3.5
Kutub Khel 79.5 45.67 13 2 0Nomadic
mean53.36 31.77 5.78 1.5 2.6
Deaths are spread relatively evenly through the year, with slight peaks reported during the winter (due to weather or feed scarcity) and spring (coincident with lambing, kidding and neo-natal losses). The majority of exits from herds occur as sales (of male kids and lambs but also older females) during the summer (Figure 26).
Comparing between the different types of farm, a high proportion of sheep and goats (overwhelmingly male lambs) were purchased into irrigated farm herds (38 percent). This suggests that farmers at these sites may purchase animals for fattening with farm grown fodder and crop by-products. At semi-irrigated farms, a much smaller proportion of lambs are purchased (12 percent), and at rainfed sites more than 90 percent of reported lambs and kids were born into farmers’ flocks. Nomad flocks are almost wholly stocked by lamb births with extremely few purchases.
With respect to reported losses from death all farm types report report between six to ten percent mortality, with irrigated farms reporting the highest number of deaths The lowest reported number of deaths (4 percent) is reported from flocks under nomadic management. Changes in herd inventories by farm type during 2006 are given in Annex 3.

Water, Opium and Livestock: Findings from the First Year of Farm and Household Monitoring
41
Management inputs6.2
WOL monitoring recorded data on three key livestock management inputs: veterinary services, feed and hired labour (shepherding). Each of these areas of management were identified and described in overview during the first year of WOL studies.
With respect to animal health, the first year studies identified farmer concerns about animal disease status and the accessibility of veterinary services. WOL monitoring now provides an opportunity for more detailed review of how farmers use veterinary medicines and treatment.
Reported veterinary interventions included vaccination, treatment with antibiotics, treatment for internal and external parasites, and artificial insemination. In some cases farmers diagnose and treat, but more commonly they seek the opinion and treatment of a pharmacist or veterinarian at a Veterinary Field Unit. Accordingly, in many cases farmers are unable to name the specific disease or condition for which veterinary
Figure 26: Entries and exits from monitored sedentary sheep and goat herds
Figure 27: Frequency of reported veterinary treatments (sedentary farmers)
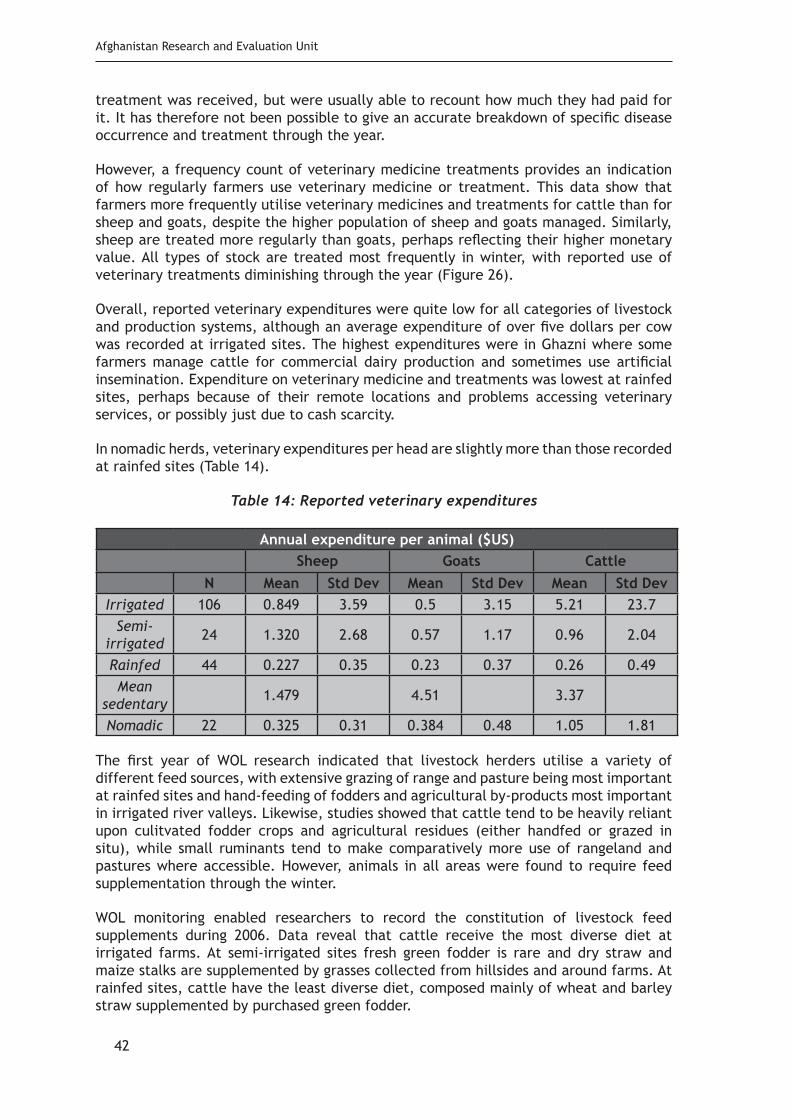
Afghanistan Research and Evaluation Unit
42
treatment was received, but were usually able to recount how much they had paid for it. It has therefore not been possible to give an accurate breakdown of specific disease occurrence and treatment through the year.
However, a frequency count of veterinary medicine treatments provides an indication of how regularly farmers use veterinary medicine or treatment. This data show that farmers more frequently utilise veterinary medicines and treatments for cattle than for sheep and goats, despite the higher population of sheep and goats managed. Similarly, sheep are treated more regularly than goats, perhaps reflecting their higher monetary value. All types of stock are treated most frequently in winter, with reported use of veterinary treatments diminishing through the year (Figure 26).
Overall, reported veterinary expenditures were quite low for all categories of livestock and production systems, although an average expenditure of over five dollars per cow was recorded at irrigated sites. The highest expenditures were in Ghazni where some farmers manage cattle for commercial dairy production and sometimes use artificial insemination. Expenditure on veterinary medicine and treatments was lowest at rainfed sites, perhaps because of their remote locations and problems accessing veterinary services, or possibly just due to cash scarcity.
In nomadic herds, veterinary expenditures per head are slightly more than those recorded at rainfed sites (Table 14).
Table 14: Reported veterinary expenditures
Annual expenditure per animal ($US)Sheep Goats Cattle
N Mean Std Dev Mean Std Dev Mean Std DevIrrigated 106 0.849 3.59 0.5 3.15 5.21 23.7
Semi-irrigated 24 1.320 2.68 0.57 1.17 0.96 2.04
Rainfed 44 0.227 0.35 0.23 0.37 0.26 0.49Mean
sedentary 1.479 4.51 3.37
Nomadic 22 0.325 0.31 0.384 0.48 1.05 1.81
The first year of WOL research indicated that livestock herders utilise a variety of different feed sources, with extensive grazing of range and pasture being most important at rainfed sites and hand-feeding of fodders and agricultural by-products most important in irrigated river valleys. Likewise, studies showed that cattle tend to be heavily reliant upon culitvated fodder crops and agricultural residues (either handfed or grazed in situ), while small ruminants tend to make comparatively more use of rangeland and pastures where accessible. However, animals in all areas were found to require feed supplementation through the winter.
WOL monitoring enabled researchers to record the constitution of livestock feed supplements during 2006. Data reveal that cattle receive the most diverse diet at irrigated farms. At semi-irrigated sites fresh green fodder is rare and dry straw and maize stalks are supplemented by grasses collected from hillsides and around farms. At rainfed sites, cattle have the least diverse diet, composed mainly of wheat and barley straw supplemented by purchased green fodder.

Water, Opium and Livestock: Findings from the First Year of Farm and Household Monitoring
43
There is a similar overall pattern in the data for sheep and goats, with irrigated and semi-irrigated farms offering the most diverse diets, by utilising residues and fodder crops as well as purchased feeds. Supplementary feeding at semi-irrigated sites is less diverse and at rainfed sites largely comprises dry straw, maize and thorns, with only limited purchased green fodder.
Sheep and goat herds managed by Khomari Khel and Kutub Khel nomads are offered much less feed supplementation than those under other types of management (both in terms of diversity and quantity of reported feed supplements). Nomads report offering 0.1 kg daily per head in the autumn and 0.2 kg in winter, while flocks graze in the Laghman and Nangarhar lowlands. This supplementation consists of green fodders, some stale bread, maize, straw and some hand-collected leaves and thorns.
Farmer reports suggest that the most rations and supplements are offered to sheep and goats through the winter (during pregnancy and when housed in stalls) and spring (with the onset of lactation). Rations for cattle show less intra-annual variation because they are predominantly stall managed through the year, but highest rations are offered during early lactation in spring and summer (see Annex 4).
To clarify the role of farm-produced fodders and residues within different systems of livestock management, WOL monitoring recorded the origin of feed supplements offered to livestock, with a focus on fresh green fodders (alfalfa and clover) and straw. Green fodders and straw comprise the two major categories of feed supplement (Annex 4). Monitoring showed that on-farm cultivation accounts for approximately two-thirds of the green fodder and dry straw offered to livestock at irrigated farm sites. In contrast, farmers of rainfed land must purchase all the green fodders they offer to livestock, but most produce sufficient straw to meet livestock demands (Figure 27). Khomari and Kutub Khel nomads without cultivated land must purchase all feed supplements.
At reported levels of use for irrigated sites, farm-cultivated green fodder has a mean monetary value of about US $103 per cow annually. The monetary value of green fodder in production is generally lower for other types of land and other species of livestock. The monetary value of farm-cultivated straw is greatest at rainfed farming sites, representing an estimated mean of $10.5 per sheep or goat annually.
Figure 28: Importance of farm-cultivated fodder in livestock production

Afghanistan Research and Evaluation Unit
44
These findings show that farm-cultivated fodder constitutes an important production input for livestock in sedentary production systems. Nevertheless, nearly all livestock owners report purchasing some livestock feed (in addition to that produced on-farm, grazed or collected from surrounding rangelands). Reported expenditure on feed supplementation for cattle are highest at irrigated sites and lowest at rainfed sites. Feed expenditures on sheep were recorded to be slightly higher at semi-irrigated sites than irrigated sites, but are clearly lowest for nomadic herders and at rainfed farming sites.
In addition to feeds, labour constitutes a further important input into livestock management. WOL studies have shown that cattle are not commonly shepherded to rangeland areas and so do not normally require hired shepherds.
Use of hired shepherds for sheep and goat herds depends upon flock size, household constitution and whether communities choose to aggregate herds for daily shepherding. Hired shepherds are most utilised at rainfed sites and least utilised at semi-irrigated sites. Data demonstrates that the peak investment in hired shepherds occurs in the spring season, when livestock are grazing remotely to make maximum use of pastures.
Figure 29: Reported expenditures on feed supplements
Figure 30: Reported expenditure on hired shepherds for sheep and goat.
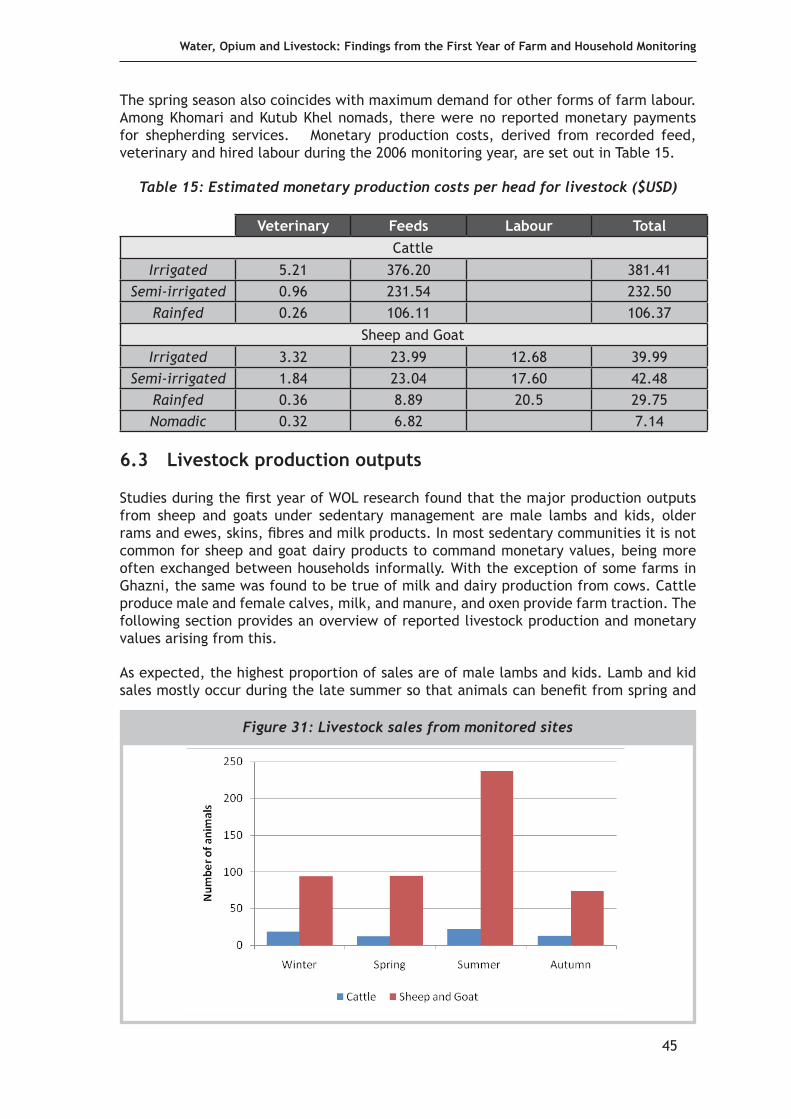
Water, Opium and Livestock: Findings from the First Year of Farm and Household Monitoring
45
The spring season also coincides with maximum demand for other forms of farm labour. Among Khomari and Kutub Khel nomads, there were no reported monetary payments for shepherding services. Monetary production costs, derived from recorded feed, veterinary and hired labour during the 2006 monitoring year, are set out in Table 15.
Table 15: Estimated monetary production costs per head for livestock ($USD)
Veterinary Feeds Labour TotalCattle
Irrigated 5.21 376.20 381.41Semi-irrigated 0.96 231.54 232.50
Rainfed 0.26 106.11 106.37
Sheep and Goat
Irrigated 3.32 23.99 12.68 39.99Semi-irrigated 1.84 23.04 17.60 42.48
Rainfed 0.36 8.89 20.5 29.75Nomadic 0.32 6.82 7.14
Livestock production outputs 6.3
Studies during the first year of WOL research found that the major production outputs from sheep and goats under sedentary management are male lambs and kids, older rams and ewes, skins, fibres and milk products. In most sedentary communities it is not common for sheep and goat dairy products to command monetary values, being more often exchanged between households informally. With the exception of some farms in Ghazni, the same was found to be true of milk and dairy production from cows. Cattle produce male and female calves, milk, and manure, and oxen provide farm traction. The following section provides an overview of reported livestock production and monetary values arising from this.
As expected, the highest proportion of sales are of male lambs and kids. Lamb and kid sales mostly occur during the late summer so that animals can benefit from spring and
Figure 31: Livestock sales from monitored sites

Afghanistan Research and Evaluation Unit
46
summer grazing opportunities, achieving maximum growth and optimal condition prior to sale. Unproductive and infertile animals are generally sold prior to the winter season, which incurs the highest feed expenses. Sales of cattle are more evenly distributed through the year, although sales also peak in the summer (Figure 30). Annual offtake of calves for sale was found to be fairly consistent (12-17 percent) across all sedentary production systems.
Irrigated farm sites reported approximately 50 percent offtake of sheep and goats for sale, while sales from rainfed farms were only 28 percent. High recorded levels of offtake from irrigated sites may reflect the practice of purchasing lambs for fattening and resale. Data for nomadic herds are incomplete, but on the basis of available records offtake during 2006 is estimated at about 30 percent.
WOL monitoring data on milk production describe the reported volumes milked out daily. Thus the measure is as much an indicator of farmer choice as of animal milk production performance. Farmer reports indicate that production of cow milk is highest at irrigated farm sites, and also relatively high from sheep and goats. Cows at rainfed sites are milked least, but sheep and goats are used to produce the most milk (Figure 31). Accordingly, the data indicates that farmers at irrigated sites utilise the milk production values of cows more than ewes and does, while the opposite is true at rainfed sites. The reported low milk productivity of cows at rainfed sites might be related to lack of green fodder or farmer choice to specialise in dairy production from does and ewes (given the larger populations of these managed).
Consistent with first year WOL research findings, the majority of milk and milk products appear to be consumed within the household or informally exchanged, with only a very small proportion sold out. In sedentary households, sales account for four percent of recorded cows milk production and nine percent of milk from ewes and does. Available data suggest that about 35 percent of ewe and doe milk production is sold by nomadic herders, both as fresh milk and durable milk products.
WOL farmers reported production of fleeces and hides from sheep and goats. In contrast to milk, nearly all of these animal fibres produced were sold to markets. In aggregate, farmers reported selling 198 hides and fleeces from irrigated sites, 26 from semi-irrigated sites and 291 from rainfed sites. A sum total of 579 fleeces and hides were sold out from
Figure 32: Reported daily milk production

Water, Opium and Livestock: Findings from the First Year of Farm and Household Monitoring
47
nomad flocks.
On average, cattle produce between 2 and 5 kg of manure daily. This manure is highly valued as an organic fertiliser, with a market value of about $0.06 per kilogramme. WOL studies show that farmers cultivating crops tend to utilise this resource on their own land rather than sell it. Only nomads with no land of their own reported sales of manure, and transactions sometimes involved grazing crop residues in situ.
The final animal product recorded through WOL monitoring is farm traction. Research participants recorded the number of days that oxen or bullocks were utilised for ploughing, land preparation or other purposes. The majority of this use was on the farmers’ own land, but for approximately a quarter of the days the animals were hired out. At irrigated sites, farmers used 24 days of animal traction, three days at semi-irrigated sites and 33 days at rainfed sites.
Mean production incomes, derived from available productivity data are set out in Table 17.
Table 17: Estimated mean production incomes per head for livestock during 2006 ($US)
Sales Milk Fibres Traction TotalCattle
Irrigated 37.40 382.20 0.44 420.04Semi-
irrigated33.00 202.02 0.30 235.32
Rainfed 26.40 125.58 0.24 152.22
Sheep and Goat
Irrigated 26.69 17.47 0.10 44.26Semi-
irrigated 11.20 25.48 0.03 36.71
Rainfed 10.50 33.93 0.12 44.55Nomadic 15.00 12.50 0.14 27.64
Livestock gross margins 6.4
Indicative gross margins for livestock production under different farming conditions are given in Table 18. The economic advantage seems to be held by the low input production systems, since differences in income (from productivity) do not vary between production systems as much as differences in expenditures (from inputs). Therefore, among the WOL monitoring group of farms, production systems with lowest inputs appear to achieve the best gross margins. Nomadic flocks produce the highest gross margins.
The lowest gross margins were estimated for semi-irrigated sites where small cultivated areas restrict farm production of both green fodders and rainfed cereals for straw. Indeed, sheep and goats appear to produce a negative gross margin. An important qualification must be made regarding the gross margin calculation given in Table 18. The calculated value of milk products encompasses production destined for both household consumption and markets. If the majority of this milk is actually consumed within households or exchanged informally, it will not produce a cash income. It is also difficult to quantify the value of non-monetary exchanges in servicing socioeconomic networks.

Afghanistan Research and Evaluation Unit
48
Table 18: Gross margins for reported livestock production ($USD)
Mean expenditure Mean Production Gross marginCattle (390)
Irrigated 381.41 420.04 38.63Semi-irrigated 232.50 235.32 2.82
Rainfed 106.37 152.22 45.85Sheep/goat (1463)
Irrigated 39.99 44.26 4.20Semi-irrigated 42.48 36.71 -5.77
Rainfed 29.75 44.55 14.80Sheep/goat (1174)
Nomadic 7.14 27.64 20.50
Furthermore, these gross margin calculations do not take account of farmyard use of livestock manure as organic fertiliser. Estimates suggest the monetary value of manure to farmers at sedentary sites could reach $35-60 per cow or bull annually (depending on feed regime and efficiency of collection and utilisation). It is harder to estimate the monetary value of manure from sheep and goats because of losses while grazing off-farm.
A recalculation of gross margins using the reported monetary incomes from milk sales is given in Annex 5. This reassessment returns negative gross margins for most categories of livestock, and the ratio of consumption value to monetary income values suggests that animals are primarily valued for subsistence production. Only sheep and goats herded by nomads still maintain a positive gross margin if domestically consumed production is discounted from the calculation. Annex 5 also confirms the widely held assumption that subsistence values are proportionately more important in cattle than in sheep and goats.
In summary, taking into account the value of household utilisation of milk and manure, it is likely that net returns from livestock would be positive at all farm sites. However, if livestock values are assessed solely in terms of monetary income from sales to markets, net returns from livestock would only be positive for herds under nomadic management.
Discussion 6.5
Evaluation of livestock management systems through farm monitoring produces some findings consistent with the first year conclusions of WOL research. Monitoring helps to further characterise production systems, and findings hold implications for the development and implementation of livestock development policy.
First, data corroborate the widely held assumption that under Afghan smallholder farming systems cattle are managed primarily for their subsistence values. These values take the form of milk for the farm household and manure and traction for land preparation. The amount of monetarised production is comparatively low, making this an essentially false measure of production. Consequently, WOL monitoring recorded the highest gross margins for production where consumption of products was highest, not necessarily where productive performance was best. This observation is relevant to understanding farmer management decisions.
Program interventions aiming to support the development of small-scale dairy production for market supply must recognise this current allocation and utilisation of milk within

Water, Opium and Livestock: Findings from the First Year of Farm and Household Monitoring
49
the farming system; specifically that most farms are not producing a marketable surplus. While this may be due to lack of access to markets, reported lactation yields do not suggest production of a large surplus. Therefore, under observed conditions, only households owning multiple cattle would be in a position to derive direct benefits from commercial dairying. The focus of dairy projects should therefore not be restricted to processing and market chain development, but also to seeking opportunities to enhance milk production through increased rural cattle populations or increased per capita lactation yields.
It is important to find out why farmers on irrigated farms are choosing to manage their sheep and goats the way they currently do. At irrigated and semi-irrigated sites, flock structures show little evidence of management to optimise production.34 Adjustments to reported male/female and sheep/goat ratios could potentially result in increased productivity. In contrast, production under extensive management at rainfed farms and by nomads demonstrates a much more considered approach to managing flocks.
Under observed Afghan farming conditions, low-input production systems appear to be associated with the best gross margins (for both sheep and goats and cattle). Of all monitored groups, only the Khomari and Kutub Khel nomads and some farmers in marginal rainfed areas seem to practice management aimed at maximising monetary revenues from herds. While a few individual farmers and herders attempt to increase productivity through intensifying management inputs, these are the exception rather than the rule, suggesting that farmers face constraints in doing this.
WOL monitoring confirms that even when the role of in situ grazing and residues is disregarded, livestock production is heavily integrated with farming at Afghan rural sites. At river valley irrigated farms, cultivation of green fodder and straw constitutes important crop inputs into livestock. At rainfed farms, even though no green fodder can be grown, extensive cereal cultivation can provide a surplus of straw that is utilised through the winter months. Conversely, lack of access to cultivated fodders appears to be one of several factors negatively affecting production gross margins for both cattle and small ruminants at semi-irrigated sites.
Available data make it clear that flocks and herds under extensive management by nomads and farmers in rangeland areas are most effectively orientated to market supply. Consequently interventions to build value chains for the supply of livestock to markets should most logically be initially focused on these production zones. However, as previous WOL research indicates, these remote sites are often overlooked in development planning in favour of population centres in irrigated river valleys. For example, Veterinary Field Units tend to be located in the latter, and as of 2006 no mechanism existed for providing credit to nomadic livestock producers to allow them to add value to lambs by fattening.
In reassessing the production values of livestock in Afghan farming systems, WOL monitoring has highlighted the importance of subsistence and auto-consumption values. A fuller appreciation of livestock production cannot therefore be disaggregated from its wider context of farm livelihoods and domestic consumption.
34 One possible explanation for observed male/female ratios is the purchase of male lambs by irrigated farmers for commercial fattening.

Afghanistan Research and Evaluation Unit
50
Labour and Farming Livelihoods7.
The final section of this report further examines the ways in which agricultural production at WOL research sites intersects with rural livelihoods. Specifically, the section draws upon monitoring data to review how labour is allocated within farming households, how food requirements are met, and how livelihoods are constructed under various farming conditions.
Evidence from the first year of WOL research suggested that Afghan rural livelihoods are highly dynamic and opportunistic, comprising a diverse and shifting portfolio of activities both on- and off-farm. Data show that a high proportion of farming households benefit from off-farm incomes, although as with other resources, access to employment is differentiated between the types of farm sites. Studies revealed differences in the food consumed at different types of farming sites. Researchers speculate that these differences reflect both the type of agriculture practiced at these sites and also the degree of access to external incomes. Overall, the data indicated dietary deficiencies at most farming sites. However, these preliminary studies raised a number of additional questions deserving further investigation:
What type of labour inputs are associated with smallholder farming?•
What are the relative contributions of various types of economic activities on- and • off-farm to household incomes?
What are the most significant factors in achieving livelihood security in rural • Afghanistan?
Labour on farm 7.1
The first year of WOL research revealed the importance of farm access to labour as a factor in securing rural livelihoods. Studies highlighted opportunism in the allocation of labour to both on- and off-farm activities. Farm monitoring provides a clearer picture of the role of both male and female labour contributions within the farm economy.
The 214 sedentary farming households participating in WOL monitoring encompassed 1,951 people, giving a mean household population of 9.12 (Std Dev 4.604). Households ranged in constitution from a minimum two members to a maximum of 33 (Figure 32). The size of households did not significantly differ among sedentary farm types. However, nomadic households of the Khomari and Kutub Khel were slightly smaller than sedentary households with a mean constitution of 7.82 members (Std Dev 4.452), ranging from a minimum of two to a maximum of 19.5.
WOL monitoring data challenge assumptions about the primacy of male on-farm labour, showing that labour is regularly contributed by both men and women at sedentary farms. The lowest proportion of female labour relative to male labour was reported at semi-irrigated farms, where the smallest land areas are under cultivation, implying a lower overall farm workload (Figure 33).
According to this data, women may contribute up to one-third of farm labour days through the year. To better understand the significance of women’s contribution to farm labour, WOL monitoring recorded the scope of female on-farm activities.
According to women’s reports, one type of farm labour stands above all others. This is the management of livestock and poultry, which includes duties related to feeding, tending
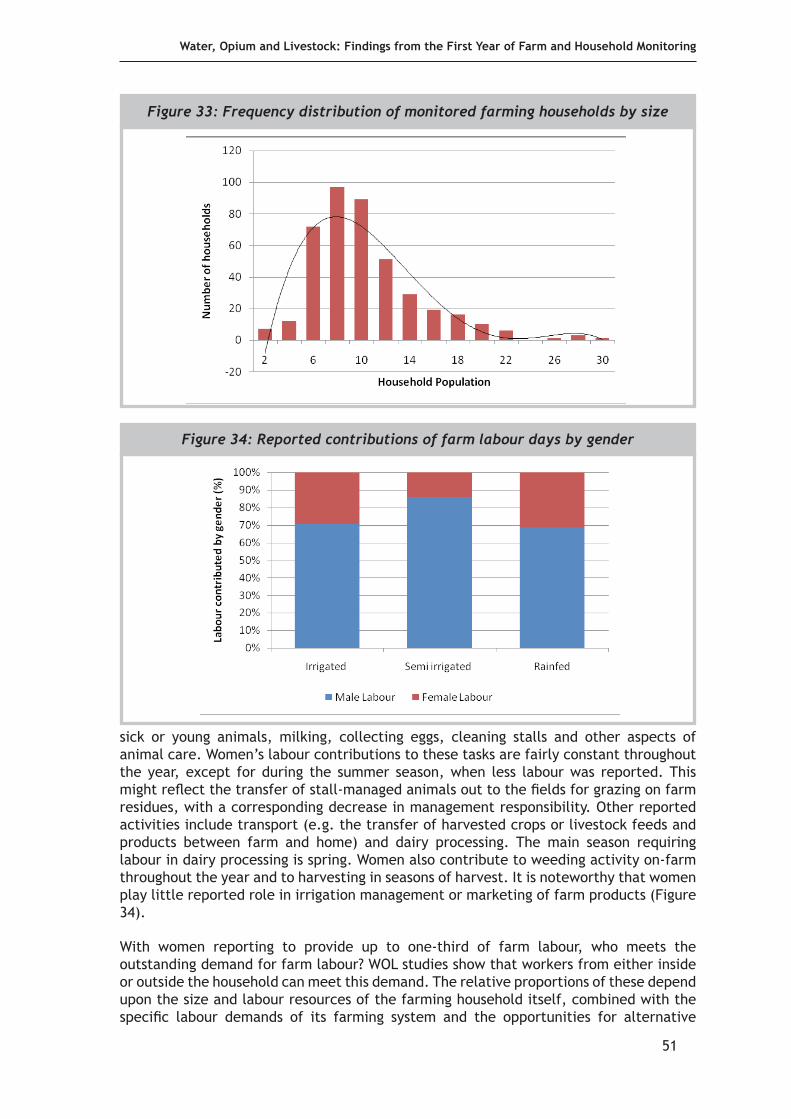
Water, Opium and Livestock: Findings from the First Year of Farm and Household Monitoring
51
sick or young animals, milking, collecting eggs, cleaning stalls and other aspects of animal care. Women’s labour contributions to these tasks are fairly constant throughout the year, except for during the summer season, when less labour was reported. This might reflect the transfer of stall-managed animals out to the fields for grazing on farm residues, with a corresponding decrease in management responsibility. Other reported activities include transport (e.g. the transfer of harvested crops or livestock feeds and products between farm and home) and dairy processing. The main season requiring labour in dairy processing is spring. Women also contribute to weeding activity on-farm throughout the year and to harvesting in seasons of harvest. It is noteworthy that women play little reported role in irrigation management or marketing of farm products (Figure 34).
With women reporting to provide up to one-third of farm labour, who meets the outstanding demand for farm labour? WOL studies show that workers from either inside or outside the household can meet this demand. The relative proportions of these depend upon the size and labour resources of the farming household itself, combined with the specific labour demands of its farming system and the opportunities for alternative
Figure 33: Frequency distribution of monitored farming households by size
Figure 34: Reported contributions of farm labour days by gender

Afghanistan Research and Evaluation Unit
52
employment off-farm. Overall, farming households reported a mean of 2.06 (Std Dev 1.965) adult males undertaking full-time labour on the farm. However, monitoring data shows considerable flux in the composition of this male labour force. The mean number of male householders engaged in farm labour changes through the year, with the highest number reported as working on-farm during the winter.35 At this time, full-time adult workers are complemented by additional boys and men working part-time. Later in the year (perhaps as opportunities for off-farm labour increase), the allocation of domestic farm labour diminishes (Figure 35).
Farms at research sites utilised a mean total of 21.59 additional days of labour (from off- farm) during 2006. Of these, 12.38 days (n=190 Std Dev 15.455) were waged labour and 9.21 days (n=99 Std Dev 14.288) were reported as unwaged. The tasks for which the most labour is hired include shepherding, land preparation, harvest and post-harvest
35 While it is possible that peak household allocation of male labour to the farm occurs during the winter, there is also the possibility that male research participants are simply not doing anything else during the winter, and so prefer to describe themselves as working “on farm.”
Figure 35: Womens reported contributions to farm labour (n=177)
Figure 36: Constitution of the male (internal household) work force on farm

Water, Opium and Livestock: Findings from the First Year of Farm and Household Monitoring
53
crop processing. Farmers most commonly draw upon unwaged external labour for land preparation, harvest, irrigation works and shepherding. Reported labour days by task and farm type are given in Annex 6.
This data shows that while farmers at semi-irrigated and irrigated sites are able to meet up to half of their additional labour requirements from within social and economic networks as unwaged labour, farmers at rainfed sites (with very much more land and lower population density to work it) have to pay for the majority of additional labour they require. This could also be interpreted as evidence that social networks of reciprocity and informal exchange of labour are stronger in river valleys and irrigated farm sites, so that rainfed farmers are disadvantaged in accessing unwaged labour.
Off-farm sources of income7.2
Investigations were conducted during the first year of WOL research to ascertain the contribution of off-farm earnings to the household economy. The WOL baseline survey results showed that 83 percent of all the farming households in the sample received off-farm incomes from waged labour during the year 2004-05. Many households received income from multiple sources, combining both permanent and temporary employment of household members. Mean monthly off-farm incomes of about $85 were reported although frequency distribution indicated a wide range, spanning from $0 to over $1,000 monthly.
WOL monitoring found that 96 percent of the sedentary farming households within the monitoring group received some form of off-farm income during the year 2006-07. Again, there was very wide variation, but the aggregate value of mean monthly incomes across the monitoring group was calculated at $93.82 (Std Dev 122.21) per household.
The data reveal differences between off-farm incomes at various types of farm site (Table 19). The highest external incomes are received at irrigated sites (mean $96.72, Std Dev 130.60), the next highest at semi-irrigated sites (mean $83.87, Std Dev 130.2), while the lowest incomes are received at rainfed sites (mean $69.72, Std Dev 45.03). With α=0.05, these differences are significant (ANOVA F=4.373, p=0.013). They are also broadly consistent with the findings of the WOL baseline survey.
Table 19: Mean monthly off-farm incomes ($USD)
Winter Spring Summer AutumnMean Std Dev Mean Std Dev Mean Std Dev Mean Std Dev
Irrigated 127.9 182.93 105.8 98.03 86.5 90.42 66.7 84.57Semi
irrigated 138 125.45 79.8 62.01 117.7 175.92
Rainfed 44 30.62 74.18 37.64 81.76 35.30 78.51 67.91
The overall distribution of reported off-farm employment (both temporary and permanent) among site types appears fairly consistent with the number of monitored households at each. About 59 percent of all reported off-farm incomes are attributed to households at irrigated sites, which constitute 56 percent of the monitoring group population. Semi-irrigated sites account for 26 percent of recorded incomes and 20 percent of households in the sample, while rainfed sites account for 15 percent of incomes and 14 percent of households. Superficially then, households at different types of farm site seem to access proportionally similar numbers of external incomes. What then accounts for the

Afghanistan Research and Evaluation Unit
54
recorded differences in total incomes received?
Reported sources of off-farm income were allocated to five general descriptive categories of work (Figure 36). The category “unskilled labour” includes work for daily wages and unskilled agricultural work, such as labour for harvesting, collection of fuel woods and shepherding. It is often temporary in nature and remunerated accordingly. The category “trader/skilled labour” encompasses most types of skilled self-employment and small business, notably occupations such as shop-keeping, butchery, baking, milling flour, driving a vehicle for hire and trading in various commodities. The “private sector/NGO” category includes working at hotels, petrol stations and small businesses and organisations. The category “government/professional employment” includes official government positions as well as professional posts such as teachers, health workers and veterinarians. “Military/security” jobs include positions with the Afghan National Army and the police and jobs as guards for specific buildings and installations.
Organising sources of off-farm income by employment category and farm type reveals discernible differences in the types of off-farm employment association with the various farm types. Households at irrigated sites seem to have the largest proportion of incomes derived from skilled and professional (and therefore presumably better paying) categories of employment, while households at rainfed sites have the largest proportion of unskilled and agricultural daily labour. Consequently while there is little difference quantitatively among the number of incomes received at various farming sites, there appear to be qualitative differences in the types of work households have access to, and thus the levels of income they derive.
The role of women in generating monetary incomes in farming households is often overlooked. The first year of WOL research identified the role of women’s manufacturing and sale of textiles in the form of rugs, carpets and ropes. Women’s manufacturing and sales of these products were recorded during farm monitoring (Table 20).
Figure 37: Source of off-farm incomes by employment category

Water, Opium and Livestock: Findings from the First Year of Farm and Household Monitoring
55
Table 20: Women’s production and sale of woven products
Households selling woven products (%)
Mean piece sales per annum (#)
Mean annual income ($USD)
Irrigated 64 2 36.2Semi-irrigated 20 0.5 6
Rainfed 63 2.8 6.48
More than half of all households at irrigated and rainfed sites reported producing woven materials for sale during the year. Although productivity (in terms of items produced) was slightly higher at rainfed sites, mean incomes from woven products were much higher at irrigated sites. This discrepancy is due to the nature of the items being produced. The most common items woven at rainfed sites are functional items purchased by others within the community at low prices, including clothes for shepherds, “covers” for donkeys, ropes and tent fabrics. Several women also reported selling unwoven spun wool. Only one household at a rainfed site reported producing a carpet. By contrast, weaving and production at irrigated river valley sites (especially in Kunduz) focus heavily on the production of carpets for specialist buyers. One household in Kunduz reported producing four carpets a year with the women generating $800 of income.
Ironically, it is the rainfed farm sites that produce the largest quantities of animal fibres (Section 5.3) and spun wool. Low monetary incomes from women’s weaving in rainfed sites probably reflects a lack of access to carpet traders. Likewise, while women at more than half of all Khomari and Kutub Khel nomadic households reported weaving fibre products, only one household reported actually selling anything. Data show that the majority of carpet sales occur during the spring and summer seasons.
Household food production, consumption and nutrition7.3
First-year WOL studies investigated household nutrition through study of the composition of diet consumed under different production conditions. In addition to suggesting that nearly all research site households face dietary deficiencies and nutritional vulnerability, the research highlighted differences in diet on the basis of farm type. Dietary diversity and food security have been shown to be strongly associated,36 so this measure was used to describe differences among farm types. However, first-year studies were not able to assess the extent to which these differences in diet stem from farm production or choices about cash purchases of food. During monitoring, additional data was collected to further investigate this relationship between farm production and consumption.
Some differences are observed in the frequency with which various food types are consumed among households engaged in diverse forms of agricultural production. The reported dietary structures at irrigated and rainfed sites are quite similar, although households on irrigated farm lands eat more vegetables and eggs than those on rainfed farms, who in turn consume slightly more meat and dairy products. In contrast, households at semi-irrigated sites report consuming a higher proportion of vegetables and milk products and fewer protein-rich foods. Nomadic households report a very basic diet largely composed of bread and dairy products with very few vegetables or protein-rich
36 Marie T. Ruel, “Is Dietary Diversrity an Indicator of Food Security or Dietary Quality? A Review of Me -surement Issue and Research Needs” (Washington: International Food Policy Research Institute, 2002), 37. Available at http://www.ifpri.org/divs/fcnd/dp/papers/fcndp140.pdf.

Afghanistan Research and Evaluation Unit
56
foods. These results are broadly consistent with the findings of the 2005 WOL baseline survey, which also indicated the most diverse and balanced diets are eaten at semi-irrigated sites. Nomad diets, comprised largely of carbohydrates and fats, feature very few vegetables or fruit and (perhaps more surprisingly) the least-frequent consumption of meat of any monitored production system.
To better understand these reported dietary structures, the research team collected data on the actual quantities of food consumed by households and the origins of these foods. These data appear in Annex 7.
At irrigated and semi-irrigated farms, the majority of consumed wheat (bread) is purchased, and although rainfed farms must also purchase wheat through the year, the larger part of what they consume is grown on-farm. Conversely, semi-irrigated farms report consuming much more fruit and vegetables than irrigated or rainfed farming households. However, the data show that the majority of these foods are purchased rather than cultivated on-farm. Rainfed farms have the highest consumption of dairy and milk products, and a large part of this is produced on-farm. The only farm product that semi-irrigated farms consume more of than other farm sites is eggs. Rainfed farms also consume a higher proportion of farm-produced eggs, while irrigated farms buy the majority of what they consume.
These findings clarify why semi-irrigated farms (with the least cultivated land area, widespread sharecropping, problems of water access and low offtake from livestock) have the highest levels of food consumption. Households in semi-irrigated areas appear to buy a larger proportion of foodstuffs than other types of farms.
Examining the overall balance between the value of farm food products autoconsumed and those purchased is instructive. Overall, the data show that on average (with wide dispersion of values) irrigated farms produce 59 percent of the value of the recorded food types that they consume. Farm production accounts for 45 percent of the value of food consumed at semi-irrigated sites and 52 percent at rainfed sites (Table 21). Therefore, irrigated farms appear to achieve the highest value of autoconsumption.
However, this analysis is distorted by the use of monetary value as the unit of comparison. Analysis by monetary values is weighted towards higher-value products such as meat
Figure 38: Reported frequency of consumption of different food types

Water, Opium and Livestock: Findings from the First Year of Farm and Household Monitoring
57
and vegetables, which may be less prominent in the diet. Wheat is the most important food staple in Afghan rural households but commands a relatively low monetary value. Considering consumed quantities of wheat (the food staple at all farming sites) and dairy (the main source of fats and protein consumed), rainfed farms are the most self-sufficient (see Annex 7).
Table 21: Mean value of weekly autoconsumption and purchase of foods per household
Irrigated Semi- irrigated Rainfed
Farm ($) Purchase ($) Farm ($) Purchase
($) Farm ($) Purchase ($)
Wheat 6.5 10.3532 7.7376 8.4734 9.3288 6.4324Rice 14.268 4.458 0 5.472 0 6.642
Vegetables 3.5648 2.6272 3.04 7.2 1.0208 1.6416Fruit 5.076 2.196 2.958 13.158 1.2 4.23
Milk/dairy 3.2784 1.4016 2.6352 2.2224 7.0512 0.6864Meat 11.424 5.856 19.2 8.896 16.48 8.192Oil 1.6684 2.8208 1.935 2.5198 0.645 3.2164
Chicken 7.616 6.432 8 6.56 5.696 6.656Eggs 1.168 1.317 2.011 1.55 0.507 0.36Total 54.56 37.46 47.52 56.05 41.93 38.06
A farm budget model 7.4
Having reviewed the monetary and consumption values of farm production, WOL monitoring allows the construction of a simple model describing farm budgets through the year. There are two important objectives in doing this:
To estimate overall gross margins for farm and household production and • consumption
To illustrate the pattern of farm cash flows through the agricultural year •
The model is constructed around a hypothetical farming household, the attributes of which are means derived from monitoring data. These assumptions describing a ”typical” farm and household are set out in Table 22. Further assumptions regarding farm cash flows are that the household starts the winter season with a “0” balance and that the value of informal, non-monetary costs and transactions are overlooked.
On the basis of all stated assumptions, the model projects that the hypothetical farming household produces a net annual income of $529.55 (Annex 7). However, it should be remembered that WOL data only captures those costs and expenditures relating directly to farm production and not other necessary household expenditures such as healthcare, clothing, travel, special occasions or other purchases (or other income sources such as loans).
Accordingly, the net returns from the production unit appear extremely low. It should be noted that the “model” farming household utilised represents a mean for the monitored WOL group. Some WOL households are better off, and others worse. Some years will produce better harvests than 2006-2007, but other years will be worse, and net returns will then be lower. Low household net returns (in the order of $530 USD), indicate that

Afghanistan Research and Evaluation Unit
58
farming households will have few capital reserves to buffer against shocks, losses and market fluctuations through the year. Even the loss of a single animal or a period of protracted illness in a household could tip net returns from positive to negative. This finding highlights the importance of informal networks of reciprocity and exchange within rural communities to help buffer households through hardship and scarcity. A further pertinent consideration is the systemic lack of investment capital available for farming improvements. Against the background of such low farm returns, it is easy to understand why farmers emphasise minimising farm inputs and reducing production costs.
In addition to the annual net returns projected, the model also provides a useful characterisation of cash flow in the smallholder farming system (Figure 39 over page), confirming that peak monetary incomes are received by farms during the spring and summer months, and that incomes are much lower during the winter. Indeed household margins are only positive during the spring and summer months and at other times the household operates at a net deficit, carried over by savings or other mechanisms of support. This cash flow model is consistent with the view that the household is at its most vulnerable at the end of the winter season.
Table 22: Assumptions made in the farm budget model
Household Constitution 9.5 (five adults over 15 years, three
older children and three children under 7)
Land type 1.7 hectares irrigated
Land tenure 1 hectare owned, 0.7 hectare sharecropped (at 50% division)
Irrigation access Midstream along canal system (1.7 hours flow of 24))
Winter/perennial crop
0.25 ha plum orchard
0.7 ha wheat
0.25 ha onion
0.5 ha potato
Summer crop
0.5 ha alfalfa (intercropped in orchard)
0.5 ha maize
0.5 ha cotton
Livestock 1 dairy cow
4 sheep and goats
Off-farm incomes 1 professional employee (school teacher)
0.25 casual daily agricultural labour

Water, Opium and Livestock: Findings from the First Year of Farm and Household Monitoring
59
7.5 Targeting development interventions: Farm systems and household food security
The WOL monitoring data presented in preceding sections of this report have been used to explore the function of agricultural systems in Afghanistan, identify major constraints upon production and gauge the importance of farm production within rural livelihoods. However, the most important question from a development-planning perspective has not yet been addressed.
Development planners need to know what types of development interventions (i.e. targeting which part of the farm system) will result in greatest overall benefit and improved food security for Afghan farming households. The final part of this report draws together WOL monitoring data covering multiple aspects of farming systems to address this question utilising a multiple regression statistical technique.
It is important to clarify that “livelihood security” and “food security” are not the same thing. Livelihood is a construct encompassing a broad spectrum of agency, assets, capabilities, institutions and risks, which cannot easily be measured.37 Moreover, the goal of improved household nutrition is not necessarily consistent with longer-term development objectives (e.g. commercialisation of agricultural production), which may involve increasing production offtakes (and therefore risks).
However, assuming the immediate goal of policymakers is to improve levels of household nutrition, what types of programs should be prioritised? What farm system components contribute most directly to household nutrition and food security?
First-year WOL studies, together with the results of farm monitoring, suggest a number of factors that may contribute to household nutrition. These are utilised as independent variables (predictors) for the regression model.
37 For example see the UK Department for International Development’s widely cited Sustainable Livel -hoods framework at http://www.sustainablelivelihoods.org/index1.htm, accessed 19 April 2009.
Figure 39: Projected annual cash flows for model farming household

Afghanistan Research and Evaluation Unit
60
Gross Croppped Area (GCA)•
The total area of land under cultivation (rainfed and irrigated) by a household. Larger cultivated areas suggest a potential to produce more crops and retain more for household consumption.
Irrigation Water Flow (IWF) •
The amount of water received by each farmer to his land. More irrigation water would allow cultivation of higher-value crops, increasing farm incomes and food purchases, or cultivation of high-value crops for autoconsumption.
Crop Diversity (CD)•
The number of different crops cultivated during the year. Crop diversity has been used as a proxy for higher-value cropping, but also as an indicator for cultivation of nutritious food crops (vegetables and fruits) for domestic consumption.
Off-Farm Incomes (OFIN)•
The total value of annual off-farm incomes from waged labour. Increased cash incomes would allow higher expenditure on purchased foodstuffs.
Sheep (SP) •
Sheep and goats can contribute to household nutrition directly through consumption of animal products or by generating incomes which are spent on food purchases.
Cattle (CT)•
Cows can contribute to household nutrition directly through consumption of animal products or by generating incomes that are spent on food purchases.
The dependent variable for the utilised for the regression is:
Nutrition Status (NT)•
This is an arbitrary measure, established by scoring the total quantity and nutritional value of foods consumed by farming households.
The regression analysis follows the formula:
Y = a+b1X1 +b2X2 +b3X3 +b4X4 +b5X5 +b6X6
where
NT= Constant + b1CT +b2SP +b3GCA +b4OFIN +b5IWF +b6CD
The summary results of this regression analysis are presented in Annex 9.
The R Square value for the model is 0.339, indicating that overall, the identified predicators account for 33.9 percent of the variance in household nutrition. This result is statistically significant (ANOVA F=6.420, p=<0.0005).
The highest Standardised Coefficient value is for cattle ownership (0.572, p=<0.0005), revealing that of all predictors, cattle ownership makes the strongest unique contribution to explaining household nutritional status. Irrigation water flow (0.288, p=0.006) and

Water, Opium and Livestock: Findings from the First Year of Farm and Household Monitoring
61
crop diversity (0.283, p=0.15) also make statistically significant contributions to the prediction of household nutritional status. According to WOL data, sheep and goat ownership, cultivated area and off-farm incomes do not significantly affect household nutritional status.
These results are in many respects intuitive. WOL studies have shown that cows are largely managed for their subsistence values, supplying milk products for household consumption and providing important sources of energy and protein. An increase in the number of cows managed by a household registers immediately as increased access to dairy products for domestic consumption. However, there are two caveats associated with this generalisation. First, some households (usually with two or more cows) will be producing a milk surplus for markets and so additional cows would contribute to monetary incomes rather than household nutrition. Second, additional milk production could be transferred informally and shared with other households.
WOL research has shown that irrigation water supply and crop diversity are closely related at research site farms. An improved irrigation water supply allows farmer diversification away from water-extensive crop staples such as wheat. Farmers with good access to water can cultivate fruits and vegetables and score more highly on their nutritional values.
It may appear strange that total cultivated area has little direct impact on household nutrition. This is probably because the largest cultivated areas are associated with rainfed farming, which is mainly limited to cereal cultivation. WOL households already consume large quantities of wheat (purchased or farm-produced) and so may be already “saturated” in terms of their consumption of this food type. Furthermore, wheat as a food type scores low in terms of nutritional value.
Sheep and goats, like cows, produce dairy products that can be consumed within the household. However, the regression analysis suggests that ownership of higher numbers of sheep and goats does not correlate to increases in household nutrition to the same extent as cows. It would be interesting to investigate whether this holds true for households that own sheep and goats but not cows. Perhaps farmers tend to consume cows’ milk within the household and utilise sheep and goat milk for exchange.
Likewise, higher levels of off-farm income do not appear to significantly predicate improved nutrition status. This is difficult to account for, and raises questions about who holds responsibility for planning cash expenditures within the household. While cash is always made available to purchase foods to meet basic household requirements, it may be possible that once these needs are met, additional incomes are directed to non-food expenditures, such as asset acquisition, paying off debts or making loans. If so, development interventions generating cash incomes may not be the best approach to improving household nutrition and food security.
Discussion7.5
Exploration of Afghan farm livelihoods using WOL monitoring data adds to the depth of understanding achieved through first year studies, notably with respect to how farm labour requirements are met and how they benefit from agricultural revenues and autoconsumption of farm products. This new understanding holds implications for development programming and policy design.
First, the data demonstrates that rural women provide up to a third of farm labour,

Afghanistan Research and Evaluation Unit
62
and most likely more than this in some circumstances. Female labour is focused into several types of tasks, particularly relating to the livestock subsector and subsistence production. Data suggests the women of the monitoring group play very little direct role in monetary transactions with markets, something that may be important to consider in the design of income generating projects. However, it also shows that women can be regular income generators through their weaving work, with over half of households reporting sales from woven products. The extension of value chains for woven products into rainfed areas may help foster small-scale production and generate much-needed incomes in those remote and vulnerable areas.
With the average smallholder farm requiring two men working full-time, there are clear limitations on the capacity of farming households to access additional labour opportunities off-farm. This is particularly true of larger rainfed farms where labour demands are high and the possibility of engaging external labour limited. In these labour-scarce areas, it would make sense for development programs to engage women in income-generating activities as much as possible, alleviating demand for scarce male labour.
WOL monitoring findings again highlight differentials in access to off-farm incomes, with better-paid and more permanent employment being concentrated in irrigated river valleys. Counter-intuitively, markets for informal and non-monetarised agricultural labour exchanges also appear strongest in the river valleys.
Second, data show that households of various farm types demonstrate significantly different levels of reliance on farm produce. During the first year of WOL research, it was not clear how semi-irrigated farms (with the least-productive land area) could have the greatest dietary diversity. Monitoring data now show that with very limited agricultural resources, households at semi-irrigated sites are heavily reliant on cash purchases for most categories of food. Other sedentary farmers can be more self-reliant on the food they consume. It is worth noting that the value of farm produced food is commonly the equivalent of two off-farm incomes at $110 USD monthly. This is presumably why households can afford the opportunity cost of allocating two men’s labour on the farm. The value of this subsistence-orientated production should therefore not be overlooked in the economics of the farm system.
With respect to recorded farm cash flows, typical Afghan farming households appear to exhibit a high level of livelihood vulnerability: small gross margins provide little buffer against risk, loss or under-productivity. Perhaps a more important observation is the constraints that these small net returns place upon farmers’ capacity for intensification or improvement of production systems. Policymakers must take note of the under-capacity of these small “entrepreneurs” to respond to economic opportunity through endogenous investment.
Farm cash flow data also highlights the fluctuations in cash availability through the year in farm budgets. This once again highlights the centrality of informal monetary exchanges, lending and borrowing in sustaining the Afghan rural economy. Policymakers should not overlook the impact that monetarising goods and services may have on the informal relations of production that provide support for many participants within the agricultural economy.
Finally, the identification of cow ownership as being the best predicator for increased household nutrition (better than off-farm incomes or even diversification into high value crops) raises contentious questions for decision-makers. Essentially, this finding indicates that cash incomes into a rural household (whether from off-farm labour or from the
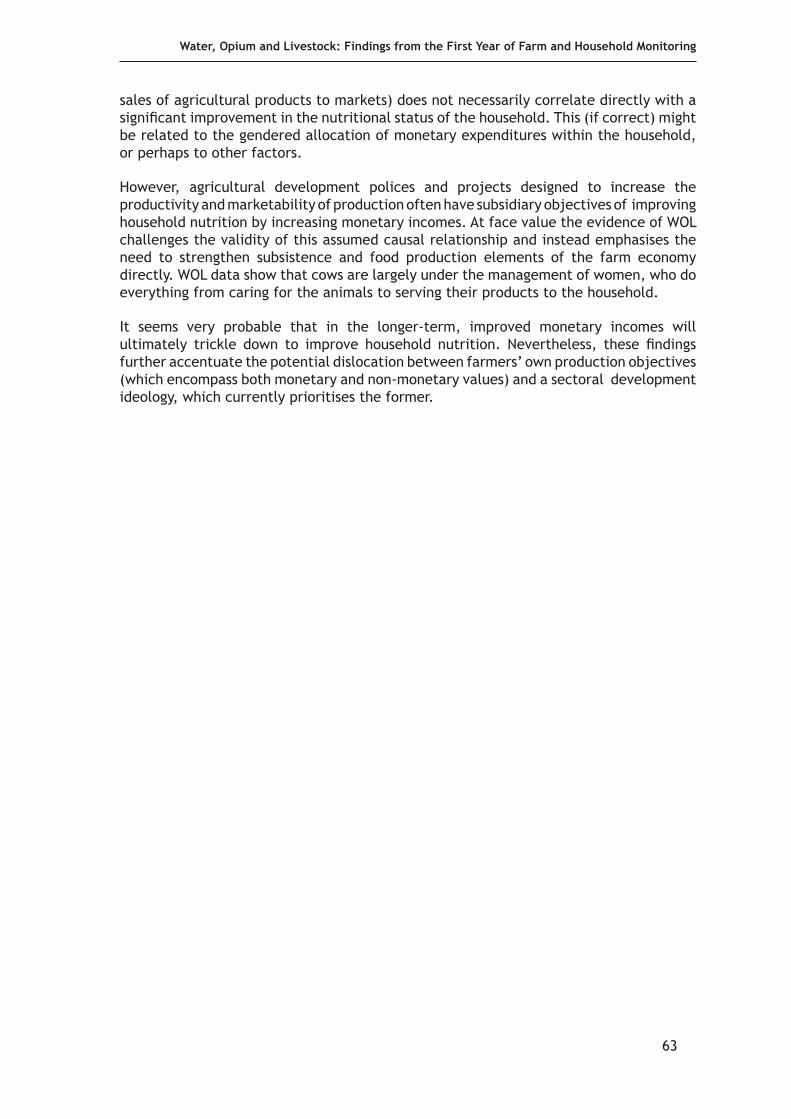
Water, Opium and Livestock: Findings from the First Year of Farm and Household Monitoring
63
sales of agricultural products to markets) does not necessarily correlate directly with a significant improvement in the nutritional status of the household. This (if correct) might be related to the gendered allocation of monetary expenditures within the household, or perhaps to other factors.
However, agricultural development polices and projects designed to increase the productivity and marketability of production often have subsidiary objectives of improving household nutrition by increasing monetary incomes. At face value the evidence of WOL challenges the validity of this assumed causal relationship and instead emphasises the need to strengthen subsistence and food production elements of the farm economy directly. WOL data show that cows are largely under the management of women, who do everything from caring for the animals to serving their products to the household.
It seems very probable that in the longer-term, improved monetary incomes will ultimately trickle down to improve household nutrition. Nevertheless, these findings further accentuate the potential dislocation between farmers’ own production objectives (which encompass both monetary and non-monetary values) and a sectoral development ideology, which currently prioritises the former.

Afghanistan Research and Evaluation Unit
64
Summary of Main Findings8.
The data obtained through farm and household monitoring under the auspices of the EC-funded WOL project considerably advance current understanding of natural resources management, agricultural systems and livelihoods in rural Afghanistan. By adopting a holistic “systems” approach, WOL research places studies of farm production within the context of domestic household economics and thus sheds new light on farming and livelihood objectives and the opportunities and constraints facing farmers.
While Afghan agricultural policy is currently focusing upon enhancing the function of free markets for (licit) farm products, WOL research is highlighting the extent to which farming systems are embedded within institutions (at multiple levels), which shape economic opportunity and behaviour and have implications for how farmers engage with markets.
This study has reviewed the function and impact of rural mechanisms for access to natural resources and highlights how these institutionalise systemic inequities, thus posing a challenge to notions of free market competition. Furthermore, by viewing farm goals and outputs within the broader context of rural livelihoods (and not just farm production), monitoring has demonstrated the significance of non-monetary values in agriculture. It therefore indicates some of the trade-offs that would be required if farmers re-orientated production towards market supply. However, at the same time, WOL data highlights some potential opportunities for building value chains around production that may be currently under-utilised or marginal to existing market networks. Following from the results of first-year WOL studies, this report highlights the importance of sequencing development interventions sub-sectorally so as to build on existing capacity and market potential.
Analysis presented in this report provides further insight into farmer decision-making, notably with respect to the choice to cultivate opium, by contextualising the entry requirements and net returns from poppy cultivation relative to those for other licit crops. A wider understanding of the function of the farming household economy further helps explain why Afghan farming is generally underproductive, with farmers choosing to opt for low-input, low-output systems of production. Development planners seeking to develop interventions to build value chains and foster production of high-value licit agricultural products will need to appreciate this broader context of farm management.
Key findings of the report are summarised below.
Land tenure systems
Up to one third of agricultural land may be cultivated under subordinate forms of • tenure. This is more than generally thought to be the case.
Sharecropping agreements (the major form of subordinate right) are most prevalent • in low-risk irrigated river valleys and less common elsewhere.
The specific terms of sharecrop agreements are most beneficial to farmers under • high-risk production conditions where supply of land outstrips demand.
Irrigation water access
Poor water availability in semi-irrigated areas means farmers are more innovative •

Water, Opium and Livestock: Findings from the First Year of Farm and Household Monitoring
65
and diversified in how they access water, with higher labour costs.
Although water scarcity is greatest in semi-irrigated areas, the greatest inequities • in labour inputs and water allocation occur on major canals in irrigated valleys.
Data show farmers upstream receive more water and contribute less labour than • those downstream, with measured impact upon crop yields and diversity.
Crop production
Seasonality of cropping gives Afghan farms a characteristic cash flow cycle, with • peak revenues received in the summer and early autumn.
Farmers tend to invest most management inputs into high-value crops, regardless • of whether they actually need them. Productivity of most crops is well below levels achieved in countries neighbouring Afghanistan.
High-value licit crops tend to have high “entry thresholds” in terms of access to • water and cash investment, excluding many farmers from them. By contrast, the entry requirements for poppy cultivation are low and returns comparatively high.
Livestock production
Livestock are most effectively managed for market supply under rainfed and nomadic • production systems. Livestock resources in these areas should be the initial focus of value-chain development.
A proportion of production from livestock under sedentary management is consumed • domestically, and so monetary values may not be the best measure of productivity. Livestock production is also closely integrated with crop production.
The best gross margins of production are those associated with the lowest-input • systems. Increasing margins by intensifying inputs is not a widely practiced farm strategy.
Labour and livelihoods
Farm labour constitutes a constraint for many households. Women provide up to one • third of farm labour and also contribute to half of all household incomes through sales of woven products.
Households in irrigated river valleys have access to better paid and more permanent • employment opportunities than those in outlying areas.
There is significant differentiation in autoconsumption of farm products between • farm type. Rainfed farms consume the highest value of their own products, and semi-irrigated farms consume the least.
Analysis of farm budget and cash flows show that Afghan farming households have • very low production margins to buffer against risks, losses or under-productivity and so are highly vulnerable to these

Afghanistan Research and Evaluation Unit
66
Annex 1: Cropping at research sites 2006
Winter Season Summer Season
Land type Site (n) Crop %
Mean cultivated hectares (Std Dev)
Crop %
Mean cultivated hectares (Std Dev)
Irrigated Qala-i-Naw (27) Apple 35 1 . 1 4
(2.050) Plum 29 1 . 1 1 (0.581)
Plum 35 Apple 24
Fodder 14 Fodder 22
Apricot 14 Potato 14
Potato 3 Wheat 10
Wheat 3 Barley 1
Onion 2
Mint 1
Cheery 1
Spinach 1
Turmai (11) Wheat 45 0.74
(0.734) Apple 33 0.90 (0.657)
Plum 27.5 Wheat 21
Apple 23.5 Plum 19
Fodder 4 Potato 18
Fodder 9
Irrigated Ch. Gunbad (6) Wheat 37 1 . 0 7
(0.193) Wheat 34 1 . 4 6 (0.712)
Plum 31 Plum 27
Apple 10 Fodder 10
Fodder 8 Barley 8
Apricot 8 Pulses 6
Almond 3 Apple 5
Grape 3 Turnip 5
Jani Khel (18) Wheat 76 1.21
(1.375) Barley 62 0.66 (0.345)
Fodder 8 Maize 27
Sugarcane 5 Cotton 7
Cucumber 5 Sugarcane 2
Onion 1 Cauliflower 2

Water, Opium and Livestock: Findings from the First Year of Farm and Household Monitoring
67
Winter Season Summer Season
Land type Site (n) Crop %
Mean cultivated hectares (Std Dev)
Crop %
Mean cultivated hectares (Std Dev)
Irrigated Wakil J. (19) Wheat 77 2.10
(1.328) Rice 27
Barley 15 Mung bean 25
Fodder 7 Sesame 21
Almond 1 Maize 14
Melon 7
Water melon 5
Pea 1
Afghan M. (17) Wheat 70 1.66
(1.275)Mung bean 33
Barley 17 Sesame 31
Fodder 9 Rice 26
Almond 2 Cotton 5
Onion 1 Maize 3
Melon 1
Onion 1
Irrigated Dana Haji (5) Wheat 85 1.06
(0.378) Rice 55
Fodder 15 Water melon 17
Sesame 8
Cotton 8
Melon 8
Mung bean 4
Tunian (13) Wheat
63 2.16 (1.950) Wheat 82
Barley 36 Barley 9
Fodder 1 Fodder 4
Pea 2
Fruit 2
Potato 1

Afghanistan Research and Evaluation Unit
68
Winter Season Summer Season
Land type Site (n) Crop %
Mean cultivated hectares (Std Dev)
Crop %
Mean cultivated hectares (Std Dev)
Irrigated Gawashk (10) Wheat 46 2.22
(2.13) Wheat 64
Potato 22 Barley 12
Cumin 13 Chick pea 7
Barley 10 Pea 8
Bean 3 Lentil 6
Fodder 3 Fodder 3
Lentil 2
Onion 1
Semi –irrigated
Zala Qala (7) Wheat 36 1.65
(1.62)
Fodder 21
Pea 12
Plum 12
Apple 7
Barley 6
Almond 4
Apricot 2
Payda Rah (2) Wheat 63 1.60
(2.121)
Plum 34
Fodder 3
Maruf C. (11) Wheat 55 1.19
(0.390)
Poppy 45
Sra Qala (11) Wheat 100 0.50
(0.643) Barley 89 0.22 (0.957)
Maize 11
Othar Khel (10) Poppy 89 0.26
(0.222) Roses 0.2
Roses 11
Khawaji (7) Poppy 100 0.2 0.1
Ghorak (7) Wheat 53
Barley 22
Beans 16
Fodder 9
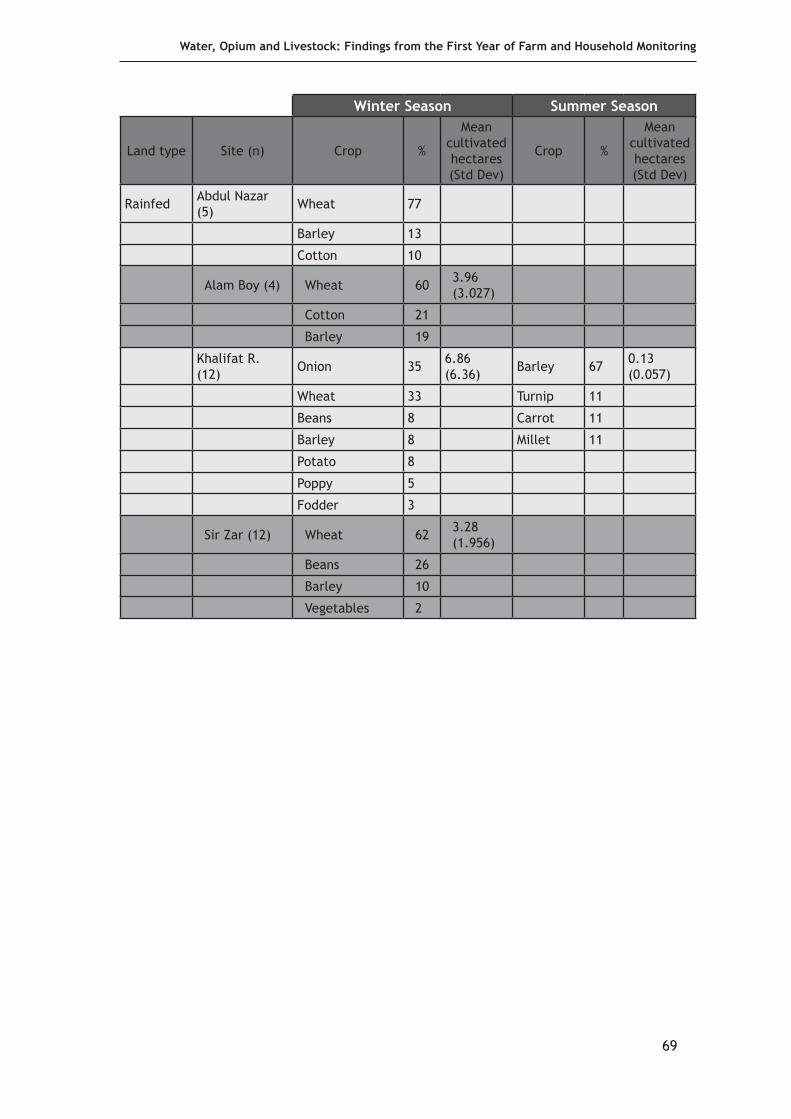
Water, Opium and Livestock: Findings from the First Year of Farm and Household Monitoring
69
Winter Season Summer Season
Land type Site (n) Crop %
Mean cultivated hectares (Std Dev)
Crop %
Mean cultivated hectares (Std Dev)
Rainfed Abdul Nazar (5) Wheat 77
Barley 13
Cotton 10
Alam Boy (4) Wheat 60 3.96 (3.027)
Cotton 21
Barley 19
Khalifat R. (12) Onion 35 6.86
(6.36) Barley 67 0.13 (0.057)
Wheat 33 Turnip 11
Beans 8 Carrot 11
Barley 8 Millet 11
Potato 8
Poppy 5
Fodder 3
Sir Zar (12) Wheat 62 3.28 (1.956)
Beans 26
Barley 10
Vegetables 2

Afghanistan Research and Evaluation Unit
70
Annex 2: Gross margins per hectare for production from important crops
Wheat (n=116) Barley (n=58)
Quantity Value ($USD) Quantity Value
($USD)
Inputs
Purchased seeds 39 Kg 9.36 26.1 Kg 7.56
Purchased fertilisers 276.94 Kg 89.74 293 Kg 96.99
Pesticides/Herbicide 0 0 0.1 Lt 0.4
Plough/Land preparation 6.14 Hr 55.27 12.25 Hr 110.26
Agricultural Labour 3.63 Dys 10.89 3.99 Dys 11.97
Total Costs 165.26 227.18
Revenues
Grain 1792.9 Kg 358.58 1685.5 Kg 337
Straw 107.57 101.12
Gross margin 300.89 210.94
Maize (n=9) Rice (n=15)
Quantity Value ($USD) Quantity Value
($USD)
Inputs
Purchased seeds 16.38 Kg 3.60 14.59 Kg 6.42
Purchased fertilisers 185.46 Kg 55.96 451.65 Kg 147.6
Pesticides/Herbicide 0 0 0 0
Plough/Land preparation 7.71 Hr 69.39 14.6 Hr 131.4
Agricultural Labour 3.71 Dys 11.13 12.06 Dys 36
Total Costs 140.08 113.761
Revenues
Grain 527 Kg 126.48 1902.4 Kg 837.05
Straw 31.66 285.3
Gross margin 18.06 1008.58

Water, Opium and Livestock: Findings from the First Year of Farm and Household Monitoring
71
Apple (n=4) Plum (n=9)
Quantity Value ($USD) Quantity Value
($USD)
InputsPurchased seeds 0 0 0 0
Purchased fertilisers 517.41 Kg 173.78 315.69 Kg 97.71
Pesticides/Herbicide 13.35 Lt 53.4 11.75 Lt 47
Plough/Land preparation 0 0 0 0
Agricultural Labour 9.2 Dys 27.6 11.48 Dys 34.44
Total Costs 172.29 159.74Revenues
Fruit 5570 Kg 1559.6 1285 Kg 1079.4
Gross margin 1387.31 919.66
Sugarcane (n=3) Cotton (n=5)
Quantity Value ($USD) Quantity Value
($USD)
InputsPurchased seeds 867.31 Kg 173.46 8.61 Kg 3.96
Purchased fertilisers 605.84 Kg 196.32 583.2 Kg 194.32
Pesticides/Herbicide 0 0 0 0
Plough/Land preparation 4.8 Hr 43.2 3.23 Hr 29.11
Agricultural Labour 14.04 Dys 42.12 5.97 Dys 17.91
Total Costs 869.18 198.48Revenues
Cane/Fibre 27222 Kg 1633.32 649.8 Kg 298.9
Seeds 350.7
Gross margin 764.14 451.16
Potato (n=20) Onion(n=4)
Quantity Value ($USD) Quantity Value
($USD)
InputsPurchased seeds 301.72 Kg 60.34 193.36 Kg 30.88
Purchased fertilisers 716 Kg 243.25 134.74 Kg 39.03
Pesticides/Herbicide 0.49 Lt 1.96 0 0
Plough/Land preparation 2.99 Hr 26.99 1.46 Hr 13.14
Agricultural Labour 11.85 Dys 35.55 11.9 Dys 35.7
Total Costs 271.71 85.40Revenues
Crop 6250 Kg 1000 4625 Kg 740
Gross margin 728.9 654.6

Afghanistan Research and Evaluation Unit
72
Melon (n=4) Alfalfa (n=37)
Quantity Value ($USD) Quantity Value
($USD)
InputsPurchased seeds 0.76 Kg 0.152 6.97 Kg 0.950
Purchased fertilisers 59.38 Kg 17.332 335.43 Kg 107.91
Pesticides/Herbicide 0 0 1.08 Lt 4.32
Plough/Land preparation 1.4 Hr 12.60 3.8 Hr 34.941
Agricultural Labour 7.07 Dys 21.21 1.65 Dys 4.95
Total Costs 37.3 225.21
Revenues Harvest 4534.4 Kg 544.12 2675.7 267.57
Gross margin 506.8 42.36
Poppy (n=15)Quantity Value ($USD)
InputsPurchased seeds 31.46 Kg Free
Purchased fertilisers 444.78 Kg 150.29
Pesticides/Herbicide 0 0
Plough/Land preparation 15.2 Hr 137.23
Agricultural Labour 125 Dys 562.5
Total Costs 850
Revenues Opium resin 26.90 Kg 2528
Gross margin 1678
All calculations based upon mean farm-gate sales prices and values recorded during spring, summer and autumn 2006.

Water, Opium and Livestock: Findings from the First Year of Farm and Household Monitoring
73
Seeds $USD (Kg) Crop $USD (Kg)Wheat 0.24 0.2
Barley 0.28 0.2
Maize 0.22 0.24
Rice 0.44 0.44
Apple 0.28
Plum 0.84
Cotton 0.46 0.46
Sugarcane 0.2 0.06
Poppy 94
Potato 0.2 0.16
Onion 0.16 0.16
Melon 0.2 0.12
Alfalfa 0.14 0.1
DAP (Kg) $0.4 USD
Urea (Kg) $0.28 USD
General agricultural labour (Day) $3 USD
Poppy agricultural labour (Day) $4.5 USD
Tractor hire (Hour) $9 USD
Herbicide (Litre, concentrate) $4 USD
Pesticide (Litre, concentrate) $4 USD

Afghanistan Research and Evaluation Unit
74
Annex 3: Change in small ruminant inventories during 2006*
Irrigated Semi-irrigated Rainfed
Sheep Goat Sheep Goat Sheep Goat
Opening inventory 207 198 67 129 324 152
Births (+) 147 89 72 94 226 151
Purchases (+) 123 21 9 6 21 5
Deaths (-) 28 12 15 15 48 30
Sales (-) 142 64 16 82 108 28
Closing inventory 307 232 117 132 415 250
*Data for nomadic herds are incomplete, with records for only two of four seasons.
Annex 4 : Mean daily feed rations per animal in sedentary herds (kg)
Cattle (n=390)
Alfalfa/ Clover Grasses Hay Bread
Oil seeds (& cakes)
Barley BranMaize seed/straw
Straw
Autumn 1.62 0.73 0.52 0.06 0.06 2.72
Winter 5.83 1.55 0.01 0.01 0.15 0.05 1.99
Spring 2.66 0.25 0.78 0.06 0.50 0.01 2.4 2.21
Summer 0.07 0.03 0.01 0.17 0.40 1.32
Sheep and Goats (n=1463)
Alfalfa/ Clover Grasses Hay Bread Thorns/
Leaves Barley BranMaize Seed/straw
Straw
Autumn 0.31 0.03 0.07 0.56
Winter 0.39 0.28 0.27 0.02
Spring 0.21 0.07 0.06 0.21 0.09
Summer 0.01 0.05 0.01 0.01 0.28

Water, Opium and Livestock: Findings from the First Year of Farm and Household Monitoring
75
Annex 5: Gross margin for livestock production adjusted for reported milk consumption ($USD)
Mean Expenditure Mean Income Gross margin Domestic
consumptionCattle (390)
Irrigated 381.41 53.12 -327.88 366.92Semi-irrigated 232.50 41.41 -191.09 193.91
Rainfed 106.37 31.64 -212.74 120.58Sheep/goat (1463)
Irrigated 39.99 31.36 -8.63 12.90Semi-irrigated 42.48 13.43 -29.05 23.28
Rainfed 29.75 13.67 -16.08 30.88Sheep/goat (1174)
Nomadic 7.14 19.51 12.37 8.13
Annex 6: Reported utilisation of external labour days on farm*
Unwaged days Waged daysMean Std Dev Mean Std Dev
Irrigation 2.08 3.650 0.55 3.109
Land preparation 2.67 5.430 1.25 4.346
Weeding 0.34 1.179 0.56 3.024
Harvest 1.94 4.919 2.71 7.818
Transport 0.13 0.488 0.69 6.808
Shepherd 1.9 12.740 4.65 4.137
Crop processing 0.13 0.680 1.81 8.908
Livestock processing 0.02 0.141
Sowing/planting 0.03 0.261
Total 9.21 12.25
Unwaged days Waged daysMean Std Dev Mean Std Dev
Irrigated 10.70 15.756 10.95 10.797
Semi-irrigated 8.58 7.856 8.27 18.619
Rainfed 4.00 5.916 14.93 18.143
*Exclusive of labour on poppy.

Afghanistan Research and Evaluation Unit
76
Annex 7: Weekly acquisition and per capita consumption of key food types
IrrigatedSem
i-irrigatedRainfed
Farm
KgPurchase
KgTotal Kg
Per capita*
Farm
KgPurchase
KgTotal Kg
Per capita*
Farm
KgPurchase Kg
Total Kg
Per capita*
Wheat
2539.82
64.826.93
29.7632.59
62.356.89
35.8824.74
60.627.32
Rice23.78
7.4331.21
3.349.12
9.121.01
11.0711.07
1.34
Vegetables 11.14
8.2119.35
2.079.5
22.532.02
3.543.19
5.138.32
1.00
Fruit8.46
3.6612.12
1.304.93
21.9326.86
2.972
7.059.05
1.09
Milk/dairy
6.832.92
9.751.04
5.494.63
10.121.12
14.691.43
16.121.95
Meat
3.571.83
5.40.58
62.78
8.780.97
5.152.56
7.710.93
Oil
1.943.28
5.220.56
2.252.93
5.180.57
0.753.74
4.490.54
Chicken 2.38
2.014.39
0.472.5
2.054.55
0.501.78
2.083.86
0.47
Eggs (units)11.68
13.1724.85
2.6620.11
15.535.61
3.935.07
3.68.67
1.05
*Calculating per capita consumption, children under 7 years are valued at 0.5 adult level of consum
ption

Water, Opium and Livestock: Findings from the First Year of Farm and Household Monitoring
77
Annex 8: Projected annual cash flow for the model farming household ($USD)
Dec Jan Feb Mar Aprl May Jun Jul Aug Sept Oct Nov
Food purchases
150 150 150 150 150 150 150 150 150 150 150 150
Plum 3.32 3.32 3.32 6.65 6.65 6.65 3.32 3.32 3.32
Wheat 9.64 9.64 9.64 19.28 19.28 19.28 9.64 9.64 9.64
Onion 1.78 1.78 1.78 3.5 3.5 3.5 1.78 1.78 1.78
Potato 22.6 22.6 22.6 11.32 11.32 11.32 11.32 11.32 11.32
Alfalfa 18.76 18.76 18.76 9.4 9.4 9.4 9.4 9.4 9.4
Cotton 16.5 16.5 16.5 8.2 8.2 8.2 8.2 8.2 8.2
Maize 5.8 5.8 5.8 11.6 11.6 11.6 5.8 5.8 5.8
Cattle 62.7 62.7 62.7 25 25 25 12.5 12.5 12.5 25 25 25
Sheep 26.6 26.6 26.6 17.77 17.77 17.77 8.9 8.9 8.9
Total 276.64 282.4 301.2 274.58 280.4 271 203.9 198.1 198.1 221.1 215.3 205.9
Wage incomes
128 128 128 105 105 105 90.5 90.5 90.5 67 67 67
Women weaving
0 0 0 6 6 6 6 6 6 0 0 0
Plum 89.9 89.9 89.9
Wheat (sharecrop
50%)54.2 54.2 54.2
Onion 61.6 61.6 61.6
Potato 166.6 333.3
Alfalfa 22.3 22.3 22.3 22.3 22.3 22.3
Cotton 108 216
Maize 26.35 52.71
Cattle 35 35 35 35 35 35 35 35 35 35 35 35
Sheep 0 0 0 29.5 29.5 29.5 29.5 29.5 29.5 0 0 0
Total 163 163 163 252 480.2 844.8 550.8 299.6 236 102 102 102

Afghanistan Research and Evaluation Unit
78
Annex 9: Results of the regression analysis for farming household nutrition
Model Summary(b)
Model R R Square Adjusted R Square Std. Error of the Estimate
1 .583(a) .339 .286 64.41182
a Predictors: (Constant), CD, OFIN, IWF, CT, SP, GCA. b Dependent Variable: NT
ANOVA(b)
Model Sum of Squares df Mean
Square F Sig.
1
Regression 159819.323 6 26636.554 6.420 .000(a)
Residual 311166.190 75 4148.883
Total 470985.513 81
a Predictors: (Constant), CD, OFIN, IWF, CT, SP, GCA. b Dependent Variable: NT
Coefficients(a)
a Dependent Variable: NT
Collinearity Diagnostics(a)
a Dependent Variable: NT
Model
Unstandardized Coefficients
Standardized Coefficients t Sig. 95% Confidence
Interval for B Correlations
B Std. Error Beta Lower
BoundUpper Bound
Zero-order Partial Part
1 (Constant) 84.605 24.671 3.429 .001 35.458 133.752
CT 24.677 4.610 .572 5.353 .000 15.493 33.861 .353 .526 .502
SP -.408 .675 -.088 -.604 .547 -1.752 .936 -.103 -.070 -.057
GCA .010 .326 .005 .030 .976 -.639 .658 -.004 .003 .003
OFIN .025 .037 .078 .665 .508 -.049 .099 .177 .077 .062
IWF .397 .139 .288 2.853 .006 .673 .120 .220 313 .268
CD 15.212 6.106 .283 2.491 .015 27.376 3.049 .180 276 .234
Model Dimension Eigenvalue Condition Index
Variance Proportions
(Constant) CT SP GCA OFIN IWF CD
1 1 4.347 1.000 .00 .01 .01 .00 .01 .01 .01
2 1.074 2.012 .01 .00 .04 .22 .02 .00 .00
3 .732 2.437 .00 .00 .01 .04 .12 .49 .00
4 .457 3.083 .01 .01 .11 .07 .16 .46 .02
5 .190 4.785 .01 .06 .55 .14 .17 .00 .28
6 .145 5.477 .02 .88 .00 .00 .01 .02 .30
7 .054 8.970 .96 .04 .27 .52 .53 .01 .38

Water, Opium and Livestock: Findings from the First Year of Farm and Household Monitoring
79
Bibliography
Al Latawi, A. and S. Nadaf. Focus on Seed Programs: The Seed Industry In Oman. Oman: Agricultural Research Centre, 2001. http://www.icarda.cgiar.org/Seed_Unit/Pdf/Focus/FOCUS-Oman.pdf (accessed October 2008)
Afghanistan Research and Evaluation Unit. Water Management, Livestock and the Opium Economy: Annotated Bibliography. Kabul: Afghanistan Research and Evaluation Unit, 2006.
Islamic Republic of Afghanistan’s Central Statistics Office. Afghanistan Statistical Yearbook 2006. Kabul: Central Statistics Office, 2006.
DFID. Sustainable Livelihoods Framework. 2000. http://www.sustainablelivelihoods.org/index1.htm (accessed October 2008).
Fitzherbert, A. “Water Management Livestock and the Opium Economy: Livestock Husbandry.” Kabul: Afghanistan Research and Evaluation Unit, 2006.
Grace, J. and A. Pain. Rethinking Rural Livelihoods in Afghanistan. Kabul: Afghanistan Research and Evaluation Unit, 2004.
Lee J. “Water Management, Livestock and the Opium Economy: Social Water Management.” Kabul: Afghanistan Research and Evaluation Unit, 2006.
McAllister Anderson, I. “Water Management Livestock and the Opium Economy: Irrigation.” Kabul: Afghanistan Research and Evaluation Unit, 2006.
McEwen, A. and B. Whitty, “Water Management, Livestock and the Opium Economy: Land Tenure.” Kabul; Afghanistan Research and Evaluation Unit, 2006.
McEwen, A. and S. Nolan. Water Management, Livestock and the Opium Economy: Options for Land Registration. Kabul, Afghanistan Research and Evaluation Unit, 2007.
National Surveillance System and Vulnerability Analysis Unit. National Risk and Vulnerability Analysis. Kabul. Afghanistan Ministry of Rural Rehabilitation and Development/Central Statistics Office, 2003, 2005.
National Surveillance System and Vulnerability Analysis Unit. National Risk and Vulnerability Analysis. Kabul, Afghanistan Ministry of Rural Rehabilitation and Development/Central Statistics Office, 2005, 2007.
Roe, A. “Water Management, Livestock and the Opium Economy: Baseline Survey.” Kabul, Afghanistan Research and Evaluation Unit, 2006.
Roe, A. Water Management, Livestock and the Opium Economy: Natural Resources Management, Farming Systems and Rural Livelihoods. Kabul, Afghanistan Research and Evaluation Unit, 2008.
Ruel, Marie T. “Is Dietary Diversrity an Indicator of Food Security or Dietary Quality? A Review of Measurement Issue and Research Needs.” Washington: International Food Policy Research Institute, 2002. Available at http://www.ifpri.org/divs/fcnd/dp/papers/fcndp140.pdf.

Afghanistan Research and Evaluation Unit
80
Thomson, E. “Water Management, Livestock and the Opium Economy: Livestock Production and Health.” Kabul, Afghanistan Research and Evaluation Unit, 2006.
World Food Program (WFP). “Vulnerability Analysis and Mapping (VAM) National Assessment 2000.” Kabul: World Food Programme, 2000.
World Food Program. “Vulnerability Analysis and Mapping (VAM) National Assessment 2001.” Kabul: World Food Programme, 2001.
World Food Program. “Vulnerability Analysis and Mapping (VAM) National Assessment 2002.” Kabul: World Food Programme, 2002.
World Food Program. “National Risk and Vulnerability Assessment (NRVA) 2003.” Kabul: World Food Program, 2003.
World Food Program. “National Risk and Vulnerability Assessment (NRVA) 2005.” Kabul: World Food Program, 2005.

Water, Opium and Livestock: Findings from the First Year of Farm and Household Monitoring
81
Recent Publications from AREU
April 2009 Water Strategy Meets Local Reality, by Kai Wegerich
April 2009 Land Conflict in Afghanistan: Building Capacity to AddressVulnerability, by Colin Deschamps and Alan Roe
April 2009 Reflections on the Paris Declaration and Aid Effectiveness in Afghanistan, by Rebecca Roberts
April 2009 Policymaking in Agriculture and Rural Development in Afghanistan, by Adam Pain and Sayed Mohammad Shah
April 2009 Mutual Accountability in Afghanistan: Promoting Partnerships in Development Aid?, by Marieke Denissen
April 2009 A Historical Perspective on the Mirab System: A Case Study of the Jangharok Canal, Baghlan, by Vincent Thomas and Mujeeb Ahmad
March 2009 Afghanistan’s New Political Parties: A Means to Organise Democratisation?, by Anna Larson
Feb. 2009 Decisions, Desires and Diversity: Marriage Practices in Afghanistan, by Deborah J. Smith
Feb. 2009 Afghanistan National Development Strategy (ANDS) Formulation Process: Influencing Factors and Challenges, by Sayed Mohammed Shah
Jan. 2009 The A to Z Guide to Afghanistan Assistance 2009 (Seventh Edition)January 2009 Delivering on Poverty Reduction: Focusing ANDS Implementation on Pro-Poor Outcomes, by Paula Kantor, Adam Pain, et al.
Dec. 2008 Microcredit, Informal Credit and Rural Livelihoods: A Village Case Study in Balkh Province, by Erna Andersen and Amanda Sim
Dec. 2008 “Let them Eat Promises”: Closing the Opium Poppy Fields in Balkh and its Consequences, by Adam Pain
Dec. 2008 Counter-Narcotics in Afghanistan: The Failure of Success?, by David Mansfield and Adam Pain
Nov. 2008 A Mandate to Mainstream: Promoting Gender Equality in Afghanistan, by Anna Larson
Nov. 2008 Elections in 2009 and 2010: Technical and Contextual Challenges toBuilding Democracy in Afghanistan, by Grant Kippen
The Afghanistan Research and Evaluation Unit (AREU) is an independent research organisation based in Kabul. AREU’s mission is to conduct high-quality research that informs and influences policy and practice. AREU also actively promotes a culture of research and learning by strengthening analytical capacity in Afghanistan and fa-cilitating reflection and debate. Fundamental to AREU’s vision is that its work should improve Afghan lives.
All AREU publications are available for download at www.areu.org.af and in hard copy from the AREU office:
Flower Street (corner of Street 2), Shahr-i-Naw, Kabul
phone: +93 (0)799 608 548 website: www.areu.org.af email: [email protected]