Embed Size (px)
Citation preview
553
ANNALS OF GEOPHYSICS, VOL. 51, N. 4 August 2008
Key words geomagnetism – magnetic dating – relo-cation
1. Introduction
The geomagnetic field is commonly de-scribed through its potential, which can be rep-resented by a spherical harmonic series. A se-ries of coefficients (that are referred to as Gausscoefficients) of the spherical functions areenough to accurately depict the features of thefield for a given time. The International Associ-
ation of Geomagnetism and Aeronomy (IAGA)publishes regularly estimates of the Gauss coef-ficients at five-yearly intervals (Maus et al.,2005) these constitute the so-called IGRF mod-els that cover the evolution of the geomagneticfield from 1900 up to present. Another set oftime-dependent Gauss coefficients, coveringthe interval from 1590 to 1990, compose theGUFM1 model by Jackson et al. (2000). Thehistorical part of the model is essentially basedon ship log books.
Recently, both geomagnetic models (IGRF-9 and GUFM1) have been used to compute thedistribution of errors due to relocation of geo-magnetic data (Casas and Incoronato, 2007).Relocation is routinely carried out by archaeo-magnetists and consists on reducing data to acentral location. This procedure permits tocompare geomagnetic data from different loca-
Application of the relocation-errordistribution on geomagnetic databases.
Analyses on the «Historical Italian Geomagnetic Data Catalogue»
Lluís Casas (1) and Alberto Incoronato (2) (1) Departament de Geologia, Universitat Autònoma de Barcelona, Spain
(2) Dipartimento di Scienze della Terra, Università degli Studi di Napoli, Italy
Abstract The reliability of the Historical Italian Geomagnetic Data Catalogue, comprising 536 directions and 393 inten-sities, has been assessed by comparing the historical geomagnetic measurements with the GUFM1 model pre-dictions. Such measurements were assessed at three selected relocation centres. For all the data contained in theCatalogue it has been calculated the discrepancy between the relocated data and the GUFM1-model predictionat the relocation centres. There is a correlation between relocation distance and the mean discrepancy. The up-per limit of discrepancy assumable as relocation error has been selected using error distributions previously cal-culated using geomagnetic field models. Angular and intensity threshold lines have been slightly shifted upwardsto account for the estimated error of GUFM1 model itself at the considered region, mainly due to the crustalfield. The Italian database proved to contain reliable data, as only a very low percentage of data (namely 14 di-rections and 20 intensities) can be considered anomalous. Possible explanations for such questionable data aresuggested. All the remaining data of this catalogue could thus be added to the databases used to produce region-al or global geomagnetic models.
Mailing address: Dr. Lluís Casas, Departament deGeologia, Universitat Autònoma de Barcelona, Edifici C,Campus de la UAB, 08193 Bellaterra (Cerdanyola del Val-lès), Spain; e-mail: [email protected]
Miscellanea 9-03-2009 14:41 Pagina 553
554
L. Casas and A. Incoronato
tions. The relocation process is usually per-formed using the «conversion via pole» method(CVP) and assumes a purely dipolar field with-in the area where the relocation is done. As isstated in Casas and Incoronato (2007) the distri-bution of relocation errors can be used by ar-chaeomagnetists as an indication of the maxi-
mum error induced by such a practice. Howev-er, this conclusion is restricted to periods withsimilar or lower values of the ratio between di-pole to non-dipole contributions than in thepresent geomagnetic field; this could cover atleast the last 7000 years (Korte and Constable,2005).
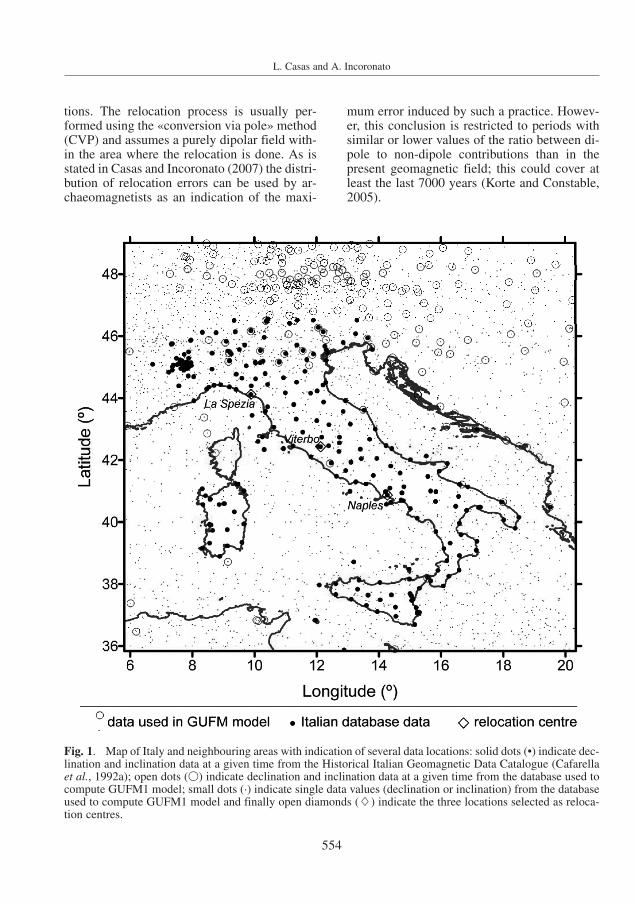
Fig. 1. Map of Italy and neighbouring areas with indication of several data locations: solid dots (•) indicate dec-lination and inclination data at a given time from the Historical Italian Geomagnetic Data Catalogue (Cafarellaet al., 1992a); open dots (�) indicate declination and inclination data at a given time from the database used tocompute GUFM1 model; small dots (·) indicate single data values (declination or inclination) from the databaseused to compute GUFM1 model and finally open diamonds (�) indicate the three locations selected as reloca-tion centres.
Miscellanea 9-03-2009 14:41 Pagina 554
555
Relocation-error distribution to analyse the «Historical Italian Geomagnetic Data Catalogue»
Another possible application of the distribu-tion of relocation errors can be found on obser-vatory data from historical periods (last 400years). The error distribution can be used to de-tect spurious data within historical geomagnet-ic databases. The historical Italian geomagnet-ic data catalogue (Cafarella et al., 1992a) hasbeen used as a demonstrative example. Thisdatabase, fully available at the cited reference(Cafarella et al., 1992a) is an excellent compi-lation of declination, inclination and intensitydata (both isolate and simultaneous determina-tions essentially from the 19th century) frommany locations in Italy obtained from librariesof old institutes and universities, as well as da-ta from Italian observatories (Cafarella et al.,1992b).
The limited resolution of historical (andolder) models that often results in an imperfectrepresentation of the non-dipole field structure,
brings a worthy motive to apply the relocation-error distribution, which checks the self-consis-tency of data assemblies, instead of foundingdecisions on data quality solely on a geomag-netic field model. Moreover, the methodologyused and presented in this paper allows a quicksurvey on long lists of geomagnetic data with-out the need of computing the «true» values(from a global model) at every single locationbut only at a few selected relocation centres.
2. Analysis on the Historical Italian Geomagnetic Data Catalogue
2.1. Methodology
The geomagnetic field for the time period ofthe data from the Italian catalogue is well de-scribed by the GUFM1 model (Jackson et al.,
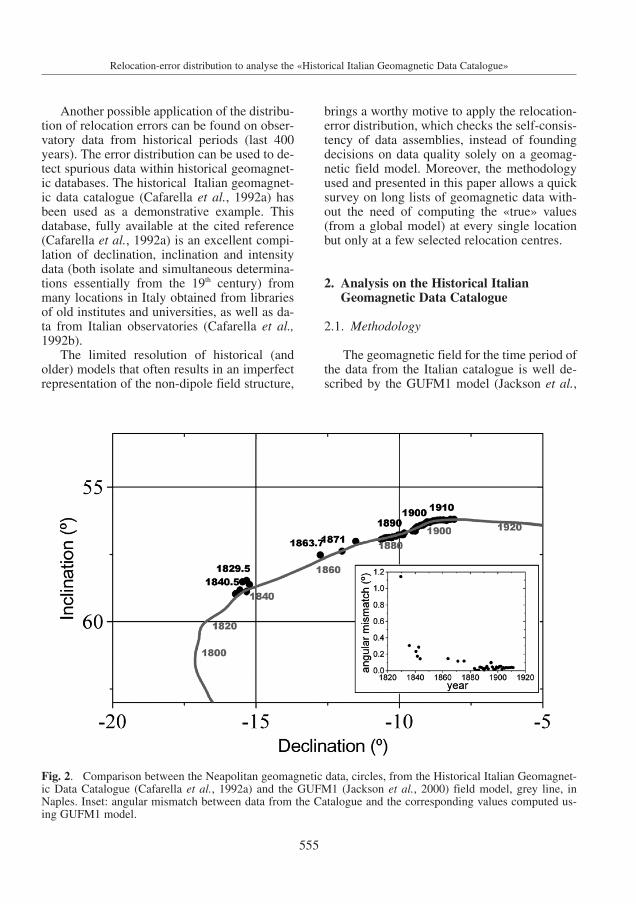
Fig. 2. Comparison between the Neapolitan geomagnetic data, circles, from the Historical Italian Geomagnet-ic Data Catalogue (Cafarella et al., 1992a) and the GUFM1 (Jackson et al., 2000) field model, grey line, inNaples. Inset: angular mismatch between data from the Catalogue and the corresponding values computed us-ing GUFM1 model.
Miscellanea 9-03-2009 14:41 Pagina 555
556
L. Casas and A. Incoronato
2000). It is worth to note that data from the Ital-ian catalogue were not used to build theGUFM1 model (see fig. 1), one of the authorsof this model (A. Jackson) kindly provided uswith the entire database used in his model andhe also confirmed in a personal communicationwith the authors that the Italian catalogue wasnot used to develop GUFM1. However, the con-sistency between the Italian catalogue and themodel can be assessed by comparing the his-torical geomagnetic measurements made inNaples (which is the most represented locationwithin the Italian catalogue) with the modelpredictions for this location (fig. 2), coefficientR2 is 0.995.
The calculation of the relocation error forany given geomagnetic datum requires theknowledge of the «true» value of the magnitudeconsidered (direction or intensity) at the reloca-
tion centre. Relocation error distributions pre-sented in Casas and Incoronato (2007) werecalculated considering a grid of relocation cen-tres. For each of them, geomagnetic data fromneighbouring sites (within a radius of 1200 km)obtained from a model (IGRF or GUFM1) wererelocated. The relocation error was calculatedas the difference between the relocated data andthe data predicted by the model at the relocationcentre. Relocation error distributions calculatedusing the historical database were computedsimilarly. The «true» values at the relocationcentres were calculated using the GUFM1 geo-magnetic field model.
Data containing both declination and incli-nation of a given site and time were selectedfrom the Italian catalogue to carry out the direc-tional analysis. For the intensity analysis, datacontaining both inclination and the horizontal
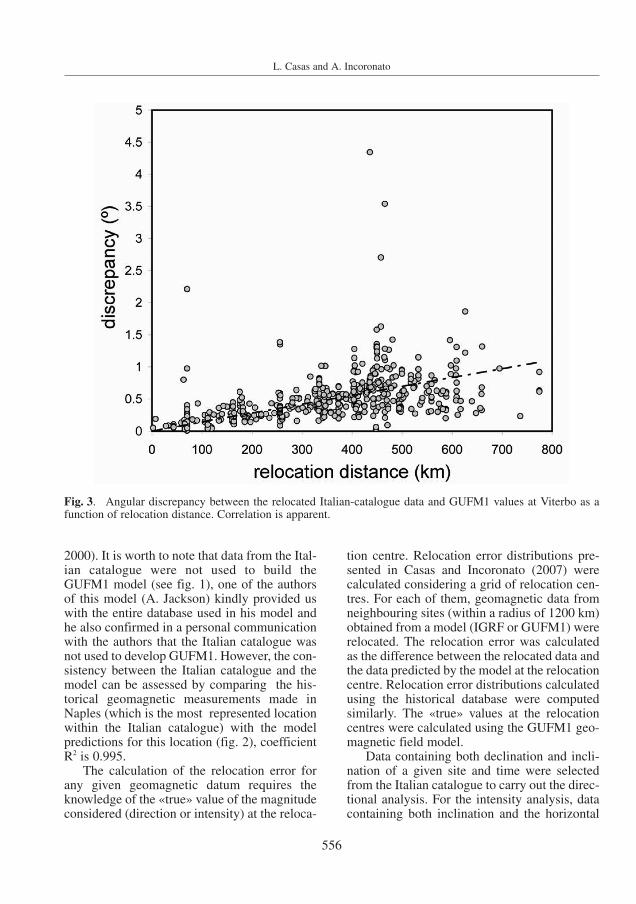
Fig. 3. Angular discrepancy between the relocated Italian-catalogue data and GUFM1 values at Viterbo as afunction of relocation distance. Correlation is apparent.
Miscellanea 9-03-2009 14:42 Pagina 556
557
Relocation-error distribution to analyse the «Historical Italian Geomagnetic Data Catalogue»
projection (H) of the magnetic vector were se-lected. All the selected data (536 directions and393 intensity values) were relocated to each oneof three central locations distributed along theItalian latitude range (La Spezia, Viterbo andNaples) and their alleged relocation error wasevaluated as the discrepancy between the relo-cated values and the ones predicted accordingto the GUFM1 model. The correlation betweenrelocation distance and the mean «discrepancy»is the same found in Casas and Incoronato(2007). As an example the angular discrepancybetween relocated data from the Italian cata-logue and GUFM1 values at Viterbo as a func-tion of relocation distance is plotted in fig. 3.The correlation is apparent, R2 parameter is0.167. To cancel out the dispersion effect thecorrelation parameter can be computed averag-ing the data at 10 km intervals, then R2 raises to0.454 and using only data with a relocation dis-tance lower than 450 km is already 0.815. How-ever some data exhibit discrepancy values that
cannot be explained as solely due to relocationerror.
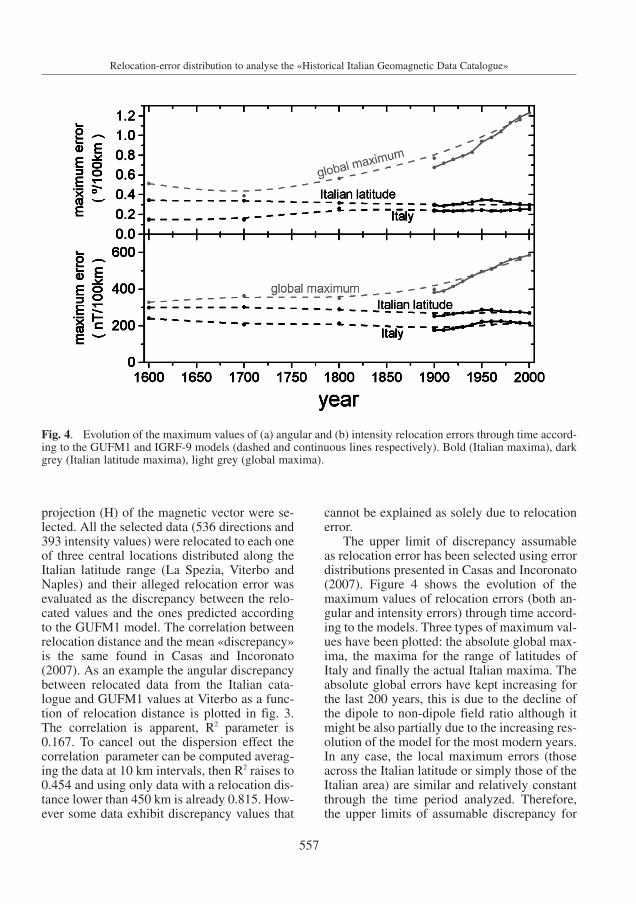
The upper limit of discrepancy assumableas relocation error has been selected using errordistributions presented in Casas and Incoronato(2007). Figure 4 shows the evolution of themaximum values of relocation errors (both an-gular and intensity errors) through time accord-ing to the models. Three types of maximum val-ues have been plotted: the absolute global max-ima, the maxima for the range of latitudes ofItaly and finally the actual Italian maxima. Theabsolute global errors have kept increasing forthe last 200 years, this is due to the decline ofthe dipole to non-dipole field ratio although itmight be also partially due to the increasing res-olution of the model for the most modern years.In any case, the local maximum errors (thoseacross the Italian latitude or simply those of theItalian area) are similar and relatively constantthrough the time period analyzed. Therefore,the upper limits of assumable discrepancy for
Fig. 4. Evolution of the maximum values of (a) angular and (b) intensity relocation errors through time accord-ing to the GUFM1 and IGRF-9 models (dashed and continuous lines respectively). Bold (Italian maxima), darkgrey (Italian latitude maxima), light grey (global maxima).
Miscellanea 9-03-2009 14:42 Pagina 557

558
L. Casas and A. Incoronato
the Italian region have been selected as 0.35ºand 300 nT per every relocated hundred of kilo-metres. Threshold lines have been shifted up-wards 0.5º and 300 nT to account for the esti-mated error of GUFM1 model itself at the con-sidered region, which is mainly due to thecrustal field (Jackson, et al., 2000). Thismethodology allows a quick survey on longlists of geomagnetic data without the need ofcomputing the «true» values (from a globalmodel) at every single location but only at somerelocation centres.
2.2. Results
Figure 5 shows the discrepancy between re-located and predicted values at Viterbo as afunction of relocation distance. The shifted andunshifted upper limits have been plotted to re-veal the outliers, though they show discrepancyvalues well above the average ones. The shift ofthe threshold lines reduces the number of out-liers and can be considered as a cautious filterto avoid the exclusion of appropriate data. Ta-bles I and II show the assembly of data that be-ing relocated fail to lie below the line of assum-able relocation error for at least one of the threerelocation centres. These are 14 directions and20 intensity data that could be regarded asanomalous. They only represent the 2.6% and
the 5.1% of the total amount of directions andintensity values respectively.
3. Discussion
Although some data are revealed as erro-neous for any relocation centre considered, it isnoticeable that every relocation centre has ahigher sensitivity to detect outliers from nearbylocations. For instance, spurious data fromnorthern Italy (Milano, Moncalieri…) are espe-cially detected from La Spezia, whereas spuri-ous data from Sicily (Palermo, Caltanissetta…)are particularly detected from Naples. This in-dicates that the defined threshold could actual-ly be logarithmic instead of linear. However,systematic evaluations described in Casas andIncoronato (2007) point to a linear dependenceof the maximum errors up to relocation dis-tances of 1200km. Anyhow, this non-uniformsensitivity advises to perform this kind ofanalysis from a grid of relocation centres in-stead of a single central point.
The anomalous values could be due to local-ly important crustal disturbances, for instance50% of the spurious directional data comesfrom Moncalieri and Lanzo Torinese (two loca-tions from the Piedmont only 30 km away fromeach other). These data were published by asingle author (Boddaert, 1907). However, most
Fig. 5. Angular (a) and intensity (b) discrepancy between relocated data from the Italian catalogue and GUFM1values at Viterbo as a function of relocation distance. Shifted line of maximum assumable relocation error hasbeen plotted to identify anomalous data.
Miscellanea 9-03-2009 14:42 Pagina 558
559
Relocation-error distribution to analyse the «Historical Italian Geomagnetic Data Catalogue»
of the data in the Italian database from thesetwo locations and from Superga, spelled asSoperga in the database, (~10 km away fromMoncalieri) published by several authors liejust below the defined threshold. In fact, situat-ing Moncalieri and its surrounding locations onan aeromagnetic anomaly map of Italy (Cara-tori-Tontini et al., 2004) one notices that theylie in a zone with important positive and nega-tive magnetic anomalies and thus with impor-tant anomaly gradients which can result in highrelocation errors. Concerning the anomalous di-rectional data from other locations, we couldpresume instrumental errors for one datumfrom Naples (1829.5) and two data from Rome(1640.5 and 1833.1) as they are the oldestmeasurements (comprising both declinationand inclination) from these two locations. Thecorrelation between time and angular mismatch
observed in fig. 2 (inset) supports the signs oflower quality for the oldest data. Although notbeing that old, possibly instrumental errors arealso affecting the anomalous values registeredin Bormio and Castelnuovo because they aredetected for any of the three selected relocationcentres and their associated relocation errorsare several times the average relocation errorvalues and thus the discrepancy cannot bemerely attributed to the combined effect of re-location procedure and crustal field.
Anomalous intensity values can be partlyexplained by the low quality of their associateddirectional data which is fundamental to com-pute the relocation of intensity. For a significantpart of the anomalous intensity data (40%) theassociated declination values were not availableand thus, for the relocation of the intensity, theposition of the virtual pole obtained from a
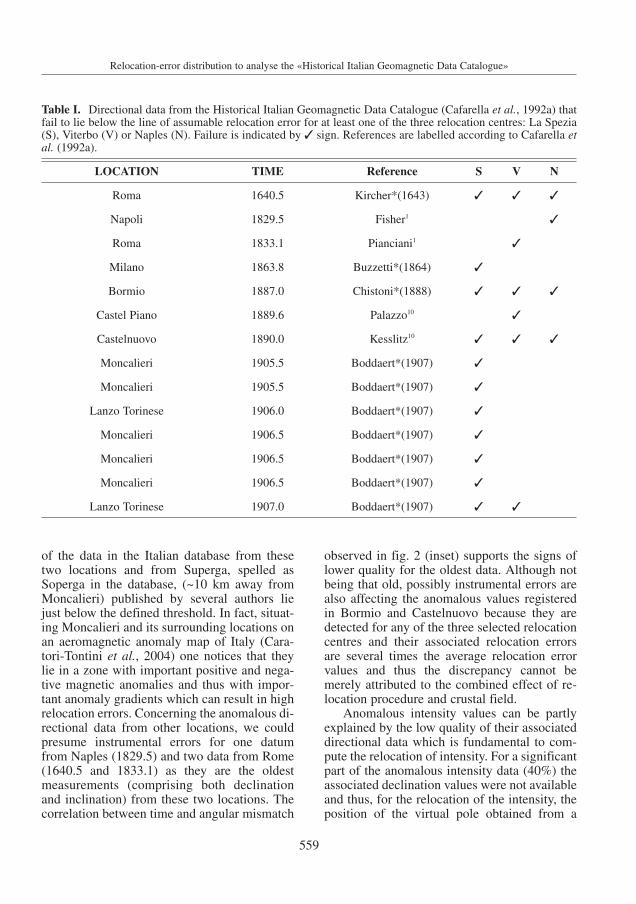
Table I. Directional data from the Historical Italian Geomagnetic Data Catalogue (Cafarella et al., 1992a) thatfail to lie below the line of assumable relocation error for at least one of the three relocation centres: La Spezia(S), Viterbo (V) or Naples (N). Failure is indicated by ✓ sign. References are labelled according to Cafarella etal. (1992a).
LOCATION TIME Reference S V N
Roma 1640.5 Kircher*(1643) ✓ ✓ ✓
Napoli 1829.5 Fisher1 ✓
Roma 1833.1 Pianciani1 ✓
Milano 1863.8 Buzzetti*(1864) ✓
Bormio 1887.0 Chistoni*(1888) ✓ ✓ ✓
Castel Piano 1889.6 Palazzo10 ✓
Castelnuovo 1890.0 Kesslitz10 ✓ ✓ ✓
Moncalieri 1905.5 Boddaert*(1907) ✓
Moncalieri 1905.5 Boddaert*(1907) ✓
Lanzo Torinese 1906.0 Boddaert*(1907) ✓
Moncalieri 1906.5 Boddaert*(1907) ✓
Moncalieri 1906.5 Boddaert*(1907) ✓
Moncalieri 1906.5 Boddaert*(1907) ✓
Lanzo Torinese 1907.0 Boddaert*(1907) ✓ ✓
Miscellanea 9-03-2009 14:42 Pagina 559
560
L. Casas and A. Incoronato
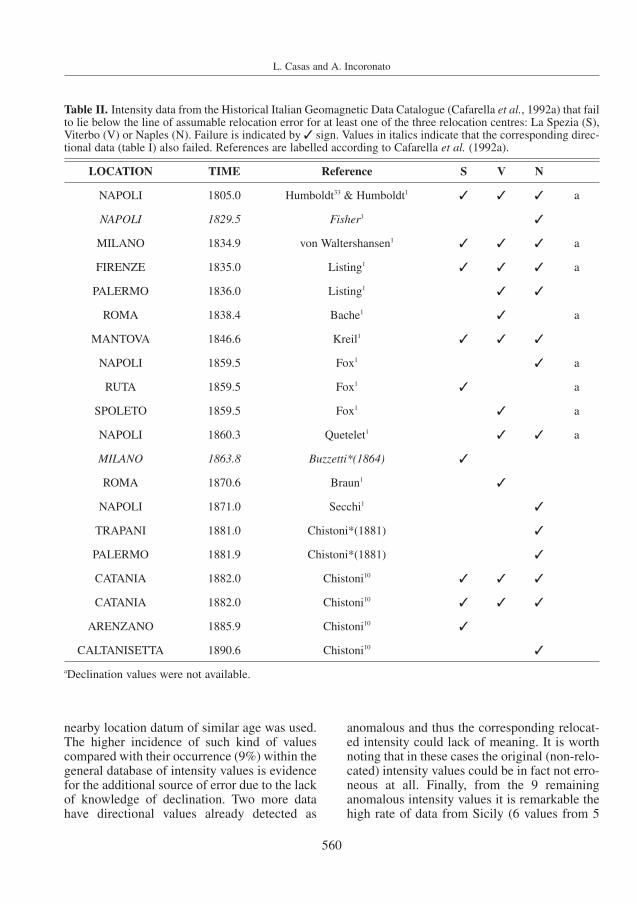
Table II. Intensity data from the Historical Italian Geomagnetic Data Catalogue (Cafarella et al., 1992a) that failto lie below the line of assumable relocation error for at least one of the three relocation centres: La Spezia (S),Viterbo (V) or Naples (N). Failure is indicated by ✓ sign. Values in italics indicate that the corresponding direc-tional data (table I) also failed. References are labelled according to Cafarella et al. (1992a).
LOCATION TIME Reference S V N
NAPOLI 1805.0 Humboldt33 & Humboldt1 ✓ ✓ ✓ a
NAPOLI 1829.5 Fisher1 ✓
MILANO 1834.9 von Waltershansen1 ✓ ✓ ✓ a
FIRENZE 1835.0 Listing1 ✓ ✓ ✓ a
PALERMO 1836.0 Listing1 ✓ ✓
ROMA 1838.4 Bache1 ✓ a
MANTOVA 1846.6 Kreil1 ✓ ✓ ✓
NAPOLI 1859.5 Fox1 ✓ a
RUTA 1859.5 Fox1 ✓ a
SPOLETO 1859.5 Fox1 ✓ a
NAPOLI 1860.3 Quetelet1 ✓ ✓ a
MILANO 1863.8 Buzzetti*(1864) ✓
ROMA 1870.6 Braun1 ✓
NAPOLI 1871.0 Secchi1 ✓
TRAPANI 1881.0 Chistoni*(1881) ✓
PALERMO 1881.9 Chistoni*(1881) ✓
CATANIA 1882.0 Chistoni10 ✓ ✓ ✓
CATANIA 1882.0 Chistoni10 ✓ ✓ ✓
ARENZANO 1885.9 Chistoni10 ✓
CALTANISETTA 1890.6 Chistoni10 ✓
aDeclination values were not available.
nearby location datum of similar age was used.The higher incidence of such kind of valuescompared with their occurrence (9%) within thegeneral database of intensity values is evidencefor the additional source of error due to the lackof knowledge of declination. Two more datahave directional values already detected as
anomalous and thus the corresponding relocat-ed intensity could lack of meaning. It is worthnoting that in these cases the original (non-relo-cated) intensity values could be in fact not erro-neous at all. Finally, from the 9 remaininganomalous intensity values it is remarkable thehigh rate of data from Sicily (6 values from 5
Miscellanea 9-03-2009 14:42 Pagina 560
561
Relocation-error distribution to analyse the «Historical Italian Geomagnetic Data Catalogue»
different locations) although it is difficult to ex-plain this geographical concentration in termsof crustal anomalies as the Sicilian directionaldata does not appear as doubtful.
4. Conclusions
The distribution of relocation errors calcu-lated using IGRF-9 and GUFM1 models hasbeen applied to a historical geomagnetic data-base (the Historical Italian Geomagnetic DataCatalogue) to detect abnormal data. Specificconclusions (on the Italian database) and gener-al conclusions (on the approach used) can bedrawn.
The Italian database has proven to containreliable data, only a very low percentage of da-ta (14 directions and 20 intensities) can be con-sidered anomalous. This catalogue could thusbe added to the databases used to produce re-gional or global geomagnetic models. Somereasons can be hypothesized to explain some ofthe outliers: i) poor quality of the measure-ments, this appears to correlate with the oldestdata, ii) intensity data can appear anomalous asa consequence of the poor quality of their asso-ciated directional data, iii) local crustal distur-bances of the internal field, grounds for this ef-fect are found for several data from the Pied-mont area.
The latter reason implies that not all anom-alous values are actually erroneous; discrepan-cies can arise from the fact that GUFM1 modelwas devised as a model for the core-mantleboundary and its extrapolation to the Earth’ssurface disregards crustal contributors.
The described methodology takes advan-tage of the higher resolution of the geomagnet-ic models that describe the present field to de-fine the limits to decide whether a value is con-sistent or requires additional explanation. Sim-ple comparison between the historical geomag-netic database values and its corresponding val-ues computed from a model would evade anoverview on the global structure of the field andit would be difficult to establish acceptance lim-its as there are no uncertainty indications relat-ed to the values predicted by the model.
A secondary advantage of the described
methodology over the simple comparison be-tween every single data and its value computedfrom a model is precisely the fact that it is notnecessary to compute all the data through themodel. This could be important whenever themodel is difficult to compute or simply notcomputable for some areas (e.g. when using anon-global model to evaluate data that lie out-side the application limits of the model, the da-ta could be relocated to a centre within the ap-plication area). Finally, even without any mod-el at all, the approach presented here could beused as a way to check the self-consistency ofany assembly of data by relocating contempora-neous data to every neighbouring available datalocation. This should be helpful in areas wherethe existing models predict the field based ononly a few historical records and speciallywhen dealing with assemblies of archaeomag-netic data from a given area.
Acknowledgments
Financial support from AARCH – ResearchTraining Network (UE, contract n. PRNCT-2002-00219) and EME2005-42 projects is ac-knowledged. The paper benefited from con-structive reviews by two anonymous reviewers.
REFERENCES
BOODAERT, D. (1907): Misure magnetiche nei dintorni di Tori-no. Declinazione e inclinazione, Memoria della R. Ac-cademia delle Scienze di Torino, 58, series 2, 397-450.
CAFARELLA, L., A. DE SANTIS and A. MELONI (1992a): TheHistorical Italian Geomagnetic Data Catalogue, ING,Rome, pp. 160.
CAFARELLA, L., A. DE SANTIS and A. MELONI (1992b): Sec-ular variation in Italy from historical geomagnetic fieldmeasurements, Phys. of the Earth and Planet. Int., 73(3-4), 206-221.
CARATORI-TONTINI, F., P. STEFANELLI, I. GIORI, O. FAGGIONI
and C. CARMISCIANO (2004): The revised aeromagnet-ic anomaly map of Italy, Annals of Geophysics, 47 (5),1547-1555.
CASAS, LL. and A. INCORONATO, (2007): Distribution analysisof errors due to relocation of geomagnetic data using the«Conversion via Pole» (CVP) method: implications onarchaeomagnetic data, Geophys. J. Int., 169, 448-454.
JACKSON, A., A JONKERS, and M. WALKER (2000): Four cen-turies of geomagnetic secular variation from historicalrecords, Phil. Trans. R. Soc. Lond., A. 358, 957-990.
KORTE, M. and C.G. CONSTABLE, (2005): The geomagnetic
Miscellanea 9-03-2009 14:42 Pagina 561
562
L. Casas and A. Incoronato
dipole moment over the last 7000 years–new resultsfrom a global model, Earth and Planet. Sc. Letters,236, 348–358.
MAUS, S., S. MACMILLAN, T. CHERNOVA, S. CHOI, D. DATER,V. GOLOVKOV, V. LESUR, F. LOWES, H. LÜHR, W. MAI,S. MCLEAN, N. OLSEN, M. ROTHER, T. SABAKA, A.
THOMSON and T. ZVEREVA (2005): The 10th GenerationInternational Geomagnetic Reference Field, Phys. ofthe Earth and Planet. Int. 151 (3-4), 320-322.
(received March 26, 2008;accepted April 23, 2008)
Miscellanea 9-03-2009 14:42 Pagina 562