Embed Size (px)
Citation preview

EFFECT OF DIFFERENT WHEAT VARIETIES ON PASTA QUALITY
A THESIS SUBMITTED TO
THE GRADUATE SCHOOL OF NATURAL AND APPLIED SCIENCES OF
MIDDLE EAST TECHNICAL UNIVERSITY
BY
MURAT BOZKURT
IN PARTIAL FULFILLMENT OF THE REQUIREMENTS
FOR
THE DEGREE OF MASTER OF SCIENCE IN
FOOD ENGINEERING
SEPTEMBER 2012

Approval of the thesis:
EFFECT OF DIFFERENT WHEAT VARIETIES ON PASTA QUALITY
Submitted by MURAT BOZKURT in partial fulfillment of the requirements for the
Degree of Master of Science in Food Engineering Department, Middle East
Technical University by,
Prof. Dr. Canan Özgen ____________
Dean, Graduate School of Natural and Applied Science
Prof. Dr. Alev Bayındırlı ____________
Head of Dept., Food Engineering
Assoc. Prof. Dr. Behiç Mert ____________
Supervisor, Food Eng. Dept., METU
Examining Committee Members:
Prof. Dr. Ayhan Atlı ____________
Food Engineering Dept., Harran University
Prof. Dr. Hamit Köksel _____________
Food Engineering Dept., Hacettepe University
Prof. Dr. Alev Bayındırlı _____________
Food Engineering Dept.., METU
Assoc. Prof. Dr. İlkay Şensoy _____________
Food Engineering Dept.., METU
Date: _______________

iii
I hereby declare that all information in this document has been obtained
and presented in accordance with academic rules and ethical conduct. I also
declare that, as required by these rules and conduct, I have fully cites and
referenced all materials and results that are original to this work.
Name, Last name: Murat Bozkurt
Signature:

iv
ABSTRACT
EFFECT OF DIFFERENT WHEAT VARIETIES ON PASTA QUALITY
Bozkurt, Murat
M.Sc., Department of Food Engineering
Supervisor: Assoc. Prof. Dr. Behiç Mert
September 2012, 90 pages
There are about 40 durum wheat varieties registered in Turkey. Around 10
varieties are being commonly cultivated. Amanos 97, Çeşit 1252, Ege 88, Fırat 93,
Fuatbey 2000, Burgos, Kızıltan 91, Sarıçanak 98, Svevo and Zenith durum wheat
varieties were used in this study.
Semolina and pasta have been produced in an industrial plant under constant
process conditions from these varieties. In general, pasta quality is determined by
three main factors, the raw materials, the production recipe and the production
process. In this study, the production recipe and the production process were fixed
and only durum wheat varieties were variable. So, the effects coming from the
production recipe and the production process on pasta quality were eliminated.
Physical, chemical and sensory properties of these pasta were determined and the
effect of different durum wheat varieties on pasta quality has been investigated to
give a clear idea to the Turkish pasta industry about the most commonly grown
durum wheat varieties in Turkey, hoping that Turkish pasta in domestic and
international Markets will continue to grow with the help of clear understanding
about the quality characteristics of the durum wheat they are using.

v
The important criteria of acceptability of pasta products is its cooking quality and
cooking quality of pasta products is of importance to consumers and also to wheat
producers, breeders and manufacturers. The pasta samples produced from Svevo,
Zenith and Fırat 93 varieties got the higher scores than others in pasta cooking
quality while those produced from Sarıçanak 98, Çeşit 1252, Kızıltan 91, and
Fuatbey 2000 durum wheat were evaluated as relatively low. The main reasons of
cooking quality differences can be interpreted as a result of the difference in
protein quantity and quality of the varieties.
The bright yellow color of pasta products, rather than cooking behavior taste, is
reported to be one of the most important considerations in assessing durum wheat
quality. In this study, the pasta samples produced from Svevo, Zenith and Burgos
varieties got the higher scores than others in pasta color (yellowness) while that
produced from Fırat 93 had the lowest yellow color. The main reasons of yellow
color differences can be interpreted as a result of the differences in carotenoid
pigments, lipoxygenase and peroxidase enzymes contents of the varieties.
Keywords: Quality, Durum Wheat, Semolina, Pasta, Variety

vi
ÖZ
DEĞİŞİK BUĞDAY ÇEŞİTLERİNİN MAKARNA KALİTESİNE ETKİSİ
Bozkurt, Murat
Yüksek Lisans, Gıda Mühendisliği Bölümü
Tez Yöneticisi: Doç. Dr. Behiç Mert
Eylül 2012, 90 sayfa
Türkiye’de 40’ın üzerinde tescil edilmiş makarnalık buğday çeşidi vardır. Bunların
içinden yaklaşık 10 tanesi yaygın olarak yetiştirilmektedir. Bu çalışmada,
Türkiye’de son yıllarda yaygın olarak yetiştirilen bu çeşitler (Amanos 97, Çeşit
1252, Ege 88, Fırat 93, Fuatbey 2000, Burgos, Kızıltan 91, Sarıçanak 98, Svevo ve
Zenith) kullanılmıştır.
Endüstriyel bir tesiste, eşit proses reçeteleri ve parametreleri kullanılarak bu
buğdaylardan makarna ve irmik üretilmiştir. Makarna kalitesini üç ana faktör
etkilemektedir: hammadde, üretim reçetesi ve üretim şartları. Bu çalışmada üretim
reçeteleri ve şartları sabit tutulmuş olup değişken sadece hammaddir. Böylece
makarna kalitesine etki edebilecek üretim reçetesi ve üretim şartlarına bağlı
faktörler ortadan kaldırılmıştır.
Üretilen bu makarnaların fiziksel, kimyasal ve duyusal özellikleri belirlenmiştir.
Bu yolla, değişik buğday çeşitlerinin makarna kalitesine etkisi araştırılarak, Türk

vii
makarna sektörünün iç ve dış pazarlardaki gelişmesine katkı sağlanması
amaçlanmıştır.
Makarna kalitesi için en önemli gösterge pişme kalitesidir. Tüketicilerin verdiği bu
önem ile pişme kalitesi, buğday ıslahçıları, buğday üreticileri ve kullanıcıları için
de önemli bir faktör olmuştur. Yapılan denemeler sonucunda, Svevo, Zenith ve
Fırat 93 çeşitlerinden üretilen makarnalar pişme kalitesi olarak diğerleri içinde en
iyi sonuçları verirken, Sarıçanak 98, Çeşit 1252, Kızıltan 91 ve Fuatbey 2000’den
üretilen makarnaların ise pişme kaliteleri düşük bulunmuştur. Pişme
kalitelerindeki bu farkların sebebi, buğday çeşitlerinin sahip olduğu protein miktarı
ve protein kalitelerindeki farklardan kaynaklamış olduğu şeklinde
yorumlanabilinir.
Makarnadaki açık sarı renk, pişme kalitesi kadar durum buğdayı kalitesi
araştırmalarında en önemli göstergelerden bir tanesidir. Yapılan bu çalışmada,
Svevo, Burgos ve Zenith çeşitlerinden üretilen makarnaları sarılık değeri
diğerlerine göre daha yüksek olup en düşük renk değeri Fırat 93 çeşitinden üretilen
makarnada bulunmuştur. Makarnaların sarılık değerlerindeki farkların, buğday
çeşitlerinin sahip olduğu farkı miktarlardaki karotenoid pigmentleri, lipoksijenaz
ve peroksidaz enzimlerinden kaynaklandığı şeklinde yorumlanabilir.
Anahtar kelimeler : Kalite, Durum Buğdayı, İrmik, Makarna, Çeşit

viii
To My Family

ix
ACKNOWLEDGEMENTS
I would like express my deepest gratitude to my supervisor Assoc. Prof. Dr. Behiç
Mert for his guidance, advice, criticism, encouragement and insight throughout
this study.
I am grateful to Barilla Gıda Bolu Team for their great contribution and
collaboration during all the tests and analysis. They were very patient, kind and
collaborative.
The support of Mümin Çetiner, Quality and Technology Manager, and Arzu
Özkan, my assistant in Barilla Gıda, deserves my warmest thanks.
Finally, I would like to dedicate this work to my family members, Gülay-Alperen-
Berra Bozkurt for their great moral support and belief me.

x
TABLE OF CONTENTS
ABSTRACT.............................................................................................................iv
ÖZ............................................................................................................................vi
ACKNOWLEDGEMENTS.....................................................................................ix
TABLE OF CONTENTS..........................................................................................x
LIST OF TABLES.................................................................................................xiii
LIST OF FIGURES...............................................................................................xiv
CHAPTERS
1. INTRODUCTION.......................................................................................1
1.1. General..........................................................................................1
1.2. Durum Wheat ...............................................................................3
1.2.1. Common wheat and durum wheat difference…..…….10
1.3. Semolina......................................................................................12
1.4. Spaghetti......................................................................................14
1.4.1. Cooking Quality...........................................................19
1.4.2. Color.............................................................................20
2. MATERIALS AND METHODS............. .................................................21
2.1. Materials......................................................................................21
2.2. Methods.......................................................................................23
2.2.1. Semolina Productions...................................................23
2.2.2. Spaghetti Productions...................................................24
2.2.3. Test Weight..................................................................24
2.2.4. Kernel Vitreousness .....................................................24
2.2.5. Protein Quantity............................................................25

xi
2.2.6. Gluten Quantity and Quality........................................25
2.2.7. Color.............................................................................26
2.2.8. Cooking Quality...........................................................27
2.2.9. Cooking Loss................................................................28
3. RESULTS AND DISCUSSION.................................................................29
3.1. Test Weight and Vitreousness ....................................................29
3.2. Color............................................................................................33
3.3. Protein Quantity...........................................................................33
3.4. Gluten Quantity and Quality.......................................................38
3.5. Cooking Quality of Spaghetti Samples.......................................41
3.6. Cooking Losses of Spaghetti Samples........................................43
3.7. Evaluation of Spaghetti Samples for Each Variety.....................43
3.7.1. Svevo............................................................................43
3.7.2. Zenith............................................................................45
3.7.3. Fırat-93.........................................................................46
3.7.4. Burgos...........................................................................47
3.7.5. Ege-88...........................................................................48
3.7.6. Kızıltan-91....................................................................49
3.7.7. Fuatbey-2000................................................................50
3.7.8. Amanos-97...................................................................51
3.7.9. Sarıçanak-98.................................................................52
3.7.10 Çesit-1252 (Ç-1252)....................................................53
4. CONCLUSION..........................................................................................54
REFERENCES.......................................................................................................58

xii
APPENDICES…....................................................................................................70
Appendix 1 Technological Standard Sheet……………………..…………. 70
Appendix 2 Gluten Quantity and Quality Analysis………….……………..72
Appendix 3 Cooking Quality Analysis……..............………………………78
Appendix 4 Color Analysis…………….……………………..…………….82
xiii
LIST OF TABLES
TABLES
Table 1 Durum wheat genotypes used in the study................................................22
Table 2 Test weights and vitreousness of wheat samples ......................................30
Table 3 Yellowness (indices b) of wheat, semolina and spaghetti samples...........31
Table 4 Protein contents of wheat and spaghetti samples……………...................35
Table 5 Gluten quantities and qualities of durum wheat varieties….……….........36
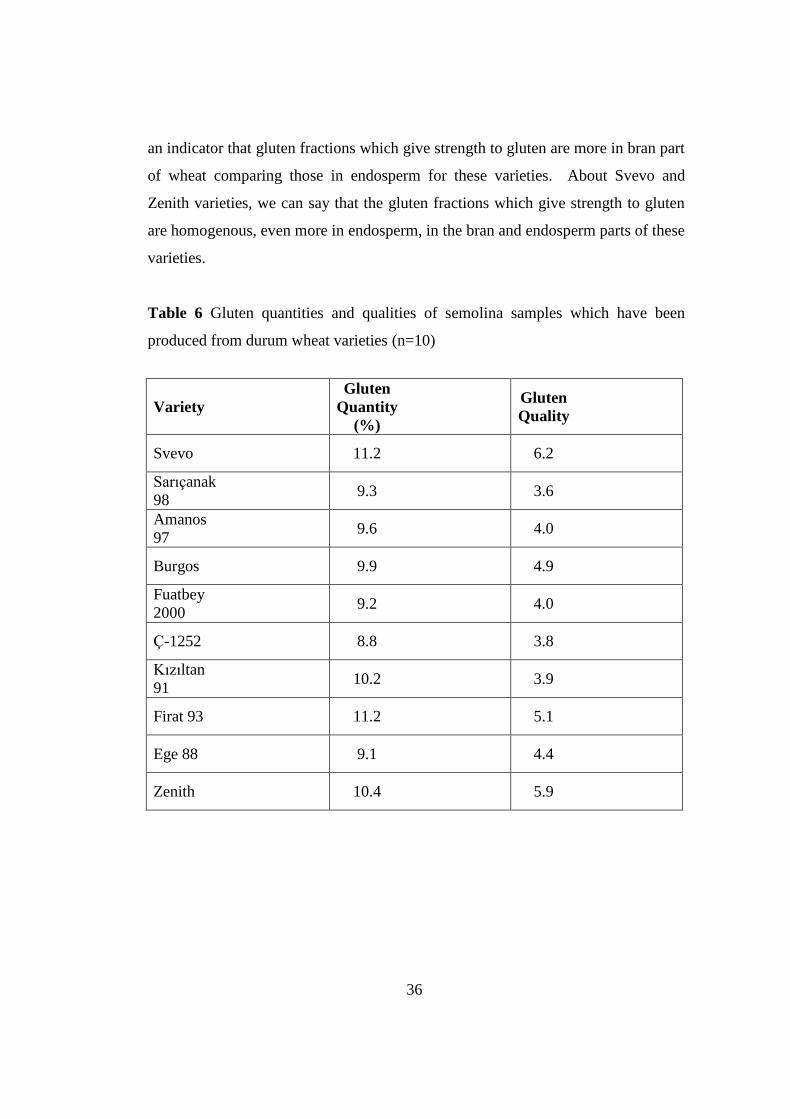
Table 6 Gluten quantities and qualities of semolina samples which have been
produced from durum wheat varieties ...................................................................36
Table 7 Cooking quality scores of spaghetti samples……….…………................38
Table 8 Cooking loss of spaghetti samples ……………….….………..................41

xiv
LIST OF FIGURES
FIGURES
Figure 1 Parts of the wheat kernel……..…………………………....................... 05
Figure 2 Ambient drying of pasta in beginning of 1900’s…….……….................16
Figure 3 Latest technology pasta production line…….......………………………17
Figure 4 Drying process of pasta............................................................................17
Figure 5 Drying cycle of spaghetti..........................................................................18
Figure 6 BÜCHI Auto-Kjeldahl Unit K-370 .……………………..…..................25
Figure 7 Perten Glutomatic 2200 – Gulten Index-(ICC)…………………………26
Figure 8 Brabender Glutograph 486049 .…….....…………….……….................26
Figure 9 Minolta CR-300 Colorimeter …..…………..……….……….................27
Figure 10 Minolta CR-410 Colorimeter .....……………………………………...27
Figure 11 Yellowness of wheat (indices b) versus yellowness of semolina ..........31
Figure 12 Yellowness of wheat (indices b) versus yellowness of spaghetti ..........32
Figure 13 Yellowness of semolina (indices b) versus yellowness of spaghetti......32

xv
Figure 14 Gluten quantities of wheat and semolina samples.................................37
Figure 15 Gluten qualities of wheat and semolina samples...................................37
Figure 16 Gluten qualities of semolina versus bulkiness scores of spaghetti …....40
Figure 17 Gluten qualities of semolina versus stickiness scores of spaghetti........40
Figure 18 Gluten quality of semolina versus firmness scores of spaghetti. ..........40
Figure 19 Gluten quantities of semolina versus cooking loss of spaghetti............42
Figure 20 Gluten quality of semolina versus cooking loss of spaghetti.................43
Figure 21 Cooked and uncooked spaghetti produced from Svevo variety…....….44
Figure 22 Cooked and uncooked spaghetti produced from Zenith variety …...….45
Figure 23 Cooked and uncooked spaghetti produced from Fırat 93 variety ….....46
Figure 24 Cooked and uncooked spaghetti produced from Burgos variety….…..47
Figure 25 Cooked and uncooked spaghetti produced from Ege 88 variety……....48
Figure 26 Cooked and uncooked spaghetti produced from Kızıltan 91 variety….49
Figure 27 Cooked and uncooked spaghetti produced from Fuatbey 2000 variety.50
xvi
Figure 28 Cooked and uncooked spaghetti produced from Amanos 97 variety….51
Figure 29 Cooked and uncooked spaghetti produced from Sarıçanak 98 variety .52
Figure 30 Cooked and uncooked spaghetti produced from Çeşit 1252 variety…..53
1
CHAPTER 1
INTRODUCTION
1.1 General
Pasta is a traditional cereal-based food product that is popular worldwide because
of its convenience, palatability, and nutritional quality, especially its low glycemic
index (GI) (Petitot et. al., 2008). Pasta quality is evaluated by color, visual
appearance and cooking quality. Yellow color (b value), indicating the content of
carotenoid pigments, is preferred by consumers for visual appearance. Cooking
quality is associated with the quality and quantity of the protein (Kaplan et al.,
2008). It is generally recognized that protein content is the primary factor
associated with pasta cooking quality, with gluten quality being secondary
importance (Feillet and Dexter, 1996).
The main pasta quality aspects, identified by market research and consumer panels,
are “al dente” trait; low stickiness, yellow color, wholesomeness. These pasta
quality parameters are highly correlated with specific durum wheat characters: “al
dente”: protein content; low stickiness: protein composition; yellow color:
endosperm yellow pigment content; wholesomeness: crop, storage and milling
treatments (Ranieri, 1995).
It is obligatory to use durum wheat in pasta and semolina production in Turkey.
(Turkish Food Codex, Pasta (2002/20) and semolina regulations (2002/21)).

2
In Turkey, pasta industry is growing, especially in export markets, rapidly. In
domestic and international markets, pasta should have a bright yellow color (also
called “amber” color) and should not become sticky when it is cooked but should
be “al dente” as indicated by a consumer research carried out by a private research
company sponsored by Association of Turkish Pasta Manufacturers (TMSD, 2008)
This thesis is based on TMSD study, stating that, Turkish pasta, when compared to
Italian ones, has a pale yellow color and rated a little bit soft and sticky.
Turkish pasta manufacturers have the latest technologies in their mills and pasta
plants. So, the only reason for pale yellow color and soft and sticky pasta is the raw
material, namely, durum wheat which is processed.
The pasta quality depends on both quality parameters of durum wheat, process
parameters of milling and pasta production. In this study, most commonly used 10
durum wheat varieties have been studied to observe the effect of each variety on
pasta quality. In this study semolina and pasta from each variety was produced by
keeping all the process parameters constant. These parameters include tempering
moisture content of wheat, the distance between rollers, the speed differential (ratio
between rotating speeds of the rollers), sifting and purifying surfaces, and in pasta
production line (mixing, kneading, extrusion, drying parameters), Consequently, it
was possible to observe the quality differences coming only from durum wheat
varieties.
Durum wheat quality can be comprehended via different meaning by different
people: Durum wheat growers may be looking for high yields of attractive look,
well filled grains, for the best price. Millers think in terms of wheat that yields the
maximum amount of semolina, because the price of semolina is higher than that of
by-products such as bran and semolina flour.

3
Millers also have to meet the semolina specifications demanded by their customers,
such as the required protein quantity and quality, color, ash, moisture, etc. Pasta
producers, the millers’ customers and the last ring of the chain, demand semolina
which will result in the high quality pasta that must satisfy the quality expectations
of the consumers.
Quality criteria of durum wheat as raw material for pasta manufacturing are
continually evolving in response to technological advances in durum wheat milling,
pasta making industry, and market pressure and increasing customers’
requirements. However, the basic quality criteria valid today, include a high yield
of highly refined semolina; high protein and yellow pigment content, strong gluten
and good pasta cooking quality, and are to remain valid for the foreseeable future.
By means of careful variety selection, optimal combination of environmental
conditions and agronomic practices and a good quality evaluation system, durum
wheat crop can be obtained at high yield and quality (Hayka, 2009).
Even if this study has been performed by the pasta producers’ point of view, the
results can be beneficial for all parties in the chain and also for the other researches
which will be done for the similar targets.
1.2. Durum Wheat
Durum wheat (Triticum durum) is tetraploid wheat a separate species from most
other commercially grown wheat classes and it has unique characteristics (Lennox,
2003).
Based on the studies of archeological relics found in various countries of the
Middle East, it is assumed that wheat was already being cultivated thousands of
years before Christ, first in the “fertile crescent” of Palestine and Mesopotamia,
later spreading to Western Europe during the Stone Age (Mondelli, 1998).

4
Over the centuries, following the domestication of wild species and the first
breeding attempts, various types of wheat evolved, among which were common
wheat (Triticum aestivum L.) and durum wheat (Triticum turgidum var. durum
Desf.). The first type spread mainly to cool/moderate areas, which were fertile and
had good rainfalls. Durum wheat, due to its tolerance to droughts and shorter
growing cycles (the period between sowing and harvest), grew in adapted to hot/dry
climates, such as those of the Mediterranean. Like other living species, durum
wheat comes in a number of “varieties” (class of things with common and uniform
features, which are different and distinct from others) and its characteristics (yield,
adaptability, quality, etc.) can be selected and gradually improved. New varieties
can therefore be developed for higher productivity, better resistance to stresses or
parasites and/or ability to new cultivation environments (Mondelli, 1998).
Currently, in the world there about 210 million hectares of cultivated wheat, of
which 90% is common wheat and 10% is durum wheat. Though durum wheat is
cultivated word wide, it is concentrated in specific areas of Asia (India,
Kazakhstan, Turkey, Syria and Ukraine), Africa (Algeria, Ethiopia, Morocco and
Tunisia), North America (Canada, Mexico and U.S.A.), Australia and Europe
(France, Greece, Italy and Spain). On the average, the world produces 35 million
tons of durum wheat per year, of which more than 7.9 million tons are produced in
EU, 2.9 tons in USA, 3 million tons in Canada and 2.7 million tons in Turkey
(TMSD, USDA Commodity Intelligent Report. 22 Dec. 2010).
With some exceptions, durum wheat is a winter crop. In Turkey and Europe, it is
generally sown between October and December and harvested at the end of May in
the warmer regions and at the end of June or the beginning of July in the cooler
regions. In Canada and the northern U.S., the situation is different because of an
extremely continental climate, with long, hard winters and short, hot summers.
There, wheat is sown in April or May, as soon as temperatures are sufficiently mild,
and the harvest takes place at the end of July or the beginning of August.

5
Pasta quality is determined by three main factors, the raw materials, the production
recipe and the production process (Dawe, 2001). In this study, the production
recipe and the production process were fixed and only durum wheat varieties were
variable. So the effects coming from the production recipe and the production
process on pasta quality were eliminated.
The wheat preferred for making pasta products is durum (Triticum turgidum var.
durum Desf.). Durum wheat, in contrast to common wheat Triticum aestivum L.,
which is used to make bread and oriental style noodles, is the hardest wheat and
durum milling produces a coarse particle size product, called semolina, ideal for
making pasta. The key features of durum wheat include its hardness, intense yellow
color and nutty taste. Durum is the best wheat for pasta products due to its excellent
amber color and superior cooking quality. Durum wheat with strong gluten
characteristics forms strong, non-sticky dough ideal for pasta processing and, in
general, tends to produce pasta products with superior cooking characteristics. After
conversion to pasta, durum wheat produces products with good cooking quality and
stability with unmatchable eating quality (Sissons, 2008).
Figure 1 Parts of the wheat kernel (Source: www.classofoods.com)
The most important factor that affects the pasta is quality of the durum wheat that
this semolina produced from. In Turkey, durum wheat is mostly used by bulgur,
semolina and pasta sectors. Turkey is ranked 5th
in the world pasta production and

6
its share in total production is 5.1%. Turkey’s pasta production is 740,684 tons and
amount of its pasta export increased up to 295,916 tons (TMSD, 2011).
In Turkey, more than 40 Durum wheat varieties have been cultivated (TMSD,
2011). Especially in the recent years, 10 of the durum varieties representing 80% of
total durum wheat production used by pasta manufacturers, which are Amanos 97,
Çeşit 1252, Ege 88, Fırat 93, Fuatbey 2000, Burgos, Kızıltan 91, Sarıçanak 98,
Svevo and Zenith. In this study, pure and undamaged samples were examined in
order to prevent any effects coming from environmental conditions (damages
coming from insects, cold, lodging, rusts, mildew, and other diseases).
The cooking quality and color are the two main quality indicators for pasta.
Consumers prefer firm and non-sticky pasta when it is cooked. Bright-yellow color
is the most preferred color for pasta before and after the cooking.
Numerous scientific researches show that rheological properties of durum wheat is
the most important parameter related to cooking quality of pasta (Matsuo et al.,
1980; Feillet et al., 1996; Sopiwnyk, 1999; Pena et al., 2002; Ames et al., 2003;
Edward et al., 2003; Oak et al., 2006; Wrigley et al., 2006; Aalami, 2006; Aalami
et al, 2007; Sissons et all, 2007; Tina Fuad et al., 2010; Sakin et al., 2011) The
impact of these components on dough properties and pasta quality has been studied
many years. Reports showed that association between glutenin allelic composition
and gluten strength in durum wheat (Du Cross, 1987; Pogna et al., 1990; Brites and
Carrillo, 2001; Sissons et al., 2005a).
Wheat proteins are a highly heterogeneous material, including albumins (soluble in
water), globulins (soluble in neutral salt solution), gliadins (soluble in 70% ethanol
and in acids) and glutenins (soluble in acids, bases) (Feillets, 1988). Gluten is a
complex mixture of gliadins and glutenins. Gliadins are heterogenous monomeric

7
proteins which are separated into groups on the basis of their mobility on
electrophoresis at low pH and responsible for gluten viscosity (Shewry et al., 1999).
Different groups of gliadins, in order of increasing mobility, are the - gliadins, ,
, and –gliadins (Shewry et al., 1999). The glutenin fraction consists of high
molecular weight polymers stabilized by inter-chain disulphate bonds (Carrilo et
al., 1990). On the basis of their mobility in SDS-PAGE, the single monomers are
usually classified into two groups, the high molecular weight subunits of glutenin
(HMW-GS) and the low molecular weight subunits of glutenin (LMW-GS)
(Galterio et al., 1991; Gupta et al., 1995; Aalami, 2006). Damidaux et al.(1978)
showed that varieties of durum wheat that contain -45 gliadin have superior
cooking quality than those contain -42 gliadin. Both proteins have the same
molecular weight (45,000) and similar amino acid composition (Feillet, 1980). On
the other hand, Payne et al. (1984) and Pogna et al. (1988) showed that the presence
or absence of low molecular weight LMW-1 and LMW-2 glutenins are linked
closely genetically to -42 and -45 gliadins, respectively and these two gliadin
polipeptides can be used only as genetic markers for other proteins responsible for
gluten quality (Aalami, 2006).
Gluten quantity and composition are the predominant factors associated with
superior pasta texture. The protein matrix holds the starch granules during cooking
to decrease the loss of solids in the cooking water and thereby reduce the surface
stickiness. With very low levels of protein extremely fragile spaghetti is produced
with low firmness. High protein durum wheat allows spaghetti swell when cooked
(affect mouth feel), reduces cooking loss and allows retention of firmness with
overcooking which is also associated with less stickiness (Dexter et al., 1983).
Protein content has been noted as a primary factor associated with superior pasta
quality (Feillet and Dexter, 1996). D’Egidio et al. (1990) stated that with low

8
temperature pasta drying technology (≤40°C), gluten content and gluten strength
assumed to have equal importance in defining pasta quality while for higher
temperature drying technology (>70°C), protein content was considered as more
important.
The recent scientific researches showed that glutenin/gliadin ratio, amount of
HMW-GS (high molecular weight glutenin subunit) or LMW GS (low molecular
weight glutenin subunit), -Gliadin types ( -42 or -45) have important effects on
dough and pasta cooking quality parameters (Edwards et al., 2003; Sissons et al.,
2007, Sakin et al., 2011). Among high molecular glutenin subunits, HMW-GS 6+8
or 7+8 give better pasta cooking quality than HMW-GS 20 (Kovacs et al., 1995).
Autran and Feillet (1987) showed that a weak but significant relationship between
HMW glutenins and pasta quality; HMW-GS 6+8 was positively associated with
quality, while 13+16 was negatively associated.
The color of pasta products is mainly influenced by the yellow pigment content and
LOX (lipoxygenase) activity of durum wheat (Aalami et al., 2007). For the
production of bright yellow pasta products, durum wheats with high pigment
content (mainly yellow carotenoids) and low LOX activity are desired. Yellow
pigment concentration of the endosperm, due to the presence of xanthophylls and
other related compounds (Lepage and Sims, 1968), is an important quality
characteristic. Except some special varieties, it is generally accepted that pigment
contents of durum wheats fluctuate from 4 to 8 mg/kg (Köksel et al., 2000, Sakin et
al., 2010; Sakin et al., 2011).
Color has become more important with increased global competition in pasta
marketing. (Dexter and Marchylo, 2001) Yellow pigment concentration (YPC) in
durum wheat is an important criterion in the assessment of semolina quality,
particularly in determining the commercial and nutritional quality of end-products

9
(Digesù et al., 2009). Final color is the result of the balance between yellow and
brown components in semolina. Carotenoid pigments and lipoxygenase (LOX)
enzyme are mainly involved in yellowness, whereas peroxidase (POD) and ash
affect brown hue (Borelli et al., 1999; Borelli et al., 2008).
The bright yellow color of durum wheat products is the result of natural carotenoid
pigments content and of their oxidative degradation by lipoxygenase activity and
depends on several factors, among which intrinsic quality of semolina and
processing conditions are considered to be the most important. The phase mainly
responsible for pigment loss is the pasta processing, particularly dough mixing,
when a substantial decrease in pigment content occurs, highly correlated with
semolina LOX activity. Particularly in wheat, the fatty acids radicals produced
during the intermediate steps of substrate peroxidation are responsible for oxidative
degradation of pigments and of thiol groups of peptides and proteins, so promoting
a loss of sulphydryl groups in dough. Thus, these reactions can affect not only the
color, but also the rheological properties of wheat dough (Fares et al., 2001).
Carotenoids are important antioxidant compounds that reduce the oxidative damage
to biological membranes implied in many human diseases and in the ageing
processes. The carotenoid content is one of the main criteria to assess the
commercial and nutritional value of pasta products.

10
1.2.1. Common Wheat and Durum Wheat Difference
Genetics:First of all, common wheat and durum wheat are two different plant
“species” (meaning class of things species a similar characteristics that can be
interbred to produce fertile seed). Botanically, they both belong to the Germineae
family, and to the Triticum genus, of which numerous wild or cultivated species are
a part. The scientific named of durum wheat and common wheat are, respectively,
Triticum turgidum var. durum Desf. and Triticum aestivum L.
From the evolutionary standpoint, it would appear that common wheat derives from
an interspecific cross (a cross between different species) between T. turgidum and a
similar wild graminaceous plant, the Aegilops squarrosa, which has provided
common wheat with a set of chromosomes that are absent in durum wheat. Thus,
the two species present very distinct genetic features, the most evident being the
number of chromosomes: 28 in durum wheat and 42 in common wheat.
Morphology:
Morphologically, the two species are similar although they do have numerous
differences.
1) Ears of wheat are composed of numerous spikes, which in durum wheat are
awned. The awns can grow as high as 7.8 inches and in a full-grown plant they are
straw-colored, reddish or black. In common wheat, the ears can be beardless
(lacking awns) or awned. In the awned varieties, the awns measure 1.17-3.12 inches
and they are more or less divaricated from plant’s axis.
2) In common wheat, the last internode of the culm (the portion of the stalk that is
nearest to the ear) is empty, while in the durum wheat it is full.

11
3) There is a fundamental difference in the structure of the grain. In common wheat
it has a floury texture when it is fractured while in durum wheat it is glassy.
Consequently, the products obtained from each variety differ greatly. Common
wheat produces flour which is white and dusty, and ground durum wheat produces
semolina. It has rougher granules and pointed (sharp) particles. The color is yellow
amber, its intensity varying depending on the variety.
Although both types are primarily used for human consumption, the technologies
employed and the end products are very different. Already in the grinding phase,
the production process depends greatly on the characteristics of the caryopsis on the
product that one wishes to obtain from it, so that the mill must be configured to suit
the raw material.
The varying compositional structure of the proteins is fundamental in determining
the typology of product that can be obtained with one or the other raw materials.
The dough obtained with common wheat, in fact, is generally very extensible, and
of medium/low tenacity, while that obtained with common wheat is generally
characterized by high tenacity and minor extensibility. Common wheat is thus
particularly suited to the production of bread or leavened products, while durum
wheat presents features that are perfectly suited to the production of pasta. Good
gluten tenacity permits to keep starch granules inside the pasta structure, reducing
stickiness. It also allows the modulation of the absorption of water during cooking,
preventing excessive expansion of the pasta, giving it the right firmness (Barilla
Alimentare S.p.A.).

12
1.3. Semolina
Durum wheat milling is different from other classes of wheat milling, in that, there
are differences in the wheat, the actual milling processes, final product
characteristics and the utilization of those final products (Robinson, 2001). The
endosperm of the wheat kernel does not breakdown into fine powdery flour when
milled, because the endosperm of durum is hard enough to hold together during
milling, and the result is a granular product called semolina, which is used to make
spaghetti and other pasta products (Connell et al., 2004).
The term semolina derives from the Italian word "semola" that derives from the
ancient Latin simila, meaning "flour,” Semolina is the raw material for pasta
production and it is a granular product (particles sizes are mostly between 0.125
and 0.450 mm in diameter) obtained from the endosperm of durum wheat by
milling and removing bran and germ fractions of the wheat.
Semolina quality requirements vary from country to country (Cubadda, 1988) and
the pasta manufacturers have unique requirements for semolina (Dick and Matsuo,
1988). Several main parameters such as moisture content, color, protein quantity
and quality, speck counts, granulation are generally considered when describing
semolina quality. After the grain is milled into semolina, several criteria are used by
pasta makers to assess the pasta quality potential. These include color, speck count,
particle size distribution, and protein quality (Sissons, 2004).
The main components of semolina are proteins and starch. Proteins are molecules
composed of a sequence of units represented by amino acids. Semolina proteins
may be grouped into four principle families, depending on their chemical
13
characteristic and function: albumins, globulins, gliadins, glutenins. From a
technological point of view, gliadins and glutenins form gluten which is
characterized by fundamental features: By adding water and mechanical energy,
these two types of proteins form gluten, which develops a protein matrix that trap
the starch. Gluten strength is thought to relate to the balance between viscosity and
elasticity (Shewry et al., 2002). It has generally been accepted that semolina from
extra strong durum varieties is thought to produce firmer pasta and consequently
gluten strength has become sought after in many markets where higher price can be
commanded (Marchylo et al., 2001). Kovacs et al. (1997) found stronger significant
correlations (r² = 0.5-0.8) between mixograph characteristics of dough (a measure
of gluten strength) in 12 genotypes grown over three seasons and sensory
characteristics of cooked pasta.
Pasta cooking quality has also been described as a competition between starch
gelatinization and protein network formation (Dalbon et al, 1982). Thus, it is
possible that starch properties also contribute to pasta cooking quality. Although
starch represents up to 80% of semolina dry matter (Fortini, 1988) and is the major
component of pasta, it has received less attention in research (Lintas and
D’Appolina, 1973; Güler et al., 2002; Aalami, 2006).
Starch is a complex molecule composed of long linear or ramified chains of
glucose. It accumulates in the endosperm of the durum wheat in the form of
granules, in varying sizes and shapes. Starch is fundamental to nutrition as it is the
main source of carbohydrates and, therefore, of energy for the organism. Starch is a
polymer of α-linked D-glucose residues and is comprised of two types of
molecules, amylose and amylopectin. Amylose is a lightly branched polymer, with
molecular weight 100,000-1,000,000. In wheat it typically represents about 25% of
the starch granules but in some genotypes this can vary greatly from 0-40%.

14
Amylopectin is a highly branched polymer with MW 10,000,000-100,000,000. The
amylose polymer can form complexes with lipids. This amylose-lipid complex
resists leaching from the starch granules and also prevents entry of water into the
granule. Native starch granules also contain small amounts of proteins, lipids and
minerals (Chibbar et al., 2005).
In this study, the semolina samples were produced from all durum varieties under
the constant milling conditions in order to prevent any effect which might arise
from different milling process. Furthermore, semolina samples were used for
spaghetti production as soon as possible after their production in order to eliminate
any possible effect (e.g. enzymatic activity) coming from storage time.
The components of durum wheat (protein, gluten, carotenoid pigments and
lipoxygenase and peroxidase enzymes), which are indispensible for final product
quality, are different across the kernel. The quantities of these key components are
higher at the outer surface of the kernel (bran) and germ, but they decrease in the
semolina after milling. Thus, analyzing every semolina lot produced from each
durum variety helps one to observe the changing trend for these components during
milling process for every variety.
1.4. Spaghetti
While for a time it was thought that Marco Polo returned from China with pasta,
there are Italian recipe books from twenty years earlier containing reference to
pasta dished. The origin of the pasta starts probably with Greeks and “Etruschi”, the
word “laganon” was used to point something similar to big tagliatelle. The first
certain record of noodles cooked by boiling is in Jerusalem Talmud, written in

15
Aramic in the 5th
century AD. The word used for the noodles was “itriyah”. In
Arabic references this word stands for the dried noodles purchased from a vendor,
rather than homemade noodles which would have been fresh. Dried noodles are
portable while fresh must be eaten immediately. More than likely, pasta was
introduced during the Arab conquest of Sicily, carried in as dry stable. The Arab
geographer, Al Idrisi wrote that a flour-based product in shape of strings was
produced Palermo (Italy), than in Arabic colony.
Second date is 1279, when the Notaio Ugolino Scarpa from Genova write a
testament of a man in which in the goods left there were a "bariscela plena de
macaronis“ (a container full of Macaroni!). According to an old recipes book wrote
by Ibni al Mibrad (IX century), when the Arabs the first to dry pasta to enlarge the
shelf life during their migration in the desert.
.
At the beginning of the 1900 the production was manual and the drying made in
ambient condition using sun and wind.
In 1933 there is the first patent was taken with a machine completely automatic. In
1951 the continuous dryer was born for long pasta with an output of about 200 kg/h
and a temperature of 40-45°C. In 1956, the continuous dryer was born for short cuts
with an output of 400 kg/h and temperature of 50-55°C. In the 1970’s, it was started
developing the high temperature revolution line gets to 1500-2000 kg/h and use
temperature up to 70°C. In the 1980’s there was the boost to 80-90°C of temperature
and we got to 4000-5000 kg/h. Current situation speaks of 9000 Kg/h with drying
cycles of 4-6 hours and Temperature that arrives to 90°C (Barilla Alimentare
S.p.A.).
16
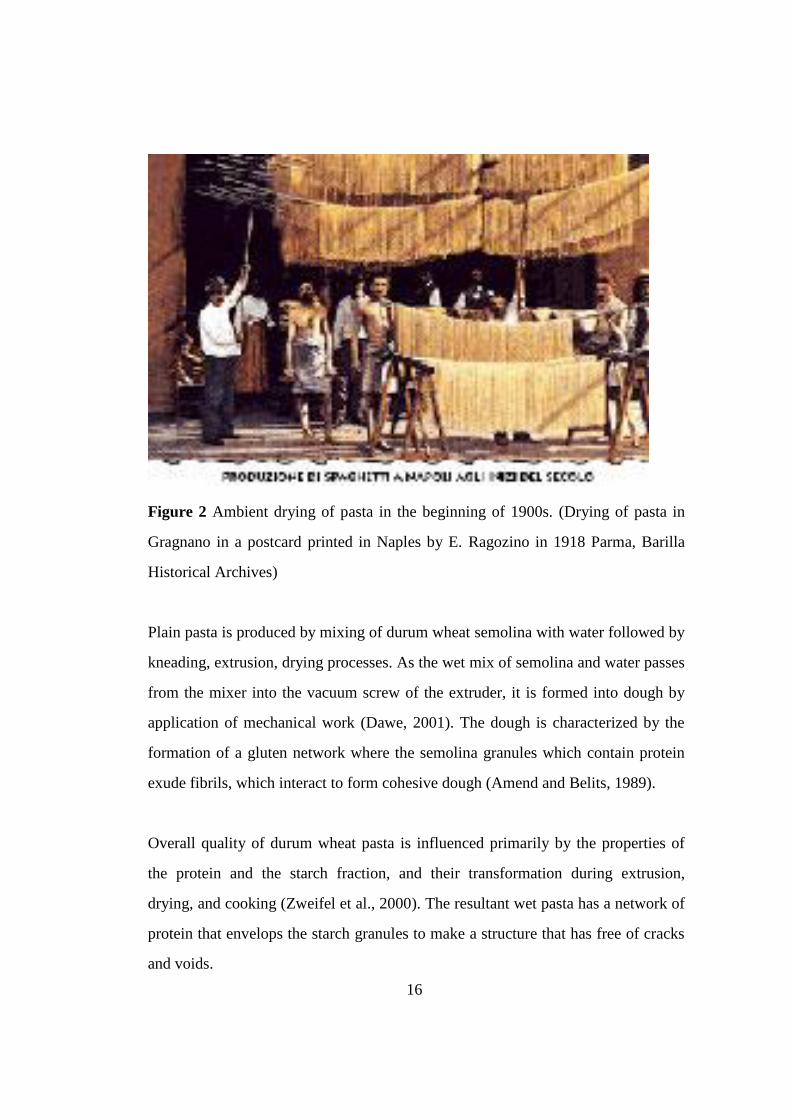
Figure 2 Ambient drying of pasta in the beginning of 1900s. (Drying of pasta in
Gragnano in a postcard printed in Naples by E. Ragozino in 1918 Parma, Barilla
Historical Archives)
Plain pasta is produced by mixing of durum wheat semolina with water followed by
kneading, extrusion, drying processes. As the wet mix of semolina and water passes
from the mixer into the vacuum screw of the extruder, it is formed into dough by
application of mechanical work (Dawe, 2001). The dough is characterized by the
formation of a gluten network where the semolina granules which contain protein
exude fibrils, which interact to form cohesive dough (Amend and Belits, 1989).
Overall quality of durum wheat pasta is influenced primarily by the properties of
the protein and the starch fraction, and their transformation during extrusion,
drying, and cooking (Zweifel et al., 2000). The resultant wet pasta has a network of
protein that envelops the starch granules to make a structure that has free of cracks
and voids.

17
Figure 3 Latest technology pasta production line (Source: FAVA)
Figure 4 Drying process of pasta (Source: Barilla)
In the semolina the gluten is glassy but upon the addition of some water it becomes
rubbery and elastic, acquiring the ability to form strand and sheets via inter-
molecular bonds. This matrix helps to trap the starch granules in pasta and hold its
Dryer front view Dryer Side view
ooooo
ooooo
ooooo
oooooPasta
Exhaust Air
with high humidity
Fresh
Air with high humidity
Fan
Heat
Exchanger
Heat
Exchanger
Fan
Pasta

18
shape during cooking. When the hydrated gluten is heated, irreversible protein-
protein cross-links are formed. The starch behaves like inert filler below 55 °C and
cannot absorb much water (Sisson, 2008).
After shaping in moulds, drying process starts which have certain process
parameters (temperature, relative humidity, etc.). At the end of the drying and
stabilization processes, dough turns to elastic stage from plastic stage and pasta is
obtained.
Figure 5 Drying cycle of spaghetti (source: Barilla)
Spaghetti is the most popular one in the pasta shapes. In traditional pasta-
consuming countries the consumer is concerned about the aroma, color,
appearance, texture, flavor and nutritional value of the pasta.
D’Egidio and Nardi (1998) stated that the cooking quality and color are the most
important parameters for pasta quality. Pasta made from durum wheat cultivars of
superior quality results in a bright yellow color and it retains firm and non-sticky
structure even after cooking.
0
10
20
30
40
50
60
70
80
90
100
110
0 15 30 45 60 75 90 105 120 135 150 165 180 195 210 225 240 255 270 285 300 315 330 345 360 375
PastaMoist %
-30
-20
-10
Pasta Moisness
Dry Bulb T°
Time (min)
Pasta T°
Relative Humidity %
T

19
1.4.1. Cooking Quality
The important test of acceptability of pasta products is its cooking quality (Matsuo,
1988). Cooking quality of pasta products is of importance to consumers and thereby
to wheat producers, breeders and manufacturers (Felliet and Dexter, 1998). Proper
evaluation of pasta cooking quality requires consideration of a number of factors
including its elasticity, firmness, stickiness, cooking time, water absorption, and
loss of solids to cooking water (Edwards et al., 1993; Feillet, 1984).
After cooking, the pasta products should maintain its texture and not become a
thick sticky mass. The process conditions and composition of raw material play the
main role for the cooking quality of pasta. The type of proteins present in the grain
affects processing properties. Group of proteins in wheat, which exert the most
influence on the strength and elastic properties of dough, are the glutenin and
gliadins. The polypeptide complex composed of glutenin, gliadin and lipid is
defined as the visco-elastic mass remaining after removal of the starch (Miflin et
al., 1983; Sissons 2008).
The protein matrix holds the starch granules during cooking to decrease the loss of
solids in the cooking water and thereby reduces surface stickiness. Insufficient
levels of protein lead to formation of extremely fragile spaghetti with low firmness.
High protein durum wheat reduces cooking loss and allows retention of firmness
with overcooking which is also associated with desired non-sticky surface (Dexter
et al., 1983).

20
Gluten quality (strength) is a term used to describe the ability of the protein to form
a satisfactory network that promotes good cooking quality. In pasta, gluten must be
tenacious enough to retain the gelatinized starch granules during cooking. The
continuity and strength of the protein matrix formed during dough mixing and
extrusion is important in defining the textural characteristics of the pasta. Compared
to weak gluten of same protein level, strong gluten wheat exhibit less sticky dough
with better extrusion properties and superior cooked textural characteristics (Dexter
and Matsuo, 1978; Autran et al.; D’Egidio et al.; 1993; Sissons et al.; 2005).
Sensory evaluation is the commonly used method for testing cooking quality of
pasta. The sensory judgment of firmness and the overall sensory judgment are
significantly correlated with gluten content (P<0.01 and P< 0.001), respectively
(Pasqualone et al., 2008). In this method, bulkiness, stickiness, and firmness of
pasta samples can be tested and compared with those of reference samples.
1.4.2. Color
Bright yellow color of pasta is an important quality parameter for the consumers.
The desired characteristic color is the result of many parameters such as;
- the natural carotenoid pigments present in the kernel,
- their residual content after milling and after the storage of either grain or
semolina,
- their oxidative degradation by lipoxygenase (LOX) during pasta processing,
- the oxidative balance among different compounds implied in this reaction,
- the process conditions

21
Final color is the result of the balance between yellow and brown components in
product. Carotenoid pigments and lipoxygenase (LOX) enzyme are mainly
involved in yellowness, whereas peroxidase (POD) and ash affect brown hue
(Borelli et al., 2008).
The bright yellow color of pasta products, rather than cooking behavior taste, is
reported to be one of the most important considerations in assessing durum wheat
quality (Borelli et al., 1999). Yellow pasta is considered a mark of quality by many
consumers (Dexter et al., 1981). However, a high level of yellow pigments in
durum wheat and semolina does not guarantee a high yellowness in pasta, because
pasta yellowness and pigment loss during processing are mainly affected by
enzymes such as lipoxygenase (LOX), peroxidase (POD), and polyphenol oxidase
(PPO) activities (Aalami, 2006).
The instrumental methods for measuring the color of cereal and cereal products are
used: (i) extraction of carotenoids and xanthopyll pigments and measurements of
them using transmitted-light colorimetry; (ii) direct measurement of the yellow
index (b) using reflected-light colorimetry (Landi, 1995).
In this study the yellowness of the wheat varieties and semolina and spaghetti
produced from each variety were measured and compared with each other.

22
CHAPTER 2
MATERIALS AND METHODS
2.1. Materials
The main durum wheat varieties those represent about 80 % durum wheat crop in
Turkey in 2009 (source: TMSD) have been used in this study. The following pure
durum wheat varieties were obtained from Central and Southeastern Anatolia
regions:
Table 1 Durum wheat genotypes used in the study.
Number Genotype Breeding Institution
1 Amanos-97 Çukurova Agricultural Research
Institute
2 Burgos Spain
3 Çeşit-1252 Field Crops Central Research Institute
4 Ege-88 Aegean Agricultural Research Institute
5 Fırat-93 Southeast Agricultural Research
Institute
6 Fuatbey-
2000
Çukurova Agricultural Research
Institute
7 Kızıltan-91 Field Crops Central Research Institute
8 Sarıçanak-
98
Southeast Agricultural Research
Institute
9 Svevo Barilla S.p.A. and PSB (Italy)
10 Zenith Barilla S.p.A. and PSB (Italy)

23
Semolina samples have been obtained by milling of durum wheat varieties in an
industrial semolina mill (Barilla Gıda Bolu Mill). Because the different milling
conditions may affect the quality parameters of semolina, (Dexter et al., 2004) the
same milling conditions (semolina extraction rates, tempering moisture content, the
distances between rollers, the ratio between rotating speeds of the rollers, sifting
and purifying surfaces, etc.) were applied to all of the samples.
Spaghetti samples with 1.7 mm diameter have been produced in an industrial pasta
production line (Barilla Gıda Bolu Plant, Long Cut Production Line, Braibanti)
applying same pasta production recipe and process conditions. (The Technological
Standard Sheet is given in Appendix-1)
2.2. Methods
2.2.1. Semolina Productions
By using each pure durum wheat variety, 10 semolina lots have been produced in
the Barilla Gıda Bolu Mill applying the same milling diagram and milling
conditions:
The following conditions were applied to all of the samples:
- Tempering time: 4 hours in initial tempering + 4 hours in final tempering,
- Tempering moisture: 17.3% ± 0.1%,
- Constant roller-mills working parameters (gaps in rollers, break-roll differentials,
positions of rollers, air-pressure, rotational speed, etc.),
- Constant sifter working parameters (sieves, rotational speed, sifting surface,
etc...,),
- Constant purifying conditions (sieves, rotational speed, purifying surface, air
pressure of the purifiers),
24
- Constant semolina extraction rate at 70%.
2.2.2. Spaghetti Productions
10 different spaghetti samples, having 1.7 mm diameter and 25.5 cm length, have
been produced from 10 different semolina lots extracted from 10 different durum
wheat varieties which were subject of this study. Same pasta production parameters
and conditions were applied in all cases. (The Technological Standard Sheet is
given in Appendix-1)
2.2.3. Test weight
AACC 55-10.01 (2000) method was applied to all durum wheat varieties using the
“Hectoliter Measurement” instrument.
2.2.4. Kernel vitreousness
The term vitreousness applies to the proportion by weight of vitreous durum wheat
kernels in 100 g of a sample as prepared for "Besatz"-analysis according to ICC
Standard No. 102/1 (Approved: 1964, Revised: 1972) and vitreousness % has been
defined according to ICC Standard no. 129 (Approved: 1980). (Method for
determination of the vitreousness of durum wheat)

25
2.2.5. Protein Quantity
Protein quantity analysis was done according to standard method (Method: AACC
46-10.01, 2000) using conversion factor of 5.7 and using the BÜCHI Auto-Kjeldahl
Unit K-370 (Switzerland).
Figure 6 BÜCHI Auto-Kjeldahl Unit K-370
2.2.6. Gluten Quantity and Quality
Gluten quantity analyses were done according to standard method (ICC Standard
No. 137/1: Mechanical determination of the gluten content of wheat flour) by using
a Perten Glutomatic 2200 –Gluten Index-(ICC) (Sweden-1999).
Glutograph: The procedure was carried out for all samples according to the Manual
of the manufacturer (Brabender GmbH and Co. Duisburg, Germany) of the
glutograph-1752E for determination of gluten quality.
Analyses were applied on wheat and semolina samples according to method given
in Appendix 2.
26
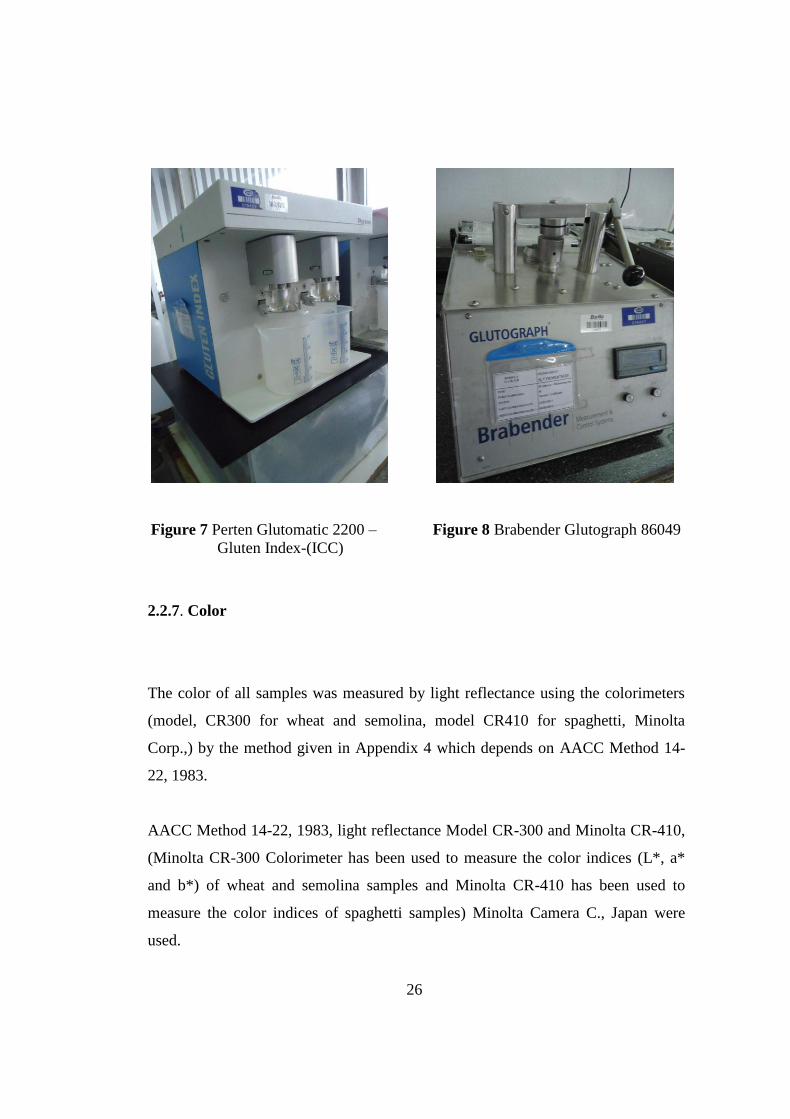
Figure 7 Perten Glutomatic 2200 – Figure 8 Brabender Glutograph 86049
Gluten Index-(ICC)
2.2.7. Color
The color of all samples was measured by light reflectance using the colorimeters
(model, CR300 for wheat and semolina, model CR410 for spaghetti, Minolta
Corp.,) by the method given in Appendix 4 which depends on AACC Method 14-
22, 1983.
AACC Method 14-22, 1983, light reflectance Model CR-300 and Minolta CR-410,
(Minolta CR-300 Colorimeter has been used to measure the color indices (L*, a*
and b*) of wheat and semolina samples and Minolta CR-410 has been used to
measure the color indices of spaghetti samples) Minolta Camera C., Japan were
used.

27
L* is a measure of brightness.
a* indicates red-green chromacity. Positive values indicate increased redness.
b* indicates yellow-blue chromacity. Positive values indicate increased yellowness
2.2.8. Cooking Quality
Cooking quality of spaghetti samples were analyzed by a group of trained panelists
at Quality and Technology Section of Barilla Turkey, Bolu, Turkey). The sensory
cooking quality parameters of all samples were measured by the method given in
Appendix 3.
Figure 9 Minolta CR-300 Figure 10 Minolta CR-410
Colorimeter Colorimeter
Samples were cooked and they were compared with each other and with reference
samples for their following characteristics (Source: Barilla)
Bulkiness: The ability of one piece of cooked pasta to slide smoothly against
another.

28
Stickiness: State of surface breakage of the cooked pasta with release of finger.
Firmness: Resistance of the cooked pasta to squashing between the fingers.
2.2.9. Cooking Loss
The method defined in the TS 1620 Pasta Standard (TSE, 1976) is applied to
measure cooking loss analyses for spaghetti samples.
The cooking loss of all spaghetti samples was measured by the method defined in
the Pasta Standard which was published by TSE (TS-1620).

29
CHAPTER 3
RESULTS AND DISCUSSION
3.1. Test Weight and Vitreousness of Wheat Samples
By using the “Hectoliter” instrument, the test weights of all durum wheat varieties
have been measures as a unit of Kg/HL. As shown in Table 2 the test weight of
durum wheat varieties are ranged between 77 Kg/HL (Kızıltan 91) and 81 Kg/HL
(Svevo).
The vitreousness of durum wheat samples were between 72% (Kızıltan 91) and
94% (Svevo) as shown in Table 2.
3.2. Color
The yellowness index (b indices) of durum wheat varieties and those of semolina
and spaghetti products, which were produced from these varieties, are given in
Table 3. The highest scores for spaghetti belong to the samples produced from
Svevo (indices b = 46.03), Burgos (indices b= 45.26) and Zenith (indices b= 44.43)
varieties. These results are not unexpected because the yellow colors of wheat and
semolina for these varieties are higher than the others: Indices b values are 23.03,
23.36, and 21.96 for Svevo, Burgos and Zenith varieties, respectively. These results
are in agreement with the previous findings (Coşkun et al., 2010) where six durum
wheat varieties (Zenith, Svevo, Alibaba, Sarıçanak-98, Fuatbey-2000, Akçakale-
2000) had been examined for their yellow color and it was stated that Zenith and

30
Svevo varieties had higher quality than others. Also Sakin et.al (2011) stated that
Zenith is one of the genotypes prevailed in pasta color quality associated
characteristics with other 3 variety among 25 durum wheat genotypes which were
subject in their study.
Table 2 Vitreousness and Test Weights of Wheat Samples (n=10)
Raw
Material
Variety
Vitreous
Kernel
(%)
Test
Weight
(Kg/HL)
Svevo 94 81
Sarıçanak
98 82 79
Amanos
97 87 80
Burgos 88 80
Fuatbey
2000 76 79
Ç-1252 76 78
Kızıltan
91 72 77
Firat 93 85 79
Ege 88 75 80
Zenith 83 79
The spaghetti samples produced from varieties Ç-1252, Ege 88, and Fırat 93 have
low yellowness scores. The yellowness indexes of these wheat varieties are also
low. Considering the color scores of both the durum wheat varieties and the
spaghetti samples produced from these varieties, one can interpret that durum wheat
varieties which have high yellowness scores lead to the high yellowness score for
pasta. The correlation was also proved by several scientific researches (Ranieri,
1995; Taha et al, 1987; Abecassis et al, 2001; Borelli et al, 2008).

31
Table 3 Yellowness (indices b) of wheat, semolina and spaghetti samples (n=10)
Variety Indice b (Wheat)
Indice b (Semolina)
Indice b (Spaghetti)
Svevo 23,03 25,73 46,03
Saricanak 98
21,27 22,5 42,24
Amanos 97 20,99 22,95 42,90
Burgos 23,36 25,48 45,26
Fuatbey 2000
19,22 21,25 42,10
Ç-1252 18,80 20,74 41,62
Kızıltan 91 21,12 23,83 42,23
Firat 93 17,93 20,04 40,71
Ege 88 19,42 21,47 41,68
Zenith 21,96 24,70 44,43
Also the relation between the color of wheat and colors of semolina and spaghetti
were examined. As it is shown in Figures 11, 12, 13, there are significant
correlations between them.
Figure 11 Yellowness of wheat (indices b) versus yellowness of semolina (r =
0.976)

32
Figure 12 Yellowness of wheat (indices b) versus yellowness of spaghetti (r=
0.917)
Figure 13 Yellowness of semolina (indices b) versus yellowness of spaghetti (r=
0.935)

33
3.3. Protein Quantity
The protein contents of durum wheat and spaghetti samples are given in Table 4.
Fırat 93 and Svevo varieties have higher protein contents comparing to others. The
protein
content of the variety Ege 88 is quite low. It must be noted that the protein contents
of wheat may differ by both genotype and environment (Nachit et al., 1995; Bushuk
1998; Troccelli et al., 2000; Sakin et al., 2011). Further studies can be done by
using same varieties under different environmental conditions.
Table 4 also shows that spaghetti sample produced from Svevo variety has the
highest protein content (13.56% Nx5.7 d.m.). The spaghetti sample produced from
Zenith variety ranked 2nd
(12.96%), the sample produced from Fırat 93 ranked 3rd
,
and the sample produced from Ege 88 have the lowest amount of protein.
3.4. Gluten Quantity and Quality
Durum wheat breeding programs generally focus on quality factors associated with
pasta. Gluten quantity and the composition are predominant factors associated with
superior pasta texture.
In this study, the gluten quantity and quality of all durum wheat varieties, semolina
products, and spaghetti samples were measured by instruments and methods
explained in Appendix 2.

34
Table 4 Protein contents of wheat and spaghetti samples. (Nx5.7 d.m.)
Variety Protein
(Wheat)
Protein
(Spaghetti)
Svevo 14.41 13.56
Sarıçanak
98 12.77 11.85
Amanos
97 13.02 12.47
Burgos 12.98 12.47
Fuatbey
2000 12.33 11.77
Ç-1252 12.75 12.00
Kızıltan
91 12.91 12.27
Fırat 93 14.55 12.94
Ege 88 11.75 10.67
Zenith 13.89 12.96
Svevo, Fırat 93 and Zenith varieties have higher dry gluten quantity. Also these
three varieties have higher scores in gluten quality comparing to other varieties.
The semolina samples which produced from these durum varieties were analyzed to
define their gluten quantity and quality. The following scores have been obtained.
Semolina samples produced from Svevo, Fırat 93 and Zenith varieties have higher
gluten quantity comparing to others. Also these three semolina samples have higher
scores in gluten quality. Especially the samples produced from Svevo and Zenith
have very high scores. The semolina samples produced from Sarıçanak 98, Ç-1252
and Kızıltan 91 have low scores for gluten quality.

35
Table 5 Gluten quantities and qualities of durum wheat varieties
Variety
Gluten
Quantity
(%)
Gluten
Quality
Svevo 11.9 5.9
Sarıçanak
98 9.7 4.0
Amanos
97 9.9 4.1
Burgos 10.4 5.1
Fuatbey
2000 10.1 4.5
Ç-1252 9.8 4.3
Kızıltan
91 10.5 4.4
Fırat 93 11.6 5.3
Ege 88 9.4 5.0
Zenith 10.9 5.8
When we compared the gluten quantities of wheat and semolina, we observe gluten
quantity decreases from wheat to semolina for all varieties. (Figure 14) This is an
indicator that a gluten fraction of bran is more than those of endosperm of the
wheat.
When we compare the gluten quality of durum wheat varieties with the semolina
samples produced from these varieties, we observe that, except Svevo and Zenith,
for all varieties the score decreases from wheat to semolina (Figure 15). This can be
36
an indicator that gluten fractions which give strength to gluten are more in bran part
of wheat comparing those in endosperm for these varieties. About Svevo and
Zenith varieties, we can say that the gluten fractions which give strength to gluten
are homogenous, even more in endosperm, in the bran and endosperm parts of these
varieties.
Table 6 Gluten quantities and qualities of semolina samples which have been
produced from durum wheat varieties (n=10)
Variety
Gluten
Quantity
(%)
Gluten
Quality
Svevo 11.2 6.2
Sarıçanak
98 9.3 3.6
Amanos
97 9.6 4.0
Burgos 9.9 4.9
Fuatbey
2000 9.2 4.0
Ç-1252 8.8 3.8
Kızıltan
91 10.2 3.9
Firat 93 11.2 5.1
Ege 88 9.1 4.4
Zenith 10.4 5.9

37
Figure 14 Gluten quantities of wheat and semolina samples
Figure 15 Gluten qualities of wheat and semolina samples

38
3.5. Cooking Qualities of Spaghetti Samples
10 spaghetti samples which were produced from 10 durum wheat varieties were
tested for their cooking quality characteristics (bulkiness, stickiness, firmness)
according to method given in Appendix 3. The results are given in Table 7. Less
bulkiness, less stickiness and high firmness get higher scores.
Table 7 Cooking Quality Scores of Spaghetti Samples
Raw Material Variety
Bulkiness Stickiness Firmness
Svevo 70 75 75
Sarıçanak 98 60 55 60
Amanos 97 60 55 65
Burgos 65 60 65
Fuatbey 2000 60 60 60
Ç-1252 60 55 60
Kızıltan 91 60 60 60
Fırat 93 65 70 70
Ege 88 65 60 65
Zenith 70 70 75

39
When we consider the bulkiness (the ability of one piece of pasta to slide against
another) the spaghetti samples which were produced from Svevo and Zenith
varieties get the highest scores as 70. The samples produced from the varieties of
Burgos and Fırat 91.
93 and Ege 88 get the medium scores (65) and the spaghetti samples produced from
other varieties get the minimum scores. (60)
The other cooking quality factor is stickiness which is defined as the state of
surface breakage of the cooked pasta, with release of finger. The more stickiness
gets low score. The spaghetti sample which was produced from Svevo variety gets
the highest score (75). The samples produced from Fırat 93 and Zenith get the
second rank with the score of 70. The samples produced from Sarıçanak 98, Ç-
1252 and Amanos 97 were evaluated as a poor quality with the score of 55. In the
firmness test which indicates the resistance of the cooked pasta, the spaghetti
samples produced from Svevo and Zenith varieties get the highest score (75). The
sample produced from Fırat 93 follows them with the score of 70. The spaghetti
samples produced from Sarıçanak 98, Fuatbey 2000, Ç-1252 and Kızıltan varieties
get the lowest scores (60).
The results show that the durum varieties and semolina having higher protein and
gluten quantity and higher gluten quality give higher cooking quality in spaghetti
samples. This agrees with the results of previous scientific studies (D’Egidio et al.,
1979; Dexter et al., 1983; D’Egidio et al., 1993; Aalami, 2006). When we compare
the gluten quality scores of semolina and cooking quality parameters of spaghetti,
we observed that there are significant correlations. (Figures 16, 17, 18)

40
Figure 16 Gluten qualities of semolina versus bulkiness scores of spaghetti (r= 0.
968)
Figure 17 Gluten qualities of semolina versus stickiness scores of spaghetti
(r=0.927)
Figure 18 Gluten qualities of semolina versus firmness scores of spaghetti

41
3.6. Cooking Loss of Spaghetti Samples
Cooking loss measures the amount of solid materials lost in the cooking water
which is not wanted by consumers. Cooking loss values of the spaghetti samples
are given in Table 8.
Higher score for cooking loss is an indicator for weak protein network which
cannot retain starches molecules during cooking and can cause stickiness of
spaghetti.
Table 8 Cooking loss of spaghetti samples (n=10)
Variety
Cooking
Loss of
Spaghetti
(%)
Svevo 4.2
Sarıçanak
98 8.8
Amanos
97 8.2
Burgos 7.5
Fuatbey
2000 7.9
Ç-1252 9.2
Kızıltan
91 7.4
Fırat 93 5.3
Ege 88 7.6
Zenith 4.1
As it is shown in Table 8, the cooking loss scores rank from 4.1% to 9.2%. The
spaghetti produced from Zenith and Svevo have minimum cooking loss, 4.1 and

42
4.2% respectively. The cooking loss results for samples produced from Ç-1252 and
Sarıçanak varieties are extremely high. (9.2% for Sarıçanak and 8.8% for Ç-1252)
Even if protein contents of spaghetti samples produced from Sarıçanak and Ç-1252
varieties do not have the worst scores, they get the worst score for cooking loss. In
discussions parts of gluten quality and quantity sections, we observed that gluten
quantity and quality scores of semolina produced from Saricanak and Ç-1252
varieties were relatively lower than those of other varieties. This situation can be
considered as a main reason of low quality for cooking loss for these varieties.
Also it was observed that there was a relation between cooking loss of pasta and
gluten quantity and quality: Increasing gluten quality and quantity decreases the
cooking loss. (Figure 19 and Figure 20)
Figure 19 Gluten quantities of semolina versus cooking loss of spaghetti (r=-
0.866).

43
Figure 20 Gluten quality of semolina versus cooking loss of spaghetti (r=- 0.942).
3.7. Evaluation of Spaghetti Samples for Each Variety
3.7.1. Svevo
The spaghetti sample which was produced from Svevo variety gets the highest
scores for almost all quality parameters and it can be ranked at the first place
according to general quality parameters (Cooking quality and color). This variety
was developed through pedigree breeding of Zenith and Linea varieties. Svevo
variety is recognized with high yellow index, very high protein content, good gluten
quality and good resistances to powdery mildew, brown rust, cold and medium
resistance to lodging (PSB-Societa Produttori Sementi S.p.A. Bologna, 2008).
In this study Svevo has the highest scores in yellowness (indices b= 46.03) and in
cooking quality parameters (bulkiness= 70, stickiness= 75, firmness= 75).

44
Also it has the highest protein quantity (13.56%) among other spaghetti samples.
For cooking loss, it was ranked to 2nd
place, with 4.2% loss; just behind the
spaghetti sample produced from Zenith variety which has 4.1% cooking loss.
Figure 21 Cooked and uncooked spaghetti produced from Svevo variety.
We can attribute these highest scores for pasta sample to the superior quality
parameters of wheat of which vitreousness is 94%, TW is 81 Kg/HL, color b-
indices is 23.03, protein content is 14.41%, gluten content is 11,9%, and gluten
quality is 5.9. The highest scores obtained from Svevo variety confirms the results
of Simeone et al. (2001) in which it was declared after several years of
experimentation that Flamino and Svevo were the most suitable for pasta making
among the durum wheat varieties examined.

45
3.7.2. Zenith
The spaghetti produced from Zenith variety is ranked at 2nd
place for the general
quality parameters just behind the spaghetti produced from Svevo variety.
Figure 22 Cooked and uncooked spaghetti produced from Zenith variety.
It gets 3rd
highest scores in yellowness (indices b= 44.43), 2nd
highest scores in
cooking quality parameters (bulkiness= 70, stickiness = 70, firmness= 75). Also it
has the second highest protein quantity with 12.96%. For cooking loss, it was
ranked at 1st place, with 4.1% loss which is minimum lost among all samples.
The good scores obtained from Zenith variety in this study confirm the similar
studies performed before (Coşkun et al., 2010; Sakin et al., 2011).

46
3.7.3. Fırat 93
Fırat 93 genotype was bred by Southeast Agricultural Research Institute and is
grown generally 1st and 2
nd sub-regions. (Diyarbakır, Şanlıurfa, Mardin, Gaziantep,
Adıyaman, Siirt, Batman)
Considering testing results for the cooking quality parameters, the spaghetti sample
produced from Fırat 93 variety can be ranked at 3rd
place (bulkiness= 65, stickiness
= 70, firmness= 70). The cooking loss is 5.3% which makes it to get to 3rd
just
behind the samples produced from Zenith and Svevo varieties. The high protein and
gluten quantities and qualities of the variety may lead to these good results in
cooking quality parameters.
Considering coloring tests which shows the yellowness of the samples as “b
indices”, the sample produced this variety gets the lowest value as 40.71. This low
yellowness value of spaghetti comes from the low yellowness (indices b) of the
wheat which was measured as 17.93
Figure 23 Cooked and uncooked spaghetti produced from Firat-93 variety

47
Another remarkable point for this variety is the difference between protein
quantities of wheat and spaghetti. The protein content of wheat was 14.55 %
(Nx5.70 d.m.) but after milling to obtain semolina, the protein content decreased to
12.94 % which means 11% reduction. This difference may show that the amino
acid content in bran part is more than that of in endosperm part.
Interbreeding of this variety with a variety which has high yellow index may be
resulted a new variety with higher values for both cooking and color results.
3.7.4. Burgos
The yellowness of wheat was very high (indices b = 23.36) for this variety so the
spaghetti sample produced from Burgos variety gets the 2nd
rank in color evaluation
with its “b indices” of 45.26 among all samples.
The cooking quality parameters of the spaghetti sample were evaluated as medium
values (bulkiness = 65, stickiness = 60, firmness= 65).
Figure 24 Cooked and uncooked spaghetti produced from Burgos variety

48
3.7.5. Ege 88
Ege 88 durum wheat variety was bred by Aegean Agricultural Research Institute by
the pedigree of JORI/ANHINGA//FLAMINGO (BITTEREN//”S”) cm 9799-126M-
1M-4Y-0M. Southeastern Anatolia and the Coastal Regions are recommended for
cultivation of this variety. Ege 88 durum wheat variety is known as its good
resistance to wheat smut and medium resistance to black-colored smut, leaf rust,
stem rust and stripe rust.
Even if the protein and gluten quantities were lowest, the cooking quality
parameters of the spaghetti sample produced from this variety gets the same values
with those produced from Burgos (bulkiness = 65, stickiness = 60, firmness= 65).
But, the gluten quality was relatively high (4.4) so, this score for gluten quality may
increase the cooking quality parameters to medium levels.
Figure 25 Cooked and uncooked spaghetti produced from Ege 88 variety

49
The yellowness index of the spaghetti gets 8th
place with 41.68 which is an
acceptable value for spaghetti.
3.7.6. Kızıltan 91
Figure 26 Cooked and uncooked spaghetti produced from Kızıltan 91 variety
This variety was bred by Field Crops Central Research Institute. Its pedigree is
ÜVY162/61 -130 and BY2E/TC. It is generally cultivated in Central Anatolia and
transition regions. Kızıltan 91 durum wheat variety is known as its tolerance against
wheat smut, black-colored smut and stripe rust and its medium resistance to leaf
rust.
The spaghetti sample produced from Kızıltan 91 variety gets 6th
rank among all
samples for both cooking quality and color parameters. All three cooking quality
parameters were evaluated as 60.

50
The yellow b index was measured as 42.23. Even if it ranks at 6th
place for color,
this value is accepted as good color for spaghetti products by pasta producers.
3.7.7. Fuatbey 2000
This variety was bred by Çukurova Agricultural Research Institute and it has good
resistance to stripe rust and septoria and medium resistance to leaf rust. Its
resistances to cold and drought are good and medium, respectively. The spaghetti
sample produced from Fuatbey 2000 get the same scores about cooking quality
parameters with the sample produced from Kızıltan 91 variety (bulkiness = 60,
stickiness = 60, firmness= 60). Also the yellowness of the sample has very similar
score with the same sample: The color b index is 42.10
Figure 27 Cooked and uncooked spaghetti produced from Fuatbey variety

51
3.7.8. Amanos 97
Like Fuatbey 2000 durum wheat variety, also Amanos 97 was bred by Çukurova
Agricultural Research Institute and it is its good resistance to stripe rust and
seproria and medium resistance to leaf rust. Its resistances to cold and drought are
good and medium, respectively.
According to the color ranking of spaghetti products, the sample produced Amanos
97 durum wheat variety gets 4th
rank with its color index which is 42.90. About its
cooking quality scores; its firmness was evaluated as 65 while its bulkiness and
stickiness were 60 and 55, respectively.
Figure 28 Cooked and uncooked spaghetti produced from Amanos 97 variety

52
3.7.9. Sarıçanak 98
Sarıçanak genotype was bred by Southeast Agricultural Research Institute. It is
known with its strong resistance against wheat bunt and wheat smut.
Considering to test results for the cooking quality parameters, the spaghetti sample
produced from Sarıçanak 98 variety can be ranked at the last place with the sample
produced from Ç-1252 variety (bulkiness = 60, stickiness = 55, firmness= 60).
By its yellowness index, 42.24, it gets 5th
rank for color ranking in all samples.
Figure 29 Cooked and uncooked spaghetti produced from Sarıçanak 98 variety
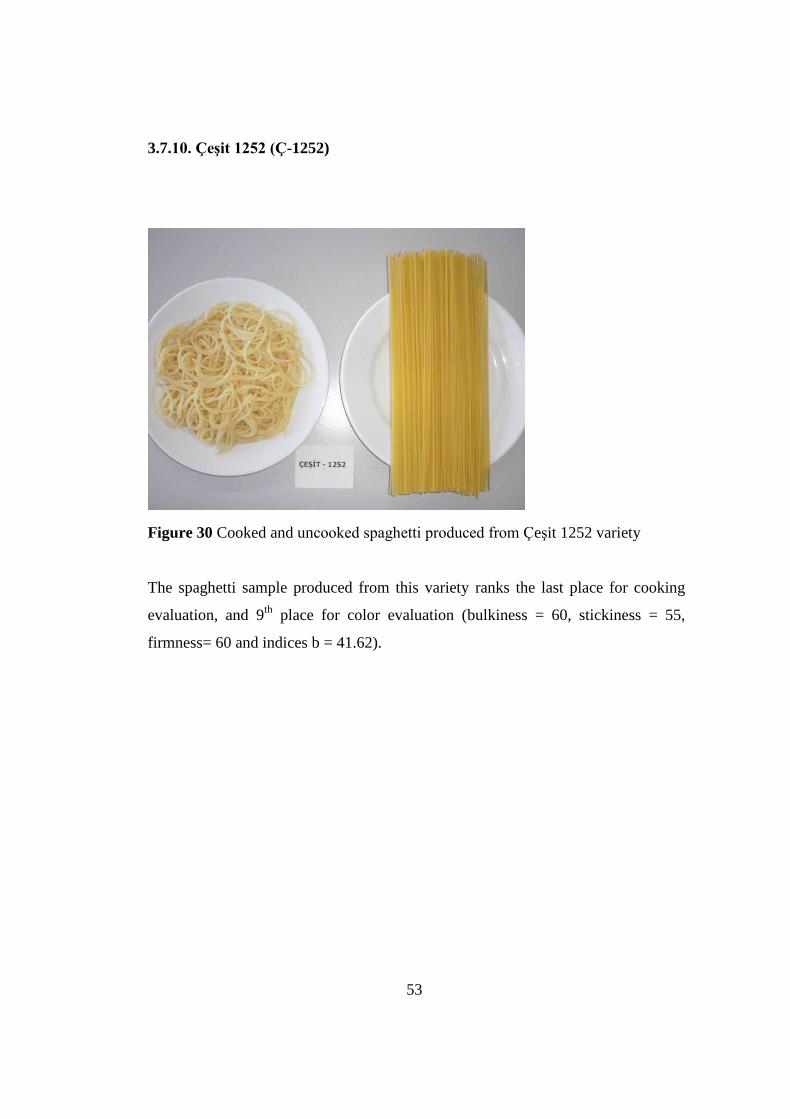
53
3.7.10. Çeşit 1252 (Ç-1252)
Figure 30 Cooked and uncooked spaghetti produced from Çeşit 1252 variety
The spaghetti sample produced from this variety ranks the last place for cooking
evaluation, and 9th
place for color evaluation (bulkiness = 60, stickiness = 55,
firmness= 60 and indices b = 41.62).

54
CHAPTER 4
CONCLUSION
In Turkey, more than 40 Durum wheat varieties have been cultivated. Especially in
the recent years, 10 of the durum varieties representing 80% of total durum wheat
production used by pasta manufacturers, which are Amanos 97, Çeşit 1252, Ege 88,
Fırat 93, Fuatbey 2000, Burgos, Kızıltan 91, Sarıçanak 98, Svevo and Zenith. In
this study, these varieties and the spaghetti products produced from these varieties
were analyzed.
The cooking quality parameters (bulkiness, stickiness, firmness) and cooking loss
of spaghetti samples produced from Svevo, Zenith and Fırat 93 varieties get the
higher scores than others. These varieties have higher protein and gluten quantity
and quality so higher scores about cooking quality parameters come from these
conditions. These scores are in agreement with a lot scientific researches those
stated the relations between cooking quality and protein fractions. The spaghetti
samples produced from Sarıçanak 98, Amanos 97, and Çeşit 1252 were evaluated
low in stickiness score (more stick and starch release) and those produced from
Sarıçanak 98, Çeşit 1252, Kızıltan 91, and Fuatbey 2000 were evaluated low for
firmness.
About the cooking loss, the spaghetti sample produced from Svevo, Zenith and
Fırat 93 get the highest scores with low cooking loss. The samples produced from
Çeşit 1252, Sarıçanak 98 and Amanos 97 gave more solids to cooking water.

55
In this study, we considered only the quantity and quality of protein and gluten. So
in this study it is impossible to show which protein’s fractions (glutenin/gliadin
ratio, amount of HMW-GS (high molecular weight glutenin subunits) or LMW GS
(low molecular weight glutenin subunits), γ-Gliadin types (γ -42 or γ -12) of these
varieties are the main responsible for having high or low cooking quality scores.
Further researches can be done to define these fractions for each variety and their
effects on cooking quality.
Some scientific researches state that the good cooking quality of pasta has also been
related to starch gelatinization properties (Resmini and Pagani, 1983; Delcour et al.,
2000a, b). So, evaluating starch properties and their effect on cooking quality
parameters can be another study for these durum wheat varieties.
The highest yellow indices (b indices) belong to spaghetti samples which are
produced from Svevo, Burgos and Zenith varieties. The b indices of other samples
ranked in between 40.71 and 42.90 which are acceptable values for pasta
manufacturers.
In general, spaghetti samples produced from Svevo and Zenith varieties have the
best scores in all quality parameters. Unfortunately, these 2 varieties have been bred
by an Italian Company and Svevo is still an exclusive variety and released 5 years
ago. Other varieties which were bred locally can be rated as medium quality but
poor in terms of color and gluten quality compared to Svevo and Zenith.
Recommendation is that, when breeding new varieties, scientists and breeders,
should focus on these two criteria to improve the quality of pasta produced in
Turkey.
Another important point is that, physical purity vitreousness (more than 90%), and
absence of soft wheat in the blend of the wheat used is an important factor on
quality.

56
According to the experiences of Turkish pasta producers which were declared by
TMSD (Association of Turkish Pasta Manufacturers), variety Çeşit-1252 is the
worst variety of Durum wheat in Turkey.
But results showed that, when this variety milled alone in a pure form, result is not
as TMSD officials declared and almost has the same quality characteristics as other
local varieties.
Protein content, gluten quality, and color are the main requirements of raw
materials in order to obtain pasta of very acceptable quality. Therefore the
characteristics of final product are linked in turn the influence of genotype and
cultivation environment. (Mariani et al, 1995); in fact the protein content is highly
dependent on the environment (locality, year, etc.); while the gluten quality and
color are mainly affected by genotype (D’Eglio and Pagani, 2010). So, the quality
parameters of durum wheat depend on both genotypes and environmental
conditions (location, growing condition, year, etc.). Further studies depending on
not only genotype but also genotype and environmental conditions can be
performed and the results of these studies will give appreciated supports and
approaches to both durum wheat producers and pasta manufacturers.
As conclusion,
Zenith and Svevo varieties are the ones which fits the end user needs. Whereas, Ç-
1252 is the worst variety and it should be deleted from the certified seeds list.
Another important result to be pointed out is that almost all of the local varieties
have similar characteristics. AS per the results of study, what we can recommend
for the future is that, instead of breeding new varieties which needs long times (12-
15 years), researchers should focus on the present varieties and develop their
“weak” characteristics from the end user point of view.

57
A good example for this is the Canada. Being the biggest exporter of Durum wheat
(Source: IGC monthly and annual reports), Canada has only 14 Durum wheat
varieties but they are “re-developed” several times as per the needs of the pasta
industry.
Importance and particularity of this thesis is that it has been carried out in an
industrial scale plant instead of laboratory scale. This is important to have a result
which can be used directly by the industry and by other parties working on similar
subjects.
This is also important for giving quick decisions for the future instead of waiting
for the industrial results of laboratory scale studies.

58
REFERENCES
AACC, 2000. Approved Methods of the American Association of Cereal Chemists.
10th
Edn., American Assocciation of Cereal Chemist Press, St. Paul, MN
Aalami, M. (2006). Physico-chemical properties and spaghetti making quality of
Indian durum wheat. Central Food Technological Research Institute Mystore-570,
India
Aalami, M., Leelavathi, K., and Rao, U.J. (2007). Spaghetti making potential of
Indian durum wheat varieties in relation to their protein, yellow pigment, and
enzyme concents. Food Chemistry 100: 1243-1248
Abecassis, J., Autran, J.C., Feillet, P. (2001). Durum wheat , semolina and pasta
quality: Recent Achievements and new trends. Editions Quae, Versailles.
Alamri, M.S., Manthey, F., Mergoum, M., Elias, E., Khan, K. (2009). Use of
Glutograph Instrument in Durum Wheat Quality Evaluation. Plant Science
Research Volume 2 Issue 3: 23-32
Alamri, M.S., Manthey, F., Mergoum, M., Elias, E., Khan, K. (2010). The Effect of
Reconstituted Semolina Fractions on Pasta Processing and Quality Parameters and
Relationship to Glutograph Parameters. Journal of Food Technology 8(4): 159-168
ISSN: 1684-8462
Amend, T., Belitz, H.D. (1989). Microscopical studies of water/flour systems.
Zeitschrift für Lebensmittel-Untersuchıng un Forschung 189 : 103-106

59
Ames, N.M., Clarke, J.M., Marchylo, B.A., Dexter, J.E., Schlichting, L.M., Woods,
S.M. (2003). The effect of extra-strong gluten on quality parameters in durum
wheat. Canadian Journal of Plant Science 83 :525-532
Autran, J.C., Abecassis, J., Felliet, P. (1986). Statistical evaluation of different
technological and biological tests for quality assessment of durum wheat. Cereal
Chemistry, 78: 157-159
Autran, J.C., and Feillet, P. (1987). Genetics and technological basis of protein
quality for durum wheat pasta. In V.Pattakou (Ed.), Proceedings of EECC
Symposium on protein evaluation in cereals and legumes. Cereal Institute,
Thessaloniki, Greece
Barilla Alimentare S.p.A. (2000). D. Brovedani and S.Tyfield (Ed.), Pasta: History,
Technologies and Secrets of Italian Tradition. Italy.
Brites, C., Carillo, J.M. (2001). Influence of High Molecular Weight and Low
Molecular Weight Glutenin Subunits Controlled by Glu-1 and Glu-3 Loci on
Durum Wheat Quality. Cereal Chemistry 78: 59-63
Borelli, G.M., Troccoli, A., Di Fonzo , N. And Fares, C. (1999): Durum wheat
lipoxgenase activity and other quality parameters that affect pasta color. Cereal
Chemistry, 76:335-340
Borelli, G.M., Troccoli, A., Fares, C., Trono, D., De Leonardis, A.M., Padalino, L.,
Pastore, D., Del Giudice, L., Di Fonzo N. (2008). Lipoxygenase in durum wheat:
What is the role in pasta color? CIHEAM-Options Mediterranean’s : 497-499
60
Bushuk, W. (1998) Wheat breeding for end product use. Euphytica 100: 137-145
Carrillo, J.M., Vazquez, J.F., Orelanna, J. (1990). Relationship between gluten
strength and glutenin proteins in durum wheat cultivars. Plant Breeding 104 : 325-
333
Chibbar, R.V., Baga, M., Ganeshan, S., Hucl, P.J., Limin, A., Perron, C.,
Ratnayaka, I., Kapoor, A., Verma, V., Fowler, D.B. (2005). Carbohyrate
modification to add value to wheat grain. In: Chung OK, Lookhard GL (Eds)
International Wheat Quality Conference, Kansas, pp 75-84
Connell, P., Lawrance, L., Nelson, R. (2004). Durum wheat: Australia’s role in
world markets. Australian Commodities, 11(2): 319-324
Coskun, Y., Ilkhan, A., Köten, M., Coskun, A. (2010) Examination for utility of b
and b* values in evaluation in terms of quality of different durum wheat cultivars
produced in Southeastern Anatolia Region. J.Agric. Fac. HR.U, 14(3): 25-29
Cubatta, R. (1988). Evaluation of durum wheat, semolina, and pasta in Europa. In
G.Fabrini and C.Lintas (Eds.) Durum wheat: Chemistry and technology, (pp.217-
228). American Association of Cereal Chemist: St. Paul, MN, USA
Dalbon G., Paganini, M.A., Resmini P. (1982). Characteristicis of durum wheat
starch and cooking qualities of pasta : Some preliminary considerations. Macaroni
Journal, 63: 22-23,26
Dawe, P.R. (2001). Pasta mixing and extrusion. In: Pasta and Semolina Technology
Blackwell Science, Oxfort, UK pp 86-118

61
D’Egidio, M.G., Pagani, M.A. (2010). Pasta and couscous: Basic foods of
Mediterranean tradition. Tecnica Molitoria International. Yearly Iaasue 2010: 105-
115
D’Egidio, M.G., Fortini, S., Galterio, G., Mariani, B.M., Sgrulletta, D., Volpi, M.
(1979). Total proteins and proteic composition of Italian durum wheat semolina
correlated with quality of pasta. Plant Foods for Human Nutrition, 14: 333-348
D’Egidio, M.G., Mariani, B.M., Nardi, S., Navoro, P. (1993). Viscoelastograph
measure and total organic matter test: Suitability evaluation of textural
characteristics of cooked pasta. Cereal Chemistry 70 : 67-72
D’Egidio, M.G., Mariani, B.M., Nardi, S., Navoro, P., Cubadda, R. (1990)
Chemical and technological variabilities and their relationships. Cereal Chemistry
67 : 275-281
D’Egidio, M.G., Nardi, S. (1998). Textural measurement of cooked spaghetti. In:
Pasta and Noodle Technology, American Association of Cereal Chemists, St Paul
MN USA, pp 133-156
Delcour, J.A., Vansteellandt, J., Hythie,r M.-C., Abecassis, J. (2000a). Fraction and
reconstitution experiments provide insight into the role of starch gelatinization and
pasting properties in pasta. Journal of Agricultural and Food Chemistry, 48: 3774-
3778
Delcour, J.A., Vansteellandt, J., Hythier, M.-C., Abecassis, J., Sindic, M.,
Deroanne, C. (2000b). Fraction and reconstitution experiments provide insight into
the role of starch gelatinization and pasting properties in pasta. Journal of
Agricultural and Food Chemistry, 48: 3674-3773

62
Dexter, J.E., Matsuo, R.R. (1978). The effect of gluten protein fractions on pasta
dough rheology and spaghetti making-quality. Cereal Chemistry 70: 44-57
Dexte,r J.E., Matsuo, R.R, Morgan, B.C. (1981). High temperature drying: Effect
on spaghetti properties. Journal of Food Science, 46: 1741-1746
Dexter, J.E., Matsuo, R.R., Morgan, B.C. (1983.) Spaghetti stickiness: Some factors
influencing stickiness and relationship to other cooking quality characteristics.
Journal of Food Science 48. 1545-1551, 1559
Dexter, J.E., and Marchylo, B.A. (2001). Recent trends in durum wheat milling and
pasta processing:impact on durum wheat quality requirements. Pages 139-164
Dexte,r J.E., Doust, M.A., Raciti, C.N., Lombargo, G.M., Clarke, F.R., Marchylo,
B.A., Schlichting, L.M. and Hatcher, D.W. (2004). Effect of durum wheat
(Triticum turgidum L. var. durum) semolina extraction rate on semolina refinement,
strength indicators and pasta properties. Canadian Journal of Plant Science 84:
1001-1013
Digesù, A.M., Platani, C., Cattivell, L., Mangini,
G., Blanco, A. (2009). Genetic
variability in yellow pigment components in cultivated and wild tetraploid wheat,
Journal of Cereal Science 50 :210-218
Du Cros, D.L. (1987). Glutenin Proteins and Gluten Strength in Durum Wheat.
Journal of Cereal Science 5: 3-12
Edward, N.M., Izydorczyk, M.S., Dexter, J.E., Biliaderis, C.G. (1993). Cooked
pasta texture: Comparison of dynamic viscoelastic properties to instrumental
assessment of firmness. Cereal Chemistry, 70(2): 122–126.

63
Edwards, N.M., Mulvaney, S.J., Scanlon M.G., Dexter J.E. (2003). Role of gluten
and its components in determining durum semolina dough viscoelastic properties.
Cereal Chemistry 8 : 755-763
Edwards, N.M., Gianibelli, M.C., McCaig, T.N., Clark,e J.M., Ames, N.P.,
Larroque, O.R., Dexter, J. (2007). Relationship between dough strength, polymeric
proteins quantity and composition for diverse durum wheat types. Journal of Cereal
Science 45: 140-149
Fares, C., Maddelen,a V., Leonardis, A., Borelli, G.M. (2001). Lipoxygenase
influence on durum wheat quality characteristics. Tecnica Molitaria v.52(3): 231-
235
Feillet, P. (1984). The biochemical basis of cooking quality-Its consequences for
durum wheat breeders. Sci. Aliment, 4 : 551-566. Cited in J.E. Kruger, R.B. Matsuo
and J.W.Dick (Eds.), Pasta and noodle technology (2nd
ed.)
Feillet, P., Dexter, J.E. (1996). Quality requirements of durum wheat for semolina
milling and pasta production. In: Pasta and noodle Technology, AACC
International St. Paul, MN, USA, pp 95-131
Feillet, P., Dexter, J.E.(1998). Quality requirements of durum wheat for semolina
milling and pasta production. In J.E. Kruger, R.B. Matsuo & J.W. Dick (Eds.),
Pasta and noodle technology (2nd
ed.): 95-132
Fortini, S. (1988). Some specific aspects of durum wheat and pasta cooking quality
evaluation in Europa. In G. Fabriani & C. Lintas. Durum wheat: Chemistry and
Technology (pp. 229-235). American Association of Cereal Chemist: St. Paul, MN,
USA

64
Fuad, T., Prabhasankar, P. (2010). Role of Ingredients in Pasta Product Quality: A
Review on recent developments. Critical Reviews in Food Science and Nutrition
(Volume 50, Number 8): 787-798
Galterio, G., Ng, P.K.W., Bushuk, W. (1991). Statistical relationship between
electrophoretic composition of proteins in pasta quality on Italian durum wheats.
Agricoltura Mediterranea, 121: 115-118
Grant, L.A., Dick, J.W., Shelton, D.R. (1993). Effect of drying temperature, starch
damages, sprouting, and additives on spaghetti quality characteristics. Cereal
Chemistry, 70: 676-684
Gupta, R.B., Popineau, Y., Lefervre, Y., Cornec,t M., Lawrance, G.J., MacTicthie,
F. (1995). Biochemical basis of flour properties in bread wheats II. Changes in
polymeric protein formation and dough /gluten properties associated with the loss
of low Mr or high Mrglutenin subunits. Journal of Cereal Science, 21: 103-116
Güler, S., Köksel, H., Ng, P.K.W. (2002). Effect of industrial pasta drying
temperature on starch properties and pasta quality. Food Research International,
35: 421-427
Hayka, C. (2009). Criteria and indices indices for durum wheat technological
quality Agricultural Science. ISSN 1311-3534 V.42(3): 23-32
Kaplan, A., Pehlivan, A., Şanal, T., Çınkaya, N., Keçeli, A., Zencirci, N., Dönmez,
E., Yazar, S. (2008). Quality Evaluation and Grouping by Diagram Method in
Some Durum Genotypes. From Seed to Pasta: The Durum Wheat Chain-
International Durum Wheat Symposium. Posters Session P.8.17
Köksel, H., Sivri, D., Ozboy, O., Basman, A., Karacan, H. (2000). Cereal
laboratory handbook. Hacettepe University Engineering Faculty, Ankara Turkey.

65
Kovacs, M.I.P., Howes, N.K., Leisle, D., Zawistowski, J. (1995). Effect of two
different low molecular weight glutenin subunits on durum wheat quality
parameters. Cereal Chemistry 72(1): 85-87
Kovacs, M.I.P , Poste, L.M , Butler, G , Woods, S.M , Leisle, D , Nol, J.S ,
Dahlke, G. (1997). Durum wheat quality: Comparison of chemical and rheological
screening tests with sensory analysis. Journal of Cereal Science 25:65-75
Landi, A. (1995). Durum wheat, semolina and pasta quality characteristics for an
Italian food company. CHIEAM-IAMZ, Zaragoza, Spain pp. 33-42
Lennox, G. (2003). Market Analysis Division Online line. Bi-weekly Bulletin,
16(11):1-6
Lepage, M., Sims, R.P.A. (1968). Carotenoids of wheat flour: Their identification
and composition. Cereal Chemistry, 45:600
Lintas, C., D’Appolina, B.L. (1973). Effect of spaghetti processing on semolina
carbohydrates. Cereal Chemistry, 50: 563-570
Marchylo, B.A., Dexte,r J.E., Clarke, J.M., Clarke, F.R., Preston, K.R. (2001).
Relationship among bread-making quality, gluten strength, physical dough
properties and pasta cooking quality for some Canadian durum wheat genotypes.
Canadian Journal of Plant Science 81: 611-620
Mariani, B.M., D’Egidio, M.G., Navoro, P. (1995). Durum wheat qality evaluation:
influence of genotype and environment. Cereal Chemistry, 72: 194-197.
66
Matsuo, R.R. (1988). Evaluation of durum wheat, semolina, and pasta in Canada. In
G.Fabriani & C.Lintas (Eds), Durum wheat: Chemistry and Technology:249-262
St. Paul, MN, USA
Matsuo, R.R., Dexter, J.E. (1980). Relationship between some durum wheat
physical characteristics and semolina milling properties. Canadian Journal of Plant
Science, 60: (1) 49-53
Miflin, B.J., Field, J.M., Shewry, P.R. (1983). Cereal storage proteins and their
effect on technological properties. In: Seed Proteins, Academic Press, London, UK,
: 255-319
Mondelli, M., ( 1998). An annotated study of the historical and documentarı
resources in Pasta e Pastai.
Nachit, M.M., Baum, M., Impiglia, A., Ketata, H. (1995). Studies on some grain
quality traits in durum wheat grown in Mediterranean environment. CIHEAM-
IAMAZ pp. 181-187
Oak, M.D., Dexter, J.E. (2006). Chemistry, genetics and prediction of dough
strength and end-use quality in durum wheat .In: Gliadin and Glutenin, AACC
International , St. Paul , M.N , pp 281-305
Pasqualone, A., Torelli, M., Salvagione, G., Torti, M. (2008). Correlation Between
Sensory Properties and Pasta Firmness Evaluated by Cuocimatic Professional Lab.
From Seed to Pasta: The Durum Wheat Chain-International Durum Wheat
Symposium. Posters Session P.8.3
67
Payne, P.I., Jackson, E.A., Holt, L.M. (1984). The association between gamma-
gliadin 45 and gluten strength in durum varieties: A direct effect or the result of
genetic linkage? Journal of Cereal Science, 2:73-81
Pena, R.J., R. Trethowan,
R., Pfeiffer,
W.H., Van Ginkel,
M. (2002). Quality (End-
Use) Improvement in Wheat. Journal of Crop Production (V.5, Iss.1-2): 1-37
Petitot, M., Barron, C., Abecassis, J., Bronssard, C., Micard, V. (2008). Change in
Pasta Protein and Starch Structure Included by Drying Cycle and Their
Relationship to Protein and Starch Digestibility. From Seed to Pasta: The Durum
Wheat Chain-International Durum Wheat Symposium. Posters Session P.9.1
Pogna, N.E., Lafiandra, D., Feille,t P., Autran, J.C. (1988). Evidence for a direct
casual effect of low molecular weight subunits of glutenins on gluten viscoelasticity
in durum wheat. . Journal of Cereal Science 7: 311-214
Pogna, N.E., Autran, J.C., Mellini, F., Lafiandra, D., Feillet, P. (1990).
Choromosome 1B-encoded gliadins and glutenins Subunits in Durum Wheat:
Genetics and Relationships to Gluten Strength. Journal of Cereal Science 11: 15-34
Ranieri, R. (1995). Durum wheat quality management. CHIEAM-IAMZ, Zaragoza,
Spain pp. 555-557
Resmini, P., Pagani, M.A. (1983). Ultra structure studies of Pasta. A review. Food
Microstructure, 2:1-12
Robinson, W.L. (2001). Durum wheat milling differs in many ways from
conventional wheat milling. Indian miller, Nov-Dec: 49-58

68
Sakin, M.A., Sayaslan, A., Düzdemir, O., Yüksel F. (2011). Quality characteristics
of registered cultivators and advanced lines of durum wheats grown in different
ecological regions of Turkey. Canadian Journal Plant Science 91: 261-271
Shewry, P.R., Tatham, A.S., Halford, N.G. (1999). The prolamins of Triticeae. In
P.R. Shewry and R. Casey (Eds.), Seed Proteins (pp.35-78) Kluwer Academic
Publisher, Dordrecht.
Shewry, P.R., Halford, N.G., Belton, P.S., Tatham, A.S. (2002) The structure and
properties of gluten: An elastic protein from wheat grain.
Philosophical Transactions Royal Society London 357 : 133-142
Simone, R., Pasqualone, A., Fares, C., Di Fidanzo, N., Blanco, A. (2001).
Evaluation of pasta-making properties of semolina from different durum wheat
cultivators. Colloques de I’INRA: 55-59
Sissons, M.J. (2004). Pasta In: Wrigley C, Corke H, Walker C (eds) Encyclopaedia
of grain Science, Elsevier, Australia, pp 409-418
Sissons, M.J., Ames, N.P., Hare, R.A., Clarke, J.M. (2005a.). Relationship between
glutenin subunit composition and gluten strength measurements in durum wheat,
Journal of the Science of Food and Agriculture 85: 2445-2452
Sissons, M.J., Egan, N.E., Gianibelli, M.C. (2005b) New insights into the role of
gluten on durum pasta quality using reconstitution method. Cereal Chemistry 82:
601-608
Sissons, M.J., Soh, H.N., Turner, M.A. (2007). Role of gluten and its components
in influencing durum wheat dough properties and spaghetti cooking quality.
Journal of the Science of Food Agriculture 87: 1874-1885

69
Sissons, M.J., (2008). Role of durum wheat composition on the quality of pasta and
bread. Global Science Books 2008: 75-90
Societa Produttori Sementi S.p.A. Bologna (2008). Improving agricultural
production through research and transfer of innovation. Via Macero, 1-40050
Argelato (BO) Italy
Sopiwnyk, E.J. (1999.) Effects of gluten strength on the rheological and textural
properties of spaghetti made from durum wheat. MSc , University of Manitoba ,
Department of foods and Nutrition, Winnipeg , Manitoba , pp 51-175
Taha, S.A., Sagi , F. (1987). Relationships between chemical composition of durum
wheat semolina and macaroni quality. II. Ash , carotenoid pigments, and oxidative
enzymes. Cereal Res. Commun., 15:402-407
TMSD: The Association of Turkish Pasta Manufacturers. Web site :
www.makarna.org.tr (2008) Pasta: Its Scientific Aspect. Ankara.
TSE: Institution of Turkish Standards. Standard 1620 (Pasta Standard) (1976)
Wrigley, C., Bekes, F., Bushuk, W. (2006). Gliadin and Glutenin : The Unique
Balance of Wheat Quality (1 st Edn), AACC International , M.N , pp 3-32
Web Site of Classfoods : www.classofoods.com.
Zweifel, C., Conde-Petit, B., Escher, F. (2000). Thermal modifications of starch
during high-temperature drying of pasta. Cereal Chemistry 77(5): 645-651

70
APPENDIX 1
Technological Standard Sheet

MOD(Q)-03-01-04-(BO)
Tarih/Date: Kontrol Tarihi:
Date Check:
Onay Tarihi: Date
Approved:
Bolu Fabrika/ Plant 01.04.2009 01.04.2009 01.04.2009Sorumlu/By Sorumlu/By Sorumlu/ByOkkaoglu I. Nespoli A. Dameno F.
Çetiner M.
Şekil/ Shape # 5 Spaghetti
Şekil İsmi/ Shape name
Birim Units Değer Value Tolerans Tolerance
İrmik Besleme Semolina feeding
İrmik Miktarı / Semolina mass flow Kg/saat Kg/h 2100 ± 100
Su Oranı / Water percent % 28,0 ± 3Hamur Suyu Sıcaklığı/Water feeding
temperature°C 50 ± 10
Vakum/Vacuum Vakum seviyesi/Vacuum level mm - Hg 600,0 ± 50
Pres/Press Vida Sıcaklıkları/Cylinder temperatures °C 35,0 ± 5
------------------------ Kafa Sıcaklıkları/Head temperatures °C 40,0 ± 5
------------------------ 1.Vida Hızı/Screw Speed 1 rpm 23,5 ± 1
------------------------ 2.Vida Hızı/Screw Speed 2 rpm 23,5 ± 1
------------------------ Vida Basıncı/Screw Pressure Bar 100 ± 10
Filtre sayısı/Die screen no. 2
Dağıtıcı / Spreader Üç Lata Zamanı / Loading cycle Saniye / sec 35,5
°C 70 ± 10Ön Ön-Kurutma 1.Bölge Pre
Predryer Z1 Sıcaklık/Temperature °C 49,0 ± 1
------------------------ Delta °C 10,0 ± 1
------------------------ Bağıl Nem/Humidity % 52,0 ± 2
------------------------ Eksoz Valfi Açıklığı/Humidity valve out Psi 11,0 ± 1
------------------------ Sıcaklık valfi açıklığı/Temperature valve out Psi 5,0 ± 1
Ön Ön-Kurutma 2.Bölge Pre Predryer Z2
Sıcaklık/Temperature °C 53,5 ± 1
------------------------ Delta °C 8,0 ± 1
------------------------ Bağıl Nem/Humidity % 62,0 ± 2
------------------------ Eksoz Valfi Açıklığı/Humidity valve out Psi 11,5 ± 1
------------------------ Sıcaklık valfi açıklığı/Temperature valve out Psi 6,0 ± 1
Ön-Kurutma 1.Bölge Predryer Z1 Sıcaklık/Temperature °C 58,0 ± 1
------------------------ Delta °C 5,8 ± 1
------------------------ Bağıl Nem/Humidity % 72,0 ± 2
------------------------ Eksoz Valfi Açıklığı/Humidity valve out Psi 11,0 ± 1
------------------------ Sıcaklık valfi açıklığı/Temperature valve out Psi 7,0 ± 1
Ön-Kurutma 2.Bölge Predryer Z2 Sıcaklık/Temperature °C 68,5 ± 1
------------------------ Delta °C 6,8 ± 1
------------------------ Bağıl Nem/Humidity % 72,0 ± 2
------------------------ Eksoz Valfi Açıklığı/Humidity valve out Psi 9,0 ± 1
------------------------ Sıcaklık valfi açıklığı/Temperature valve out Psi 5,0 ± 1
------------------------ Ön Kurutma Çıkış Nemi/Moistness of
product % 18,0 ± 1
------------------------ Ön Kurutma Süresi /Pre-Dryer Residence
timesaat:dak/hours:min 0:45:00
GPL 1 Sıcaklık/Temperature °C 78,0 ± 1
------------------------ Delta °C 6,8 ± 1
------------------------ Bağıl Nem/Humidity % 74,0 ± 2
------------------------ Eksoz Valfi Açıklığı/Humidity valve out Psi 9,0 ± 1
------------------------ Sıcaklık valfi açıklığı/Temperature valve out Psi 3,5 ± 1
GPL 2 Sıcaklık/Temperature °C 79,0 ± 1
------------------------ Delta °C 6,6 ± 1
------------------------ Bağıl Nem/Humidity % 75,0 ± 2
------------------------ Eksoz Valfi Açıklığı/Humidity valve out Psi 10,0 ± 1
GPL 3 Sıcaklık/Temperature °C 86,0 ± 1
------------------------ Delta °C 10,6 ± 1
------------------------ Bağıl Nem/Humidity % 64,0 ± 2
------------------------ Eksoz Valfi Açıklığı/Humidity valve out Psi 9,0 ± 1
------------------------ Sıcaklık valfi açıklığı/Temperature valve out Psi 6,0 ± 1
------------------------ M-1 Çıkış Nemi/Moistness of product % 13,0 ± 1
------------------------ İkinci Kurutma Süresi /GPL Residence time saat:dak/hours:min 5:00:00
Sıcak Şoklama/Gradual Cooler Sıcaklık/Temperature °C 72,0 ± 3
------------------------ Delta °C 3,0 ± 2
------------------------ Bağıl Nem/Humidity % 88,0 ± 2
Süre / Residence time saat:dak/hours:min 0:25:00
Soğutma / Cooler Sıcaklık/Temperature °C 36,0 ± 3
------------------------ Delta °C 5,0 ± 2
------------------------ Bağıl Nem/Humidity % 60,0 ± 2
Süre / Residence time saat:dak/hours:min 0:25:00
% 11,5 ± 1
saat:dak/hours:min 6:35:00
Toplam Hat/Total Line Randıman/Productivity Kg/saat Kg/h 1950 ± 50
Revizyon numarası/Revision Number N° 003
Spaghetti
Proses Değerleri/Variables Values
Su Besleme/Water feeding
"Ürün Reçetesi/Technological Standard Sheet "
Kafa Üfleme Sıcaklığı/Temperature Fans
Hat Çıkış Nemi / Moistness After Cooler
Toplam Kurutma Süresi / Total residence time
SPAGHETTIHat/Line: 107
71

72
APPENDIX 2
1. Gluten Quantity and Gluten Quality Analysis
The gluten quantity and quality of all samples were measured by the following
method:
1.1. Scope:
To measure and describe the method for the determination of the quality evaluation
of gluten of wheat and semolina using Glutograph and quantitative analysis
1.2. Principle:
Dough is prepared by mixing the milled durum wheat or semolina with a buffered
solution of sodium chloride; the wet gluten is isolated by leaching and washing the
dough with Glutomatic using the same solution. The Glutograph is used for the
qualitative analysis. For the quantitative analysis, the gluten is dried and weighed.
1.3. Reagents:
Distilled water.
Sodium chloride.
Sodium chloride, washing solution 2% p/v
Weigh (7.1) 20 g of sodium chloride (6.2).
Dissolve (7.9) in 1 litre of distilled water (6.1).
Mix well.
1.4. Apparatus:
Balance, precision 0.01 g.

73
Perten Glutomatic 2200 – Gluten washer.
Brabender Glutograph.
Automatic doser supplied with the gluten washer.
Chronometer.
Mercury thermometer or digital thermometer with Pt100 probe.
Laboratory mill Cyclotec Mod.1093 with grid of 0.5 mm diameter.
Metallic sieve with a nominal mesh opening of 20 x 1.9 mm.
Glass calibrated flask, 1000 ml capacity.
1.5. Procedure:
1.5.1. Sample preparations:
Durum wheat
- Weight 70 g of durum wheat.
- Pour the weighted sample on the metallic sieve.
- Sieve manually.
- Eliminate all impurities and extraneous material.
- Collect the sample held in the metallic sieve and mill.
- Slowly feed the mill avoiding grid obstruction.
- Accurately mix the milled sample.
- Let cool the milled sample until room temperature is attained.
Semolina
Analyze as it is.
1.5.2. Dough preparation and washing
- Always prepare 2 dough samples for every sample
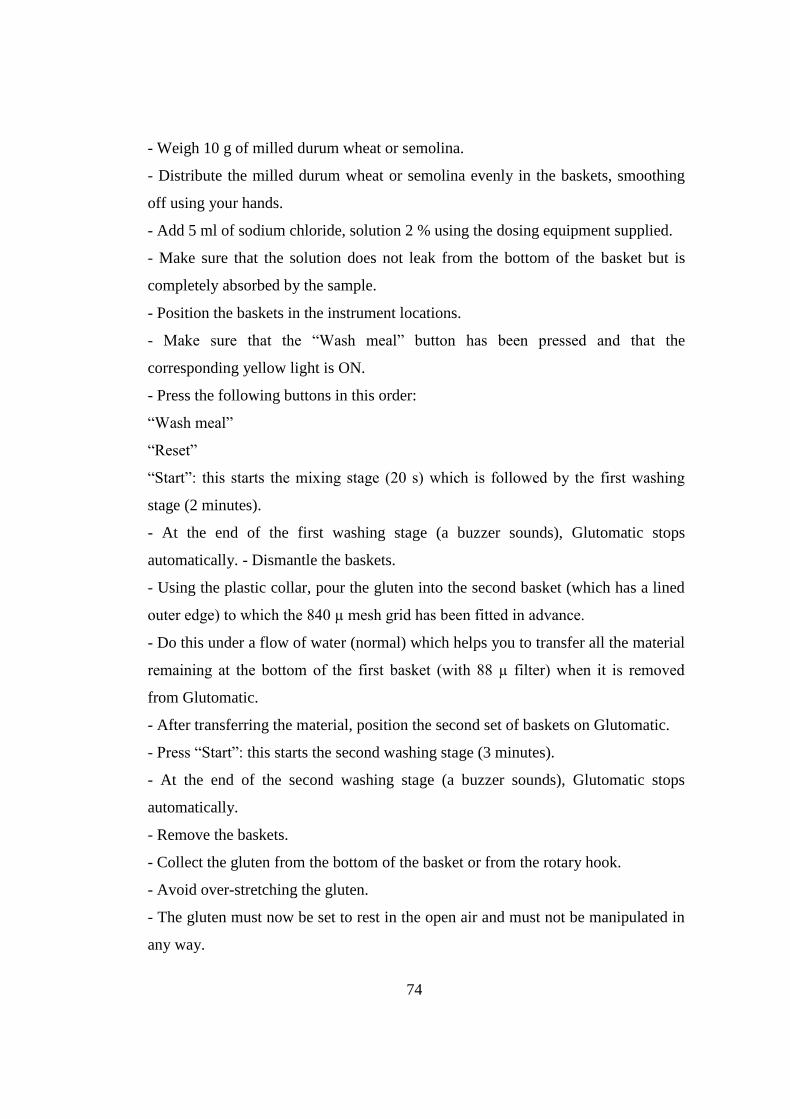
74
- Weigh 10 g of milled durum wheat or semolina.
- Distribute the milled durum wheat or semolina evenly in the baskets, smoothing
off using your hands.
- Add 5 ml of sodium chloride, solution 2 % using the dosing equipment supplied.
- Make sure that the solution does not leak from the bottom of the basket but is
completely absorbed by the sample.
- Position the baskets in the instrument locations.
- Make sure that the “Wash meal” button has been pressed and that the
corresponding yellow light is ON.
- Press the following buttons in this order:
“Wash meal”
“Reset”
“Start”: this starts the mixing stage (20 s) which is followed by the first washing
stage (2 minutes).
- At the end of the first washing stage (a buzzer sounds), Glutomatic stops
automatically. - Dismantle the baskets.
- Using the plastic collar, pour the gluten into the second basket (which has a lined
outer edge) to which the 840 µ mesh grid has been fitted in advance.
- Do this under a flow of water (normal) which helps you to transfer all the material
remaining at the bottom of the first basket (with 88 µ filter) when it is removed
from Glutomatic.
- After transferring the material, position the second set of baskets on Glutomatic.
- Press “Start”: this starts the second washing stage (3 minutes).
- At the end of the second washing stage (a buzzer sounds), Glutomatic stops
automatically.
- Remove the baskets.
- Collect the gluten from the bottom of the basket or from the rotary hook.
- Avoid over-stretching the gluten.
- The gluten must now be set to rest in the open air and must not be manipulated in
any way.

75
1.5.3. Gluten rest:
Leave the gluten for 5 minutes in the open air.
1.5.4. Gluten quality evaluation – Glutograph:
- Transfer the sample obtained from the first washing cycle of Glutomatic in the
central part of the lower toothed disk on the Glutograph.
- Position it so that it maintains the same position as during the rest stage (the lower
part in contact with the table during the rest stage must now be fully in contact with
the lower toothed disk).
- Lower the upper toothed disk.
- Tighten the closing mechanism.
- Cut the surplus edge of gluten with a rapid downwards movement, rotating it in an
anti-clockwise direction at the same time to assist the work of the knife.
- Move the knife back to its original position
- Remove any bits of gluten stuck to the lower cylinder.
- Turn ON the instrument by pressing “Start”.
- The instrument stops automatically when the pen reaches the 800 B.U. line or
when 126 seconds have elapsed, regardless of the position of the pen.
Repeat these operations for the gluten obtained from the second washing cycle of
Glutomatic.
1.5.5. Gluten quantity
- Mix the two gluten samples from the Glutograph test with the surplus gluten cut
from the samples previously.
- Dry gluten by pressing it between the palms of your hands.

76
- Continue this operation until the weight stops decreasing.
- Weigh gluten: P
1.6. Expression of Results:
Gluten quality is expressed with one decimal place. Gluten weight is expressed
with one decimal place
1.7. Method of calculation and formulas:
1.7.1. Qualitative analysis:
Depending on the quality of the gluten, we can have two reading conditions:
i) Time in seconds (to be read on the display, considering that the third digit
represents tenths of a second) if the pen had reached the 800 B.U. line within 126
seconds.
ii) B.U. value (read the B.U. value corresponding to the point reached by the pen),
if the pen had not reached the 800 B.U. line within 126 seconds.
To obtain an evaluation on a decimal scale, use the following equations:
Evaluation = 2.66 + 0.96 x Ln sec.
Evaluation = 9.92 - 3.35 x (B.U./ 1000)
Where:
Ln sec = natural time logarithm (expressed in seconds).
B.U. = Brabender Units

77
1.7.2. Quantitative analysis:
The gluten content, expressed as %, is:
P x 5
% gluten = ________
3
P x 5 100
% gluten (dried matter) = __________ x __________
3 100 - U
Where;
P = Dried gluten weight, in grams
U = % Sample moisture
1.7.3. Repeatability:
The difference between the results of two single determinations carried out
simultaneously or in rapid succession by the same analyst shall not exceed the
following value:
Evaluation: ± 0.15
If the differences are greater, the analysis must be repeated.

78
APPENDIX 3
1. Cooking Quality Analysis
The cooking quality parameters of all samples were measured by the following
method:
1.1. Scope:
To describe the method for cooking pasta and for manual analysis of
characteristics of the cooked pasta to check that it meets the product standards for
the particular reference pasta cuts.
1.2. Terms and Definition:
Bulkiness: the ability of one piece of pasta to slide smoothly against another.
Stickiness: State of surface breakage of the cooked pasta, with release of finger.
Firmness: Resistance of the cooked pasta to squashing between the fingers.
1.3. Apparatus:
Balance, precision 0.001 g.
Steel pots with lids, 2 liter capacity.
A colander for pasta, plates and a fork.
Hot plates.
Chronometer.
Graduated cylinder, 1 liter capacity.

79
Glass beaker, 250 ml capacity.
Reference pasta samples of which cooking characteristics (bulkiness,
stickiness, firmness) have been predefined.
1.4. Procedure:
- Weigh 80 g of pasta.
- Only for long cuts break the pasta in two parts and eliminate any small bits before
weighing.
- Turn on the hot plate, always positioning the plate knob in the same way to ensure
that the cooking speed conditions are always the same.
- Place the 2-liter steel pot containing 1300 ml of tap water measured using a
graduated cylinder on the hot plate.
- Boil the water.
- Keep the water close to boiling point so that it can be brought back to boiling
point as soon as the pasta is added.
- Add the pasta sample in the pot and start the chronometer at the same time
- Cook the pasta for the time indicated by product standards.
- For the first minute, leave the pot fully closed. For the remaining time, the lid
must be moved slightly to the side.
- While the pasta is cooking, mix it with a fork 3 times for 10 seconds. Do this at
1.4, 1.2 and 3.4 of the cooking time.
- When the pasta is cooked (8 minutes for spaghetti which are subject for this
project), cool the water by adding 200 ml of cold tap water into the pot using a
beaker.
- Drain the pasta immediately, hitting the colander 3 times (7.3).
- Pour the pasta onto the plate.
- Leave the cooked pasta to the plate for 5 minutes.
-Test the pasta using the hands.

80
1.5. Test methods:
1.5.1. Bulkiness:
- Wet your hands and shake off the excess water.
- Pick up handful of pasta and drop it onto the plate.
- Repeat the operation three times.
Using the reference samples for comparison, test the way in which the pieces of
pasta separate from each other and the way they drop onto the plate.
1.5.2. Stickiness:
- Wet your hands and shake off the excess water.
- Put your on the pasta and rub it with the palm of your hands and your fingers.
- Repeat the operation three times.
Using the reference sample for comparison, evaluate the amount of starch on your
hands and fingers.
1.5.3. Firmness:
-Wet your hands and shake off the excess water.
- Place two pieces of pasta in the front end of index finger and press it with your
thumb until both pieces break.
- Repeat the operation approximately 10 times.
Using the reference samples for comparison, evaluate the effort required to break
the pasta pieces.

81
1.6. Expression of Results:
The results are expressed by an integer number in relation to a defined scale for the
three parameters tested.
Score the sample tested, referring to the evaluation scale stipulated for the three
parameters: Bulkiness, stickiness and firmness
Table 1 Evaluation scale for cooking quality
Bulkiness Stickiness Firmness
90 90 90
80 80 80
70 70 70
60 60 60
50 50 50

82
APPENDIX 4
1. Color Analysis (Wheat)
Colors of all samples were measured by the following method:
1.1. Scope:
To describe the method for the determination of color or “b” index of durum wheat
kernels
1.2. Method:
Kernels are taken the barks off to remove bran part, which would cover yellow
component and later grinder.
Intrinsic color is identified using only one definite band of flour particle size to
limit the variability due to grinding and by evaluating the color using the Minolta
colorimeter.
1.3. Apparatus and Reagents:
MT-0020 –Minolta CR300 colorimeter.
Satake debranner TM 50.
Buhler grinder MLI 205.
Technical balance, precision 0.01 g.
Minolta CR 300 colorimeter.
CR A-50 accessory for powder.
White reference plate.
Buhler MLI 300 type sieve unit with eccentric movement.

83
Series of sieves for Buhler sieve unit with diameter of 200 mm and three 42
cm chains secured to the inside at 120° with nytal filter with mesh 200 µ
Series of sieves for Buhler sieve unit with diameter of 200 mm and three 42
cm chains secured to the inside at 120° with nytal filter with mesh 160 µ
Collection plate.
Plastic bowl.
Small rubber hammer.
Soft bristle brush.
1.4. Procedure:
1.4.1. Instrument preparation:
Calibrate the instrument by carefully positioning the measurement head of the
optic lens of the CR A-50 accessory on the white reference plate supplied and select
the color space Y x y (with D65 light) in the CieLab system.
At the end of calibration, return to color space “L” “a” “b” and press 8 [PAGE]
and 16 [ENTER] to set up the color meter for reading the samples
1.4.2. Sample preparation:
- Pick up a wheat sample of about 250 grams.
- Clean wheat accurately using metallic sieve.
- Divide sample into two portions of about 100 grams each.
- Pass two samples separately from Satake debranner for 4 minutes.
- Assemble two barked portions and grind.
- Do grinding a first time with grinder regulation on nr.9 (gross grinding).
- Then repeat grinding on position nr. 4.

84
- The particle size of flour product must be so that waste on film 160 µ is contained
between 10 and 12 g.
-Mix sample accurately.
- Mount the sieves fitted with the Nytal filters with 200 and 160 µ mesh size with
200 above and 160 below.
- Place the collection plate underneath the sieves.
- Place this set on the sieve unit.
- Weigh 100 g of semolina.
- Pour the semolina onto the 200 µ sieve.
- Secure the cover carefully.
- Sieve for 5 minutes.
- At the end of the sieving, carefully eliminate the bits still under the 160 µ filter by
hitting the sieve gently with a small rubber hammer.
- Collect the remains from the 160 µ filter in a plastic bowl.
- Homogenize.
- The colorimeter analysis is carried out on the material which remains in the 160 µ
filter sieve.
1.4.3. Colorimeter reading:
- Take one part of the sample and carry out the colorimeter reading using the CR A-
50 cell
- Place this sample part back in the container (7.9) and mix again.
- Repeat the reading for 3 different parts of the sample.
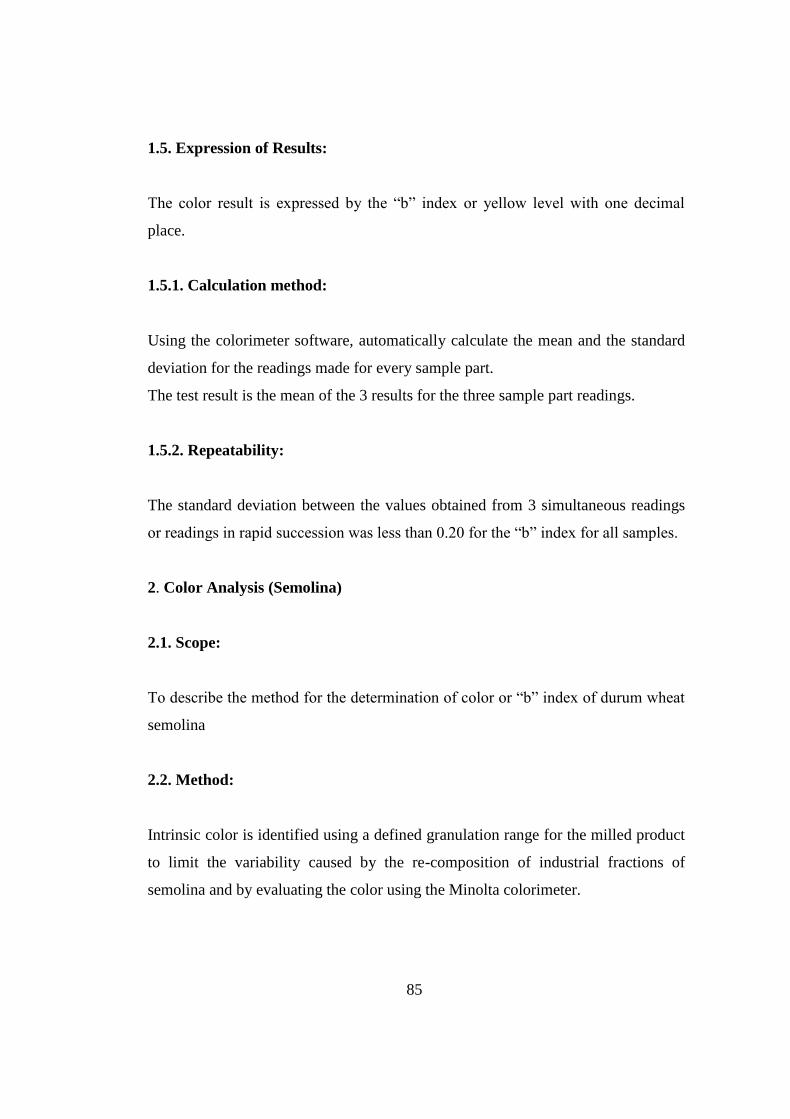
85
1.5. Expression of Results:
The color result is expressed by the “b” index or yellow level with one decimal
place.
1.5.1. Calculation method:
Using the colorimeter software, automatically calculate the mean and the standard
deviation for the readings made for every sample part.
The test result is the mean of the 3 results for the three sample part readings.
1.5.2. Repeatability:
The standard deviation between the values obtained from 3 simultaneous readings
or readings in rapid succession was less than 0.20 for the “b” index for all samples.
2. Color Analysis (Semolina)
2.1. Scope:
To describe the method for the determination of color or “b” index of durum wheat
semolina
2.2. Method:
Intrinsic color is identified using a defined granulation range for the milled product
to limit the variability caused by the re-composition of industrial fractions of
semolina and by evaluating the color using the Minolta colorimeter.

86
2.3. Apparatus:
Minolta CR 300 colorimeter
CR A-50 accessory for powder
White reference plate
Technical balance, precision 0.01 g
Buhler MLI 300 type sieve unit with eccentric movement
Series of sieves for Buhler sieve unit with diameter of 200 mm and three 42
cm chains secured to the inside at 120° with nytal filter with mesh 200 µ
Series of sieves for Buhler sieve unit with diameter of 200 mm and three 42
cm chains secured to the inside at 120° with nytal filter with mesh 160 µ
Collection plate
Retsch type sieve unit, mod. AS 200 Control “G”
Series of metal sieves for Retsch sieve unit, as per DIN-ISO3310/1 standard
with mesh of 200 µ
Series of metal sieves for Retsch sieve unit, as per DIN-ISO3310/1 standard
with mesh of 160 µ
Collection plate
Glass balls, diameter 0.5 mm, n.°80
Plastic bowl
Small rubber hammer
Soft bristle brush
2.4. Procedure:
2.4.1. Instrument preparation:
Calibrate the instrument by carefully positioning the measurement head of the optic
lens of the CR A-50 accessory on the white reference plate supplied and select the
color space Y x y (with D65 light) in the CieLab system.

87
At the end of calibration, return to color space “L” “a” “b” and press 8 [PAGE]
and 16 [ENTER] to set up the color meter for reading the samples
2.4.2. Sample preparation:
- Mount the sieves fitted with the Nytal filters with 200 and 160 µ mesh size with
200 above and 160 below.
- Place the collection plate underneath the sieves.
- Place this set on the sieve unit.
- Weigh 100 g of semolina.
- Pour the semolina onto the 200 µ sieve.
- Secure the cover carefully.
- Sieve for 5 minutes.
- After sieving, carefully eliminate the bits still under the 160 µ filter by hitting the
sieve gently with a small rubber hammer or using a soft bristle brush.
- Pass the remains from the 160 µ filter through a broad mesh sieve to recover the
glass balls.
- Collect the remains from the 160 µ filter passed through the broad mesh sieve in a
plastic bowl and homogenize.
- The colorimeter analysis is carried out on the material which remains in the 160 µ
filter sieve.
2.4.3. Colorimeter reading:
- Take one part of the sample and carry out the colorimeter reading using the CR A-
50 cell.
- Place this sample part back in the container and mix again.
- Repeat the reading for 3 different parts of the sample.

88
2.5. Expression of Results:
The color result is expressed by the “b” index or yellow level with one decimal
place.
2.5.1. Calculation method:
Using the colorimeter software, automatically calculate the mean and the standard
deviation for the readings made for every sample part.
The test result is the mean of the 3 results for the three sample part readings.
2.5.2. Repeatability:
The standard deviation between the values obtained from 3 simultaneous readings
or readings in rapid succession were less than 0.20 for the “b” index for all samples.
3. Color Analysis (Pasta-Spaghetti)
3.1. Scope:
To describe the method for the determination of color of spaghetti
3.2. Principle:
The apparent color of all pasta cuts is determined directly using a Minolta CR410
colorimeter with a very large reading spot.

89
3.3. Apparatus:
Minolta CR410 colorimeter.
Minolta accessory: special extension tube for CR 410 without reflection-
proof glass.
PTFE collar dimensions: outer diameter 70 mm, inner diameter 56 mm and
height 45 mm. This is inserted on the extension tube to facilitate reading
head positioning on the containers used for the pasta samples.
Rectangular Plexiglas container with dimensions of 275 x 94 and height of
65 mm, including a cover with three 55 mm diameter holes.
3.4. Procedure:
3.4.1. Instrument preparation:
Calibrate the instrument by carefully positioning the measurement head with the
extension tube fitted with the white collar on the white reference plate and select
the color space Y x y (with D65 light) in the CieLab system.
At the end, return to color space “L” “a” “b” and press 8 [PAGE] and 16 [ENTER]
to set up the color meter for reading the samples
3.4.2. Sample preparation:
- Use approximately 500 g of spaghetti pasta.
- Position the pasta sample inside the rectangular container and remove all pieces of
crooked pasta.
- Compress the sample inside the container using the special cover with 3 holes.
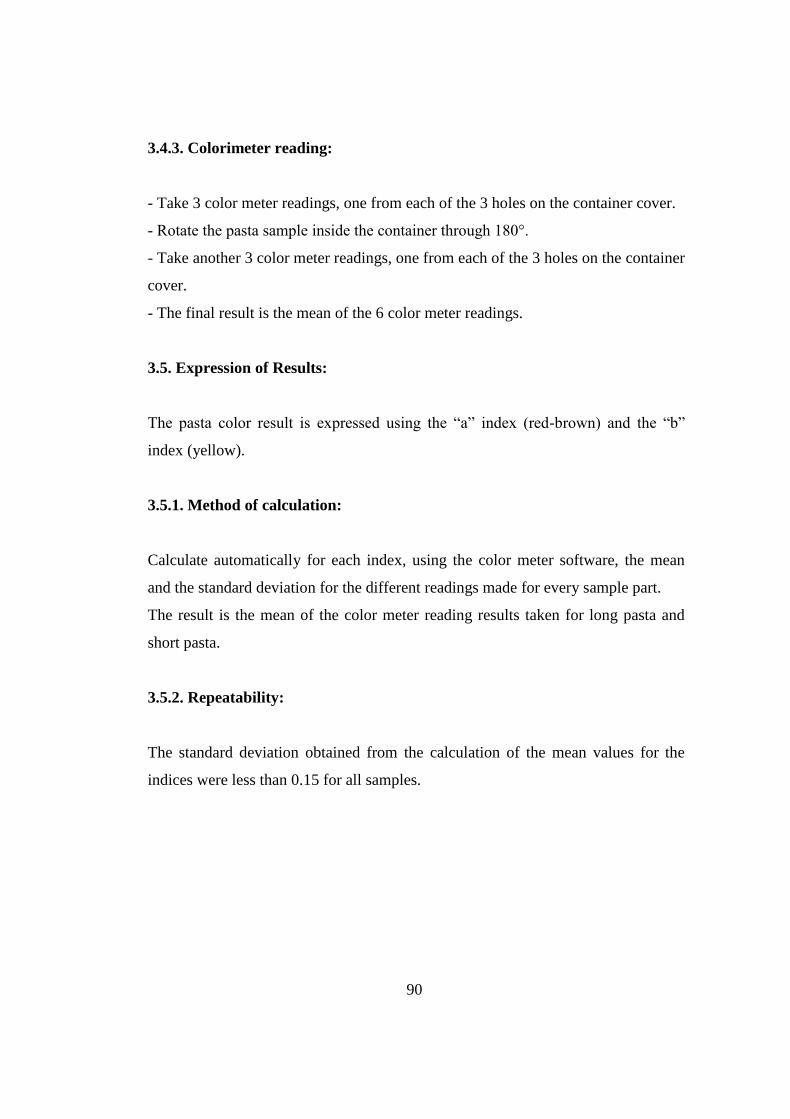
90
3.4.3. Colorimeter reading:
- Take 3 color meter readings, one from each of the 3 holes on the container cover.
- Rotate the pasta sample inside the container through 180°.
- Take another 3 color meter readings, one from each of the 3 holes on the container
cover.
- The final result is the mean of the 6 color meter readings.
3.5. Expression of Results:
The pasta color result is expressed using the “a” index (red-brown) and the “b”
index (yellow).
3.5.1. Method of calculation:
Calculate automatically for each index, using the color meter software, the mean
and the standard deviation for the different readings made for every sample part.
The result is the mean of the color meter reading results taken for long pasta and
short pasta.
3.5.2. Repeatability:
The standard deviation obtained from the calculation of the mean values for the
indices were less than 0.15 for all samples.