Embed Size (px)
Citation preview

CESQA
Application of AWARE for the
quantification of the Water Scarcity
Footprint of a pure Malt Beer produced by
Birra Castello
Manzardo Alessandro1, Enrico Grigolini1, Antonio Scipioni1
1 CESQA, Department of Industrial Engineering, University of Padova

CESQA
Goal and Scope
• The objective of this study is to test the application of the AWARE
method in a real case study and compare the results with other
alternative methods: AWARE 100 +50% EWR, DTA, DTAX. Results
of this analysis will be used in the process of validation of AWARE
• Actual audience targeted is the WULCA group; potentially results will
be made publicly available.
• The system understudy cover the production and distribution of a
pure malt beer produced by Birra Castello SpA, located in the north
east of Italy.
• A cradle to grave approach is adopted
• The functional unit is to provide one 50cl of beer packed with glass
bottle at retail
CESQA
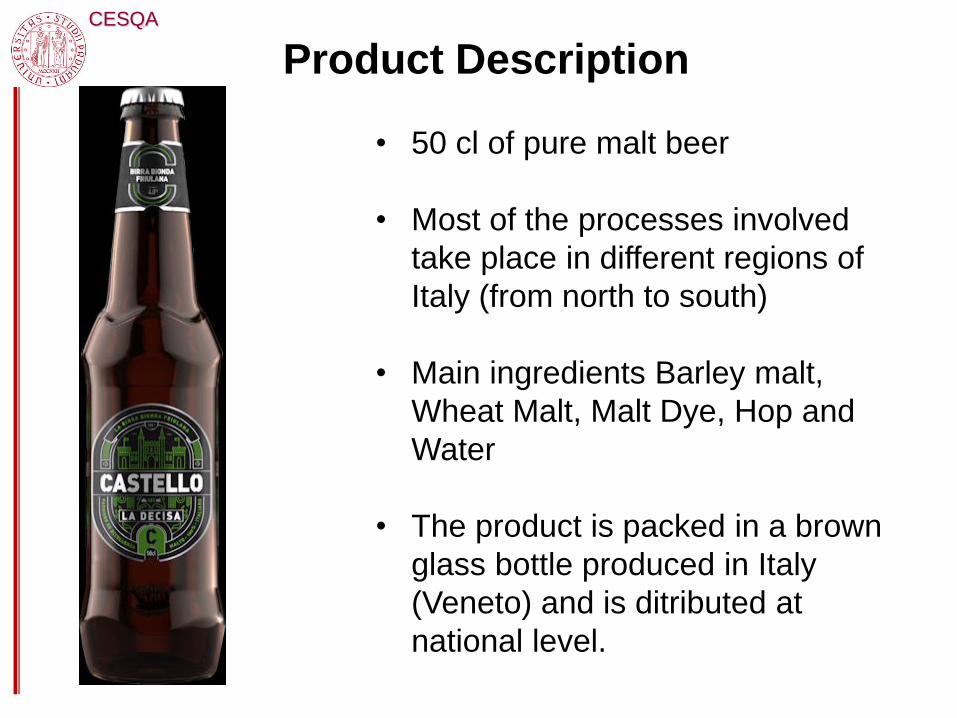
Product Description
• 50 cl of pure malt beer
• Most of the processes involved
take place in different regions of
Italy (from north to south)
• Main ingredients Barley malt,
Wheat Malt, Malt Dye, Hop and
Water
• The product is packed in a brown
glass bottle produced in Italy
(Veneto) and is ditributed at
national level.

CESQA
System Boundaries

CESQA
Inventory DataWater Use Inventory
Life cyce phases DescriptionCharacterization
Factor
Raw materials
Barley Malt, Wheat malt and Malt Dye are mostly rainfedtherefore water use is related to the other agricultural processes (e.g. fertilizer production) and malt processing acquired from database; Hop production water use are primary data acquired on a monthly basis.
Monthlys Local CF, Irri; RER average, Non Irri
Beer Production
Primary data on water use related to water incorporated into beer and other water used for production processes were acquired. Indirect water use from database is used for ancillary material, energy, methane production and distribution.
Local, NonIrri; RER Average, Non Irri; World Avaerage Non Irri
PackagingPrimary data on direct water use were acquired for glass production; Secondary data on other packaging production, energy use etc. are acquired from database.
Local, Non Irri; RER Average, Non Irri; World Average Non Irri
Transportation(Inbound/Primary/Secondary)
Direct and indirect water use are considered from database. World Average Non Irri
UseWater use related to the producction of energy to chill the product at home
Country average, Non Irri
End of life Water used for the treatment of packaging waste from datasetCountry average, Non Irri
Activty data are generally primary data (except EoL and use stage) and refer to 2015

CESQA
Results
Annual AverageAWARE100
[m3]AWARE 100
+50%EWR [m3] DTAx [m3] DTA [m3]
Raw Material 6,38E-02 8,41E-02 3,40E-03 2,13E-03
Packagings 4,56E-03 8,59E-03 2,11E-03 2,49E-03
Productive Process 2,64E-03 6,42E-03 6,46E-04 8,13E-04
Distribution 4,61E-03 1,33E-02 4,02E-04 6,63E-04
Phase of Use 4,47E-03 1,29E-02 3,90E-04 3,69E-04
End Of Life 2,79E-06 8,07E-06 2,44E-07 2,31E-07
Total 8,01E-02 1,25E-01 6,95E-03 6,47E-03
• Results of AWARE 100+50%EWR are 56% higher than AWARE 100
• Absoulte value differences between AWARE different versions and
DTAX,DTA depends also on their different scale

CESQA
Results
• With all of the methods applied, Raw Materials production resulted to be
an hotpsot
• Using DTA and DTAX also Glass production significantly contribute to the
total water scarcity footprint
CESQA
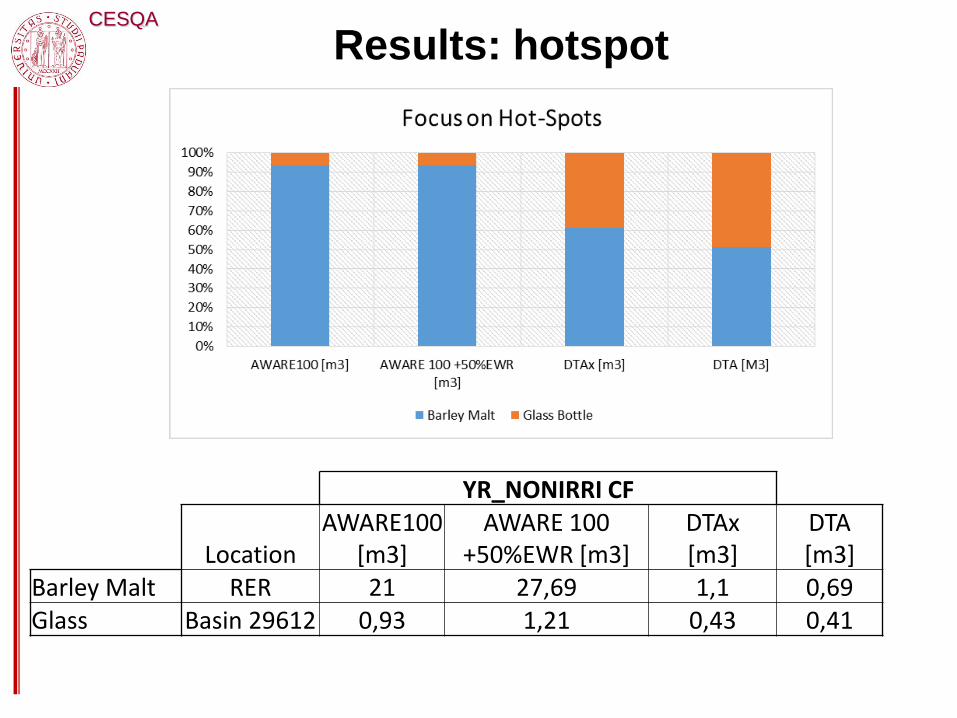
Results: hotspot
YR_NONIRRI CF
LocationAWARE100
[m3]AWARE 100
+50%EWR [m3]DTAx[m3]
DTA [m3]
Barley Malt RER 21 27,69 1,1 0,69Glass Basin 29612 0,93 1,21 0,43 0,41

CESQA
Discussion• Results are mostly influenced by the water used for Barley
Malt production and primary packaging production (Brown
glass bottle)
• AWARE and AWARE + 50%EWR gave consistent results
• AWARE gave different results in terms of hot-spot analysis
when compared to DTA and DTAx.
• Results of the Water Scarcity Footprint are therefore
highly influenced by the method selected.
• The analysis was also performed using monthly data
(where available) and yearly average but no significant
differences (absolute and realtive results) emerged
CESQA
Lessons learned• All of the methods were successfully applied to the same product
• The method presents different geographical and temporal scope that
allows to investigate data acquired with different geographical and
temporal information
• The use of monthly or yearly average values did not influence final
results in this case study
• Results are significantly influenced by accuracy of information on
location of the processes
• Using the different methods proved that the relative level of water
scarcity of different locations may change significantly (Glass bottle vs
Raw Materials)
• AWARE, AWARE+50% EWR can give consistent results

CESQA
Reccomendations
• Considering that AWARE provides CF at different
geographical scale, when performing a Water Footprint
scarcity study it would be important to get specific
information on the geographical location of processes
and raw materials in order to avoid either overestimation
or underestimation of results
• Considering that in this case study AWARE (both
versions) presents different results than DTAx, DTA in
hotspot analysis, it is reccomended to perform sensitivty
analysis with different methods to to test and improve the
robustness of the conclusion

CESQA
Thank you
Via Marzolo, 9 – 35131 Padova
Tel. 049/8275539 Fax 049/8275785
Centro Studi Qualità AmbienteDipartimento di Ingegneria Industriale
Università degli Studi di Padova