Embed Size (px)
Citation preview

Appendix K
Type A Logging Data Analysis: Suggested Methods to Support the OU 7-1 3/14 Comprehensive Remedial
I nvestigatiodfeasi bi I i ty Study
K- I

K-2

Appendix K
Type A Logging Data Analysis: Suggested Methods to Support the OU 7-1 3/14 Comprehensive Remedial
I nvestigatiodfeasi bi I i ty Study
Author: Nicholas Josten at GeoSense
K-I. INTRODUCTION
An in-depth evaluation of analysis methods to estimate various waste properties from existing Type A geophysical logging data was completed. The purpose of this evaluation was to generate more accurate site parameters to be used in contamination release modeling and risk assessment for OU 7-13/14.
K-2. BACKGROUND
The SDA at the RWMC is a low-level radioactive waste burial ground that received waste from INEEL facilities and the U.S. Department of Energy RFP beginning in 1952. In addition to low-level TRU, the SDA received organic waste in the form of sludge-filled drums.
Bechtel BWXT Idaho, LLC, is currently preparing a RVFS for the RWMC SDA. As part of the characterization phase of the remedial investigation, 140 Type A steel probes were installed into the buried waste within the SDA. These probes were then logged using several geophysical tools to detect radioisotopes and chemical constituents above, within, and below the buried waste layer. The geophysical data now need to be evaluated in conjunction with water sampling data, vapor sampling data, moisture measurements, waste inventory information, and general site history to support development of the RI/FS .
This report evaluates analysis methods that will use existing geophysical Type A probe data to estimate the following waste properties: uranium mass within a compact source suitable for conducting a groundwater release study; Np-23 7 mass within a compact source suitable for conducting a groundwater release study; Am-24 1 mass within a compact source suitable for conducting a groundwater release study; Pu-239 mass in the vicinity of probehole P9-20; extent of Th-228, Th-232, Np-237, and Am-241 enrichment within Pits 4 and 10; and the total carbon tetrachloride mass remaining from original 743 sludge. In addition to evaluating analysis methodologies, this work will discuss the feasibility of achieving program objectives should the recommended analysis be pursued in earnest. The OU 7-13/14 Project will use the recommendations and discussion presented herein to guide hture activities aimed at improving the risk assessment basis for the RI/FS.
K-3. ANALYSIS APPROACH
The protocol to be used is a three-tiered analysis. Tier 1 analysis consists of calculating analysis indices and then analyzing these indices to obtain general information about the waste. Tier 2 analysis consists of using the results of Tier 1 analyses together with Monte Carlo modeling to arrive at quantitative estimates of total masses or source terms. Tier 3 analysis consists of using quantitative Tier 2 results as input into vadose zone fate transport modeling.
K-3

K-3.1 Tier 1 Analysis-Analysis Indices
Tier 1 analysis revolves around the calculation and use of analysis indices. We define an analysis index as a semiquantitative interpretation aid focused on a particular analysis question. Tier 1 analysis indices are calculated directly from the logging data and are presented alongside raw log data on chart displays. Analysis indices will indicate regions of interest, enrichments and enhancements of isotopes and elements, and the physical extent of waste bodies. In summary, these indices are intended to identify regions where hrther analysis is appropriate or necessary.
K-3.2 Tier 2 Analysis-Monte Carlo Modeling
Tier 2 analysis consists of using the results of Tier 1 analyses (i.e., analysis indices and isotopic concentrations) together with Monte Carlo modeling to arrive at estimates of total masses or source terms. The analysis index results and standard logging results will be used to estimate the initial source distribution estimate for the Monte Carlo analysis. The results from cluster probeholes also will be incorporated into this estimation. Iterations will be performed until the calculated results best match the logging measurement results and a best estimate of the waste mass dimensions and makeup is obtained.
K-3.3 Tier 3 Analysis-Fate Transport Modeling
For several tasks, the computed source distribution (i.e., second tier analysis results) will be used to determine if existing fate and transport modeling parameters are sufficiently conservative to bound the environmental risks. Third tier analysis covers this final step. While the actual Tier 3 modeling will be performed by INEEL geoscientists, this report discusses the interface between these activities.
K-4. TASK 1: DEPLETED URANIUM SOURCE TERM
Uranium-235 and U-238 are known components of some RFP waste buried at the SDA. Waste inventory records report uranium waste as enriched, depleted, or natural form although the depleted form predominates. Uranium isotopes have the potential to migrate and are considered contaminants of potential concern in the environmental risk assessment for the SDA. The long-term groundwater contamination for uranium depends, at least in part, on uranium release parameters. These release factors describe uranium solubility under the influence of vadose zone moisture conditions and are poorly understood at the SDA. Depleted uranium source-term analysis would involve a study of uranium release into groundwater in order to estimate uranium release parameters. The objective of this task is to develop analysis methodology to accomplish this uranium source-term study.
K-4.1 Description of Proposed Method
The method proposed for this task is to develop Tier 1 indices for identifying areas of U-235 and U-238 contamination and then to use these indices to select a representative area for a U-235 and U-238 source-term study. The ideal location would contain a localized high concentration of U-235 and U-238 supported by logging data from multiple probes. The source-term study will involve Tier 2 Monte Carlo physics code evaluation (MCNP) modeling of the contamination zone with the objective of defining the spatial distribution of uranium and characteristics of the medium. These results would then provide input for Tier 3 analysis directed at improved estimates of uranium release into groundwater. The current task evaluates the scope for the required Tier 1 and Tier 2 analyses.
K-4

K-4.2 Computational Basis for Uranium-235 and Uranium-238 Analysis Indices
Gamma Encrg!. (kcV)
Some RFP waste contains depleted or enriched uranium. Both U-235 and daughters of U-238 emit gamma rays that can be used to identify and quantify the respective uranium isotopes. Major U-235 gamma rays and branching ratios (i.e., intensities) are displayed in Table K-1 (data obtained from the current evaluated nuclear structure data file [ENSDF] database).
Branching Ratio ( " 0 )
Table K-1. Uranium-235 gamma rays and branching ratios from the Evaluated Nuclear Structure Data File database.
Gamma Encrg!. (kcV) Braiicliiiig Ratio (%)
143.8 I 10.96
184.7 258.3
185.7 I 57.2
0.00142 0.00609
205.3 I 5.01
742.8 766.4
Because of its higher intensity and energy, the 185.7-keV gamma ray is usually used for the detection of U-235.
0.067 0.246
Major U-238 gamma rays and branching ratios are displayed in Table K-2 (data obtained from current ENSDF database).
786.3 1.001.0
Table K-2. Uranium-238 gamma rays and branching ratios from the Evaluated Nuclear Structure Data File database.
0.0406 0.701
1,434.1 1.510.2
140.1 I 0.00107
0.00810 0.01077
1,737.7 1.831.3
739.95 I 0.00979
0.0177 0.0144
1,911.2 0.00526
1.193.8 I 0.01 127
a. All U-238 gamma rays are emitted from decay of Pa-234M. This daughter of U-238 will be in secular equilibrium with its parent within several months of the separation of uranium and its daughters. Therefore, secular equilibrium can be assumed for material in the Idaho National Engineering and Environmental Laboratory Subsurface Disposal Area.
Because of its high energy and relatively high branching ratio, the 1,001-keV gamma ray is the preferred gamma ray for measuring the U-23 8 concentration.
K-5

K-4.2.1 Analysis Index 1 .I-Uranium-238 Enhancement
For uranium only, the term enhancement will be used to indicate a uranium concentration above natural environmental soil levels. This definition is provided because the term uranium enrichment has a very specific, historically used meaning, namely a U-235 to U-238 ratio different from the natural ratio. For other isotopes and elements, the term enrichment will indicate concentrations above what would be expected.
In principle, the average environmental soil concentration of U-238 can be obtained from the average intensity of the 1,001-keV gamma ray in regions above and below the waste layer. However, review of the available gamma-ray spectra obtained from logging of probeholes indicates that the count time is not sufficiently long to see the 1,001-keV gamma ray. The detection limit for U-238 is approximately 10 pCi/g, a value that is well above the expected environmental level. Therefore, either (1) much longer count times must be used for background quantification purposes or (2) a value for the average environmental intensity of this gamma ray must be assumed. For practical purposes, we will use the measured intensity of the 1,001-keV gamma ray for our analysis index and define Analysis Index 1.1 as follows:
Analysis Index 1.1 = measured U-238 concentration
= intensity of 1,OO 1 -keV gamma ray.
A value for Analysis Index 1.1 statistically >O will indicate that there is enhanced U-238 at this location. Without using additional information, however, nothing can be said about the uranium enrichment, i.e., whether the enhancement is caused by natural, depleted, or enriched uranium.
K-4.2.2 Analysis Index 1.2-Uranium-235 Enhancement
Just as for U-238, normal background concentrations of U-235 are well below the detection limit of the Type A logging data (-0.5 pCi/g). For practical reasons, we choose to use the measured intensity of the 185.7-keV gamma ray for our analysis index and define Analysis Index 1.2 as follows:
Analysis Index 1.2 = measured U-235 concentration
= intensity of 185.7-keV gamma ray.
A value for Analysis Index 1.2 statistically >O will indicate that there is enhanced U-235 at this location. However, without using additional information, nothing can be said about the uranium enrichment. For example, a ratio statistically >O could indicate the presence of enriched uranium or a large amount of natural uranium. Also, enriched uranium located behind waste that contains no uranium could give a value for Analysis Index go, and even a large amount of natural uranium in a similar location could give a value go. In both cases, the value for Analysis Index 1.1 would probably be >O.
K-4.2.3 Analysis Index 1.3-Uranium Enrichment
Since it is possible for the waste to contain depleted uranium, natural uranium, or enriched uranium, it would be usehl to have an analysis index to indicate the apparent uranium enrichment condition at any point of measurement. Again, if the count times would be sufficiently long, we could obtain the ratio of the average 185.7-keV gamma-ray intensity to the average 1,001-keV gamma-ray intensity in background regions and compare this value with ratios obtained in waste regions. Analysis
K-6

Index 1.3 would then be the ratio of the ratio of the intensities in the waste region to the ratio of the average environmental intensities:
(185.7-keV/l,OOl-keV intensity),,,,,/( 185.7-keV/1,001-keV intensity)envlronment.
Alternatively, the activity ratios could be used in the definition of the analysis index:
(U-235 activity/U-23 8 activity),,,,,/(U-235 activity/U-23 8 aCtivity),nvlronm,nt.
The U-235 and U-238 ratio is known for naturally occurring uranium, so the ratio of the natural activities can be calculated from the half-lives of the two isotopes. The calculated value is 0.04604. The latter definition, with the natural or environmental ratio (U-325 activity and U-23 8 activity),nvlronm,nt being calculated from the natural isotopic abundances and known half-lives, will be used for Analysis Index 1.3:
Analysis Index 1.3 = (U-235 activity and U-238 activity),,,,,/(U-235 activity/U-238 aCtivitY)envlronment
= (U-235 activity/U-23 8 activity),,,,,/0.04604.
In principle, Analysis Index 1.3 should indicate the uranium enrichment, i.e., whether the uranium observed is depleted, natural, or enriched. However, this is a more difficult analysis index to interpret than the analysis index to indicate the presence of enhanced uranium concentrations (indicated by Analysis Indices 1.1 and 1.2). If Analysis Index 1.1 > 1 or Analysis Index 1.2 > 1, this is a definite indication of the presence of concentrations of U-238 or U-235 above the environmental level. However, if Analysis Index 1.3 > 1, this could indicate either enriched uranium or a large amount of natural uranium dispersed close to the probehole. Similarly, if Analysis Index 1.3 < 1, this could indicate either depleted uranium, or natural or enriched uranium located behind a mass of waste that does not contain uranium. Analysis Index 1.3, therefore, must be used in conjunction with other information.
K-4.2.4 Analysis Index 1.4-Location of Uranium-238
Where the U-23 8 gamma rays are of sufficient intensity, differential attenuation of the gamma rays can be used to determine the average effective material thickness through which the gamma rays have passed. Analysis Index 1.4 is defined to be the ratio of this thickness to the average environmental soil thickness for U-238 gamma rays:
Analysis Index 1.4 =thickness from U-238 gamma rays and average environmental soil thickness.
Here, the average environmental soil thickness is defined as the soil thickness determined from differential attenuation of the gamma rays from a uniform distribution of natural uranium in normal SDA soil. Since the average environmental thickness cannot be determined from the existing measurements (much longer measurements are required), it must be calculated using the probe’s calibration equation data.
Analysis Index 1.4 can give us some information as to the location of the U-238, i.e., whether it is close to or far from the probehole. An index statistically <1 would indicate U-238 close to the probehole. An index statistically > 1 could indicate U-23 8 far from the probehole or a concentrated mass of uranium in which self-shielding accounts for a major fraction of the differential attenuation. Experience will help establish rules for the joint use of indices 1.3 and 1.4 to interpret in situ enrichment conditions.
K-7

K-4.3 Media Indices
Characteristics of the media surrounding a probehole can have profound influence over measured logging data values. Large changes in measured gamma radiation can be caused by anomalies in the soil or waste media, such as the presence of voids or neutron-absorbing compounds. Accordingly, media effects represent a significant source of ambiguity in the analysis of Type A logging data at the SDA, particularly where quantitative results are sought. The Tier 2 approach for uranium mass estimation requires that media properties be supplied. We propose a set of analysis indices specifically directed toward understanding media characteristics and estimating media properties. A complete discussion of media indices is presented under Task 4 below.
K-4.4 Estimating the Uranium Source Term
In order to determine the uranium source term, we must know the spatial distribution of the uranium. To accomplish this, we propose construction of a Tier 2 MCNP model encompassing the volume surrounding the selected probehole. In the general MCNP modeling scheme, the total model volume is subdivided into elemental volumes. Each element is assigned nuclear source and transport parameters based on the interpreted character of the model area (i.e., the probehole vicinity). The MCNP model run then simulates the gamma-ray flux that would be created within the theoretical model volume. The validity of the model is evaluated by comparing the simulated gamma-ray flux with the measured gamma-ray flux from logging data.
Initial estimates must be provided for media characteristics and the sizes and locations of the uranium bodies. These estimates will be developed through Tier 1 analysis. Information gained from active and passive spectral log data, azimuthal log data, and analysis indices will provide the basis for the initial model. It is very important that all available data and information be used because the more accurate the initial input for the Tier 2 analysis, the faster the method will converge.
At the end of each model iteration, the results will be reviewed and revised and a more accurate estimate of the uranium distribution will be developed. Then another iteration will be initiated. Iterations will continue until either the results adequately match the measurements, or no hrther improvements are made.
K-4.5 Principal Tasks and Subtasks
The objective of this task is to estimate the uranium mass in the vicinity of a selected probehole. The following subtasks are proposed in order to hlly develop and use the uranium analysis indices and Tier 2 analysis to arrive at the uranium source term at any location of interest (see Table K-3).
Table K-3. Principal tasks and subtasks for depleted uranium. Subtask Number
1
2
3
Raw spectral analysisa-automated, semiautomated, and manual spectrum analysis to determine peak heights for all gamma rays of interest and all Type A probes
Develop media analysis indicesb- develop specific algorithms, incorporate uncertainty analysis, implement as database function, and develop presentation method
Test and refine uranium analysis index definitions-develop specific algorithms, incorporate uncertainty analysis,
PC-GAP programmer Batch processing programmer Database programmer Senior nuclear measurements analyst Staff nuclear measurements analyst
Senior nuclear measurements analyst Staff nuclear measurements analyst Database programmer Geophysics analyst
Senior nuclear measurements analyst Staff nuclear measurements analyst Database programmer
Estimated Labor Hours
40 40 40 40
300
16 32 8
40
4 16 4
K-8

implement as database function, and develop presentation method
Senior nuclear measurements analyst Geophysics analyst
Geophysics analyst 4
5
7
6
Prepare report Senior nuclear measurements analyst 10 Geophysics analyst 20 Staffsupport 20
Analyze and interpret all probe data for uranium-identify locations of uranium enrichment, select location that appears to be the one for which the best estimate of initial uranium source distribution can be developed and develop source distribution for initial Tier 2 analysis input
Monte Carlo physics code evaluation setup'-develop model geometry for multiple probeholes and logging tools; develop outline of basic computational process; test with logging data
Tier 2 uranium analysisd
Senior nuclear measurements analyst Geophysics analyst Monte Carlo physics code evaluation modeler
Senior nuclear measurements analyst Geophysics analyst Monte Carlo physics code evaluation modeler
16 40
16 24 160
16 24 80
K-4.6 S pec i a I Perform e r Qu a I if i cat i o ns
Staff nuclear measurements analyst for Subtask 1 is preferably a staff or mid-level professional working under the direction of a senior analyst. The primary activities will be quality control for automated peak height analysis as well as some semiautomatic and manual peak height analysis.
Senior nuclear measurement analyst must have extensive experience in measuring, analyzing, and interpreting gamma-ray spectra. In addition, this person must have a working knowledge of RFP waste that has been buried at the SDA, extensive experience in field gamma-ray measurements (especially in- field measurements, including well logging), extensive experience with both passive gamma-ray measurements and active interrogation using neutrons, a working knowledge of gamma-ray metrology, and extensive knowledge of TRU, actinides, and naturally occurring isotopes.
An INEEL computer programmer with working knowledge of the INEEL spectral analysis computer program called PC-GAP will be needed to implement automated spectral analysis.
Nuclear measurements and geophysics analysts for Subtasks 2, 3 , and 4 will preferably have experience with SDA Type A probe data.
The MCNP modeler must have extensive experience using MCNP to model geometries similar to waste drums and probeholes.
K-4.7 Technical Benefits and Risks
The primary benefit of the proposed index-based analysis method is that it provides for the succinct display and review of all the logging information that is relevant to recognizing uranium concentrations and locations. This approach will support rapid evaluation of all relevant logging data and will preserve (and emphasize) statistical uncertainty considerations. These characteristics of the proposed analysis
K-9

method are well suited for forming general, qualitative conclusions regarding the uranium distribution and developing the most accurate initial input model for Tier 2 analysis. A detailed, accurate uranium input distribution will help ensure that the Tier 2 analysis will converge and provide the uranium source term with the best possible accuracy. The uranium source term provided by the Tier 2 analysis will be usehl as input for Tier 3 analysis.
One primary risk with the proposed approach is that the Tier 2 analysis might not converge. Nonconvergence could result if the MCNP model structure is insufficiently detailed to accommodate the actual conditions in the vicinity of the probehole. Nonconvergence also might occur because of the slowness of the MCNP calculation process, which might make it difficult to accomplish an adequate number of iterations in a reasonable amount of time. The problem of nonconvergence increases with increasing amounts of control data, i.e., the number and quality of logging measurements to be fitted. Potential nonconvergence will be a more significant problem if cluster probeholes are chosen for the uranium source-term analysis.
Nonuniqueness is a second risk of the proposed approach. This MCNP application requires that the source location, shape, and concentration as well as matrix characteristics be determined simultaneously. In some cases, these parameters may be indistinguishable from each other so that the final result contains hndamental ambiguity. Multiple models may satisfy the existing logging data with equal accuracy. The problem of nonuniqueness decreases with increasing amount of control. Nonuniqueness will be a more significant problem if a single probehole is chosen for uranium source-term analysis.
The final objective of uranium source-term analysis is to improve our understanding of the mechanism by which uranium is released from waste into groundwater. The release mechanism is the subject of Tier 3 analysis, which simulates the action of vadose zone moisture on the uranium body estimated by Tier 2 MCNP modeling. The Tier 3 analysis has many uncertainties of its own, and achievement of the final objective depends in large part on the success of the Tier 3 work regardless of the quality and accuracy of the uranium source-term model.
Finally, any conclusions regarding uranium release will be susceptible to the argument that the chosen study area is not representative of the SDA as a whole. This argument is difficult to ignore. Source-term analysis and release studies could be conducted at multiple locations to attempt to attain a statistical treatment of uranium release.
K-5. TASK 2: NEPTUNIUM-237 SOURCE TERM
Weapons grade plutonium, which was produced, processed, and ultimately shipped as waste from RFP to the INEEL, decays to produce predictable mixtures of Am-241, Np-237, and Pu-239. Neptunium-237 has the potential to migrate and is a contaminant of potential concern for the environmental risk assessment for the SDA. Current risk assessments for Np-237 are based on the assumption that Np-237 in INEEL waste has been produced solely from the decay of Pu-239 (this assumption is examined in Task 5 of this report). The long-term groundwater contamination risk because of Np-237 also depends on neptunium release parameters. These release factors describe Np-237 solubility under the influence of vadose zone moisture conditions and are poorly understood at the SDA. Neptunium-237 source-term analysis would involve an in situ study of Np-237 release in order to estimate neptunium release parameters. The objective of this task is to develop analysis methodology to accomplish the Np-237 source-term study.
K-10

K-5.1 Description of Proposed Method
The method proposed for this task is to use the Tier 1 index approach discussed in Task 5 for evaluating Type A probe data and selecting a representative Np-237 contamination area for a source-term study. The source-term study will involve quantitative Tier 2 analysis of Type A logging data aimed at determining the spatial concentration and distribution of Np-23 7 contamination and characteristics of the surrounding media. These results provide input for Tier 3 analysis directed at improved estimates of Np-237 release. The current task is limited to outlining scope for the required Tier 2 analysis.
K-5.2 Media Indices
Characteristics of the media surrounding a probehole can have profound influence over measured logging data values. Large changes in measured gamma radiation can be caused by anomalies in the soil and waste media, such as the presence of voids or neutron-absorbing compounds. Accordingly, media effects represent a significant source of ambiguity in the analysis of Type A logging data at the SDA, particularly where quantitative results are sought. The Tier 2 approach for Np-237 mass estimation requires that media properties be supplied. We propose a set of analysis indices specifically directed toward understanding media characteristics and estimating media properties. A complete discussion of media indices is presented under Task 4 below.
K-5.3 Estimating the Neptunium-237 Source Term
In order to determine the Np-237 source term, we must first identify a location of Np-237 enrichment and then determine the spatial distribution of the Np-237, i.e., the Np-237 concentrations and the sizes and locations of the Np-237 bodies. The variation in the Np-237 concentrations with depth together with the information gained from our analysis indices, the results from azimuthal logs, and the results from any probehole clusters will be used to estimate the sizes and locations of the Np-237 masses. Included will be a correlation of all ancillary data (e.g., americium data and media information derived from elemental data obtained from active and passive probes together with inferred waste form information) to assist in providing the best input for Tier 2 analysis. It is very important that all available data and information be used because the more accurate the initial input for the Tier 2 analysis, the faster the method will converge.
All of this information will be used to provide an initial input for Tier 2 (Monte Carlo) analysis. This may be a difficult task, depending on the amount of data and information available for a given location-the more data and information, the more accurate the initial input uranium distribution for the Tier 2 analysis. This will require Monte Carlo modeling and iteration. At the end of each iteration, the results will be reviewed and revised and a more accurate estimate of the Np-237 distribution will be developed. Then another iteration will be initiated. Iterations will continue until either the results adequately match the measurements or no hrther improvements are made.
K-5.4 Principal Tasks and Subtasks
The objective of this task is to estimate theNp-237 mass in the vicinity of a selected probehole. The following subtasks are proposed in order to hl ly use the Np-237 analysis indices and perform Tier 2 analysis to arrive at the Np-237 source term at any location of interest (see Table K-4).
K-1 I

Table K-4. Principal tasks and subtasks for neptunium-237 Subtask Number
1
2
3
4
5
6
7
Raw spectral analysisa-automated, semiautomated, and manual spectrum analysis to determine peak heights for all gamma rays of interest and all Type A probes
Develop media analysis indicesb- develop specific algorithms, incorporate uncertainty analysis, implement as database function, and develop presentation method
Test and refine Np-237 analysis index definitions and analyze and interpret all probe data for neptunium enrichment'- develop specific algorithms, incorporate uncertainty analysis, implement as database function, and develop presentation method
Review all Np-237 analysis index data developed in Subtask 3 above or Subtask 3 of Task 5 and identify locations of Np-237 enrichment-review media data for these locations, select location that appears to be the one for which the best estimate of initial Np-237 source distribution can be developed, and develop source distribution for initial Tier 2 analysis input
Monte Carlo physics code evaluation setupd-develop model geometry for multiple probeholes and logging tools, develop outline of basic computational process, and test with logging data
Tier 2 analysis'
Prepare report
PC-GAP programmer Batch processing programmer Database programmer Senior nuclear measurements analyst Staff nuclear measurements analyst
Senior nuclear measurements analyst Staff nuclear measurements analyst Database programmer Geophysics analyst
Senior nuclear measurements analyst Staff nuclear measurements analyst Database programmer Geophysics analyst
Senior nuclear measurements analyst Geophysics analyst
Senior nuclear measurements analyst Geophysics analyst Monte Carlo physics code evaluation modeler
Senior nuclear measurements analyst Geophysics analyst Monte Carlo physics code evaluation modeler
Senior nuclear measurements analyst Geophysics analyst Staffsuuuort I 1
Eshmated Labor Hours
40 40 40 40
300
16 32 8
40
4 16 4 4
16 40
16 24 160
16 24 80
10 20 20
rsk is performed one time to meet all but specialized future analysis requirements. This subtask will require significant lead time. b. This effort to develop elemental analysis indices is required only once to support all Tier 1 and Tier 2 analyses for any task. c. This subtask is required only if Task 5 is not performed. d. This consists of initial setup of the Monte Carlo physics code evaluation model and is a top-level prerequisite for all Tier analyses. It is required only once. Once developed, this model can be used for Tier 2 analysis for any task. e.t is assumed that four iterations will be required for the estimated hours for Subtask 6.
K-5.5 S pec i a I Perform e r Q u a I if i c at i o n s
Staff nuclear measurements analyst for Subtask 1 is preferably a staff or mid-level professional working under the direction of a senior analyst. The primary activities will be quality control for automated peak height analysis as well as some semiautomatic and manual peak height analysis.
Senior nuclear measurement analyst must have extensive experience in measuring, analyzing, and interpreting gamma-ray spectra. In addition, this person must have a working knowledge of RFP waste that has been buried at the SDA, extensive experience in field gamma-ray measurements (especially in-
K-12

field measurements, including well logging), extensive experience with both passive gamma-ray measurements and active interrogation using neutrons, a working knowledge of gamma-ray metrology, and extensive knowledge of TRU, actinides, and naturally occurring isotopes.
An INEEL computer programmer with working knowledge of the INEEL spectral analysis computer program called PC-GAP will be needed to implement automated spectral analysis.
Nuclear measurements and geophysics analysts for Subtasks 2, 3, and 4 will preferably have experience with SDA Type A probe data.
The MCNP modeler must have extensive experience using MCNP to model geometries similar to waste drums and probeholes.
K-5.6 Technical Benefits and Risks
The primary benefit of the proposed index-based analysis method is that it provides for the succinct display and review of all the logging information that is relevant to recognizing Np-237 concentrations and locations. This approach will support rapid evaluation of all relevant logging data and will preserve (and emphasize) statistical uncertainty considerations. These characteristics of the proposed analysis method are well suited for forming general, qualitative conclusions regarding the Np-23 7 distribution and developing the most accurate initial input model for Tier 2 analysis. A detailed, accurate Np-237 input distribution will help ensure that the Tier 2 analysis will converge and provide the Np-237 source term with the best possible accuracy. The Np-237 source term provided by the Tier 2 analysis will be usehl as input for Tier 3 analysis.
One primary risk with the proposed approach is that the Tier 2 analysis might not converge. Nonconvergence could result if the MCNP model structure is insufficiently detailed to accommodate the actual conditions in the vicinity of the probehole. Nonconvergence also might occur because of the slowness of the MCNP calculation process, which might make it difficult to accomplish an adequate number of iterations in a reasonable amount of time. The problem of nonconvergence increases with increasing amounts of control data, i.e., the number and quality of logging measurements to be fitted. Potential nonconvergence will be a more significant problem if cluster probeholes are chosen for the uranium source-term analysis.
Nonuniqueness is a second risk of the proposed approach. This MCNP application requires that the source location, shape, and concentration as well as matrix characteristics be determined simultaneously. In some cases, these parameters may be indistinguishable from each other so that the final result contains hndamental ambiguity. Multiple models may satisfy the existing logging data with equal accuracy. The problem of nonuniqueness decreases with increasing amount of control. Nonuniqueness will be a more significant problem if a single probehole is chosen for Np-237 source-term analysis.
The final objective of Np-237 source-term analysis is to improve our understanding of the mechanism by which Np-237 is released from waste. The release mechanism is the subject of Tier 3 analysis, which simulates the action of vadose zone moisture on the Np-237 body estimated by Tier 2 MCNP modeling. The Tier 3 analysis has many uncertainties of its own, and achievement of the final objective depends in large part on the success of the Tier 3 work, regardless of the quality and accuracy of the Np-237 source-term model.
Finally, any conclusions regarding Np-237 release will be susceptible to the argument that the chosen study area is not representative of the SDA as a whole. This argument is difficult to ignore.
K-13

Source-term analysis and release studies could be conducted at multiple locations to attempt to attain a statistical treatment of Np-237 release.
K-6. TASK 3: AMERICIUM-241 SOURCE TERM
Weapons grade plutonium, which was produced, processed, and ultimately shipped as waste from RFP to the INEEL, decays to produce predictable mixtures of Am-241, Np-237, and Pu-239. Americium- 24 1 has the potential to migrate and is a contaminant of potential concern in the environmental risk assessment for the SDA. Current risk assessments for Am-24 1 are based on the assumption that Am-24 1 in INEEL waste has been produced solely from the decay of Pu-239 (this assumption is examined in Task 5 of this report). The long-term groundwater contamination risk because of Am-24 1 also depends on americium release parameters. These release factors describe Am-24 1 solubility under the influence of vadose zone moisture conditions and are poorly understood as the SDA. Americium-24 1 source-term analysis would involve an in situ study of Am-24 1 release in order to estimate americium release parameters. The objective of this task is to develop analysis methodology to accomplish the Am-241 source-term study.
K-6.1 Description of Proposed Method
The method proposed for this task is to use the Tier 1 index approach discussed in Task 5 for evaluating Type A probe data and selecting a representative Am-24 1 contamination area for a source-term study. The source-term study will involve quantitative Tier 2 analysis of Type A logging data aimed at determining the spatial concentration and distribution of Am-24 1 contamination and characteristics of the surrounding media. These results provide input for Tier 3 analysis directed at improved estimates of Am-241 release. The current task is limited to outlining scope for the required Tier 2 analysis.
K-6.2 Media Indices
Characteristics of the media surrounding a probehole can have profound influence over measured logging data values. Large changes in measured gamma radiation can be caused by anomalies in the soil and waste media, such as the presence of voids or neutron-absorbing compounds. Accordingly, media effects represent a significant source of ambiguity in the analysis of Type A logging data at the SDA, particularly where quantitative results are sought. The Tier 2 approach for Am-24 1 mass estimation requires that media properties be supplied. We propose a set of analysis indices specifically directed toward understanding media characteristics and estimating media properties. A complete discussion of media indices is presented under Task 4.
K-6.3 Estimating the Americium-241 Source Term
In order to determine the Am-24 1 source term, we must first identify a suitable location of Am-24 1 enrichment and then determine the spatial distribution of the Am-241, i.e., the Am-241 concentrations and the sizes and locations of the Am-24 1 bodies. The variation in the Am-24 1 concentrations with depth together with the information gained from our analysis indices, the results from azimuthal logs, and the results from any probehole clusters will be used to estimate the sizes and locations of the Am-24 1 masses. Included will be a correlation of all ancillary data (e.g., Plutonium data and elemental data from active and passive probes together with inferred waste form information) to assist in providing the best input for Tier 2 analysis. It is very important that all available data and information be used because the more accurate the initial input for the Tier 2 analysis, the faster the method will converge.
K-14

All of this information will be used to provide an initial input for Tier 2 (Monte Carlo) analysis. This may be a difficult task, depending on the amount of data and information available for a given location-the more data and information, the more accurate the initial input uranium distribution for the Tier 2 analysis. This will require Monte Carlo modeling and iteration. At the end of each iteration, the results will be reviewed, a revised (and hopehlly more accurate) estimate of the Am-24 1 distribution will be developed, and another iteration will be initiated. Iterations will continue until either the results adequately match the measurements or no hrther improvements are made.
K-6.4 Principal Tasks and Subtasks
The objective of this task is to estimate the Am-241 mass in the vicinity of a selected probehole. The following subtasks are proposed in order to hlly develop and use the Am-24 1 analysis indices and Tier 2 analysis to arrive at the Am-241 source term at any location of interest (see Table K-5).
Table K-5. Principal tasks and subtasks for americium-24 1 Subtask
No
1
2
3
4
5
6
7
Raw spectral analysisa-automated, semiautomated, and manual spectrum analysis to determine peak heights for all gamma rays of interest and all Type A probes
Develop media analysis indicesb- develop specific algorithms, incorporate uncertainty analysis, implement as database function, and develop presentation method
Test and refine Am-241 analysis index definitions and analyze and interpret all probe data for americium enrichment'- develop specific algorithms, incorporate uncertainty analysis, implement as database function, and develop presentation method
Review all Am-241 analysis index data developed in Subtask 3 above or Subtask 3 of Task 5 and identify locations of Am- 241 enrichment-review media data for these locations, select location that appears to be the one for which the best estimate of initial Am-241 source distribution can be developed, and develop source distribution for initial Tier 2 analysis input
Monte Carlo physics code evaluation setupd-develop model geometry for multiple probeholes and logging tools, develop outline of basic computational process, and test with logging data
Tier 2 analysis'
Prepare report
PC-GAP programmer Batch processing programmer Database programmer Senior nuclear measurements analyst Staff nuclear measurements analyst
Senior nuclear measurements analyst Staff nuclear measurements analyst Database programmer Geophysics analyst
Senior nuclear measurements analyst Staff nuclear measurements analyst Database programmer Geophysics analyst
Senior nuclear measurements analyst Geophysics analyst
Senior nuclear measurements analyst Geophysics analyst Monte Carlo physics code evaluation modeler
Senior nuclear measurements analyst Geophysics analyst Monte Carlo physics code evaluation modeler
Senior nuclear measurements analyst Geophysics analyst Staffsuuuort
Eshmated Labor Hours
40 40 40 40
300
16 32 8
40
4 16 4 4
16 40
16 24 160
16 24 80
10 20 20
K-15

a. Subtask 1 constitutes a top-level prerequisite for all the analysis methods proposed in this report. This subtask is performed one time to meet all but specialized future analysis requirements. This subtask will require significant lead time. b. This effort to develop elemental analysis indices is required only once to support all Tier 1 and Tier 2 analyses for any task. c. This subtask is required only if Task 5 is not performed. d. This consists of initial setup of the Monte Carlo physics code evaluation model and is a top-level prerequisite for all Tier 2 analyses. It is required only once. Once developed, this model can be used for Tier 2 analysis for any task. e. It is assumed that four iterations will be required for the estimated hours for Subtask 6 .
K-6.5 S pec i a I Perform e r Q u a I if i c at i o n s
Staff nuclear measurements analyst for Subtask 1 is preferably a staff or mid-level professional working under the direction of a senior analyst. The primary activities will be quality control for automated peak height analysis as well as some semiautomatic and manual peak height analysis.
Senior nuclear measurement analyst must have extensive experience in measuring, analyzing, and interpreting gamma-ray spectra. In addition, this person must have a working knowledge of RFP waste that has been buried at the SDA, extensive experience in field gamma-ray measurements (especially in-field measurements, including well logging), extensive experience with both passive gamma-ray measurements and active interrogation using neutrons, a working knowledge of gamma-ray metrology, and extensive knowledge of TRU, actinides, and naturally occurring isotopes.
An INEEL computer programmer with working knowledge of the INEEL spectral analysis computer program called PC-GAP will be needed to implement automated spectral analysis.
Nuclear measurements and geophysics analysts for Subtasks 2, 3 , and 4 will preferably have experience with SDA Type A probe data.
The MCNP modeler must have extensive experience using MCNP to model geometries similar to waste drums and probeholes.
K-6.6 Technical Benefits and Risks
The primary benefit of the proposed index-based analysis method is that it provides for the succinct display and review of all the logging information that is relevant to recognizing Am-24 1 concentrations and locations. This approach will support rapid evaluation of all relevant logging data and will preserve (and emphasize) statistical uncertainty considerations. These characteristics of the proposed analysis method are well suited for forming general, qualitative conclusions regarding the Am-24 1 distribution and developing the most accurate initial input model for Tier 2 analysis. A detailed, accurate Am-24 1 input distribution will help ensure that the Tier 2 analysis will converge and provide the Am-24 1 source term with the best possible accuracy. The Am-24 1 source term provided by the Tier 2 analysis will be usehl as input for Tier 3 analysis.
One primary risk with the proposed approach is that the Tier 2 analysis might not converge. Nonconvergence could result if the MCNP model structure is insufficiently detailed to accommodate the actual conditions in the vicinity of the probehole. Nonconvergence also might occur because of the slowness of the MCNP calculation process, which might make it difficult to accomplish an adequate number of iterations in a reasonable amount of time. The problem of nonconvergence increases with increasing amounts of control data, i.e., the number and quality of logging measurements to be fitted. Potential nonconvergence will be a more significant problem if cluster probeholes are chosen for the uranium source-term analysis.
K-16

Nonuniqueness is a second risk of the proposed approach. This MCNP application requires that the source location, shape, and concentration as well as matrix characteristics be determined simultaneously. In some cases, these parameters may be indistinguishable from each other so that the final result contains hndamental ambiguity. Multiple models may satisfy the existing logging data with equal accuracy. The problem of nonuniqueness decreases with increasing amount of control. Nonuniqueness will be a more significant problem if a single probehole is chosen for Am-24 1 source-term analysis.
The final objective of Am-24 1 source-term analysis is to improve our understanding of the mechanism by which Am-241 is released from waste. The release mechanism is the subject of Tier 3 analysis, which simulates the action of vadose zone moisture on the Am-24 1 body estimated by Tier 2 MCNP modeling. The Tier 3 analysis has many uncertainties of its own, and achievement of the final objective depends in large part on the success of the Tier 3 work, regardless of the quality and accuracy of the Am-24 1 source-term model.
Finally, any conclusions regarding Am-24 1 release will be susceptible to the argument that the chosen study area is not representative of the SDA as a whole. This argument is difficult to ignore. Source-term analysis and release studies could be conducted at multiple locations to attempt to attain a statistical treatment of Am-24 1 release.
K-7. TASK 4: PLUTONIUM-239 SOURCE TERM (P9-20)
Weapons grade plutonium, which was produced, processed, and ultimately shipped as waste from RFP to the INEEL. Plutonium-239 gamma rays were detected in 100 of the 136 Type A probes logged at the SDA. The maximum measured apparent Pu-239 concentration was 194,000 nCi/g in Probehole P9-20R. The actual Pu-239 mass near P9-20R is indeterminate and, depending on the assumed distribution and volume, can vary from gram to kilogram quantities. Since kilogram quantities of Pu-239 could present critical mass conditions, additional probes were installed in the vicinity of P9-20R to hrther constrain the Pu-239 distribution. The objective of this task is to develop quantitative methods to estimate the Pu-239 mass near P9-20R, so that criticality risks may be objectively assessed. These methods also will be applicable for determining the plutonium source term for other locations of interest in the SDA.
K-7.1 Description of Proposed Method
The method proposed for this task is to develop a 3-D Monte Carlo model of the region surrounding P9-20R and to vary the Pu-239 distribution and media characteristics within the model region in order to satisfy logging data. Tier 1 indices will be used to guide construction of the initial model, i.e., an initial plutonium distribution and the initial media characteristics.
K-7.2 Computational Basis for Plutonium-239 Analysis Indices
The plutonium concentration will be obtained from the intensity of the gamma rays emitted by the decay of Pu-239. Of particular importance is the 413.7-keV gamma ray. Major Pu-239 gamma rays and their associated branching ratios (i.e., intensities) are displayed in Table K-6 (data obtained from the current ENSDF database).
K-17
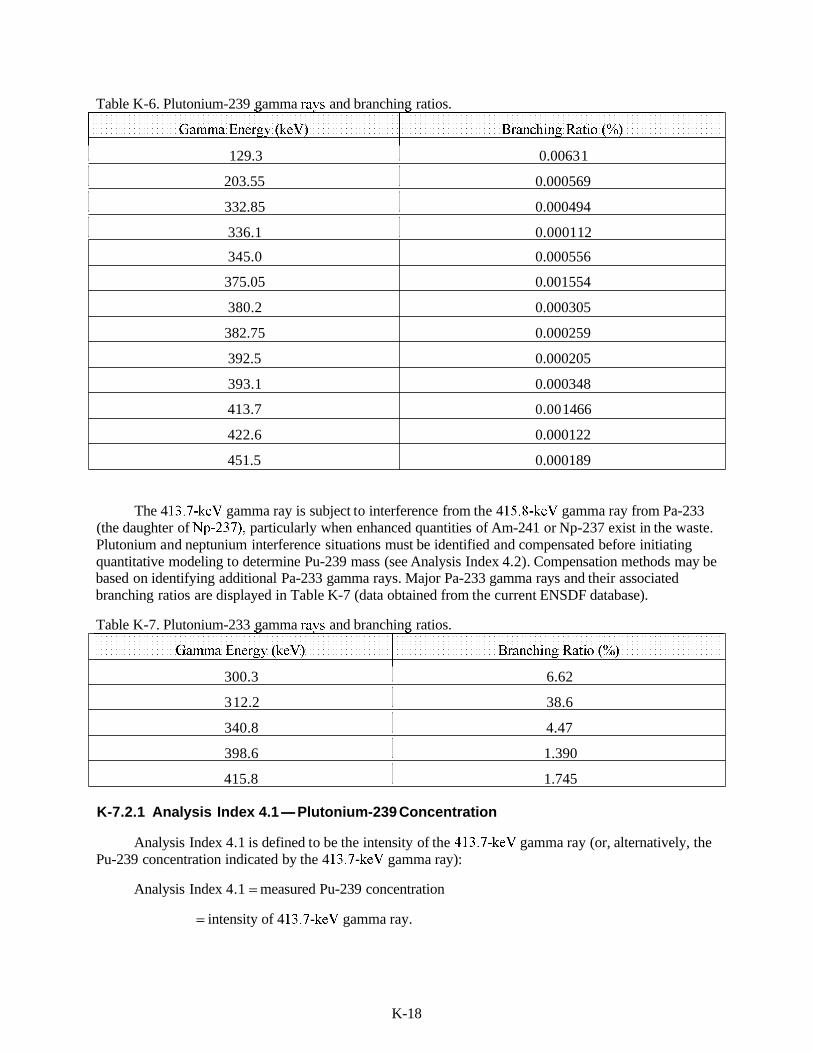
Table K-6. Plutonium-239 gamma raw and branching ratios.
Gamma Encrg!. (kcV) Branching Ratio ( " 0 )
I 129.3 I 0.0063 1
345.0
375.05
380.2
382.75
392.5
393.1
413.7
422.6
451.5
I 203.55 I 0.000569
0.000556
0.001554
0.000305
0.000259
0.000205
0.000348
0.00 1466
0.000122
0.000189
I 332.85 I 0.000494
Gamma Encrg!. (kcV)
I 336.1 I 0.0001 12
Branching Ratio ( " 0 )
The 4 13.7-keV gamma ray is subject to interference from the 4 15.8-keV gamma ray from Pa-233 (the daughter of Np-237), particularly when enhanced quantities of Am-241 or Np-237 exist in the waste. Plutonium and neptunium interference situations must be identified and compensated before initiating quantitative modeling to determine Pu-239 mass (see Analysis Index 4.2). Compensation methods may be based on identifying additional Pa-233 gamma rays. Major Pa-233 gamma rays and their associated branching ratios are displayed in Table K-7 (data obtained from the current ENSDF database).
Table K-7. Plutonium-233 gamma raw and branching ratios.
300.3 I 6.62
3 12.2 I 38.6
340.8 I 4.47
398.6 I 1.390
415.8 I 1.745
K-7.2.1 Analysis Index 4.1-Plutonium-239 Concentration
Analysis Index 4.1 is defined to be the intensity of the 413.7-keV gamma ray (or, alternatively, the Pu-239 concentration indicated by the 4 13.7-keV gamma ray):
Analysis Index 4.1 = measured Pu-239 concentration
= intensity of 4 13.7-keV gamma ray.
K-18
This analysis index will identify Pu-239 distributions and locations of high Pu-239 concentrations. Since the very low Pu-239 concentration found in the environment is well below the detection limit of the logging probe, any value of Analysis Index 4.1 statistically >O will indicate the presence of waste plutonium.
K-7.2.2 Analysis Index 4.2-Plutonium and Neptunium Interference
Analysis Index 4.2 (the Np-237 concentration or, alternatively, the intensity of the 3 12.2-keV gamma ray) is proposed for recognizing and compensating Pa-233 interference. Any nonzero value of Analysis Index 4.2 will indicate that compensation may be required:
Analysis Index 4.2 = measured Np-237 concentration
= intensity of 3 12.2-keV gamma ray.
The best method for compensating 4 13.7 and 4 15.8 interference will vary depending on various factors including Pu-23 9 concentration and the presence or absence of americium and neptunium enrichment. Americium and Neptunium enrichment indices may be used in combination with Analysis Index 4.2 to help choose a compensation method. The final compensation approach will be developed through experimentation with actual logging data.
K-7.2.3 Analysis Index 4.3-Location of Plutonium
Differential attenuation of the various gamma rays from Pu-239 can yield the average mass thickness through which the gamma rays have passed. Differential attenuation for uniform Pu-239 in homogenous soil serves as the index standard. Analysis Index 4.3 is then defined as the ratio of the measured average thickness to the predicted average thickness for uniform and homogenous conditions :
Analysis Index 4.3 = (measured thickness from Pu-239 gamma rays)/(predicted thickness for uniform and homogenous conditions).
The value of Analysis Index 4.3 may be interpreted as follows:
<1, Pu close to the probehole or low-density medium next to probehole
>1, Pu farther from the probehole or high-density medium next to probehole
= 1, Pu uniformly distributed in soillike medium.
Experience with actual logging data will help distinguish the meaning of and boundary between these various domains.
K-7.3 Media Indices
Characteristics of the media surrounding a probehole can have profound influence over measured logging data values. Large changes in measured gamma radiation can be caused by anomalies in the soil or waste media, such as the presence of voids or neutron-absorbing compounds. Accordingly, media effects represent a significant source of ambiguity in the analysis of Type A logging data at the SDA, particularly where quantitative results are sought. The Tier 2 approach for Pu-239 mass estimation at P9-20R requires that media properties be supplied. We propose a set of analysis indices specifically directed toward understanding media characteristics and estimating media properties. As with other indices, these media indices are calculated directly from the logging data and are meant for qualitative interpretation. Both passive and active gamma-ray data are used.
K-19

In many cases, a combination of the results of radionuclide analysis (from the passive probe) and elemental analyses (from both the active probe and passive probe) can give information about the waste form. In some instances, a specific waste form can be inferred, while in other cases, the data may be consistent with several waste forms. Table K-8 is an elemental characterization matrix proposed for use in waste form determination.
Table K-8. Elemental characterization matrix
INEEL, 2000, OU 7-1 0 Stage I Subsurface Exploration and Treatability Studies Report (Llrafl), INEEL/EXT-2000-00403, Rev. A, Idaho National Engineering and Environmental Laboratory.
Analysis indices obtained from elemental concentrations or ratios will be used in conjunction with this elemental characterization matrix to help identify the waste form. If successhlly developed, media indices would greatly expedite the selection of initial matrix conditions for use in Tier 2 modeling studies. Suggested media indices are listed in the “Summary” section.
K-7.4 Plutonium-239 Source Term
In order to determine the Pu-239 source term, construction of a Tier 2 MCNP model encompassing the volume surrounding probehole P9-20R is proposed. In the general MCNP modeling scheme, the total model volume is subdivided into elemental volumes. Each element is assigned nuclear source and transport parameters based on the interpreted character of the model area (i.e., the P9-20R vicinity). The MCNP model run then simulates the gamma-ray flux that would be created by the theoretical model volume. The validity of the model is evaluated by comparing the simulated gamma-ray flux with the measured gamma-ray flux from logging data.
Initial estimates must be provided for media characteristics and the sizes and locations of the Pu-239 bodies. These estimates will be developed through Tier 1 analysis. Information gained from active and passive spectral log data, azimuthal log data, and analysis indices will provide the basis for the initial model. It is very important that all available data and information be used because the more accurate the initial input for the Tier 2 analysis, the faster the method will converge.
The Tier 2 analysis is anticipated to be easier to initiate for Pu-239 at P9-20R than for other proposed source-term problems because of the large amount of data available at this location. Initial model parameters can be based on a relatively complete and consistent dataset that reveals an apparently simple Pu-239 distribution. At the end of each model iteration, the results will be reviewed and revised and a more accurate estimate of the Pu-239 distribution will be developed. Then another iteration will be initiated. Iterations will continue until either the results adequately match the measurements or no hrther improvements are made.
K-20

K-7.5 Principal Tasks and Subtasks
The objective of this task is to estimate the plutonium in P9-20R. The method is applicable to any probehole(s) where the plutonium source term is desired. The following subtasks are proposed in order to hl ly develop and use the Tier 1 and 2 analyses to arrive at the plutonium source term at P9-20R (see Table K-9).
Table K-9. Principal tasks and subtasks for Subtask Number
1
Estimated Labor Hours
Raw spectral analysisa-automated, semiautomated, and manual spectrum analysis to determine peak heights for all gamma rays of interest and all Type A probes
PC-GAP programmer Batch processing programmer Database programmer Senior nuclear measurements analyst Staff nuclear measurements analvst
40 40 40 40
300
2 Senior nuclear measurements analyst Staff nuclear measurements analyst Database programmer Geophysics analyst
16 32 8
40
Develop media analysis indicesb- develop specific algorithms, incorporate uncertainty analysis, implement as database function, and develop presentation method
Test and refine Pu-239 analysis index definitions and analyze and interpret all probe data for Pu-239 enrichment- develop specific algorithms, incorporate uncertainty analysis, implement as database function, and develop presentation method
Analyze and interpret all P9-20R cluster probe data and analysis index data for Pu-239 developed in Subtask 3 above- review media data, develop source distribution for initial Tier 2 analysis innut
3 Senior nuclear measurements analyst Staff nuclear measurements analyst Database programmer Geophysics analyst
8 4 16 4
4 Senior nuclear measurements analyst Geophysics analyst
32 60
5 Senior nuclear measurements analyst Geophysics analyst Monte Carlo physics code evaluation modeler
16 24 160
Monte Carlo physics code evaluation setup‘-develop model geometry for multiple probeholes and logging tools, develop outline of basic computational process, and test with logging data
Tier 2 analysisd 6 Senior nuclear measurements analyst Geophysics analyst Monte Carlo physics code evaluation modeler
16 24 80
I Prepare report 10 20 20
Senior nuclear measurements analyst Geophysics analyst Staffsupport
a. Subtask 1 constitutes a top-level prerequisite for all the analysis methods proposed in this report. This subtask is performed one time to meet all but specialized future analysis requirements. This subtask will require significant lead time. b. This effort to develop elemental analysis indices is required only once to support all Tier 1 and Tier 2 analyses for any task. c. This consists of initial setup of the Monte Carlo physics code evaluation model and is a top-level prerequisite for all Tier 2 analyses. It is required only once. Once developed, this model can be used for Tier 2 analysis for any task. d. It is assumed that four iterations will be required for the estimated hours for Subtask 6.
K-7.6 S pec i a I Perform e r Q u a I if i c at i o n s
Staff nuclear measurements analyst for Subtask 1 is preferably a staff or mid-level professional working under the direction of a senior analyst. The primary activities will be quality control for automated peak height analysis as well as some semiautomatic and manual peak height analysis.
K-2 1

Senior nuclear measurement analyst must have extensive experience in measuring, analyzing, and interpreting gamma-ray spectra. In addition, this person must have a working knowledge of RFP waste that has been buried at the SDA, extensive experience in field gamma-ray measurements (especially in- field measurements, including well logging), extensive experience with both passive gamma-ray measurements and active interrogation using neutrons, a working knowledge of gamma-ray metrology, and extensive knowledge of TRU, actinides, and naturally occurring isotopes.
An INEEL computer programmer with working knowledge of the INEEL spectral analysis computer program called PC-GAP will be needed to implement automated spectral analysis.
Nuclear measurements and geophysics analysts for Subtasks 2, 3, and 4 will preferably have experience with SDA Type A probe data.
The MCNP modeler must have extensive experience using MCNP to model geometries similar to waste drums and probeholes.
K-7.7 Technical Benefits and Risks
The primary benefit of the proposed index-based analysis method is that it provides for the succinct display and review of all the logging information that is relevant to recognizing plutonium concentrations and locations. This approach will support rapid evaluation of all P9-20R logging data and will preserve (and emphasize) statistical uncertainty considerations. These characteristics of the proposed analysis method are well suited for forming general, qualitative conclusions regarding the plutonium distribution around P9-20R and developing the most accurate initial input model for Tier 2 analysis. A detailed, accurate input plutonium distribution will help ensure that the Tier 2 analysis will converge and provide the plutonium source term with the best possible accuracy. The plutonium source term provided by the Tier 2 analysis will result in final closure of the high plutonium concentration concerns at P9-20R. A successhl Tier 2 analysis for P9-20R also will provide assurance that a similar Tier 2 analysis can yield the plutonium source term for other SDA locations of interest.
One primary risk with the proposed approach is that the Tier 2 analysis might not converge. Nonconvergence could result if the MCNP model structure is insufficiently detailed to accommodate the actual conditions in the vicinity of P9-20R. Nonconvergence also might occur because of the slowness of the MCNP calculation process, which might make it difficult to accomplish an adequate number of iterations in a reasonable amount of time. The problem of nonconvergence increases with increasing amounts of control data, i.e., the number and quality of logging measurements to be fitted.
Nonuniqueness is a second risk of the proposed approach. This MCNP application requires that the source location, shape, and concentration as well as matrix characteristics are determined simultaneously. In some cases, these parameters may be indistinguishable from each other so that the final result contains a hndamental ambiguity. Multiple models may satisfy the existing logging data with equal accuracy. The problem of nonuniqueness decreases with increasing amount of control. Of all the source-term tasks, P9-20R would appear to present the best opportunity to achieve a unique solution.
K-8. TASK 5: NEPTUNIUM AND AMERICIUM ENRICHMENT
Weapons grade plutonium, which was produced, processed, and ultimately shipped as waste from RFP to the INEEL, decays to produce predictable mixtures of Am-241, Np-237, and Pu-239. Neptunium-237 and Am-24 1 have the potential to migrate and are contaminants of potential concern in the environmental risk assessment for the SDA. Current risk assessments for Am-24 1 and Np-237 are based on the assumption that Am-24 1 and Np-237 in INEEL waste have been produced solely from the
K-22

decay of Pu-239. However, RFP historical records document the addition of americium to some categories of plutonium waste before it was shipped to the INEEL for burial. In addition, spectral gamma-ray logging data collected under the OU 7-13/14 logging program show apparent elevated Np-237. The objective of this task is to develop qualitative methods to deduce the presence of neptunium or americium enrichment from logging data. Results may suggest revisions to the Am-24 1 and Np-237 groundwater contamination risk assessments.
PI utoniuin I sotopc
Weapons grade plutonium, which was produced, processed, and ultimately shipped as waste from RFP to the INEEL, decays to produce predictable mixtures of Am-241, Np-237, and Pu-239. Americium- 24 1 has the potential to migrate and is a contaminant of potential concern in the environmental risk assessment for the SDA. Current risk assessments for Am-24 1 are based on the assumption that Am-24 1 in INEEL waste has been produced solely from the decay of Pu-239 (this assumption is examined in Task 5 of this report). The long-term groundwater contamination risk because of Am-24 1 also depends on americium release parameters. These release factors describe Am-24 1 solubility under the influence of vadose zone moisture conditions and are poorly understood as the SDA. Americium-24 1 source-term analysis would involve an in situ study of Am-24 1 release in order to estimate americium release parameters. The objective of this task is to develop analysis methodology to accomplish the Am-241 source-term study.
Weight'%,- I ' ~ c i g ~ i r ' ~ ~ - ~ "
K-8.1 Description of Proposed Method
Pu-23 9
Pu-240
Pu-24 1
The method proposed for evaluation of Am-24 1 and Np-237 enrichment is the development of Tier 1 indices to flag enrichment conditions. Development of these indices will be based on three sets of calculations: (1) calculation of expected Am-241, Np-237, and Pu-239 ratios for theoretical decay, (2) calculation of existing in situ Am-241, Np-237, and Pu-239 ratios based on logging data, and (3) calculation of differential gamma-ray attenuation factors for Am-24 1, Np-237, and Pu-239, which provide a quality control measure. The general scheme is outlined in the following sections.
93.826% 93.72 f 0.11%
5.820% 5.860 f 0.068%
0.340% 0.380 f 0.054%
K-8.2 Com p u tat i o nal Bas is for Am erici u m -241 E n rich men t Ana I ys is Indices
There are two possible sources of Am-24 1 : (1) decay from Pu-239 and (2) added Am-24 1. Source 1, because of decay of plutonium-bearing waste, always occurs in a predictable proportion to Pu-239 if original isotopic ratios are known. Source 2, when present, constitutes Am-241 enrichment.
Table K-10 gives two sets of isotopic ratio values for RFP weapons grade plutonium. Note that the Pu-24 1 fraction obtained from the shipping records is about 1 1 % higher than the value for weapons grade plutonium at the time of first production. This apparent discrepancy must be resolved before any attempts to determine Am-24 1 and Np-237 americium enrichments, since a value for the original Pu-24 1 fraction is required.
Table K-10. Isotopic ratio values for Rockv Flats Plant weapons made plutonium.
I Pu-23 8 I 0.012% I 0.0149 f 0.0083% I
I Pu-242 I 0.024% I 0.0248 f 0.0046% I
K-23

a. Ratios at time of plutonium production (INEEL, 2000, OU 7-1 0 Stage I Subsurface Exploration and Treatability Studies Report [Draj?], INEEL/EXT-2000-00403, Rev. A, Idaho National Engineering and Environmental Laboratory).
b. Ratios assumed to apply at time of waste shipment to Idaho National Engineering and Environmental Laboratory (EDF-1242, 1999, “Default Plutonium Mass Fractions for Rocky Flats Plant Waste,” Rev. 0, Idaho National Engineering and Environmental Laboratory).
376.65 662.4 722.0
Once a starting Pu-24 1 concentration has been obtained, we can calculate the predicted Am-24 1 concentration at any location arising from the decay of Pu-24 1 alone. This is done using the half-life of Pu-241 (14.4 years), the decay time (which depends on the age of the pit), and the initial Pu-241 concentration. Since the pits were filled over an extended period, an average age for a given pit must be used unless the actual burial date of the waste at a probehole location is known. Age uncertainty of one year will create 5% uncertainty in the calculated Am-24 1 concentration because of decay of the Pu-24 1.
0.00014 0.000364 0.000 196
The existing Am-24 1 concentration can be obtained from passive spectral gamma-ray logging data. Major Am-241 gamma rays and branching ratios are displayed in Table K-1 1 (data obtained from the current ENSDF database).
Table K- 1 1. Americium-24 1 gamma rays and branching ratios.
I 125.3 I 0.00408 I 146.55 I 0.00046 I 208.0 I 0.00079 I 322.5 I 0.00015 I 332.35 I 0.00015 I 335.4 I 0.00050 I 368.65 I 0.00022
Experience has shown that the 662.4-keV gamma ray provides the most reliable basis for determining in situ Am-24 1 concentration. (The 722-keV gamma ray may be used in cases where interference from Cs-137 is suspected.)
K-8.2.1 Analysis Index 5.1-Americium Concentration
Analysis Index 5.1 is defined as the measured Am-24 1 concentration or, alternatively, the intensity of the 662.4-keV gamma ray used to measure Am-24 1 :
Analysis Index 5.1 = measured Am-24 1 concentration
= intensity of 662.4-keV gamma ray
Examination of the values of this index obtained from logging data will identify regions where Am-241 is located.
K-24
K-8.2.2 Analysis Index 5.2-Americium Enrichment
Once the in situ Am-24 1 and Pu-239 concentrations and the predicted Am-24 1 concentrations have been obtained, we form the ratio of the in situ Am-24 1 concentration to the in situ Pu-239 concentration and the ratio of the predicted Am-24 1 concentration to the in situ Pu-239 concentration. Analysis Index 5.2 is defined as the ratio of these ratios:
Analysis Index 5.2 = (measured Am-24 1 and measured Pu-239)/(calculated Am-24 1 and measured Pu-239)
= measured Am-24 1 and calculated Am-24 1
A value for Analysis Index 5.2 statistically >1 will indicate the presence of americium enrichment at that location @e., Am-241 that cannot be accounted for by the decay of Pu-241).
K-8.2.3 Analysis Index 5.3-Relative Locations of Americium and Plutonium
If Analysis Index 5.2 indicates americium enrichment, differential attenuation of the Pu-239 gamma rays and the Am-24 1 gamma rays can give an indication whether or not the added americium is collocated with the plutonium. Using the differential attenuation of the Pu-239 gamma rays and the differential attenuation of the Am-24 1 gamma rays, we can calculate the average thicknesses of material through which the gamma rays from each nuclide have traveled. Analysis Index 5.3 is defined as the ratio of these two thicknesses:
Analysis Index 5.3 = thickness from Am-24 1 differential attenuation and thickness from Pu-239 differential attenuation.
A value for Analysis Index 5.3 statistically different from one indicates that the plutonium and the added americium are at different locations. Since enrichment Analysis Index 5.2 depends on the assumption that plutonium and americium are collocated, Analysis Index 5.3 can be used for quality assessment purposes.
K-8.3 Com p u tat i o nal Bas is for Ne pt u n i u m -237 En rich men t Analysis Indices
There are three possible sources of Np-237: decay from Pu-241 present in the original waste, decay from added Am-24 1, and added Np-237.
Since Np-237 does not emit gamma rays of usehl intensities, we must determine its in situ concentration from the gamma rays emitted upon decay of its daughter, Pa-233. Since the half-life of Pa-233 is very short compared with the half-life of Np-237 (27 days versus 2.14 x lo6 years), Pa-233 will be in secular equilibrium with its parent within a few months. Because the waste is over 30 years old, the activity of Pa-233 in the SDA will be equal to the activity of its parent. Therefore, Pa-233 is an excellent indicator for Np-237. The 3 12.2-keV gamma ray from Pa-233 will be used to determine the in situ concentration of Np-237.
We can calculate the predicted Np-237 because of the decay of Pu-24 1 by using the measured Pu-239 concentration together with the original isotopic ratios for the waste and the decay time. Likewise, we can calculate the Np-237 because of decay of total Am-24 1 in the waste by using the measured Am-24 1 concentration. As previously discussed, uncertainties regarding the age or original isotopic makeup of the waste will create corresponding uncertainties in the predicted Np-237. The Np-237 enrichment @e., the amount of Np-237 that cannot be accounted for by the decay of Am-241) is simply the total Np-237 concentration minus the Np-237 concentration because of decay of Am-241.
K-25
K-8.3.1 Analysis Index 5.4-Neptunium Concentration
Analysis Index 5.4 is defined as the measured Np-237 concentration or, alternatively, the intensity of the 3 12.2-keV gamma ray used to measure Np-237:
Analysis Index 5.4 = measured Np-237 concentration
= intensity of 3 12.2-keV gamma ray.
Examination of the values of this index obtained from logging data will identify regions where Np-237 is located.
K-8.3.2 Analysis Index 5.5-Neptunium Enrichment
Analysis Index 5.5 is defined as the ratio of the total Np-237 concentration to the calculated Np-237 concentration because of the decay of Am-24 1 :
Analysis Index 5.5 = measured Np-237 conclusion and calculated Np-237 conclusion because of Am-24 1 decay.
If this ratio is statistically greater than one, this indicates that there is Np-237 enrichment.
K-8.3.3 Analysis Index 5.6-Relative Locations of Americium and Neptunium
If Analysis Index 5.5 indicates neptunium enrichment, the differential attenuation of the Pa-233 gamma rays and the Am-24 1 gamma rays might give an indication of whether or not the additional Np-237 is located with the Am-24 1. Analysis Index 5.6 is defined as the ratio of the average material thickness indicated by the differential attenuation of the Pa-233 gamma rays to the corresponding thickness indicated by the differential attenuation of the Am-24 1 gamma rays:
Analysis Index 5.6 = thickness from Pa-233 differential attenuation and thickness from Am-24 1 differential attenuation.
Because the gamma rays from Pa-233 span only a relatively small energy range (300.3-415.8 keV), the differential attenuation of the gamma rays will not be large. The attenuation coefficient for the 300.3-keV gamma ray in soil is 0.107 cm2/g, while that for the 415.8-keV gamma ray is 0.0945 cm2/g. The difference in attenuation for these gamma rays traveling through 15 cm of soil with a density of 1.7 g/cm’ will be only about 27%. In addition, the 415.8-keV peak from Pa-233 has an interference because of Pu-239 that must be removed, a process that increases the uncertainty in the result. Because of these difficulties, Analysis Index 5.6 can be obtained with sufficient accuracy only if all the gamma rays from Pa-233 are very strong, including the 4 15 .8-keV gamma ray, and the intensity of the 4 15 .8-keV gamma ray can be accurately distinguished from the 4 13.7-keV gamma ray from Pu-239. Therefore, obtaining the differential attenuation for Pa-233 gamma rays may be difficult to impossible to accomplish for locations where the Np-237 concentration is not sufficiently high. Tests using logging spectra indicate Analysis Index 5.6 can be obtained with sufficient accuracy to be usehl for Np-237 concentrations of about 50-100 pCi/g if the Pu-239 concentration is below about 50-1 00 nCi/g.
K-8.4 Principal Tasks and Subtasks
The following subtasks are proposed in order to hl ly develop and use the americium and neptunium enrichment analysis indices (see Table K- 12).
K-26

Table K-12. Principal tasks and subtasks for neptunium and americium enrichment.
1
2
Raw spectral analysisa-automated, semiautomated, and manual spectrum analysis to determine peak heights for all gamma rays of interest and all Type A probes
Test and refine index definitions- develop specific algorithms, incorporate uncertainty analysis, implement as database function, and develop uresentation method
PC-GAP programmer Batch processing programmer Database programmer Senior nuclear measurements analyst Staff nuclear measurements analyst
Senior nuclear measurements analyst Staff nuclear measurements analyst Database programmer Geophysics analyst
40 40 40 40
300
16 32 8
40
Analyze and interpret all probe data for neutunium and americium enrichment
Prepare report
Senior nuclear measurements analyst Geophysics analyst
Senior nuclear measurements analyst Geophysics analyst Staffsunnort
20 20
a. Subtask 1 constitutes a top-level prerequisite for all the analysis methods proposed in this report. This subtask is performed one time to meet all but specialized future analysis requirements. This subtask will require significant lead time.
K-8.5 S pec i a I Perform e r Q u a I if i c at i o n s
Nuclear measurements analyst for Subtask 1 is preferably a staff or mid-level professional working under the direction of a senior analyst. The primary activities will be quality control for automated peak height analysis as well as some semiautomatic and manual peak height analysis.
An INEEL computer programmer with working knowledge of the INEEL spectral analysis computer program called PC-GAP will be needed to implement automated spectral analysis.
Nuclear measurements and geophysics analysts for Subtasks 2, 3 , and 4 will preferably have experience with SDA Type A probe data.
K-8.6 Technical Benefits and Risks
The primary benefit of the proposed index-based analysis method is that it provides for the succinct display and review of all the logging information that is relevant to recognizing americium and neptunium enrichment conditions. This approach will support rapid evaluation of all SDA logging data and will preserve (and emphasize) statistical uncertainty considerations. These characteristics of the proposed analysis method are well suited for forming general, qualitative conclusions regarding americium and neptunium enrichment that can be compared with historical record information. It is also important to note that the proposed analysis indices are independent of the characteristics of the intervening soil and waste media, provided that the plutonium, americium, and neptunium are collocated.
The primary risk with the proposed approach is that the higher-level analysis indices @e., indices that depend on two or more gamma rays) may often be indeterminate because of their dependence on low-intensity or low-energy gamma rays and gamma-ray interferences. In the worst case, we may not obtain enough statistically credible index values to ascertain trends.
K-27

K-9. TASK 6: THORIUM ENRICHMENT
Gamma Encrg!. (kcV)
Existing SDA risk assessments do not consider thorium as a risk to human health since buried waste records contain no evidence for elevated thorium. However, preliminary spectral gamma-ray logging measurements indicate widespread elevated concentrations of Th-232 and Th-228 in the SDA. In addition, the logging data indicate that at some locations the Th-228 and Th-232 ratio also is elevated above natural ratios. The objective of this task is to develop methods to evaluate the characteristics of thorium enrichment in SDA buried waste. Depending on results of this evaluation, the OU 7-13/14 Project may conduct a risk assessment for thorium.
Branching Ratio ( " 0 ) Sourcc Isotopc
K-9.1 Description of Proposed Method
The method proposed for evaluation of Th-228 and Th-232 enrichment is the development of Tier 1 indices to flag enrichment conditions. Development of these indices will be based on three sets of calculations: (1) calculation of expected Th-228 and Th-232 ratios for theoretical decay, (2) calculation of existing in situ Th-228 and Th-232 ratios based on logging data, and (3) calculation of expected gamma- ray attenuation factors for Th-232 and Th-228, which provide a quality control measure. The general scheme is outlined below.
K-9.1 .I Computational Basis for Thorium-228 and Thorium-232 Enrichment Analysis Indices
Gamma rays from the decay of Th-208 are usually used to quantify natural thorium @e., Th-232) in secular equilibrium with its daughters and Th-228 in secular equilibrium with its daughters. It takes less than a month for the daughters of Th-228 to be in secular equilibrium with their parent. In 30 years, the daughters of Th-232 are almost (within about 4%) in secular equilibrium with their parent, and in 35 years, they are within 2% of secular equilibrium. Since the waste in the pits has been there for 30-35 years, the error introduced by assuming that the thorium chain parents and daughters are in secular equilibrium will be essentially negligible. Therefore, we will assume such secular equilibrium and use the gamma rays from Th-208 to determine both the Th-228 and Th-232 concentrations.
Major Th-228 gamma rays and their associated branching ratios are displayed in Table K-13 (data obtained from the current ENSDF database).
Table K- 13. Thorium-228 enrichment gamma ravs and branching ratios.
I 238.6 I 43.3 I Pb-212 I I 510.8 I 8.12 I Th-208 I I 583.2 I 30.4 I Th-208 I I 727.3 I 6.58 I P-2120 I I 860.6 I 4.46 I Th-208 I I 2.614.5 I 35.65 I Th-208 I
Major Ac-228 gamma rays (Ac-228 is a daughter of Th-232 but not of Th-228) and their associated branching ratios are displayed in Table K-14 (data obtained from the current ENSDF database).
K-28

Table K-14. Actinium-228 gamma raw and branching ratios Gamma Encrg\. (kcV) Branching Ratio ((h)
338.3 911.2
11.3 25.8
The intensity of the 2,614.5-keV gamma ray will be used to determine the total thorium concentration; the intensity of the 9 1 1.2-keV gamma ray will be used to determine the Th-232 concentration; and the difference @e., total thorium concentration minus Th-232 concentration) will give the Th-228 concentration.
964.8 969.0
K-9.1.2 Analysis Index 6.1-Thorium Concentration
2,614.5-keV gamma ray or, alternatively, the intensity of the 2,614.5-keV gamma ray itself Analysis Index 6.1 is defined as the measured thorium concentration as determined from the
Analysis Index 6.1 = measured thorium concentration
= intensity of 2,614.5-keV gamma ray
Examination of the values of this index obtained from logging data will identify regions where high concentrations of thorium are located.
4.99 15.8
K-9.1.3 Analysis Index 6.2-Thorium Enrichment
Thorium is present in normal SDA soil, and its gamma rays will appear in logging gamma-ray spectra. For each probehole logging scan, the average environmental soil concentration of thorium will be obtained from the average intensity of the 2,614.5-keV gamma ray in regions above and (if possible) below the waste layer. The ratio of the 2,614.5-keV gamma-ray intensity in various locations of the waste layer to this environmental average is defined to be Analysis Index 6.2:
Analysis Index 6.2 = 2,614.5-keV y-ray intensity and average environmental 2,614.5-keV y-ray intensity.
This analysis index is designed to provide rapid indications of regions of thorium enrichment. In the waste layer, this ratio should be 51 because displacement of some of the soil by the waste will tend to lower this ratio. A ratio statistically >1 will indicate that there is enhanced thorium at this location, but we will not know whether the enhancement is because of Th-228 or Th-232.
Analysis Index 6.2 will be used in screening the logging data to identify locations where there is thorium enrichment. When such locations are found, addition analysis indices will be used to determine whether the thorium is Th-228 or Th-232.
K-9.1.4 Analysis Indices 6.3 and 6.4-Isotopic Thorium Enrichment
If the 9 1 1.2 keV gamma ray can be observed in the soil regions above and (if possible) below the waste layer, the average environmental intensity can be determined. If the 9 1 1.2-keV gamma ray is not observed in the gamma-ray spectra from the soil regions above or below the waste region, its average environmental intensity will be obtained theoretically (using the intensity of the 2,6 14.5-keV gamma ray and assuming thorium chain secular equilibrium). The ratio of the 9 1 1.2-keV gamma ray intensity in a location of the waste layer where Analysis Index 6.2 indicated enriched thorium to this environmental average is defined to be Analysis Index 6.3:
K-29

Analysis Index 6.3 = 9 1 1.2-keV y-ray intensity and average environmental 9 1 1.2-keV y-ray intensity.
1
2
3
4
This index, which is dependent only on the Th-232 concentration, will indicate Th-232 enrichment.
Raw spectral analysisa-automated, PC-GAP programmer 40 semiautomated, and manual spectrum Batch processing programmer 40 analysis to determine peak heights for all Database 40 gamma rays of interest and all Type A Senior nuclear measurements analyst 40
300 probes
Test and refine index definitions- Senior nuclear measurements analyst 6 develop specific algorithms, incorporate Staff nuclear measurements analyst 24 uncertainty analysis, implement as Database programmer 6 database function, and develop Geophysics analyst 6 presentation method
Analyze and interpret all probe data for Senior nuclear measurements analyst 16 thorium enrichment Geophysics analyst 40
Staff nuclear measurements analyst
Prepare report Senior nuclear measurements analyst 10 Geophysics analyst 20 Staffsupport 20
In order to obtain information concerning Th-228 enrichment, Analysis Index 6.2 will be compared with Analysis Index 6.3. Analysis Index 6.4 is defined as the ratio of Analysis Index 6.2 to Analysis Index 6.3 :
Analysis Index 6.4 = Analysis Index 6.3 and Analysis Index 6.2.
If Analysis Index 6.4 is statistically equal to one, this will indicate that there is no Th-228 enrichment and the total thorium enrichment is because of Th-232. If Analysis Index 6.4 is statistically greater than one, this will indicate that there is an enrichment of Th-228 in that location.
K-9.1.5 Analysis Index 6.5-Relative Locations of Thorium-228 and Thorium-232
If the 338.3-keV and 91 1.2-keV gamma rays from the decay of Ac-228, which are indicators of Th-232 only, are observable together with the 2,614.5-keV and either the 238.6-keV or 583.2-keV gamma rays from the decay of T1-208 and Pb-212 (indicators of total thorium), we may be able to determine whether the enriched Th-228 and Th-232 are in the same location or separated. Using differential attenuation, we can determine the thickness of material through which the gamma rays from each parent have traveled. Analysis Index 6.5 is defined to be the ratio of these two thicknesses:
Analysis Index 6.5 = thickness from Th-232 differential attenuation and thickness from total thorium differential attenuation.
A value for Analysis Index 6.5 statistically different from one will indicate that the two thorium isotopes are in different locations.
K-9.2 Principal Tasks and Subtasks
The following subtasks are proposed in order to hl ly develop and use the thorium enrichment analysis indices (see Table K-15).
K-3 0

K-9.3 S pec i a I Perform e r Q u a I if i c at i o n s
Nuclear measurements analyst for Subtask 1 is preferably a staff or mid-level professional working under the direction of a senior analyst. The primary activities will be quality control for automated peak height analysis as well as some semiautomatic and manual peak height analysis.
An INEEL computer programmer with working knowledge of the INEEL spectral analysis computer program called PC-GAP will be needed to implement automated spectral analysis.
Nuclear measurements and geophysics analysts for Subtasks 2, 3, and 4 will preferably have experience with SDA Type A probe data.
K-9.4 Technical Benefits and Risks
The primary benefit of the proposed index-based analysis method is that it provides for the succinct display and review of all the logging information that is relevant to recognizing americium and neptunium enrichment conditions. This approach will support rapid evaluation of all SDA logging data and will preserve (and emphasize) statistical uncertainty considerations. These characteristics of the proposed analysis method are well suited for forming general, qualitative conclusions regarding americium and neptunium enrichment that can be compared with historical record information. It is also important to note that the proposed analysis indices are independent of the characteristics of the intervening soil and waste media, provided that the plutonium, americium, and neptunium are collocated.
The primary risk with the proposed approach is that the higher-level analysis indices @e., indices that depend on two or more gamma rays) may often be indeterminate because of their dependence on low-intensity or low-energy gamma rays and gamma-ray interferences. In the worst case, we may not obtain enough statistically credible index values to ascertain trends.
K-10. TASK 7: ORGANIC SLUDGE SOURCE MASS ESTIMATION
Waste containing volatile organic compounds (VOCs) and waste oils were shipped from the U.S. Department of Energy RFP to the INEEL for disposal between 1966 and 1969. The majority of VOC-bearing waste was contained in Series 743 sludge. Series 743 sludge consists mainly of carbon tetrachloride, 1 , 1 , 1 -trichloroethane, trichloroethylene (TCE), tetrachloroethylene, and miscellaneous waste oils including Texaco Regal oil. The amount of carbon tetrachloride originally buried at the SDA was estimated to be approximately 1 x 10' g based on waste shipping records. Miller and Navratil revised this estimate up to 5 x 10' g of carbon tetrachloride based on more detailed inventory information.
Carbon tetrachloride and other VOCs have been detected in overburden soils, particularly above SDA waste pits known to have received large volumes of Series 743 sludge. Carbon tetrachloride also has been detected in groundwater beneath the SDA. The OU 7-13/14 Project is currently attempting to revise its assessment of the human health risk posed by carbon tetrachloride at the SDA and to recommend appropriate remedial measures. The effectiveness of the various remedial alternatives under consideration depends strongly on the amount of carbon tetrachloride currently present in the SDA subsurface. The objective of this task is to develop quantitative methods to estimate in situ carbon tetrachloride mass based on logging data.
K-10.1 Description of Proposed Method
Direct measurement of carbon tetrachloride using nuclear methods is currently not possible. The active (n-gamma) tool used by GTS Duratek in the SDA logging activities identifies the presence of
K-3 I

chlorine (Cl), but the amount and physical form of the C1 are either unknown or subject to considerable uncertainty. There are three primary problems that arise in using the GTS active tool to make quantitative measurements of chlorine and ultimately carbon tetrachloride:
1. Source heterogeneity-the C1 response of the active tool depends on the nature of the matrix material containing the chlorine, which will vary for different waste types or soil conditions
2. GTS calibration studies suggest (and theory supports) that the active tool has a C1 saturation limit, i.e., the tool loses its sensitivity above a certain C1 level
3. Inventory records indicate that SDA waste contains a variety of C1-bearing materials including chlorinated solvents, inorganic halide salts, and plastic or PVC; the particular source of C1 cannot be distinguished directly by the active tool.
It is proposed that the problems presented above can be solved, at least in part, using Monte Carlo modeling of the active tool. Modeling will have two objectives: (1) to determine the response of the active tool under various important C1 conditions and determine the corresponding calibration hnction and (2) to reveal indicators that can be used to differentiate between the various important C1 conditions so that the correct calibration hnction may be selected for use in data processing.
The OU 7-13/14 work plan objective is to develop a carbon tetrachloride mass estimate for the entire SDA. Currently, only small portions of Pits 4, 5 , 9, and 10 have been sampled by logging probes. While the foregoing discussion lays out a strategy for estimating the carbon tetrachloride mass within the immediate vicinity of each probe, it is also necessary to consider methods for generalizing these results to the entire SDA.
Based on the overall complexity of the carbon tetrachloride estimation problem, we propose a four- part analysis approach as follows:
1. Active tool recalibration based on MCNP modeling
2. Tier 1 analysis to obtain qualitative assessment of the amount of chlorine, its heterogeneity, the nature of the surrounding soil media, and to develop an initial model for Tier 2 analysis
3. Tier 2 MCNP modeling
4. Tier 3 evaluation of extrapolation method results to obtain carbon tetrachloride estimate for entire SDA
Each of these steps are discussed in the following sections.
K-10.2 Logging Tool Recalibration
GTS calibrated the active tool using a brine solution. This calibration is inappropriate for use in the SDA because neutron transport properties are significantly different in a water solution than they are in soil. Existing field data provide evidence of this problem. In several cases, measured count rates were observed to exceed the theoretical limit established by calibration. Effectively, the region of interrogation is significantly smaller in water than in a material such as soil that contains relatively small quantities of hydrogen, resulting in a smaller activated volume, i.e., smaller source. The smaller source, in turn, produces fewer gamma rays at a greater distance from the gamma-ray detector. As a result, use of the system in soil will produce a larger activated volume with the gamma rays being produced in closer proximity to the detector and a higher observed count rate.
K-32

It is expected that the active tool will exhibit saturation behavior even in soil because of the self- shielding effects of chlorine. In practical terms, this means that the tool response will be identical for C1 concentrations at or above the saturation level with the result that very high C1 concentrations cannot be recognized. Under these conditions, C1 mass estimates will be biased low, or large uncertainties must be assigned to the measurement results.
We will conduct an initial modeling effort to duplicate the GTS Duratek simulation of the brine solution calibration standard. This model will serve as a benchmark to verify that the INEEL Tier 2 simulations are representative of the active tool at high-end chlorine concentrations. We also will conduct a modeling effort to obtain a calibration for the active tool for typical SDA soil.
Gamma Encrg!. I (kcV)
K-10.3 Computational Basis for Chlorine Analysis Indices
I lit ciis i t!' I (') 0)
Gamma rays from (n,y) reactions detected by the active probe can be used to detect and quantify elements such as chlorine. Energies and intensities of the most prominent gamma rays from the C1 (n,y) reaction are displayed in Table K- 16.
Table K-16. Energies and intensities from chlorine reaction.
788.4 1.164.7
16.4 27.2
I 5 16.7 I 23.8 I
1,950.9 1.959.1
I 786.3 I 10.4 I
20.2 13.0
6,110.8 7,413.7
20.8 10.0
Because of its high intensity, the 1,164.7-keV gamma ray is usually used to quantify chlorine although sometimes the 6,110.8-keV gamma ray also is used.
K-I 0.3.1 Analysis Index 7.1-Chlorine Concentration
Analysis Index 7.1 is defined as the measured chlorine concentration as determined from the 1,164.7-keV gamma ray or, alternatively, the intensity of the 1,164.7-keV gamma ray itself
Analysis Index 7.1 = measured chlorine concentration
= intensity of 1,164.7-keV gamma ray.
Examination of the values of this index obtained from logging data will identify regions where high concentrations of chlorine are located. In interpreting Analysis Index 7.1, care must be taken because the presence of large amounts of elements with high thermal neutron capture cross sections (e.g., plutonium and chlorine itself) can perturb the thermal neutron flux and cause erroneously low apparent chlorine concentrations. Analysis Index 7.2 can be used to identify this situation.
K-3 3

K-I 0.3.2 Analysis Index 7.2-Neutron Flux Perturbation
The situation of a depressed thermal neutron flux because of the presence of large amounts of high cross-section materials can be identified from observation of the intensity of the iron capture gamma rays. Because of the 1/2-in. thick steel casing, the intensity of the iron capture gamma rays should never drop below their background levels (i.e., their intensities in nonwaste regions) unless the thermal neutron flux is abnormally low. The intensity of the iron capture gamma rays can, however, be higher than their background levels because of the presence of iron in the waste (e.g., steel drums or steel waste materials). Analysis Index 7.2 is defined as the ratio of the measured intensity of the 7,63 1,1-7,645.45-keV iron capture gamma ray doublet to the background intensity of this doublet (or, alternatively, the ratio of the measured iron concentration to the background iron concentration) :
Analysis Index 7.2 = (measured 7,63 1-7,645-keV y-ray intensity)/(background 7,63 1-7,645-keV y-ray intensity)
= (measured iron concentration)/(background iron concentration).
A value for Analysis Index 7.2 statistically <1 indicates a neutron flux perturbation. This perturbation can be caused by either the presence of either large amounts of high thermal-neutron-capture, cross-section materials or large voids close to the probehole. These two cases can be distinguished by review of the active and passive probe data. If relatively high concentrations of chlorine or plutonium are observed, voids can be ruled out as being highly unlikely.
Analysis Index 7.2 also can be used to perform a first order correction to Analysis Index 7.1. For cases where Analysis Index 7.2 is statistically <1, dividing Analysis Index 7.1 by Analysis Index 7.2 will partially correct Analysis Index 7.1. This is only a first-order, partial correction because the true value of the iron concentration is unknown. In waste regions, the iron concentration is frequently greater than the background value because of the presence of steel drums and iron-containing waste. We can, however, only correct to the background iron concentration and not to this unknown elevated concentration.
K-I 0.3.3 Analysis Index 7.3-Location of Chlorine
Because of the large energy range of the C1 (n,y) gamma rays, differential attenuation of the various gamma rays from this reaction can yield the average mass thickness through which the gamma rays have passed. Differential attenuation for uniformly-distributed chlorine in homogenous soil serves as the index standard. Analysis Index 7.3 is then defined as the ratio of the measured average thickness to the predicted average thickness for uniform and homogenous conditions :
Analysis Index 7.3 = (measured thickness from chlorine gamma rays)/(predicted thickness for uniform and homogenous conditions).
The value of Analysis Index 7.3 may be interpreted as follows:
0 <1, chlorine close to the probehole or low-density medium next to probehole
> 1, chlorine farther from the probehole or high-density medium next to probehole
0 = 1, chlorine uniformly distributed in soillike medium.
Experience with actual logging data will help distinguish the meaning of and boundary between these various domains.
K-34

K-I 0.3.4 Determination of Organic Chlorine
The active type A probe measures only total chlorine. Therefore, other information is required to determine whether the chlorine detected is because of organic sludge, inorganic salts, or PVC. An estimate of the type of chlorine compound detected can be obtained from the measured concentrations of calcium and potassium. The analysis indices for elements will be used for this determination.
K-10.4 Tier 2 Analysis
The primary modeling effort will explore the n-gamma tool response to various C1-bearing waste forms. The following models were selected to represent a set of end-member cases that have physical significance to the waste in the SDA:
Model the active tool response to a homogenous distribution of carbon tetrachloride in INEEL soils
0 Model the active tool response to a homogenous distribution of TCE in INEEL soils
Model the active tool response to an intact organic sludge waste containing carbon tetrachloride
Model the active tool response to an intact organic sludge waste containing TCE
Model the active tool response to waste containing halide salts including potassium chloride, calcium chloride, potassium fluoride, and calcium fluoride
Model the active tool response to waste that contains plastic in the form of PVC.
Model results will be analyzed to determine: (1) calibration hnctions for converting raw data to C1 mass estimates for each important waste type, (2) methods and capabilities for waste type recognition based on nuclear data characteristics, and ( 3 ) C1 saturation behavior. This analysis will provide a clearer understanding of the approximations and assumptions that will be required to make a carbon tetrachloride mass estimate based on field data. Uncertainties may then be assessed based on the required approximations.
As the final step, logging data will be evaluated by Tier 1 methods to determine the best calibration hnction for each measurement. The calibration hnction will be applied to obtain a C1 mass estimate at each measurement depth. These single point estimates may be then summed to obtain a C1 mass estimate for the vicinity of each probehole. Point and probehole C1 mass estimates constitute the final output of Tier 2 analysis.
K-10.5 Tier 3 Analysis
Tier 3 analysis has two objectives: correct the Tier 2 mass estimates to account for non-carbon tetrachloride sources of chlorine and extrapolate the mass estimate results to the remainder of the SDA.
Inventory data show the presence of multiple chlorinated VOCs in waste sludge, with carbon tetrachloride and TCE being the most important from a volume standpoint. Inventory data also show shipments of inorganic C1-bearing halide salts and combustible waste that could include large masses of C1-bearing PVC pipe. Plastic bag liners, which are associated with nearly all waste types, are another potential non-VOC source of C1. Without some means to differentiate specific C1 forms, it will be necessary to assume that all C1 is associated with carbon tetrachloride in a manner that will overestimate the actual carbon tetrachloride mass.
K-3 5
A set of mass calculations must be conducted to ascertain the significance of the various C1 sources. These calculations will permit us to estimate maximum amounts of chlorine (in ppm) that could occur within the active tool volume of investigation for each chlorine source. These non-carbon tetrachloride chlorine mass estimates will be compared with expected carbon tetrachloride chlorine mass to establish thresholds under which Tier 2 results must be corrected. It is hoped that some potential chlorine sources (such as bag liners) may be discounted entirely based on these results. For chlorine sources that are still a problem, it will be necessary to develop methods to recognize and correct for these non-carbon tetrachloride chlorine sources. Some non-carbon tetrachloride chlorine sources, such as salts and combustible waste, should be readily recognizable from Tier 1 media indices. Others, such as additional VOC contaminants, will most likely be impossible to recognize. Mass percentages of the various waste VOC components (developed from inventory studies) may be used to compute approximate corrections for these non-carbon tetrachloride chlorine sources.
The final step is to extrapolate carbon tetrachloride corrected mass estimates at each probehole to a mass estimate for the entire SDA. Three alternative methods have been considered:
1. Sample waste pits thoroughly by additional probe installation
2.
3 .
Use soil gas data to generalize existing probe data results
Use inventory data to generalize existing probe data results.
Information concerning unsampled portions of the SDA may be obtained straightforwardly by installing additional probes. The first step would be to develop a sampling plan to establish the number and location of new probes needed to evaluate carbon tetrachloride distribution throughout the pit. After installing, logging, and computing a carbon tetrachloride mass estimate for each probe, a continuous mass distribution would be interpolated over the entire pit by standard minimum curvature or krigging interpolation routines. A total carbon tetrachloride mass estimate could then be calculated directly. The required number of additional probes is unknown but would probably be on the order of many hundreds. This approach is considered economically unfeasible.
The total carbon tetrachloride mass also may be estimated by indirect methods. The general approach is to use the existing probe data, which relates to only a limited portion of the SDA, to calibrate a secondary data set that encompasses the entire pit. The carbon tetrachloride mass for the entire pit is then calculated by applying an appropriate calibration relation to the secondary data set. Two secondary data sets are available for the SDA: inventory records and soil gas data.
The indirect method based on overburden soil gas data depends on the assumption that soil gas carbon tetrachloride concentration at any particular location depends primarily on the total amount of liquid carbon tetrachloride mass in the underlying waste. For this method, probe data would first be analyzed to determine carbon tetrachloride mass along the probe transect. A continuous mass distribution would then be developed by interpolating between probeholes and extending these estimates outward perpendicular to the transect. After constructing a release transport model to relate the estimated carbon tetrachloride mass to soil gas measurements, the model would be calibrated to determine gas release transport parameters that satisfy observed soil gas measurements along the probe transect. Soil gas data for the remainder of the SDA could then be inverse modeled to estimate carbon tetrachloride mass.
The chief concern in using this method is that soil gas measurements may depend on carbon tetrachloride mobility to an equal or greater extent than carbon tetrachloride mass. Carbon tetrachloride mobility will depend foremost on the integrity of shipping containers and liners, which are conditions that are not typically known. Use of this method could proceed only on the basis that the average container integrity along the calibration transect is typical of the average container integrity for the rest of the SDA.
K-3 6
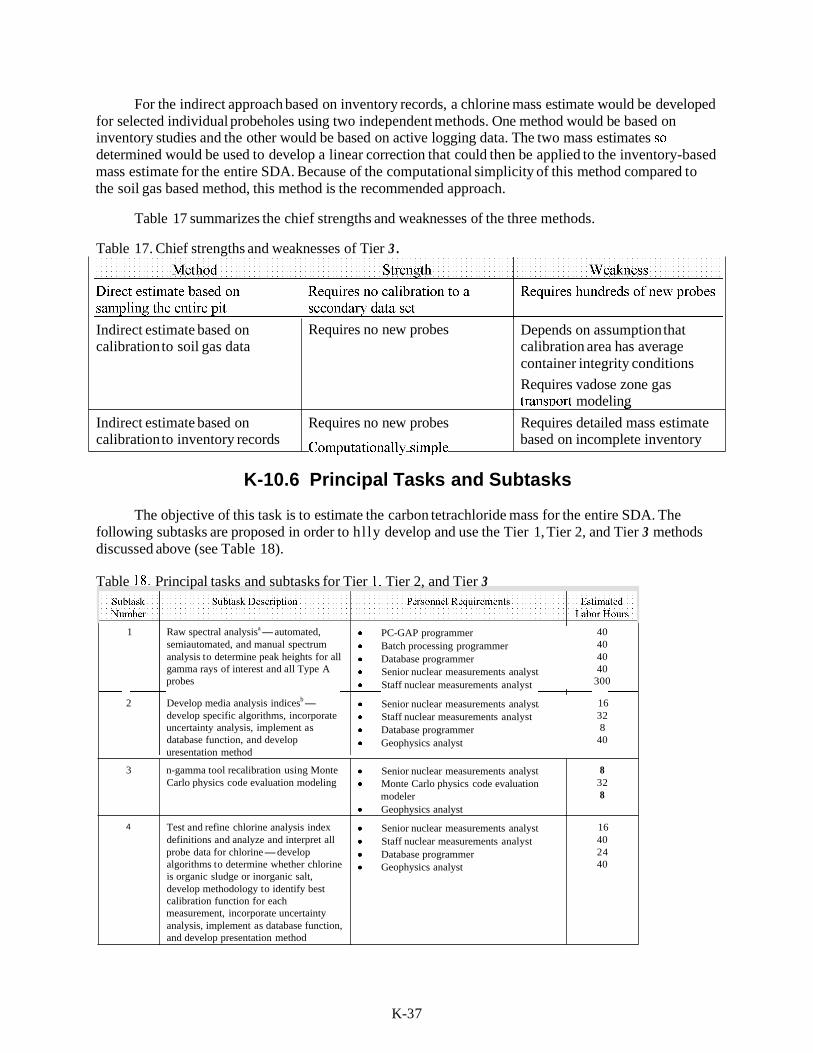
For the indirect approach based on inventory records, a chlorine mass estimate would be developed for selected individual probeholes using two independent methods. One method would be based on inventory studies and the other would be based on active logging data. The two mass estimates so determined would be used to develop a linear correction that could then be applied to the inventory-based mass estimate for the entire SDA. Because of the computational simplicity of this method compared to the soil gas based method, this method is the recommended approach.
Indirect estimate based on calibration to inventory records
Table 17 summarizes the chief strengths and weaknesses of the three methods.
Requires no new probes ~omputat iona~~y simple
Requires detailed mass estimate based on incomplete inventory
Table 17. Chief strengths and weaknesses of Tier 3 .
Indirect estimate based on calibration to soil gas data
Requires no new probes Depends on assumption that calibration area has average container integrity conditions Requires vadose zone gas transnort modeling
K-10.6 Principal Tasks and Subtasks
The objective of this task is to estimate the carbon tetrachloride mass for the entire SDA. The following subtasks are proposed in order to hl ly develop and use the Tier 1, Tier 2, and Tier 3 methods discussed above (see Table 18).
Table 18. Principal tasks and subtasks for Tier 1, Tier 2, and Tier 3
1
2
Raw spectral analysisa-automated, semiautomated, and manual spectrum analysis to determine peak heights for all gamma rays of interest and all Type A probes
Develop media analysis indicesb- develop specific algorithms, incorporate uncertainty analysis, implement as database function, and develop uresentation method
PC-GAP programmer Batch processing programmer Database programmer Senior nuclear measurements analyst Staff nuclear measurements analyst
Senior nuclear measurements analyst Staff nuclear measurements analyst Database programmer Geophysics analyst
40 40 40 40
300
16 32 8
40
3
4
n-gamma tool recalibration using Monte Carlo physics code evaluation modeling
Test and refine chlorine analysis index definitions and analyze and interpret all probe data for chlorine-develop algorithms to determine whether chlorine is organic sludge or inorganic salt, develop methodology to identify best calibration function for each measurement, incorporate uncertainty analysis, implement as database function, and develop presentation method
Senior nuclear measurements analyst Monte Carlo physics code evaluation modeler Geophysics analyst
Senior nuclear measurements analyst Staff nuclear measurements analyst Database programmer Geophysics analyst
8 32 8
16 40 24 40
K-3 7

5
6
7
K-10.7 Special Performer Qualifications
Monte Carlo physics code evaluation Senior nuclear measurements analyst 16 setup‘-develop model geometry for Geophysics analyst 24 multiple Probeholes and logging tools; Monte Carlo physics code evaluation 160 develop outline of basic computational process; test with logging data
Tier 2 analysis to develop calibration Senior nuclear measurements analyst 40
modeler
functions for each of the selected Staff nuclear measurements analyst 80 “standard’ waste/soil conditions; apply Geophysics analyst 80 calibration functions based on Task 4 Monte carlo physics code evaluation 120
Prepare report Senior nuclear measurements analyst 10
results modeler
Geophysics analyst 40 Staffsupport 30
Staff nuclear measurements analyst for Subtask 1 is preferably a staff or mid-level professional working under the direction of a senior analyst. The primary activities will be quality control for automated peak height analysis as well as some semiautomatic and manual peak height analysis.
Senior nuclear measurement analyst must have extensive experience in measuring, analyzing, and interpreting gamma-ray spectra. In addition, this person must have a working knowledge of RFP waste that has been buried at the SDA, extensive experience in field gamma-ray measurements (especially in- field measurements, including well logging), extensive experience with both passive gamma-ray measurements and active interrogation using neutrons, a working knowledge of gamma-ray metrology, and extensive knowledge of TRU, actinides, and naturally occurring isotopes.
An INEEL computer programmer with working knowledge of the INEEL spectral analysis computer program called PC-GAP will be needed to implement automated spectral analysis.
Nuclear measurements and geophysics analysts will preferably have experience with SDA Type A probe data.
The MCNP modeler must have extensive experience using MCNP to model geometries similar to waste drums and probeholes.
K-10.8 Technical Benefits and Risks
The primary benefit of the proposed index-based analysis method is that it provides for the succinct display and review of all the logging information that is relevant to recognizing chlorine concentrations and locations. This approach will support rapid evaluation of all chlorine logging data and will preserve (and emphasize) statistical uncertainty considerations. These characteristics of the proposed analysis method are well suited for forming general, qualitative conclusions regarding the organic sludge distribution around any probehole and selecting the appropriate calibration hnction for estimating chlorine mass.
An important benefit of the overall proposed method is that it will produce an independent estimate of chlorine mass. This result could be extremely usehl since the current estimate could easily have order
K-3 8

of magnitude uncertainty. Because of the RI/FS requirement to use the most conservative @e., largest possible) value for chlorine mass, a second independent estimate may, at a minimum, improve our understanding of the uncertainty.
One risk with the proposed approach is that it will be difficult to identify the proper calibration hnction for each active measurement or that some factors that have great influence on the active measurement cannot be recognized at all. The use of sensitivity studies as part of Subtask 6 will be usehl for hrther evaluating this risk. The accuracy of chlorine mass estimates based on active logging data may depend entirely on our ability to recognize the local environment of each measurement so that the proper calibration hnction is used.
A second risk is that the correction for non-carbon tetrachloride VOC chlorine, which will have no basis in any logging measurements, will have a major influence on determining the final correction factor for inventory-based mass estimate. This situation may cast considerable uncertainty on the result or require that the final total mass be estimated as range rather than a single value.
A third risk is caused by uncertainty in the inventory-based mass estimates that will be used in Tier 3 to determine the final correction factor. One of the major issues with inventory information is poor location control. In Tier 3 , we will need to obtain inventory-based mass estimates at specific probe locations.
K-3 9