Embed Size (px)
Citation preview

AECOM Wellington to Hutt Valley Walking Cycling Link Project W2HVlink Cycleway Investigations
D R A F T
Revision 0 – 07-Mar-2014 Prepared for – New Zealand Transport Agency – Co No.: N/A
Appendix E
Laboratory Test Reports
RELEASED U
NDER THE
OFFICIA
L INFORMATIO
N ACT

P2N Cycleway
Petone foreshore
NZTA
JAD Civil Design
Aecom
17.12.13
Test pit
TP2 1.20m
GRAVEL: f-vc, brown, with sand Report No:
As received Sample No:
n/a t/m3 Assumed Client Ref:
7.2 % whole
Hydrometer Analysis
Sieve Size Passing Sieve Size Passing Sieve Size Passing Particle Size Passing Particle Size Passing
(mm) (%) (mm) (%) (mm) (%) (mm) (%) (mm) (%)
100.0 100 9.50 29 0.425 12 0.0750 6 0.0750 6
75.0 88 6.70 25 0.300 11 0.0750 6 0.0750 6
53.0 74 4.75 22 0.212 10 0.0750 6 0.0750 6
37.5 61 2.36 18 0.150 9 0.0750 6 0.0750 6
19.0 41 1.18 15 0.106 7 0.0750 6 0.0750 6
13.20 34 0.600 13 0.075 6 0.0750 6 0.0750 6
Test Methods Notes
Particle Size Analysis: NZS 4402 1986 Test 2.8.1 (Wet Sieve) History: Air + Oven dried
Particle Size Analysis: NZS 4402 1986 Test 2.8.4 (Hydrometer)
Date Tested: 19.12.13
Date Reported: 13.1.14
19/11/08
21/02/09
Designation :
Date : 28/07/08 13.1.14
21/02/09
PF-LAB-100 (30/05/2013) Page 1 of 1
Uncalibrated Sieve sizes: 0.212, 0.106mm.
Solid density
PRELIMINARY
This report may only be reproduced in full
Water content as rec'd
IANZ Approved Signatory
Technical Officer (MJ Mclachlan)
60306339/7.02
Testing only is covered by IANZ Accreditation
PARTICLE SIZE ANALYSIS
TEST REPORT
Sieve Analysis
Location:
Client:
Date sampled:
Sample condition:
Contractor:
Sampling method:
522900/1078
2-13/400
Project:
Sampled by:
Sample source:
Sample description:
PRELIMINARY
Sieve Aperture Size (mm)
100.0
75.0
53.0
37.5
19.0
13.2
0
9.5
0
6.7
0
4.7
5
2.3
6
1.1
8
0.6
00
0.4
25
0.3
00
0.2
12
0.1
50
0.1
06
0.0
75
0
10
20
30
40
50
60
70
80
90
100
0.001 0.010 0.100 1.000 10.000 100.000Particle Size (mm)
Per
cen
tag
e fi
ner
by
mas
s (%
)
CLAY
fine
SILT
medium coarse
SAND
fine medium coarse
GRAVEL
fine medium coarsevery
coarse
Opus International Consultants Limited
Quality Management Systems Certified to ISO 9001
Opus Research
138 Hutt Park Road
PO Box 30 845, Lower Hutt
New Zealand
Telephone +64 4 587 0600
Facsimile +64 4 587 0604
Website www.opus.co.nz
RELEASED U
NDER THE
OFFICIA
L INFORMATIO
N ACT

P2N Cycleway
Petone foreshore
NZTA
JAD Civil Design
Aecom
17.12.13
Test pit
TP2 1.80m
Gravel: f-vc, grey, with sand Report No:
As received Sample No:
n/a t/m3 Assumed Client Ref:
11.4 % whole
Hydrometer Analysis
Sieve Size Passing Sieve Size Passing Sieve Size Passing Particle Size Passing Particle Size Passing
(mm) (%) (mm) (%) (mm) (%) (mm) (%) (mm) (%)
75.0 100 9.50 53 0.425 12 0.0750 3 0.0750 3
53.0 95 6.70 36 0.300 11 0.0750 3 0.0750 3
37.5 91 4.75 28 0.212 9 0.0750 3 0.0750 3
26.5 87 2.36 19 0.150 5 0.0750 3 0.0750 3
19.0 81 1.18 15 0.106 4 0.0750 3 0.0750 3
13.20 68 0.600 13 0.075 3 0.0750 3 0.0750 3
Test Methods Notes
Particle Size Analysis: NZS 4402 1986 Test 2.8.1 (Wet Sieve) History: Air + Oven dried
Particle Size Analysis: NZS 4402 1986 Test 2.8.4 (Hydrometer)
Date Tested: 19.12.13
Date Reported: 13.1.14
19/11/08
21/02/09
Designation :
Date : 28/07/08 13.1.14
21/02/09
PF-LAB-100 (30/05/2013) Page 1 of 1
Uncalibrated Sieve sizes: 0.212, 0.106mm.
Solid density
PRELIMINARY
This report may only be reproduced in full
Water content as rec'd
IANZ Approved Signatory
Technical Officer (MJ Mclachlan)
60306339/7.02
Testing only is covered by IANZ Accreditation
PARTICLE SIZE ANALYSIS
TEST REPORT
Sieve Analysis
Location:
Client:
Date sampled:
Sample condition:
Contractor:
Sampling method:
522900/1078
2-13/401
Project:
Sampled by:
Sample source:
Sample description:
PRELIMINARY
Sieve Aperture Size (mm)
75.0
53.0
37.5
26.5
19.0
13.2
0
9.5
0
6.7
0
4.7
5
2.3
6
1.1
8
0.6
00
0.4
25
0.3
00
0.2
12
0.1
50
0.1
06
0.0
75
0
10
20
30
40
50
60
70
80
90
100
0.001 0.010 0.100 1.000 10.000 100.000Particle Size (mm)
Per
cen
tag
e fi
ner
by
mas
s (%
)
CLAYSILT
fine medium coarse fine
SAND
medium coarse fine
GRAVEL
medium coarsevery
coarse
Opus International Consultants Limited
Quality Management Systems Certified to ISO 9001
Opus Research
138 Hutt Park Road
PO Box 30 845, Lower Hutt
New Zealand
Telephone +64 4 587 0600
Facsimile +64 4 587 0604
Website www.opus.co.nz
RELEASED U
NDER THE
OFFICIA
L INFORMATIO
N ACT

Project : P2N Cycleway
Location : Petone foreshore
Client : NZTA
Contractor : JAD Civil Design
Sampled by : Aecom
Date sampled : 17.12.13
Sampling method : Test pit Report No:
Sample No:
Client Ref:
Test Results
Sample No. 2-13/400 - - - - -
Source:TP2
1.20m- - - - -
Sample description:
GRAVEL:
f-vc, brown,
with sand
- - - - -
History Air dried - - - - -
Passing 19mm % 41 - - - - -
Lime/cement additive % - - - - - -
Curing time days - - - - - -
Surcharge mass kg 4 - - - - -
Sample condition: Soaked - - - - -
Soaking time days 2 - - - - -
Swell % 0.1 - - - - -
W/c as rec'd (whole) % 7.2 - - - - -
W/c as comp. (-19mm) % 7.0 - - - - -
Dry density t/m³ 2.02 - - - - -
Compaction (NZ Heavy) % 95.0* - - - - -
W/c after test % 9.0 - - - - -
Penetration mm 2.5 - - - - -
CBR value % 55 - - - - -
Test Methods Notes:
CBR NZS 4402: 1986 test 6.1.1, NZS 4407:1991 test 3.15
Water Content NZS 4402: 1986 test 2.1, NZS 4407: 1991 test 3.1
Compaction NZS 4402: 1986 test 4.1.3 (Vibrating hammer)
NZS 4402: 1986 test 4.1.2 (Heavy)
Testing only is covered by IANZ Accreditation
This report may only be reproduced in full
Date tested :
Date reported :
IANZ Approved Signatory
Designation : Technical Officer (MJ Mclachlan)
Date :
PF-LAB-020 (18/12/2010) Page 1 of 1
16/03/09
8-13.1.14
13.1.14
13.1.14
16.03.09
CALIFORNIA BEARING RATIO (REMOULDED)
TEST REPORT
2-13/400
60306339/7.02
NZS 4402: 1986 test 4.1.3 (Vibrating)
522900/1078
* Estimated from one point NZ Heavy Compaction,
indicating MDD = 2.13 t/m3, OWC = 7.0%
Opus International Consultants
Quality Management Systems Certified to ISO 9001
Opus Research
Telephone +64 4 587 0600
Facsimile +64 4 587 0604
Website www.opus.co.nz
138 Hutt Park Road
PO Box 30 845, Lower Hutt
New Zealand
RELEASED U
NDER THE
OFFICIA
L INFORMATIO
N ACT

AECOM Wellington to Hutt Valley Walking Cycling Link Project W2HVlink Cycleway Investigations
D R A F T
Revision 0 – 07-Mar-2014 Prepared for – New Zealand Transport Agency – Co No.: N/A
Appendix F
Site Walkover Observations and Photographs
RELEASED U
NDER THE
OFFICIA
L INFORMATIO
N ACT

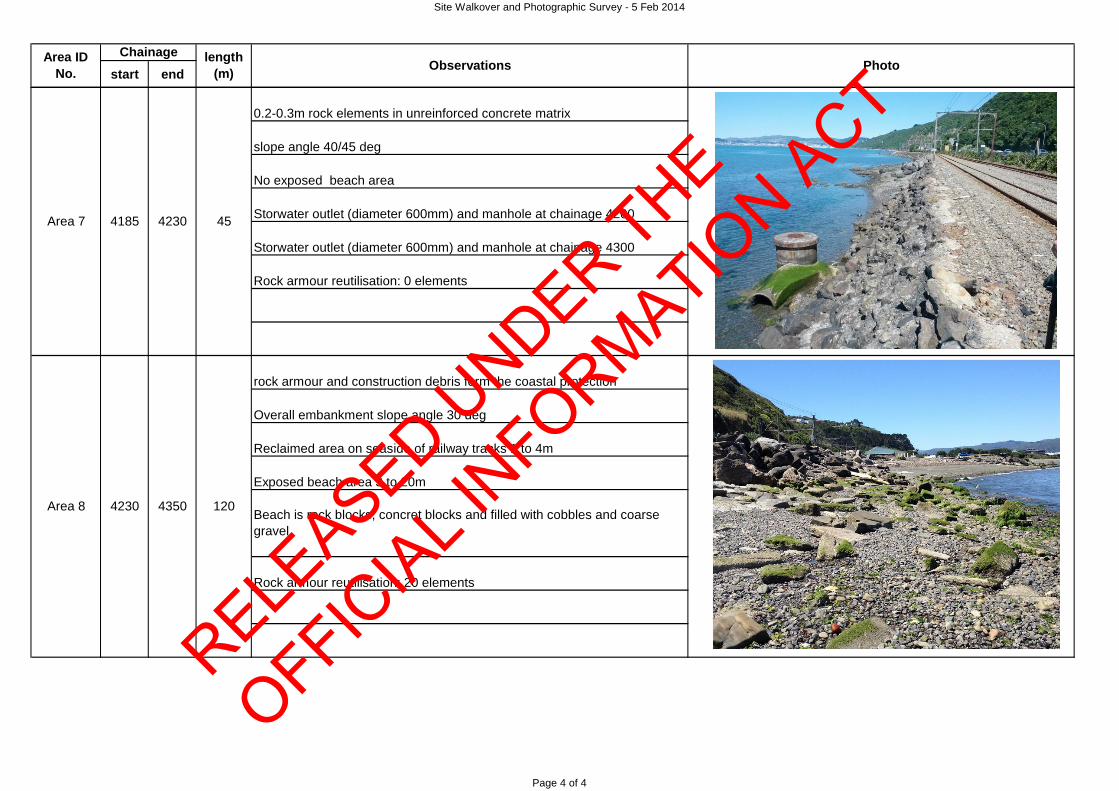
Site Walkover and Photographic Survey - 5 Feb 2014
start end
0.2-0.3m rock elements in unreinforced concrete matrix
existing railway embankment slope 45-55 deg
Beach gently sloping. Cobbles and coarse gravel
exposed beach area approx 10m
Rock armour reutilisation: 0 elements
0.3-0.5m rock elements in unreinforced concrete matrix
existing railway embankment slope 45-55 deg
Beach gently sloping. Coarse gravel
exposed beach area approx 5m
Rock armour reutilisation: 0 elements
Observations Photo
Concrete blocks sizing 1.5x0.7mx0.6m at embankment toe (2 rows). Concrete includes cooble size elements and appear to be unreinforced. Some of the blocks are heavily eroded
Area 2 3730 3800 70
ChainageArea ID No.
length (m)
Area 1 3690 3730 40
Page 1 of 4
RELEASED U
NDER THE
OFFICIA
L INFORMATIO
N ACT

Site Walkover and Photographic Survey - 5 Feb 2014
start end Observations PhotoChainageArea ID
No.length
(m)
0.2-0.3m rock elements in unreinforced concrete matrix
Additional rock armour elemnts at toe. Sizing 400-1000mm
existing railway embankment slope 45-55 deg
Beach gently sloping. Cobbles and coarse gravel
no exposed beach area
Rock armour reutilisation: 10 elements
Additional rock armour protection on existing slope. Sizing 300-1200mm
rock outcrops on beach and in shallow waters
Overall embankment slope angle 30 deg
Beach gently sloping. Coarse gravel
Exposed beach area up to 15m
Rock armour reutilisation: 40 elements
Area 4 3840 3960 120
Area 3 3800 3840 40
Page 2 of 4
RELEASED U
NDER THE
OFFICIA
L INFORMATIO
N ACT

Site Walkover and Photographic Survey - 5 Feb 2014
start end Observations PhotoChainageArea ID
No.length
(m)
0.2-0.3m rock elements in unreinforced concrete matrix
slope angle 50/55deg
Additional rock armour elemnts at toe. Sizing 350-1100mm
Unreinforced masonry wall and RC beam on top of on a 15m section
no exposed beach area
Rock armour reutilisation: 15 elements
stormwater outlet diameter 800mm at chainage 3880
0.2-0.3m rock elements in unreinforced concrete matrix
slope angle 50/55deg
Exposed beach area 5 to 8m
Rock armour reutilisation: 15 elements
Area 6 4095 4185 90
Area 5 3960
Additional rock armour elements at toe and on embankment slope. Sizing 250-1300mm
4095 135
Page 3 of 4
RELEASED U
NDER THE
OFFICIA
L INFORMATIO
N ACT
Site Walkover and Photographic Survey - 5 Feb 2014
start end Observations PhotoChainageArea ID
No.length
(m)
0.2-0.3m rock elements in unreinforced concrete matrix
slope angle 40/45 deg
No exposed beach area
Storwater outlet (diameter 600mm) and manhole at chainage 4200
Storwater outlet (diameter 600mm) and manhole at chainage 4300
Rock armour reutilisation: 0 elements
rock armour and construction debris form the coastal protection
Overall embankment slope angle 30 deg
Reclaimed area on seaside of railway tracks 1 to 4m
Exposed beach area 3 to 20m
Rock armour reutilisation: 20 elements
Area 7 4185 4230 45
Area 8 4230 4350 120 Beach is rock blocks, concret blocks and filled with cobbles and coarse gravel
Page 4 of 4
RELEASED U
NDER THE
OFFICIA
L INFORMATIO
N ACT

AECOM Wellington to Hutt Valley Walking Cycling Link Project W2HVlink Cycleway Investigations
D R A F T
Revision 0 – 07-Mar-2014 Prepared for – New Zealand Transport Agency – Co No.: N/A
Appendix G
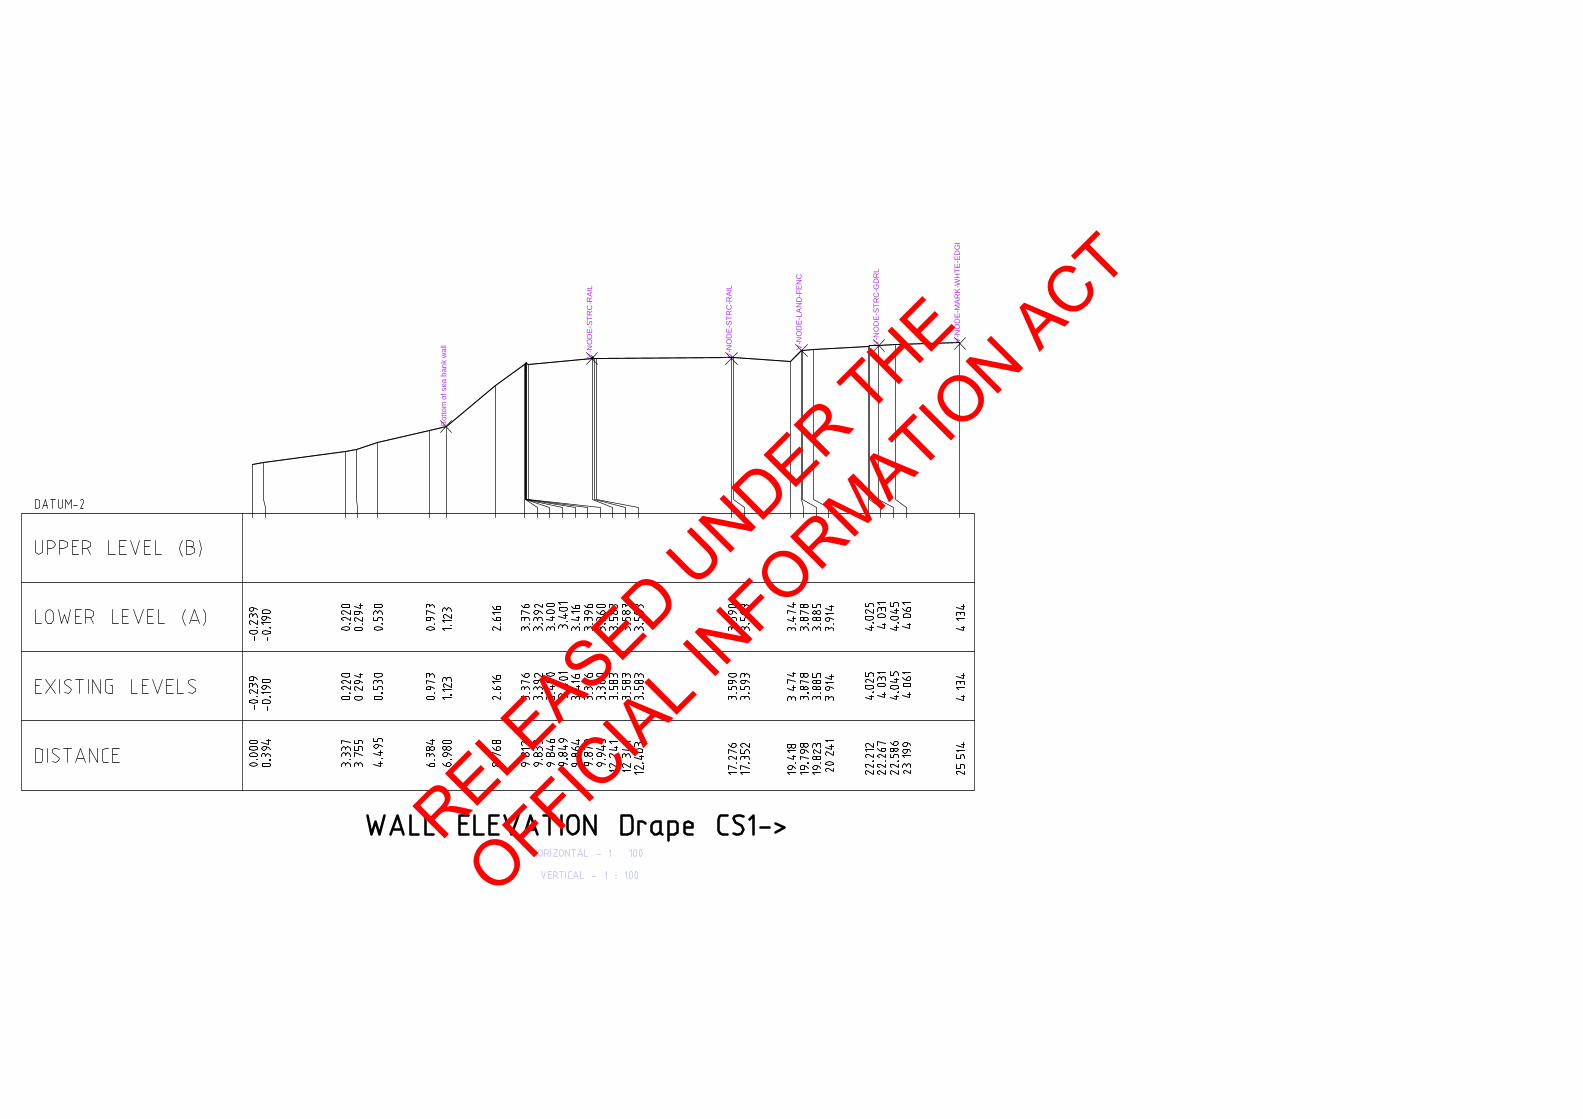
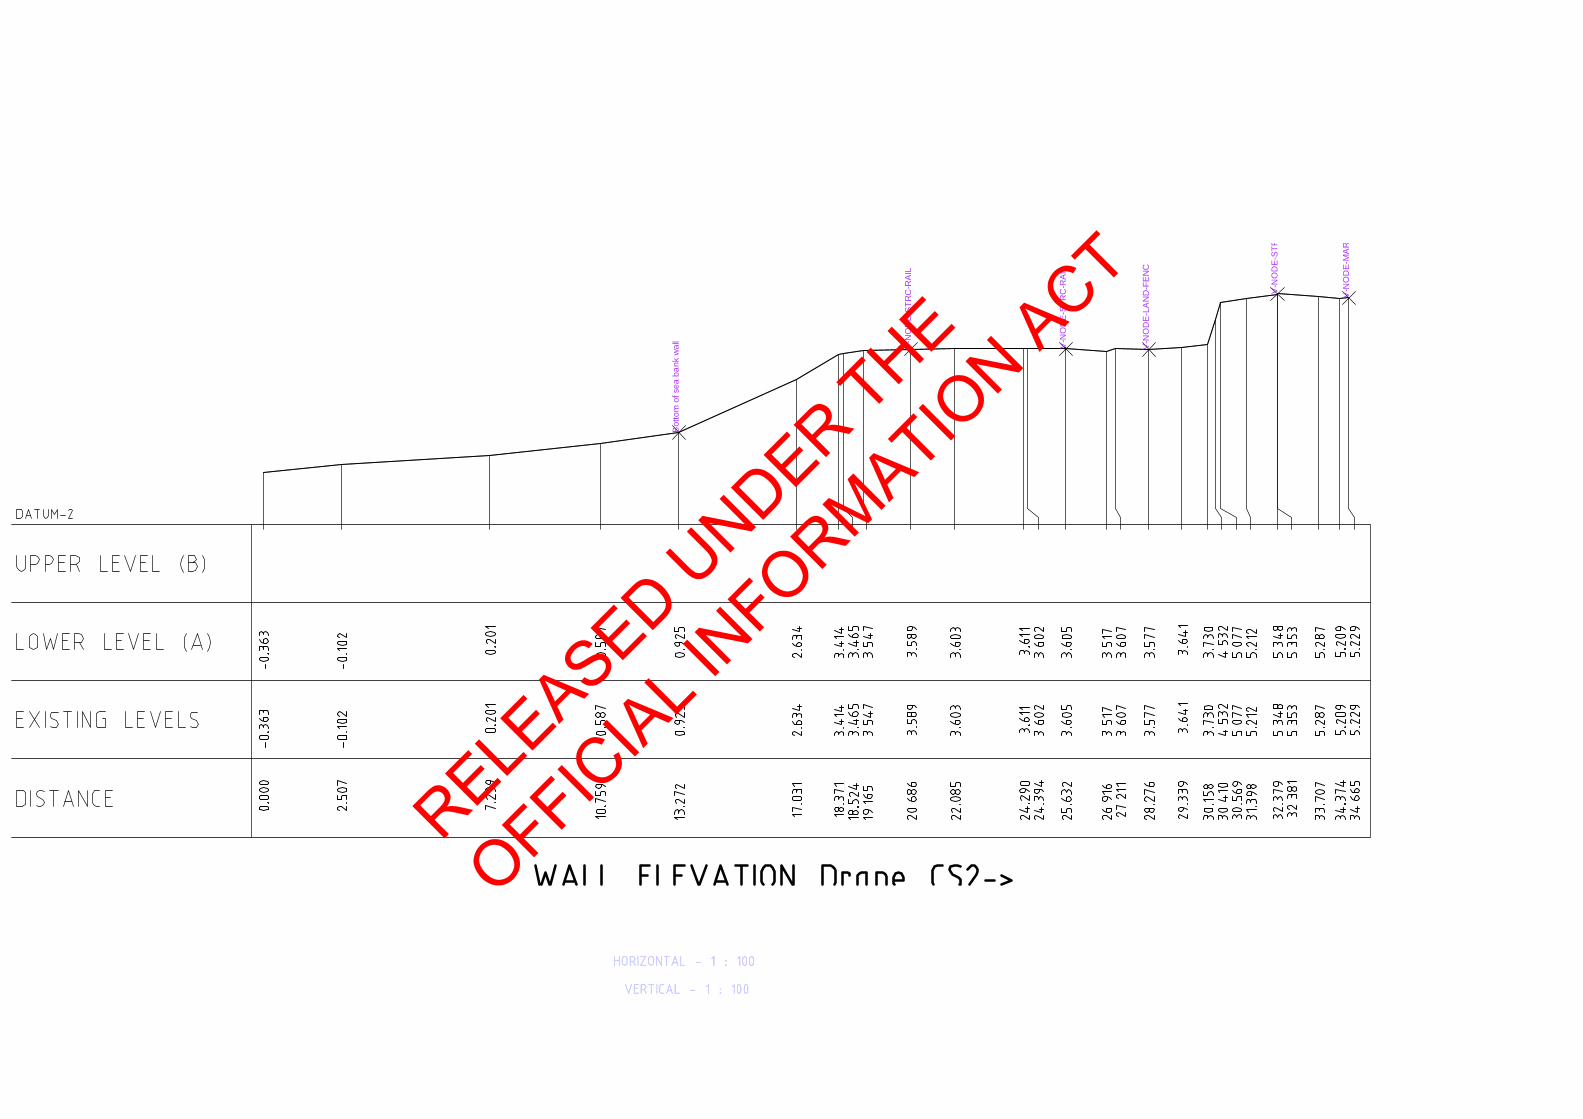
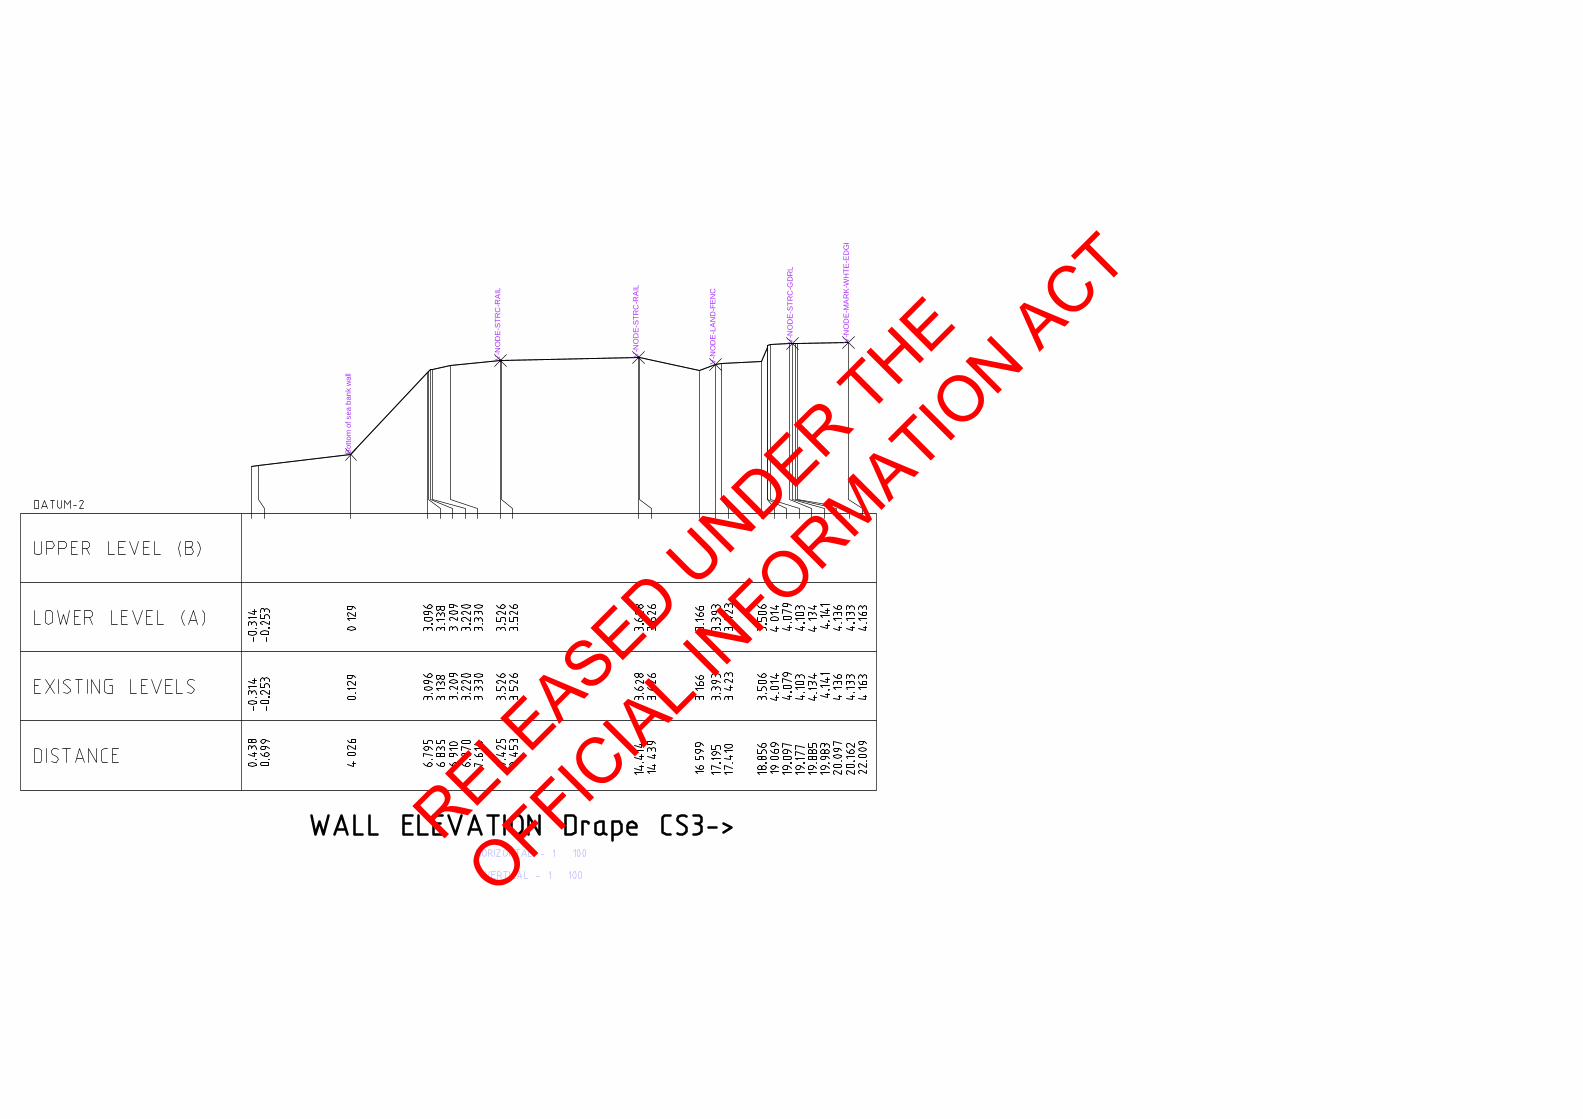
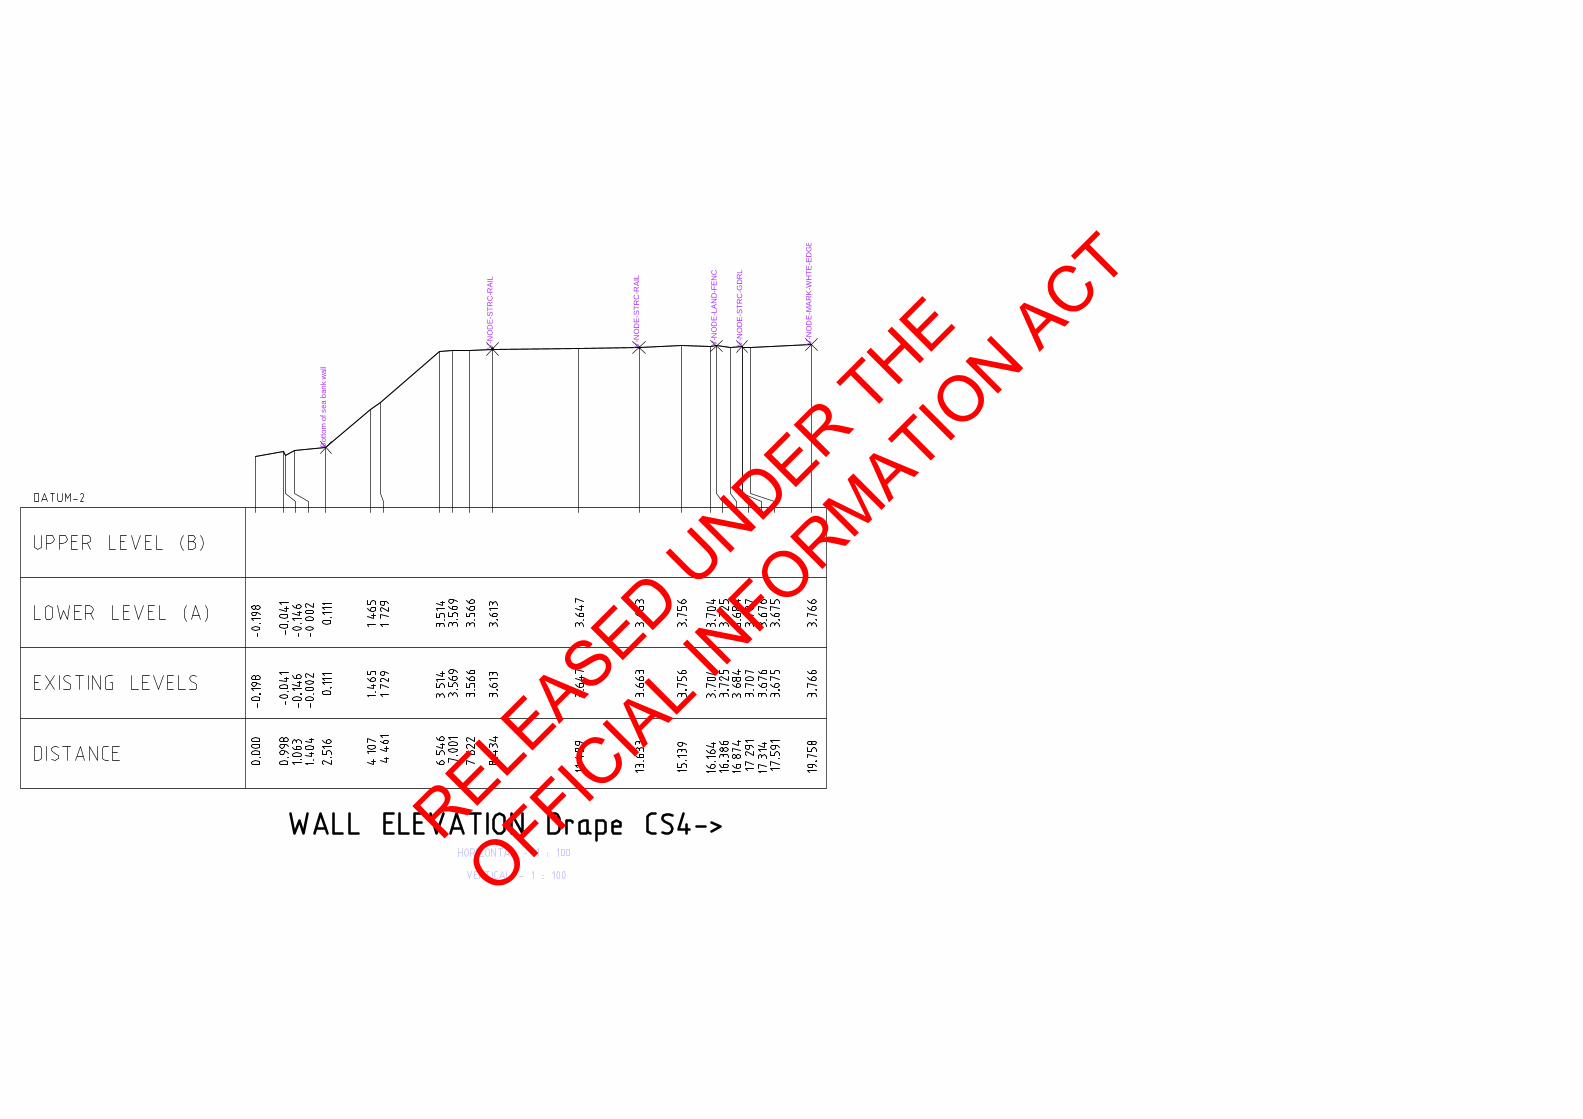
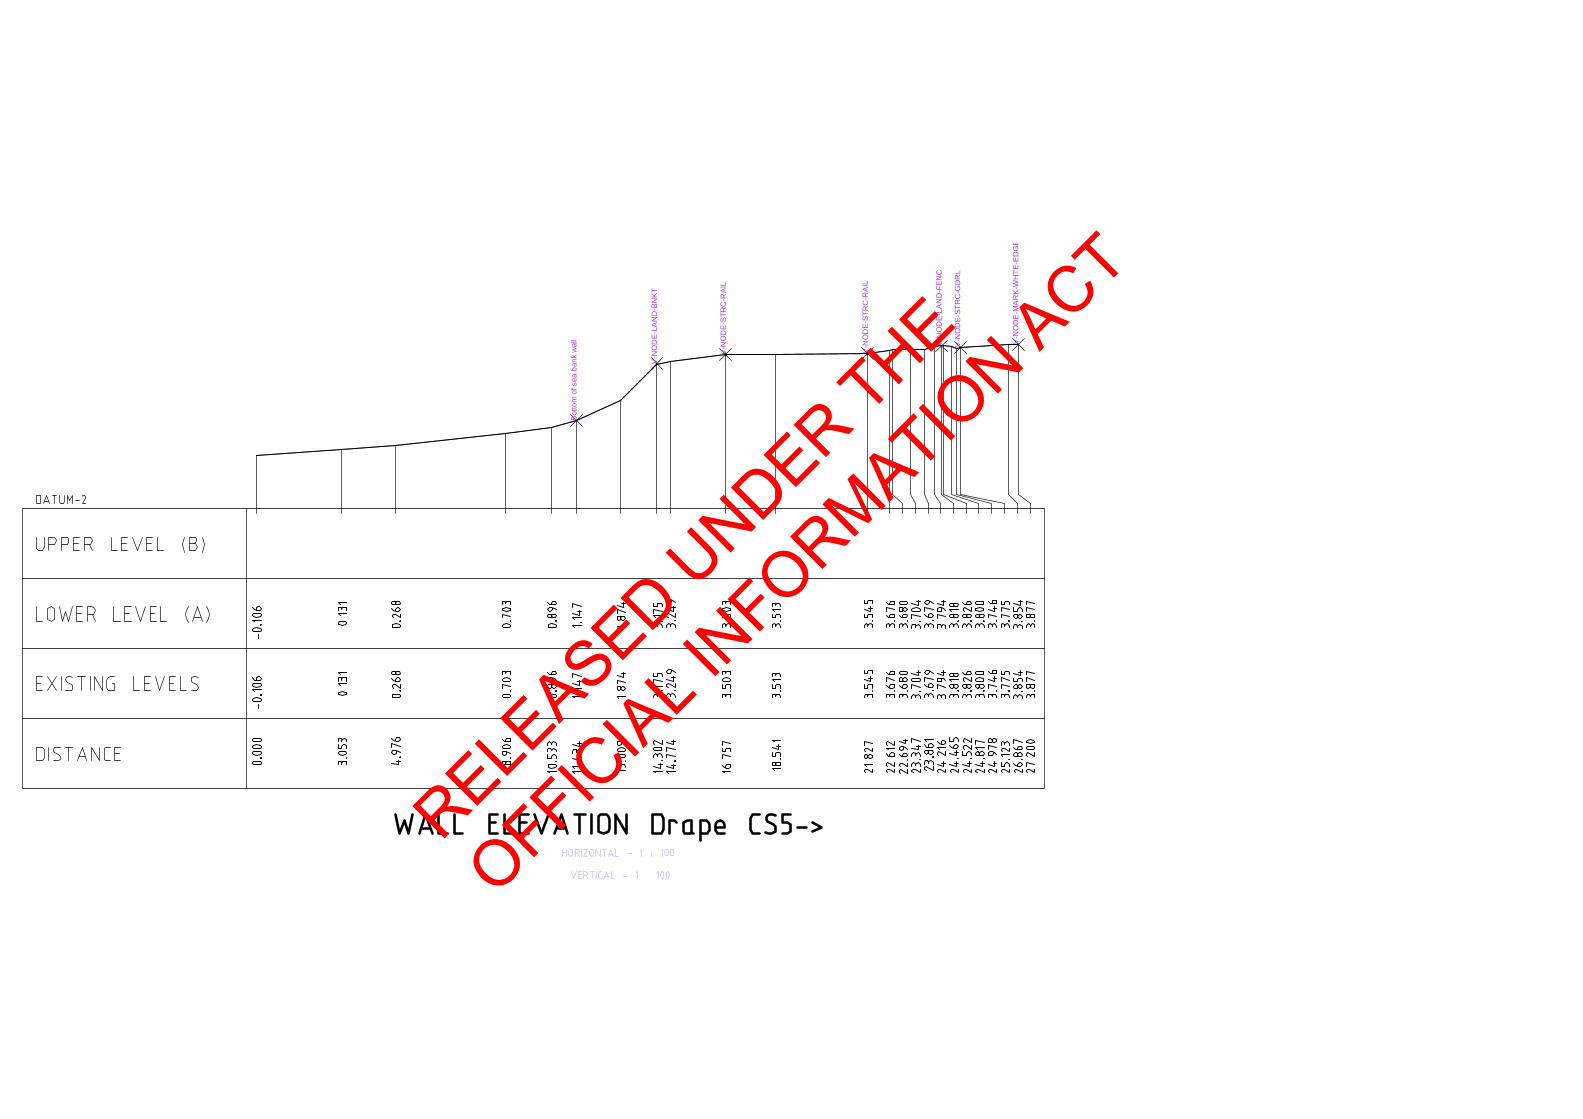
Cross-sections from GPS Survey
RELEASED U
NDER THE
OFFICIA
L INFORMATIO
N ACT

RELEASED U
NDER THE
OFFICIA
L INFORMATIO
N ACT
V-N
OD
E-L
AN
D-F
EN
C
V-N
OD
E-M
AR
K-W
HTE
-ED
GE
V-N
OD
E-ST
RC
-GD
RL
V-N
OD
E-S
TRC
-RA
IL
V-N
OD
E-S
TRC
-RA
IL
Bot
tom
of s
ea b
ank
wal
lRELE
ASED UNDER THE
OFFICIA
L INFORMATIO
N ACT
V-N
OD
E-L
AN
D-F
EN
C
V-N
OD
E-M
AR
K-W
V-N
OD
E-S
TRC
-
V-N
OD
E-S
TRC
-RA
IL
V-N
OD
E-S
TRC
-RA
IL
Bot
tom
of s
ea b
ank
wal
l
RELEASED U
NDER THE
OFFICIA
L INFORMATIO
N ACT
V-N
OD
E-L
AN
D-F
EN
C
V-N
OD
E-M
AR
K-W
HTE
-ED
GE
V-N
OD
E-ST
RC
-GD
RL
V-N
OD
E-S
TRC
-RA
IL
V-N
OD
E-S
TRC
-RA
IL
Bot
tom
of s
ea b
ank
wal
l
RELEASED U
NDER THE
OFFICIA
L INFORMATIO
N ACT
V-N
OD
E-L
AN
D-F
EN
C
V-N
OD
E-M
AR
K-W
HTE
-ED
GE
V-N
OD
E-ST
RC
-GD
RL
V-N
OD
E-S
TRC
-RA
IL
V-N
OD
E-S
TRC
-RA
IL
Bot
tom
of s
ea b
ank
wal
l
RELEASED U
NDER THE
OFFICIA
L INFORMATIO
N ACT
V-N
OD
E-L
AN
D-B
NK
T
V-N
OD
E-L
AN
D-F
EN
C
V-N
OD
E-M
AR
K-W
HTE
-ED
GE
V-N
OD
E-ST
RC
-GD
RL
V-N
OD
E-S
TRC
-RA
IL
V-N
OD
E-S
TRC
-RA
IL
Bot
tom
of s
ea b
ank
wal
l
RELEASED U
NDER THE
OFFICIA
L INFORMATIO
N ACT

V-N
OD
E-L
AN
D-B
NK
T
V-N
OD
E-L
AN
D-F
EN
C
V-N
OD
E-M
AR
K-W
HTE
-ED
GE
V-N
OD
E-ST
RC
-GD
RL
V-N
OD
E-S
TRC
-RA
IL
V-N
OD
E-S
TRC
-RA
IL
Bot
tom
of s
ea b
ank
wal
l
RELEASED U
NDER THE
OFFICIA
L INFORMATIO
N ACT

V-N
OD
E-L
AN
D-B
NK
T
V-N
OD
E-L
AN
D-F
EN
C
V-N
OD
E-M
AR
K-W
HTE
-ED
GE
V-N
OD
E-ST
RC
-GD
RL
V-N
OD
E-S
TRC
-RA
IL
V-N
OD
E-S
TRC
-RA
IL
Bot
tom
of s
ea b
ank
wal
l
RELEASED U
NDER THE
OFFICIA
L INFORMATIO
N ACT

Revision 0 – 12-May-2014 Prepared for – New Zealand Transport Agency – Co No.: N/A
Wellington to Hutt Valley Walking and Cycling Link New Zealand Transport Agency 12-May-2014
W2HVlink Field Investigations Geotechnical Interpretive Report
RELEASED U
NDER THE
OFFICIA
L INFORMATIO
N ACT

AECOM Wellington to Hutt Valley Walking and Cycling Link W2HVlink Field Investigations – Geotechnical Interpretive Report
Revision 0 – 12-May-2014 Prepared for – New Zealand Transport Agency – Co No.: N/A
W2HVlink Field Investigations Geotechnical Interpretive Report
Client: New Zealand Transport Agency
Co No.: N/A
Prepared by AECOM New Zealand Limited Level 7, 13-27 Manners Street, Wellington 6011, PO Box 27277, Wellington 6141, New Zealand T +64 4 382 2999 F +64 4 382 2998 www.aecom.com
12-May-2014
Job No.: 60306339
AECOM in Australia and New Zealand is certified to the latest version of ISO9001, ISO14001, AS/NZS4801 and OHSAS18001.
© AECOM New Zealand Limited (AECOM). All rights reserved.
AECOM has prepared this document for the sole use of the Client and for a specific purpose, each as expressly stated in the document. No other party should rely on this document without the prior written consent of AECOM. AECOM undertakes no duty, nor accepts any responsibility, to any third party who may rely upon or use this document. This document has been prepared based on the Client’s description of its requirements and AECOM’s experience, having regard to assumptions that AECOM can reasonably be expected to make in accordance with sound professional principles. AECOM may also have relied upon information provided by the Client and other third parties to prepare this document, some of which may not have been verified. Subject to the above conditions, this document may be transmitted, reproduced or disseminated only in its entirety." ""
RELEASED U
NDER THE
OFFICIA
L INFORMATIO
N ACT

RELEASED U
NDER THE
OFFICIA
L INFORMATIO
N ACT

AECOM Wellington to Hutt Valley Walking and Cycling Link W2HVlink Field Investigations – Geotechnical Interpretive Report
Revision 0 – 12-May-2014 Prepared for – New Zealand Transport Agency – Co No.: N/A
Table of Contents Executive Summary i 1.0 Introduction 1 2.0 Site Description and Geological Setting 1
2.1 Site Description 1 2.2 Distance Reference 2 2.3 Geological Setting 2 2.4 Proposed Development 3
3.0 Scope of Investigations 7 3.1 Scope 7 3.2 Desktop Study 7 3.3 Drillholes (DH) 7 3.4 Investigation Pits (TP) 8 3.5 Laboratory Testing 9 3.6 Site Walkover and GPS Survey 9
4.0 Results of Investigations 10 4.1 Desktop Study 10 4.2 Ground Conditions 10 4.3 Groundwater 10 4.4 Hazards 11
5.0 Geotechnical Assessment 13 5.1 Soil Strength Parameters 13 5.2 Groundwater 13 5.3 Seismic Loading 13 5.4 Soil Liquefaction and Seismic Settlement 14 5.5 Lateral Spreading 15 5.6 Stability of Existing Slopes 16
6.0 Proposed Reclamation 17 6.1 General 17 6.2 Tidal Planes 17 6.3 Topography of Sea Bed 17 6.4 Existing Coastal Defence Measures 18 6.5 Proposed Geometry 18 6.6 Coastal Defence Measure Design Considerations 19 6.7 Structural Fill Material Requirements 21 6.8 Rock Armour/Fill Interface 21 6.9 Slope Stability Analysis for Proposed Reclamation Embankment 21
7.0 Construction Issues and Recommendations 22 7.1 Access 22 7.2 Procurement Strategy 23 7.3 Construction Sequencing 24
8.0 Pavement and Railway Track Structure 24 9.0 Limitations 25 10.0 References 25 Appendix A
Location Plan A Appendix B
Investigation Location Plans B Appendix C
Previous Drillhole Core Logs C Appendix D
Drillhole Core Logs and Photographs D Appendix E
Investigation Pit Logs and Photographs E
RELEASED U
NDER THE
OFFICIA
L INFORMATIO
N ACT

AECOM Wellington to Hutt Valley Walking and Cycling Link W2HVlink Field Investigations – Geotechnical Interpretive Report
Revision 0 – 12-May-2014 Prepared for – New Zealand Transport Agency – Co No.: N/A
Appendix F Laboratory Test Reports F
Appendix G Site Walkover Observations and Photographs G
Appendix H Liquefaction Analysis H
Appendix I Proposed Preliminary Reclamation Cross-section I
Appendix J Slope Stability Analysis J
List of Tables
Table 1 Option 1 Proposed Civil Works 5 Table 2 Option 3 Proposed Works 5 Table 3 Existing Shoreline Extensions 6 Table 4 Summary of Drillholes 8 Table 5 Summary of Inspection Pits 8 Table 6 Summary of Laboratory Testing 9 Table 7 Geotechnical Units along Proposed Reclamation Area (From Drillhole Investigations) 10 Table 8 Geotechnical Design Parameters 13 Table 9 Importance Level of Assets along the W2HVlink Project Area 13 Table 10 Geotechnical Design Seismic Loading 14 Table 11 Seismic Induced Soil Densification and Ground Surface Settlement 15 Table 12 Tidal Plane Elevation for Wellington Harbour 17 Table 13 Significant Design Wave Height 20 Table 14 Slope Stability Analysis Results 22 Table 15 Transport Options 24 Table 16 CBR Values 24
List of Figures
Figure 1 View of the Existing Transport Corridor (Courtesy of Google Earth® imagery) 2 Figure 2 Extract of Geological Map (Begg & Mazengarb, 1996) 3 Figure 3 Schematic Layout of Retaining Wall Arrangement for Option 1 (locations detailed in
Table 1) 4 Figure 4 Schematic Cross-section of Option 1 Reclamation Area (between chainages 3,500 and
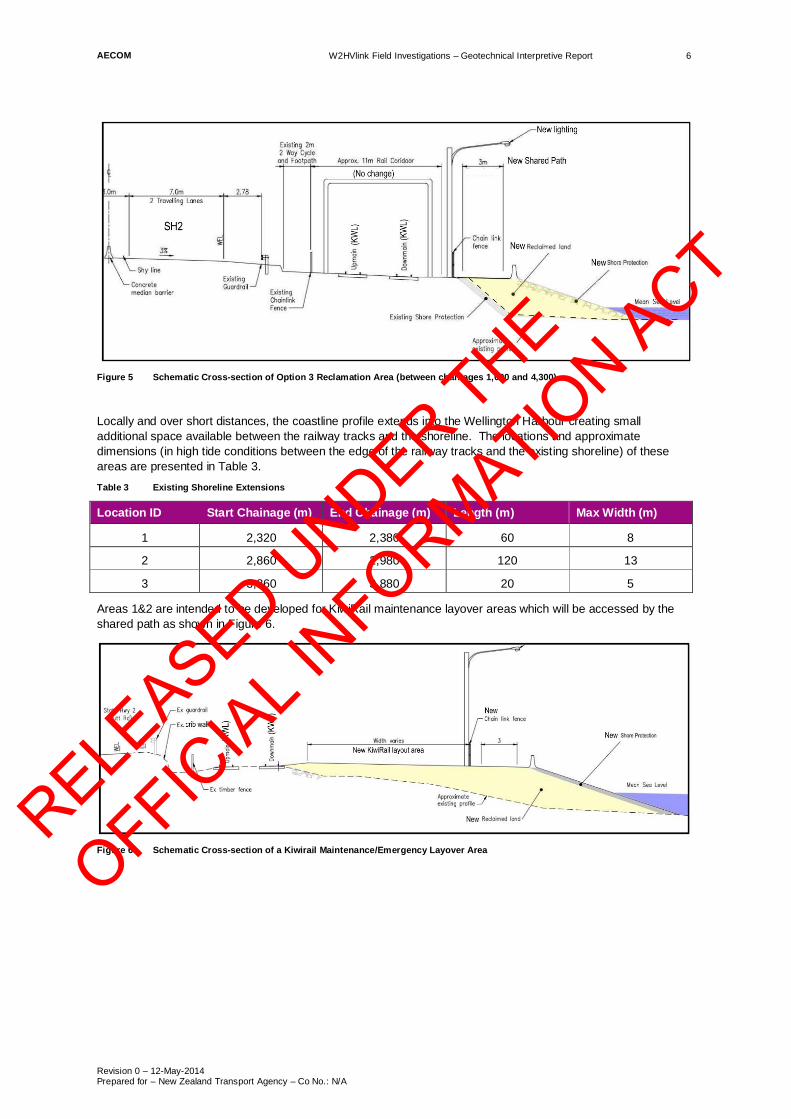
4,300 approximately) 4 Figure 5 Schematic Cross-section of Option 3 Reclamation Area (between chainages 1,000 and
4,300) 6 Figure 6 Schematic Cross-section of a Kiwirail Maintenance/Emergency Layover Area 6 Figure 7 Schematic Representations of Ground Conditions (chainage 3,800 approx) 11 Figure 8 Evidence of Slope Instability along the Existing SH2 Alignment 12 Figure 9 Effects of Liquefaction and Lateral Spreading on Reclaimed Land 12 Figure 10 Extract from Wellington Harbour Depth Map with Approximate Project Reclamation Area
(Option 3) 17 Figure 11 Existing Coastal Protection Measures 18 Figure 12 Location of Prediction Model for SWH 19 Figure 13 Graph of the Significant Wave Height vs Exceedance (from NIWA study) 20 Figure 14 Access from Ngauranga Gorge End for Option 3 Reclamation 22 Figure 15 Access from Petone End for Options 1&3 Reclamation 23
RELEASED U
NDER THE
OFFICIA
L INFORMATIO
N ACT

AECOM Wellington to Hutt Valley Walking and Cycling Link W2HVlink Field Investigations – Geotechnical Interpretive Report
Revision 0 – 12-May-2014 Prepared for – New Zealand Transport Agency – Co No.: N/A
i
Executive Summary AECOM was engaged by NZTA to carry out site investigations to provide geotechnical data for feasibility engineering design for the Wellington to Hutt Valley walking/cycling link (W2HVlink). The project includes upgrading of the existing cycling and pedestrian facilities between Ngauranga Gorge and Petone 5km north-east of Wellington. In this area the existing cycleway is located along a transport corridor which includes SH2 and the KiwiRail Wairarapa Line and offers a poor level of service as it is incomplete, of insufficient width and poorly maintained, with poor drainage and flood susceptibility with uneven and cracked surfacing.
Following an early option assessment two options are currently being considered to provide sufficient space for an upgraded cycle path.
- Option 1 (Existing Shared Path Improvement) - Widening and general improvement of the existing cycleway and creation of a new cycleway path where the facility currently does not exist, achieved through reclamation of an approximate 800m length of Wellington Harbour shoreline.
- Option 3 (Seaward Side Shared Path) - Creation of a new seaward cycleway path on reclaimed land. The path will also be used by KiwiRail to improve access to the railway tracks for maintenance and emergency vehicles. Reclamation in Wellington Harbour would extend along an approximate 3.3km length of shoreline which includes the reclamation area for option 1. A cycle and pedestrian bridge crossing over the railway is required.
Geotechnical investigations including machine drillholes, investigation pits, laboratory testing on recovered samples, a site walkover and a GPS survey were carried out between December 2013 and February 2014. This geotechnical interpretive report presents the results of a desktop study, analysis of field investigations results and laboratory testing. It also includes a geological interpretation of the results and provides design parameters for land reclamation design in the study area.
The transport corridor between Ngauranga Gorge and Petone is located on a relatively narrow bench underlain by a wave-cut shore platform that was uplifted during the 1855 Wairarapa earthquake. Numerous faults are mapped in the area, with the mapped trace of the Wellington Fault in Wellington Harbour, running 100m to 500m to the east of the coastline. Rakaia terrane greywacke underlies the area and forms the steep ranges west of the corridor. Overlying the shore platform is a cover of debris comprising colluvium eroded from the steep slopes of the ranges mixed with coarse alluvial fan sediment. Coarse reclamation fill was placed over the cover of colluvium and alluvium to create the present surface on which the road and rail are located.
Fill material generally comprises loose to medium dense sandy silty gravel with some clay and minor cobbles. The colluvium and alluvial fan deposits include dense to very dense sandy gravel. These deposits overlie fault-affected (brecciated) weak greywacke rock. A gently sloping layering of the above units can be inferred from the investigations, with the depth below road surface to the base of each unit relatively consistent (4 to 6m) at the Petone end. At the Ngauranga end, where the reclamation fill is mapped as extending further into the harbour, the base of colluvium/alluvium is at a greater depth of 13m.
The geotechnical assessment identifies liquefaction, lateral spreading and slope instability of the existing and proposed reclamation fill as possible site risks for the design earthquake (1000 year return period). Liquefaction-induced settlement of 75mm could develop at the Ngauranga Gorge end where the reclamation fill thickness is greater. Additional survey and bathymetry data is required to enable detailed assessment of this area where construction of a bridge is proposed.
Recent failure of the existing rock armour following the June 2013 storm event indicates that adequately designed coastal protection measures will be critical for the stability of the proposed reclamation. A double rock armour layer is considered the most cost-effective solution for the wave and wind conditions inside Wellington Harbour. Preliminary design based on a design wave height of 1.9m (1000 return period) indicates that a 2H:1V slope with double rock armour of indicative diameter of 0.57m (500kg approximately) will be required. Use of a filter rock layer and high-strength geotextile are also recommended. Material requirements for the reclamation structural fill include low fines content granular fill-material placed with low compaction demand and suitable for underwater placement.
At this stage the main issues for reclamation construction are material sourcing and transport to site. It is expected that the larger diameter and durable rock armour elements will have to be sourced from locations across New Zealand and transport options should be carefully planned. Access to site is constrained by the corridor geometry. Reclamation operations (including rock armour placement) will most likely need to be carried out in short sections to minimise temporary erosion exposure during construction.
Pavement and rail track foundation structure design is beyond the scope of this report. However, CBR values from site investigations and laboratory testing are provided for preliminary design purposes.
RELEASED U
NDER THE
OFFICIA
L INFORMATIO
N ACT

AECOM W2HVlink Field Investigations – Geotechnical Interpretive Report
Revision 0 – 12-May-2014 Prepared for – New Zealand Transport Agency – Co No.: N/A
1
1.0 Introduction AECOM New Zealand Limited (AECOM) was engaged by the New Zealand Transport Agency (NZTA) to carry out site investigations to provide geotechnical data for feasibility engineering design for the Wellington to Hutt Valley walking cycling link (W2HVlink) project.
A critical part of the W2HVlink project involves the upgrading of the existing cycling and pedestrian facilities between Ngauranga Gorge and Petone north-east of Wellington, hereafter identified as the study area. Other areas of the W2HVlink have not been investigated and are not addressed by this report. In the study area the existing cycleway is located between State Highway 2 (SH2) and the KiwiRail Wairarapa Line (KWL) and offers a poor level of service as it is incomplete, of insufficient width and poorly maintained, with poor drainage and flood susceptibility with uneven and cracked surfacing.
As part of the W2HVlink project the following two options are currently being considered to provide sufficient space for an upgraded cycle path between Ngauranga Gorge and Petone. Other options have been previously discarded and are not considered for this report.
- Option 1 (Existing Shared Path Improvement) - Widening and general improvement of the existing cycleway and creation of a new cycleway path where the facility currently does not exist, achieved through reclamation of an approximate 800m length of Wellington Harbour shoreline.
- Option 3 (Seaward Side Shared Path) - Creation of a new seaward cycleway path on reclaimed land. The path will also be used by KiwiRail to improve access to the railway tracks for maintenance and emergency vehicles. Reclamation in Wellington Harbour would extend along an approximate 3.3km length of shoreline which includes the reclamation area for option 1. A cycle and pedestrian bridge crossing over the railway is required.
Site investigations including machine drillholes, investigation pits, a site walkover and a GPS survey were carried out between December 2013 and February 2014. This geotechnical interpretive report presents the results of a desktop study, analysis of field investigations results and laboratory testing. It also includes a geological interpretation of the results and provides design parameters for land reclamation design in the study area.
This report does not address upgrading works for the W2HVlink outside of the study area. Any planned improvements and/or modifications of SH2 which may or may not impact on the project are also not addressed. Design of the railway track formation structure is also beyond the scope of this report.
The field work included some investigations undertaken jointly with the NZTA Petone to Grenada Link Road project (P2G) undertaken by Opus International Consultants Ltd (Opus). The investigations applicable to both projects are located in an area where the two projects overlap and the investigation data will be shared. Some of the investigations have not been completed at the time of writing and will be included in a future revision of this report.
2.0 Site Description and Geological Setting
2.1 Site Description The W2HVlink project area extends along a 5km section of SH2, 5km north-east of Wellington CBD, between the existing SH1/SH2 interchange at Ngauranga Gorge to approximately 200m east of the Petone SH2 interchange. A location plan is provided in Appendix A.
Through this area the highway runs along a narrow transport corridor set between the north-western shoreline of Wellington Harbour and steep hills uplifted by the Wellington Fault. In addition to the highway and the existing but incomplete cycleway, the transport corridor includes the KWL which is located between SH2 and the shoreline.
Figure 1 provides an aerial oblique view of the transport corridor in an area where the cycleway currently exists.
RELEASED U
NDER THE
OFFICIA
L INFORMATIO
N ACT

AECOM W2HVlink Field Investigations – Geotechnical Interpretive Report
Revision 0 – 12-May-2014 Prepared for – New Zealand Transport Agency – Co No.: N/A
2
Figure 1 View of the Existing Transport Corridor (Courtesy of Google Earth® imagery)
The corridor is approximately 40m wide developing from the toe of the existing hills to the existing shoreline on the sea side of the railway line. Locally the corridor width extends up to 100m as the hill toe moves away from the current shoreline. The topography of the transport corridor is relatively flat. Reclamation was carried out to adapt the natural shoreline to the geometric requirements of motorway and railway alignments. The railway line is set directly behind the crest of the existing reclamation embankment with little to no available residual space on the sea side. Along the study area the edge of existing reclamation elevation varies between 3 and 4m above mean sea level. Existing rock armour and seawall currently protect the railway embankment from wave action from the Wellington Harbour.
The existing cycleway is incomplete, with an approximately 800m long section missing towards the north-east end of the study area, between the end of the existing cycleway and the existing SH2 interchange at Petone. In this area cyclists currently ride on SH2 shoulder where pedestrians are not allowed.
2.2 Distance Reference For ease of location along the project area, the current project chainage has been used to identify the location of the investigations and easily recognisable landmarks such as KWL traction poles. The chainage zero point is located at the south-west (Ngauranga Gorge, existing SH1/SH2 interchange) end of the study area. Petone interchange is at chainage 4,800 approximately. The north-east end of the study area is located at chainage 5,000.
2.3 Geological Setting The transport corridor between Ngauranga Gorge and Petone is located on a relatively narrow bench underlain by a wave-cut shore platform that was uplifted by approximately one metre during the 1855 Wairarapa earthquake. Uplift improved what was prior to the faulting event a narrow and low-lying access to the Hutt Valley.
Rakaia terrane greywacke underlies the area (Figure 2, Begg & Mazengarb, 1996) and forms the steep ranges west of the corridor. The eastern (seaward) margin of the ranges is defined by steep slopes of the eroded scarp of the NE/SW oriented Wellington Fault. The mapped trace of the fault is in Wellington Harbour, 100m to 500m to the east of the coastline. Activity on the fault has been predominantly right lateral strike-slip (i.e., horizontal) movement, with a lesser magnitude of vertical displacement (mainly downthrown to the east although there reportedly has been some reverse movement). Erosion of the upthrown (western) side of the fault has caused regression of the scarp to its present position a few hundred metres from the fault location. Wellington Fault is classed as active and one of New Zealand’s major faults.
Overlying the shore platform is a cover of debris comprising colluvium eroded from the steep slopes of the ranges mixed with coarse alluvial fan sediment deposited by the short, steep streams originating in the ranges. Coarse reclamation fill was placed over the cover of colluvium and alluvium to create the present surface on which the road and rail corridor is located. A greater surface of fill is mapped at the south-western end of the study area.
Rakaia terrane greywacke comprises bedded, strong sandstone and siltstone that generally is closely jointed and veined. Given the proximity of Wellington Fault, the rock underlying the site is likely to be in places sheared and crushed forming fault breccia. Where exposed elsewhere, fault breccia commonly is annealed (re-cemented).
Wellington Harbour
Existing cycleway
Wairarapa Line
Rock Armour
SH2
NE view towards Petone Interchange
RELEASED U
NDER THE
OFFICIA
L INFORMATIO
N ACT

AECOM W2HVlink Field Investigations – Geotechnical Interpretive Report
Revision 0 – 12-May-2014 Prepared for – New Zealand Transport Agency – Co No.: N/A
3
Figure 2 Extract of Geological Map (Begg & Mazengarb, 1996)
2.4 Proposed Development 2.4.1 General
The proposed cycleway and pedestrian path upgrading options are detailed in the following sections. Following a previous assessment Options 1 & 3 only have been considered
2.4.2 Option 1 – Existing Shared Path Improvement
The existing path improvement option includes widening, drainage improvement and resurfacing of the existing path between chainages 0 and 3,500, i.e. approximately to where the existing cycleway ends. At three locations along the existing alignment the level of SH2 carriageway is higher than the adjacent cycleway and crib walls are in place to support the road edge. Widening of the cycleway path will require:
- Construction of new retaining walls closer to the road as illustrated in Figure 3 to accommodate the path widening works. The maximum height of the walls is 1.5m, with typical heights less than 1.0m as indicated in Table 1 along with the indicative length of the proposed retaining wall sections. In-between these sections widening of the existing path does not require retaining structure as the levels of SH2 and the existing path are similar.
1.5km 0m 3km
Ngauranga Gorge interchange (chainage 0m)
Petone interchange (chainage 4800m)
Project Study Area
RELEASED U
NDER THE
OFFICIA
L INFORMATIO
N ACT
AECOM W2HVlink Field Investigations – Geotechnical Interpretive Report
Revision 0 – 12-May-2014 Prepared for – New Zealand Transport Agency – Co No.: N/A
4
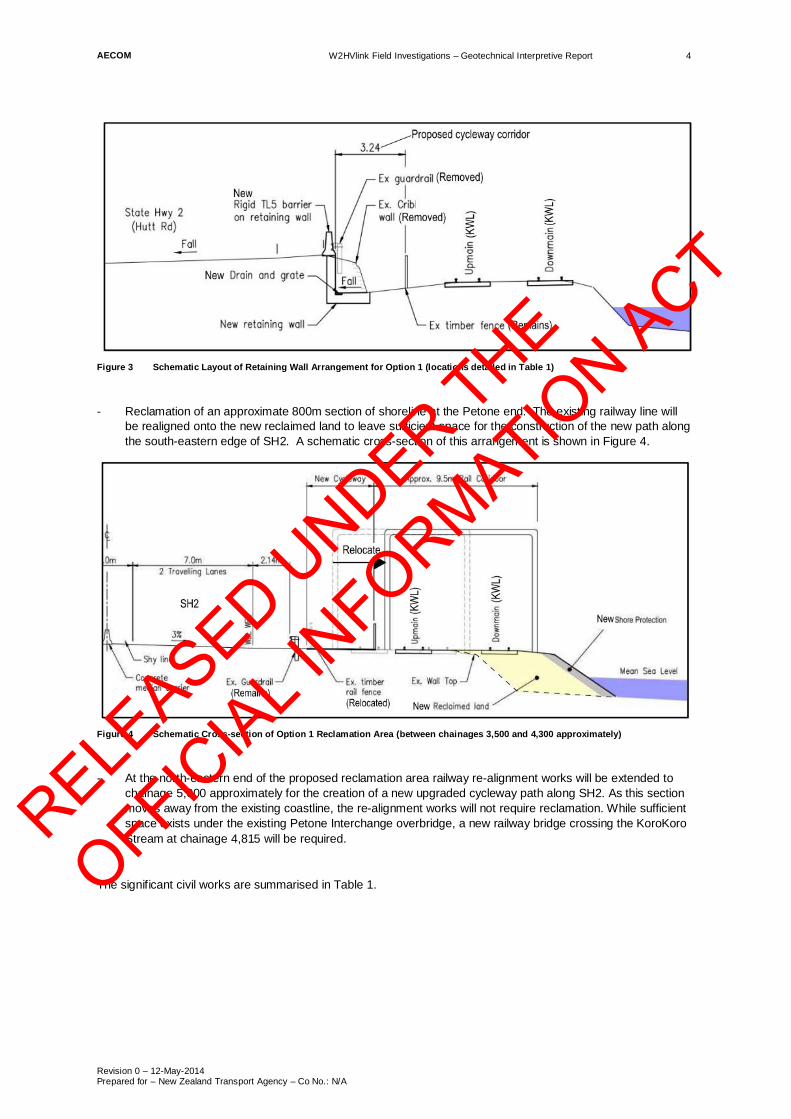
Figure 3 Schematic Layout of Retaining Wall Arrangement for Option 1 (locations detailed in Table 1)
- Reclamation of an approximate 800m section of shoreline at the Petone end. The existing railway line will be realigned onto the new reclaimed land to leave sufficient space for the construction of the new path along the south-eastern edge of SH2. A schematic cross-section of this arrangement is shown in Figure 4.
Figure 4 Schematic Cross-section of Option 1 Reclamation Area (between chainages 3,500 and 4,300 approximately)
- At the north-eastern end of the proposed reclamation area railway re-alignment works will be extended to chainage 5,000 approximately for the creation of a new upgraded cycleway path along SH2. As this section moves away from the existing coastline, the re-alignment works will not require reclamation. While sufficient space exists under the existing Petone Interchange overbridge, a new railway bridge crossing the KoroKoro Stream at chainage 4,815 will be required.
The significant civil works are summarised in Table 1.
RELEASED U
NDER THE
OFFICIA
L INFORMATIO
N ACT
AECOM W2HVlink Field Investigations – Geotechnical Interpretive Report
Revision 0 – 12-May-2014 Prepared for – New Zealand Transport Agency – Co No.: N/A
5
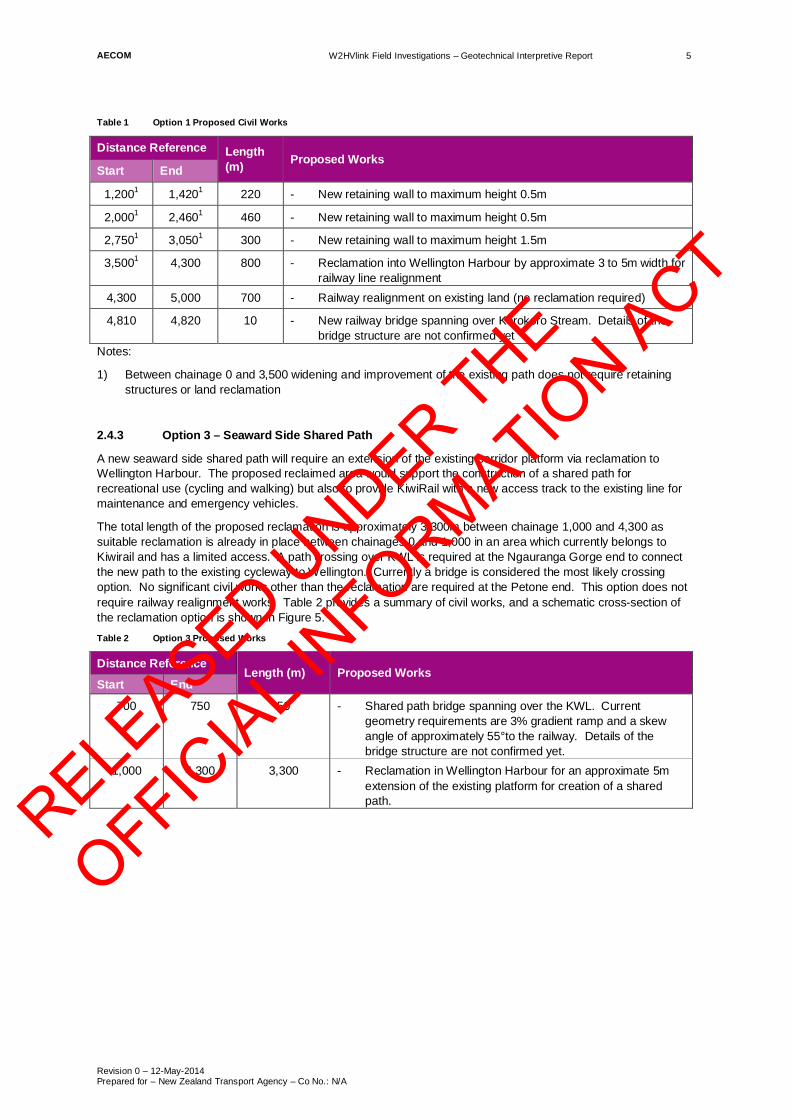
Table 1 Option 1 Proposed Civil Works
Distance Reference Length (m) Proposed Works
Start End
1,2001 1,4201 220 - New retaining wall to maximum height 0.5m
2,0001 2,4601 460 - New retaining wall to maximum height 0.5m
2,7501 3,0501 300 - New retaining wall to maximum height 1.5m
3,5001 4,300 800 - Reclamation into Wellington Harbour by approximate 3 to 5m width for railway line realignment
4,300 5,000 700 - Railway realignment on existing land (no reclamation required)
4,810 4,820 10 - New railway bridge spanning over Korokoro Stream. Details of the bridge structure are not confirmed yet
Notes:
1) Between chainage 0 and 3,500 widening and improvement of the existing path does not require retaining structures or land reclamation
2.4.3 Option 3 – Seaward Side Shared Path
A new seaward side shared path will require an extension of the existing corridor platform via reclamation to Wellington Harbour. The proposed reclaimed area would support the construction of a shared path for recreational use (cycling and walking) but also to provide KiwiRail with a new access track to the existing line for maintenance and emergency vehicles.
The total length of the proposed reclamation is approximately 3,300m between chainage 1,000 and 4,300 as suitable reclamation is already in place between chainages 0 and 1,000 in an area which currently belongs to Kiwirail and has a limited access. A path crossing over KWL is required at the Ngauranga Gorge end to connect the new path to the existing cycleway to Wellington. Currently a bridge is considered the most likely crossing option. No significant civil works other than the reclamation are required at the Petone end. This option does not require railway realignment works. Table 2 provides a summary of civil works, and a schematic cross-section of the reclamation option is shown in Figure 5. Table 2 Option 3 Proposed Works
Distance Reference Length (m) Proposed Works
Start End
700 750 50 - Shared path bridge spanning over the KWL. Current geometry requirements are 3% gradient ramp and a skew angle of approximately 55°to the railway. Details of the bridge structure are not confirmed yet.
1,000 4,300 3,300 - Reclamation in Wellington Harbour for an approximate 5m extension of the existing platform for creation of a shared path.
RELEASED U
NDER THE
OFFICIA
L INFORMATIO
N ACT
AECOM W2HVlink Field Investigations – Geotechnical Interpretive Report
Revision 0 – 12-May-2014 Prepared for – New Zealand Transport Agency – Co No.: N/A
6
Figure 5 Schematic Cross-section of Option 3 Reclamation Area (between chainages 1,000 and 4,300)
Locally and over short distances, the coastline profile extends into the Wellington Harbour creating small additional space available between the railway tracks and the shoreline. The locations and approximate dimensions (in high tide conditions between the edge of the railway tracks and the existing shoreline) of these areas are presented in Table 3.
Table 3 Existing Shoreline Extensions
Location ID Start Chainage (m) End Chainage (m) Length (m) Max Width (m)
1 2,320 2,380 60 8
2 2,860 2,980 120 13
3 3,860 3,880 20 5
Areas 1&2 are intended to be developed for KiwiRail maintenance layover areas which will be accessed by the shared path as shown in Figure 6.
Figure 6 Schematic Cross-section of a Kiwirail Maintenance/Emergency Layover Area
RELEASED U
NDER THE
OFFICIA
L INFORMATIO
N ACT
AECOM W2HVlink Field Investigations – Geotechnical Interpretive Report
Revision 0 – 12-May-2014 Prepared for – New Zealand Transport Agency – Co No.: N/A
7
3.0 Scope of Investigations
3.1 Scope The scope of the field investigations comprised the following:
- Desktop study of published geological and topographical maps and analysis of available geotechnical information;
- 6 machine cored drillholes (DH);
- 4 mechanically excavated investigation pits (TP);
- Laboratory testing on retrieved samples; and
- Site walkover and GPS survey of the current shoreline and intertidal area along the missing cycleway section (chainage 3,500 to 4,300).
Results from all of these works are presented in this report. Location plans of site investigations are presented in Appendix B. Coordinates for investigation points were measured using the NZ Transverse Mercator 2000 (NZTM2000). Reduced levels are in terms of Mean Sea Level 1953.
3.2 Desktop Study 3.2.1 Geotechnical Information
The desktop study included review of available geotechnical information from projects in the same area. This information was used to scope field investigation. Site investigations in the Petone interchange area were coordinated with Opus to optimise the locations, as Opus is providing design services to NZTA for the P2G project. The P2G project includes the construction of a new road interchange approximately 200m east of the existing one. Available geotechnical information includes geotechnical investigations completed for the following works on SH2:
- Petone existing overbridge (Works Consultancy, 1992). Investigations include 2 drillholes (BH1 & BH2) to 11.15 and 7.15m depth respectively; and
- Melling-Petone Upgrade (Beca, 1998). 2 drillholes (P1 & P2) to 10.0 and 9.5m depth respectively. Approximate locations of the above investigations are presented in Appendix B. The relevant drillhole logs are presented in Appendix C. No core log photographs are available for these drillholes.
3.2.2 Other Information
The desktop study also comprised analysis of:
- The published 1:50 000 Wellington geological map (Reference 1)
- Topographical and sea depth map to complete available survey data (References 2&3)
- Historical information and technical papers relating to the study area (Reference 4)
3.3 Drillholes (DH) The locations of the drillholes are shown in Appendix B. The drillholes (excluding DH01, refer Notes to Table 4) were drilled by Griffiths Drilling NZ Ltd between 12 December 2013 and 21 February 2014 using:
- SonicSampDrill CR-F XL-Duo sonic rig for DH02, 03, 04 & 05; and
- HC150 tractor-mounted rig for DH06.
Details of each drillhole are summarised in Table 4.
RELEASED U
NDER THE
OFFICIA
L INFORMATIO
N ACT

AECOM W2HVlink Field Investigations – Geotechnical Interpretive Report
Revision 0 – 12-May-2014 Prepared for – New Zealand Transport Agency – Co No.: N/A
8
Table 4 Summary of Drillholes
DH ID Depth (m) Start Date End Date Location
Coordinates (Eastings, Northings)
Project Chainage RL (m)3
DH01 Refer Note 1
DH02 7.5 19/12/2013 19/12/2013 Near KWL, 50m southwest of rowing clubhouse
1755518, 5434577
4345 3
DH03 10.5 12/12/2013 13/12/2013 SH2 southbound shoulder, opposite Horokiwi Quarry access
1755283, 5434504
4100 3
DH04 8.1 15/12/2013 16/12/2013 SH2 southbound shoulder, 100m south of Horokiwi Quarry access
1755069, 5434388
3850 3
DH05 2.02 16/12/2013 16/12/2013 SH2 southbound shoulder, 15m north of KiwiRail seaward building
1754304, 5433973
2900 3
DH06 13.5 19/02/2014 21/02/2014 Near KWL, approximately 650m north of Ngauranga Station
1752517, 5432596
700 3
Notes:
1) DH01 is a P2N/P2G joint drillhole investigation which has not yet been undertaken. Its proposed location is in the area of the Korokoro stream crossing. Results from DH01 will be included in a future revision of this report.
2) At DH05 location an unknown and undetected (by service location) service was exposed during vacuum excavation at approximately 1.9m depth. The service was not damaged by the vacuum excavation. Machine drilling was not carried out at this location to prevent damage to the service. The hole was backfilled and surface reinstated. A substitute hole was not drilled.
3) A detailed level survey of drillhole locations was not carried out and elevations are approximate.
Standard Penetration Tests (SPTs) were undertaken in soil and weak rock at 1.5m intervals where appropriate. Piezometer were not installed in any of the drillholes. All drillholes were fully cored between SPTs and the core logged, boxed and photographed. All recovered material was logged by an AECOM geotechnical engineer in accordance with the procedures outlined in the NZ Geotechnical Society Guideline “Field Description of Soil and Rock”, December 2005. Drillhole logs and core photographs are presented in Appendix D.
3.4 Investigation Pits (TP) Four investigation pits were dug at the locations shown in Appendix B using a ZAXIS 120 12 tonne excavator. Dynamic Cone Penetrometer (DCP) and downhole hand held Shear Vane tests were carried out at TP locations where appropriate. All recovered material was logged by an AECOM geotechnical engineer in accordance with the procedures outlined in the NZ Geotechnical Society Guideline “Field Description of Soil and Rock”, December 2005. Bulk samples were recovered for laboratory testing. The investigation pits were carried out between 17 December 2013 and 10 February 2014.
Details of each inspection pit are summarised in Table 2. Investigation pit logs and photographs are presented in Appendix E. Pit levels are approximate. Table 5 Summary of Inspection Pits
TP ID Depth (m) Date Location Coordinates
(Eastings, Northings) Project
Chainage RL (m)
TP01 2.2 10/02/2014 50m E of Korokoro Stream Railway Bridge
1756024, 5434683 4870 3
TP02 2.0 17/12/2013 Opposite Water Ski Clubhouse 1755803, 5434676 4620 3
TP03 2.5 17/12/2013 50m NE of Rowing Clubhouse
1755696, 5434647 4450 3
TP04 2.2 17/12/2013 50m SW of Rowing Clubhouse 1755518, 5434577 4350 3
RELEASED U
NDER THE
OFFICIA
L INFORMATIO
N ACT
AECOM W2HVlink Field Investigations – Geotechnical Interpretive Report
Revision 0 – 12-May-2014 Prepared for – New Zealand Transport Agency – Co No.: N/A
9
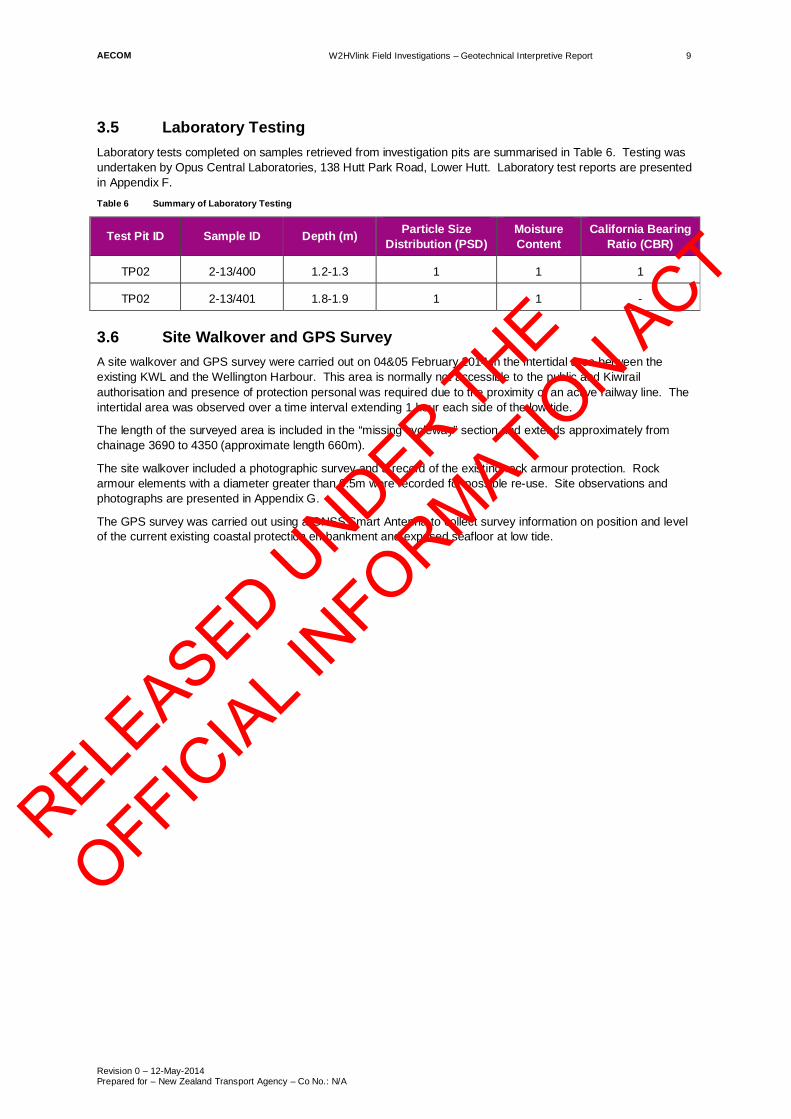
3.5 Laboratory Testing Laboratory tests completed on samples retrieved from investigation pits are summarised in Table 6. Testing was undertaken by Opus Central Laboratories, 138 Hutt Park Road, Lower Hutt. Laboratory test reports are presented in Appendix F.
Table 6 Summary of Laboratory Testing
Test Pit ID Sample ID Depth (m) Particle Size Distribution (PSD)
Moisture Content
California Bearing Ratio (CBR)
TP02 2-13/400 1.2-1.3 1 1 1
TP02 2-13/401 1.8-1.9 1 1 -
3.6 Site Walkover and GPS Survey A site walkover and GPS survey were carried out on 04&05 February 2014 in the intertidal area between the existing KWL and the Wellington Harbour. This area is normally not accessible to the public and Kiwirail authorisation and presence of protection personal was required due to the proximity of an active railway line. The intertidal area was observed over a time interval extending 1 hour each side of the low tide.
The length of the surveyed area is included in the “missing cycleway” section and extends approximately from chainage 3690 to 4350 (approximate length 660m).
The site walkover included a photographic survey and a record of the existing rock armour protection. Rock armour elements with a diameter greater than 0.5m were recorded for possible re-use. Site observations and photographs are presented in Appendix G.
The GPS survey was carried out using a GNSS Smart Antenna to collect survey information on position and level of the current existing coastal protection embankment and exposed seafloor at low tide.
RELEASED U
NDER THE
OFFICIA
L INFORMATIO
N ACT

AECOM W2HVlink Field Investigations – Geotechnical Interpretive Report
Revision 0 – 12-May-2014 Prepared for – New Zealand Transport Agency – Co No.: N/A
10
4.0 Results of Investigations
4.1 Desktop Study 4.1.1 Geological features
The geological setting of the project is described in Section 2.3.
4.1.2 Geotechnical Investigation Information
Information from four drillholes is available from the area of the existing Petone interchange. The drillholes encountered, below a variable thickness of fill (including medium dense silty sandy gravel), a 3.5 to 4.0m thick layer of medium dense gravelly marine and alluvial deposits. Underlying this, slightly weathered greywacke rock was encountered in all holes at an elevation between 2.0m and -2.2m (Datum: Mean Sea Level). Considering the distance between drillhole locations it is estimated that the rock head dips south with a gradient of approximately 1/50.
4.2 Ground Conditions The results of the current investigations along the proposed reclamation area are summarised in Table 7. Generally the material types are as expected based on the geological setting, with a nearly-horizontal layering of reclamation fill material over colluvium and alluvial deposits. These deposits overlie greywacke rock. The greywacke recovered in drillholes is fault-affected (brecciated).
The materials are grouped into four units comprising fill material (Unit 1) overlying mixed colluvium and alluvial fan deposits (Unit 2), over completely weathered (Unit 3) and very closely jointed and sheared (brecciated) slightly weathered greywacke sandstone (Unit 4). A gently sloping layering of these units can be inferred from the investigations, with the level to the base of each unit relatively consistent (4 to 6m) at the north-eastern end. At the south-western end, where the reclamation fill is mapped as extending further into the harbour, the base of Unit 2 (colluvium/alluvium) is at a greater depth of 13m at DH06 location.
Fill material generally comprises loose to medium dense sandy silty gravel with some clay and minor cobbles. The colluvium and alluvial fan deposits include dense to very dense sandy gravel. The recovered rock core indicates a weak rock mass of brecciated (crushed and sheared) fine sandstone (greywacke).
Geotechnical units and their consistency as inferred from uncorrected SPT results are summarised in Table 7. Table 7 Geotechnical Units along Proposed Reclamation Area (From Drillhole Investigations)
Unit Depth to Top of Layer (m)
Thickness (m) Description
SPT (‘N’ value)
Range Typical
1 0 3.0 – 6.65 Reclamation fill, comprising loose to medium dense sandy silty gravel, with some clay and minor cobbles
7 – 28 15
2 3.0 – 6.65 1.0 – 6.35 Reworked colluvium and alluvial fan sediments, comprising dense to very dense sandy gravel with minor silt and clay
19 – 50+ 30
3 5.0 0 -1.0 Completely weathered, extremely weak fine sandstone 50 50
4 4.1 - 13 > 2.1 Slightly weathered, extremely weak, sheared fine sandstone 50+ 50+
Information from DH04 has been compiled into a schematic geological cross-section at chainage 3,800 approximately, as presented in Figure 7.
4.3 Groundwater Groundwater was observed between 2.2 and 2.5m depth in TP01 and TP03 respectively.
RELEASED U
NDER THE
OFFICIA
L INFORMATIO
N ACT

AECOM W2HVlink Field Investigations – Geotechnical Interpretive Report
Revision 0 – 12-May-2014 Prepared for – New Zealand Transport Agency – Co No.: N/A
11
Figure 7 Schematic Representations of Ground Conditions (chainage 3,800 approx)
4.4 Hazards 4.4.1 General
The main identified regional geological hazards along the proposed alignment are listed and briefly discussed in the following sections.
4.4.2 Earthquakes and Ground Shaking
The Wellington area is one of the most seismically active regions of New Zealand. Major historical earthquakes include the 1848 Marlborough and 1855 Wairarapa earthquakes on different faults around the Wellington area. The mapped alignment of the Wellington Fault is roughly parallel to and within 200m distance of the study area. Earthquakes and associated strong ground shaking is therefore to be expected in the area.
The research project “It’s Our Fault”, led by GNS Science (Reference 4), identifies there is a 10% probability of a major rupture of the Wellington Fault within the next 100 years. Such an event would be of a magnitude of about Richter 7.5. The Wellington Fault ruptures on average every 840 years, with the last major rupture around 300 years ago. At the fault line itself, it is anticipated that a Wellington Fault rupture would produce up to 4m to 5m in horizontal ground movement and up to 1m in vertical movement. The Wellington Fault is, however, just one of the many faults that may produce earthquakes affecting the study area.
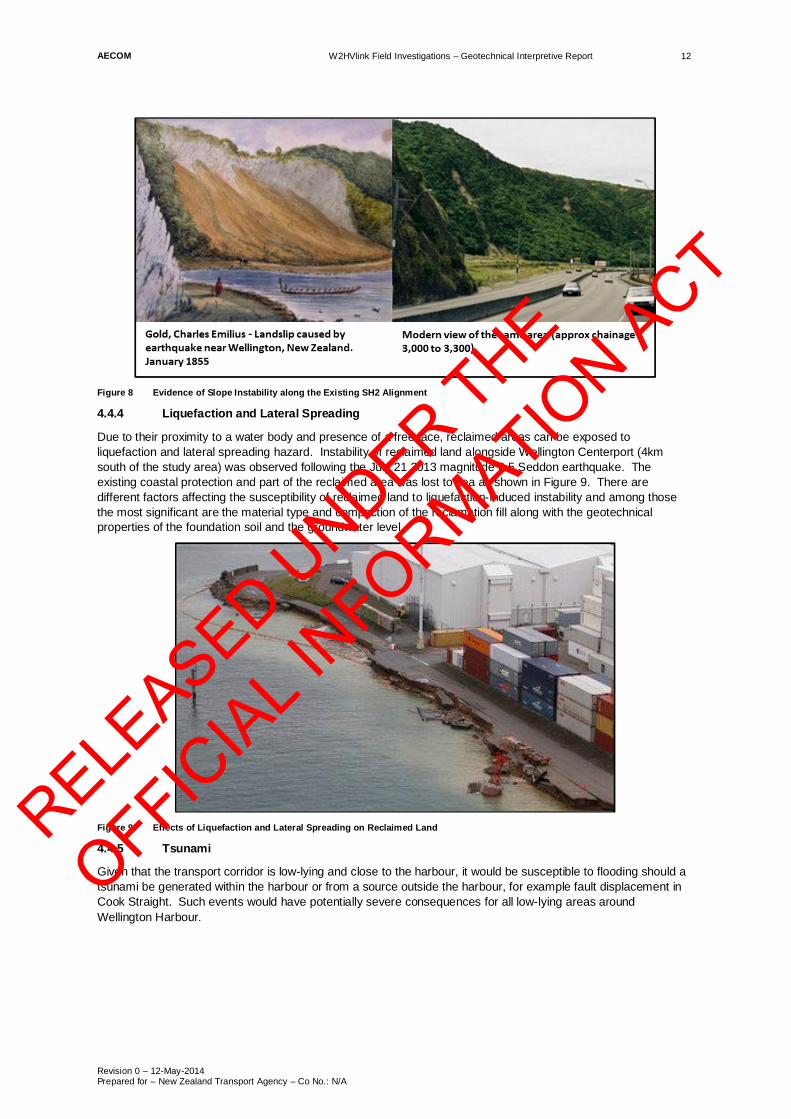
4.4.3 Historical Slope Instability
Evidence of previous instability can be observed in the steep hills north-west of SH2. This may include small scale failures (slips and landslides) triggered by intense rainfall episodes to full size slope failure following strong earthquakes such as the January 23, 1855 magnitude 8.2 Wairarapa earthquake. A 1855 painting and a photograph of the same area today shown in Figure 8 illustrates the size of such an event.
SH2 KWL DH04
20m 0m 40m
RELEASED U
NDER THE
OFFICIA
L INFORMATIO
N ACT
AECOM W2HVlink Field Investigations – Geotechnical Interpretive Report
Revision 0 – 12-May-2014 Prepared for – New Zealand Transport Agency – Co No.: N/A
12
Figure 8 Evidence of Slope Instability along the Existing SH2 Alignment
4.4.4 Liquefaction and Lateral Spreading
Due to their proximity to a water body and presence of a free face, reclaimed areas can be exposed to liquefaction and lateral spreading hazard. Instability of reclaimed land alongside Wellington Centerport (4km south of the study area) was observed following the July 21 2013 magnitude 6.5 Seddon earthquake. The existing coastal protection and part of the reclaimed area was lost to sea as shown in Figure 9. There are different factors affecting the susceptibility of reclaimed land to liquefaction-induced instability and among those the most significant are the material type and compaction of the reclamation fill along with the geotechnical properties of the foundation soil and the groundwater level.
Figure 9 Effects of Liquefaction and Lateral Spreading on Reclaimed Land
4.4.5 Tsunami
Given that the transport corridor is low-lying and close to the harbour, it would be susceptible to flooding should a tsunami be generated within the harbour or from a source outside the harbour, for example fault displacement in Cook Straight. Such events would have potentially severe consequences for all low-lying areas around Wellington Harbour.
RELEASED U
NDER THE
OFFICIA
L INFORMATIO
N ACT

AECOM W2HVlink Field Investigations – Geotechnical Interpretive Report
Revision 0 – 12-May-2014 Prepared for – New Zealand Transport Agency – Co No.: N/A
13
5.0 Geotechnical Assessment
5.1 Soil Strength Parameters Based on the findings of the investigation the strength parameters indicated in Table 8 are recommended for geotechnical design. Table 8 Geotechnical Design Parameters
Soil Unit and Description Unit Weight (kN/m3)
Undrained Parameters
Cu (kPa)
Effective Stress Parameters
c’ (kPa) ’ (°)
1 Existing reclamation fill, comprising loose to medium dense sandy silty gravel, with some clay and minor cobbles
17-18 - 0 30-33
2 Reworked colluvium and alluvial fan sediments, comprising dense to very dense sandy gravel with minor silt and clay
17 - 1 35-37
3 Completely weathered, extremely weak fine sandstone 19 150 5 30
4 Slightly weathered, extremely weak, sheared fine sandstone 22 - 1,500 25
5.2 Groundwater Due to the coastal environment the groundwater level is expected to be closely related to the variation of sea level. The effects of amplitude reduction and lag from the actual sea level are expected to increase moving inland. Along the coastline, a design static groundwater level of 3.0m depth (equivalent to Mean Sea Level) may be assumed for preliminary liquefaction assessment. Design of the reclamation embankment will require consideration of the dynamic nature of sea level variations.
A shallower design groundwater depth (H=2.0m bgl) may be considered in the area of the Petone interchange where groundwater was encountered between 2.2m and 2.5m depth.
5.3 Seismic Loading Seismic design parameters need to be determined for each project element during detailed design. The transport corridor includes different assets with specific importance level as described in NZS 1170.0 (Reference 5) and detailed in Table 9. Table 9 Importance Level of Assets along the W2HVlink Project Area
Asset Owner/Managing Authority Comments Importance Level
SH2 NZTA Key facility for post-disaster recovery 4
Wairarapa Line KiwiRail Important communication facility with high density of users
3
Cycle and pedestrian link (including bridges)
NZTA Recreational facility 2
Buried and overhead services
Various (GWRC, private suppliers)
Includes strategic power or water supply networks
3-4
While different project elements need to be designed according to their specific importance level and required design life, a geotechnical site assessment typically provides an overall assessment of the site. Discussion among the stakeholders is currently undergoing to define the required importance level and consequent serviceability and design loads. For the purpose of this geotechnical assessment the seismic loading (peak ground acceleration) is determined using NZS 1170:5 (Reference 6) with the following inputs:
RELEASED U
NDER THE
OFFICIA
L INFORMATIO
N ACT

AECOM W2HVlink Field Investigations – Geotechnical Interpretive Report
Revision 0 – 12-May-2014 Prepared for – New Zealand Transport Agency – Co No.: N/A
14
Equipment/facility importance level (IL): 2 (TBC)
1170.5:2004 site subsoil soil classification: Class C – shallow soil sites
Spectral shape factor: 1.33 (period, T = 0)
Structure design life: 100 years
Hazard factor, Z: 0.4 (Wellington)
Near fault factor, N (T=0): 1.0
Serviceability Limit State (SLS) earthquake annual probability of exceedance 1/25, Rs = 0.25
Ultimate Limit State (ULS) earthquake annual probability of exceedance 1/1000, Ru = 1.3
Design peak ground accelerations and the performance criteria at serviceability and design levels are presented in Table 10 according to NZS 1170:0 (Reference 5). Table 10 Geotechnical Design Seismic Loading
Earthquake Loading Design Peak Ground Acceleration, PGA (g), at Zero Period (T = 0)
Annual Probability of Exceedance
Design Performance Criteria (Reference 5)
Serviceability Limit State (SLS) 0.133 1/25
The structural and non-structural component do not require repair following the SLS earthquake
Ultimate Limit state (ULS) 0.692 1/1000 Repairable as soon as
reasonably practicable
These PGA are valid for geotechnical analysis only (i.e., liquefaction and slope stability). They may be used for design of retaining structures not structurally related to bridges. For bridge structural design, NZTA Bridge Manual should be considered for evaluation of PGA.
5.4 Soil Liquefaction and Seismic Settlement 5.4.1 General
Liquefaction occurs when cyclic deformations generated by earthquake causes an increase in porewater pressure in lower density sands and silts. When the porewater pressure equals insitu applied pressure, loss in strength occurs (liquefaction) leading to ground deformation and potentially, loss of bearing capacity. The presence of significant porewater pressure within the soil is essential for liquefaction and generally material above the water table is not susceptible to liquefaction. The susceptibility of a soil is a function of particle size distribution, groundwater level, soil density and loading. Liquefaction is a transient effect and strength is regained to some degree following the event as pore water pressures dissipate.
During earthquake shaking, soils particles may dislodge and reorganise into a denser state, whether above or below the groundwater table, though typically effects are more pronounced below the groundwater table. Densification of discrete layers accumulated over the full depth soil profile can result in significant ground surface settlement.
5.4.2 Evaluation
Along most of the study area the relatively shallow depth of the rock layer, along with the density and very coarse grading of the fill and colluvium/alluvium are expected to mitigate the development of liquefaction. However, at both ends of the study area where reclamation further offshore was previously carried out to create the existing Kiwirail land, loose soil conditions were encountered at the base of the fill with low SPT values (7 at DH02 location and 9&11 at DH06).
Liquefaction potential and resulting ground surface settlement under seismic loading has been assessed using liquefaction analysis software LiquefyPro version 5.5 by CivilTech (2007) using SPT data. Data input to the analysis includes:
- Ground conditions and SPT data as per drillholes DH02 and DH06
- Soil fines content based on inferences from soil description
- Groundwater depth at 2.0m
RELEASED U
NDER THE
OFFICIA
L INFORMATIO
N ACT

AECOM W2HVlink Field Investigations – Geotechnical Interpretive Report
Revision 0 – 12-May-2014 Prepared for – New Zealand Transport Agency – Co No.: N/A
15
- Peak seismic ground accelerations as per Table 10, and earthquake magnitude 7.5 as per NZS 1170.5:2004 (Reference 6).
Software outputs are presented in Appendix H for Serviceability (SLS) and Ultimate (ULS) Limit State earthquake loading (Table 10). Table 11 illustrates the calculated liquefaction zone and ground settlement at DH02 and DH06 locations. Table 11 Seismic Induced Soil Densification and Ground Surface Settlement
Location Depth of Liquefiable Layers (m)
Estimated Ground Settlement (mm)
SLS (0.133g) ULS (0.672g)
DH02 (Petone end) 3.0-3.5 <5 35
DH06 (Ngauranga Gorge end) 3.0-6.5 <5 75
5.4.3 Discussion
Liquefaction develops at the base of the existing reclamation fill where it is assumed that compaction of the fill was possibly limited due to underwater placement conditions. At DH02 location the thickness of the liquefiable layer is 0.5m in relatively permeable ground. Water pressure build-up is expected to dissipate rapidly, thus reducing the potential for liquefaction.
Soil liquefaction and free-field ground densification need to be considered in the design of the relevant project elements such as the bridge crossing for Option 3. Effects on the vertical geometry of the railway line are also to be expected with a possible interruption of the traffic.
However, the level of settlement might be considered as acceptable for the design performance criteria discussed in Table 10. Furthermore, it is expected that liquefaction mitigation will be a complex and expensive operation for the existing reclaimed area, especially at DH06 (Ngauranga Gorge) where possible liquefiable soils extend to 6.5m depth.
Effects of liquefaction on slope stability will require more detailed information on the existing reclamation fill geometry as discussed in Section 5.6.2
5.5 Lateral Spreading 5.5.1 General
Lateral spreading of ground can occur over liquefied soil where there is a slope or a ‘free face’, e.g. sea wall, towards which the ground may displace. Lateral spread of the ground occurs under static loading condition (post-earthquake) when the gravitation driving force of the ground due to the slope or free face gradient exceeds the shearing resistance of the liquefied soil. Displacements are greatest towards the free face and diminish with distance back form the free face. Lateral displacements can be highly destructive for infrastructure. Effects can extend 100’s of metres back from the free face. Considering the results of the liquefaction assessment, only the DH06 location has been considered for the lateral spreading assessment.
5.5.2 Evaluation
Lateral spreading risk has been assessed at DH06 location using empirical methods (Reference 7). The following assumptions have been considered to provide a preliminary assessment of lateral spreading risk:
- Free face height of 7m. The height of the free face is not known as bathymetry data is not available. However, the above height has been estimated using the fill thickness at DH06 location (6.65m) and a sea bed gradient of 1:70 as discussed in Section 6.3. DH06 is located approximately 20m behind the crest of the existing embankment.
- Distance to source of earthquake varying from 2 to 20km corresponding to different scenario of rupture of the Wellington Fault in the Wellington Harbour area. These distances are indicative and a more detailed fault rupture scenario should be considered.
The calculated lateral ground displacement is between 100mm and 540mm depending on the distance to the earthquake source (20 and 5km respectively). This applies to the ULS design event only.
RELEASED U
NDER THE
OFFICIA
L INFORMATIO
N ACT

AECOM W2HVlink Field Investigations – Geotechnical Interpretive Report
Revision 0 – 12-May-2014 Prepared for – New Zealand Transport Agency – Co No.: N/A
16
5.5.3 Discussion
The estimated lateral spreading-induced ground displacement could be significant and possibly affect the entire corridor width, particularly the railway line and the proposed cycleway bridge foundation. However, the indicated displacement is an approximate and indicative figure based on empirical methods only. More detailed geometric information is required for further assessment, and this risk should be further assessed during detailed design.
5.6 Stability of Existing Slopes 5.6.1 Natural Hill Slopes
Historically, steep slopes on the west side of SH2 are prone to slope instability. A major landslide, triggered by either rainfall or a seismic event, has the potential to impact the entire transport corridor width. For slope instability hazard, SH2 is the most at risk asset along the corridor.
A comprehensive slope stability analysis along the corridor is beyond the scope of this report. This needs to be carried out to evaluate the resilience of SH2 to natural hazards. It is expected that the outcome of this analysis and the relevant mitigation measures for SH2, if implemented, will provide sufficient protection to the cycleway corridor, for both Options 1 and 3.
5.6.2 Existing Reclamation Embankment
Stability of the existing reclamation embankment is expected to be related to both the resistance to failure from static and dynamic (earthquake, including liquefaction and lateral spreading) loads and the resistance to the dynamic actions of waves.
Wave action appears to be the most critical factor as the June 21, 2013 storm event washed out some sections of the tracks interrupting rail traffic for several days. No significant damage was reported after the July 21, 2013 Seddon (Magnitude 6.5) and August 16, 2013 Lake Grassmere (Magnitude 6.6) earthquakes. Peak ground accelerations at site for these events were likely to be at a level comparable to SLS as described in section 5.3. However, slope instability is likely to develop for a design (ULS) level earthquake on the Wellington Fault. This may also include effects from lateral spreading as discussed in Section 5.5.
More detailed geometric information is required for the slope stability analysis of the existing embankment. Detailed geometric information for carrying out a slope stability analysis is available for the missing cycleway section only (chainage 3,500 to 4,300). In this area both project options include an extension of the reclaimed land and slope stability analysis has been carried out for the proposed reclamation geometry as described in section 6.9.
RELEASED U
NDER THE
OFFICIA
L INFORMATIO
N ACT
AECOM W2HVlink Field Investigations – Geotechnical Interpretive Report
Revision 0 – 12-May-2014 Prepared for – New Zealand Transport Agency – Co No.: N/A
17
6.0 Proposed Reclamation
6.1 General Reclamation is proposed for both options over a length of corridor varying from 800m for Option 1 and up to 3,300m for Option 3. The average proposed reclamation width is approximately 5m from the existing crest to allow for:
- Railway realignment for Option 1. - A 3m wide shared path, safety (barriers) and lightening equipment for Option 3. - Practicable and efficient construction. The following sections introduce the main parameters and variables affecting preliminary design of the reclamation embankment and the necessary coastal protection measures.
6.2 Tidal Planes Wellington Harbour is topographically partially isolated from oceanic influences and tidal movement is minimal, with a tidal range of approximately 0.9 m and 1.2 m for neap and spring tides, respectively. Tides in the Wellington Harbour are defined as semi-diurnal with a low diurnal bias. The tidal planes are indicated in Table 12: Table 12 Tidal Plane Elevation for Wellington Harbour
Tidal Plane Elevation in meter (datum: WVD53)
Max HW – Maximum High Water 0.955
MHWS – Mean High Water Spring 0.82
MSL - Mean Sea Level 0.195
MLWS - Mean Low Water Spring -0.43
LLW – Lower Low Water -0.545
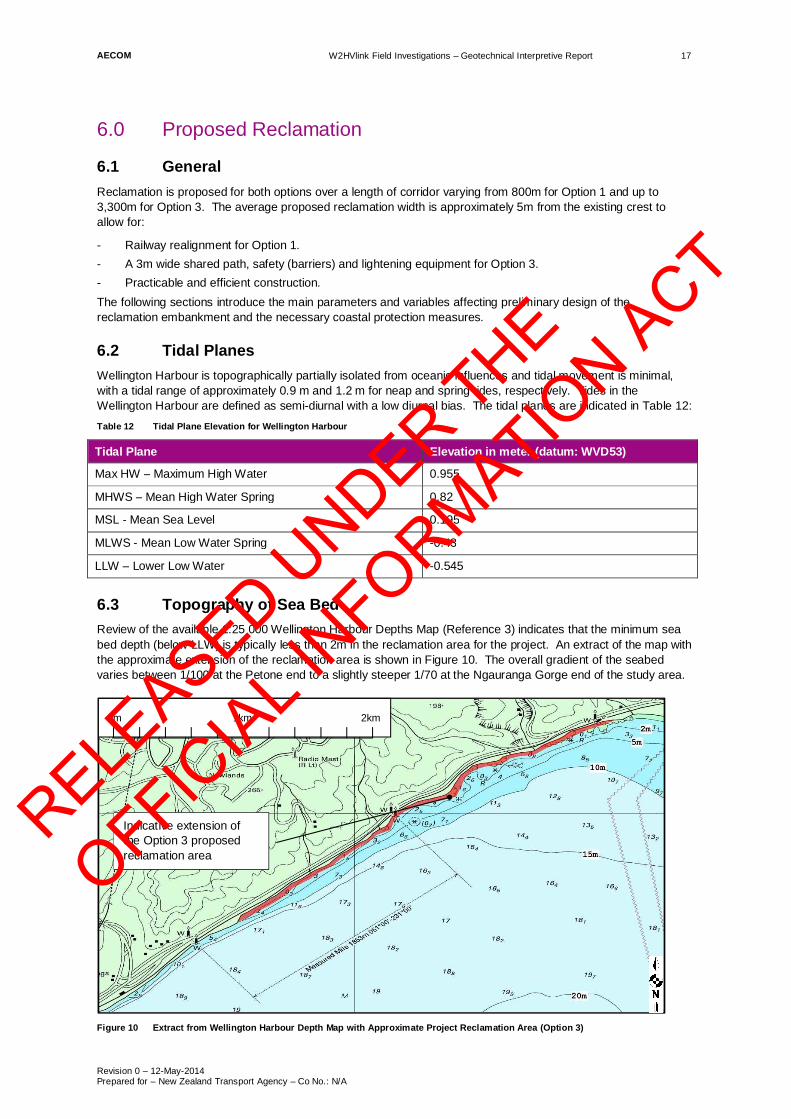
6.3 Topography of Sea Bed Review of the available 1:25 000 Wellington Harbour Depths Map (Reference 3) indicates that the minimum sea bed depth (below LLW) is typically less than 2m in the reclamation area for the project. An extract of the map with the approximate extension of the reclamation area is shown in Figure 10. The overall gradient of the seabed varies between 1/100 at the Petone end to a slightly steeper 1/70 at the Ngauranga Gorge end of the study area.
Figure 10 Extract from Wellington Harbour Depth Map with Approximate Project Reclamation Area (Option 3)
Indicative extension of the Option 3 proposed reclamation area
1km 0m 2km
RELEASED U
NDER THE
OFFICIA
L INFORMATIO
N ACT

AECOM W2HVlink Field Investigations – Geotechnical Interpretive Report
Revision 0 – 12-May-2014 Prepared for – New Zealand Transport Agency – Co No.: N/A
18
6.4 Existing Coastal Defence Measures Currently various types and sizes of engineered coastal defence measures exist on the shoreline. They are related to the history of reclamation, storm-related damage and consequent repairs. The existing defence measures vary from relatively small size concrete-bond rock elements to large size boulders of different origin and concrete elements from demolition sites. The site walkover carried out on 5&6 February (observations and notes provided in Appendix G) provides a visual assessment of existing coastal defence measures in the area proposed for reclamation of both options 1&3 (from chainage 3,500 to 4,300 approximately). Photographs of the typical observed measures are shown in Figure 11.
Figure 11 Existing Coastal Protection Measures
The existing reclamation embankment profile typically includes a steep (35/45°) slope profile extending directly onto the seafloor from the side of the existing railway tracks as shown in Figure 11. The crest of the existing reclamation embankment is at elevation 3.0m (WVD53) which is approximately 2.8m above Mean Sea Level. In some areas additional rock armouring has been added following instability of the existing slope. These maintenance works are ongoing and the latest was completed in January 2014 under Kiwirail supervision.
6.5 Proposed Geometry The required reclamation material volume is dependent upon:
- Proposed formation / finished level;
- Proposed reclamation width and alignment;
- Slope angle for the reclamation embankment;
- Existing reclamation embankment geometry; and
- Profile of sea bed over the reclamation footprint, and any requirement for undercut of unsuitable foundation materials
The slope angle should be considered carefully during detailed design. A shallower angle offers greater stability but requires more fill material. At this stage a preliminary slope profile of 1V:2H (approximately 26° from horizontal) has been considered. This is expected to provide a good balance between stability, rock armour size and fill volume. Design optimisation will be required at a later stage. However, due to the difficulty of fill placement and compaction underwater, steepening will likely be limited to the fill placed above mean sea level. Steepening of the reclamation slope will also result in a requirement for larger rock armour (see section 6.6 Coastal Defence Measure Design) and hence expected benefits are limited.
RELEASED U
NDER THE
OFFICIA
L INFORMATIO
N ACT
AECOM W2HVlink Field Investigations – Geotechnical Interpretive Report
Revision 0 – 12-May-2014 Prepared for – New Zealand Transport Agency – Co No.: N/A
19
6.6 Coastal Defence Measure Design Considerations 6.6.1 General
The proposed reclamation will require adequate protection from the natural coastal processes such as wind, wave and tidal action. In relatively sheltered areas with limited wave height such as the Wellington Harbour, rock armour is the most widely used and cost-effective engineered coastal defence measure. This involves placement of suitably sized rock blocks on the face of the reclamation embankment slope. Materials other than rock can be used such as concrete rubble and precast concrete blocks of different shape. The latter relies on interlocking properties in addition to their self-weight. The cost per unit is however significantly greater compared to traditional rock armouring, and interlocking concrete blocks are typically used for protection againist larger wave height in open-sea coastlines.
6.6.2 Rock Armour Design Parameters
Individual rock unit size and weight is of critical importance and can be determined through the use of the Hudson Equation from the USACE Shore Protection Manual (Reference 8):
= ( ) /
Where: HS = Design Significant Wave Height [m] = Dimensionless Relative Buoyant Density of Rock Dn50 = Nominal Median Diameter of Armour Blocks [m] KD = Dimensionless Stability Coefficient = Slope Angle from horizontal [°]
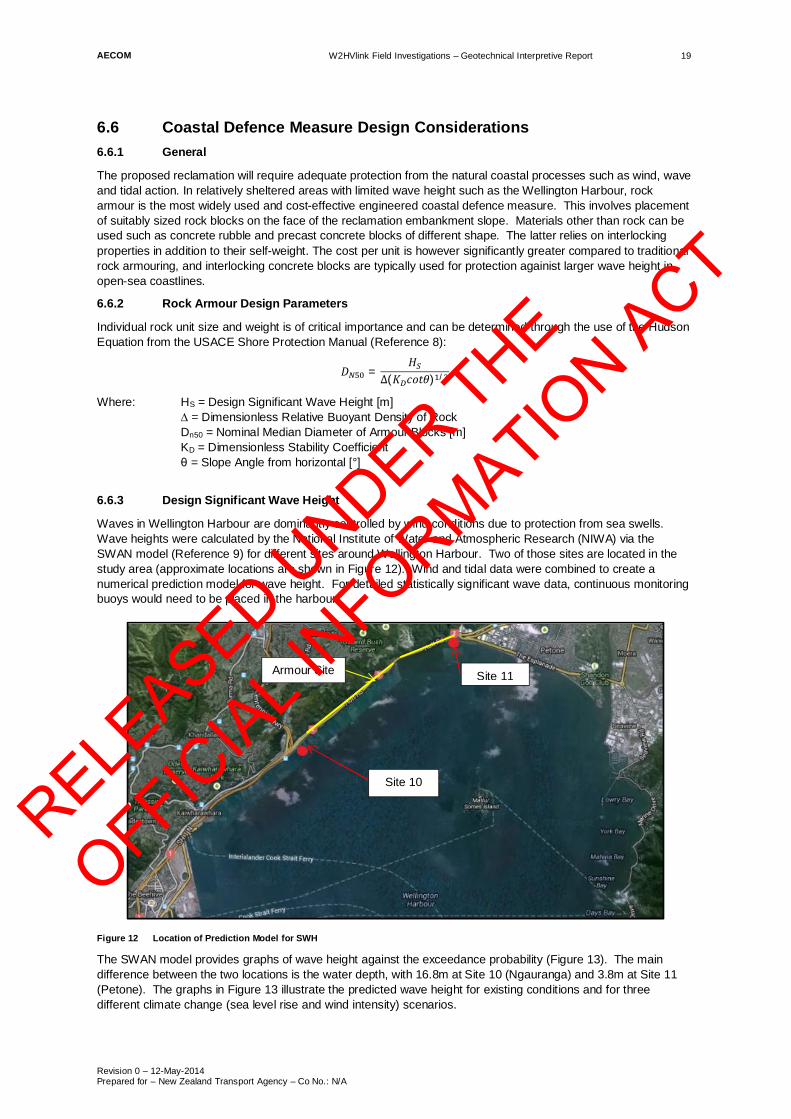
6.6.3 Design Significant Wave Height
Waves in Wellington Harbour are dominantly controlled by wind conditions due to protection from sea swells. Wave heights were calculated by the National Institute of Water and Atmospheric Research (NIWA) via the SWAN model (Reference 9) for different sites around Wellington Harbour. Two of those sites are located in the study area (approximate locations are shown in Figure 12). Wind and tidal data were combined to create a numerical prediction model for wave height. For detailed statistically significant wave data, continuous monitoring buoys would need to be placed in the harbour.
Figure 12 Location of Prediction Model for SWH
The SWAN model provides graphs of wave height against the exceedance probability (Figure 13). The main difference between the two locations is the water depth, with 16.8m at Site 10 (Ngauranga) and 3.8m at Site 11 (Petone). The graphs in Figure 13 illustrate the predicted wave height for existing conditions and for three different climate change (sea level rise and wind intensity) scenarios.
Site 11
Site 10
Armour Site
RELEASED U
NDER THE
OFFICIA
L INFORMATIO
N ACT

AECOM W2HVlink Field Investigations – Geotechnical Interpretive Report
Revision 0 – 12-May-2014 Prepared for – New Zealand Transport Agency – Co No.: N/A
20
Figure 13 Graph of the Significant Wave Height vs Exceedance (from NIWA study)
The predicted wave heights from the model are indicated in Table 13 against different return periods. These values do not consider the effects of climate change over these periods with predicted sea level and wind intensity rise likely to have significant effects on the wave height prediction and therefore the proposed rock armour properties. The worst case scenario in the NIWA report indicates a predicted wave height approximately 30% greater than the existing conditions. Table 13 Significant Design Wave Height
Return Period (Annual Exceedance Probability - AEP)
HS [m]
Site 10 (Ngauranga Gorge) Site 11 (Petone)
50 years (AEP 2%) 1.3 1.2
100 years (AEP 1%) 1.4 1.25
500 years (AEP 0.2%) 1.5 1.3
1000 years (AEP 0.1%) 1.9 1.5
2500 years (AEP 0.04%) 2.2 1.6
A preliminary design significant wave height of 1.9m was selected for rock armouring design purposes. This corresponds to a 1000 year return event (AEP 0.1%). Confirmation of the design wave height is required for detailed design purposes.
6.6.4 Other Parameters
The stability coefficient KD is an empirical value used to account for all the other variables that have an effect on stability, such as friction and roughness of the rock units and the type of wave. The value used (4.0) is based on test result published in the 1984 Edition of the USACE Shore Protection Manual (Reference 8) for a rough angular quarrystone.
The other values used in the formula depend upon the type of rock used in the armour. For example a metamorphosed sandstone element will need to be larger than a basalt unit due to its lower density or built on a shallower slope angle. An indicative rock density of 2.65 (buoyant 1.65) has been assumed which corresponds to a granite rock.
6.6.5 Preliminary Rock Armour Sizing
Application of the Hudson equation provides an indicative Dn50 = 0.57m. This corresponds to rock armour elements with an approximate unit weight of 500kg. Double layer rock armour is required for stability. Detailed design by a suitably qualified coastal engineer is required for the rock armour. The rock armour size determined in detailed design may vary from the above.
RELEASED U
NDER THE
OFFICIA
L INFORMATIO
N ACT

AECOM W2HVlink Field Investigations – Geotechnical Interpretive Report
Revision 0 – 12-May-2014 Prepared for – New Zealand Transport Agency – Co No.: N/A
21
6.7 Structural Fill Material Requirements The reclamation embankment will be partially submerged and subject to the continuous and variable action of tides and waves from the harbour. In order to prevent long term settlement and instability caused by fines migration, the fill material will have to be well-graded coarse gravel or crushed rock suitable for fill placement under water, i.e. with low compaction requirements. At this preliminary stage an indicative maximum diameter of 200mm and low fine content should be suitable, but material requirements will need to be confirmed during detailed design.
The fill material will need to maintain its strength characteristics underwater and following cyclic periods of drying and wetting. This will dictate rock type suitability. Crushed rock materials will need to be sourced from moderately or less weathered rock mass.
The coarse fill material should be used to the mean sea level. Intensive dynamic compaction is recommended at the final layer. A field trial and monitoring are recommended to investigate if there are any adverse vibrational effects on the existing railway line.
Above mean sea level we recommend the use of well-compacted granular fill material (e,g. GAP 65). It is assumed that compaction can be carried out above mean sea level during low tide intervals.
6.8 Rock Armour/Fill Interface This interface is critical for the stability of both the structural fill and rock armour elements. Traditionally multiple layers of rock materials (filter or cushioning layers) are used, grading down in diameter from the surface towards the structural fill. The placement of multiple rock layers is time-consuming and introduces additional material and transport requirements. In order to reduce the number of filter layers, non-woven geotextile can be laid at the base of a single cushioning layer. The geotextile key attributes are:
- High permeability to avoid build-up of pore water pressure. The geotextile permeability should be 10 to 100 times greater than that of the underlying granular fill;
- High mechanical performance. The geotextile would need sufficient extensibility to wrap around point loads, avoid puncture and resist compression; and
- High durability to resist exposure to UV and variable pH conditions.
Considering the size of rock armour as described in Section 6.6, a high-performance geotextile (tensile strength > 150 kN/m, puncture resistance >30kN, thickness >12mm) is required with consequent high cost. Although expensive, the combination of a high strength geotextile and a single filter rock layer is faster and easier to install and should provide savings in material, transport and placement time compared to multiple layers of graded rock material. Initially, filter rock of an indicative nominal diameter of 250mm has been considered (approximate unit weight of 50kg).
A schematic cross-section of the reclamation fill and rock armour protection is presented in Appendix I. This is indicative only and detailed design is required.
6.9 Slope Stability Analysis for Proposed Reclamation Embankment 6.9.1 General
The proposed reclamation geometry and material properties have been considered for preliminary stability analysis of the reclamation embankment in the missing cycleway section (chainage 3,500 to 4,300). Available survey and drillhole information for other sections are not sufficient to provide a reliable analysis.
GPS survey information collected during the 4&5 February 2013 site walkover was used to provide cross-sections for slope stability analysis. The analysis was carried out using the software SLIDE Version 6 by Rocscience (2009).
6.9.2 Analysis Assumptions
The slope stability analysis is based on the proposed geometry at chainage 3,800 with a fill slope angle of 2H:1V (26°). This is considered representative for the proposed reclamation section between chainage 3,500 and 4,300. Modification of the reclamation slope angle is likely to significantly affect the results.
The output of the analysis is the ratio between stabilising and mobilising forces defined as the Factor of Safety (FoS) for the slope. Slope stability has been assessed for the static case and for seismic loading as presented in Table 10. Target FoS are typically 1.5 for static and 1.1 for seismic.
RELEASED U
NDER THE
OFFICIA
L INFORMATIO
N ACT
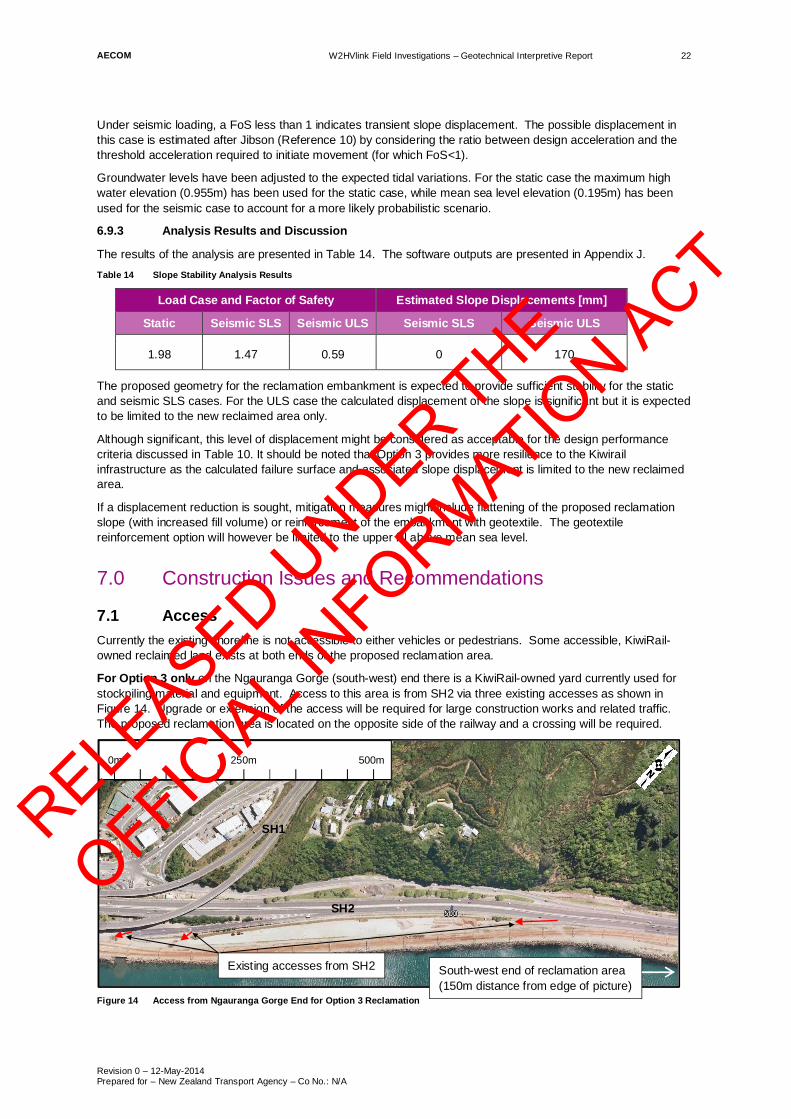
AECOM W2HVlink Field Investigations – Geotechnical Interpretive Report
Revision 0 – 12-May-2014 Prepared for – New Zealand Transport Agency – Co No.: N/A
22
Under seismic loading, a FoS less than 1 indicates transient slope displacement. The possible displacement in this case is estimated after Jibson (Reference 10) by considering the ratio between design acceleration and the threshold acceleration required to initiate movement (for which FoS<1).
Groundwater levels have been adjusted to the expected tidal variations. For the static case the maximum high water elevation (0.955m) has been used for the static case, while mean sea level elevation (0.195m) has been used for the seismic case to account for a more likely probabilistic scenario.
6.9.3 Analysis Results and Discussion
The results of the analysis are presented in Table 14. The software outputs are presented in Appendix J. Table 14 Slope Stability Analysis Results
Load Case and Factor of Safety Estimated Slope Displacements [mm]
Static Seismic SLS Seismic ULS Seismic SLS Seismic ULS
1.98 1.47 0.59 0 170
The proposed geometry for the reclamation embankment is expected to provide sufficient stability for the static and seismic SLS cases. For the ULS case the calculated displacement of the slope is significant but it is expected to be limited to the new reclaimed area only.
Although significant, this level of displacement might be considered as acceptable for the design performance criteria discussed in Table 10. It should be noted that Option 3 provides more resilience to the Kiwirail infrastructure as the calculated failure surface and associated slope displacement is limited to the new reclaimed area.
If a displacement reduction is sought, mitigation measures might include flattening of the proposed reclamation slope (with increased fill volume) or reinforcement of the embankment with geotextile. The geotextile reinforcement option will however be limited to the upper fill above mean sea level.
7.0 Construction Issues and Recommendations
7.1 Access Currently the existing shoreline is not accessible to either vehicles or pedestrians. Some accessible, KiwiRail-owned reclaimed land exists at both ends of the proposed reclamation area.
For Option 3 only on the Ngauranga Gorge (south-west) end there is a KiwiRail-owned yard currently used for stockpiling material and equipment. Access to this area is from SH2 via three existing accesses as shown in Figure 14. Upgrade or extension of the access will be required for large construction works and related traffic. The proposed reclamation area is located on the opposite side of the railway and a crossing will be required.
Figure 14 Access from Ngauranga Gorge End for Option 3 Reclamation
250m 0m 500m
South-west end of reclamation area (150m distance from edge of picture)
SH2
SH1
Existing accesses from SH2
RELEASED U
NDER THE
OFFICIA
L INFORMATIO
N ACT

AECOM W2HVlink Field Investigations – Geotechnical Interpretive Report
Revision 0 – 12-May-2014 Prepared for – New Zealand Transport Agency – Co No.: N/A
23
For both options 1&3 on the Petone (north-east) end an existing sealed accessway from The Petone Esplanade leads to the Petone Rowing Clubhouse. A gate marks the limit of the KiwiRail-owned land. Upgrading works to the accessway are required for access of construction equipment.
Figure 15 Access from Petone End for Options 1&3 Reclamation
Due to the large material volumes involved in the project and to achieve acceptable progress rates it would be desirable to progress reclamation works from both ends. However, material delivery to the fill sites will likely prove problematic due to the lack of turning space. Proposed KiwiRail layover areas might be used during construction but there may also need to be allowances for additional width of the reclamation fill to accommodate passing bays.
7.2 Procurement Strategy 7.2.1 General
The required volumes of fill and rock armour for the reclamation area are significant and a reliable procurement methodology is required. At this stage it appears that the rock armour procurement will prove challenging due to required size of the rock elements and the limited sourcing areas.
7.2.2 Rock Armour
Greywacke rock which is common in the Wellington area is typically highly fractured. Occurrence of suitably sized rock elements during extraction is rare and the blocks are not currently stocked in quarry facilities in significant quantity. The blocks might furthermore break during transport and placement. Although two quarries (Horokiwi, Kiwi Point) are located in close proximity to the site, local sourcing of rock armour is expected to be insufficient for this project, especially for Option 3 (3,300m shoreline reclamation). However, some elements might be sourced locally if early notice is given to local quarries.
It is expected that the majority of the rock armour elements will have to be sourced from around the country with possible supply sources in the South Island and the North Island Ruapehu volcanic area. This will require transport over significant distances and possibly sea crossing.
The intermediate rock (cushioning) layer might be sourced locally but preliminary enquiries to local quarries are recommended.
7.2.3 Structural Fill
For structural fill, suitable material is expected to be available from the following sources:
1) Local quarries should be able to provide suitable fill material. However, the required volume for the project requires advanced planning.
2) Cut to fill operations from local infrastructure projects. Although financially viable, this option has the major constraint of being dependent on the programme of both projects. Also the suitability of the available materials needs to be confirmed by site investigations and testing. Among the possible projects, P2G or the Mt Victoria Tunnel Duplication could be considered for supply of filling materials.
250m 0m 500m
SH2
Wairarapa Line
Rowing Clubhouse
North-east end of reclamation area
RELEASED U
NDER THE
OFFICIA
L INFORMATIO
N ACT
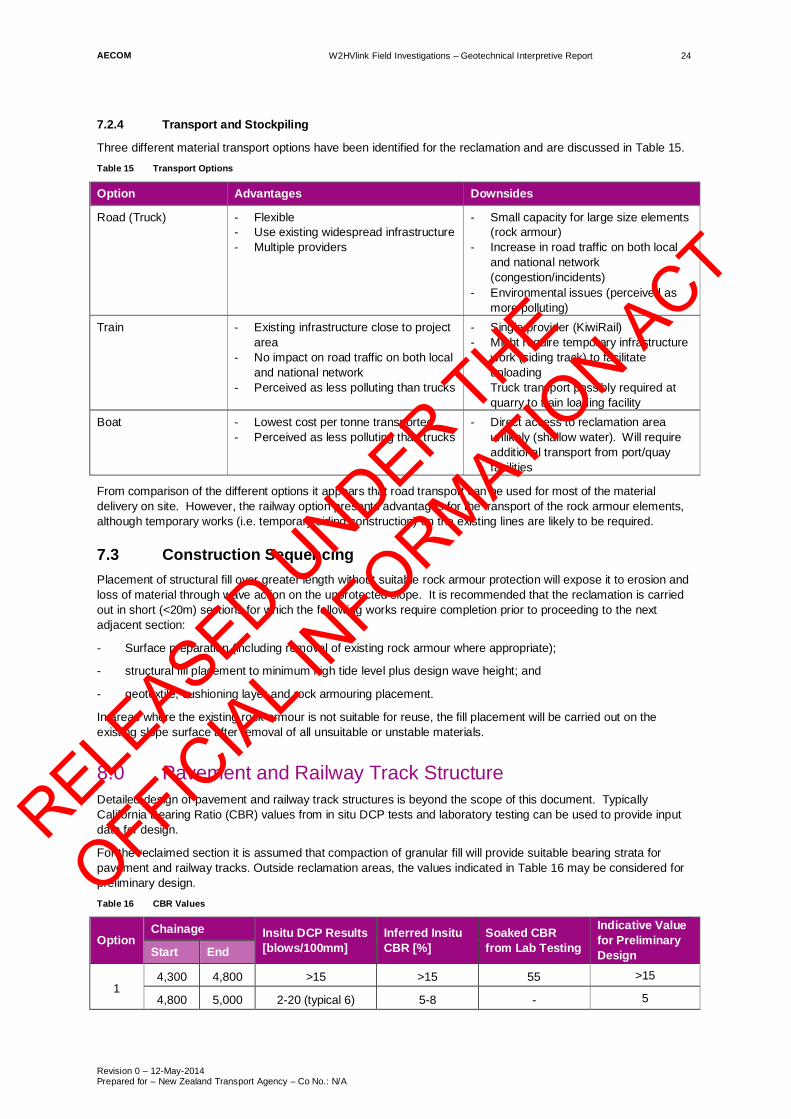
AECOM W2HVlink Field Investigations – Geotechnical Interpretive Report
Revision 0 – 12-May-2014 Prepared for – New Zealand Transport Agency – Co No.: N/A
24
7.2.4 Transport and Stockpiling
Three different material transport options have been identified for the reclamation and are discussed in Table 15. Table 15 Transport Options
Option Advantages Downsides
Road (Truck) - Flexible - Use existing widespread infrastructure - Multiple providers
- Small capacity for large size elements (rock armour)
- Increase in road traffic on both local and national network (congestion/incidents)
- Environmental issues (perceived as more polluting)
Train - Existing infrastructure close to project area
- No impact on road traffic on both local and national network
- Perceived as less polluting than trucks
- Single provider (KiwiRail) - Might require temporary infrastructure
work (siding track) to facilitate unloading
- Truck transport possibly required at quarry to train loading facility
Boat - Lowest cost per tonne transported - Perceived as less polluting than trucks
- Direct access to reclamation area unlikely (shallow water). Will require additional transport from port/quay facilities
From comparison of the different options it appears that road transport can be used for most of the material delivery on site. However, the railway option presents advantages for the transport of the rock armour elements, although temporary works (i.e. temporary siding construction) on the existing lines are likely to be required.
7.3 Construction Sequencing Placement of structural fill over greater length without suitable rock armour protection will expose it to erosion and loss of material through wave action on the unprotected slope. It is recommended that the reclamation is carried out in short (<20m) sections for which the following works require completion prior to proceeding to the next adjacent section:
- Surface preparation (including removal of existing rock armour where appropriate);
- structural fill placement to minimum high tide level plus design wave height; and
- geotextile, cushioning layer and rock armouring placement.
In areas where the existing rock armour is not suitable for reuse, the fill placement will be carried out on the existing slope surface after removal of all unsuitable or unstable materials.
8.0 Pavement and Railway Track Structure Detailed design of pavement and railway track structures is beyond the scope of this document. Typically California Bearing Ratio (CBR) values from in situ DCP tests and laboratory testing can be used to provide input data for design.
For the reclaimed section it is assumed that compaction of granular fill will provide suitable bearing strata for pavement and railway tracks. Outside reclamation areas, the values indicated in Table 16 may be considered for preliminary design. Table 16 CBR Values
Option Chainage Insitu DCP Results
[blows/100mm] Inferred Insitu CBR [%]
Soaked CBR from Lab Testing
Indicative Value for Preliminary Design Start End
1 4,300 4,800 >15 >15 55 >15
4,800 5,000 2-20 (typical 6) 5-8 - 5
RELEASED U
NDER THE
OFFICIA
L INFORMATIO
N ACT

AECOM W2HVlink Field Investigations – Geotechnical Interpretive Report
Revision 0 – 12-May-2014 Prepared for – New Zealand Transport Agency – Co No.: N/A
25
Further investigations are required to provide sufficient information for detailed design. These should include in situ and laboratory testing at closer spacing along the proposed alignment in order to identify possible variations in subgrade characteristics and strength. Results should be reviewed by a geotechnical or pavement specialist.
9.0 Limitations Recommendations and opinions contained in this report are based on limited site investigations and observations. Inferences of ground conditions over the site are made on the basis of investigation results using geological principles and engineering judgement. However, it is possible that ground conditions over the site may vary and therefore it is not possible to guarantee the continuity of the ground conditions away from test locations.
Information in this report is not sufficient for detailed design. Further investigations including collection of topographical and bathymetry survey data and significant wave height determination for rock armour design are required.
This report has been prepared for the particular project described in the brief to us, and no responsibility is accepted for the use of any part of this report in any other context or for any other purpose.
10.0 References 1) Begg, J.G., Mazengrab, C. – 1996 – Geology of the Wellington area – scale 1:50 000 – Institute of
Geological & Nuclear Sciences geological map 22 – 1 sheet + 128p. – Lower Hutt, New Zealand.
2) Land Information New Zealand – Topomaps BQ31 (Wellington) – scale 1:50 000
3) Land Information New Zealand - Wellington Harbour Depth in Meters – Scale 1:25 000
4) Van Dissen, R.and others, 2010, It’s Our Fault: better defining earthquake risk in Wellington. in proceedings, 11th IAEG Congress, Auckland, New Zealand, 5-10 September, 2010: 737-746
5) New Zealand Standard 1170:0 – 2002 – Structural Design Actions – Part 0: General Principles
6) New Zealand Standard 1170:5 – 2004 – Structural Design Actions – Part 5: Earthquake Actions – New Zealand
7) X. Youd, T.L., Corbett, M.H., Bartlett, S.F. - Revised multilinear regression equations for prediction of lateral spread displacement - Journal of Geotechnical and Geoenvironmental Engineering – Volume 128 – Number 12 – dated December.
8) United States Army Corps of Engineers – Shore Protection Manual – Fourth Edition – 1984
9) National Institute of Water & Atmospheric Research Ltd - Impacts of Long Term Climate Change on Weather and Coastal Hazards for Wellington City – 2006
10) Jibson R.W. – Regression Models for Estimating Coseismic Landslide Displacement – Engineering Geology Journal – v. 91 – p. 209-218 – 2007
RELEASED U
NDER THE
OFFICIA
L INFORMATIO
N ACT