Embed Size (px)
Citation preview

Appendix B
Geotechnical Laboratory Test Results


Appendix B Geotechnical Laboratory Test Results
X:\X_WATER\SAN CLEMENTE DAM REMOVAL - 26816781\GEOTECHNICAL\GDR REPORT\FINAL_GDR MAY 2010.DOC\13-MAY-10\\ B-1
This appendix presents the results of rock and soil laboratory testing completed as part of the geotechnical investigations. A summary of the results of the laboratory tests completed in the borings is presented in Table B-1. Results of the laboratory tests are also presented on the individual boring logs at the corresponding sample locations in Appendix A.
B.1 ROCK CORE TESTING The recovered rock core samples were visually classified and evaluated with respect to rock type and strength according to the classification criteria in Appendix A. The laboratory program for the rock samples from core borings consisted of unconfined compression tests. The URS Pleasant Hill performed the unconfined compression testing.
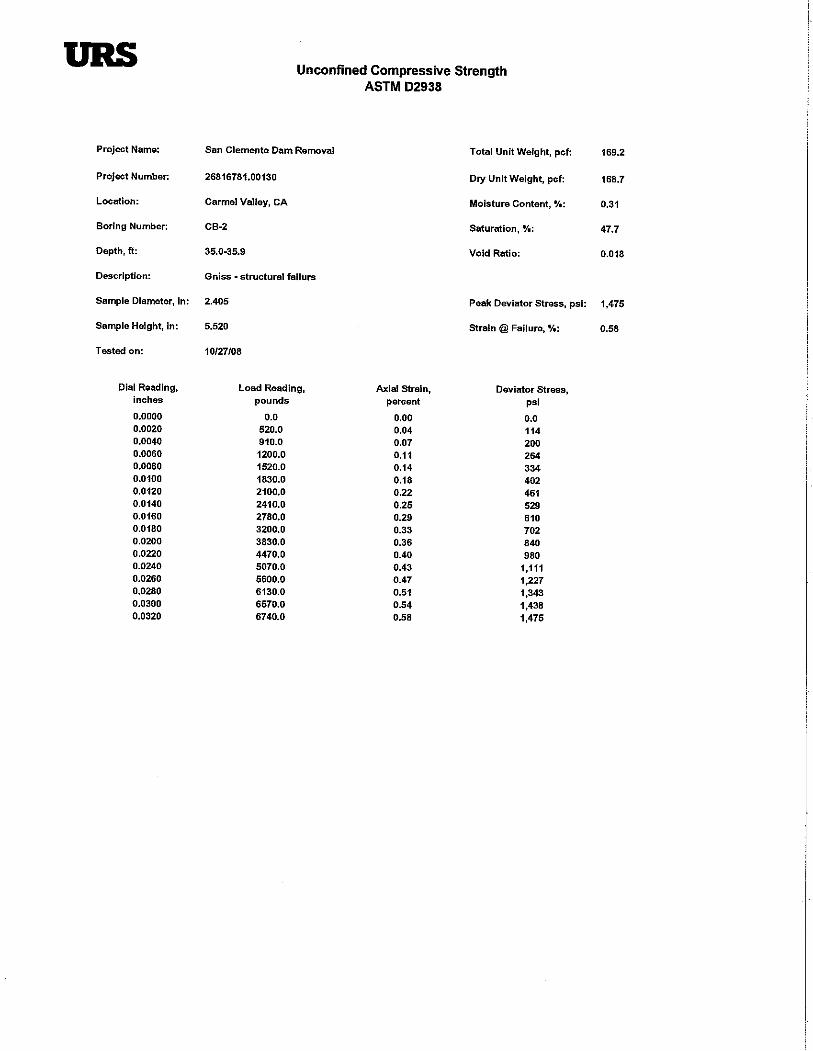
B.1.1 Unconfined Compression Strength Unconfined compression strength (UCS) testing was conducted to assess rock strength. The testing was performed on 4 samples obtained from borings CB-1 and CB-2. The testing was performed in general accordance with ASTM D2938, and all samples were prepared in accordance with ASTM D4543. At the time of testing, the bulk density of each core sample for unconfined compression test was measured. Stress-strain measurements were also plotted for the UCS tests completed by URS. Results of the UCS tests are presented in Table B-1.
B.2 SOIL TESTING Laboratory tests were performed on soil samples collected from the rotary wash borings and test pits. The materials encountered in the field were visually classified and evaluated with respect to consistency, moisture content, plasticity, and grain size distribution. The samples were returned to URS’ laboratory for further examination and testing. The visual classifications were then confirmed by performing moisture content, gradation analyses and evaluating the plasticity characteristics of representative samples of the soils. Results of laboratory testing are shown at the corresponding sample locations on the boring logs (Appendices A).
B.2.1 Moisture Content Moisture content determinations were performed on soils encountered in the borings. These tests were conducted in accordance with ASTM D2216. The results of the individual tests are presented in the corresponding logs in Appendices A, at the respective locations of the samples and on Table B-1 in this Appendix.
B.2.2 Atterberg Limits Liquid limits (LL) and plastic limits (PL) were measured on one sample using the procedure in ASTM D4318. This sample was non-plastic. The results of these tests are presented on the corresponding log in Appendices A and in Table B-1.

Appendix B Geotechnical Laboratory Test Results
X:\X_WATER\SAN CLEMENTE DAM REMOVAL - 26816781\GEOTECHNICAL\GDR REPORT\FINAL_GDR MAY 2010.DOC\13-MAY-10\\ B-2
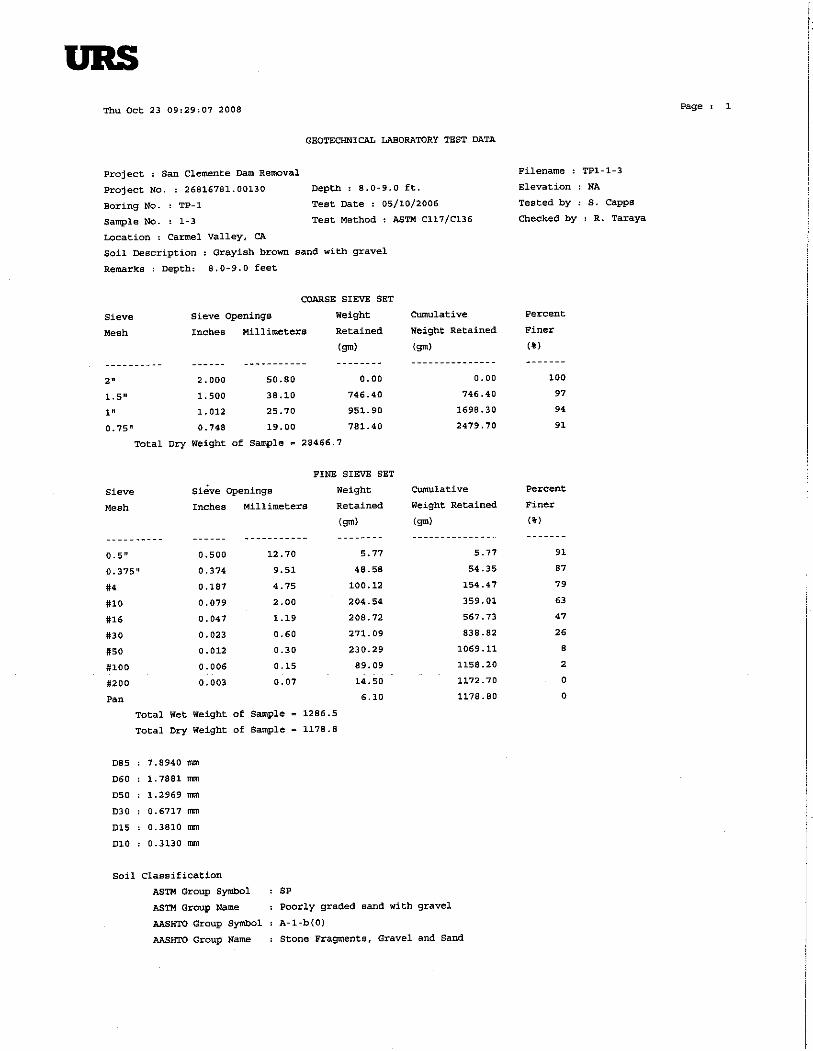
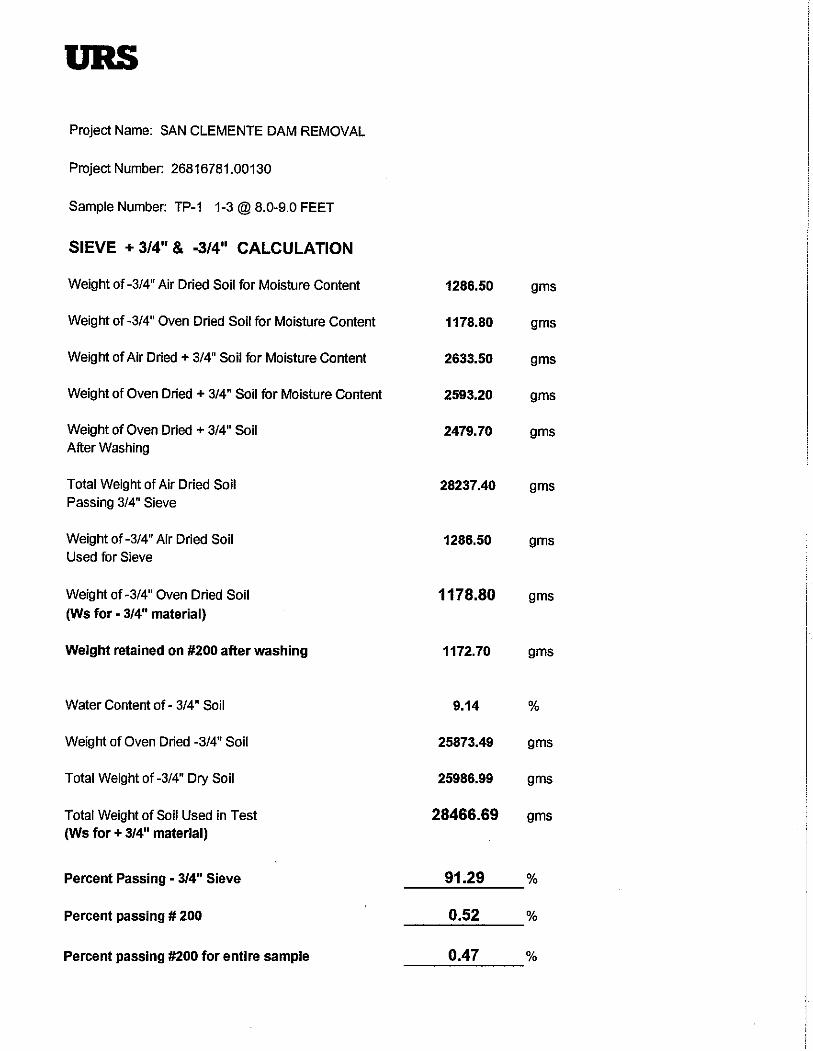
B.2.3 Gradation Analyses Gradation analyses were performed on samples to evaluate the percentages of gravels, sands, and/or fines (minus No. 200 sieve). The tests were performed in accordance with the procedure in ASTM D422, and the results are presented in Figures B-1 through B-6 for the borings. In addition, hydrometer tests were performed on 6 samples to determine the percentage of silt and clay. The results of the sieves are presented in Table B-1.
Results of the gradation analyses completed on the test pits are shown following the Figure B-6.
B.2.4 Corrosion Analyses Corrosion testing was performed by CERCO Analytical in Concord, CA on soil samples from the two test pits. The samples were tested for redox potential, pH, resistivity (100 percent saturation), sulfides, chlorides, and sulfates. The corrosion test results are presented following the gradation analyses for the test pits in this appendix.

6
RW-2
55 38 7
RW-3 1 4-5.5
477.0
SP
52.5-54
92 2
RW-3 3 14-15.5 515.5 SP 0
525.5
34-35.5
38
24-25.5 505.5 SP 1 94 5
GP-GM
7
RW-3
495.5 OL 0 33 67 13
RW-2 11
RW-2
0
92.8 41.6
RW-3 9-3 40-40.5 490.0 SM
96
43.5
36.5-37
64 36 5
RW-3 11 49-50.5 480.5
CB-1
93.5
29-30.5
5
4 19-20.5 510.5 SP 3 94 3
PT
6
493.5
500.5 SP 2 95 4
RW-3 8-3
4
RW-3
151.5
5
165.2 7991
CB-2 R14 48-48.6 542.0
[Rock]
1.0
547.0
1479
RW-1 2 9-10.5 520.5 SP 1 96
[Rock]
35-35.9
R34 108.3-109 511.7 [Rock] 0.1 163.1 13802
0.3
R10
3
555.0 [Rock] 0.3 168.7 1475
CB-2 R13 43-43.8
CB-2
79
42 50 7
RW-2 1 4-5.5 525.5
3
19
51-52.3
2
RW-2 2 9-10.5 520.5 SP 0 95
SW
495.5
58
14-15.5 515.5 SM 0 83 16
RW-1
SP-SM
34-35.5
478.5
OL 0 29 71 15
RW-1 10
RW-1
7
PL
RW-5
In SituWater
Content,%
Sand,%
SUMMARY OF SOIL AND ROCK LABORATORY DATA
USCSGroupSymbol
Atterberg Limits
PIGravel,%
SP
49-50.5 480.5 ML 0 26 74
< 5µ,%
In SituDry UnitWeight,
pcf
San Clemente Dam RemovalMonterey County, California26816781.00130
Sample Information
16
Rep
ort S
OIL
_1_P
OR
TRA
IT_M
U_U
C;
OA
K_S
CLE
MD
AM
.GP
J;
11/2
1/20
08
BoringNumber
UnconfinedCompressiveStrength ofRock, psi
< #200,%
Elevation,feet MSL
11
Depth,feet
Sheet 1 of 1
Sieve and Hydrometer
SampleNumber
TABLE B-1
LL
500.5
10
510.5 SP 2 95 3
RW-4
4
29-30.5
RW-4
SP-SM 2 93 5
RW-4 10-2 46-46.5 484.0
6
RW-4
4
RW-4 1 4-5.5 525.5 SP 3
19-20.5
2
70.6
3 14-15.5 515.5 SM 0 55 45 7
95
95
1 96 2
RW-5 5 24-25.5 505.5
OL
0
14-15.5
5
RW-5 7 34-35.5 495.5 SP-SM 0 89
SP
4-5.5
NOTE: The laboratory tests were performed in general accordance with the following standards:Water Content - ASTM Test Method D2216Dry Unit Weight - ASTM Test Method D2937Particle Size Distribution Analysis by Mechanical Sieving and Hydrometer - ASTM Test Method D422Atterberg Limits - ASTM Test Method D4318Unconfined Compressive Strength of Rock - ASTM Test Method D2938
0 25 75 13 NP NP NP
SP
1
515.5
525.5 SP 10 87 2
RW-5 3
46.1
RW-5

MH or OH
PLASTICITY CHART
PLA
STIC
ITY
IND
EX, P
I
"A" LINE
LIQUID LIMIT, LL
ML or OL
60
CL-ML
CL or OL
110
CH or OH
80
0
10
20
30
40
50
80
70
1000 10 20 30 40 50
26816781.00130
70 90
60
SampleNumber LLDepth
(feet)Test
Symbol PLBoringNumber
RW-4 46-46.5 46.1 Organic Silt with Sand (OL)
Monterey County, CaliforniaSan Clemente Dam Removal
Figure B-1Rep
ort:
ATT
ER
BE
RG
_PLO
T_8
PTS
HW
C;
File
: OA
K_S
CLE
MD
AM
.GP
J;
11/2
1/20
08
RW
-04
Classification
NPNPNP
WaterContent (%) PI
10-2

3/44
PER
CEN
T R
ETA
INED
90
0.01
80
100
0.0010.1110100
60
50
70
0
10
20
30
40
ClassificationSampleNumber
BoringNumber
Depth(feet) %G %S %F
3
0
0
42
19
96
83
29
79
16
71
7
2
50
Symbol
Rep
ort:
SIE
VE
_5_C
UR
VE
S_O
AK
_GS
F;
File
: OA
K_S
CLE
MD
AM
.GP
J;
11/2
1/20
08
RW
-02
Well-Graded Sand with Gravel (SW)
0
10
20
30
40
50
60
70
80
90
10 200
HYDROMETER
8
SIEVE OPENING IN INCHES U.S. STANDARD SIEVE NUMBERS
1.5 3/8 50
Figure B-2
3
SILT OR CLAY
1
PER
CEN
T PA
SSIN
G
San Clemente Dam Removal
4
GRAVEL SAND
fine
2
PARTICLE SIZE (mm)
U.S. STANDARD
6
medium
RW-2
coarse
9-10.5
14-15.5
34-35.5
51-52.3
4-5.5
RW-1
RW-1
RW-1
2
3
7
10
1
Poorly Graded Sand (SP)
Silty Sand (SM)
Organic Silt with Sand (OL)
Poorly Graded Sand with Silt and Gravel (SP-SM)
RW-1
301
26816781.00130Monterey County, California
100
100
fine
16
PARTICLE SIZEDISTRIBUTION CURVES
BO
ULD
ERS
12
CO
BB
LES
coarse

4100
0.1
PER
CEN
T R
ETA
INED
3/4
0.01110100
80
70
0.001
90
0
10
20
30
40
50
60
SampleNumber
BoringNumber
Depth(feet) %G %S %FSymbol
51
0
55
6
95
94
33
38
5
67
7
2
Rep
ort:
SIE
VE
_5_C
UR
VE
S_O
AK
_GS
F;
File
: OA
K_S
CLE
MD
AM
.GP
J;
11/2
1/20
08
RW
-03
92
Classification
Poorly Graded Sand (SP)
3/82 200
HYDROMETER
80
10
20
30
40
50
60
70
80
90
SIEVE OPENING IN INCHES50
Figure B-3
3
SILT OR CLAYcoarse
0
U.S. STANDARD SIEVE NUMBERS
San Clemente Dam Removal
4
GRAVEL SAND
medium
1
PARTICLE SIZE (mm)
U.S. STANDARD
6 1.5
fine
2
10
24-25.5
34-35.5
52.5-54
4-5.5
RW-2
RW-2
RW-2
RW-3
5
7
11
1
Poorly Graded Sand (SP)
Poorly Graded Sand (SP)
Sandy Organic Silt (OL)
Poorly Graded Gravel with Silt and Sand (GP-GM)
PER
CEN
T PA
SSIN
G
RW-2
PARTICLE SIZEDISTRIBUTION CURVES
26816781.00130Monterey County, California
100
100
fine coarse
9-10.5
30
BO
ULD
ERS
12
CO
BB
LES
16

4100
0.1
PER
CEN
T R
ETA
INED
3/4
0.01110100
80
70
0.001
90
0
10
20
30
40
50
60
SampleNumber
BoringNumber
Depth(feet) %G %S %FSymbol
33
2
0
38
96
94
95
64
4
4
36
4
Rep
ort:
SIE
VE
_5_C
UR
VE
S_O
AK
_GS
F;
File
: OA
K_S
CLE
MD
AM
.GP
J;
11/2
1/20
08
RW
-03
58
Classification
Poorly Graded Sand with Gravel (SP)
3/82 200
HYDROMETER
80
10
20
30
40
50
60
70
80
90
SIEVE OPENING IN INCHES50
Figure B-4
3
SILT OR CLAYcoarse
0
U.S. STANDARD SIEVE NUMBERS
San Clemente Dam Removal
4
GRAVEL SAND
medium
1
PARTICLE SIZE (mm)
U.S. STANDARD
6 1.5
fine
3
10
19-20.5
29-30.5
40-40.5
49-50.5
RW-3
RW-3
RW-3
RW-3
4
6
9-3
11
Poorly Graded Sand (SP)
Poorly Graded Sand (SP)
Poorly Graded Sand (SP)
Silty Sand (SM)
PER
CEN
T PA
SSIN
G
RW-3
PARTICLE SIZEDISTRIBUTION CURVES
26816781.00130Monterey County, California
100
100
fine coarse
14-15.5
30
BO
ULD
ERS
12
CO
BB
LES
16

50
40
30
20
0
60
PER
CEN
T R
ETA
INED
10
100 10 1 0.1 0.01 0.001
4
70
3/4100
90
80
PER
CEN
T PA
SSIN
G
ClassificationSampleNumber
BoringNumber
Depth(feet) %G %S %F
2
0
2
2
0
95
55
95
25
45
3
5
75
93
Symbol
Rep
ort:
SIE
VE
_5_C
UR
VE
S_O
AK
_GS
F;
File
: OA
K_S
CLE
MD
AM
.GP
J;
11/2
1/20
08
RW
-04
Organic Silt with Sand (OL)
0
10
20
30
40
50
60
70
80
90
10 200
HYDROMETER
8
SIEVE OPENING IN INCHES U.S. STANDARD SIEVE NUMBERS
1.5 3/8 50
Figure B-5
3
SILT OR CLAY
3
San Clemente Dam Removal
4
GRAVEL SAND
fine
2
PARTICLE SIZE (mm)
U.S. STANDARD
6
medium
RW-4
coarse
4-5.5
14-15.5
19-20.5
29-30.5
46-46.5
RW-4
RW-4
RW-4
1
3
4
6
10-2
Poorly Graded Sand (SP)
Silty Sand (SM)
Poorly Graded Sand (SP)
Poorly Graded Sand with Silt (SP-SM)
RW-4
301
26816781.00130Monterey County, California
100
100
fine
16
PARTICLE SIZEDISTRIBUTION CURVES
BO
ULD
ERS
12
CO
BB
LES
coarse

3/44
1
PER
CEN
T R
ETA
INED
0.0010.110100
80
0.01
100
0
10
20
30
40
50
60
70
San Clemente Dam Removal
90
SampleNumber
BoringNumber
Depth(feet)
10
%G %S %FSymbol
2
PER
CEN
T PA
SSIN
G
0
0
0
87
96
95
89
2
5
11
74
Rep
ort:
SIE
VE
_5_C
UR
VE
S_O
AK
_GS
F;
File
: OA
K_S
CLE
MD
AM
.GP
J;
11/2
1/20
08
RW
-05
26
Classification
200
HYDROMETER
8
U.S. STANDARD SIEVE NUMBERS
1
3/8
SIEVE OPENING IN INCHES50
Figure B-6
3
SILT OR CLAYcoarse
100
10
20
30
40
50
60
70
80
90
PARTICLE SIZE (mm)
4
GRAVEL SAND
medium fine
U.S. STANDARD
6 1.5
26816781.00130
1
2
14-15.5
24-25.5
34-35.5
49-50.5
RW-5
RW-5
RW-5
RW-5
3
5
7
10
Poorly Graded Sand (SP)
Poorly Graded Sand (SP)
Poorly Graded Sand (SP)
Poorly Graded Sand with Silt (SP-SM)
Silt with Sand (ML)
RW-5
PARTICLE SIZEDISTRIBUTION CURVESMonterey County, California
100
100
fine coarse
4-5.5
301
BO
ULD
ERS
12
CO
BB
LES
16