Embed Size (px)
Citation preview

1
APPENDIX D
PROVISIONAL C4SLs FOR
BENZENE

2
CONTENTS
1. INTRODUCTION ......................................................................................................... 5
1.1 BACKGROUND INFORMATION ON BENZENE ................................................... 5
2. LOW LEVEL OF TOXICOLOGICAL CONCERN FOR BENZENE ............................... 6
2.1 ORAL ROUTE ....................................................................................................... 6
2.1.1 FLOWCHART ELEMENT 1: COLLATE THE EVALUATIONS FOR THE CONTAMINANT AS PER SR2: IDENTIFY ALL KNOWN TOXICOLOGICAL HAZARDS; COLLATE HBGVS FROM RELEVANT AUTHORITATIVE BODIES AND SPECIFY THE CONDITIONS OF MINIMAL RISK .............................................. 6
2.1.2 FLOWCHART ELEMENT 2: REVIEW THE SCIENTIFIC BASIS OF EACH HBGV. CHOOSE THE PIVOTAL STUDY ......................................................... 7
2.1.3 FLOWCHART ELEMENT 6: ARE THERE ADEQUATE DOSE-EFFECTS DATA FOR THE CHOSEN PIVOTAL STUDY – HUMAN DATA? ................................ 9
2.1.4 FLOWCHART ELEMENT 6c: SPECIFY AN ELCR ABOVE 1 IN 105 .............. 9
2.1.5 FLOWCHART ELEMENT 7: ASSESS LLTC for BENZENE .......................... 10
2.2 INHALATION ROUTE ......................................................................................... 10
2.2.1 FLOWCHART ELEMENT 1: COLLATE THE EVALUATIONS FOR THE CONTAMINANT AS PER SR2: IDENTIFY ALL KNOWN TOXICOLOGICAL HAZARDS; COLLATE HBGVS FROM RELEVANT AUTHORITATIVE BODIES AND SPECIFY THE CONDITIONS OF MINIMAL RISK ............................................ 10
2.2.2 FLOWCHART ELEMENT 2: REVIEW THE SCIENTIFIC BASIS OF EACH HBGV. CHOOSE THE PIVOTAL STUDY ....................................................... 11
2.2.3 FLOWCHART ELEMENT 6: ARE THERE ADEQUATE DOSE-EFFECTS DATA FOR THE CHOSEN PIVOTAL STUDY – HUMAN DATA? .............................. 13
2.2.4 FLOWCHART ELEMENT 6c. SPECIFY AN ELCR ABOVE 1 IN 105 ............. 13
2.2.5 FLOWCHART ELEMENT 7: ASSESS LLTC for BENZENE .......................... 13
2.2.6 CALCULATION OF A CHILD-SPECIFIC LLTC FOR BENZENE ................... 13
2.3 DERMAL ROUTE ................................................................................................ 14
3. EXPOSURE MODELLING FOR BENZENE .............................................................. 15
3.1 DETERMINISTIC MODELLING ........................................................................... 15
3.2 PROBABILISTIC MODELLING ........................................................................... 17
4. PROVISIONAL C4SLs FOR BENZENE .................................................................... 19
4.1 PROVISIONAL C4SLs ........................................................................................ 19
4.2 PROBABILITY OF EXCEEDING THE LLTCS ..................................................... 20
4.2.1 RESIDENTIAL (WITH CONSUMPTION OF HOMEGROWN PRODUCE) LAND-USE ................................................................................................................ 20
4.2.2 RESIDENTIAL (WITHOUT CONSUMPTION OF HOMEGROWN PRODUCE) LAND-USE ............................................................................................ 23
4.2.3 ALLOTMENTS LAND-USE ........................................................................... 23

3
4.2.4 COMMERCIAL LAND-USE ........................................................................... 25
4.3 QUALITATIVE APPRAISAL OF UNCERTAINTY ................................................ 26
4.3.1 TOXICOLOGICAL ASSESSMENT................................................................ 27
4.3.2 EXPOSURE MODELLING ............................................................................ 28
4.4 OTHER CONSIDERATIONS ............................................................................... 30
4.5 SUMMARY AND CONCLUSIONS ....................................................................... 32
5. REFERENCES .......................................................................................................... 34

4
APPENDICES Appendix D1 - Human Toxicological Data Sheet for Benzene
FIGURES Figure 2.1: Example of all chronic (>365 days) animal and human study evaluations that lead to different adverse toxicological responses following oral exposure
Figure 2.2: Example of all chronic (>365 days) animal and human study evaluations that lead to different adverse toxicological responses following inhalation exposure
Figure 4.1: Reverse cumulative frequency graph of ADE for alternative values of pC4SLs for benzene for residential (with consumption of homegrown produce) land-use with 6% SOM
Figure 4.2: Probability of exposure exceeding LLTC with alternative values of pC4SLs for benzene for residential (with consumption of homegrown produce) land-use with 6% SOM
Figure 4.3: Probability of exposure exceeding LLTC with alternative values of pC4SLs for benzene for residential (without consumption of homegrown produce) land-use with 6% SOM
Figure 4.4: Reverse cumulative frequency graph of ADE for alternative values of pC4SLs for benzene for allotments land-use
Figure 4.5: Probability of exposure exceeding LLTC with alternative values of pC4SL for benzene for allotments land-use
Figure 4.6: Probability of exposure exceeding LLTC with alternative values of pC4SL for benzene for commercial land-use
Figure 4.7: Key for symbols used to express judgements about the magnitude of potential over- or under-estimation of the LLTC and exposure in Tables 4.3 and 4.4 respectively.
Figure 4.8: Probability of exposure exceeding LLTC for benzene for allotments land-use with alternative values for produce consumption rate.
TABLES Table 2.1: Proposed choices of oral LLTC values using different PODs and/or CSMs
Table 2.2: Proposed choices of inhalation LLTC values using different PODs and/or CSMs
Table 2.3: Proposed benzene inhalation LLTCs for C4SL land use scenarios
Table 3.1:Contaminant specific parameter values used for derivation of pC4SLs for benzene
Table 3.2: Parameters modelled probabilistically for benzene
Table 3.3: PDF attributes for contaminant specific parameters for Monte Carlo analysis for benzene
Table 4.1: Provisional C4SLs and SGVs
Table 4.2: Relative contributions of exposure pathways to overall exposure
Table 4.3: Qualitative appraisal of key residual uncertainties in the toxicology evaluation
Table 4.4: Qualitative appraisal of key residual uncertainties in exposure modelling not captured by probabilistic modelling
Table 4.5: pC4SLs for Benzene (based on 6% SOM)

5
1. INTRODUCTION This appendix presents provisional Category 4 Screening Levels (pC4SLs) for benzene based on the methodology described in Section 5 of the main report. Section 1.1 provides brief background information on benzene, while Section 2 summarises the toxicological review from which Low Levels of Toxicological Concern (LLTCs) are identified (Steps 1 and 2 of the methodology). Section 3 presents the exposure modelling aspects for the generic land-uses under consideration (Step 3), while Section 4 presents the remaining steps of the methodology (Steps 4 to 7). The pC4SLs presented herein can be used for the setting of final C4SLs by relevant authorities (e.g., Defra).
1.1 BACKGROUND INFORMATION ON BENZENE
The following background information on benzene has been obtained from the Environment Agency (EA) Soil Guideline Value (SGV) report (EA2009a) and the HPA’s “Compendium of Chemical Hazards” document (HPA, 2011):
• Benzene, also known as benzol, is a naturally occurring aromatic hydrocarbon with a sweet odour. Pure benzene is a clear, colourless, volatile liquid (at room temperature and ambient pressure) which is highly flammable. It is slightly soluble in water but is easily miscible with most organic solvents.
• Benzene is naturally present in emissions from volcanoes and forest fires. It is also a constituent of crude oil and, as a consequence, many refined petroleum products. However, releases to the environment from natural sources are small compared with anthropogenic inputs.
• Benzene is used throughout the world in enormous quantities. Other than its use as an additive to petrol, the vast majority of benzene produced is used as a chemical intermediate in the production of other chemicals: ethylbenzene (used to make styrene), cumene (used to make phenol and acetone), cyclohexane (used to make nylon), nitrobenzene, alkylbenzene, maleic acid anhydride and chlorinated benzenes. The estimated annual production of benzene as a chemical intermediate in the European Union is around 5.8–7.2 million tonnes.
• Historically, benzene was widely used as a solvent in manufacturing processes and consumer products. Its use in this way has declined in recent years and this accounts for a very small proportion of current use. Uses as a solvent include/included: in the manufacture of products such as solvents, industrial paints, rubber cements, adhesives, paint removers and degreasing agents; in the production of artificial leather and rubber goods and in the shoe industry.
• Benzene is also added to petrol to improve the octane rating. The European petrol quality requirements limit benzene in petrol to a maximum of one percent by volume. Annual consumption of petrol across the EU (1990-1994) was about 120 million tonnes with approximately 1.41 million tonnes of benzene consumed per year in petrol.
Further background information on benzene, relevant to land contamination risk assessment, can be found in the above-referenced documents.

6
2. LOW LEVEL OF TOXICOLOGICAL CONCERN FOR BENZENE A framework for evaluating chemical-specific toxicology data for the purposes of LLTC derivation is presented in the form of a flowchart in Figure 2.2 of the main report. The remainder of this section demonstrates the application of this framework to benzene.
As indicated in Figure 2.2 in the main report, the first task of the toxicological framework is to perform a review of existing health based guidance value (HBGV) evaluations for all routes of exposure. A checklist of information from authoritative bodies has been collated, as per the process in SR2, although pertinent primary literature in peer reviewed journals has also been searched and included, if relevant (although it should be noted that, as described in the main report, reviews by authoritative international and national bodies are preferred to the open scientific literature, for the purpose of LLTC derivation). A “Human Toxicological Data Sheet (HTDS)” for benzene has also been completed, as shown in Appendix D1.
2.1 ORAL ROUTE 2.1.1 FLOWCHART ELEMENT 1: COLLATE THE EVALUATIONS FOR THE
CONTAMINANT AS PER SR2: IDENTIFY ALL KNOWN TOXICOLOGICAL HAZARDS; COLLATE HBGVS FROM RELEVANT AUTHORITATIVE BODIES AND SPECIFY THE CONDITIONS OF MINIMAL RISK
All oral HBGVs from authoritative bodies, together with a brief description of how they were derived, are given in descending order in Section II of the HTDS (see Appendix D1).
In 2009, the EA published the Science report SC050021 for benzene (EA 2009b). This has been used as the starting point of the data search.
The EA chose to base their oral index dose (ID) on the WHO drinking water guideline of 10 μg L-1 (WHO 2003; 2006), giving an Excess Lifetime Cancer Risk (ELCR) of 1 in 100,000. Based on adult physiological parameters of a 70 kg adult drinking 2 L of water per day, this gives an oral ID of 0.29 μg kg-1 bw day-1 (EA 2009b).
In 2013, the main authoritative evaluations come from the World Health Organisation (WHO) (WHO 2011, 2006, 2003, 1993 and Agency for Toxic Substances and Disease Registry (ATSDR) (ATSDR 2007).).
WHO calculated excess cancer risk estimates using two sources of data, namely human epidemiology data (WHO 1984) and animal data (WHO 1993, 2006, 2011 & IPCS, 1993). Both animal and human data ELCR analyses led to a value of 10 μg L-1
as the WHO drinking water guideline.
(N.B. It should be noted that the UK Committee on Carcinogenicity (COC) does not favour the use of low dose extrapolation from animal data (COC, 2012); however the value here is not only derived from animal data but is also supported by human epidemiology data (via inhalation using route to route extrapolation) – see section 2.2.2 below)
ATSDR (2007) derived an oral minimal risk level (MRL) for non-cancer effects using route-to-route extrapolation from an epidemiology study on human inhalation exposure to benzene from a Chinese shoe factory population (Lan et al., 2004).
The ATSDR toxicological profile for benzene covers a review of the primary literature base on the toxicology of benzene via oral exposure and maps all quantitative toxicological responses seen in animals and humans (ATSDR 2007). An example of the type of information provided in the ATSDR report is shown below in Figure 2.1.
This review provides the best evidence that respiratory, gastrointestinal, haematological, endocrine and immunological effects, as well as reproductive toxicity and cancer, are all sensitive toxicological effects by the oral route. In defining minimal

7
risk, it is only necessary to focus on the most sensitive of all effects in defining the HBGV. In choosing a point on the dose-response curve that is higher than minimal risk, however, it is important to note that the dose-responses for different toxic effects may overlap. Therefore, in setting the LLTC for benzene, ALL endpoints must be borne in mind (e.g. see Figure 2.1 below). This is an important principle in any of the toxicological evaluations where there are overlapping toxicological effects data, and is an important departure from the principles of how SR2 and minimal risk evaluations are implemented more simply.
Figure 2.1: Example of all chronic (>365 days) animal and human study evaluations that lead to different adverse toxicological responses following oral exposure (ATSDR 2007)
2.1.2 FLOWCHART ELEMENT 2: REVIEW THE SCIENTIFIC BASIS OF EACH HBGV. CHOOSE THE PIVOTAL STUDY
Flowchart element 2 requires a suitably qualified individual who sufficiently understands the nature of toxicological data to review the scientific basis of all existing HBGVs and choose the pivotal toxicology study for the LLTC calculation for the oral route. Three possible options are provided for the type of pivotal study that could be chosen at this point, i.e. in the form of: 1) animal toxicology data; 2) human

8
toxicology/epidemiology data; and 3) an evidence informed policy choice (i.e. based on an existing guideline from another regime, with or without a toxicological rationale).
2a) Animal Toxicology Data
WHO evaluated the National Toxicology Program (NTP) (1986) data and risk estimates were calculated using data from these long-term gavage studies in rats and mice (NTP 1986). Using a linear extrapolation model, the estimated range of concentrations in drinking water resulting in an ELCR of 1 in 10,000, 100,000 and 1,000,000 were 100-800, 10-80 and 1-8 μg L-1. These were based on leukaemia and lymphomas in female mice and oral cavity squamous cell carcinomas in male rats. The WHO task force concluded that these were a similar order of magnitude to that derived from occupational studies by Rinsky et al., (1981, 1987)(WHO 2003, 2011).
ATSDR (2007) also used NTP data and concluded that a threshold for haematological and immunological effects for benzene could not be identified (NTP 1986). A Lowest Observed Adverse Effect Level (LOAEL) of 25 mg kg-1 bw day-1 was identified based on haematotoxicity and immunotoxicity effects. However, these data were not directly used as the basis for an MRL as toxicokinetic studies showed that the absorption of benzene is approximately 50 % of the inhaled dose, and 100 % of the orally absorbed dose. Therefore inhalation data from the occupational study by Lan et al., (2004) were used to estimate the oral doses that would cause the same critical toxicity effect (see section 2b). 2b) Human Toxicology/Epidemiology Data
For benzene no human oral studies exist. However, inhalation data can be used using route-to-route extrapolations (IGHRC 2006) to estimate oral doses that would cause the same critical systemic toxicity effect. Toxicokinetic studies of inhaled benzene in humans, rats and mice have showed that systemic absorption of benzene is approximately 50% of the inhaled dose and 100% of the orally absorbed dose (ATSDR 2007).
Most evaluations for the oral route have been based on route-to-route extrapolation of inhalation exposures causing leukaemia in the ‘Pliofilm’ epidemiology data in a population of rubber workers in Ohio, USA (Rinsky et al., 1981, 1987). Extensive analyses have been carried out on such data by Crump (1994, 1996) to provide risk estimates.
US Environmental Protection Agency (USEPA) used inhalation unit risk values derived by Crump (1994, 1996) based on the Pliofilm cohort (Rinsky 1981, 1887) to calculate the drinking water unit risk, again based on the assumptions regarding absorption and a default intake of 2 L per day. This resulted in an ELCR of 4.4 in 10,000,000 to 1.6 in 1,000,000 per 1 μg L-1 (USEPA 1999).
WHO have assessed benzene in drinking water on several occasions (WHO 1984, 1993, 2006, 2011), although human epidemiology studies only formed the basis of the drinking water in the first ‘Guidelines for drinking water quality’ document (WHO 1984). In this initial assessment, they referred to “a risk estimate using data on leukaemia from epidemiological studies (most probably using the inhalation data from Rinsky et al., 1981, 1987 although it is not explicitly stated in the report). WHO concluded that a drinking-water concentration of 10 μg L-1
would pose an ELCR of 1 in 100,000, and 100 μg L-1 would pose an ELCR of 1 in 10,000 (WHO 1984). This drinking water standard was similar to that found from using animal data. Although epidemiology data are not the basis of the current standard, this assessment has been maintained in the WHO 1993, 2006 and 2011 statements on drinking water.
Based on the toxicokinetic findings regarding absorption of benzene between animals and humans, ATSDR (2007) derived a HBGV (MRL) based on a non-cancer endpoint. They used a decreased lymphocyte count as the critical endpoint in workers in a Chinese shoe factory where inhalation exposure had occurred (Lan et al., 2004). The BMCL0.25SD of 96 μg m-3 (the 95 % confidence interval of the inhalation concentration that causes a benchmark response of a B cell count of 0.25 of a standard deviation below the control value) was considered the point of departure (POD). Applying route-to-route extrapolation of this BMCL, using the above assumptions about absorption, and using an uncertainty factor (UF) of 30 (10 for human variability and 3 for

9
uncertainty in route-to-route extrapolation) gave a MRL of 0.5 μg kg-1 bw day-1 (ATSDR 2007) for non-cancer effects. The USEPA (2003) also derived an oral reference dose (RfD) for non-cancer effects, based on route-to-route extrapolation of the benchmark dose (BMD) (for a hematotoxicity endpoint seen in an exposed Chinese population) modelled from data published by Rothman et al. (1996), using a BMR of one standard deviation change from the control mean. The inhalation 95th lower confidence limit of benchmark dose (BMDL) of 8.2 mg m-3 was converted to the oral BMDL of 1.2 mg kg-1
bw day-1 by assuming adult physiological parameters, and again, using the same assumptions regarding absorption as discussed above. An UF of 300 (3 for use of a LOAEL, 3 for subchronic to chronic extrapolation and 3 for database deficiencies and 10 for human variability) was applied to the oral BMDL giving a RfD of 4 μg kg-1 bw day-1 (USEPA 2003).
Based on the data available, the ‘Pliofilm’ epidemiology data presented by Rinksy et al., (1981, 1987) has been selected as the pivotal study.
GO TO FLOWCHART ELEMENT 6.
2c) Policy choice, with or without a toxicological rationale
Not applicable.
2.1.3 FLOWCHART ELEMENT 6: ARE THERE ADEQUATE DOSE-EFFECTS DATA FOR THE CHOSEN PIVOTAL STUDY – HUMAN DATA?
Yes No Not applicable
X
Human epidemiology studies formed the basis of the benzene drinking water guideline in the first ‘Guidelines for drinking water quality’ document (WHO 1984). WHO referred to “a risk estimate using the human data on leukaemia” and concluded that a drinking-water concentration of 10 μg L-1
would pose an ELCR of 1 in 100,000, and 100 μg L-1 would pose an ELCR of 1 in 10,000 (WHO 1984).
Subsequently, WHO derived an ELCR from the NTP (1986) animal study associated with various concentrations of benzene in drinking water. Both evaluations using animal data were used as the basis of the resulting drinking water guideline value, with greater weight being given to the previous human epidemiology data (Rinsky et al., 1981).
GO TO FLOWCHART ELEMENT 6c
2.1.4 FLOWCHART ELEMENT 6c: SPECIFY AN ELCR ABOVE 1 IN 105
Various authoritative bodies have based their HBGV on an ELCR of 1 in 100,000. For the purpose of deriving the LLTC, however, the dose that equates to an ELCR of 1 in 50,000 is proposed (note that this approach assumes linearity of response). Table 2.1 shows the resultant LLTC.

10
Table 2.1: Proposed choices of oral LLTC values using different PODs and/or CSMs
POD Drinking water
value
(µg L-1)
HCV/LLTC
(µg kg-1 bw day-1)
Current HCV for benzene 1 in 100,000 10 0.29
Proposed LLTC 1 in 50,000 20 0.57
GO TO FLOWCHART ELEMENT 7
2.1.5 FLOWCHART ELEMENT 7: ASSESS LLTC for BENZENE
Based upon a scientific evaluation of leukemia in ‘Pliofilm’ rubber factory workers (Rinksy et al., 1981, 1987), an oral LLTC of 0.57 µg kg-1 bw day-1 is proposed, based on an ELCR of 1 in 50,000 derived from a drinking water concentration of 20 µg L-1. This value:
a) is 2 fold higher that the current EA minimal risk value of 0.29 µg kg-1 bw day-1 (EA 2009)
b) describes 1 in 50,000 lifetime cancer risk
Therefore this LLTC is considered to be a pragmatic level for setting a C4SL, and is suitably protective of all health effects including cancer in the general population.
2.2 INHALATION ROUTE 2.2.1 FLOWCHART ELEMENT 1: COLLATE THE EVALUATIONS FOR THE
CONTAMINANT AS PER SR2: IDENTIFY ALL KNOWN TOXICOLOGICAL HAZARDS; COLLATE HBGVS FROM RELEVANT AUTHORITATIVE BODIES AND SPECIFY THE CONDITIONS OF MINIMAL RISK
As with the oral route, the Science report SC050021 for benzene has been used as the basis of the data search (EA 2009b).
In 2013, the main sources come from Expert Panel on Air Quality Standards (EPAQs 1994), WHO (2000), USEPA (2003) and ATSDR (2007).
The critical toxicological effect of benzene via inhalation is leukaemia or haematotoxicity. For carcinogenic effects, most authoritative bodies based their evaluations on occupational data obtained from the Pliofilm leukaemia data (Rinsky et al. 1981, 1987) or from analyses of such data (Crump 1994, 1996).
EPAQS estimated cancer risk by using data from Rinksy et al. (1987) as well as from Wong (1987), who presented data from a larger cohort of American chemical workers exposed to benzene. USEPA also calculated the inhalation unit risk estimates based on the data from Rinsky et al., (1981, 1987).WHO used cancer risk estimates reported by Crump as the basis of the air quality guideline (WHO 2000).
EA based the ID for benzene on the Air Quality Objective in England and Wales of 5 µg m-3 in order to avoid disproportionately targeting exposures from soil. Based on adult physiological properties, this equates to an intake of 1.4 µg kg bw-1 day-1 (EA 2009b).
For non-cancer endpoints USEPA used data by Rothman et al. (1996) and ATSDR used data from Lan (2004).
The ATSDR toxicological profile for benzene document covers a review of the primary literature base on the toxicology of benzene by inhalation exposure (ATSDR 2007) and maps all quantitative toxicological responses seen in animal and humans. An

11
example of the type of information provided in the ATSDR report is shown below in Figure 2.2.
This review provides the best evidence that respiratory and immunological effects are the most sensitive of all non-cancer effects by the inhalation route.
Figure 2.2: Example of all chronic (>365 days) animal and human study evaluations that lead to different adverse toxicological responses following inhalation exposure (ATSDR 2007)
2.2.2 FLOWCHART ELEMENT 2: REVIEW THE SCIENTIFIC BASIS OF EACH HBGV. CHOOSE THE PIVOTAL STUDY
As above, flowchart element 2 requires a suitably qualified individual who sufficiently understands the nature of toxicological data to identify the scientific basis of all existing HCVs for the inhalation route. Again, three possible options are provided for

12
the type of pivotal study that could be chosen at this point, i.e. in the form of: 1) animal toxicology data; 2) human toxicology/epidemiology data; and 3) an evidence informed policy choice (i.e. based on an existing guideline from another regime, with or without a toxicological rationale). 2a) Animal Toxicology Data
Not applicable as no animal data were used as the pivotal data in the evaluation of the inhalation toxicity of benzene.
2b) Human Toxicology/Epidemiology Data
Expert group consensus recommends that leukaemia is the most sensitive health effect following inhalation of benzene, based on the occupational data from rubber workers in the Pliofilm cohort (Rinsky et al., 1981, 1987).
USEPA calculated the inhalation unit risk estimates to be 2.2 – 7.8 x 10⁻⁶ per µg m-3. Based on the same data, WHO reported the geometric mean of the range of estimates of ELCR of leukaemia to be 6 x 10⁻⁶ at an air concentration of 1 µg m-3 (WHO 2000). Therefore, the concentrations of benzene in air associated with an ELCR of 1 in 10,000, 100,000 and 1,000,000 are 17, 1.7 and 0.17 µg m-3 (WHO 2000).
The EU INDEX project (EU-JRC, 2005), EU Scientific Committee on Health and Environmental Risks (SCHER; 2006) and National Institute for Public Health and the Environment (RIVM (2001) all used this unit risk calculation as the basis of their HBGVs.
EU RAR also used Crump data (1994, 1996), and assumed that 45 years of occupation exposure to benzene concentrations of 3.2 µg m-3 may pose a ELCR of 1 in 50,000 (EC 2003).
As well as assessing the Pliofilm data, EPAQS also used the data from Wong (1987) and concluded that the risk of leukemia was not detectable in workers when exposure was 1600 µg m-3 (considered the No Observed Adverse Effect Level (NOAEL)). To convert to from occupational to continuous exposure a factor of 10 was applied, as well as 10 for human variability, leading to an Air Quality Standard of 16 µg m-3 as a running annual average. However, they recommended the lower target standard of 3.2 µg m-3 using the Crump data since benzene is a genotoxic carcinogen (EPAQS 1998).
For non-cancer endpoints, USEPA, ATSDR and EU INDEX project all carried out risk assessment based on various epidemiology studies. USEPA based their evaluation on a reduced lymphocyte count in Shanghai factory workers (Rothman et al. 1996), deriving a RfC of 30 µg m-3. ATSDR used occupational data from Chinese shoe factory workers (Lan et al. 2004) deriving a MRL of 9.6 µg m-3. The EU INDEX project used the occupational study by Tsai et al. (1983) to derive their HBGV of 60 µg m-3.
All non-cancer HBGVs are above the benzene concentration in air that would pose an ELCR of 1 in 100,000 hence a guideline value of 1.7 µg m-3 would also protect against non-cancer effects.
GO TO FLOWCHART ELEMENT 6
2c) Policy choice, with or without a toxicological rationale
Defra recommended an annual average concentration of 5 µg m-3 in setting the Air Quality Objective for England and Wales (Defra 2007), to be achieved by 2010 although acknowledged that exposure to benzene should be as low as reasonably practicable, and recommended a target of 3.2 µg m-3 as a running annual mean. However, in order to avoid disproportionately targeting exposures from soil, it was recommended that the higher value was used in deriving HCVs for benzene. Based on an adult of 70 kg breathing 20 m3 per day, this Air Quality Objective of 5 µg m-3 equates to an intake of 1.4 µg kg-1 bw day-1, which is higher than the health based values equating to and ELCR of 1 in 50,00 – 1 in 100,000 described above.

13
2.2.3 FLOWCHART ELEMENT 6: ARE THERE ADEQUATE DOSE-EFFECTS DATA FOR THE CHOSEN PIVOTAL STUDY – HUMAN DATA?
Yes No Not applicable
X GO TO FLOWCHART ELEMENT 6c
2.2.4 FLOWCHART ELEMENT 6c. SPECIFY AN ELCR ABOVE 1 IN 105
As described above, various bodies have presented data outlining the carcinogenic risk of benzene via inhalation. EPAQS derived a value of 3.2 µg m-3 as the minimal risk value, equating to an intake of 0.9 µg kg-1 bw day-1. WHO presented benzene concentrations of 17, 1.7 and 0.17 µg m-3 that correspond to an ELCRs of 1 in 10,000, 100,000 and 1,000,000, respectively and intake values of 5.0, 0.5 and 0.05 µg kg-1 bw day-1, respectively. The target concentration 5 µg m-3, adopted in the UK Air Quality Standards Regulation (Defra 2007) would approximately correlate to a cancer risk of 1 in 34,000, assuming linearity and an intake of 1.4 µg kg-1 bw day-1. Table 2.2 presents the resultant LLTCs based on different air concentrations and consequently varying levels of cancer risk.
Table 2.2: Proposed choices of inhalation LLTC values using different PODs and/or CSMs
POD Air
concentration
(µg m-3)
HCV/LLTC
(µg kg-1 bw day-1)
Alternative 1 in 100,000 1.7 0.5
Alternative 1 in 50,000 3.4 1.0
Current HCV for benzene AQO (1 in 34,000) 5 1.4 *using receptor specific physiological parameters
GO TO FLOWCHART ELEMENT 7
2.2.5 FLOWCHART ELEMENT 7: ASSESS LLTC for BENZENE
Based upon a scientific evaluation of carcinogenic data in humans, an inhalation LLTC of 1.4 µg kg-1 bw day-1 is proposed, based on an ELCR of 1 in 34,000, derived from the UK Air Quality Standards Regulation of 5 µg m-3. This value:
a) is the same as the current EA minimal risk value (EA 2009);
b) describes a 1 in 34,000 lifetime cancer risk
c) is lower than the adult mean intake from ambient air in indoor environments (2.9 µg kg-1 bw day-1).
Therefore this LLTC is considered to be a pragmatic level for setting a C4SL to avoid disproportionately targeting exposures from soil.
2.2.6 CALCULATION OF A CHILD-SPECIFIC LLTC FOR BENZENE
As described above, the oral LLTC is based on an adjustment to the WHO drinking water guideline of 10 µg L-1, which corresponds to an ELCR of 1 in 100,000. A drinking water concentration of 20 µg L-1 would give an ELCR of 1 in 50,000 and this equates to 0.57 µg kg-1 bw day-1 based on default physiological parameter values for the adult receptor that would be considered in the commercial land use scenario. Derivation of receptor-specific oral LLTCs has not been undertaken due to it being based on the health-based drinking water guideline recommended by WHO.
As described above, the inhalation LLTC is based on the Air Quality Objective for England and Wales of 5 µg m-3, which equates to 1.4 µg kg-1 bw day-1 based on default physiological parameter values for the adult receptor that would be considered

14
in the commercial land use scenario. Inhalation LLTCs for other land use scenarios are derived based on receptor-specific physiological parameter values (i.e. for bodyweight and inhalation rate) and are detailed in Table 2.3. Table 2.3: Proposed benzene inhalation LLTCs for C4SL land use scenarios
Land use Critical receptor
Receptor age
classes
Average bodyweight
(kg)
Inhalation rate
(m3 day-1)
LLTCinh
(µg kg-1 bw day-1)
Residential Female child 1-6 13.3 8.8 3.3
Allotments Female child 1-6 13.3 8.8 3.3
Commercial Female worker 17 701 20 1.4
POS-residential Female child 4-9 21 11 2.6
POS-park Female child 1-6 13.3 8.8 3.3
2.3 DERMAL ROUTE Benzene is poorly absorbed through the skin and there are no specific toxicity data, HBGVs or authoritative evaluations on the dermal route of exposure. Although route-specific toxicity cannot be determined, exposure via this route is considered during the exposure modelling.
1 Default adult physiological parameter values for conversion of media concentrations to intake values detailed in EA, 2009a. Values for other receptors are the average bodyweight and inhalation rate for the age class range taken from EA, 2009b.

15
3. EXPOSURE MODELLING FOR BENZENE As described in step 4 of the framework (see Section 5.1 of the main report), the CLEA model has been used deterministically with the LLTCs to derive provisional C4SLs for the following six land-uses:
• Residential with consumption of homegrown produce; • Residential without consumption of homegrown produce; • Allotments; • Commercial; • Public open space (POS):
o The scenario of open space close to housing that includes tracking back of soil (POSresi); and
o A park-type scenario where the park is considered to be at a sufficient distance from the home that there is negligible tracking back of soil (POSpark).
The CLEA model has then been used probabilistically to determine the probability that exposure of a random individual within the critical receptor group would exceed the LLTC values for a range of different soil concentrations (step 5). This probabilistic step helps to illustrate the level of precaution provided by each pC4SL and, if necessary, can be used to guide any modifications judged necessary. The approach and key assumptions for both types of exposure modelling are discussed in the following sections. The results of the modelling are presented in Section 4.
3.1 DETERMINISTIC MODELLING
Deterministic modelling uses a single value for each parameter input and derives one estimate of ADE for each exposure pathway. ADEs are then summed for some or all exposure pathways for comparison with the LLTC. The pathways considered in the summation are dependent on the critical toxicological effects that the LLTC is based on. In the case of benzene blood and the immune system are the main targets of chronic exposure and all routes of exposures contribute to the same systemic effect of leukemia. Therefore the sum of the oral and dermal exposures have been compared with the LLTCoral and the sum of the inhalation exposures has been compared with LLTCinhal. CLEA uses iteration to find the soil concentrations at which the summed ADEs equal the respective LLTC values and these are termed ‘assessment criteria’ (AC). As described in the CLEA SR2 and SR3 documents (EA, 2009 c & d), the AC are integrated by CLEA to determine an overall AC where the critical toxicological effects via both routes of exposure are systemic. Given that both the LLTCoral and LLTCinhal are based on systemic effects this approach has been taken to determine the pC4SLs for benzene. The assumptions and non-contaminant specific parameter values used for the derivation of the pC4SLs are presented in Section 3 of the main report. For residential, allotments and commercial land-uses the assumptions and parameter values are as those described in the SR3 report (EA, 2009d) with the exception of those summarised in Section 3.5.7 of the main report. Note that for consumption of homegrown produce CLEA predicts the greatest exposure to benzene from root vegetables and tree fruit for both the residential and allotments scenarios. Therefore, in accordance with the “top two” approach (see Section 3.5.5.3 of the main text for further details), 90th percentile consumption rates have been used for these two produce types and mean consumption rates have been used for the remaining produce types. For the POS land-uses the assumptions and parameter values are described in Section 3.6 of the main report. Note that the C4SLs have been derived assuming a sandy loam soil type containing 6% organic matter (i.e. as used for deriving SGVs).
16
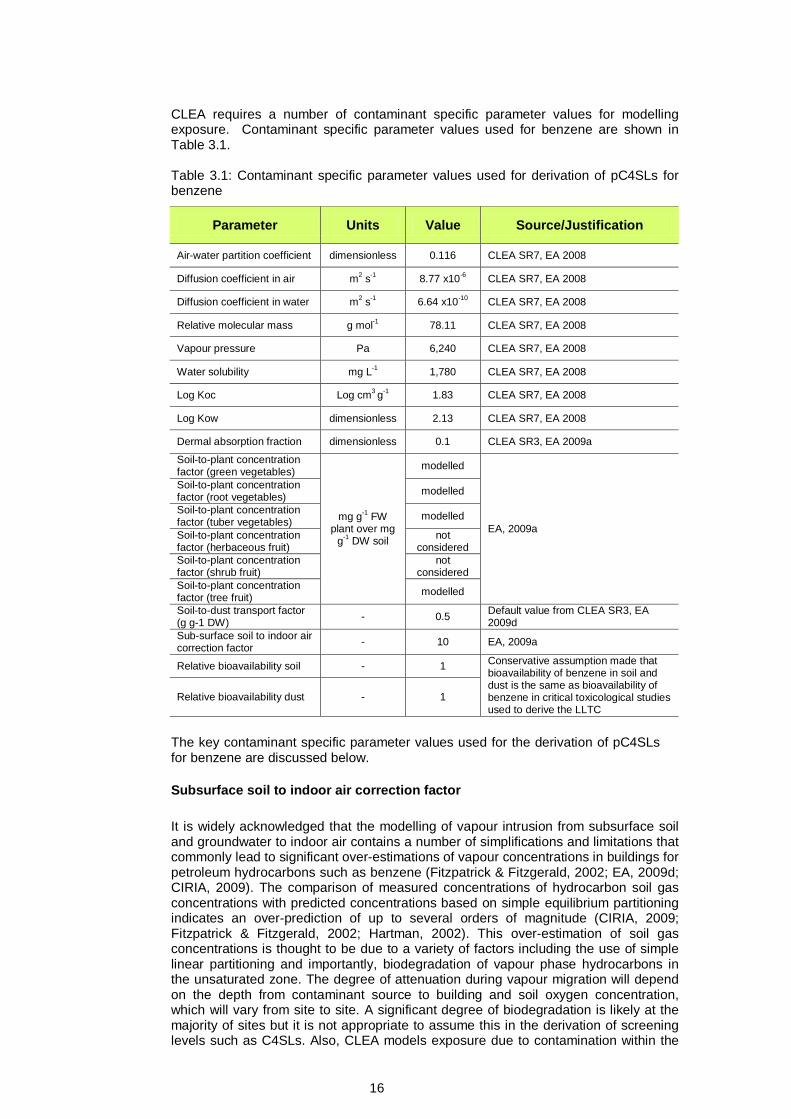
CLEA requires a number of contaminant specific parameter values for modelling exposure. Contaminant specific parameter values used for benzene are shown in Table 3.1. Table 3.1: Contaminant specific parameter values used for derivation of pC4SLs for benzene
Parameter Units Value Source/Justification
Air-water partition coefficient dimensionless 0.116 CLEA SR7, EA 2008
Diffusion coefficient in air m2 s-1 8.77 x10⁻⁶ CLEA SR7, EA 2008
Diffusion coefficient in water m2 s-1 6.64 x10⁻¹⁰ CLEA SR7, EA 2008
Relative molecular mass g mol-1 78.11 CLEA SR7, EA 2008
Vapour pressure Pa 6,240 CLEA SR7, EA 2008
Water solubility mg L-1 1,780 CLEA SR7, EA 2008
Log Koc Log cm3 g-1 1.83 CLEA SR7, EA 2008
Log Kow dimensionless 2.13 CLEA SR7, EA 2008
Dermal absorption fraction dimensionless 0.1 CLEA SR3, EA 2009a
Soil-to-plant concentration factor (green vegetables)
mg g-1 FW plant over mg
g-1 DW soil
modelled
EA, 2009a
Soil-to-plant concentration factor (root vegetables) modelled
Soil-to-plant concentration factor (tuber vegetables) modelled
Soil-to-plant concentration factor (herbaceous fruit)
not considered
Soil-to-plant concentration factor (shrub fruit)
not considered
Soil-to-plant concentration factor (tree fruit) modelled
Soil-to-dust transport factor (g g-1 DW) - 0.5 Default value from CLEA SR3, EA
2009d Sub-surface soil to indoor air correction factor - 10 EA, 2009a
Relative bioavailability soil - 1 Conservative assumption made that bioavailability of benzene in soil and dust is the same as bioavailability of benzene in critical toxicological studies used to derive the LLTC
Relative bioavailability dust - 1
The key contaminant specific parameter values used for the derivation of pC4SLs for benzene are discussed below. Subsurface soil to indoor air correction factor It is widely acknowledged that the modelling of vapour intrusion from subsurface soil and groundwater to indoor air contains a number of simplifications and limitations that commonly lead to significant over-estimations of vapour concentrations in buildings for petroleum hydrocarbons such as benzene (Fitzpatrick & Fitzgerald, 2002; EA, 2009d; CIRIA, 2009). The comparison of measured concentrations of hydrocarbon soil gas concentrations with predicted concentrations based on simple equilibrium partitioning indicates an over-prediction of up to several orders of magnitude (CIRIA, 2009; Fitzpatrick & Fitzgerald, 2002; Hartman, 2002). This over-estimation of soil gas concentrations is thought to be due to a variety of factors including the use of simple linear partitioning and importantly, biodegradation of vapour phase hydrocarbons in the unsaturated zone. The degree of attenuation during vapour migration will depend on the depth from contaminant source to building and soil oxygen concentration, which will vary from site to site. A significant degree of biodegradation is likely at the majority of sites but it is not appropriate to assume this in the derivation of screening levels such as C4SLs. Also, CLEA models exposure due to contamination within the

17
upper 65cm of soil (i.e. the base of the building may be in direct contact with the source of contamination) thus reducing the potential for attenuation during migration. The CLEA model uses the Johnson and Ettinger (J & E) vapour intrusion model in order to estimate the transport of contaminant vapour from soil gas to indoor air. The J & E sub-model is thought to over-estimate vapour intrusion for a large proportion of UK building stock and particularly new builds (CIRIA, 2009). The J & E model within CLEA assumes a residential property built on a ground-bearing slab, whereas most new houses in the UK have a precast suspended floor slab with a ventilated void below it (Wilson, 2008). However, a screening level is required to be sufficiently conservative to protect all types of building and increasing the correction factor on this basis would not be protective for some of the UK housing stock. The SGV for benzene (EA, 2009a) includes a subsurface to indoor air correction factor of 10 in order to account for the over-prediction of soil gas concentrations of petroleum hydrocarbons based on simple linear partitioning. It is recommended that this value is retained in derivation of the C4SLs but it is acknowledged that this is likely to be highly conservative for the majority of sites. The impacts of uncertainty in this factor have been further assessed in the probabilistic modelling (Section 4.2). Where the vapour inhalation pathway is identified as the main risk driver for a site it is recommended that DQRA is undertaken using appropriate modelling approaches for the site and buildings or that direct measurement is made of soil gas and/or indoor air concentrations following appropriate technical guidance (e.g. CIRIA, 2009). Modelling of soil to plant concentration factors Benzene is only moderately hydrophobic (log Kow = 2.13) and can therefore enter the transpiration system through the roots and be transported to stems and leaves. As a volatile compound benzene vapour can also be taken up by leaves and this pathway for plant uptake has been the most commonly studied. A literature review by the EA (EA, 2009e; supplementary report to SGV) did not identify sufficient data to specify soil-to-plant concentrations factors. The generic CLEA algorthims for plant uptake of organic compounds were therefore used in the derivation of benzene SGVs. There are little data available on plant uptake of petroleum hydrocarbons with which to validate these algorithms (EA, 2006) so their accuracy for benzene is uncertain. Also, benzene is known to be metabolised within plants to varying extents which will reduce concentrations in homegrown produce. It should noted that no suitable algorithms were identified for estimating uptake of organic chemicals into herbaceous and shrub fruits and these produce groups are not considered in the derivation of SGVs or C4SLs for benzene. Further consideration may therefore be necessary if these plant types make up a large proportion of the homegrown produce consumed from a specific site.
3.2 PROBABILISTIC MODELLING
The sensitivity analysis described in Section 3.4 of the main report helped to identify the key parameters contributing to the greatest uncertainty in the model results. The CLEA model has been used probabilistically, substituting the single deterministic values for these parameters with a probability density function and using Monte Carlo analysis to derive a distribution of possible ADE results for a given soil concentration; all other parameters in CLEA remain unchanged as deterministic single values. Although there is uncertainty in the remaining parameters, the sensitivity analysis demonstrated that this does not give rise to significant uncertainty in the CLEA model outputs and these remaining parameters have not therefore been modelled probabilistically. Key parameters modelled probabilistically together with an indication of where and how they are correlated are shown for the residential and allotments land-uses in Table 3.2.

18
Table 3.2: Parameters modelled probabilistically for benzene
Parameter
Generic Land-use
Correlation Residential
Allot-ments
With home grown prod.
Without home grown prod.
Body weight
Correlated between age classes, i.e. a heavy one year old is assumed to become a heavy six year old. Body weight is also correlated with inhalation rate, i.e. a child in the upper percentile body weight will also have an upper percentile inhalation rate
Soil ingestion rate Correlated between age classes
Inhalation rate Correlated between age classes and with body weight
Subsurface soil to indoor air correction factor
Not correlated with other parameters
Produce consumption rate
Correlated between age classes. Also, consumers of homegrown produce assumed to be within the upper quartile of consumers of fruit and vegetables
Homegrown fraction
Correlated between produce types, i.e. an individual who consumes potatoes, most of which are homegrown will also consume mostly homegrown root and green vegetables and fruit
A probability density function (PDF) has been derived for each of these parameters. The type of distribution (e.g. normal, log normal, beta etc.) and associated attributes (e.g. mean, standard deviation or 95th percentile) selected for each parameter have been chosen to best represent the range of distribution families considered. The PDF type and associated attributes for contaminant specific parameters are summarised in Table 3.3 below for contaminant specific parameters. The PDF types and attributes for the remaining parameters modelled probabilistically are summarised in Appendix B of the main report.
Table 3.3: PDF attributes for contaminant specific parameters for Monte Carlo analysis for benzene
Parameter Units Basis of PDF PDF attributes
Subsurface soil to indoor air correction factor -
Log normal PDF assumed with mean and standard deviation based on inverse of Hc values for benzene from Fitzpatrick and Fitzgerald (1996) (Mean Hc = 0.0005, SD = 0.0005)
AF = 1/Hc, Hc = Log normal (geomean 0.035, SD (ln) 0.855)

19
4. PROVISIONAL C4SLs FOR BENZENE As described in the framework (see Section 5.1 of the main report), the setting of C4SLs involves an initial deterministic stage, whereby modified CLEA exposure modelling is combined with LLTCs to produce provisional C4SLs (pC4SLs) (Step 4), followed by quantitative (Step 5) and qualitative evaluations of uncertainty (Steps 6a and 6b), using probabilistic modelling and other methods, to examine their likely levels of precaution. Other considerations are also brought to bear (Steps 6c and 6d), such that any final C4SLs (Step 7) can most closely match Defra’s defined policy objectives.
4.1 PROVISIONAL C4SLs The pC4SLs for benzene, derived from the deterministic CLEA modelling using the proposed LLTC values, are presented in Table 4.1 below, along with benzene’s existing SGVs.
Table 4.1: Provisional C4SLs and SGVs (in mg kg-1)
Exposure parameters
HCV or LLTC µg kg-1(bw)
day-1 pC4SL
Oral Inhal
Residential
Allot-ments
Commercial POSresi POSpark
With home grown prod.
Without home grown prod.
Current SGV 0.29 1.4 0.33 N/A 0.07 95 N/A N/A pC4SL with exposure changes only 1
0.29 1.4 0.42 1.4 0.09 90 72 110
pC4SL with LLTC but exposure parameters as SR3 2,3
0.57 1.4-3.33 0.69 2.3 0.15 100 N/A N/A
pC4SL with changes in exposure and LLTC 0.57 1.4-3.33
0.87 3.3 0.18 98 140 230
- 6% SOM
- 1% SOM4 0.20 0.89 0.039 27 140 190
1 Parameters as described in Section 4. Calculated for 6% SOM 2 Chemical specific parameters as described above. Non-contaminant specific parameters as SR3. Calculated for 6% SOM. 3 Note age specific adjustments used for residential and POS land-uses as shown in Table 3.5. N/A: Not applicable 4 Comparative pC4SLs calculated with 1% SOM to demonstrate that lower screening levels are required when less soil organic matter is present (this is particularly evident for land uses where exposure is dominated by inhalation of vapour indoors) The relative contribution of each exposure pathway to total ADE is shown for each land-use in Table 4.2.
20
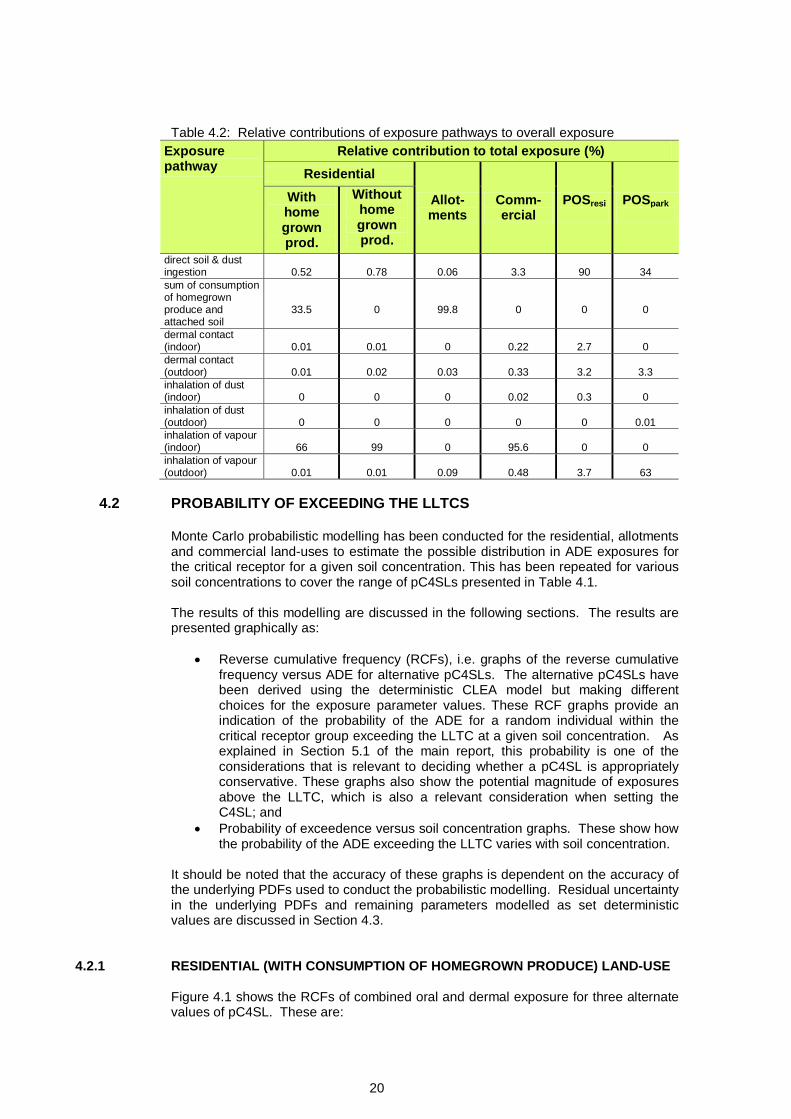
Table 4.2: Relative contributions of exposure pathways to overall exposure
Exposure pathway
Relative contribution to total exposure (%) Residential
Allot-ments
Comm-ercial
POSresi
POSpark
With home grown prod.
Without home grown prod.
direct soil & dust ingestion
0.52
0.78
0.06
3.3
90
34
sum of consumption of homegrown produce and attached soil
33.5
0
99.8
0
0
0
dermal contact (indoor)
0.01
0.01
0
0.22
2.7
0
dermal contact (outdoor)
0.01
0.02
0.03
0.33
3.2
3.3
inhalation of dust (indoor)
0
0
0
0.02
0.3
0
inhalation of dust (outdoor)
0
0
0
0
0
0.01
inhalation of vapour (indoor)
66
99
0
95.6
0
0
inhalation of vapour (outdoor)
0.01
0.01
0.09
0.48
3.7
63
4.2 PROBABILITY OF EXCEEDING THE LLTCS
Monte Carlo probabilistic modelling has been conducted for the residential, allotments and commercial land-uses to estimate the possible distribution in ADE exposures for the critical receptor for a given soil concentration. This has been repeated for various soil concentrations to cover the range of pC4SLs presented in Table 4.1. The results of this modelling are discussed in the following sections. The results are presented graphically as:
• Reverse cumulative frequency (RCFs), i.e. graphs of the reverse cumulative frequency versus ADE for alternative pC4SLs. The alternative pC4SLs have been derived using the deterministic CLEA model but making different choices for the exposure parameter values. These RCF graphs provide an indication of the probability of the ADE for a random individual within the critical receptor group exceeding the LLTC at a given soil concentration. As explained in Section 5.1 of the main report, this probability is one of the considerations that is relevant to deciding whether a pC4SL is appropriately conservative. These graphs also show the potential magnitude of exposures above the LLTC, which is also a relevant consideration when setting the C4SL; and
• Probability of exceedence versus soil concentration graphs. These show how the probability of the ADE exceeding the LLTC varies with soil concentration.
It should be noted that the accuracy of these graphs is dependent on the accuracy of the underlying PDFs used to conduct the probabilistic modelling. Residual uncertainty in the underlying PDFs and remaining parameters modelled as set deterministic values are discussed in Section 4.3.
4.2.1 RESIDENTIAL (WITH CONSUMPTION OF HOMEGROWN PRODUCE) LAND-USE Figure 4.1 shows the RCFs of combined oral and dermal exposure for three alternate values of pC4SL. These are:

21
1. pC4SL = 0.69 mg kg-1. This is the pC4SL derived assuming a SOM of 6% and using an LLTCoral of 0.57 µg kg-1 bw day-1 and an age class adjusted LLTCinhal of 3.3 µg kg-1 bw day-1 but making no changes to the exposure parameters from the CLEA SR3 report;
2. pC4SL = 0.87 mg kg-1. This is the pC4SL derived using an LLTC as above but with the proposed modifications to exposure modelling parameters described in Section 3.5.7 of the main report; and
3. pC4SL = 1.8 mg kg-1. This is the pC4SL derived as above, but with additional modifications to exposure modelling parameters that had been proposed in the draft interim methodology document produced in advance of the first Stakeholder Workshop. These additional modifications are soil ingestion rate reduced to 80 mg d-1, mean consumption rate used for all produce types, homegrown fraction halved for all produce types and dust loading factor reduced to 25 µg .m-3.
The coloured curves on Figure 4.1 show the RCFs for the alternative pC4SLs. These curves show that there is a high probability of exposure exceeding a low ADE value but a low probability of exposure exceeding a high value. Figure 4.1 also shows the LLTCoral (as a dashed line) along with estimates of average background exposure from non soil sources for comparison with the RCFs of average daily exposure. As discussed below, the probability of inhalation exposure exceeding the LLTCinhal is negligible and so RCFs are not presented for inhalation exposure in Figure 4.1. Note that the probabilistic modelling for residential (with consumption of home-grown produce land-use) is based on the assumption that the property has a garden and the critical receptor consumes produce grown in that garden (albeit to varying degrees).
0
0.1
0.2
0.3
0.4
0.5
0.6
0.7
0.8
0.9
1
0 1 2 3 4 5 6
Reve
rse
Cum
ulat
ive
Freq
uenc
y
ADE for oral and dermal pathways (ug.kg-1(bw).day-1)
pC4SL=0.69mg/kg
pC4SL=0.87mg/kg
pC4SL=1.8mg/kg
Figure 4.1: Reverse cumulative frequency graph of ADE for alternative values of pC4SL for benzene for residential (with consumption of homegrown produce) land-use with 6% SOM Figure 4.1 can be used to estimate the probability that exposure to a random individual within the critical receptor group would exceed the LLTCoral by reading off the probability from the y axis where the RCF curve intersects the LLTC vertical dashed line. Thus, the probability that exposure would exceed the LLTCoral is 23% for a soil concentration of 0.69 mg kg-1, increasing to 31% and 55% for soil concentrations of 0.87 and 1.8 mg kg-1, respectively. The probability that exposure would exceed ten times the LLTCoral (i.e. 5.7 ug.kg(bw)-1.day-1) is less than 1%. As discussed in Section 4.3, a generally conservative approach has been adopted for the
LLTCoral
Estimates of mean daily intake from non soil sources

22
probabilistic modelling and it is possible that the true probabilities of exceedence are significantly lower. Figure 4.1 can also be used to assess the relative importance of background exposure to exposure from soils. In the case of benzene for residential (with consumption of homegrown produce) median exposures from the alternative pC4SLs are significantly greater than the estimated mean daily intake background exposure. The large range in exposures for the residential scenario indicated by Figure 4.1 is principally due to the large range in possible values for the homegrown fraction and consumption rate. For families who grow a large quantity of fruit and vegetables in their garden for home consumption, exposure could be more than order of magnitude above median exposure. Figure 4.2 presents the probability of exceedence graphs for residential (with consumption of homegrown produce) land-use. This graph shows two curves: the probability that the oral and dermal exposure from soil exceeds the LLTCoral and the probability that inhalation exposure from soil exceeds the LLTCinhal. Like Figure 4.1, this graph can also be used to estimate the probability that exposure to a random individual in the critical receptor group exceeds the LLTC for alternative pC4SL, but has the added advantage that the relationship between probability of exceedence and soil concentration can be seen more easily. Figure 4.2 shows that there is negligible probability that inhalation exposure would exceed the LLTCinhal for the range of alternative pC4SL.
0
0.1
0.2
0.3
0.4
0.5
0.6
0.7
0 0.5 1 1.5 2
Prob
abili
ty o
f exp
osur
e ex
ceed
ing
the
LLTC
for
the
iden
tifie
d re
cept
or
Soil concentration (mg kg-1)
P that oral + dermal ADE > LLTCoral of 0.57 ug.kg-1.d-1
P that ADEinhal > LLTCinhal of 3.3 ug.kg-1.d-1
Figure 4.2: Probability of exposure exceeding an LLTC with alternative values of pC4SLs for benzene for residential (with consumption of homegrown produce) land-use with 6% SOM
Alternative pC4SL
23
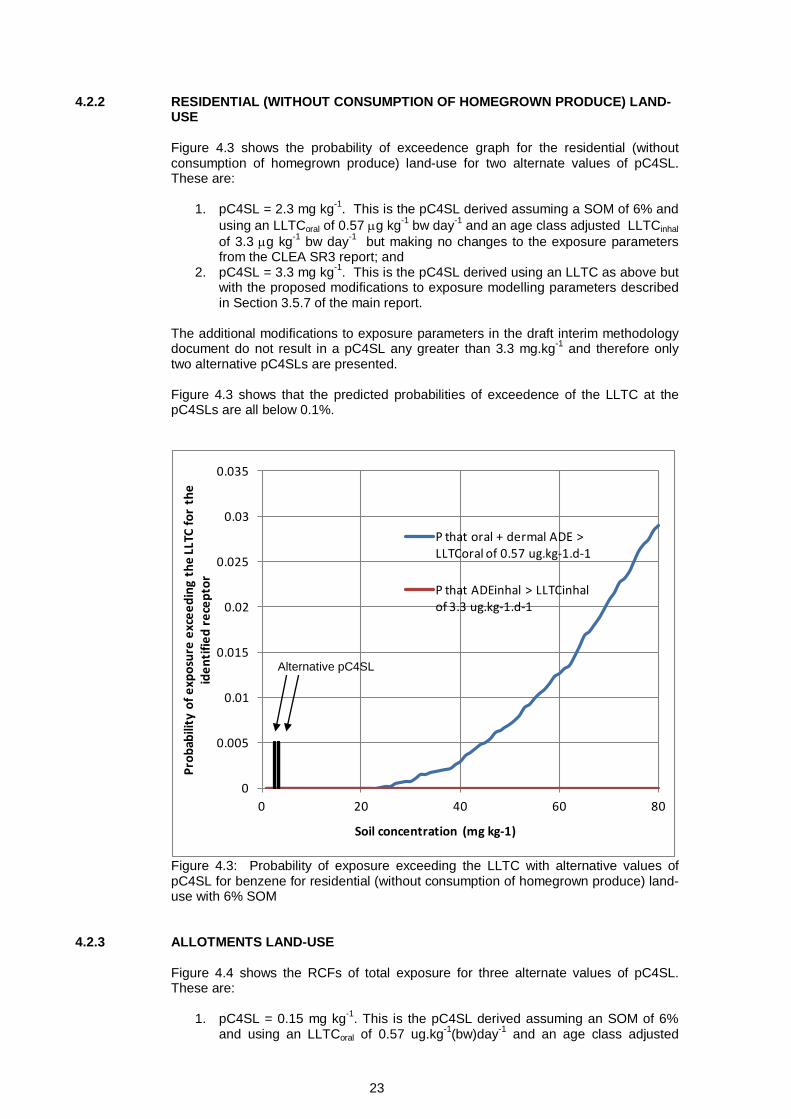
4.2.2 RESIDENTIAL (WITHOUT CONSUMPTION OF HOMEGROWN PRODUCE) LAND-USE Figure 4.3 shows the probability of exceedence graph for the residential (without consumption of homegrown produce) land-use for two alternate values of pC4SL. These are:
1. pC4SL = 2.3 mg kg-1. This is the pC4SL derived assuming a SOM of 6% and using an LLTCoral of 0.57 µg kg-1 bw day-1 and an age class adjusted LLTCinhal of 3.3 µg kg-1 bw day-1 but making no changes to the exposure parameters from the CLEA SR3 report; and
2. pC4SL = 3.3 mg kg-1. This is the pC4SL derived using an LLTC as above but with the proposed modifications to exposure modelling parameters described in Section 3.5.7 of the main report.
The additional modifications to exposure parameters in the draft interim methodology document do not result in a pC4SL any greater than 3.3 mg.kg-1 and therefore only two alternative pC4SLs are presented. Figure 4.3 shows that the predicted probabilities of exceedence of the LLTC at the pC4SLs are all below 0.1%.
0
0.005
0.01
0.015
0.02
0.025
0.03
0.035
0 20 40 60 80
Prob
abili
ty o
f exp
osur
e ex
ceed
ing
the
LLTC
for
the
iden
tifie
d re
cept
or
Soil concentration (mg kg-1)
P that oral + dermal ADE > LLTCoral of 0.57 ug.kg-1.d-1
P that ADEinhal > LLTCinhal of 3.3 ug.kg-1.d-1
Figure 4.3: Probability of exposure exceeding the LLTC with alternative values of pC4SL for benzene for residential (without consumption of homegrown produce) land-use with 6% SOM
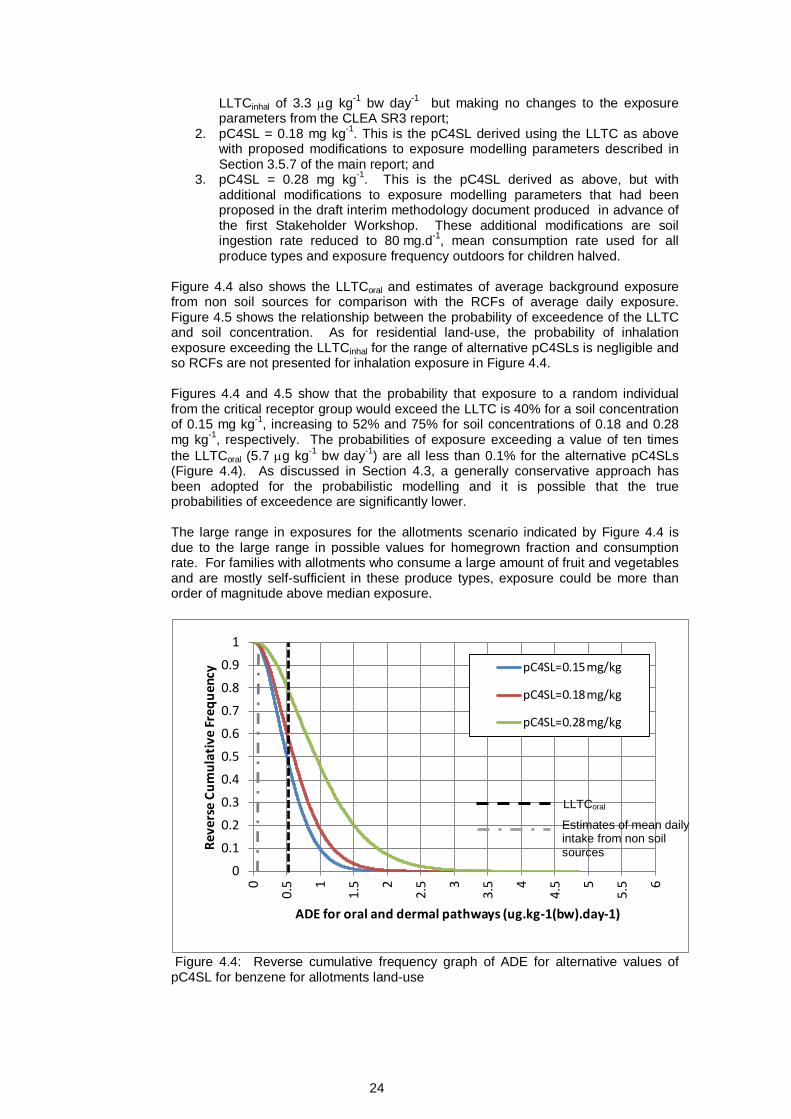
4.2.3 ALLOTMENTS LAND-USE Figure 4.4 shows the RCFs of total exposure for three alternate values of pC4SL. These are:
1. pC4SL = 0.15 mg kg-1. This is the pC4SL derived assuming an SOM of 6% and using an LLTCoral of 0.57 ug.kg-1(bw)day-1 and an age class adjusted
Alternative pC4SL
24
LLTCinhal of 3.3 µg kg-1 bw day-1 but making no changes to the exposure parameters from the CLEA SR3 report;
2. pC4SL = 0.18 mg kg-1. This is the pC4SL derived using the LLTC as above with proposed modifications to exposure modelling parameters described in Section 3.5.7 of the main report; and
3. pC4SL = 0.28 mg kg-1. This is the pC4SL derived as above, but with additional modifications to exposure modelling parameters that had been proposed in the draft interim methodology document produced in advance of the first Stakeholder Workshop. These additional modifications are soil ingestion rate reduced to 80 mg.d-1, mean consumption rate used for all produce types and exposure frequency outdoors for children halved.
Figure 4.4 also shows the LLTCoral and estimates of average background exposure from non soil sources for comparison with the RCFs of average daily exposure. Figure 4.5 shows the relationship between the probability of exceedence of the LLTC and soil concentration. As for residential land-use, the probability of inhalation exposure exceeding the LLTCinhal for the range of alternative pC4SLs is negligible and so RCFs are not presented for inhalation exposure in Figure 4.4. Figures 4.4 and 4.5 show that the probability that exposure to a random individual from the critical receptor group would exceed the LLTC is 40% for a soil concentration of 0.15 mg kg-1, increasing to 52% and 75% for soil concentrations of 0.18 and 0.28 mg kg-1, respectively. The probabilities of exposure exceeding a value of ten times the LLTCoral (5.7 µg kg-1 bw day-1) are all less than 0.1% for the alternative pC4SLs (Figure 4.4). As discussed in Section 4.3, a generally conservative approach has been adopted for the probabilistic modelling and it is possible that the true probabilities of exceedence are significantly lower. The large range in exposures for the allotments scenario indicated by Figure 4.4 is due to the large range in possible values for homegrown fraction and consumption rate. For families with allotments who consume a large amount of fruit and vegetables and are mostly self-sufficient in these produce types, exposure could be more than order of magnitude above median exposure.
0
0.1
0.2
0.3
0.4
0.5
0.6
0.7
0.8
0.9
1
0
0.5 1
1.5 2
2.5 3
3.5 4
4.5 5
5.5 6
Reve
rse
Cum
ulat
ive
Freq
uenc
y
ADE for oral and dermal pathways (ug.kg-1(bw).day-1)
pC4SL=0.15 mg/kg
pC4SL=0.18 mg/kg
pC4SL=0.28 mg/kg
Figure 4.4: Reverse cumulative frequency graph of ADE for alternative values of pC4SL for benzene for allotments land-use
LLTCoral
Estimates of mean daily intake from non soil sources

25
0
0.1
0.2
0.3
0.4
0.5
0.6
0.7
0.8
0.9
1
0 0.1 0.2 0.3 0.4 0.5 0.6 0.7 0.8
Prob
abili
ty o
f exp
osur
e ex
ceed
ing
the
LLTC
for
the
iden
tifie
d re
cept
or
Soil concentration (mg kg-1)
P that oral + dermal ADE > LLTCoral of 0.57 ug.kg-1.d-1
P that ADEinhal > LLTCinhal of 3.3 ug.kg-1.d-1
Figure 4.5: Probability of exposure exceeding the LLTC with alternative values of pC4SL for benzene for allotments land-use As can be seen from Figure 4.4 median exposures from the three alternative pC4SLs are significantly greater than estimated background oral exposure.
4.2.4 COMMERCIAL LAND-USE Figure 4.6 shows the probability of exceedence graph for the commercial land-use for two alternate values of pC4SL. These are:
1. pC4SL = 100 mg kg-1. This is the pC4SL derived assuming an SOM of 6% and using an LLTCoral of 0.57 ug.kg-1(bw)day-1 and an LLTCinhal of 1.4 µg kg-1 bw day-1 but making no changes to the exposure parameters from the CLEA SR3 report; and
2. pC4SL = 98 mg kg-1. This is the pC4SL derived as above, but with the proposed modifications to exposure modelling parameters described in Section 3.5.7 of the main report (slight increase in inhalation rate).
The additional modifications to exposure parameters in the draft interim methodology document do not result in a pC4SL any greater than 98 mg.kg-1 and therefore only two alternative pC4SLs are presented. Figure 4.6 shows that the predicted probabilities of exceedence of the LLTC at the pC4SLs are all below 0.1%.
Alternative C4SL

26
0
0.01
0.02
0.03
0.04
0.05
0.06
0.07
0 50 100 150 200 250 300 350 400
Prob
abili
ty o
f exp
osur
e ex
ceed
ing
the
LLTC
for
the
iden
tifie
d re
cept
or
Soil concentration (mg kg-1)
P that oral + dermal ADE > LLTCoral of 0.57 ug.kg-1.d-1
P that ADEinhal > LLTCinhal of 1.4 ug.kg-1.d-1
Figure 4.6: Probability of exposure exceeding the LLTC with alternative values of pC4SL for benzene for commercial land-use
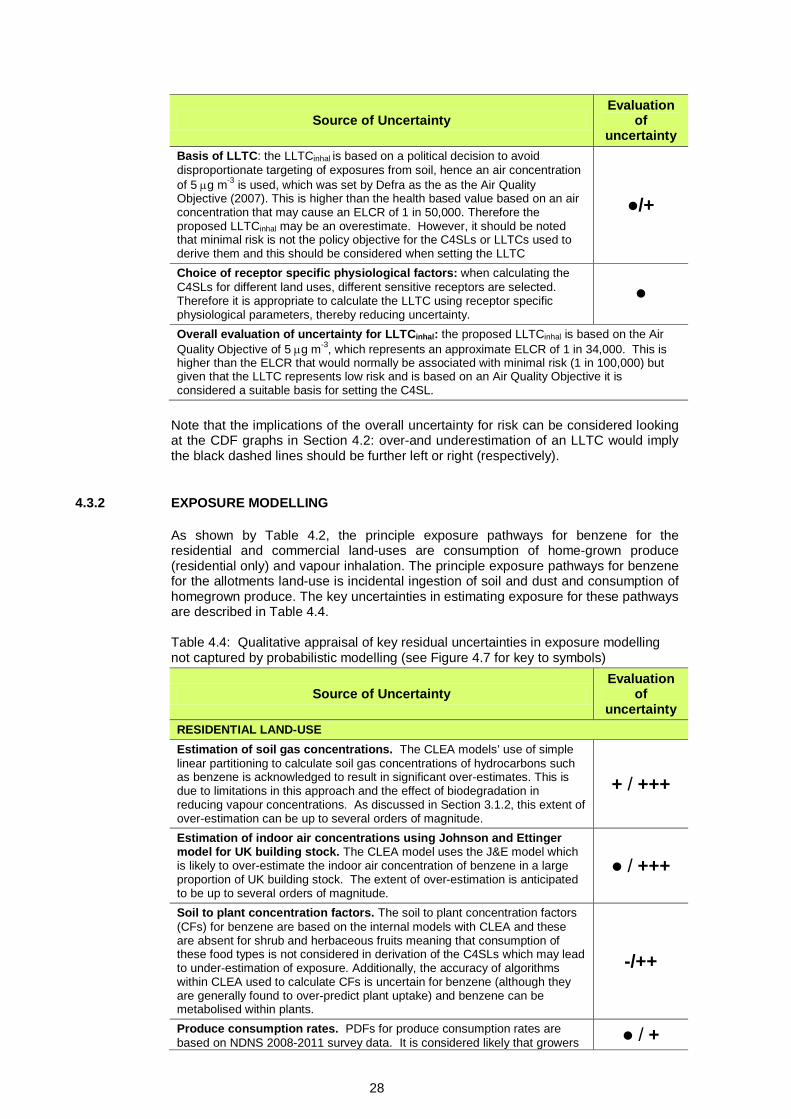
4.3 QUALITATIVE APPRAISAL OF UNCERTAINTY As described previously, there are a number of uncertainties that have not been captured by the probabilistic modelling. These include identifiable uncertainty in the LLTCs and PDF attributes used for the probabilistic modelling, as well as unknown levels of uncertainty relating to aspects such as the assumed conceptual models, the representativeness of the algorithms embedded in CLEA and the behaviour of benzene in the environment. A qualitative appraisal of some of these residual uncertainties has been conducted using an “uncertainty table” approach, as described in Section 5.1.4 of the main report. Tables 4.3 and 4.4 describe the key residual uncertainties and their impact on toxicity and exposure estimates for the exposure modelling of these pathways, respectively. The residual uncertainties are listed in the left hand column of the table, whilst the right hand column contains a subjective evaluation of the impact of each uncertainty on the estimated LLTC and exposures, using plus (+) and minus (-) symbols.
The number of symbols provides an estimate of the approximate magnitude of the over- or under-estimation, based on the scale, shown in Figure 4.7. A dot () represents an assumed negligible impact (< ±10 %), while symbols separated by a forward slash represent an uncertain impact (e.g. -/++ indicates between 0.5x underestimate and x5 overestimate). Note that the implications of the symbols differ between toxicity and exposure: a “+” for exposure implies an assumed overestimation of exposure, and hence a potential overestimation of risk, while a “+” for the LLTC implies an assumed overestimation of the LLTC which results in a potential underestimation of risk.
Alternative C4SL

27
0.05x 0.2x 0.5x 0.9x 1.1x 2x 5x 20x
Figure 4.7: Key for symbols used to express judgements about the magnitude of potential over- or under-estimation of the LLTC and exposure in Tables 4.3 and 4.4 respectively.
Finally, at the foot of the table, a qualitative assessment is given of the overall impact of the identified uncertainties. The assessment of the overall impact is necessarily a subjective judgement, taking into account the evaluation of the individual uncertainties (as shown in the individual rows) and how they might combine (including potential dependencies between them where relevant). Importantly, further sources of unassessed (and potentially unknown) uncertainty may still remain in any risk-based modelling of this nature.
4.3.1 TOXICOLOGICAL ASSESSMENT
Table 4.3 describes the key residual uncertainties and their impact on the toxicology evaluation. Table 4.3: Qualitative appraisal of key residual uncertainties in the toxicology evaluation (see Figure 4.7 for key to symbols)
Source of Uncertainty Evaluation
of uncertainty
ORAL LLTC
Choice of pivotal study: due to the lack of oral toxicity data in humans, inhalation data was used and route-to-route extrapolation applied. The WHO water guideline value was chosen as a basis of the LLTC, based on the Pliofilm study. There is an expert concensus that the cancer profile of this cohort is the best to use to evaluate the cancer potency of benzene via oral exposure. The route to route extrapolation may introduce uncertainty. However, the assumptions made when carrying out such extrapolations was based on toxicokinetic studies in inhaled benzene in humans and inhaled and orally administered benzene in rats and mice.
Choice endpoint from pivotal study: haematological effects of benzene, both carcinogenic and non-carcinogenic are widely accepted.
ELCR modelling: an ELCR of 1 in 50,000 was selected as a basis of the LLTCoral. Basing the LLTC on a higher ELCR e.g. 1 in 10,000 would result in an LLTC 5x higher than that chosen (implying chosen value was 0.2x under-estimated), whilst basing it on the minimal risk ELCR of 1 in 100,000 would result in an LLTC 0.5x that chosen (implying chosen value was 2 x over-estimated).
--/+
Overall evaluation of uncertainty for LLTCoral: The choice of ELCR is the greatest uncertainty in the choice of the LLTCoral. The value chosen is considered to represent low risk and is considered appropriate for derivation of the pC4SL.. INHALATION LLTC
- - - - - - + ++ +++
Under-estimation Over-estimation
28
Source of Uncertainty Evaluation
of uncertainty
Basis of LLTC: the LLTCinhal is based on a political decision to avoid disproportionate targeting of exposures from soil, hence an air concentration of 5 µg m-3 is used, which was set by Defra as the as the Air Quality Objective (2007). This is higher than the health based value based on an air concentration that may cause an ELCR of 1 in 50,000. Therefore the proposed LLTCinhal may be an overestimate. However, it should be noted that minimal risk is not the policy objective for the C4SLs or LLTCs used to derive them and this should be considered when setting the LLTC
/+
Choice of receptor specific physiological factors: when calculating the C4SLs for different land uses, different sensitive receptors are selected. Therefore it is appropriate to calculate the LLTC using receptor specific physiological parameters, thereby reducing uncertainty.
Overall evaluation of uncertainty for LLTCinhal: the proposed LLTCinhal is based on the Air Quality Objective of 5 µg m-3, which represents an approximate ELCR of 1 in 34,000. This is higher than the ELCR that would normally be associated with minimal risk (1 in 100,000) but given that the LLTC represents low risk and is based on an Air Quality Objective it is considered a suitable basis for setting the C4SL.
Note that the implications of the overall uncertainty for risk can be considered looking at the CDF graphs in Section 4.2: over-and underestimation of an LLTC would imply the black dashed lines should be further left or right (respectively).
4.3.2 EXPOSURE MODELLING
As shown by Table 4.2, the principle exposure pathways for benzene for the residential and commercial land-uses are consumption of home-grown produce (residential only) and vapour inhalation. The principle exposure pathways for benzene for the allotments land-use is incidental ingestion of soil and dust and consumption of homegrown produce. The key uncertainties in estimating exposure for these pathways are described in Table 4.4.
Table 4.4: Qualitative appraisal of key residual uncertainties in exposure modelling not captured by probabilistic modelling (see Figure 4.7 for key to symbols)
Source of Uncertainty Evaluation
of uncertainty
RESIDENTIAL LAND-USE Estimation of soil gas concentrations. The CLEA models’ use of simple linear partitioning to calculate soil gas concentrations of hydrocarbons such as benzene is acknowledged to result in significant over-estimates. This is due to limitations in this approach and the effect of biodegradation in reducing vapour concentrations. As discussed in Section 3.1.2, this extent of over-estimation can be up to several orders of magnitude.
+ / +++
Estimation of indoor air concentrations using Johnson and Ettinger model for UK building stock. The CLEA model uses the J&E model which is likely to over-estimate the indoor air concentration of benzene in a large proportion of UK building stock. The extent of over-estimation is anticipated to be up to several orders of magnitude.
/ +++
Soil to plant concentration factors. The soil to plant concentration factors (CFs) for benzene are based on the internal models with CLEA and these are absent for shrub and herbaceous fruits meaning that consumption of these food types is not considered in derivation of the C4SLs which may lead to under-estimation of exposure. Additionally, the accuracy of algorithms within CLEA used to calculate CFs is uncertain for benzene (although they are generally found to over-predict plant uptake) and benzene can be metabolised within plants.
-/++
Produce consumption rates. PDFs for produce consumption rates are based on NDNS 2008-2011 survey data. It is considered likely that growers / +

29
Source of Uncertainty Evaluation
of uncertainty
of produce and their families tend to be within the upper percentiles of consumers of fruit and vegetables. For the purposes of the probabilistic modelling the assumption was made that the consumption rate is within the top quartile. This is likely to be a conservative assumption, as not all individuals who consume homegrown produce will be high level consumers for all produce types. Thus the PDF is considered likely to over- estimate exposure, possibly by up to a factor of 2x. Homegrown fraction. The PDFs for the fraction of consumed produce that is grown on a residential property is based on data from the UK Expenditure and Food Survey 2004/5. It was beyond the scope of this project to re-assess the raw data from this survey and so the beta shaped PDF is based on information presented in SR3 and the former CLR10 report (EA, 2002). It is considered possible that the PDF attributes result in over- or under-estimates of exposure by up to a factor of 2, although this could be much greater at specific locations.
-/+
OVERALL EVALUATION OF UNCERTAINTY FOR RESIDENTIAL LAND-USE: Based on the above it is considered likely that the estimates of total exposure predicted by the probabilistic modelling are likely to be highly conservative, particularly at specific locations.
ALLOTMENTS LAND-USE Soil to plant concentration factors. As residential. -/++ Produce consumption rates. PDFs for produce consumption rates are based on NDNS 2008-2011 survey data. It is considered likely that allotment holders and their families tend to be within the upper percentiles of consumers of fruit and vegetables. For the purposes of the probabilistic modelling the assumption was made that consumption rate is within the top quartile. This is likely to be a conservative assumption, as not all individuals who consume homegrown produce will be high level consumers for all produce types. Thus the PDF is considered likely to over- estimate exposure for families who have allotments, possibly by a factor of up to 2x.
/ +
Homegrown fraction. The PDF for fraction of consumed produce grown at the allotment is based on UK Expenditure and Food Survey 2004/5. It was beyond the scope of this project to re-assess the raw data from this survey and so the beta shaped PDF is based on information presented in SR3 and the former CLR10 report (EA, 2002). It is possible that PDF attributes over- or under-estimate exposure by a factor of up to 2.
-/+
OVERALL EVALUATION OF UNCERTAINTY FOR ALLOTMENTS LAND-USE: Based on the above it is considered likely that the estimates of total exposure predicted by the probabilistic modelling likely to be moderately conservative, particularly at specific locations. COMMERCIAL LAND-USE Vapour migration and intrusion. The CLEA models’ use of simple linear partitioning and the J&E model are anticipated to result in significant over-estimates of the indoor air concentration of benzene at a large proportion of sites. As discussed in Section 3.1.2, this extent of over-estimation can be up to several orders of magnitude.
/ +++
OVERALL EVALUATION OF UNCERTAINTY FOR COMMERCIAL LAND-USE: Based on the above it is considered likely that the estimates of total exposure predicted by the probabilistic modelling likely to be highly conservative, particularly at specific locations.
Note that the implications of the assessed levels of overall uncertainty for the C4SLs can be considered by looking at the RCF graphs in Section 4.2: over-and underestimation of the exposure would imply that the RCF should be shifted to the left or right, respectively. The above qualitative evaluation of uncertainty has indicated that the exposure estimates derived by the probabilistic modelling are likely to be over-estimates.

30
4.4 OTHER CONSIDERATIONS
Other considerations that are relevant when setting the C4SLs for benzene include the following:
• The British Geological Survey (BGS) has not derived normal background concentrations (NBCs) for benzene (Defra, 2012). Although it occurs naturally in crude oil and in emissions from volcanoes and forest fires, benzene is not expected to occur in the environment away from a source (such as a leaking underground fuel storage tank) and background soil concentrations are therefore expected to be negligible.
• Modelled oral exposure from soil with concentrations of benzene at the various pC4SLs is generally in excess of background oral exposure. By extension, therefore, soil could be a potentially major contributor of benzene oral exposure on a site-specific basis and its remediation could potentially significantly reduce this. As discussed in Sections 3.1 and 4.3.2, modelling is likely to significantly over-estimate inhalation exposure indoors thus indicating that soil may not be the major contributor to benzene inhalation exposure on a site-specific basis.
• Since benzene is a known human carcinogen (see above), it might be necessary to apply the “As Low as Reasonably Practicable” (ALARP) principle in relation to its remediation at specific sites (see EA, 2009c; 2009d for details).
• There are no known epidemiological studies directly linking benzene in soil with adverse health effects, although this has been the subject of specific studies (Fera, 2009). As an example, the Fera report describes how benzene was one of the known or strongly suspected carcinogens identified at the Love Canal site in Niagara Falls (New York State, USA). A detailed study of cancer incidence around the site identified respiratory cancer rates which were not statistically different from those reported in other areas of Niagara Falls which were not influenced by the site. The Fera report also describes how a 2005-2007 HPA investigation into the deaths of two toddlers at Leftwich, in Cheshire, from a rare form of leukaemia, failed to find a link with a reported low-level presence of benzene. However, lack of evidence does not mean a lack of effect, as this could be the result of limitations in risk assessment or epidemiological techniques (Kibble and Saunders 2001; Fera 2009).
• As detailed in Section 6.3 of the main report, C4SLs have been derived on the basis of chronic exposure and risks to human health. They have not been specifically derived to be protective of acute risks (e.g. due to one-off ingestion of a significant amount of soil by a young child). It is noted here that the C4SLs derived for POSpark are several orders of magnitude higher than values for the residential land use where inhalation exposure (to benzene vapour) is the most important exposure pathway in deriving the C4SL. Therefore, further consideration of the possibility of acute risk due to ingestion of soil at the benzene concentrations indicated by the POSpark pC4SLs may be necessary.
• Step 6c of the framework used to derive these C4SLs highlights the need to consider other factors such as aesthetic considerations, which may be an issue at the soil concentrations of benzene derived as C4SLs for POSpark. Benzene is inevitably associated with other petroleum hydrocarbons and a benzene concentration of >100 mg/kg is likely to indicate the presence of hydrocarbon concentrations at levels that could pose an odour or visual nuisance (e.g. assuming a typical benzene proportion of 1% of total petroleum hydrocarbons, this would suggest a a total hydrocarbon concentration of >10,000 mg/kg which may exist as separate phase and would possibly pose a visual and odour nuisance).
• The principle of ALARP automatically applies to the regulation and management of non-threshold chemicals in the UK. It is important to note that ALARP remains the overriding principle even when a margin of exposure or minimal risk level or LLTC suggests there is a minimal/low concern for human
31
health. What is considered practicable is a remediation/risk management decision, and could be lower or higher than the scientific values derived.

32
4.5 SUMMARY AND CONCLUSIONS
Following the methodology described in Section 3 of the main report, deterministic exposure modelling with a modified version of CLEA has been used to estimate the soil concentration that could result in potential exposure to an individual receptor within the critical receptor group for each land-use equating to the LLTCs for benzene. These soil concentrations are the pC4SLs. A range of pC4SLs have been derived for benzene, using three alternative sets of deterministic exposure parameters (and with varying concentrations of SOM), as follows:
Option 1: Use of minimal risk HCVs with changes to exposure parameters (as summarised in Section 3.5.7 of the main report);
Option 2: Use of LLTCs with no change to exposure parameters (i.e. as defined in SR3); and
Option 3: Use of LLTCs with changes to exposure parameters. The pC4SLs are shown below in Table 4.5. Table 4.5: pC4SLs for Benzene (based on 6% SOM)
Land-Use
pC4SL (mg/kg) HCVs with suggested changes to exposure
parameters
LLTCs with no change
to exposure parameters
LLTCs with suggested changes to exposure
parameters Residential (with consumption of homegrown produce) 0.42 0.69 0.87
Residential (without consumption of homegrown produce) 1.4 2.3 3.3
Allotments 0.09 0.15 0.18 Commercial 90 100 98 POSresi 72 NA 140 POSpark 110 NA 230
Quantitative probabilistic modelling has been conducted to better understand some of the uncertainty inherent within the exposure modelling aspects of the pC4SLs and the level of protection they may provide. The probabilistic modelling has focused on key exposure pathways and has helped to demonstrate the expected variability in exposures between individuals within the critical receptor group for a given soil concentration (and the probability that exposure to a random individual within the group would exceed the LLTC). Such modelling has not been carried out in relation to toxicological aspects, due to a lack of suitable data and approaches. In addition to the probabilistic modelling, a qualitative analysis of uncertainty has been carried out to further elucidate the level of uncertainty within the pC4SLs. This has focused on other aspects of the exposure modelling, as well as the LLTC setting process. The quantitative and qualitative appraisal of uncertainty has indicated that the pC4SLs are likely to be highly conservative, in most cases. The greatest sources of uncertainty within the exposure modelling are associated with the indoor vapour inhalation pathway and the consumption of homegrown produce pathway (where relevant). Conservatism within the former is due to the modelling approach adopted while uncertainty from the latter is due to the large degree of variability in produce

33
consumption rates, the fraction consumed that is homegrown and the soil to plant concentration factors used for modelling plant uptake. As a final step within the C4SL derivation process, other relevant considerations are identified, which should have a bearing on any final choice of numbers. For benzene, these take the form of estimates of background human exposure levels and a review of epidemiological evidence of health impacts from benzene in UK soil. As described in the main report, and at the request of the Steering Group, this appendix stops short of providing “final C4SLs” for benzene since: 1) final C4SLs should be set by “relevant authorities” (e.g., Defra); 2) the toxicological framework contained herein has recently been submitted for review by the Committee on Toxicity (COT, 2013), with comments pending; and 3) the whole document will also be the subject of peer review. Since the above pC4SLs have been derived using a modified version of the CLEA model, the Environment Agency’s SR3 document (EA, 2009d) should be referred to for important caveats and supporting information regarding their use. Furthermore, the LLTCs have been derived using similar methods to those outlined in the Environment Agency’s HCV document (EA, 2009b), and the reader is referred to that document for the same reasons. As described in the main report, the finalised C4SLs can be used in a broadly similar manner to that described for SGVs in the Environment Agency’s “Using Soil Guideline Values” document (EA, 2009f). Although they are unlikely to represent a “significant possibility of significant harm” (SPOSH), the likelihood of an exceedance of a C4SL being representative of SPOSH may be greater than if the default CLEA settings and toxicological criteria equivalent to minimal risk had been used in their derivation.

34
5. REFERENCES AGENCY FOR TOXIC SUBSTANCES AND DISEASE Registry (ATSDR) 2007. Toxicological profile for Benzene. U.S. department of health and human services. BRITISH GEOLOGICAL SURVEY (BGS), 2012. Normal background concentrations (NBCs) of contaminants in English soils: Final project report. Commissioned Report CR/12/035. CIRIA, 2009. The VOCs Handbook: Investigating, assessing and managing risks from inhalation of VOCs at land affected by contamination. CIRIA C682, London 2009. COMMITTEE ON CARCINOGENICITY OF CHEMICALS IN FOOD, CONSUMER PRODUCTS AND THE ENVIRONMENT (COC), 2012. Risk Characterisation Methods. COC/G06. October 2012. COT, 2013. COT Agenda and Papers: 14 May 2013. Accessed online at: http://cot.food.gov.uk/cotmtgs/cotmeets/cotmeets2013/cotmeet14may13/cotagepap14may13. CRUMP, K.S., 1994. Risk of benzene-induced leukemia: a sensitivity analysis of the Pliofilm cohort with additional follow-up and new exposure estimates. Journal of Toxicology and Environmental Health, 42, 219-242. CRUMP, K.S., 1996. Risk of benzene-induced leukemia predicted from the Pliofilm cohort. Environmental Health Perspectives, 104, Suppl. 6, 1437-1441. DEPARTMENT FOR ENVIRONMENT, FOOD AND RURAL AFFAIRS (DEFRA), 2007. The air quality strategy for England, Scotland, Wales and Northern Ireland (Volume 2). London: Department for Environment, Food and Rural Affairs. Available from: http://www.defra.gov.uk/environment/airquality/strategy/pdf/airqualitystrategy- vol2.pdf EC, 2003. Draft European Union Risk Assessment Report – Benzene. CAS-No.: 71-3- 2 EINECS-No.: 200-753-7. R063_0205_env Environment part (May 2002) -R063_0303_hh Human Health part (March 2003). European Union – Joint Research Centre. Brussels: European Commission. Available from: http://ecb.jrc.it/DOCUMENTS/Existing- Chemicals/RISK_ASSESSMENT/DRAFT/R063_0309_env_hh.pdf
ENVIRONMENT AGENCY (EA), 2008. Compilation of data for priority organic pollutants for derivation of soil guideline values. Science report SC050021/SR7. ISBN: 978-84432-964-9. Environment Agency. ENVIRONMENT AGENCY (EA) 2009a. Soil guideline values for benzene in soil. Science Report SC050021/benzene SGV. Environment Agency, Bristol, May 2009. ENVIRONMENT AGENCY (EA), 2009b. Contaminants in soil: updated collation of toxicological data and intake values for humans Benzene. Better Regulation Science Programme Science report: SC050021. ENVIRONMENT AGENCY (EA), 2009c. Human health toxicological assessment of contaminants in soil. Science Report – SC050021/SR2. Environment Agency. Bristol, 2009. ENVIRONMENT AGENCY (EA), 2009d. Updated technical background to the CLEA model. Science Report – SC050021/SR3. ISBN: 978-1-84432-856-7. Environment Agency. Bristol, 2009.

35
ENVIRONMENT AGENCY (EA), 2009e. Supplementary information for the derivation of SGV for benzene. Science Report SC050021. Environment Agency, Bristol, May 2009.
EA, 2009f. Using soil guideline values. Science Report SC050021/SGV Introduction. ISBN: 978-1-84911-037-2. Environment Agency, Bristol, 2009.
EXPERT PANEL ON AIR QUALITY STANDARDS (EPAQS), 1994. Benzene. Department of the Environment, Expert Panel on Air Quality Standards. London: HMSO. EU-JOINT RESEARCH CENTRE (EU-JRC), 2005. Critical appraisal of the setting and implementation of indoor exposure limits in the EU. The INDEX project. Ispra, Italy: European Commission – Joint Research Centre. Available from: http://ec.europa.eu/health/ph_projects/2002/pollution/fp_pollution_2002_frep_02.pdf EUROPEAN FOOD SAFETY AUTHORITY (EFSA), 2012. Guidance on the Use of Probabilistic Methodology for Modelling Dietary Exposure to Pesticide Residues. EFSA Journal 2012; 10(10):2839. European Food Safety Authority, 2012. FOOD AND ENVIRONMENTAL RESEARCH AGENCY (FERA), 2009. Potential health effects of contaminants in soil. Defra Research Project SP1002. Food and Environment Protection Agency. 2009. FITZPATRICK, N.A. and FITZGERALD, J.J. 2002. An evaluation of vapor intrusion into buildings through a study of field data. Soil and Sediment Contamination, 11, 603-623 HARTMAN, B., 2002. Re-evaluating the upward vapor migration risk pathway. LUSTLine Bulletin, 41, June 2002. HEALTH PROTECTION AGENCY (HPA), 2011. HPA Compendium of Chemical Hazards – Benzene. INTERNATINOAL GROUP ON HEALTH RISKS FROM CHEMICALS (IGHRC), 2006. Guidelines on route to route extrapolation of toxicity data when assessing health risks of chemicals. Institute of Environmental Health. Cranfield University. INTERNATIONAL PROGRAMME OF CHEMICAL SAFETY (IPCS), 1993. Benzene. Geneva, Environmental Health Criteria, No. 150.
KIBBLE, A. J. & SAUNDERS, P. J. 2001. Contaminated land and the link with health. In Assessment and reclamation of contaminated land. Issues in Environmental Science and Technology. Eds. R.E. Hester and R.M. Harrison.p. 65.
LAN, Q., ZHANG, L., LI, G., VERMEULEN, R., WEINBERG, R.S., DOSEMECI, M., RAPPAPORT, S.M., SHEN, M., ALTER, B.P., WU, Y., KOPP, W., WAIDYANATHA, S., RABKIN, C., GUO, W., CHANOCK, S., HAYES, R.B., LINET, M., KIM, S., YIN, S., ROTHMAN, N. AND SMITH, M.T., 2004. Hematotoxicity in workers exposed to low levels of benzene. Science, 306, 1774-1776 [cited in ATSDR, 2007]. NATIONAL TOXICOLOGY PROGRAM (NTP), 1986. Toxicology and carcinogenesis studies of benzene in F344/N rats and B6C3F1 mice (gavage studies). Research Triangle Park, NC, US Department of Health and Human Services, 1986 (Technical Reports Series No. 289). RINSKY, R., YOUNG, R.J. AND SMITH, A.B., 1981. Leukemia in benzene workers. American Journal of Industrial Medicine, 2, 217-245. RINSKY, R., SMITH, A., HORNUNG, R., FILLOON, T., YOUNG, R., OKUN, A. AND LANDRIGAN, P.J., 1987. Benzene and leukaemia: an epidemiologic risk assessment. New England Journal of Medicine, 316, 1044-1050.

36
NATIONAL INSTITUTE FOR PUBLIC HELATH AND THE ENVIRONMENT (RIVM), 2001. Re-evaluation of human-toxicological maximum permissible risk levels. Chapter 3.1. Benzene. RIVM Report 711701025. Bilthoven, The Netherlands: Dutch National Institute of Public Health and the Environment. Available from: http://www.rivm.nl/bibliotheek/rapporten/711701025.html ROTHMAN, N., LI, G.L., DOSEMECI, M., BECHTOLD, W.E., MARTI, G.E., WANG, Y.Z., LINET, M., XI, L.Q., LU, W., SMITH, M.T., TITENKO-HOLLAND, N., ZHANG, L.P., BLOT, W., YIN, S.N. AND HAYES, R.B., 1996. Hemotoxicity among Chinese workers heavily exposed to benzene. American Journal of Industrial Medicine, 29, 236- 246.. SCIENTIFIC COMMITTEE ON HEALTH AND ENVIRONMENTAL RISKS (SCHER), 2006. Opinion on the report “Emission of chemicals by air fresheners. Tests on 74 consumer products sold in Europe” (BEUC report January 2005). Adopted by the SCHER during the 9th plenary of 27 January 2006. Brussels: European Commission, Scientific Committee on Health and Environmental Risks. Available from: http://ec.europa.eu/health/ph_risk/committees/04_scher/docs/scher_o_026.pdf TSAI, S.P., WEN, C.P., WEISS, N.S., WONG, O., MCCLELLAN, W.A. AND GIBSON, R.L.,1983. Retrospective mortality and medical surveillance studies of workers in benzene areas of refineries. Journal of Occupational Medicine, 25, 685-692.
US ENVIRONMENTAL PROTECTION AGENCY (USEPA), 1999. Extrapolation of the benzene inhalation unit risk estimate to the oral route of exposure. NCEA-W-0517. Washington, DC: US Environmental Protection Agency. Available from: http://www.epa.gov/ncea/iris/supdocs/benz-sup.pdf USEPA, 2000. Benzene (CAS RN 71-43-2). Carcinogenicity Assessment [online]. Integrated Risk Information System (IRIS – USEPA online chemical toxicity information service). Washington, DC: US Environmental Protection Agency. Available from: http://www.epa.gov/iris/subst/0276.htm USEPA, 2003. Benzene (CAS RN 71-43-2). Oral RfD Assessment. Inhalation RfC Assessment [online]. Integrated Risk Information System (IRIS – USEPA online chemical toxicity information service). Washington, DC: US Environmental Protection Agency. Available from: http://www.epa.gov/iris/subst/0276.htm WILSON S., 2008. Modular approach to analysing vapour migration into buildings in the UK. Land Contamination and Reclamation, 16 (3), 223-236. WONG, O., 1987. An industry wide mortality study of chemical workers occupationally exposed to benzene. I. General results. British Journal of Industrial Medicine, 44, 365-381. WORLD HEALTH ORGANISATION (WHO), 1984. Guidelines for drinking-water quality (1st edition). Geneva: World Health Organization. WORLD HEALTH ORGANISATION (WHO), 1993. Guidelines for drinking-water quality (2nd edition). Geneva: World Health Organization. WORLD HEALTH ORGANISATION (WHO), 2000. Air quality guidelines for Europe (2nd edition). WHO Regional Publications, European Series No. 91. Copenhagen: World Health Organization Regional Office for Europe. WORLD HEALTH ORGANISATION (WHO), 2003. Benzene in drinking-water. Background document for development of WHO Guidelines for Drinking-water Quality. Geneva, World Health Organization (WHO/SDE/WSH/03.04/24. Available from: http://www.who.int/water_sanitation_health/dwq/benzene.pdf).

37
WORLD HEALTH ORGANISATION (WHO), 2006. Guidelines for drinking-water quality, 3rd edition incorporating 1st and 2nd addenda. Vol. 1. Recommendations. Geneva, World Health Organization, Available from: http://www.who.int/water_sanitation_health/dwq/chemicals/benzenesum.pdf). WORLD HEALTH ORGANISATION (WHO), 2011. Guidelines for drinking-water quality, 4th edition. Geneva, World Health Organization. Available from: http://www.who.int/water_sanitation_health/publications/2011/dwq_guidelines/en/
38
APPENDIX D1
HUMAN TOXICOLOGICAL DATA SHEET FOR BENZENE

Human Toxicological Data Sheet - BenzeneMay 2013
Chemical: Benzene
Human Health Hazard Profile - ReferencesAuthoratative bodies Website Checked (Y/N) References
EA http://www.environment-agency.gov.uk/ Y Science report SC050021FSA http://www.food.gov.uk/ YCOC http://www.iacoc.org.uk/ Y None availableCOM http://www.iacom.org.uk/ Y Toxicogenomics: application to mechanism of benzene induces leukaemia MUT/04/02COT http://cot.food.gov.uk/ Y None availableEFSA http://www.efsa.europa.eu/ Y None availableJECFA http://www.who.int/foodsafety/chem/jecfa/publications/en/index.html YWHO http://www.who.int/en/ Y IPCS EHC 150 1993
Exposure to benzene. A major public health concern. Guidelines for drinking water, 1984, 1993, 3006, 2011. Benzene in drinking water - background document. 2003.Air quality guidelesin for Europe, 2000.
RIVM http://www.rivm.nl/English Y Benzeen: Evaluatie advieswaardeATDSR http://www.atsdr.cdc.gov/ Y Toxicological profile for benzene, 2007.USEPA http://www.epa.gov/ Y Extrapolation of the benzene inhalation unit risk estimate to the oral route of exposure, 1999.
Oral RfD Assessment. Inhalation RfC Assessment, 2003.Health Canada http://www.hc-sc.gc.ca/index-eng.php YOther referencesEPAQS http://archive.defra.gov.uk/environment/quality/air/airquality/panels/aqs/ Y Benzene. 1994EU-JRC http://ihcp.jrc.ec.europa.eu/our_activities/public-health/index_final_report Y Critical appraisal of the setting and implementation of indoor exposure limits in the EU, 2005.NTP http://ntp-server.niehs.nih.gov/ Y Toxicology and carcinogenesis studies of benzene in F344/N rats and B6C3F1 mice (gavage studies), 1986.SCHER http://ec.europa.eu/health/scientific_committees/environmental_risks/ Y Opinion on the report “Emission of chemicals by air fresheners. Tests on 74 consumer products sold in Europe, 2006.
Human Toxicological Data Sheet for C4SL derivation: Reference checklist
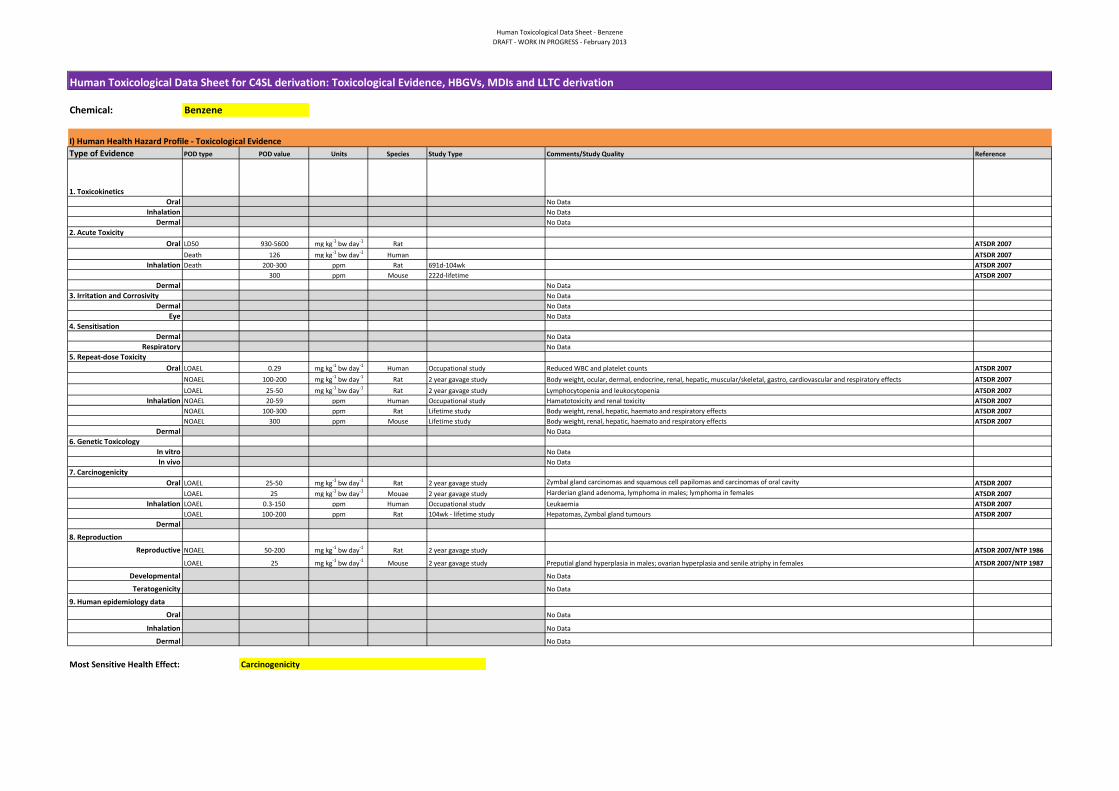
Human Toxicological Data Sheet - BenzeneDRAFT - WORK IN PROGRESS - February 2013
Chemical:
I) Human Health Hazard Profile - Toxicological EvidenceType of Evidence POD type POD value Units Species Reference
1. ToxicokineticsOral
InhalationDermal
2. Acute Toxicity Oral LD50 930-5600 mg kg-1 bw day-1 Rat ATSDR 2007
Death 126 mg kg-1 bw day-1 Human ATSDR 2007Inhalation Death 200-300 ppm Rat ATSDR 2007
300 ppm Mouse 222d-lifetime ATSDR 2007Dermal
3. Irritation and CorrosivityDermal
Eye4. Sensitisation
DermalRespiratory
5. Repeat-dose ToxicityOral LOAEL 0.29 mg kg-1 bw day-1 Human ATSDR 2007
NOAEL 100-200 mg kg-1 bw day-1 Rat Body weight, ocular, dermal, endocrine, renal, hepatic, muscular/skeletal, gastro, cardiovascular and respiratory effects ATSDR 2007LOAEL 25-50 mg kg-1 bw day-1 Rat Lymphocytopenia and leukocytopenia ATSDR 2007
Inhalation NOAEL 20-59 ppm Human ATSDR 2007NOAEL 100-300 ppm Rat Lifetime study Body weight, renal, hepatic, haemato and respiratory effects ATSDR 2007NOAEL 300 ppm Mouse Lifetime study Body weight, renal, hepatic, haemato and respiratory effects ATSDR 2007
Dermal6. Genetic Toxicology
In vitroIn vivo
7. CarcinogenicityOral LOAEL 25-50 mg kg-1 bw day-1 Rat ATSDR 2007
LOAEL 25 mg kg-1 bw day-1 Mouae ATSDR 2007Inhalation LOAEL 0.3-150 ppm Human Occupational study Leukaemia ATSDR 2007
LOAEL 100-200 ppm Rat 104wk - lifetime study Hepatomas, Zymbal gland tumours ATSDR 2007Dermal
8. Reproduction
Reproductive NOAEL 50-200 mg kg-1 bw day-1 Rat ATSDR 2007/NTP 1986
LOAEL 25 mg kg-1 bw day-1 Mouse ATSDR 2007/NTP 1987
Developmental
Teratogenicity
9. Human epidemiology data
Oral
Inhalation
Dermal
Most Sensitive Health Effect:
Benzene
Carcinogenicity
No DataNo DataNo Data
No Data
No Data
2 year gavage study
Occupational study
No Data
Occupational study
2 year gavage study2 year gavage study
691d-104wk
Human Toxicological Data Sheet for C4SL derivation: Toxicological Evidence, HBGVs, MDIs and LLTC derivation
No DataNo Data
No DataNo Data
Reduced WBC and platelet counts
Hamatotoxicity and renal toxicity
No Data
Comments/Study QualityStudy Type
2 year gavage study
No Data
2 year gavage study Preputial gland hyperplasia in males; ovarian hyperplasia and senile atriphy in females
2 year gavage study Harderian gland adenoma, lymphoma in males; lymphoma in females
No DataNo Data
No Data
No Data
No Data
Zymbal gland carcinomas and squamous cell papilomas and carcinomas of oral cavity
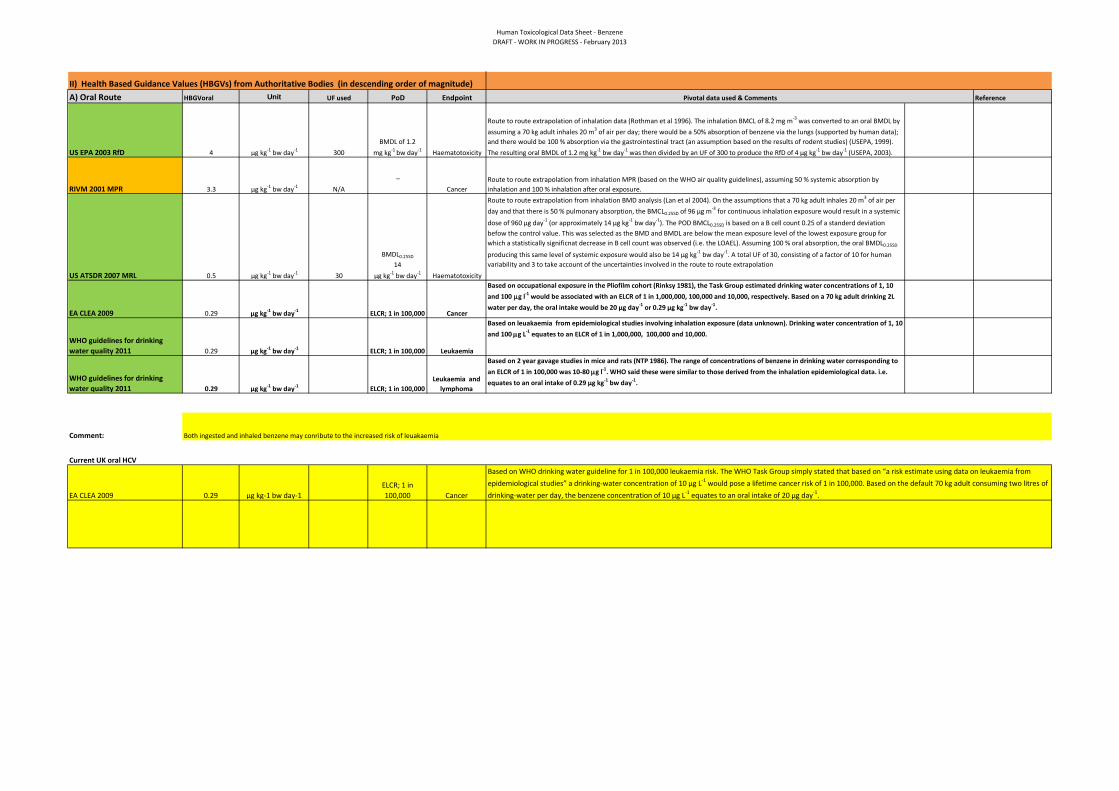
Human Toxicological Data Sheet - BenzeneDRAFT - WORK IN PROGRESS - February 2013
II) Health Based Guidance Values (HBGVs) from Authoritative Bodies (in descending order of magnitude)A) Oral Route HBGVoral Unit UF used PoD Endpoint Reference
US EPA 2003 RfD 4 μg kg-1 bw day-1 300BMDL of 1.2
mg kg-1 bw day-1 Haematotoxicity
RIVM 2001 MPR 3.3 μg kg-1 bw day-1 N/A
_
Cancer
US ATSDR 2007 MRL 0.5 μg kg-1 bw day-1 30
BMDL0.25SD
14 μg kg-1 bw day-1 Haematotoxicity
EA CLEA 2009 0.29 μg kg-1 bw day-1 ELCR; 1 in 100,000 Cancer
WHO guidelines for drinking water quality 2011 0.29 μg kg-1 bw day-1 ELCR; 1 in 100,000 Leukaemia
WHO guidelines for drinking water quality 2011 0.29 μg kg-1 bw day-1 ELCR; 1 in 100,000
Leukaemia and lymphoma
Comment:
Current UK oral HCV
EA CLEA 2009 0.29 μg kg-1 bw day-1ELCR; 1 in 100,000 Cancer
Based on WHO drinking water guideline for 1 in 100,000 leukaemia risk. The WHO Task Group simply stated that based on “a risk estimate using data on leukaemia from epidemiological studies” a drinking-water concentration of 10 μg L-1 would pose a lifetime cancer risk of 1 in 100,000. Based on the default 70 kg adult consuming two litres of drinking-water per day, the benzene concentration of 10 μg L-1 equates to an oral intake of 20 μg day-1.
Both ingested and inhaled benzene may conribute to the increased risk of leuakaemia
Pivotal data used & Comments
Route to route extrapolation of inhalation data (Rothman et al 1996). The inhalation BMCL of 8.2 mg m-3 was converted to an oral BMDL by assuming a 70 kg adult inhales 20 m3 of air per day; there would be a 50% absorption of benzene via the lungs (supported by human data); and there would be 100 % absorption via the gastrointestinal tract (an assumption based on the results of rodent studies) (USEPA, 1999). The resulting oral BMDL of 1.2 mg kg-1 bw day-1 was then divided by an UF of 300 to produce the RfD of 4 μg kg-1 bw day-1 (USEPA, 2003).
Route to route extrapolation from inhalation MPR (based on the WHO air quality guidelines), assuming 50 % systemic absorption by inhalation and 100 % inhalation after oral exposure. Route to route extrapolation from inhalation BMD analysis (Lan et al 2004). On the assumptions that a 70 kg adult inhales 20 m3 of air per day and that there is 50 % pulmonary absorption, the BMCL0.25SD of 96 μg m-3 for continuous inhalation exposure would result in a systemic
dose of 960 μg day-1 (or approximately 14 μg kg-1 bw day-1). The POD BMCL0.25SD is based on a B cell count 0.25 of a standerd deviation befow the control value. This was selected as the BMD and BMDL are below the mean exposure level of the lowest exposure group for which a statistically significnat decrease in B cell count was observed (i.e. the LOAEL). Assuming 100 % oral absorption, the oral BMDL0.25SD
producing this same level of systemic exposure would also be 14 μg kg-1 bw day-1. A total UF of 30, consisting of a factor of 10 for human variability and 3 to take account of the uncertainties involved in the route to route extrapolation
Based on occupational exposure in the Pliofilm cohort (Rinksy 1981), the Task Group estimated drinking water concentrations of 1, 10 and 100 µg l-1 would be associated with an ELCR of 1 in 1,000,000, 100,000 and 10,000, respectively. Based on a 70 kg adult drinking 2L water per day, the oral intake would be 20 μg day-1 or 0.29 μg kg-1 bw day-1.
Based on 2 year gavage studies in mice and rats (NTP 1986). The range of concentrations of benzene in drinking water corresponding to an ELCR of 1 in 100,000 was 10-80 µg l-1. WHO said these were similar to those derived from the inhalation epidemiological data. i.e. equates to an oral intake of 0.29 μg kg-1 bw day-1.
Based on leuakaemia from epidemiological studies involving inhalation exposure (data unknown). Drinking water concentration of 1, 10 and 100 µg L-1 equates to an ELCR of 1 in 1,000,000, 100,000 and 10,000.

Human Toxicological Data Sheet - BenzeneDRAFT - WORK IN PROGRESS - February 2013
B) Inhalation RouteConverted HBGVinh Unit HBGVinh ng m-3 UF used PoD Endpoint Reference
EU RAR 2003 914.29 µg kg -1 bw day -1 3200 μg m-3 N/A ELCR; 1 in 50,000 Cancer
EU INDEX project on indoor air 2005 17 µg kg -1 bw day -1 60 μg m-3 10
NOAEC; 600 µg m-3 Haematotoxicity
US EPA 2003RfD 8.57 µg kg -1 bw day -1 30 μg m-3 270 BMCL; 23 mg m-3 HaematotoxicityRIVM 2001MPR
5.71 µg kg -1 bw day -1 20 μg m-3 N/A ELCR; 1 in 10,000 Cancer
EU working group 1998 5.71 µg kg -1 bw day -1 20 μg m-3 N/AELCR; 1 in 1,000,000 Leukaemia
ATSDR 2007MRL 2.7 µg kg -1 bw day -1 9.6 μg m-3 10
BMCL; 320 μg m-3 Haematotoxicity
EA CLEA 2009HCV 1.4 µg kg -1 bw day -1 5.0 μg m-3
EPAQS 1998 0.91 µg kg -1 bw day -1 3.2 μg m-3 100NOAEL'; 1600 µg
m-3 Leukaemia
EU working group 1998 0.06 µg kg -1 bw day -1 0.2 μg m-3 N/AELCR; 1 in 1,000,000 Leukaemia
WHO AQG 2000 0.49 µg kg -1 bw day -1 1.7 μg m-3 N/A ELCR; 1 in 100,000 Leukaemia
EU INDEX project on indoor air 2005 0.49 µg kg -1 bw day -1 1.7 μg m-3 N/A ELCR; 1 in 100,000 Cancer
EU RAR 2003NOAEC; 3.2 mg m-
3 Haematotoxicity
Comment:
EA CLEA 2009HCV
1.4 µg kg -1 bw day -1 5.0 μg m-3
Based on non-cancerous effects in the blood of chronically exposed workers
Based on occupation data from the Pliofilm study, analysed by Crump 1994. The geometric mean of the range of cancer risk estimates was chosen as the basis of the air quality guidelines. An ELCR of 1 in 10,000, 100,000 and 1,000,000 was associated with a concentration of benzene in air of 17, 1.7 and 0.17 µg m-3.
Both ingested and inhaled benzene may conribute to the increased risk of leuakaemia
Based on the Air Quality Objective set by Defra of 5 µg m-3. Based on an 70 kg adult inhaling 20 m3 per day, this equates to an intake of 1.4 µg kg bw-1 day-1.
UK inhalation HCV
Based on the WHO air quality guidelines unit cancer risk value of 6 x 10⁻⁶. The maximum permissible risk (MPR) equivalent to an ELCR of 1 in 10,000 was 20 µg m-3. MPR of 20 µg m-3 would also protect against non-cancer effects.
Based on occupational data from the Pliofilm cohort (Rinksy 1987) and from American chemical workers (Wong 1987). EPAQS concluded that average exposure over a lifetime to 1600 µg m-3, the risk of leukaemia would be undetectable. This concentration in air was divided by 10 to account for worling life and chronological lifetime, and 10 to account for human variability, to give an air quality standard of 16 µg m-3. Seeing as benzene is a genotoxici carcinogen, EPAQS recommended a target standard of 3.2 µg m-3.
Based on the WHO air quality guideline. The range of benzene concentrations that pose a 1 in 1,000,000 ELCR was 0.2 - 20 µg m-3.
Based on occupational data from a workers for Shanghai factories working with benzene (Rothman 1996). BMCL of 23 mg m-3 was converted to continuous exposure (8.2 mg m-3). UF of 3 was used to account for using a LOAEL, 10 for human variability, 3 to extrapolate from sub-chronic to chronic exposure and 3 for database deficiencies as there were no developmental or reproductive studies.
Based on the Air Quality Objective (AQO) of 5 µg m-3 was set by Defra to be achieved by 2010. To avoid disproportionately targetting soil this value was used as the ID.
Pivotal Study used & Comments
Based on blood toxicity in workers in Chinese shoe factories (Lan 2004). BMCL of 320 µg m-3 was converted to continuous exposure, then divided by 100 to account for human variability.
Based on WHO unit risk value of 6 x 10⁻⁶ for an exposure of 1 µg m-3. Therefore airborn benzene concentrations of 17, 1.7 and 0.17 µg m-3 are assocaited with an ELCR of 1 in 10,000, 100,000 and 1,000,000.
Based on the analysis by Crump of the cancer mortality data in the pliofilm workers, 3.2 mg m-1 poses a cancer risk of 0.02 in 1000 or 1 in 50,000.
Based on occupation data from workers working with benzene (Tsai 1983). An UF of 10 was used for interindividual variability. HCV based on 70 kg adult breathing 20 m3 per day.
Based on the WHO air quality guideline. The range of benzene concentrations that pose a 1 in 1,000,000 ELCR was 0.2 - 20 µg m-3.

Human Toxicological Data Sheet - BenzeneDRAFT - WORK IN PROGRESS - February 2013
C) Dermal Route HBGVderm Units UF used POD Endpoint Reference
COT/COC Opinion:
Positioning of UK Minimal Risk HCV vs other HBGV from authoritative bodies
III) Mean Daily Intakes from Other Sources (e.g. Diet)
Pathways Units Adults Children Refs
Food (average) Oral µg kg-1 bw day-1 0.007-0.03 - EA 2009
Water Oral µg kg-1 bw day-1 0.003 0.005 EA 2009
Air rural Inhalation µg kg-1 bw day-1 0.28 - WHO 2000
Air urban Inhalation µg kg-1 bw day-1 1.4-5.7 - WHO 2000
Air rural non smoker Inhalation µg kg-1 bw day-1 1-1.1 - EA 2009
Air urban non-smoker Inhalation µg kg-1 bw day-1 1.27-1.36 - EA 2009
Air Urban smoker Inhalation µg kg-1 bw day-1 7.37-7.46 - EA 2009
Air urban passive smoker Inhalation µg kg-1 bw day-1 1.66-1.74 - EA 2009
Air freshners Inhalation µg kg-1 bw day-1 2.29 - EA 2009
MDI Oral µg kg-1 bw day-1 0.04 0.11 EA 2009MDI Inhalation µg kg-1 bw day-1 2.9 7.4 EA 2009
Comment:
There are no authoratative assessments of benzene. However benzene is porrly absorbed through the skin.
Pivotal Study used & Comments
00.5
11.5
22.5
33.5
44.5
HCV
(µg
kg-1
bw
day
-1)
Oral data
02468
1012141618
HCV
(µg
kg-1
bw
day
-1) Inhalation data

Human Toxicological Data Sheet - BenzeneDRAFT - WORK IN PROGRESS - February 2013
IV) LLTC derivation
A) ORAL
Choice of Pivotal Data Dosing vehicle Doses Units Species Reference
BMD Modelling (if relevant)
Software used
BMD1 BMD5 BMD10 BMD15 BMD20BMD modelling (value)(mg kg-1 bw day-1)
BMDL1 BMDL5 BMDL10 BMDL15 BMDL20BMD modelling (value) (mg kg-1 bw day-1)
Comments:
Point of Departure for ORAL LLTC: Value Units Oral LLTC calculation:
Type of PoD 1 in 50,000 ELCR Units
Description of PoD LLTC (Thresholded chemical) Value selected 0.57 µg kg-1 bw day-1
LLTC (Non Thresholded chemical) 0.57
Range Selected value
Intraspecies 1 - 10
Interspecies 1 - 10 LLTC (Human carcinogen) Classified by IARC as a group 1 human carcinogen
Additional uncertainties 1 - 10
Comments:Thresholded chemical? No
If yes - calculate CSAFIf no - calculate CSM
CSAF = (for thresholded chemical)
CSM = 0 (for non-thresholded chemical)
ELCR = 50,000
Lifetime averaging to be applied in CLEA No
Pliofilm study (workers from three rubber film factories in USA) (Rinksy 1981, 1987; Crump 1984).
NA NA
µg kg-1 bw day-1
Study Type
μg kg-1 bw day-1 Human Occupational epidemiology studyStudy used by several authoratative bodies. Drinking water concentrations of 1, 10 and 100 μg l-1 would be associated with an ELCR of 1 in 1,000,000, 100,000 and 10,000, respectively. Based on a 70 kg adult drinking 2L water per day, the oral intake of 20 μg day-1 or 0.29 μg kg-1 bw day-1 equates to an ELCR of 1 in 100,000.
Chemical Specific Adjustment Factor to account for uncertainties in the data
Comments

Human Toxicological Data Sheet - BenzeneDRAFT - WORK IN PROGRESS - February 2013
B) INHALATIONChoice of Pivotal Data Dosing vehicle Doses Units Species Comments Reference
BMD Modelling (if relevant)
Software used
BMD1 BMD5 BMD10 BMD15 BMD20BMD modelling (value)
BMDL1 BMDL5 BMDL10 BMDL15 BMDL20BMD modelling (value)
Comments:
Point of Departure for INHALATION LLTC:
Value UnitsInhalation LLTC calculation:
Type of PoD UnitsDescription of PoD LLTC (Thresholded chemical) Value selected 5.0 μg m-3
LLTC (Non Thresholded chemical) 1.4 adultRange Selected value 3.3 child
Intraspecies 1 - 10
Interspecies 1 - 10 LLTC (Human carcinogen) Classified by IARC as a group 1 human carcinogen
Additional uncertainties 1 - 10
Thresholded chemical? No Comments:If yes - calculate CSAFIf no - calculate CSM
CSAF = 0 (for thresholded chemical)
CSM = 0 (for non-thresholded chemical)
ELCR = Adult Child Units
Lifetime averaging to be applied in CLEA No Body weight 70 13.3 kg
Inhalation rate 20 8.8 m3
Chemical Specific Adjustment Factor to account for uncertainties in the data
HumanOccupational study with workers from three rubber film factories in USA) Data anaysed by Crump 1984.
UK Air Quality Standards Regulation (2010)
Based on a geometric mean for cancer risk estimates (calculated by Crump 1994), concentrations of airborne benzene of 17, 1.7 and 0.17 µg m-
3 is associated with an ELCR of 1 in 10,000, 100,000 and 1,000,000. WHO Air Quality guidelines
Paste BMDL graph here
NA NA
Study Type
Physiological conversion factors
µg kg-1 bw day-1
In order to disproportionately target exposure from soil, the Air Quality Objective (AQO) of 5 µg m-3 (1.4 µg kg bw-1 day-1) is selected to form the basis of the inhalation LLTC. This equates to an ELCR of 1 in 34000.
µg kg-1 bw day-1
NA