Embed Size (px)
Citation preview

APPENDIX C
TRAFFIC DATA
TECHNICAL TRANSPORTATION APPENDIX
CHILDREN’S HOSPITAL AND RESEARCH CENTER OAKLAND
DRAFT EIR
May 2014
WC12-2940

Appendix A: Intersection Count Data Sheets
Appendix B: LOS Calculation Worksheets – Existing Conditions
Appendix C: LOS Calculation Worksheets – 2020 No Project Conditions
Appendix D: LOS Calculation Worksheets – 2035 No Project Conditions
Appendix E: Transportation Impact Analysis Assumptions Memorandum
Appendix F: LOS Calculation Worksheets – Existing Plus Phase 1 Conditions
Appendix G: LOS Calculation Worksheets – Existing Plus Phase 2 Conditions
Appendix H: LOS Calculation Worksheets – 2020 Plus Phase 1 Conditions
Appendix I: LOS Calculation Worksheets – 2020 Plus Phase 2 Conditions
Appendix J: LOS Calculation Worksheets – 2035 Plus Phase 1 Conditions
Appendix K: LOS Calculation Worksheets – 2035 Plus Phase 2 Conditions
Appendix L: CMP Analysis Calculations
Appendix M: Queuing Analysis Summary
Appendix N: Collisions Analysis Summary
Appendix O: LOS Calculation Worksheets – Dover Street Closure Conditions

Appendix A Intersection Count Data Sheets

File Name :Date :
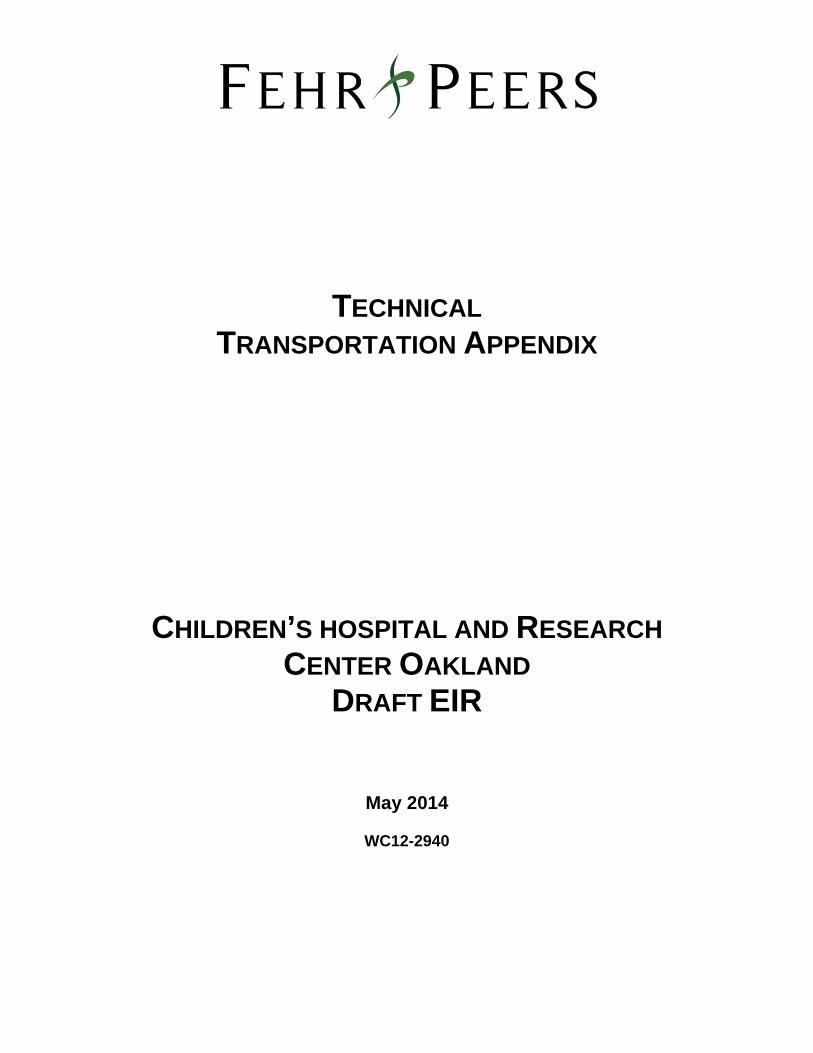
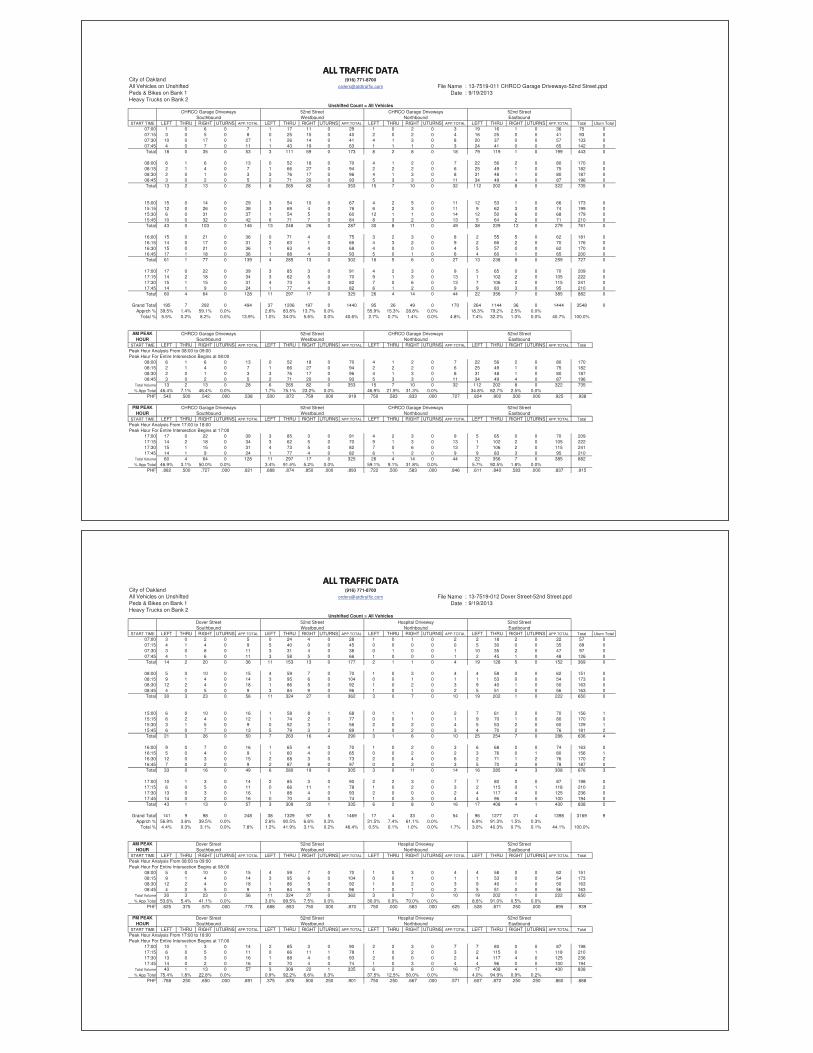
START TIME LEFT THRU RIGHT UTURNS APP.TOTAL LEFT THRU RIGHT UTURNS APP.TOTAL LEFT THRU RIGHT UTURNS APP.TOTAL LEFT THRU RIGHT UTURNS APP.TOTAL Total Uturn Total07:00 10 124 1 0 135 5 14 5 0 24 12 133 10 4 159 1 17 30 0 48 366 407:15 6 224 2 1 233 7 19 9 0 35 11 220 12 1 244 2 26 37 0 65 577 207:30 11 249 3 1 264 13 26 9 0 48 26 241 9 0 276 1 33 32 0 66 654 107:45 15 283 4 1 303 10 30 11 0 51 28 355 10 3 396 5 33 62 0 100 850 4Total 42 880 10 3 935 35 89 34 0 158 77 949 41 8 1075 9 109 161 0 279 2447 11
08:00 8 274 8 2 292 12 47 13 0 72 40 319 17 6 382 5 40 51 0 96 842 808:15 18 330 9 0 357 12 58 11 0 81 31 324 11 3 369 3 55 63 0 121 928 308:30 9 339 2 0 350 17 60 21 0 98 25 330 8 0 363 4 44 50 0 98 909 008:45 15 296 8 0 319 13 52 12 0 77 31 367 13 4 415 1 31 55 0 87 898 4Total 50 1239 27 2 1318 54 217 57 0 328 127 1340 49 13 1529 13 170 219 0 402 3577 15
15:00 14 260 4 0 278 9 40 8 0 57 41 272 16 4 333 1 39 41 0 81 749 415:15 15 289 5 2 311 15 46 16 0 77 38 284 22 4 348 5 41 36 0 82 818 615:30 24 299 3 1 327 20 27 15 0 62 48 297 16 3 364 0 35 44 0 79 832 415:45 15 302 4 0 321 13 34 13 0 60 34 317 18 3 372 4 33 41 0 78 831 3Total 68 1150 16 3 1237 57 147 52 0 256 161 1170 72 14 1417 10 148 162 0 320 3230 17
16:00 10 286 2 0 298 10 31 10 0 51 43 300 12 2 357 5 35 41 0 81 787 216:15 16 341 9 0 366 7 30 7 0 44 53 321 15 3 392 3 33 34 0 70 872 316:30 19 308 5 0 332 10 35 9 0 54 54 353 11 1 419 4 42 43 0 89 894 116:45 18 335 3 1 357 6 38 10 0 54 48 403 16 3 470 4 63 36 0 103 984 4Total 63 1270 19 1 1353 33 134 36 0 203 198 1377 54 9 1638 16 173 154 0 343 3537 10
17:00 28 316 1 1 346 15 30 8 0 53 49 371 24 7 451 2 72 36 0 110 960 817:15 23 321 5 0 349 9 37 13 0 59 59 390 23 0 472 4 51 45 0 100 980 017:30 15 322 5 0 342 19 32 11 0 62 41 414 24 3 482 2 61 44 0 107 993 317:45 26 313 3 0 342 10 29 8 0 47 49 371 19 1 440 3 52 39 0 94 923 1Total 92 1272 14 1 1379 53 128 40 0 221 198 1546 90 11 1845 11 236 164 0 411 3856 12
Grand Total 315 5811 86 10 6222 232 715 219 0 1166 761 6382 306 55 7504 59 836 860 0 1755 16647 65Apprch % 5.1% 93.4% 1.4% 0.2% 19.9% 61.3% 18.8% 0.0% 10.1% 85.0% 4.1% 0.7% 3.4% 47.6% 49.0% 0.0%
Total % 1.9% 34.9% 0.5% 0.1% 37.4% 1.4% 4.3% 1.3% 0.0% 7.0% 4.6% 38.3% 1.8% 0.3% 45.1% 0.4% 5.0% 5.2% 0.0% 10.5% 100.0%
START TIME LEFT THRU RIGHT UTURNS APP.TOTAL LEFT THRU RIGHT UTURNS APP.TOTAL LEFT THRU RIGHT UTURNS APP.TOTAL LEFT THRU RIGHT UTURNS APP.TOTAL TotalPeak Hour Analysis From 08:00 to 09:00Peak Hour For Entire Intersection Begins at 08:00
08:00 8 274 8 2 292 12 47 13 0 72 40 319 17 6 382 5 40 51 0 96 84208:15 18 330 9 0 357 12 58 11 0 81 31 324 11 3 369 3 55 63 0 121 92808:30 9 339 2 0 350 17 60 21 0 98 25 330 8 0 363 4 44 50 0 98 90908:45 15 296 8 0 319 13 52 12 0 77 31 367 13 4 415 1 31 55 0 87 898
Total Volume 50 1239 27 2 1318 54 217 57 0 328 127 1340 49 13 1529 13 170 219 0 402 3577% App Total 3.8% 94.0% 2.0% 0.2% 16.5% 66.2% 17.4% 0.0% 8.3% 87.6% 3.2% 0.9% 3.2% 42.3% 54.5% 0.0%
PHF .694 .914 .750 .250 .923 .794 .904 .679 .000 .837 .794 .913 .721 .542 .921 .650 .773 .869 .000 .831 .964
START TIME LEFT THRU RIGHT UTURNS APP.TOTAL LEFT THRU RIGHT UTURNS APP.TOTAL LEFT THRU RIGHT UTURNS APP.TOTAL LEFT THRU RIGHT UTURNS APP.TOTAL TotalPeak Hour Analysis From 16:45 to 17:45Peak Hour For Entire Intersection Begins at 16:45
16:45 18 335 3 1 357 6 38 10 0 54 48 403 16 3 470 4 63 36 0 103 98417:00 28 316 1 1 346 15 30 8 0 53 49 371 24 7 451 2 72 36 0 110 96017:15 23 321 5 0 349 9 37 13 0 59 59 390 23 0 472 4 51 45 0 100 98017:30 15 322 5 0 342 19 32 11 0 62 41 414 24 3 482 2 61 44 0 107 993
Total Volume 84 1294 14 2 1394 49 137 42 0 228 197 1578 87 13 1875 12 247 161 0 420 3917% App Total 6.0% 92.8% 1.0% 0.1% 21.5% 60.1% 18.4% 0.0% 10.5% 84.2% 4.6% 0.7% 2.9% 58.8% 38.3% 0.0%
PHF .750 .966 .700 .500 .976 .645 .901 .808 .000 .919 .835 .953 .906 .464 .973 .750 .858 .894 .000 .955 .986
Martin Luther King Jr WayNorthbound
55th StreetWestbound
Martin Luther King Jr WaySouthbound
55th StreetWestbound
Martin Luther King Jr WaySouthbound
55th StreetEastbound
13-7519-001 Martin Luther King Jr Way-55th Street.ppd
Unshifted Count = All VehiclesHeavy Trucks on Bank 2
55th StreetEastbound
9/19/2013
PM PEAK HOUR
Martin Luther King Jr WaySouthbound
55th StreetWestbound
Martin Luther King Jr WayNorthbound
AM PEAK HOUR
55th StreetEastbound
Martin Luther King Jr WayNorthbound
City of OaklandAll Vehicles on UnshiftedPeds & Bikes on Bank 1
(916) [email protected]
File Name :Date :
START TIME LEFT THRU RIGHT UTURNS APP.TOTAL LEFT THRU RIGHT UTURNS APP.TOTAL LEFT THRU RIGHT UTURNS APP.TOTAL LEFT THRU RIGHT UTURNS APP.TOTAL Total Uturn Total07:00 1 0 1 0 2 1 23 2 0 26 0 0 2 0 2 2 36 0 0 38 68 007:15 5 1 1 0 7 7 31 1 0 39 1 0 2 0 3 0 40 0 0 40 89 007:30 4 2 2 0 8 3 39 0 0 42 4 1 3 0 8 2 55 1 0 58 116 007:45 2 1 1 0 4 5 42 0 0 47 1 1 2 0 4 1 55 2 0 58 113 0Total 12 4 5 0 21 16 135 3 0 154 6 2 9 0 17 5 186 3 0 194 386 0
08:00 3 1 5 0 9 4 65 0 0 69 2 1 6 0 9 2 64 2 0 68 155 008:15 1 1 5 0 7 10 71 2 0 83 4 2 3 0 9 9 70 2 0 81 180 008:30 3 1 5 0 9 3 85 2 0 90 1 1 1 0 3 3 63 1 0 67 169 008:45 1 3 6 0 10 3 75 2 0 80 0 4 1 0 5 4 52 1 0 57 152 0Total 8 6 21 0 35 20 296 6 0 322 7 8 11 0 26 18 249 6 0 273 656 0
15:00 2 2 2 0 6 2 47 1 0 50 2 0 7 0 9 0 62 0 0 62 127 015:15 4 4 2 0 10 1 70 1 0 72 3 4 8 0 15 4 63 3 0 70 167 015:30 3 0 7 0 10 1 49 1 0 51 1 1 5 0 7 5 68 4 0 77 145 015:45 5 2 6 0 13 3 50 1 0 54 2 5 3 0 10 3 59 4 0 66 143 0Total 14 8 17 0 39 7 216 4 0 227 8 10 23 0 41 12 252 11 0 275 582 0
16:00 1 0 2 0 3 6 51 3 0 60 3 1 2 0 6 2 57 2 0 61 130 016:15 3 3 5 0 11 0 36 1 0 37 5 0 5 0 10 5 61 1 0 67 125 016:30 4 4 3 0 11 3 40 1 0 44 3 6 3 0 12 3 61 1 0 65 132 016:45 2 3 9 0 14 0 40 1 0 41 2 0 9 0 11 2 98 0 0 100 166 0Total 10 10 19 0 39 9 167 6 0 182 13 7 19 0 39 12 277 4 0 293 553 0
17:00 1 3 3 0 7 2 38 3 0 43 5 4 5 0 14 5 112 6 0 123 187 017:15 5 0 9 0 14 3 45 4 0 52 4 4 4 0 12 4 86 2 0 92 170 017:30 3 3 9 0 15 1 51 1 0 53 1 4 4 0 9 6 94 1 0 101 178 017:45 2 3 4 0 9 4 42 0 0 46 1 1 3 0 5 1 97 1 0 99 159 0Total 11 9 25 0 45 10 176 8 0 194 11 13 16 0 40 16 389 10 0 415 694 0
Grand Total 55 37 87 0 179 62 990 27 0 1079 45 40 78 0 163 63 1353 34 0 1450 2871 0Apprch % 30.7% 20.7% 48.6% 0.0% 5.7% 91.8% 2.5% 0.0% 27.6% 24.5% 47.9% 0.0% 4.3% 93.3% 2.3% 0.0%
Total % 1.9% 1.3% 3.0% 0.0% 6.2% 2.2% 34.5% 0.9% 0.0% 37.6% 1.6% 1.4% 2.7% 0.0% 5.7% 2.2% 47.1% 1.2% 0.0% 50.5% 100.0%
START TIME LEFT THRU RIGHT UTURNS APP.TOTAL LEFT THRU RIGHT UTURNS APP.TOTAL LEFT THRU RIGHT UTURNS APP.TOTAL LEFT THRU RIGHT UTURNS APP.TOTAL TotalPeak Hour Analysis From 08:00 to 09:00Peak Hour For Entire Intersection Begins at 08:00
08:00 3 1 5 0 9 4 65 0 0 69 2 1 6 0 9 2 64 2 0 68 15508:15 1 1 5 0 7 10 71 2 0 83 4 2 3 0 9 9 70 2 0 81 18008:30 3 1 5 0 9 3 85 2 0 90 1 1 1 0 3 3 63 1 0 67 16908:45 1 3 6 0 10 3 75 2 0 80 0 4 1 0 5 4 52 1 0 57 152
Total Volume 8 6 21 0 35 20 296 6 0 322 7 8 11 0 26 18 249 6 0 273 656% App Total 22.9% 17.1% 60.0% 0.0% 6.2% 91.9% 1.9% 0.0% 26.9% 30.8% 42.3% 0.0% 6.6% 91.2% 2.2% 0.0%
PHF .667 .500 .875 .000 .875 .500 .871 .750 .000 .894 .438 .500 .458 .000 .722 .500 .889 .750 .000 .843 .911
START TIME LEFT THRU RIGHT UTURNS APP.TOTAL LEFT THRU RIGHT UTURNS APP.TOTAL LEFT THRU RIGHT UTURNS APP.TOTAL LEFT THRU RIGHT UTURNS APP.TOTAL TotalPeak Hour Analysis From 16:45 to 17:45Peak Hour For Entire Intersection Begins at 16:45
16:45 2 3 9 0 14 0 40 1 0 41 2 0 9 0 11 2 98 0 0 100 16617:00 1 3 3 0 7 2 38 3 0 43 5 4 5 0 14 5 112 6 0 123 18717:15 5 0 9 0 14 3 45 4 0 52 4 4 4 0 12 4 86 2 0 92 17017:30 3 3 9 0 15 1 51 1 0 53 1 4 4 0 9 6 94 1 0 101 178
Total Volume 11 9 30 0 50 6 174 9 0 189 12 12 22 0 46 17 390 9 0 416 701% App Total 22.0% 18.0% 60.0% 0.0% 3.2% 92.1% 4.8% 0.0% 26.1% 26.1% 47.8% 0.0% 4.1% 93.8% 2.2% 0.0%
PHF .550 .750 .833 .000 .833 .500 .853 .563 .000 .892 .600 .750 .611 .000 .821 .708 .871 .375 .000 .846 .937
Dover StreetNorthbound
55th StreetWestbound
Dover StreetSouthbound
55th StreetWestbound
Dover StreetSouthbound
55th StreetEastbound
C:\Users\Sac - 3\Desktop\NDS\ITMs\13-7519 Oakland\raw\13
Unshifted Count = All VehiclesHeavy Trucks on Bank 2
55th StreetEastbound
9/19/2013
PM PEAK HOUR
Dover StreetSouthbound
55th StreetWestbound
Dover StreetNorthbound
AM PEAK HOUR
55th StreetEastbound
Dover StreetNorthbound
City of OaklandAll Vehicles on UnshiftedPeds & Bikes on Bank 1
(916) [email protected]
File Name :Date :
START TIME LEFT THRU RIGHT UTURNS APP.TOTAL LEFT THRU RIGHT UTURNS APP.TOTAL LEFT THRU RIGHT UTURNS APP.TOTAL LEFT THRU RIGHT UTURNS APP.TOTAL Total Uturn Total07:00 3 50 3 0 56 3 18 0 0 21 3 47 2 0 52 4 28 6 0 38 167 007:15 6 68 5 0 79 1 26 4 0 31 3 78 3 0 84 4 37 2 0 43 237 007:30 1 98 3 0 102 3 36 3 0 42 3 83 9 0 95 11 48 7 0 66 305 007:45 7 141 5 0 153 1 33 4 0 38 5 94 3 0 102 8 41 8 0 57 350 0Total 17 357 16 0 390 8 113 11 0 132 14 302 17 0 333 27 154 23 0 204 1059 0
08:00 7 124 9 0 140 4 51 8 0 63 7 105 4 0 116 11 55 7 0 73 392 008:15 3 146 4 0 153 5 71 6 0 82 7 88 7 0 102 18 57 7 0 82 419 008:30 4 144 10 0 158 6 65 8 0 79 9 113 9 0 131 13 37 13 0 63 431 008:45 11 130 5 0 146 10 63 9 0 82 5 124 4 0 133 8 38 13 0 59 420 0Total 25 544 28 0 597 25 250 31 0 306 28 430 24 0 482 50 187 40 0 277 1662 0
15:00 8 137 9 0 154 7 43 2 0 52 4 99 6 0 109 5 59 8 0 72 387 015:15 4 111 11 0 126 10 41 7 0 58 12 92 11 0 115 8 48 10 0 66 365 015:30 10 131 8 0 149 3 33 3 0 39 5 128 8 0 141 16 53 9 0 78 407 015:45 10 131 8 0 149 2 31 8 0 41 7 120 11 0 138 9 51 12 0 72 400 0Total 32 510 36 0 578 22 148 20 0 190 28 439 36 0 503 38 211 39 0 288 1559 0
16:00 12 107 7 0 126 4 40 6 0 50 8 85 4 0 97 20 39 6 0 65 338 016:15 5 128 8 0 141 8 28 12 0 48 4 112 8 0 124 7 60 3 0 70 383 016:30 5 139 14 0 158 9 26 7 0 42 11 115 11 0 137 10 56 6 0 72 409 016:45 4 126 2 0 132 4 27 13 0 44 10 123 11 0 144 17 72 14 0 103 423 0Total 26 500 31 0 557 25 121 38 0 184 33 435 34 0 502 54 227 29 0 310 1553 0
17:00 7 134 7 0 148 6 32 5 0 43 3 122 9 0 134 16 90 11 0 117 442 017:15 4 133 4 0 141 5 42 8 0 55 6 144 2 0 152 19 60 7 0 86 434 017:30 3 137 11 0 151 1 33 10 0 44 8 134 11 0 153 18 70 11 0 99 447 017:45 7 133 6 0 146 6 25 4 0 35 8 128 6 0 142 16 68 6 0 90 413 0Total 21 537 28 0 586 18 132 27 0 177 25 528 28 0 581 69 288 35 0 392 1736 0
Grand Total 121 2448 139 0 2708 98 764 127 0 989 128 2134 139 0 2401 238 1067 166 0 1471 7569 0Apprch % 4.5% 90.4% 5.1% 0.0% 9.9% 77.2% 12.8% 0.0% 5.3% 88.9% 5.8% 0.0% 16.2% 72.5% 11.3% 0.0%
Total % 1.6% 32.3% 1.8% 0.0% 35.8% 1.3% 10.1% 1.7% 0.0% 13.1% 1.7% 28.2% 1.8% 0.0% 31.7% 3.1% 14.1% 2.2% 0.0% 19.4% 100.0%
START TIME LEFT THRU RIGHT UTURNS APP.TOTAL LEFT THRU RIGHT UTURNS APP.TOTAL LEFT THRU RIGHT UTURNS APP.TOTAL LEFT THRU RIGHT UTURNS APP.TOTAL TotalPeak Hour Analysis From 08:00 to 09:00Peak Hour For Entire Intersection Begins at 08:00
08:00 7 124 9 0 140 4 51 8 0 63 7 105 4 0 116 11 55 7 0 73 39208:15 3 146 4 0 153 5 71 6 0 82 7 88 7 0 102 18 57 7 0 82 41908:30 4 144 10 0 158 6 65 8 0 79 9 113 9 0 131 13 37 13 0 63 43108:45 11 130 5 0 146 10 63 9 0 82 5 124 4 0 133 8 38 13 0 59 420
Total Volume 25 544 28 0 597 25 250 31 0 306 28 430 24 0 482 50 187 40 0 277 1662% App Total 4.2% 91.1% 4.7% 0.0% 8.2% 81.7% 10.1% 0.0% 5.8% 89.2% 5.0% 0.0% 18.1% 67.5% 14.4% 0.0%
PHF .568 .932 .700 .000 .945 .625 .880 .861 .000 .933 .778 .867 .667 .000 .906 .694 .820 .769 .000 .845 .964
START TIME LEFT THRU RIGHT UTURNS APP.TOTAL LEFT THRU RIGHT UTURNS APP.TOTAL LEFT THRU RIGHT UTURNS APP.TOTAL LEFT THRU RIGHT UTURNS APP.TOTAL TotalPeak Hour Analysis From 16:45 to 17:45Peak Hour For Entire Intersection Begins at 16:45
16:45 4 126 2 0 132 4 27 13 0 44 10 123 11 0 144 17 72 14 0 103 42317:00 7 134 7 0 148 6 32 5 0 43 3 122 9 0 134 16 90 11 0 117 44217:15 4 133 4 0 141 5 42 8 0 55 6 144 2 0 152 19 60 7 0 86 43417:30 3 137 11 0 151 1 33 10 0 44 8 134 11 0 153 18 70 11 0 99 447
Total Volume 18 530 24 0 572 16 134 36 0 186 27 523 33 0 583 70 292 43 0 405 1746% App Total 3.1% 92.7% 4.2% 0.0% 8.6% 72.0% 19.4% 0.0% 4.6% 89.7% 5.7% 0.0% 17.3% 72.1% 10.6% 0.0%
PHF .643 .967 .545 .000 .947 .667 .798 .692 .000 .845 .675 .908 .750 .000 .953 .921 .811 .768 .000 .865 .977
Shattuck AvenueNorthbound
55th StreetWestbound
Shattuck AvenueSouthbound
55th StreetWestbound
Shattuck AvenueSouthbound
55th StreetEastbound
C:\Users\Sac - 3\Desktop\NDS\ITMs\13-7519 Oakland\raw\13
Unshifted Count = All VehiclesHeavy Trucks on Bank 2
55th StreetEastbound
9/19/2013
PM PEAK HOUR
Shattuck AvenueSouthbound
55th StreetWestbound
Shattuck AvenueNorthbound
AM PEAK HOUR
55th StreetEastbound
Shattuck AvenueNorthbound
City of OaklandAll Vehicles on UnshiftedPeds & Bikes on Bank 1
(916) [email protected]
File Name :Date :
START TIME LEFT THRU RIGHT UTURNS APP.TOTAL LEFT THRU RIGHT UTURNS APP.TOTAL LEFT THRU RIGHT UTURNS APP.TOTAL LEFT THRU RIGHT UTURNS APP.TOTAL Total Uturn Total07:00 5 83 15 0 103 8 1 0 0 9 1 70 5 0 76 19 1 11 0 31 219 007:15 6 98 26 0 130 3 2 2 0 7 5 112 5 0 122 30 3 9 0 42 301 007:30 4 138 32 0 174 4 1 3 0 8 8 122 15 0 145 42 2 12 0 56 383 007:45 5 156 34 0 195 10 3 2 0 15 12 148 8 0 168 31 2 17 0 50 428 0Total 20 475 107 0 602 25 7 7 0 39 26 452 33 0 511 122 8 49 0 179 1331 0
08:00 8 169 48 0 225 8 3 3 0 14 8 180 12 0 200 41 4 17 0 62 501 008:15 9 216 62 0 287 7 0 2 0 9 18 178 9 0 205 41 3 15 0 59 560 008:30 5 200 65 0 270 7 5 3 0 15 15 159 7 0 181 27 4 21 0 52 518 008:45 5 221 61 0 287 10 2 1 0 13 17 198 12 0 227 27 3 24 0 54 581 0Total 27 806 236 0 1069 32 10 9 0 51 58 715 40 0 813 136 14 77 0 227 2160 0
15:00 13 190 33 0 236 10 2 6 0 18 18 176 13 0 207 48 6 20 0 74 535 015:15 7 211 37 0 255 3 10 9 0 22 12 183 8 0 203 33 6 14 0 53 533 015:30 10 158 20 0 188 8 8 4 0 20 10 214 8 0 232 42 7 19 0 68 508 015:45 6 190 20 0 216 4 2 2 0 8 15 226 9 0 250 33 4 22 0 59 533 0Total 36 749 110 0 895 25 22 21 0 68 55 799 38 0 892 156 23 75 0 254 2109 0
16:00 6 178 26 0 210 5 6 2 0 13 22 188 8 0 218 46 4 18 0 68 509 016:15 11 191 18 0 220 10 5 7 0 22 18 196 14 0 228 45 8 24 0 77 547 016:30 5 189 15 0 209 7 5 3 0 15 13 184 14 0 211 48 4 19 0 71 506 016:45 2 180 24 0 206 7 3 2 0 12 14 228 13 0 255 58 6 14 0 78 551 0Total 24 738 83 0 845 29 19 14 0 62 67 796 49 0 912 197 22 75 0 294 2113 0
17:00 5 235 21 0 261 10 5 7 0 22 12 224 17 0 253 63 7 26 0 96 632 017:15 4 255 29 0 288 8 3 5 0 16 24 255 14 0 293 41 4 23 0 68 665 017:30 9 254 22 0 285 13 3 4 0 20 20 216 13 0 249 66 3 30 0 99 653 017:45 8 234 23 0 265 9 0 2 0 11 19 246 10 0 275 55 4 26 0 85 636 0Total 26 978 95 0 1099 40 11 18 0 69 75 941 54 0 1070 225 18 105 0 348 2586 0
Grand Total 133 3746 631 0 4510 151 69 69 0 289 281 3703 214 0 4198 836 85 381 0 1302 10299 0Apprch % 2.9% 83.1% 14.0% 0.0% 52.2% 23.9% 23.9% 0.0% 6.7% 88.2% 5.1% 0.0% 64.2% 6.5% 29.3% 0.0%
Total % 1.3% 36.4% 6.1% 0.0% 43.8% 1.5% 0.7% 0.7% 0.0% 2.8% 2.7% 36.0% 2.1% 0.0% 40.8% 8.1% 0.8% 3.7% 0.0% 12.6% 100.0%
START TIME LEFT THRU RIGHT UTURNS APP.TOTAL LEFT THRU RIGHT UTURNS APP.TOTAL LEFT THRU RIGHT UTURNS APP.TOTAL LEFT THRU RIGHT UTURNS APP.TOTAL TotalPeak Hour Analysis From 08:00 to 09:00Peak Hour For Entire Intersection Begins at 08:00
08:00 8 169 48 0 225 8 3 3 0 14 8 180 12 0 200 41 4 17 0 62 50108:15 9 216 62 0 287 7 0 2 0 9 18 178 9 0 205 41 3 15 0 59 56008:30 5 200 65 0 270 7 5 3 0 15 15 159 7 0 181 27 4 21 0 52 51808:45 5 221 61 0 287 10 2 1 0 13 17 198 12 0 227 27 3 24 0 54 581
Total Volume 27 806 236 0 1069 32 10 9 0 51 58 715 40 0 813 136 14 77 0 227 2160% App Total 2.5% 75.4% 22.1% 0.0% 62.7% 19.6% 17.6% 0.0% 7.1% 87.9% 4.9% 0.0% 59.9% 6.2% 33.9% 0.0%
PHF .750 .912 .908 .000 .931 .800 .500 .750 .000 .850 .806 .903 .833 .000 .895 .829 .875 .802 .000 .915 .929
START TIME LEFT THRU RIGHT UTURNS APP.TOTAL LEFT THRU RIGHT UTURNS APP.TOTAL LEFT THRU RIGHT UTURNS APP.TOTAL LEFT THRU RIGHT UTURNS APP.TOTAL TotalPeak Hour Analysis From 17:00 to 18:00Peak Hour For Entire Intersection Begins at 17:00
17:00 5 235 21 0 261 10 5 7 0 22 12 224 17 0 253 63 7 26 0 96 63217:15 4 255 29 0 288 8 3 5 0 16 24 255 14 0 293 41 4 23 0 68 66517:30 9 254 22 0 285 13 3 4 0 20 20 216 13 0 249 66 3 30 0 99 65317:45 8 234 23 0 265 9 0 2 0 11 19 246 10 0 275 55 4 26 0 85 636
Total Volume 26 978 95 0 1099 40 11 18 0 69 75 941 54 0 1070 225 18 105 0 348 2586% App Total 2.4% 89.0% 8.6% 0.0% 58.0% 15.9% 26.1% 0.0% 7.0% 87.9% 5.0% 0.0% 64.7% 5.2% 30.2% 0.0%
PHF .722 .959 .819 .000 .954 .769 .550 .643 .000 .784 .781 .923 .794 .000 .913 .852 .643 .875 .000 .879 .972
Telegraph AvenueNorthbound
55th StreetWestbound
Telegraph AvenueSouthbound
55th StreetWestbound
Telegraph AvenueSouthbound
55th StreetEastbound
C:\Users\Sac - 3\Desktop\NDS\ITMs\13-7519 Oakland\raw\13
Unshifted Count = All VehiclesHeavy Trucks on Bank 2
55th StreetEastbound
9/19/2013
PM PEAK HOUR
Telegraph AvenueSouthbound
55th StreetWestbound
Telegraph AvenueNorthbound
AM PEAK HOUR
55th StreetEastbound
Telegraph AvenueNorthbound
City of OaklandAll Vehicles on UnshiftedPeds & Bikes on Bank 1
(916) [email protected]
File Name :Date :
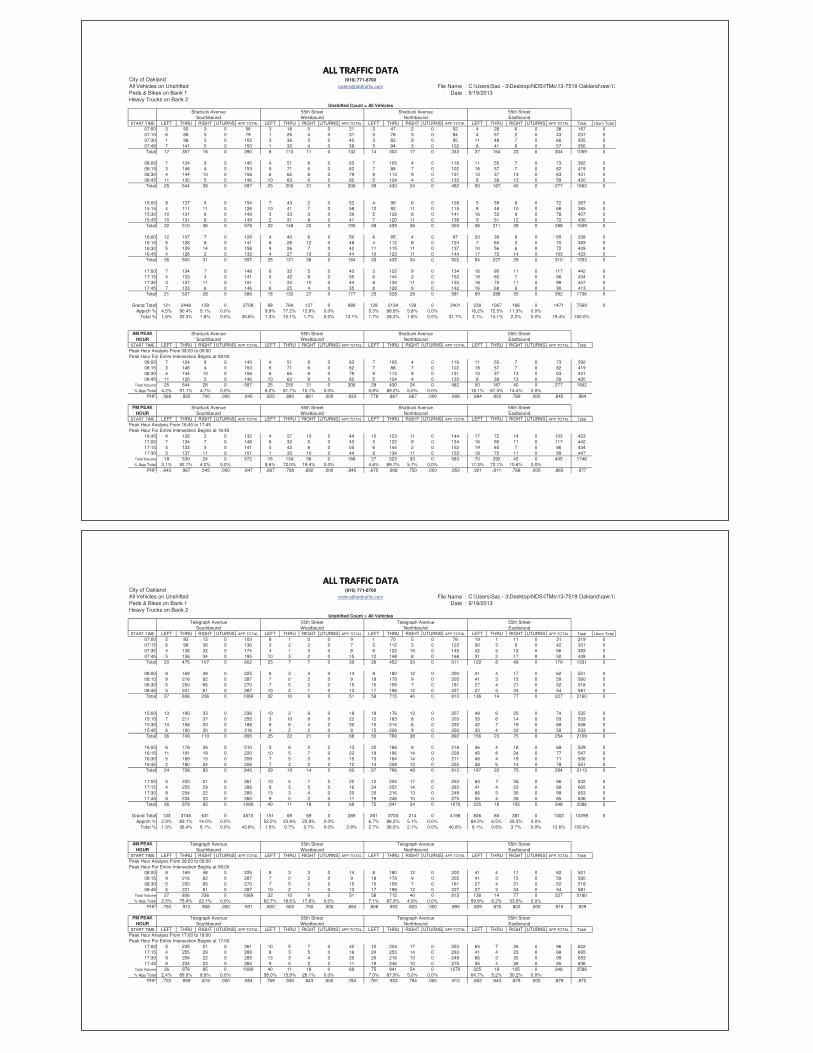
START TIME LEFT THRU RIGHT UTURNS APP.TOTAL LEFT THRU RIGHT UTURNS APP.TOTAL LEFT THRU RIGHT UTURNS APP.TOTAL LEFT THRU RIGHT UTURNS APP.TOTAL Total Uturn Total07:00 0 172 1 2 175 2 0 3 0 5 5 150 2 2 159 0 0 6 0 6 345 407:15 1 256 0 1 258 1 0 1 0 2 5 248 5 0 258 0 0 5 0 5 523 107:30 0 301 1 0 302 0 0 3 0 3 2 275 2 1 280 0 0 8 0 8 593 107:45 0 346 0 1 347 0 1 3 0 4 1 385 4 1 391 2 0 6 0 8 750 2Total 1 1075 2 4 1082 3 1 10 0 14 13 1058 13 4 1088 2 0 25 0 27 2211 8
08:00 0 344 1 1 346 1 0 0 0 1 5 387 1 1 394 0 2 12 0 14 755 208:15 2 392 2 1 397 1 2 4 0 7 1 352 2 2 357 2 0 9 0 11 772 308:30 1 411 2 0 414 2 0 1 0 3 4 373 3 3 383 0 0 13 0 13 813 308:45 2 338 2 1 343 1 1 3 0 5 5 393 4 4 406 2 1 9 0 12 766 5Total 5 1485 7 3 1500 5 3 8 0 16 15 1505 10 10 1540 4 3 43 0 50 3106 13
15:00 1 311 2 1 315 2 1 2 0 5 3 321 5 1 330 1 2 6 0 9 659 215:15 6 347 0 3 356 2 2 4 0 8 4 334 0 2 340 0 1 6 0 7 711 515:30 4 355 2 1 362 3 1 4 0 8 7 362 3 2 374 1 0 5 0 6 750 315:45 4 376 1 0 381 1 1 3 0 5 3 379 3 3 388 2 3 7 0 12 786 3Total 15 1389 5 5 1414 8 5 13 0 26 17 1396 11 8 1432 4 6 24 0 34 2906 13
16:00 1 329 0 3 333 3 0 0 0 3 5 356 5 6 372 0 2 8 0 10 718 916:15 4 376 1 1 382 2 0 2 0 4 7 387 3 3 400 1 2 9 0 12 798 416:30 0 377 2 2 381 0 3 4 0 7 6 415 2 4 427 1 0 6 0 7 822 616:45 1 386 1 2 390 1 1 0 0 2 7 484 3 2 496 1 4 4 0 9 897 4Total 6 1468 4 8 1486 6 4 6 0 16 25 1642 13 15 1695 3 8 27 0 38 3235 23
17:00 3 357 1 1 362 2 0 5 0 7 4 446 4 4 458 1 0 9 0 10 837 517:15 5 372 4 3 384 6 0 2 0 8 9 459 6 2 476 0 0 13 0 13 881 517:30 0 371 1 0 372 5 1 1 0 7 12 455 2 0 469 2 1 12 0 15 863 017:45 2 345 2 1 350 4 1 0 0 5 6 465 1 3 475 0 0 7 0 7 837 4Total 10 1445 8 5 1468 17 2 8 0 27 31 1825 13 9 1878 3 1 41 0 45 3418 14
Grand Total 37 6862 26 25 6950 39 15 45 0 99 101 7426 60 46 7633 16 18 160 0 194 14876 71Apprch % 0.5% 98.7% 0.4% 0.4% 39.4% 15.2% 45.5% 0.0% 1.3% 97.3% 0.8% 0.6% 8.2% 9.3% 82.5% 0.0%
Total % 0.2% 46.1% 0.2% 0.2% 46.7% 0.3% 0.1% 0.3% 0.0% 0.7% 0.7% 49.9% 0.4% 0.3% 51.3% 0.1% 0.1% 1.1% 0.0% 1.3% 100.0%
START TIME LEFT THRU RIGHT UTURNS APP.TOTAL LEFT THRU RIGHT UTURNS APP.TOTAL LEFT THRU RIGHT UTURNS APP.TOTAL LEFT THRU RIGHT UTURNS APP.TOTAL TotalPeak Hour Analysis From 08:00 to 09:00Peak Hour For Entire Intersection Begins at 08:00
08:00 0 344 1 1 346 1 0 0 0 1 5 387 1 1 394 0 2 12 0 14 75508:15 2 392 2 1 397 1 2 4 0 7 1 352 2 2 357 2 0 9 0 11 77208:30 1 411 2 0 414 2 0 1 0 3 4 373 3 3 383 0 0 13 0 13 81308:45 2 338 2 1 343 1 1 3 0 5 5 393 4 4 406 2 1 9 0 12 766
Total Volume 5 1485 7 3 1500 5 3 8 0 16 15 1505 10 10 1540 4 3 43 0 50 3106% App Total 0.3% 99.0% 0.5% 0.2% 31.3% 18.8% 50.0% 0.0% 1.0% 97.7% 0.6% 0.6% 8.0% 6.0% 86.0% 0.0%
PHF .625 .903 .875 .750 .906 .625 .375 .500 .000 .571 .750 .957 .625 .625 .948 .500 .375 .827 .000 .893 .955
START TIME LEFT THRU RIGHT UTURNS APP.TOTAL LEFT THRU RIGHT UTURNS APP.TOTAL LEFT THRU RIGHT UTURNS APP.TOTAL LEFT THRU RIGHT UTURNS APP.TOTAL TotalPeak Hour Analysis From 16:45 to 17:45Peak Hour For Entire Intersection Begins at 16:45
16:45 1 386 1 2 390 1 1 0 0 2 7 484 3 2 496 1 4 4 0 9 89717:00 3 357 1 1 362 2 0 5 0 7 4 446 4 4 458 1 0 9 0 10 83717:15 5 372 4 3 384 6 0 2 0 8 9 459 6 2 476 0 0 13 0 13 88117:30 0 371 1 0 372 5 1 1 0 7 12 455 2 0 469 2 1 12 0 15 863
Total Volume 9 1486 7 6 1508 14 2 8 0 24 32 1844 15 8 1899 4 5 38 0 47 3478% App Total 0.6% 98.5% 0.5% 0.4% 58.3% 8.3% 33.3% 0.0% 1.7% 97.1% 0.8% 0.4% 8.5% 10.6% 80.9% 0.0%
PHF .450 .962 .438 .500 .967 .583 .500 .400 .000 .750 .667 .952 .625 .500 .957 .500 .313 .731 .000 .783 .969
Martin Luther King Jr WayNorthbound
54th StreetWestbound
Martin Luther King Jr WaySouthbound
54th StreetWestbound
Martin Luther King Jr WaySouthbound
54th StreetEastbound
13-7519-005 Martin Luther King Jr Way-54th Street.ppd
Unshifted Count = All VehiclesHeavy Trucks on Bank 2
54th StreetEastbound
9/19/2013
PM PEAK HOUR
Martin Luther King Jr WaySouthbound
54th StreetWestbound
Martin Luther King Jr WayNorthbound
AM PEAK HOUR
54th StreetEastbound
Martin Luther King Jr WayNorthbound
City of OaklandAll Vehicles on UnshiftedPeds & Bikes on Bank 1
(916) [email protected]
File Name :Date :
START TIME LEFT THRU RIGHT UTURNS APP.TOTAL LEFT THRU RIGHT UTURNS APP.TOTAL LEFT THRU RIGHT UTURNS APP.TOTAL LEFT THRU RIGHT UTURNS APP.TOTAL Total Uturn Total07:00 0 1 0 0 1 0 2 1 0 3 0 0 0 0 0 0 2 1 0 3 7 007:15 1 7 0 0 8 0 0 0 0 0 1 3 0 0 4 1 2 3 0 6 18 007:30 0 3 2 0 5 0 0 2 0 2 2 6 2 0 10 0 0 1 0 1 18 007:45 0 5 2 0 7 0 0 0 0 0 1 4 1 0 6 2 2 0 0 4 17 0Total 1 16 4 0 21 0 2 3 0 5 4 13 3 0 20 3 6 5 0 14 60 0
08:00 0 9 0 0 9 1 1 2 0 4 2 4 1 0 7 2 1 3 0 6 26 008:15 2 11 4 0 17 2 2 3 0 7 0 5 7 0 12 1 1 1 0 3 39 008:30 2 6 0 0 8 0 0 1 0 1 2 3 2 0 7 1 2 0 0 3 19 008:45 0 7 1 0 8 1 3 3 0 7 4 5 1 0 10 1 1 2 0 4 29 0Total 4 33 5 0 42 4 6 9 0 19 8 17 11 0 36 5 5 6 0 16 113 0
15:00 1 5 0 0 6 1 2 0 0 3 1 10 2 0 13 0 2 2 0 4 26 015:15 0 6 3 0 9 1 2 2 0 5 1 9 1 0 11 2 4 1 0 7 32 015:30 2 4 1 0 7 2 4 2 0 8 3 3 2 0 8 2 1 2 0 5 28 015:45 1 4 2 0 7 0 3 3 0 6 0 5 1 0 6 2 5 0 0 7 26 0Total 4 19 6 0 29 4 11 7 0 22 5 27 6 0 38 6 12 5 0 23 112 0
16:00 0 3 3 0 6 0 1 1 0 2 0 4 1 0 5 1 2 2 0 5 18 016:15 2 4 1 0 7 2 1 1 0 4 0 7 0 0 7 3 2 3 0 8 26 016:30 0 4 5 0 9 1 0 1 0 2 2 7 1 0 10 3 1 0 0 4 25 016:45 2 2 0 0 4 0 0 4 0 4 0 8 1 0 9 4 2 2 0 8 25 0Total 4 13 9 0 26 3 2 7 0 12 2 26 3 0 31 11 7 7 0 25 94 0
17:00 2 5 2 0 9 1 2 6 0 9 3 9 2 0 14 3 3 1 0 7 39 017:15 3 4 0 0 7 1 2 1 0 4 3 7 0 0 10 0 3 0 0 3 24 017:30 0 6 0 0 6 0 1 0 0 1 2 7 1 0 10 1 2 1 0 4 21 017:45 1 3 3 0 7 0 1 0 0 1 1 5 1 0 7 1 1 1 0 3 18 0Total 6 18 5 0 29 2 6 7 0 15 9 28 4 0 41 5 9 3 0 17 102 0
Grand Total 19 99 29 0 147 13 27 33 0 73 28 111 27 0 166 30 39 26 0 95 481 0Apprch % 12.9% 67.3% 19.7% 0.0% 17.8% 37.0% 45.2% 0.0% 16.9% 66.9% 16.3% 0.0% 31.6% 41.1% 27.4% 0.0%
Total % 4.0% 20.6% 6.0% 0.0% 30.6% 2.7% 5.6% 6.9% 0.0% 15.2% 5.8% 23.1% 5.6% 0.0% 34.5% 6.2% 8.1% 5.4% 0.0% 19.8% 100.0%
START TIME LEFT THRU RIGHT UTURNS APP.TOTAL LEFT THRU RIGHT UTURNS APP.TOTAL LEFT THRU RIGHT UTURNS APP.TOTAL LEFT THRU RIGHT UTURNS APP.TOTAL TotalPeak Hour Analysis From 08:00 to 09:00Peak Hour For Entire Intersection Begins at 08:00
08:00 0 9 0 0 9 1 1 2 0 4 2 4 1 0 7 2 1 3 0 6 2608:15 2 11 4 0 17 2 2 3 0 7 0 5 7 0 12 1 1 1 0 3 3908:30 2 6 0 0 8 0 0 1 0 1 2 3 2 0 7 1 2 0 0 3 1908:45 0 7 1 0 8 1 3 3 0 7 4 5 1 0 10 1 1 2 0 4 29
Total Volume 4 33 5 0 42 4 6 9 0 19 8 17 11 0 36 5 5 6 0 16 113% App Total 9.5% 78.6% 11.9% 0.0% 21.1% 31.6% 47.4% 0.0% 22.2% 47.2% 30.6% 0.0% 31.3% 31.3% 37.5% 0.0%
PHF .500 .750 .313 .000 .618 .500 .500 .750 .000 .679 .500 .850 .393 .000 .750 .625 .625 .500 .000 .667 .724
START TIME LEFT THRU RIGHT UTURNS APP.TOTAL LEFT THRU RIGHT UTURNS APP.TOTAL LEFT THRU RIGHT UTURNS APP.TOTAL LEFT THRU RIGHT UTURNS APP.TOTAL TotalPeak Hour Analysis From 16:15 to 17:15Peak Hour For Entire Intersection Begins at 16:15
16:15 2 4 1 0 7 2 1 1 0 4 0 7 0 0 7 3 2 3 0 8 2616:30 0 4 5 0 9 1 0 1 0 2 2 7 1 0 10 3 1 0 0 4 2516:45 2 2 0 0 4 0 0 4 0 4 0 8 1 0 9 4 2 2 0 8 2517:00 2 5 2 0 9 1 2 6 0 9 3 9 2 0 14 3 3 1 0 7 39
Total Volume 6 15 8 0 29 4 3 12 0 19 5 31 4 0 40 13 8 6 0 27 115% App Total 20.7% 51.7% 27.6% 0.0% 21.1% 15.8% 63.2% 0.0% 12.5% 77.5% 10.0% 0.0% 48.1% 29.6% 22.2% 0.0%
PHF .750 .750 .400 .000 .806 .500 .375 .500 .000 .528 .417 .861 .500 .000 .714 .813 .667 .500 .000 .844 .737
Dover StreetNorthbound
54th StreetWestbound
Dover StreetSouthbound
54th StreetWestbound
Dover StreetSouthbound
54th StreetEastbound
13-7519-006 Dover Street-54th Street.ppd
Unshifted Count = All VehiclesHeavy Trucks on Bank 2
54th StreetEastbound
9/19/2013
PM PEAK HOUR
Dover StreetSouthbound
54th StreetWestbound
Dover StreetNorthbound
AM PEAK HOUR
54th StreetEastbound
Dover StreetNorthbound
City of OaklandAll Vehicles on UnshiftedPeds & Bikes on Bank 1
(916) [email protected]

File Name :Date :
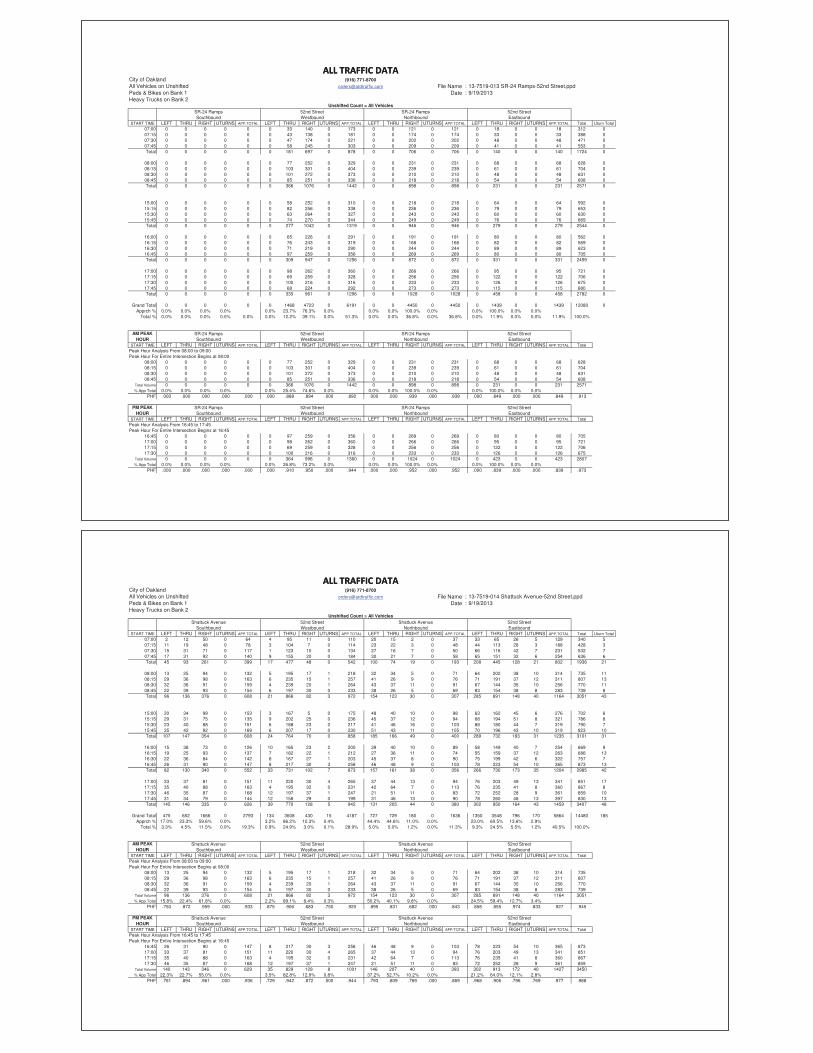
START TIME LEFT THRU RIGHT UTURNS APP.TOTAL LEFT THRU RIGHT UTURNS APP.TOTAL LEFT THRU RIGHT UTURNS APP.TOTAL LEFT THRU RIGHT UTURNS APP.TOTAL Total Uturn Total07:00 0 59 0 0 59 3 0 1 0 4 2 59 0 0 61 1 0 2 0 3 127 007:15 0 73 0 0 73 2 0 0 0 2 0 71 0 0 71 2 0 3 0 5 151 007:30 0 109 1 0 110 1 0 1 0 2 1 90 0 0 91 0 0 5 0 5 208 007:45 0 147 0 0 147 0 0 0 0 0 1 106 0 0 107 1 0 3 0 4 258 0Total 0 388 1 0 389 6 0 2 0 8 4 326 0 0 330 4 0 13 0 17 744 0
08:00 0 122 1 0 123 3 0 1 0 4 3 116 0 0 119 1 0 2 0 3 249 008:15 0 154 1 0 155 1 0 0 0 1 2 104 0 0 106 0 0 8 0 8 270 008:30 0 159 1 0 160 0 0 0 0 0 3 134 0 0 137 0 0 3 0 3 300 008:45 0 152 2 0 154 2 0 0 0 2 4 133 0 0 137 0 0 1 0 1 294 0Total 0 587 5 0 592 6 0 1 0 7 12 487 0 0 499 1 0 14 0 15 1113 0
15:00 2 142 2 0 146 0 0 0 0 0 2 110 1 0 113 1 0 4 0 5 264 015:15 1 129 0 0 130 2 0 0 0 2 4 118 1 0 123 1 0 5 0 6 261 015:30 1 144 2 0 147 2 0 1 0 3 6 155 1 0 162 1 0 1 0 2 314 015:45 0 154 1 0 155 0 0 0 0 0 6 125 1 0 132 2 0 5 0 7 294 0Total 4 569 5 0 578 4 0 1 0 5 18 508 4 0 530 5 0 15 0 20 1133 0
16:00 0 93 0 0 93 4 0 0 0 4 2 93 2 0 97 1 0 3 0 4 198 016:15 0 131 2 0 133 0 0 0 0 0 2 108 0 0 110 0 0 2 0 2 245 016:30 0 159 1 0 160 0 0 0 0 0 1 117 0 0 118 2 0 0 0 2 280 016:45 1 149 0 0 150 2 0 1 0 3 2 151 2 0 155 0 0 2 0 2 310 0Total 1 532 3 0 536 6 0 1 0 7 7 469 4 0 480 3 0 7 0 10 1033 0
17:00 0 152 1 0 153 1 0 0 0 1 5 126 0 0 131 0 0 4 0 4 289 017:15 1 160 1 0 162 0 0 1 0 1 2 163 2 0 167 1 0 6 0 7 337 017:30 0 153 1 0 154 0 0 0 0 0 2 161 0 0 163 2 0 2 0 4 321 017:45 0 145 0 0 145 0 0 0 0 0 4 137 0 0 141 1 0 1 0 2 288 0Total 1 610 3 0 614 1 0 1 0 2 13 587 2 0 602 4 0 13 0 17 1235 0
Grand Total 6 2686 17 0 2709 23 0 6 0 29 54 2377 10 0 2441 17 0 62 0 79 5258 0Apprch % 0.2% 99.2% 0.6% 0.0% 79.3% 0.0% 20.7% 0.0% 2.2% 97.4% 0.4% 0.0% 21.5% 0.0% 78.5% 0.0%
Total % 0.1% 51.1% 0.3% 0.0% 51.5% 0.4% 0.0% 0.1% 0.0% 0.6% 1.0% 45.2% 0.2% 0.0% 46.4% 0.3% 0.0% 1.2% 0.0% 1.5% 100.0%
START TIME LEFT THRU RIGHT UTURNS APP.TOTAL LEFT THRU RIGHT UTURNS APP.TOTAL LEFT THRU RIGHT UTURNS APP.TOTAL LEFT THRU RIGHT UTURNS APP.TOTAL TotalPeak Hour Analysis From 08:00 to 09:00Peak Hour For Entire Intersection Begins at 08:00
08:00 0 122 1 0 123 3 0 1 0 4 3 116 0 0 119 1 0 2 0 3 24908:15 0 154 1 0 155 1 0 0 0 1 2 104 0 0 106 0 0 8 0 8 27008:30 0 159 1 0 160 0 0 0 0 0 3 134 0 0 137 0 0 3 0 3 30008:45 0 152 2 0 154 2 0 0 0 2 4 133 0 0 137 0 0 1 0 1 294
Total Volume 0 587 5 0 592 6 0 1 0 7 12 487 0 0 499 1 0 14 0 15 1113% App Total 0.0% 99.2% 0.8% 0.0% 85.7% 0.0% 14.3% 0.0% 2.4% 97.6% 0.0% 0.0% 6.7% 0.0% 93.3% 0.0%
PHF .000 .923 .625 .000 .925 .500 .000 .250 .000 .438 .750 .909 .000 .000 .911 .250 .000 .438 .000 .469 .928
START TIME LEFT THRU RIGHT UTURNS APP.TOTAL LEFT THRU RIGHT UTURNS APP.TOTAL LEFT THRU RIGHT UTURNS APP.TOTAL LEFT THRU RIGHT UTURNS APP.TOTAL TotalPeak Hour Analysis From 16:45 to 17:45Peak Hour For Entire Intersection Begins at 16:45
16:45 1 149 0 0 150 2 0 1 0 3 2 151 2 0 155 0 0 2 0 2 31017:00 0 152 1 0 153 1 0 0 0 1 5 126 0 0 131 0 0 4 0 4 28917:15 1 160 1 0 162 0 0 1 0 1 2 163 2 0 167 1 0 6 0 7 33717:30 0 153 1 0 154 0 0 0 0 0 2 161 0 0 163 2 0 2 0 4 321
Total Volume 2 614 3 0 619 3 0 2 0 5 11 601 4 0 616 3 0 14 0 17 1257% App Total 0.3% 99.2% 0.5% 0.0% 60.0% 0.0% 40.0% 0.0% 1.8% 97.6% 0.6% 0.0% 17.6% 0.0% 82.4% 0.0%
PHF .500 .959 .750 .000 .955 .375 .000 .500 .000 .417 .550 .922 .500 .000 .922 .375 .000 .583 .000 .607 .932
Shattuck AveniueNorthbound
54th StreetWestbound
Shattuck AveniueSouthbound
54th StreetWestbound
Shattuck AveniueSouthbound
54th StreetEastbound
13-7519-007 Shattuck Aveniue-54th Street.ppd
Unshifted Count = All VehiclesHeavy Trucks on Bank 2
54th StreetEastbound
9/19/2013
PM PEAK HOUR
Shattuck AveniueSouthbound
54th StreetWestbound
Shattuck AveniueNorthbound
AM PEAK HOUR
54th StreetEastbound
Shattuck AveniueNorthbound
City of OaklandAll Vehicles on UnshiftedPeds & Bikes on Bank 1
(916) [email protected]
File Name :Date :
START TIME LEFT THRU RIGHT UTURNS APP.TOTAL LEFT THRU RIGHT UTURNS APP.TOTAL LEFT THRU RIGHT UTURNS APP.TOTAL LEFT THRU RIGHT UTURNS APP.TOTAL Total Uturn Total07:00 2 167 0 0 169 1 0 0 0 1 1 159 3 0 163 0 1 3 0 4 337 007:15 3 271 0 0 274 0 1 0 0 1 2 255 4 0 261 3 0 8 0 11 547 007:30 1 296 1 0 298 2 0 4 0 6 5 288 4 2 299 0 0 9 0 9 612 207:45 3 363 0 2 368 0 1 1 0 2 4 382 3 3 392 0 1 11 0 12 774 5Total 9 1097 1 2 1109 3 2 5 0 10 12 1084 14 5 1115 3 2 31 0 36 2270 7
08:00 2 343 0 0 345 1 0 2 0 3 4 403 4 1 412 0 3 8 0 11 771 108:15 2 425 1 0 428 3 2 3 0 8 5 338 5 0 348 2 0 8 0 10 794 008:30 1 418 1 0 420 5 0 1 0 6 4 383 8 0 395 1 0 10 0 11 832 008:45 6 360 3 2 371 4 2 6 0 12 4 410 6 3 423 1 1 8 0 10 816 5Total 11 1546 5 2 1564 13 4 12 0 29 17 1534 23 4 1578 4 4 34 0 42 3213 6
15:00 4 313 0 1 318 2 2 1 0 5 4 317 5 1 327 1 0 10 0 11 661 215:15 6 333 1 0 340 8 0 2 0 10 2 345 4 4 355 0 0 8 0 8 713 415:30 3 378 1 0 382 5 0 3 0 8 2 369 5 5 381 0 1 10 0 11 782 515:45 3 369 3 0 375 4 0 3 0 7 8 365 4 2 379 1 2 12 0 15 776 2Total 16 1393 5 1 1415 19 2 9 0 30 16 1396 18 12 1442 2 3 40 0 45 2932 13
16:00 1 354 0 0 355 2 0 1 0 3 5 380 5 0 390 2 0 6 0 8 756 016:15 1 387 1 0 389 3 1 3 0 7 5 380 5 0 390 5 0 12 0 17 803 016:30 3 368 0 0 371 10 0 0 0 10 3 434 8 6 451 0 3 15 0 18 850 616:45 2 409 0 0 411 2 2 2 0 6 2 474 7 2 485 0 1 17 0 18 920 2Total 7 1518 1 0 1526 17 3 6 0 26 15 1668 25 8 1716 7 4 50 0 61 3329 8
17:00 2 358 1 0 361 6 0 1 0 7 3 482 2 1 488 0 1 10 0 11 867 117:15 2 423 1 0 426 7 2 2 0 11 1 463 3 0 467 1 1 10 0 12 916 017:30 6 362 2 0 370 8 2 1 0 11 3 481 7 4 495 1 2 9 0 12 888 417:45 0 385 2 0 387 3 0 0 0 3 7 465 4 3 479 0 3 15 0 18 887 3Total 10 1528 6 0 1544 24 4 4 0 32 14 1891 16 8 1929 2 7 44 0 53 3558 8
Grand Total 53 7082 18 5 7158 76 15 36 0 127 74 7573 96 37 7780 18 20 199 0 237 15302 42Apprch % 0.7% 98.9% 0.3% 0.1% 59.8% 11.8% 28.3% 0.0% 1.0% 97.3% 1.2% 0.5% 7.6% 8.4% 84.0% 0.0%
Total % 0.3% 46.3% 0.1% 0.0% 46.8% 0.5% 0.1% 0.2% 0.0% 0.8% 0.5% 49.5% 0.6% 0.2% 50.8% 0.1% 0.1% 1.3% 0.0% 1.5% 100.0%
START TIME LEFT THRU RIGHT UTURNS APP.TOTAL LEFT THRU RIGHT UTURNS APP.TOTAL LEFT THRU RIGHT UTURNS APP.TOTAL LEFT THRU RIGHT UTURNS APP.TOTAL TotalPeak Hour Analysis From 08:00 to 09:00Peak Hour For Entire Intersection Begins at 08:00
08:00 2 343 0 0 345 1 0 2 0 3 4 403 4 1 412 0 3 8 0 11 77108:15 2 425 1 0 428 3 2 3 0 8 5 338 5 0 348 2 0 8 0 10 79408:30 1 418 1 0 420 5 0 1 0 6 4 383 8 0 395 1 0 10 0 11 83208:45 6 360 3 2 371 4 2 6 0 12 4 410 6 3 423 1 1 8 0 10 816
Total Volume 11 1546 5 2 1564 13 4 12 0 29 17 1534 23 4 1578 4 4 34 0 42 3213% App Total 0.7% 98.8% 0.3% 0.1% 44.8% 13.8% 41.4% 0.0% 1.1% 97.2% 1.5% 0.3% 9.5% 9.5% 81.0% 0.0%
PHF .458 .909 .417 .250 .914 .650 .500 .500 .000 .604 .850 .935 .719 .333 .933 .500 .333 .850 .000 .955 .965
START TIME LEFT THRU RIGHT UTURNS APP.TOTAL LEFT THRU RIGHT UTURNS APP.TOTAL LEFT THRU RIGHT UTURNS APP.TOTAL LEFT THRU RIGHT UTURNS APP.TOTAL TotalPeak Hour Analysis From 16:45 to 17:45Peak Hour For Entire Intersection Begins at 16:45
16:45 2 409 0 0 411 2 2 2 0 6 2 474 7 2 485 0 1 17 0 18 92017:00 2 358 1 0 361 6 0 1 0 7 3 482 2 1 488 0 1 10 0 11 86717:15 2 423 1 0 426 7 2 2 0 11 1 463 3 0 467 1 1 10 0 12 91617:30 6 362 2 0 370 8 2 1 0 11 3 481 7 4 495 1 2 9 0 12 888
Total Volume 12 1552 4 0 1568 23 6 6 0 35 9 1900 19 7 1935 2 5 46 0 53 3591% App Total 0.8% 99.0% 0.3% 0.0% 65.7% 17.1% 17.1% 0.0% 0.5% 98.2% 1.0% 0.4% 3.8% 9.4% 86.8% 0.0%
PHF .500 .917 .500 .000 .920 .719 .750 .750 .000 .795 .750 .985 .679 .438 .977 .500 .625 .676 .000 .736 .976
Martin Luther King Jr WayNorthbound
53rd StreetWestbound
Martin Luther King Jr WaySouthbound
53rd StreetWestbound
Martin Luther King Jr WaySouthbound
53rd StreetEastbound
13-7519-008 Martin Luther King Jr Way-53rd Street.ppd
Unshifted Count = All VehiclesHeavy Trucks on Bank 2
53rd StreetEastbound
9/19/2013
PM PEAK HOUR
Martin Luther King Jr WaySouthbound
53rd StreetWestbound
Martin Luther King Jr WayNorthbound
AM PEAK HOUR
53rd StreetEastbound
Martin Luther King Jr WayNorthbound
City of OaklandAll Vehicles on UnshiftedPeds & Bikes on Bank 1
(916) [email protected]

File Name :Date :
START TIME LEFT THRU RIGHT UTURNS APP.TOTAL LEFT THRU RIGHT UTURNS APP.TOTAL LEFT THRU RIGHT UTURNS APP.TOTAL LEFT THRU RIGHT UTURNS APP.TOTAL Total Uturn Total07:00 0 1 1 0 2 0 1 0 0 1 0 1 0 0 1 0 1 4 0 5 9 007:15 1 8 1 0 10 0 0 0 0 0 2 6 1 0 9 1 1 5 0 7 26 007:30 1 4 2 0 7 1 1 0 0 2 3 4 0 0 7 4 1 4 0 9 25 007:45 0 4 2 0 6 1 0 1 0 2 2 5 3 0 10 1 1 5 0 7 25 0Total 2 17 6 0 25 2 2 1 0 5 7 16 4 0 27 6 4 18 0 28 85 0
08:00 2 8 3 0 13 0 1 1 0 2 1 4 1 0 6 2 0 4 0 6 27 008:15 0 9 6 0 15 1 0 4 0 5 1 5 5 0 11 3 2 2 0 7 38 008:30 0 4 3 0 7 1 2 0 0 3 3 4 1 0 8 4 0 3 0 7 25 008:45 0 5 6 0 11 1 0 1 0 2 8 8 4 0 20 2 0 8 0 10 43 0Total 2 26 18 0 46 3 3 6 0 12 13 21 11 0 45 11 2 17 0 30 133 0
15:00 0 8 1 0 9 2 1 2 0 5 3 7 4 0 14 2 0 7 0 9 37 015:15 0 7 4 0 11 0 1 2 0 3 4 9 1 0 14 2 0 5 0 7 35 015:30 0 5 5 0 10 0 1 1 0 2 3 2 0 0 5 4 1 6 0 11 28 015:45 0 2 4 0 6 3 0 0 0 3 2 7 2 0 11 2 0 6 0 8 28 0Total 0 22 14 0 36 5 3 5 0 13 12 25 7 0 44 10 1 24 0 35 128 0
16:00 1 3 2 0 6 3 3 0 0 6 1 3 1 0 5 1 0 7 0 8 25 016:15 1 5 2 0 8 1 1 1 0 3 5 4 1 0 10 2 0 4 0 6 27 016:30 1 5 3 0 9 6 4 1 0 11 1 3 1 0 5 4 3 8 0 15 40 016:45 0 6 0 0 6 0 1 1 0 2 3 10 1 0 14 1 0 3 0 4 26 0Total 3 19 7 0 29 10 9 3 0 22 10 20 4 0 34 8 3 22 0 33 118 0
17:00 0 4 3 0 7 1 1 1 0 3 1 8 2 0 11 3 0 6 0 9 30 017:15 1 5 3 0 9 2 0 2 0 4 2 6 3 0 11 3 1 4 0 8 32 017:30 0 5 2 0 7 0 1 1 0 2 2 6 0 0 8 4 1 9 0 14 31 017:45 0 5 0 0 5 2 1 1 0 4 0 7 0 0 7 2 2 7 0 11 27 0Total 1 19 8 0 28 5 3 5 0 13 5 27 5 0 37 12 4 26 0 42 120 0
Grand Total 8 103 53 0 164 25 20 20 0 65 47 109 31 0 187 47 14 107 0 168 584 0Apprch % 4.9% 62.8% 32.3% 0.0% 38.5% 30.8% 30.8% 0.0% 25.1% 58.3% 16.6% 0.0% 28.0% 8.3% 63.7% 0.0%
Total % 1.4% 17.6% 9.1% 0.0% 28.1% 4.3% 3.4% 3.4% 0.0% 11.1% 8.0% 18.7% 5.3% 0.0% 32.0% 8.0% 2.4% 18.3% 0.0% 28.8% 100.0%
START TIME LEFT THRU RIGHT UTURNS APP.TOTAL LEFT THRU RIGHT UTURNS APP.TOTAL LEFT THRU RIGHT UTURNS APP.TOTAL LEFT THRU RIGHT UTURNS APP.TOTAL TotalPeak Hour Analysis From 08:00 to 09:00Peak Hour For Entire Intersection Begins at 08:00
08:00 2 8 3 0 13 0 1 1 0 2 1 4 1 0 6 2 0 4 0 6 2708:15 0 9 6 0 15 1 0 4 0 5 1 5 5 0 11 3 2 2 0 7 3808:30 0 4 3 0 7 1 2 0 0 3 3 4 1 0 8 4 0 3 0 7 2508:45 0 5 6 0 11 1 0 1 0 2 8 8 4 0 20 2 0 8 0 10 43
Total Volume 2 26 18 0 46 3 3 6 0 12 13 21 11 0 45 11 2 17 0 30 133% App Total 4.3% 56.5% 39.1% 0.0% 25.0% 25.0% 50.0% 0.0% 28.9% 46.7% 24.4% 0.0% 36.7% 6.7% 56.7% 0.0%
PHF .250 .722 .750 .000 .767 .750 .375 .375 .000 .600 .406 .656 .550 .000 .563 .688 .250 .531 .000 .750 .773
START TIME LEFT THRU RIGHT UTURNS APP.TOTAL LEFT THRU RIGHT UTURNS APP.TOTAL LEFT THRU RIGHT UTURNS APP.TOTAL LEFT THRU RIGHT UTURNS APP.TOTAL TotalPeak Hour Analysis From 15:00 to 16:00Peak Hour For Entire Intersection Begins at 15:00
15:00 0 8 1 0 9 2 1 2 0 5 3 7 4 0 14 2 0 7 0 9 3715:15 0 7 4 0 11 0 1 2 0 3 4 9 1 0 14 2 0 5 0 7 3515:30 0 5 5 0 10 0 1 1 0 2 3 2 0 0 5 4 1 6 0 11 2815:45 0 2 4 0 6 3 0 0 0 3 2 7 2 0 11 2 0 6 0 8 28
Total Volume 0 22 14 0 36 5 3 5 0 13 12 25 7 0 44 10 1 24 0 35 128% App Total 0.0% 61.1% 38.9% 0.0% 38.5% 23.1% 38.5% 0.0% 27.3% 56.8% 15.9% 0.0% 28.6% 2.9% 68.6% 0.0%
PHF .000 .688 .700 .000 .818 .417 .750 .625 .000 .650 .750 .694 .438 .000 .786 .625 .250 .857 .000 .795 .865
Dover StreetNorthbound
53rd StreetWestbound
Dover StreetSouthbound
53rd StreetWestbound
Dover StreetSouthbound
53rd StreetEastbound
13-7519-009 Dover Street-53rd Street.ppd
Unshifted Count = All VehiclesHeavy Trucks on Bank 2
53rd StreetEastbound
9/19/2013
PM PEAK HOUR
Dover StreetSouthbound
53rd StreetWestbound
Dover StreetNorthbound
AM PEAK HOUR
53rd StreetEastbound
Dover StreetNorthbound
City of OaklandAll Vehicles on UnshiftedPeds & Bikes on Bank 1
(916) [email protected]
File Name :Date :
START TIME LEFT THRU RIGHT UTURNS APP.TOTAL LEFT THRU RIGHT UTURNS APP.TOTAL LEFT THRU RIGHT UTURNS APP.TOTAL LEFT THRU RIGHT UTURNS APP.TOTAL Total Uturn Total07:00 8 170 0 0 178 8 7 11 0 26 6 161 24 9 200 5 5 10 0 20 424 907:15 12 254 0 1 267 14 9 10 0 33 14 241 20 11 286 6 8 14 0 28 614 1207:30 18 280 0 0 298 26 6 14 0 46 10 273 30 13 326 6 10 29 0 45 715 1307:45 18 355 0 0 373 16 11 25 0 52 12 349 30 9 400 3 16 31 0 50 875 9Total 56 1059 0 1 1116 64 33 60 0 157 42 1024 104 42 1212 20 39 84 0 143 2628 43
08:00 27 329 0 0 356 19 14 28 0 61 11 379 30 14 434 11 23 28 0 62 913 1408:15 19 403 0 0 422 11 24 35 0 70 20 297 29 9 355 7 26 28 0 61 908 908:30 31 404 0 0 435 20 20 44 0 84 14 342 33 17 406 5 17 22 0 44 969 1708:45 28 340 0 0 368 13 22 41 0 76 11 372 40 10 433 7 19 22 0 48 925 10Total 105 1476 0 0 1581 63 80 148 0 291 56 1390 132 50 1628 30 85 100 0 215 3715 50
15:00 28 315 1 1 345 29 14 27 0 70 17 304 26 17 364 6 12 18 0 36 815 1815:15 35 310 0 0 345 30 25 48 0 103 13 288 22 19 342 9 19 11 0 39 829 1915:30 25 359 0 1 385 42 19 35 0 96 14 314 17 14 359 16 21 15 0 52 892 1515:45 35 342 1 0 378 46 22 44 0 112 15 315 21 14 365 11 15 18 0 44 899 14Total 123 1326 2 2 1453 147 80 154 0 381 59 1221 86 64 1430 42 67 62 0 171 3435 66
16:00 32 335 0 0 367 33 19 41 0 93 12 324 17 9 362 4 13 20 0 37 859 916:15 34 353 0 0 387 26 19 42 0 87 11 334 10 11 366 15 29 15 0 59 899 1116:30 25 379 0 0 404 31 18 34 0 83 17 383 15 8 423 16 21 21 0 58 968 816:45 25 388 0 0 413 34 20 58 0 112 20 413 17 17 467 12 23 18 0 53 1045 17Total 116 1455 0 0 1571 124 76 175 0 375 60 1454 59 45 1618 47 86 74 0 207 3771 45
17:00 23 364 1 0 388 35 24 49 0 108 19 434 20 6 479 10 27 26 0 63 1038 617:15 46 390 0 0 436 29 24 37 0 90 21 400 22 11 454 22 38 26 0 86 1066 1117:30 49 351 0 0 400 27 16 47 0 90 14 416 32 8 470 21 30 25 0 76 1036 817:45 40 339 1 0 380 16 30 48 1 95 10 389 35 8 442 19 23 19 0 61 978 9Total 158 1444 2 0 1604 107 94 181 1 383 64 1639 109 33 1845 72 118 96 0 286 4118 34
Grand Total 558 6760 4 3 7325 505 363 718 1 1587 281 6728 490 234 7733 211 395 416 0 1022 17667 238Apprch % 7.6% 92.3% 0.1% 0.0% 31.8% 22.9% 45.2% 0.1% 3.6% 87.0% 6.3% 3.0% 20.6% 38.6% 40.7% 0.0%
Total % 3.2% 38.3% 0.0% 0.0% 41.5% 2.9% 2.1% 4.1% 0.0% 9.0% 1.6% 38.1% 2.8% 1.3% 43.8% 1.2% 2.2% 2.4% 0.0% 5.8% 100.0%
START TIME LEFT THRU RIGHT UTURNS APP.TOTAL LEFT THRU RIGHT UTURNS APP.TOTAL LEFT THRU RIGHT UTURNS APP.TOTAL LEFT THRU RIGHT UTURNS APP.TOTAL TotalPeak Hour Analysis From 08:00 to 09:00Peak Hour For Entire Intersection Begins at 08:00
08:00 27 329 0 0 356 19 14 28 0 61 11 379 30 14 434 11 23 28 0 62 91308:15 19 403 0 0 422 11 24 35 0 70 20 297 29 9 355 7 26 28 0 61 90808:30 31 404 0 0 435 20 20 44 0 84 14 342 33 17 406 5 17 22 0 44 96908:45 28 340 0 0 368 13 22 41 0 76 11 372 40 10 433 7 19 22 0 48 925
Total Volume 105 1476 0 0 1581 63 80 148 0 291 56 1390 132 50 1628 30 85 100 0 215 3715% App Total 6.6% 93.4% 0.0% 0.0% 21.6% 27.5% 50.9% 0.0% 3.4% 85.4% 8.1% 3.1% 14.0% 39.5% 46.5% 0.0%
PHF .847 .913 .000 .000 .909 .788 .833 .841 .000 .866 .700 .917 .825 .735 .938 .682 .817 .893 .000 .867 .958
START TIME LEFT THRU RIGHT UTURNS APP.TOTAL LEFT THRU RIGHT UTURNS APP.TOTAL LEFT THRU RIGHT UTURNS APP.TOTAL LEFT THRU RIGHT UTURNS APP.TOTAL TotalPeak Hour Analysis From 16:45 to 17:45Peak Hour For Entire Intersection Begins at 16:45
16:45 25 388 0 0 413 34 20 58 0 112 20 413 17 17 467 12 23 18 0 53 104517:00 23 364 1 0 388 35 24 49 0 108 19 434 20 6 479 10 27 26 0 63 103817:15 46 390 0 0 436 29 24 37 0 90 21 400 22 11 454 22 38 26 0 86 106617:30 49 351 0 0 400 27 16 47 0 90 14 416 32 8 470 21 30 25 0 76 1036
Total Volume 143 1493 1 0 1637 125 84 191 0 400 74 1663 91 42 1870 65 118 95 0 278 4185% App Total 8.7% 91.2% 0.1% 0.0% 31.3% 21.0% 47.8% 0.0% 4.0% 88.9% 4.9% 2.2% 23.4% 42.4% 34.2% 0.0%
PHF .730 .957 .250 .000 .939 .893 .875 .823 .000 .893 .881 .958 .711 .618 .976 .739 .776 .913 .000 .808 .981
Martin Luther King Jr WayNorthbound
52nd StreetWestbound
Martin Luther King Jr WaySouthbound
52nd StreetWestbound
Martin Luther King Jr WaySouthbound
52nd StreetEastbound
13-7519-010 Martin Luther King Jr Way-52nd Street.ppd
Unshifted Count = All VehiclesHeavy Trucks on Bank 2
52nd StreetEastbound
9/19/2013
PM PEAK HOUR
Martin Luther King Jr WaySouthbound
52nd StreetWestbound
Martin Luther King Jr WayNorthbound
AM PEAK HOUR
52nd StreetEastbound
Martin Luther King Jr WayNorthbound
City of OaklandAll Vehicles on UnshiftedPeds & Bikes on Bank 1
(916) [email protected]
File Name :Date :
START TIME LEFT THRU RIGHT UTURNS APP.TOTAL LEFT THRU RIGHT UTURNS APP.TOTAL LEFT THRU RIGHT UTURNS APP.TOTAL LEFT THRU RIGHT UTURNS APP.TOTAL Total Uturn Total07:00 1 0 6 0 7 1 17 11 0 29 1 0 2 0 3 19 16 1 0 36 75 007:15 3 0 5 0 8 0 25 15 0 40 2 0 2 0 4 16 25 0 0 41 93 007:30 10 0 17 0 27 1 26 14 0 41 4 1 3 0 8 20 37 0 0 57 133 007:45 4 0 7 0 11 1 43 19 0 63 1 1 1 0 3 24 41 0 0 65 142 0Total 18 0 35 0 53 3 111 59 0 173 8 2 8 0 18 79 119 1 0 199 443 0
08:00 6 1 6 0 13 0 52 18 0 70 4 1 2 0 7 22 56 2 0 80 170 008:15 2 1 4 0 7 1 66 27 0 94 2 2 2 0 6 25 49 1 0 75 182 008:30 2 0 1 0 3 3 76 17 0 96 4 1 3 0 8 31 48 1 0 80 187 008:45 3 0 2 0 5 2 71 20 0 93 5 3 3 0 11 34 49 4 0 87 196 0Total 13 2 13 0 28 6 265 82 0 353 15 7 10 0 32 112 202 8 0 322 735 0
15:00 15 0 14 0 29 3 54 10 0 67 4 2 5 0 11 12 53 1 0 66 173 015:15 12 0 26 0 38 3 69 4 0 76 6 2 3 0 11 9 62 3 0 74 199 015:30 6 0 31 0 37 1 54 5 0 60 12 1 1 0 14 12 50 6 0 68 179 015:45 10 0 32 0 42 6 71 7 0 84 8 3 2 0 13 5 64 2 0 71 210 0Total 43 0 103 0 146 13 248 26 0 287 30 8 11 0 49 38 229 12 0 279 761 0
16:00 15 0 21 0 36 0 71 4 0 75 3 2 3 0 8 2 55 5 0 62 181 016:15 14 0 17 0 31 2 63 1 0 66 4 3 2 0 9 2 66 2 0 70 176 016:30 15 0 21 0 36 1 63 4 0 68 4 0 0 0 4 5 57 0 0 62 170 016:45 17 1 18 0 36 1 88 4 0 93 5 0 1 0 6 4 60 1 0 65 200 0Total 61 1 77 0 139 4 285 13 0 302 16 5 6 0 27 13 238 8 0 259 727 0
17:00 17 0 22 0 39 3 85 3 0 91 4 2 3 0 9 5 65 0 0 70 209 017:15 14 2 18 0 34 3 62 5 0 70 9 1 3 0 13 1 102 2 0 105 222 017:30 15 1 15 0 31 4 73 5 0 82 7 0 6 0 13 7 106 2 0 115 241 017:45 14 1 9 0 24 1 77 4 0 82 6 1 2 0 9 9 83 3 0 95 210 0Total 60 4 64 0 128 11 297 17 0 325 26 4 14 0 44 22 356 7 0 385 882 0
Grand Total 195 7 292 0 494 37 1206 197 0 1440 95 26 49 0 170 264 1144 36 0 1444 3548 0Apprch % 39.5% 1.4% 59.1% 0.0% 2.6% 83.8% 13.7% 0.0% 55.9% 15.3% 28.8% 0.0% 18.3% 79.2% 2.5% 0.0%
Total % 5.5% 0.2% 8.2% 0.0% 13.9% 1.0% 34.0% 5.6% 0.0% 40.6% 2.7% 0.7% 1.4% 0.0% 4.8% 7.4% 32.2% 1.0% 0.0% 40.7% 100.0%
START TIME LEFT THRU RIGHT UTURNS APP.TOTAL LEFT THRU RIGHT UTURNS APP.TOTAL LEFT THRU RIGHT UTURNS APP.TOTAL LEFT THRU RIGHT UTURNS APP.TOTAL TotalPeak Hour Analysis From 08:00 to 09:00Peak Hour For Entire Intersection Begins at 08:00
08:00 6 1 6 0 13 0 52 18 0 70 4 1 2 0 7 22 56 2 0 80 17008:15 2 1 4 0 7 1 66 27 0 94 2 2 2 0 6 25 49 1 0 75 18208:30 2 0 1 0 3 3 76 17 0 96 4 1 3 0 8 31 48 1 0 80 18708:45 3 0 2 0 5 2 71 20 0 93 5 3 3 0 11 34 49 4 0 87 196
Total Volume 13 2 13 0 28 6 265 82 0 353 15 7 10 0 32 112 202 8 0 322 735% App Total 46.4% 7.1% 46.4% 0.0% 1.7% 75.1% 23.2% 0.0% 46.9% 21.9% 31.3% 0.0% 34.8% 62.7% 2.5% 0.0%
PHF .542 .500 .542 .000 .538 .500 .872 .759 .000 .919 .750 .583 .833 .000 .727 .824 .902 .500 .000 .925 .938
START TIME LEFT THRU RIGHT UTURNS APP.TOTAL LEFT THRU RIGHT UTURNS APP.TOTAL LEFT THRU RIGHT UTURNS APP.TOTAL LEFT THRU RIGHT UTURNS APP.TOTAL TotalPeak Hour Analysis From 17:00 to 18:00Peak Hour For Entire Intersection Begins at 17:00
17:00 17 0 22 0 39 3 85 3 0 91 4 2 3 0 9 5 65 0 0 70 20917:15 14 2 18 0 34 3 62 5 0 70 9 1 3 0 13 1 102 2 0 105 22217:30 15 1 15 0 31 4 73 5 0 82 7 0 6 0 13 7 106 2 0 115 24117:45 14 1 9 0 24 1 77 4 0 82 6 1 2 0 9 9 83 3 0 95 210
Total Volume 60 4 64 0 128 11 297 17 0 325 26 4 14 0 44 22 356 7 0 385 882% App Total 46.9% 3.1% 50.0% 0.0% 3.4% 91.4% 5.2% 0.0% 59.1% 9.1% 31.8% 0.0% 5.7% 92.5% 1.8% 0.0%
PHF .882 .500 .727 .000 .821 .688 .874 .850 .000 .893 .722 .500 .583 .000 .846 .611 .840 .583 .000 .837 .915
CHRCO Garage DrivewaysNorthbound
52nd StreetWestbound
CHRCO Garage DrivewaysSouthbound
52nd StreetWestbound
CHRCO Garage DrivewaysSouthbound
52nd StreetEastbound
13-7519-011 CHRCO Garage Driveways-52nd Street.ppd
Unshifted Count = All VehiclesHeavy Trucks on Bank 2
52nd StreetEastbound
9/19/2013
PM PEAK HOUR
CHRCO Garage DrivewaysSouthbound
52nd StreetWestbound
CHRCO Garage DrivewaysNorthbound
AM PEAK HOUR
52nd StreetEastbound
CHRCO Garage DrivewaysNorthbound
City of OaklandAll Vehicles on UnshiftedPeds & Bikes on Bank 1
(916) [email protected]
File Name :Date :
START TIME LEFT THRU RIGHT UTURNS APP.TOTAL LEFT THRU RIGHT UTURNS APP.TOTAL LEFT THRU RIGHT UTURNS APP.TOTAL LEFT THRU RIGHT UTURNS APP.TOTAL Total Uturn Total07:00 3 0 2 0 5 0 24 4 0 28 1 0 1 0 2 2 18 2 0 22 57 007:15 4 1 4 0 9 5 40 0 0 45 0 0 0 0 0 5 30 0 0 35 89 007:30 3 0 8 0 11 3 31 4 0 38 0 1 0 0 1 10 35 2 0 47 97 007:45 4 1 6 0 11 3 58 5 0 66 1 0 0 0 1 2 45 1 0 48 126 0Total 14 2 20 0 36 11 153 13 0 177 2 1 1 0 4 19 128 5 0 152 369 0
08:00 5 0 10 0 15 4 59 7 0 70 1 0 3 0 4 4 58 0 0 62 151 008:15 9 1 4 0 14 3 95 6 0 104 0 0 1 0 1 1 53 0 0 54 173 008:30 12 2 4 0 18 1 86 5 0 92 1 0 2 0 3 9 40 1 0 50 163 008:45 4 0 5 0 9 3 84 9 0 96 1 0 1 0 2 5 51 0 0 56 163 0Total 30 3 23 0 56 11 324 27 0 362 3 0 7 0 10 19 202 1 0 222 650 0
15:00 6 0 10 0 16 1 58 8 1 68 0 1 1 0 2 7 61 2 0 70 156 115:15 6 2 4 0 12 1 74 2 0 77 0 0 1 0 1 9 70 1 0 80 170 015:30 3 1 5 0 9 0 52 3 1 56 2 0 2 0 4 5 53 2 0 60 129 115:45 6 0 7 0 13 5 79 3 2 89 1 0 2 0 3 4 70 2 0 76 181 2Total 21 3 26 0 50 7 263 16 4 290 3 1 6 0 10 25 254 7 0 286 636 4
16:00 9 0 7 0 16 1 65 4 0 70 1 0 2 0 3 6 68 0 0 74 163 016:15 5 0 4 0 9 1 60 4 0 65 0 0 2 0 2 3 76 0 1 80 156 116:30 12 0 3 0 15 2 68 3 0 73 2 0 4 0 6 2 71 1 2 76 170 216:45 7 0 2 0 9 2 87 8 0 97 0 0 3 0 3 5 70 3 0 78 187 0Total 33 0 16 0 49 6 280 19 0 305 3 0 11 0 14 16 285 4 3 308 676 3
17:00 10 1 3 0 14 2 85 3 0 90 2 2 3 0 7 7 80 0 0 87 198 017:15 6 0 5 0 11 0 66 11 1 78 1 0 2 0 3 2 115 0 1 118 210 217:30 13 0 3 0 16 1 88 4 0 93 2 0 0 0 2 4 117 4 0 125 236 017:45 14 0 2 0 16 0 70 4 0 74 1 0 3 0 4 4 96 0 0 100 194 0Total 43 1 13 0 57 3 309 22 1 335 6 2 8 0 16 17 408 4 1 430 838 2
Grand Total 141 9 98 0 248 38 1329 97 5 1469 17 4 33 0 54 96 1277 21 4 1398 3169 9Apprch % 56.9% 3.6% 39.5% 0.0% 2.6% 90.5% 6.6% 0.3% 31.5% 7.4% 61.1% 0.0% 6.9% 91.3% 1.5% 0.3%
Total % 4.4% 0.3% 3.1% 0.0% 7.8% 1.2% 41.9% 3.1% 0.2% 46.4% 0.5% 0.1% 1.0% 0.0% 1.7% 3.0% 40.3% 0.7% 0.1% 44.1% 100.0%
START TIME LEFT THRU RIGHT UTURNS APP.TOTAL LEFT THRU RIGHT UTURNS APP.TOTAL LEFT THRU RIGHT UTURNS APP.TOTAL LEFT THRU RIGHT UTURNS APP.TOTAL TotalPeak Hour Analysis From 08:00 to 09:00Peak Hour For Entire Intersection Begins at 08:00
08:00 5 0 10 0 15 4 59 7 0 70 1 0 3 0 4 4 58 0 0 62 15108:15 9 1 4 0 14 3 95 6 0 104 0 0 1 0 1 1 53 0 0 54 17308:30 12 2 4 0 18 1 86 5 0 92 1 0 2 0 3 9 40 1 0 50 16308:45 4 0 5 0 9 3 84 9 0 96 1 0 1 0 2 5 51 0 0 56 163
Total Volume 30 3 23 0 56 11 324 27 0 362 3 0 7 0 10 19 202 1 0 222 650% App Total 53.6% 5.4% 41.1% 0.0% 3.0% 89.5% 7.5% 0.0% 30.0% 0.0% 70.0% 0.0% 8.6% 91.0% 0.5% 0.0%
PHF .625 .375 .575 .000 .778 .688 .853 .750 .000 .870 .750 .000 .583 .000 .625 .528 .871 .250 .000 .895 .939
START TIME LEFT THRU RIGHT UTURNS APP.TOTAL LEFT THRU RIGHT UTURNS APP.TOTAL LEFT THRU RIGHT UTURNS APP.TOTAL LEFT THRU RIGHT UTURNS APP.TOTAL TotalPeak Hour Analysis From 17:00 to 18:00Peak Hour For Entire Intersection Begins at 17:00
17:00 10 1 3 0 14 2 85 3 0 90 2 2 3 0 7 7 80 0 0 87 19817:15 6 0 5 0 11 0 66 11 1 78 1 0 2 0 3 2 115 0 1 118 21017:30 13 0 3 0 16 1 88 4 0 93 2 0 0 0 2 4 117 4 0 125 23617:45 14 0 2 0 16 0 70 4 0 74 1 0 3 0 4 4 96 0 0 100 194
Total Volume 43 1 13 0 57 3 309 22 1 335 6 2 8 0 16 17 408 4 1 430 838% App Total 75.4% 1.8% 22.8% 0.0% 0.9% 92.2% 6.6% 0.3% 37.5% 12.5% 50.0% 0.0% 4.0% 94.9% 0.9% 0.2%
PHF .768 .250 .650 .000 .891 .375 .878 .500 .250 .901 .750 .250 .667 .000 .571 .607 .872 .250 .250 .860 .888
Hospital DrivewayNorthbound
52nd StreetWestbound
Dover StreetSouthbound
52nd StreetWestbound
Dover StreetSouthbound
52nd StreetEastbound
13-7519-012 Dover Street-52nd Street.ppd
Unshifted Count = All VehiclesHeavy Trucks on Bank 2
52nd StreetEastbound
9/19/2013
PM PEAK HOUR
Dover StreetSouthbound
52nd StreetWestbound
Hospital DrivewayNorthbound
AM PEAK HOUR
52nd StreetEastbound
Hospital DrivewayNorthbound
City of OaklandAll Vehicles on UnshiftedPeds & Bikes on Bank 1
(916) [email protected]
File Name :Date :
START TIME LEFT THRU RIGHT UTURNS APP.TOTAL LEFT THRU RIGHT UTURNS APP.TOTAL LEFT THRU RIGHT UTURNS APP.TOTAL LEFT THRU RIGHT UTURNS APP.TOTAL Total Uturn Total07:00 0 0 0 0 0 0 33 140 0 173 0 0 121 0 121 0 18 0 0 18 312 007:15 0 0 0 0 0 0 43 138 0 181 0 0 174 0 174 0 33 0 0 33 388 007:30 0 0 0 0 0 0 47 174 0 221 0 0 202 0 202 0 48 0 0 48 471 007:45 0 0 0 0 0 0 58 245 0 303 0 0 209 0 209 0 41 0 0 41 553 0Total 0 0 0 0 0 0 181 697 0 878 0 0 706 0 706 0 140 0 0 140 1724 0
08:00 0 0 0 0 0 0 77 252 0 329 0 0 231 0 231 0 68 0 0 68 628 008:15 0 0 0 0 0 0 103 301 0 404 0 0 239 0 239 0 61 0 0 61 704 008:30 0 0 0 0 0 0 101 272 0 373 0 0 210 0 210 0 48 0 0 48 631 008:45 0 0 0 0 0 0 85 251 0 336 0 0 218 0 218 0 54 0 0 54 608 0Total 0 0 0 0 0 0 366 1076 0 1442 0 0 898 0 898 0 231 0 0 231 2571 0
15:00 0 0 0 0 0 0 58 252 0 310 0 0 218 0 218 0 64 0 0 64 592 015:15 0 0 0 0 0 0 82 256 0 338 0 0 236 0 236 0 79 0 0 79 653 015:30 0 0 0 0 0 0 63 264 0 327 0 0 243 0 243 0 60 0 0 60 630 015:45 0 0 0 0 0 0 74 270 0 344 0 0 249 0 249 0 76 0 0 76 669 0Total 0 0 0 0 0 0 277 1042 0 1319 0 0 946 0 946 0 279 0 0 279 2544 0
16:00 0 0 0 0 0 0 65 226 0 291 0 0 191 0 191 0 80 0 0 80 562 016:15 0 0 0 0 0 0 76 243 0 319 0 0 168 0 168 0 82 0 0 82 569 016:30 0 0 0 0 0 0 71 219 0 290 0 0 244 0 244 0 89 0 0 89 623 016:45 0 0 0 0 0 0 97 259 0 356 0 0 269 0 269 0 80 0 0 80 705 0Total 0 0 0 0 0 0 309 947 0 1256 0 0 872 0 872 0 331 0 0 331 2459 0
17:00 0 0 0 0 0 0 98 262 0 360 0 0 266 0 266 0 95 0 0 95 721 017:15 0 0 0 0 0 0 69 259 0 328 0 0 256 0 256 0 122 0 0 122 706 017:30 0 0 0 0 0 0 100 216 0 316 0 0 233 0 233 0 126 0 0 126 675 017:45 0 0 0 0 0 0 68 224 0 292 0 0 273 0 273 0 115 0 0 115 680 0Total 0 0 0 0 0 0 335 961 0 1296 0 0 1028 0 1028 0 458 0 0 458 2782 0
Grand Total 0 0 0 0 0 0 1468 4723 0 6191 0 0 4450 0 4450 0 1439 0 0 1439 12080 0Apprch % 0.0% 0.0% 0.0% 0.0% 0.0% 23.7% 76.3% 0.0% 0.0% 0.0% 100.0% 0.0% 0.0% 100.0% 0.0% 0.0%
Total % 0.0% 0.0% 0.0% 0.0% 0.0% 0.0% 12.2% 39.1% 0.0% 51.3% 0.0% 0.0% 36.8% 0.0% 36.8% 0.0% 11.9% 0.0% 0.0% 11.9% 100.0%
START TIME LEFT THRU RIGHT UTURNS APP.TOTAL LEFT THRU RIGHT UTURNS APP.TOTAL LEFT THRU RIGHT UTURNS APP.TOTAL LEFT THRU RIGHT UTURNS APP.TOTAL TotalPeak Hour Analysis From 08:00 to 09:00Peak Hour For Entire Intersection Begins at 08:00
08:00 0 0 0 0 0 0 77 252 0 329 0 0 231 0 231 0 68 0 0 68 62808:15 0 0 0 0 0 0 103 301 0 404 0 0 239 0 239 0 61 0 0 61 70408:30 0 0 0 0 0 0 101 272 0 373 0 0 210 0 210 0 48 0 0 48 63108:45 0 0 0 0 0 0 85 251 0 336 0 0 218 0 218 0 54 0 0 54 608
Total Volume 0 0 0 0 0 0 366 1076 0 1442 0 0 898 0 898 0 231 0 0 231 2571% App Total 0.0% 0.0% 0.0% 0.0% 0.0% 25.4% 74.6% 0.0% 0.0% 0.0% 100.0% 0.0% 0.0% 100.0% 0.0% 0.0%
PHF .000 .000 .000 .000 .000 .000 .888 .894 .000 .892 .000 .000 .939 .000 .939 .000 .849 .000 .000 .849 .913
START TIME LEFT THRU RIGHT UTURNS APP.TOTAL LEFT THRU RIGHT UTURNS APP.TOTAL LEFT THRU RIGHT UTURNS APP.TOTAL LEFT THRU RIGHT UTURNS APP.TOTAL TotalPeak Hour Analysis From 16:45 to 17:45Peak Hour For Entire Intersection Begins at 16:45
16:45 0 0 0 0 0 0 97 259 0 356 0 0 269 0 269 0 80 0 0 80 70517:00 0 0 0 0 0 0 98 262 0 360 0 0 266 0 266 0 95 0 0 95 72117:15 0 0 0 0 0 0 69 259 0 328 0 0 256 0 256 0 122 0 0 122 70617:30 0 0 0 0 0 0 100 216 0 316 0 0 233 0 233 0 126 0 0 126 675
Total Volume 0 0 0 0 0 0 364 996 0 1360 0 0 1024 0 1024 0 423 0 0 423 2807% App Total 0.0% 0.0% 0.0% 0.0% 0.0% 26.8% 73.2% 0.0% 0.0% 0.0% 100.0% 0.0% 0.0% 100.0% 0.0% 0.0%
PHF .000 .000 .000 .000 .000 .000 .910 .950 .000 .944 .000 .000 .952 .000 .952 .000 .839 .000 .000 .839 .973
SR-24 RampsNorthbound
52nd StreetWestbound
SR-24 RampsSouthbound
52nd StreetWestbound
SR-24 RampsSouthbound
52nd StreetEastbound
13-7519-013 SR-24 Ramps-52nd Street.ppd
Unshifted Count = All VehiclesHeavy Trucks on Bank 2
52nd StreetEastbound
9/19/2013
PM PEAK HOUR
SR-24 RampsSouthbound
52nd StreetWestbound
SR-24 RampsNorthbound
AM PEAK HOUR
52nd StreetEastbound
SR-24 RampsNorthbound
City of OaklandAll Vehicles on UnshiftedPeds & Bikes on Bank 1
(916) [email protected]
File Name :Date :
START TIME LEFT THRU RIGHT UTURNS APP.TOTAL LEFT THRU RIGHT UTURNS APP.TOTAL LEFT THRU RIGHT UTURNS APP.TOTAL LEFT THRU RIGHT UTURNS APP.TOTAL Total Uturn Total07:00 2 12 50 0 64 4 95 11 0 110 20 15 2 0 37 33 65 26 5 129 340 507:15 11 19 48 0 78 3 104 7 0 114 23 22 3 0 48 44 113 28 3 188 428 307:30 15 31 71 0 117 1 123 10 0 134 27 16 7 0 50 66 116 42 7 231 532 707:45 17 31 92 0 140 9 155 20 0 184 30 21 7 0 58 65 151 32 6 254 636 6Total 45 93 261 0 399 17 477 48 0 542 100 74 19 0 193 208 445 128 21 802 1936 21
08:00 13 25 94 0 132 5 195 17 1 218 32 34 5 0 71 64 202 38 10 314 735 1108:15 29 36 98 0 163 6 235 15 1 257 41 26 9 0 76 71 191 37 12 311 807 1308:30 32 36 91 0 159 4 239 20 1 264 43 37 11 0 91 67 144 35 10 256 770 1108:45 22 39 93 0 154 6 197 30 0 233 38 26 5 0 69 83 154 38 8 283 739 8Total 96 136 376 0 608 21 866 82 3 972 154 123 30 0 307 285 691 148 40 1164 3051 43
15:00 20 34 99 0 153 3 167 5 0 175 48 40 10 0 98 63 162 45 6 276 702 615:15 29 31 75 0 135 9 202 25 0 236 45 37 12 0 94 68 194 51 8 321 786 815:30 23 40 88 0 151 6 188 23 0 217 41 46 16 0 103 88 180 44 7 319 790 715:45 35 42 92 0 169 6 207 17 0 230 51 43 11 0 105 70 196 43 10 319 823 10Total 107 147 354 0 608 24 764 70 0 858 185 166 49 0 400 289 732 183 31 1235 3101 31
16:00 15 38 73 0 126 10 165 23 2 200 39 40 10 0 89 58 149 40 7 254 669 916:15 19 25 93 0 137 7 182 22 1 212 27 36 11 0 74 55 159 37 12 263 686 1316:30 22 36 84 0 142 8 167 27 1 203 45 37 8 0 90 75 199 42 6 322 757 716:45 26 31 90 0 147 8 217 30 3 258 46 48 9 0 103 78 223 54 10 365 873 13Total 82 130 340 0 552 33 731 102 7 873 157 161 38 0 356 266 730 173 35 1204 2985 42
17:00 33 37 81 0 151 11 220 30 4 265 37 44 13 0 94 76 203 49 13 341 851 1717:15 35 40 88 0 163 4 195 32 0 231 42 64 7 0 113 76 235 41 8 360 867 817:30 46 35 87 0 168 12 197 37 1 247 21 51 11 0 83 72 252 28 9 361 859 1017:45 31 34 79 0 144 12 158 29 0 199 31 46 13 0 90 78 260 46 13 397 830 13Total 145 146 335 0 626 39 770 128 5 942 131 205 44 0 380 302 950 164 43 1459 3407 48
Grand Total 475 652 1666 0 2793 134 3608 430 15 4187 727 729 180 0 1636 1350 3548 796 170 5864 14480 185Apprch % 17.0% 23.3% 59.6% 0.0% 3.2% 86.2% 10.3% 0.4% 44.4% 44.6% 11.0% 0.0% 23.0% 60.5% 13.6% 2.9%
Total % 3.3% 4.5% 11.5% 0.0% 19.3% 0.9% 24.9% 3.0% 0.1% 28.9% 5.0% 5.0% 1.2% 0.0% 11.3% 9.3% 24.5% 5.5% 1.2% 40.5% 100.0%
START TIME LEFT THRU RIGHT UTURNS APP.TOTAL LEFT THRU RIGHT UTURNS APP.TOTAL LEFT THRU RIGHT UTURNS APP.TOTAL LEFT THRU RIGHT UTURNS APP.TOTAL TotalPeak Hour Analysis From 08:00 to 09:00Peak Hour For Entire Intersection Begins at 08:00
08:00 13 25 94 0 132 5 195 17 1 218 32 34 5 0 71 64 202 38 10 314 73508:15 29 36 98 0 163 6 235 15 1 257 41 26 9 0 76 71 191 37 12 311 80708:30 32 36 91 0 159 4 239 20 1 264 43 37 11 0 91 67 144 35 10 256 77008:45 22 39 93 0 154 6 197 30 0 233 38 26 5 0 69 83 154 38 8 283 739
Total Volume 96 136 376 0 608 21 866 82 3 972 154 123 30 0 307 285 691 148 40 1164 3051% App Total 15.8% 22.4% 61.8% 0.0% 2.2% 89.1% 8.4% 0.3% 50.2% 40.1% 9.8% 0.0% 24.5% 59.4% 12.7% 3.4%
PHF .750 .872 .959 .000 .933 .875 .906 .683 .750 .920 .895 .831 .682 .000 .843 .858 .855 .974 .833 .927 .945
START TIME LEFT THRU RIGHT UTURNS APP.TOTAL LEFT THRU RIGHT UTURNS APP.TOTAL LEFT THRU RIGHT UTURNS APP.TOTAL LEFT THRU RIGHT UTURNS APP.TOTAL TotalPeak Hour Analysis From 16:45 to 17:45Peak Hour For Entire Intersection Begins at 16:45
16:45 26 31 90 0 147 8 217 30 3 258 46 48 9 0 103 78 223 54 10 365 87317:00 33 37 81 0 151 11 220 30 4 265 37 44 13 0 94 76 203 49 13 341 85117:15 35 40 88 0 163 4 195 32 0 231 42 64 7 0 113 76 235 41 8 360 86717:30 46 35 87 0 168 12 197 37 1 247 21 51 11 0 83 72 252 28 9 361 859
Total Volume 140 143 346 0 629 35 829 129 8 1001 146 207 40 0 393 302 913 172 40 1427 3450% App Total 22.3% 22.7% 55.0% 0.0% 3.5% 82.8% 12.9% 0.8% 37.2% 52.7% 10.2% 0.0% 21.2% 64.0% 12.1% 2.8%
PHF .761 .894 .961 .000 .936 .729 .942 .872 .500 .944 .793 .809 .769 .000 .869 .968 .906 .796 .769 .977 .988
Shattuck AvenueNorthbound
52nd StreetWestbound
Shattuck AvenueSouthbound
52nd StreetWestbound
Shattuck AvenueSouthbound
52nd StreetEastbound
13-7519-014 Shattuck Avenue-52nd Street.ppd
Unshifted Count = All VehiclesHeavy Trucks on Bank 2
52nd StreetEastbound
9/19/2013
PM PEAK HOUR
Shattuck AvenueSouthbound
52nd StreetWestbound
Shattuck AvenueNorthbound
AM PEAK HOUR
52nd StreetEastbound
Shattuck AvenueNorthbound
City of OaklandAll Vehicles on UnshiftedPeds & Bikes on Bank 1
(916) [email protected]

File Name :Date :
START TIME LEFT THRU RIGHT UTURNS APP.TOTAL LEFT THRU RIGHT UTURNS APP.TOTAL LEFT THRU RIGHT UTURNS APP.TOTAL LEFT THRU RIGHT UTURNS APP.TOTAL Total Uturn Total07:00 6 65 32 0 103 7 3 10 0 20 0 70 9 0 79 0 0 0 0 0 202 007:15 9 71 34 0 114 18 7 20 0 45 0 100 17 0 117 0 0 0 0 0 276 007:30 12 94 50 0 156 15 9 15 0 39 0 122 29 0 151 5 0 0 0 5 351 007:45 14 106 50 0 170 14 6 33 0 53 0 143 33 0 176 1 2 0 0 3 402 0Total 41 336 166 0 543 54 25 78 0 157 0 435 88 0 523 6 2 0 0 8 1231 0
08:00 10 126 59 0 195 17 14 41 0 72 0 162 28 0 190 1 0 3 0 4 461 008:15 9 157 77 0 243 26 12 31 0 69 0 174 35 0 209 0 0 0 0 0 521 008:30 20 157 57 0 234 19 15 35 0 69 0 153 24 0 177 1 0 3 0 4 484 008:45 25 158 76 0 259 32 11 47 0 90 0 176 30 0 206 4 0 0 0 4 559 0Total 64 598 269 0 931 94 52 154 0 300 0 665 117 0 782 6 0 6 0 12 2025 0
15:00 13 150 56 0 219 19 15 22 0 56 5 174 36 0 215 4 1 9 0 14 504 015:15 13 154 70 0 237 19 12 25 0 56 4 189 24 0 217 1 2 3 0 6 516 015:30 15 131 49 0 195 18 12 34 0 64 3 196 38 0 237 3 1 3 0 7 503 015:45 19 141 53 0 213 20 22 22 0 64 2 202 40 0 244 3 0 4 0 7 528 0Total 60 576 228 0 864 76 61 103 0 240 14 761 138 0 913 11 4 19 0 34 2051 0
16:00 27 129 57 0 213 19 12 38 0 69 2 177 27 0 206 1 0 3 0 4 492 016:15 18 136 60 0 214 21 9 36 0 66 3 205 32 0 240 1 0 3 0 4 524 016:30 17 161 61 0 239 16 24 28 0 68 3 194 37 0 234 1 2 5 0 8 549 016:45 20 120 64 0 204 32 19 43 0 94 6 228 55 0 289 2 2 3 0 7 594 0Total 82 546 242 0 870 88 64 145 0 297 14 804 151 0 969 5 4 14 0 23 2159 0
17:00 28 160 81 0 269 27 20 36 0 83 1 211 47 0 259 6 1 6 0 13 624 017:15 27 182 81 0 290 23 16 35 0 74 5 232 64 0 301 3 2 0 0 5 670 017:30 26 204 54 0 284 17 17 43 0 77 2 214 58 0 274 2 2 4 0 8 643 017:45 26 175 77 0 278 21 10 41 0 72 0 215 75 0 290 2 1 11 0 14 654 0Total 107 721 293 0 1121 88 63 155 0 306 8 872 244 0 1124 13 6 21 0 40 2591 0
Grand Total 354 2777 1198 0 4329 400 265 635 0 1300 36 3537 738 0 4311 41 16 60 0 117 10057 0Apprch % 8.2% 64.1% 27.7% 0.0% 30.8% 20.4% 48.8% 0.0% 0.8% 82.0% 17.1% 0.0% 35.0% 13.7% 51.3% 0.0%
Total % 3.5% 27.6% 11.9% 0.0% 43.0% 4.0% 2.6% 6.3% 0.0% 12.9% 0.4% 35.2% 7.3% 0.0% 42.9% 0.4% 0.2% 0.6% 0.0% 1.2% 100.0%
START TIME LEFT THRU RIGHT UTURNS APP.TOTAL LEFT THRU RIGHT UTURNS APP.TOTAL LEFT THRU RIGHT UTURNS APP.TOTAL LEFT THRU RIGHT UTURNS APP.TOTAL TotalPeak Hour Analysis From 08:00 to 09:00Peak Hour For Entire Intersection Begins at 08:00
08:00 10 126 59 0 195 17 14 41 0 72 0 162 28 0 190 1 0 3 0 4 46108:15 9 157 77 0 243 26 12 31 0 69 0 174 35 0 209 0 0 0 0 0 52108:30 20 157 57 0 234 19 15 35 0 69 0 153 24 0 177 1 0 3 0 4 48408:45 25 158 76 0 259 32 11 47 0 90 0 176 30 0 206 4 0 0 0 4 559
Total Volume 64 598 269 0 931 94 52 154 0 300 0 665 117 0 782 6 0 6 0 12 2025% App Total 6.9% 64.2% 28.9% 0.0% 31.3% 17.3% 51.3% 0.0% 0.0% 85.0% 15.0% 0.0% 50.0% 0.0% 50.0% 0.0%
PHF .640 .946 .873 .000 .899 .734 .867 .819 .000 .833 .000 .945 .836 .000 .935 .375 .000 .500 .000 .750 .906
START TIME LEFT THRU RIGHT UTURNS APP.TOTAL LEFT THRU RIGHT UTURNS APP.TOTAL LEFT THRU RIGHT UTURNS APP.TOTAL LEFT THRU RIGHT UTURNS APP.TOTAL TotalPeak Hour Analysis From 17:00 to 18:00Peak Hour For Entire Intersection Begins at 17:00
17:00 28 160 81 0 269 27 20 36 0 83 1 211 47 0 259 6 1 6 0 13 62417:15 27 182 81 0 290 23 16 35 0 74 5 232 64 0 301 3 2 0 0 5 67017:30 26 204 54 0 284 17 17 43 0 77 2 214 58 0 274 2 2 4 0 8 64317:45 26 175 77 0 278 21 10 41 0 72 0 215 75 0 290 2 1 11 0 14 654
Total Volume 107 721 293 0 1121 88 63 155 0 306 8 872 244 0 1124 13 6 21 0 40 2591% App Total 9.5% 64.3% 26.1% 0.0% 28.8% 20.6% 50.7% 0.0% 0.7% 77.6% 21.7% 0.0% 32.5% 15.0% 52.5% 0.0%
PHF .955 .884 .904 .000 .966 .815 .788 .901 .000 .922 .400 .940 .813 .000 .934 .542 .750 .477 .000 .714 .967
Telegraph AvenueNorthbound
Claremont AvenueWestbound
Telegraph AvenueSouthbound
Claremont AvenueWestbound
Telegraph AvenueSouthbound
52nd StreetEastbound
C:\Users\Sac - 3\Desktop\NDS\ITMs\13-7519 Oakland\raw\13
Unshifted Count = All VehiclesHeavy Trucks on Bank 2
52nd StreetEastbound
9/19/2013
PM PEAK HOUR
Telegraph AvenueSouthbound
Claremont AvenueWestbound
Telegraph AvenueNorthbound
AM PEAK HOUR
52nd StreetEastbound
Telegraph AvenueNorthbound
City of OaklandAll Vehicles on UnshiftedPeds & Bikes on Bank 1
(916) [email protected]
File Name :Date :
START TIME LEFT THRU RIGHT UTURNS APP.TOTAL LEFT THRU RIGHT UTURNS APP.TOTAL LEFT THRU RIGHT UTURNS APP.TOTAL LEFT THRU RIGHT UTURNS APP.TOTAL Total Uturn Total07:00 8 48 3 0 59 4 47 20 0 71 9 46 7 0 62 22 38 8 0 68 260 007:15 18 64 1 0 83 11 64 28 0 103 9 44 7 0 60 38 59 11 0 108 354 007:30 15 83 2 0 100 9 75 32 0 116 13 69 8 0 90 54 65 8 0 127 433 007:45 31 95 4 0 130 9 115 47 0 171 12 63 13 0 88 63 109 11 0 183 572 0Total 72 290 10 0 372 33 301 127 0 461 43 222 35 0 300 177 271 38 0 486 1619 0
08:00 36 100 7 0 143 20 127 53 0 200 20 84 12 0 116 59 129 23 0 211 670 008:15 38 136 11 1 186 22 136 66 2 226 25 86 17 0 128 57 151 15 0 223 763 308:30 39 125 12 0 176 35 141 58 0 234 28 80 14 0 122 46 118 16 0 180 712 008:45 33 150 8 0 191 22 126 61 0 209 17 70 15 0 102 66 90 14 0 170 672 0Total 146 511 38 1 696 99 530 238 2 869 90 320 58 0 468 228 488 68 0 784 2817 3
15:00 45 129 15 0 189 27 69 46 1 143 23 101 30 0 154 74 100 23 0 197 683 115:15 47 109 9 0 165 19 104 57 0 180 24 94 25 0 143 60 130 30 0 220 708 015:30 53 91 11 1 156 24 109 33 0 166 24 116 26 0 166 77 122 27 0 226 714 115:45 45 94 12 0 151 24 115 45 0 184 16 121 22 0 159 72 125 28 0 225 719 0Total 190 423 47 1 661 94 397 181 1 673 87 432 103 0 622 283 477 108 0 868 2824 2
16:00 53 101 9 0 163 17 110 43 0 170 16 127 14 0 157 50 91 20 0 161 651 016:15 46 104 11 0 161 16 102 44 0 162 24 126 21 0 171 67 112 18 0 197 691 016:30 50 112 12 0 174 13 87 40 0 140 16 107 18 0 141 71 100 20 0 191 646 016:45 47 104 10 0 161 15 128 68 1 212 27 129 23 0 179 93 148 23 0 264 816 1Total 196 421 42 0 659 61 427 195 1 684 83 489 76 0 648 281 451 81 0 813 2804 1
17:00 61 110 17 0 188 11 114 53 0 178 23 141 31 0 195 74 129 22 0 225 786 017:15 80 124 6 0 210 14 117 43 0 174 11 164 26 0 201 94 158 15 0 267 852 017:30 74 137 11 0 222 16 118 65 0 199 17 140 17 0 174 87 172 24 0 283 878 017:45 64 143 10 0 217 16 110 66 0 192 11 133 25 0 169 92 179 24 0 295 873 0Total 279 514 44 0 837 57 459 227 0 743 62 578 99 0 739 347 638 85 0 1070 3389 0
Grand Total 883 2159 181 2 3225 344 2114 968 4 3430 365 2041 371 0 2777 1316 2325 380 0 4021 13453 6Apprch % 27.4% 66.9% 5.6% 0.1% 10.0% 61.6% 28.2% 0.1% 13.1% 73.5% 13.4% 0.0% 32.7% 57.8% 9.5% 0.0%
Total % 6.6% 16.0% 1.3% 0.0% 24.0% 2.6% 15.7% 7.2% 0.0% 25.5% 2.7% 15.2% 2.8% 0.0% 20.6% 9.8% 17.3% 2.8% 0.0% 29.9% 100.0%
START TIME LEFT THRU RIGHT UTURNS APP.TOTAL LEFT THRU RIGHT UTURNS APP.TOTAL LEFT THRU RIGHT UTURNS APP.TOTAL LEFT THRU RIGHT UTURNS APP.TOTAL TotalPeak Hour Analysis From 08:00 to 09:00Peak Hour For Entire Intersection Begins at 08:00
08:00 36 100 7 0 143 20 127 53 0 200 20 84 12 0 116 59 129 23 0 211 67008:15 38 136 11 1 186 22 136 66 2 226 25 86 17 0 128 57 151 15 0 223 76308:30 39 125 12 0 176 35 141 58 0 234 28 80 14 0 122 46 118 16 0 180 71208:45 33 150 8 0 191 22 126 61 0 209 17 70 15 0 102 66 90 14 0 170 672
Total Volume 146 511 38 1 696 99 530 238 2 869 90 320 58 0 468 228 488 68 0 784 2817% App Total 21.0% 73.4% 5.5% 0.1% 11.4% 61.0% 27.4% 0.2% 19.2% 68.4% 12.4% 0.0% 29.1% 62.2% 8.7% 0.0%
PHF .936 .852 .792 .250 .911 .707 .940 .902 .250 .928 .804 .930 .853 .000 .914 .864 .808 .739 .000 .879 .923
START TIME LEFT THRU RIGHT UTURNS APP.TOTAL LEFT THRU RIGHT UTURNS APP.TOTAL LEFT THRU RIGHT UTURNS APP.TOTAL LEFT THRU RIGHT UTURNS APP.TOTAL TotalPeak Hour Analysis From 17:00 to 18:00Peak Hour For Entire Intersection Begins at 17:00
17:00 61 110 17 0 188 11 114 53 0 178 23 141 31 0 195 74 129 22 0 225 78617:15 80 124 6 0 210 14 117 43 0 174 11 164 26 0 201 94 158 15 0 267 85217:30 74 137 11 0 222 16 118 65 0 199 17 140 17 0 174 87 172 24 0 283 87817:45 64 143 10 0 217 16 110 66 0 192 11 133 25 0 169 92 179 24 0 295 873
Total Volume 279 514 44 0 837 57 459 227 0 743 62 578 99 0 739 347 638 85 0 1070 3389% App Total 33.3% 61.4% 5.3% 0.0% 7.7% 61.8% 30.6% 0.0% 8.4% 78.2% 13.4% 0.0% 32.4% 59.6% 7.9% 0.0%
PHF .872 .899 .647 .000 .943 .891 .972 .860 .000 .933 .674 .881 .798 .000 .919 .923 .891 .885 .000 .907 .965
Telegraph AvenueNorthbound
51st StreetWestbound
Telegraph AvenueSouthbound
51st StreetWestbound
Telegraph AvenueSouthbound
51st StreetEastbound
13-7519-016 Telegraph Avenue-51st Street.ppd
Unshifted Count = All VehiclesHeavy Trucks on Bank 2
51st StreetEastbound
9/19/2013
PM PEAK HOUR
Telegraph AvenueSouthbound
51st StreetWestbound
Telegraph AvenueNorthbound
AM PEAK HOUR
51st StreetEastbound
Telegraph AvenueNorthbound
City of OaklandAll Vehicles on UnshiftedPeds & Bikes on Bank 1
(916) [email protected]

File Name :Date :
START TIME LEFT THRU RIGHT UTURNS APP.TOTAL LEFT THRU RIGHT UTURNS APP.TOTAL LEFT THRU RIGHT UTURNS APP.TOTAL LEFT THRU RIGHT UTURNS APP.TOTAL Total Uturn Total07:00 169 16 3 0 188 0 0 176 0 176 0 21 0 0 21 0 0 5 0 5 390 007:15 254 26 3 0 283 0 0 279 0 279 1 19 0 0 20 2 0 1 0 3 585 007:30 309 29 2 0 340 0 0 318 0 318 1 28 0 0 29 0 0 3 0 3 690 007:45 356 40 2 0 398 0 0 375 0 375 1 33 0 0 34 0 0 6 0 6 813 0Total 1088 111 10 0 1209 0 0 1148 0 1148 3 101 0 0 104 2 0 15 0 17 2478 0
08:00 326 46 4 0 376 0 0 392 0 392 0 36 0 0 36 1 0 8 0 9 813 008:15 378 63 4 0 445 0 0 339 0 339 2 37 0 0 39 1 0 7 0 8 831 008:30 380 73 1 0 454 0 0 373 0 373 1 40 0 0 41 1 0 4 0 5 873 008:45 333 51 0 0 384 0 0 397 0 397 1 35 0 0 36 1 0 3 0 4 821 0Total 1417 233 9 0 1659 0 0 1501 0 1501 4 148 0 0 152 4 0 22 0 26 3338 0
15:00 326 47 0 0 373 0 0 297 0 297 4 51 0 0 55 1 0 5 0 6 731 015:15 334 51 2 0 387 0 0 299 0 299 4 46 0 0 50 0 0 8 0 8 744 015:30 372 58 1 0 431 0 0 325 0 325 1 43 0 0 44 1 0 8 0 9 809 015:45 377 61 0 0 438 0 0 311 0 311 1 49 0 0 50 1 0 4 0 5 804 0Total 1409 217 3 0 1629 0 0 1232 0 1232 10 189 0 0 199 3 0 25 0 28 3088 0
16:00 364 39 1 0 404 0 0 321 0 321 4 46 0 0 50 3 0 3 0 6 781 016:15 353 51 0 0 404 0 0 326 0 326 6 38 0 0 44 0 0 3 0 3 777 016:30 384 68 1 0 453 0 0 379 0 379 3 63 0 0 66 1 0 7 0 8 906 016:45 400 63 1 0 464 0 0 394 0 394 2 68 0 0 70 0 0 4 0 4 932 0Total 1501 221 3 0 1725 0 0 1420 0 1420 15 215 0 0 230 4 0 17 0 21 3396 0
17:00 356 54 2 0 412 0 0 432 0 432 2 59 0 0 61 3 0 13 0 16 921 017:15 407 68 1 0 476 0 0 391 0 391 1 75 0 0 76 1 0 6 0 7 950 017:30 384 50 0 0 434 0 0 397 0 397 2 66 0 0 68 0 0 13 0 13 912 017:45 333 59 1 0 393 0 0 400 0 400 0 56 0 0 56 1 0 4 0 5 854 0Total 1480 231 4 0 1715 0 0 1620 0 1620 5 256 0 0 261 5 0 36 0 41 3637 0
Grand Total 6895 1013 29 0 7937 0 0 6921 0 6921 37 909 0 0 946 18 0 115 0 133 15937 0Apprch % 86.9% 12.8% 0.4% 0.0% 0.0% 0.0% 100.0% 0.0% 3.9% 96.1% 0.0% 0.0% 13.5% 0.0% 86.5% 0.0%
Total % 43.3% 6.4% 0.2% 0.0% 49.8% 0.0% 0.0% 43.4% 0.0% 43.4% 0.2% 5.7% 0.0% 0.0% 5.9% 0.1% 0.0% 0.7% 0.0% 0.8% 100.0%
START TIME LEFT THRU RIGHT UTURNS APP.TOTAL LEFT THRU RIGHT UTURNS APP.TOTAL LEFT THRU RIGHT UTURNS APP.TOTAL LEFT THRU RIGHT UTURNS APP.TOTAL TotalPeak Hour Analysis From 08:00 to 09:00Peak Hour For Entire Intersection Begins at 08:00
08:00 326 46 4 0 376 0 0 392 0 392 0 36 0 0 36 1 0 8 0 9 81308:15 378 63 4 0 445 0 0 339 0 339 2 37 0 0 39 1 0 7 0 8 83108:30 380 73 1 0 454 0 0 373 0 373 1 40 0 0 41 1 0 4 0 5 87308:45 333 51 0 0 384 0 0 397 0 397 1 35 0 0 36 1 0 3 0 4 821
Total Volume 1417 233 9 0 1659 0 0 1501 0 1501 4 148 0 0 152 4 0 22 0 26 3338% App Total 85.4% 14.0% 0.5% 0.0% 0.0% 0.0% 100.0% 0.0% 2.6% 97.4% 0.0% 0.0% 15.4% 0.0% 84.6% 0.0%
PHF .932 .798 .563 .000 .914 .000 .000 .945 .000 .945 .500 .925 .000 .000 .927 1.000 .000 .688 .000 .722 .956
START TIME LEFT THRU RIGHT UTURNS APP.TOTAL LEFT THRU RIGHT UTURNS APP.TOTAL LEFT THRU RIGHT UTURNS APP.TOTAL LEFT THRU RIGHT UTURNS APP.TOTAL TotalPeak Hour Analysis From 16:45 to 17:45Peak Hour For Entire Intersection Begins at 16:45
16:45 400 63 1 0 464 0 0 394 0 394 2 68 0 0 70 0 0 4 0 4 93217:00 356 54 2 0 412 0 0 432 0 432 2 59 0 0 61 3 0 13 0 16 92117:15 407 68 1 0 476 0 0 391 0 391 1 75 0 0 76 1 0 6 0 7 95017:30 384 50 0 0 434 0 0 397 0 397 2 66 0 0 68 0 0 13 0 13 912
Total Volume 1547 235 4 0 1786 0 0 1614 0 1614 7 268 0 0 275 4 0 36 0 40 3715% App Total 86.6% 13.2% 0.2% 0.0% 0.0% 0.0% 100.0% 0.0% 2.5% 97.5% 0.0% 0.0% 10.0% 0.0% 90.0% 0.0%
PHF .950 .864 .500 .000 .938 .000 .000 .934 .000 .934 .875 .893 .000 .000 .905 .333 .000 .692 .000 .625 .978
Martin Luther King Jr WayNorthbound
SR-24 RampsWestbound
Martin Luther King Jr WaySouthbound
SR-24 RampsWestbound
Martin Luther King Jr WaySouthbound
47th StreetEastbound
13-7519-017 Martin Luther King Jr Way-47th Street.ppd
Unshifted Count = All VehiclesHeavy Trucks on Bank 2
47th StreetEastbound
9/19/2013
PM PEAK HOUR
Martin Luther King Jr WaySouthbound
SR-24 RampsWestbound
Martin Luther King Jr WayNorthbound
AM PEAK HOUR
47th StreetEastbound
Martin Luther King Jr WayNorthbound
City of OaklandAll Vehicles on UnshiftedPeds & Bikes on Bank 1
(916) [email protected]
File Name :Date :
START TIME LEFT THRU RIGHT UTURNS APP.TOTAL LEFT THRU RIGHT UTURNS APP.TOTAL LEFT THRU RIGHT UTURNS APP.TOTAL LEFT THRU RIGHT UTURNS APP.TOTAL Total Uturn Total07:00 3 0 0 0 3 0 23 1 0 24 0 0 2 0 2 0 47 0 0 47 76 007:15 3 0 0 0 3 1 42 2 0 45 0 0 3 0 3 0 60 0 0 60 111 007:30 4 1 2 0 7 2 54 1 0 57 1 1 3 0 5 0 75 0 0 75 144 007:45 7 3 1 0 11 2 60 2 0 64 2 2 6 0 10 0 86 0 0 86 171 0Total 17 4 3 0 24 5 179 6 0 190 3 3 14 0 20 0 268 0 0 268 502 0
08:00 9 5 1 0 15 0 65 0 0 65 0 4 7 0 11 0 80 0 0 80 171 008:15 9 2 4 0 15 0 91 6 0 97 0 6 5 0 11 0 101 0 0 101 224 008:30 4 3 3 0 10 1 79 2 0 82 3 1 1 0 5 2 89 0 0 91 188 008:45 10 2 0 0 12 3 77 2 0 82 3 0 1 0 4 0 84 0 0 84 182 0Total 32 12 8 0 52 4 312 10 0 326 6 11 14 0 31 2 354 0 0 356 765 0
15:00 1 0 0 0 1 3 58 2 0 63 0 0 4 0 4 0 79 1 0 80 148 015:15 2 0 1 0 3 0 80 1 0 81 2 5 3 0 10 0 75 1 0 76 170 015:30 7 2 2 0 11 1 65 4 0 70 2 3 4 0 9 0 74 0 0 74 164 015:45 1 1 2 0 4 3 63 5 0 71 1 1 1 0 3 1 78 0 0 79 157 0Total 11 3 5 0 19 7 266 12 0 285 5 9 12 0 26 1 306 2 0 309 639 0
16:00 2 1 1 0 4 2 64 4 0 70 1 3 3 0 7 4 73 1 0 78 159 016:15 11 6 0 0 17 2 73 3 0 78 1 4 1 0 6 1 89 0 0 90 191 016:30 5 2 1 0 8 2 93 5 0 100 3 1 8 0 12 0 96 0 0 96 216 016:45 4 1 3 0 8 3 76 4 0 83 4 6 6 0 16 1 67 0 0 68 175 0Total 22 10 5 0 37 9 306 16 0 331 9 14 18 0 41 6 325 1 0 332 741 0
17:00 3 1 1 0 5 4 80 4 0 88 1 5 3 0 9 4 94 1 0 99 201 017:15 11 0 2 0 13 1 101 11 0 113 3 4 7 0 14 1 97 0 0 98 238 017:30 9 1 4 0 14 2 81 10 0 93 0 3 13 0 16 6 112 0 0 118 241 017:45 4 4 1 0 9 2 88 5 0 95 2 4 6 0 12 1 87 0 0 88 204 0Total 27 6 8 0 41 9 350 30 0 389 6 16 29 0 51 12 390 1 0 403 884 0
Grand Total 109 35 29 0 173 34 1413 74 0 1521 29 53 87 0 169 21 1643 4 0 1668 3531 0Apprch % 63.0% 20.2% 16.8% 0.0% 2.2% 92.9% 4.9% 0.0% 17.2% 31.4% 51.5% 0.0% 1.3% 98.5% 0.2% 0.0%
Total % 3.1% 1.0% 0.8% 0.0% 4.9% 1.0% 40.0% 2.1% 0.0% 43.1% 0.8% 1.5% 2.5% 0.0% 4.8% 0.6% 46.5% 0.1% 0.0% 47.2% 100.0%
START TIME LEFT THRU RIGHT UTURNS APP.TOTAL LEFT THRU RIGHT UTURNS APP.TOTAL LEFT THRU RIGHT UTURNS APP.TOTAL LEFT THRU RIGHT UTURNS APP.TOTAL TotalPeak Hour Analysis From 08:00 to 09:00Peak Hour For Entire Intersection Begins at 08:00
08:00 9 5 1 0 15 0 65 0 0 65 0 4 7 0 11 0 80 0 0 80 17108:15 9 2 4 0 15 0 91 6 0 97 0 6 5 0 11 0 101 0 0 101 22408:30 4 3 3 0 10 1 79 2 0 82 3 1 1 0 5 2 89 0 0 91 18808:45 10 2 0 0 12 3 77 2 0 82 3 0 1 0 4 0 84 0 0 84 182
Total Volume 32 12 8 0 52 4 312 10 0 326 6 11 14 0 31 2 354 0 0 356 765% App Total 61.5% 23.1% 15.4% 0.0% 1.2% 95.7% 3.1% 0.0% 19.4% 35.5% 45.2% 0.0% 0.6% 99.4% 0.0% 0.0%
PHF .800 .600 .500 .000 .867 .333 .857 .417 .000 .840 .500 .458 .500 .000 .705 .250 .876 .000 .000 .881 .854
START TIME LEFT THRU RIGHT UTURNS APP.TOTAL LEFT THRU RIGHT UTURNS APP.TOTAL LEFT THRU RIGHT UTURNS APP.TOTAL LEFT THRU RIGHT UTURNS APP.TOTAL TotalPeak Hour Analysis From 17:00 to 18:00Peak Hour For Entire Intersection Begins at 17:00
17:00 3 1 1 0 5 4 80 4 0 88 1 5 3 0 9 4 94 1 0 99 20117:15 11 0 2 0 13 1 101 11 0 113 3 4 7 0 14 1 97 0 0 98 23817:30 9 1 4 0 14 2 81 10 0 93 0 3 13 0 16 6 112 0 0 118 24117:45 4 4 1 0 9 2 88 5 0 95 2 4 6 0 12 1 87 0 0 88 204
Total Volume 27 6 8 0 41 9 350 30 0 389 6 16 29 0 51 12 390 1 0 403 884% App Total 65.9% 14.6% 19.5% 0.0% 2.3% 90.0% 7.7% 0.0% 11.8% 31.4% 56.9% 0.0% 3.0% 96.8% 0.2% 0.0%
PHF .614 .375 .500 .000 .732 .563 .866 .682 .000 .861 .500 .800 .558 .000 .797 .500 .871 .250 .000 .854 .917
Genoa StreetNorthbound
55th StreetWestbound
Genoa StreetSouthbound
55th StreetWestbound
Genoa StreetSouthbound
55th StreetEastbound
13-7679-001 Genoa Street-55th Street.ppd
Unshifted Count = All VehiclesHeavy Trucks on Bank 2
55th StreetEastbound
11/13/2013
PM PEAK HOUR
Genoa StreetSouthbound
55th StreetWestbound
Genoa StreetNorthbound
AM PEAK HOUR
55th StreetEastbound
Genoa StreetNorthbound
City of OaklandAll Vehicles on UnshiftedPeds & Bikes on Bank 1
(916) [email protected]

File Name :Date :
START TIME LEFT THRU RIGHT UTURNS APP.TOTAL LEFT THRU RIGHT UTURNS APP.TOTAL LEFT THRU RIGHT UTURNS APP.TOTAL LEFT THRU RIGHT UTURNS APP.TOTAL Total Uturn Total07:00 0 0 0 0 0 1 3 0 0 4 0 0 0 0 0 0 8 0 0 8 12 007:15 0 0 1 0 1 1 3 3 0 7 0 0 1 0 1 0 19 1 0 20 29 007:30 4 0 1 0 5 0 15 2 0 17 0 0 0 0 0 0 32 0 0 32 54 007:45 11 0 0 0 11 0 10 5 0 15 0 1 0 0 1 1 40 0 0 41 68 0Total 15 0 2 0 17 2 31 10 0 43 0 1 1 0 2 1 99 1 0 101 163 0
08:00 8 0 1 0 9 1 18 5 0 24 0 0 0 0 0 2 38 0 0 40 73 008:15 1 0 2 0 3 1 16 7 0 24 0 0 1 0 1 3 40 0 0 43 71 008:30 4 0 0 0 4 1 24 6 0 31 1 0 1 0 2 0 43 1 0 44 81 008:45 2 0 0 0 2 1 19 2 0 22 0 0 1 0 1 0 23 0 0 23 48 0Total 15 0 3 0 18 4 77 20 0 101 1 0 3 0 4 5 144 1 0 150 273 0
15:00 6 0 0 0 6 1 27 3 0 31 0 0 0 0 0 1 22 1 0 24 61 015:15 2 0 0 0 2 1 18 8 0 27 0 0 2 0 2 0 20 0 0 20 51 015:30 8 0 0 0 8 2 16 8 0 26 0 1 1 0 2 1 23 1 0 25 61 015:45 3 0 2 0 5 0 25 9 0 34 0 0 1 0 1 0 24 0 0 24 64 0Total 19 0 2 0 21 4 86 28 0 118 0 1 4 0 5 2 89 2 0 93 237 0
16:00 1 1 1 0 3 0 23 12 0 35 0 1 0 0 1 0 14 0 0 14 53 016:15 7 1 1 0 9 0 13 6 0 19 0 0 0 0 0 0 17 0 0 17 45 016:30 3 1 0 0 4 0 26 11 0 37 0 0 0 0 0 0 28 0 0 28 69 016:45 1 0 1 0 2 1 31 10 0 42 0 0 1 0 1 0 22 1 0 23 68 0Total 12 3 3 0 18 1 93 39 0 133 0 1 1 0 2 0 81 1 0 82 235 0
17:00 4 0 0 0 4 1 17 8 0 26 1 0 1 0 2 0 29 1 0 30 62 017:15 1 0 1 0 2 0 26 10 0 36 0 0 1 0 1 1 27 0 0 28 67 017:30 5 0 1 0 6 0 23 8 0 31 1 0 0 0 1 0 32 0 0 32 70 017:45 5 0 1 0 6 0 23 8 0 31 0 0 0 0 0 0 26 0 0 26 63 0Total 15 0 3 0 18 1 89 34 0 124 2 0 2 0 4 1 114 1 0 116 262 0
Grand Total 76 3 13 0 92 12 376 131 0 519 3 3 11 0 17 9 527 6 0 542 1170 0Apprch % 82.6% 3.3% 14.1% 0.0% 2.3% 72.4% 25.2% 0.0% 17.6% 17.6% 64.7% 0.0% 1.7% 97.2% 1.1% 0.0%
Total % 6.5% 0.3% 1.1% 0.0% 7.9% 1.0% 32.1% 11.2% 0.0% 44.4% 0.3% 0.3% 0.9% 0.0% 1.5% 0.8% 45.0% 0.5% 0.0% 46.3% 100.0%
START TIME LEFT THRU RIGHT UTURNS APP.TOTAL LEFT THRU RIGHT UTURNS APP.TOTAL LEFT THRU RIGHT UTURNS APP.TOTAL LEFT THRU RIGHT UTURNS APP.TOTAL TotalPeak Hour Analysis From 07:45 to 08:45Peak Hour For Entire Intersection Begins at 07:45
07:45 11 0 0 0 11 0 10 5 0 15 0 1 0 0 1 1 40 0 0 41 6808:00 8 0 1 0 9 1 18 5 0 24 0 0 0 0 0 2 38 0 0 40 7308:15 1 0 2 0 3 1 16 7 0 24 0 0 1 0 1 3 40 0 0 43 7108:30 4 0 0 0 4 1 24 6 0 31 1 0 1 0 2 0 43 1 0 44 81
Total Volume 24 0 3 0 27 3 68 23 0 94 1 1 2 0 4 6 161 1 0 168 293% App Total 88.9% 0.0% 11.1% 0.0% 3.2% 72.3% 24.5% 0.0% 25.0% 25.0% 50.0% 0.0% 3.6% 95.8% 0.6% 0.0%
PHF .545 .000 .375 .000 .614 .750 .708 .821 .000 .758 .250 .250 .500 .000 .500 .500 .936 .250 .000 .955 .904
START TIME LEFT THRU RIGHT UTURNS APP.TOTAL LEFT THRU RIGHT UTURNS APP.TOTAL LEFT THRU RIGHT UTURNS APP.TOTAL LEFT THRU RIGHT UTURNS APP.TOTAL TotalPeak Hour Analysis From 16:45 to 17:45Peak Hour For Entire Intersection Begins at 16:45
16:45 1 0 1 0 2 1 31 10 0 42 0 0 1 0 1 0 22 1 0 23 6817:00 4 0 0 0 4 1 17 8 0 26 1 0 1 0 2 0 29 1 0 30 6217:15 1 0 1 0 2 0 26 10 0 36 0 0 1 0 1 1 27 0 0 28 6717:30 5 0 1 0 6 0 23 8 0 31 1 0 0 0 1 0 32 0 0 32 70
Total Volume 11 0 3 0 14 2 97 36 0 135 2 0 3 0 5 1 110 2 0 113 267% App Total 78.6% 0.0% 21.4% 0.0% 1.5% 71.9% 26.7% 0.0% 40.0% 0.0% 60.0% 0.0% 0.9% 97.3% 1.8% 0.0%
PHF .550 .000 .750 .000 .583 .500 .782 .900 .000 .804 .500 .000 .750 .000 .625 .250 .859 .500 .000 .883 .954
Genoa StreetNorthbound
52nd StreetWestbound
Genoa StreetSouthbound
52nd StreetWestbound
Genoa StreetSouthbound
52nd StreetEastbound
13-7679-002 Genoa Street-52nd Street.ppd
Unshifted Count = All VehiclesHeavy Trucks on Bank 2
52nd StreetEastbound
11/13/2013
PM PEAK HOUR
Genoa StreetSouthbound
52nd StreetWestbound
Genoa StreetNorthbound
AM PEAK HOUR
52nd StreetEastbound
Genoa StreetNorthbound
City of OaklandAll Vehicles on UnshiftedPeds & Bikes on Bank 1
(916) [email protected]
File Name :Date :
START TIME LEFT THRU RIGHT UTURNS APP.TOTAL LEFT THRU RIGHT UTURNS APP.TOTAL LEFT THRU RIGHT UTURNS APP.TOTAL LEFT THRU RIGHT UTURNS APP.TOTAL Total Uturn Total07:00 0 3 0 0 3 7 6 0 0 13 2 0 7 0 9 0 8 1 0 9 34 007:15 1 6 0 0 7 10 7 0 0 17 0 0 11 0 11 0 18 3 0 21 56 007:30 3 8 0 0 11 16 13 0 0 29 4 0 15 0 19 0 32 4 0 36 95 007:45 1 7 0 0 8 11 11 0 0 22 6 0 11 0 17 0 44 5 0 49 96 0Total 5 24 0 0 29 44 37 0 0 81 12 0 44 0 56 0 102 13 0 115 281 0
08:00 0 8 1 0 9 12 18 0 0 30 7 0 16 0 23 0 42 4 0 46 108 008:15 1 5 0 0 6 17 11 0 0 28 4 0 18 0 22 0 45 2 0 47 103 008:30 1 9 3 0 13 14 22 0 0 36 7 0 19 0 26 0 39 2 0 41 116 008:45 0 21 1 0 22 14 21 0 0 35 4 0 18 0 22 0 33 2 0 35 114 0Total 2 43 5 0 50 57 72 0 0 129 22 0 71 0 93 0 159 10 0 169 441 0
15:00 2 14 2 0 18 14 25 0 0 39 8 0 28 0 36 0 20 6 0 26 119 015:15 0 15 1 0 16 19 15 0 0 34 8 0 21 0 29 0 23 2 0 25 104 015:30 1 18 5 0 24 17 13 0 0 30 13 0 27 0 40 1 21 4 0 26 120 015:45 4 15 1 0 20 14 23 0 0 37 9 0 28 0 37 0 32 5 0 37 131 0Total 7 62 9 0 78 64 76 0 0 140 38 0 104 0 142 1 96 17 0 114 474 0
16:00 1 12 1 0 14 15 18 0 0 33 19 0 22 0 41 0 15 0 0 15 103 016:15 3 11 1 0 15 31 12 0 0 43 7 0 29 0 36 0 23 7 0 30 124 016:30 0 16 2 0 18 24 23 0 0 47 10 0 32 0 42 0 29 6 0 35 142 016:45 1 15 0 0 16 22 32 0 0 54 15 0 28 0 43 0 22 2 0 24 137 0Total 5 54 4 0 63 92 85 0 0 177 51 0 111 0 162 0 89 15 0 104 506 0
17:00 1 14 2 0 17 18 19 0 0 37 7 0 34 0 41 0 24 2 0 26 121 017:15 3 12 1 0 16 13 25 0 0 38 10 0 40 0 50 0 35 2 0 37 141 017:30 1 11 1 0 13 30 18 0 0 48 11 0 32 0 43 0 31 2 0 33 137 017:45 2 15 2 0 19 16 22 0 0 38 12 0 29 0 41 0 34 1 0 35 133 0Total 7 52 6 0 65 77 84 0 0 161 40 0 135 0 175 0 124 7 0 131 532 0
Grand Total 26 235 24 0 285 334 354 0 0 688 163 0 465 0 628 1 570 62 0 633 2234 0Apprch % 9.1% 82.5% 8.4% 0.0% 48.5% 51.5% 0.0% 0.0% 26.0% 0.0% 74.0% 0.0% 0.2% 90.0% 9.8% 0.0%
Total % 1.2% 10.5% 1.1% 0.0% 12.8% 15.0% 15.8% 0.0% 0.0% 30.8% 7.3% 0.0% 20.8% 0.0% 28.1% 0.0% 25.5% 2.8% 0.0% 28.3% 100.0%
START TIME LEFT THRU RIGHT UTURNS APP.TOTAL LEFT THRU RIGHT UTURNS APP.TOTAL LEFT THRU RIGHT UTURNS APP.TOTAL LEFT THRU RIGHT UTURNS APP.TOTAL TotalPeak Hour Analysis From 08:00 to 09:00Peak Hour For Entire Intersection Begins at 08:00
08:00 0 8 1 0 9 12 18 0 0 30 7 0 16 0 23 0 42 4 0 46 10808:15 1 5 0 0 6 17 11 0 0 28 4 0 18 0 22 0 45 2 0 47 10308:30 1 9 3 0 13 14 22 0 0 36 7 0 19 0 26 0 39 2 0 41 11608:45 0 21 1 0 22 14 21 0 0 35 4 0 18 0 22 0 33 2 0 35 114
Total Volume 2 43 5 0 50 57 72 0 0 129 22 0 71 0 93 0 159 10 0 169 441% App Total 4.0% 86.0% 10.0% 0.0% 44.2% 55.8% 0.0% 0.0% 23.7% 0.0% 76.3% 0.0% 0.0% 94.1% 5.9% 0.0%
PHF .500 .512 .417 .000 .568 .838 .818 .000 .000 .896 .786 .000 .934 .000 .894 .000 .883 .625 .000 .899 .950
START TIME LEFT THRU RIGHT UTURNS APP.TOTAL LEFT THRU RIGHT UTURNS APP.TOTAL LEFT THRU RIGHT UTURNS APP.TOTAL LEFT THRU RIGHT UTURNS APP.TOTAL TotalPeak Hour Analysis From 16:30 to 17:30Peak Hour For Entire Intersection Begins at 16:30
16:30 0 16 2 0 18 24 23 0 0 47 10 0 32 0 42 0 29 6 0 35 14216:45 1 15 0 0 16 22 32 0 0 54 15 0 28 0 43 0 22 2 0 24 13717:00 1 14 2 0 17 18 19 0 0 37 7 0 34 0 41 0 24 2 0 26 12117:15 3 12 1 0 16 13 25 0 0 38 10 0 40 0 50 0 35 2 0 37 141
Total Volume 5 57 5 0 67 77 99 0 0 176 42 0 134 0 176 0 110 12 0 122 541% App Total 7.5% 85.1% 7.5% 0.0% 43.8% 56.3% 0.0% 0.0% 23.9% 0.0% 76.1% 0.0% 0.0% 90.2% 9.8% 0.0%
PHF .417 .891 .625 .000 .931 .802 .773 .000 .000 .815 .700 .000 .838 .000 .880 .000 .786 .500 .000 .824 .952
West StreetNorthbound
52nd StreetWestbound
West StreetSouthbound
52nd StreetWestbound
West StreetSouthbound
52nd StreetEastbound
13-7679-003 West Street-52nd Street.ppd
Unshifted Count = All VehiclesHeavy Trucks on Bank 2
52nd StreetEastbound
11/13/2013
PM PEAK HOUR
West StreetSouthbound
52nd StreetWestbound
West StreetNorthbound
AM PEAK HOUR
52nd StreetEastbound
West StreetNorthbound
City of OaklandAll Vehicles on UnshiftedPeds & Bikes on Bank 1
(916) [email protected]

Appendix B LOS Calculation Worksheets – Existing Conditions
HCM Signalized Intersection Capacity Analysis Children's Hospital1: MLK Way & 55th Street Existing AM
Fehr & Peers Synchro 8 Report
Movement EBL EBT EBR WBL WBT WBR NBU NBL NBT NBR SBL SBTLane ConfigurationsVolume (vph) 13 170 219 54 217 57 13 127 1340 49 52 1239Ideal Flow (vphpl) 1900 1900 1900 1900 1900 1900 1900 1900 1900 1900 1900 1900Total Lost time (s) 5.0 5.0 4.5 5.0 4.5 5.0Lane Util. Factor 1.00 1.00 1.00 0.91 1.00 0.91Frpb, ped/bikes 0.98 1.00 1.00 1.00 1.00 1.00Flpb, ped/bikes 1.00 1.00 1.00 1.00 1.00 1.00Frt 0.93 0.98 1.00 0.99 1.00 1.00Flt Protected 1.00 0.99 0.95 1.00 0.95 1.00Satd. Flow (prot) 1707 1759 1770 5047 1770 5064Flt Permitted 0.98 0.77 0.95 1.00 0.95 1.00Satd. Flow (perm) 1683 1364 1770 5047 1770 5064Peak-hour factor, PHF 1.00 1.00 1.00 1.00 1.00 1.00 1.00 1.00 1.00 1.00 1.00 1.00Adj. Flow (vph) 13 170 219 54 217 57 13 127 1340 49 52 1239RTOR Reduction (vph) 0 56 0 0 10 0 0 0 3 0 0 2Lane Group Flow (vph) 0 346 0 0 318 0 0 140 1386 0 52 1264Confl. Peds. (#/hr) 7 14 14 7 21Confl. Bikes (#/hr) 16 15 6Heavy Vehicles (%) 1% 1% 1% 4% 4% 4% 2% 2% 2% 2% 2% 2%Turn Type Perm NA Perm NA Prot Prot NA Prot NAProtected Phases 4 8 5 5 2 1 6Permitted Phases 4 8Actuated Green, G (s) 25.9 25.9 15.3 45.1 4.5 34.3Effective Green, g (s) 25.9 25.9 15.3 45.1 4.5 34.3Actuated g/C Ratio 0.29 0.29 0.17 0.50 0.05 0.38Clearance Time (s) 5.0 5.0 4.5 5.0 4.5 5.0Vehicle Extension (s) 3.0 3.0 3.0 3.0 3.0 3.0Lane Grp Cap (vph) 484 392 300 2529 88 1929v/s Ratio Prot 0.08 c0.27 0.03 c0.25v/s Ratio Perm 0.21 c0.23v/c Ratio 0.72 0.81 0.47 0.55 0.59 0.66Uniform Delay, d1 28.7 29.8 33.7 15.4 41.8 23.0Progression Factor 1.00 1.00 0.52 0.12 1.00 1.00Incremental Delay, d2 5.0 12.0 1.1 0.8 10.2 1.8Delay (s) 33.7 41.8 18.5 2.6 52.0 24.7Level of Service C D B A D CApproach Delay (s) 33.7 41.8 4.0 25.8Approach LOS C D A C
Intersection SummaryHCM 2000 Control Delay 18.9 HCM 2000 Level of Service BHCM 2000 Volume to Capacity ratio 0.70Actuated Cycle Length (s) 90.0 Sum of lost time (s) 14.5Intersection Capacity Utilization 85.2% ICU Level of Service EAnalysis Period (min) 15c Critical Lane Group

HCM Signalized Intersection Capacity Analysis Children's Hospital1: MLK Way & 55th Street Existing AM
Fehr & Peers Synchro 8 Report
Movement SBRLane ConfigurationsVolume (vph) 27Ideal Flow (vphpl) 1900Total Lost time (s)Lane Util. FactorFrpb, ped/bikesFlpb, ped/bikesFrtFlt ProtectedSatd. Flow (prot)Flt PermittedSatd. Flow (perm)Peak-hour factor, PHF 1.00Adj. Flow (vph) 27RTOR Reduction (vph) 0Lane Group Flow (vph) 0Confl. Peds. (#/hr) 12Confl. Bikes (#/hr) 7Heavy Vehicles (%) 2%Turn TypeProtected PhasesPermitted PhasesActuated Green, G (s)Effective Green, g (s)Actuated g/C RatioClearance Time (s)Vehicle Extension (s)Lane Grp Cap (vph)v/s Ratio Protv/s Ratio Permv/c RatioUniform Delay, d1Progression FactorIncremental Delay, d2Delay (s)Level of ServiceApproach Delay (s)Approach LOS
Intersection Summary
HCM Unsignalized Intersection Capacity Analysis Children's Hospital2: Dover Street & 55th Street Existing AM
Fehr & Peers Synchro 8 Report
Movement EBL EBT EBR WBL WBT WBR NBL NBT NBR SBL SBT SBRLane ConfigurationsVolume (veh/h) 18 249 6 20 296 6 7 8 11 8 6 21Sign Control Free Free Stop StopGrade 0% 0% 0% 0%Peak Hour Factor 1.00 1.00 1.00 1.00 1.00 1.00 1.00 1.00 1.00 1.00 1.00 1.00Hourly flow rate (vph) 18 249 6 20 296 6 7 8 11 8 6 21Pedestrians 9 20 15 6Lane Width (ft) 12.0 12.0 12.0 12.0Walking Speed (ft/s) 4.0 4.0 4.0 4.0Percent Blockage 1 2 1 1Right turn flare (veh)Median type None NoneMedian storage veh)Upstream signal (ft) 641 677pX, platoon unblocked 0.92 0.92 0.92 0.92 0.92 0.92vC, conflicting volume 308 270 675 651 287 668 651 314vC1, stage 1 conf volvC2, stage 2 conf volvCu, unblocked vol 208 270 606 580 287 598 580 214tC, single (s) 4.1 4.1 7.1 6.5 6.2 7.1 6.5 6.2tC, 2 stage (s)tF (s) 2.2 2.2 3.5 4.0 3.3 3.5 4.0 3.3p0 queue free % 99 98 98 98 99 98 98 97cM capacity (veh/h) 1235 1266 345 377 735 348 373 750
Direction, Lane # EB 1 WB 1 NB 1 SB 1Volume Total 273 322 26 35Volume Left 18 20 7 8Volume Right 6 6 11 21cSH 1235 1266 460 522Volume to Capacity 0.01 0.02 0.06 0.07Queue Length 95th (ft) 1 1 4 5Control Delay (s) 0.7 0.6 13.3 12.4Lane LOS A A B BApproach Delay (s) 0.7 0.6 13.3 12.4Approach LOS B B
Intersection SummaryAverage Delay 1.8Intersection Capacity Utilization 36.6% ICU Level of Service AAnalysis Period (min) 15

HCM Signalized Intersection Capacity Analysis Children's Hospital3: 55th Street & Shattuck Ave Existing AM
Fehr & Peers Synchro 8 Report
Movement EBL EBT EBR WBL WBT WBR NBL NBT NBR SBL SBT SBRLane ConfigurationsVolume (vph) 50 187 40 25 250 31 28 430 24 25 544 28Ideal Flow (vphpl) 1900 1900 1900 1900 1900 1900 1900 1900 1900 1900 1900 1900Total Lost time (s) 3.0 3.0 5.0 5.0Lane Util. Factor 1.00 1.00 1.00 1.00Frpb, ped/bikes 0.99 1.00 1.00 1.00Flpb, ped/bikes 1.00 1.00 1.00 1.00Frt 0.98 0.99 0.99 0.99Flt Protected 0.99 1.00 1.00 1.00Satd. Flow (prot) 1740 1803 1841 1861Flt Permitted 0.90 0.96 0.95 0.97Satd. Flow (perm) 1573 1744 1759 1813Peak-hour factor, PHF 1.00 1.00 1.00 1.00 1.00 1.00 1.00 1.00 1.00 1.00 1.00 1.00Adj. Flow (vph) 50 187 40 25 250 31 28 430 24 25 544 28RTOR Reduction (vph) 0 8 0 0 5 0 0 2 0 0 2 0Lane Group Flow (vph) 0 269 0 0 301 0 0 480 0 0 595 0Confl. Peds. (#/hr) 6 13 13 6 7 17 17 7Confl. Bikes (#/hr) 22 10 13 24Heavy Vehicles (%) 5% 5% 5% 3% 3% 3% 2% 2% 2% 1% 1% 1%Turn Type Perm NA Perm NA Perm NA Perm NAProtected Phases 2 6 4 8Permitted Phases 2 6 4 4 8Actuated Green, G (s) 25.0 25.0 47.0 47.0Effective Green, g (s) 25.0 25.0 47.0 47.0Actuated g/C Ratio 0.31 0.31 0.59 0.59Clearance Time (s) 3.0 3.0 5.0 5.0Lane Grp Cap (vph) 491 545 1033 1065v/s Ratio Protv/s Ratio Perm 0.17 c0.17 0.27 c0.33v/c Ratio 0.55 0.55 0.46 0.56Uniform Delay, d1 22.8 22.9 9.4 10.1Progression Factor 1.00 1.00 1.00 1.00Incremental Delay, d2 4.4 4.0 1.5 2.1Delay (s) 27.2 26.9 10.9 12.2Level of Service C C B BApproach Delay (s) 27.2 26.9 10.9 12.2Approach LOS C C B B
Intersection SummaryHCM 2000 Control Delay 17.0 HCM 2000 Level of Service BHCM 2000 Volume to Capacity ratio 0.56Actuated Cycle Length (s) 80.0 Sum of lost time (s) 8.0Intersection Capacity Utilization 73.4% ICU Level of Service DAnalysis Period (min) 15c Critical Lane Group
HCM Signalized Intersection Capacity Analysis Children's Hospital4: 55th Street & Telegraph Ave Existing AM
Fehr & Peers Synchro 8 Report
Movement EBL EBT EBR WBL WBT WBR NBL NBT NBR SBL SBT SBRLane ConfigurationsVolume (vph) 136 14 77 32 10 9 58 715 40 27 806 236Ideal Flow (vphpl) 1900 1900 1900 1900 1900 1900 1900 1900 1900 1900 1900 1900Total Lost time (s) 4.5 4.5 4.5 4.5 4.5 4.5Lane Util. Factor 1.00 1.00 1.00 0.95 1.00 0.95Frpb, ped/bikes 0.99 0.99 1.00 1.00 1.00 0.99Flpb, ped/bikes 1.00 1.00 1.00 1.00 0.99 1.00Frt 0.95 0.98 1.00 0.99 1.00 0.97Flt Protected 0.97 0.97 0.95 1.00 0.95 1.00Satd. Flow (prot) 1651 1713 1761 3497 1768 3406Flt Permitted 0.79 0.80 0.23 1.00 0.34 1.00Satd. Flow (perm) 1338 1405 435 3497 640 3406Peak-hour factor, PHF 1.00 1.00 1.00 1.00 1.00 1.00 1.00 1.00 1.00 1.00 1.00 1.00Adj. Flow (vph) 136 14 77 32 10 9 58 715 40 27 806 236RTOR Reduction (vph) 0 32 0 0 7 0 0 4 0 0 28 0Lane Group Flow (vph) 0 195 0 0 44 0 58 751 0 27 1014 0Confl. Peds. (#/hr) 6 11 11 6 13 17 17 13Confl. Bikes (#/hr) 15 15 43 27Heavy Vehicles (%) 5% 5% 5% 4% 4% 4% 2% 2% 2% 1% 1% 1%Turn Type Perm NA Perm NA Perm NA Perm NAProtected Phases 4 8 2 6Permitted Phases 4 8 2 6Actuated Green, G (s) 16.2 16.2 44.8 44.8 44.8 44.8Effective Green, g (s) 16.2 16.2 44.8 44.8 44.8 44.8Actuated g/C Ratio 0.23 0.23 0.64 0.64 0.64 0.64Clearance Time (s) 4.5 4.5 4.5 4.5 4.5 4.5Vehicle Extension (s) 3.0 3.0 3.0 3.0 3.0 3.0Lane Grp Cap (vph) 309 325 278 2238 409 2179v/s Ratio Prot 0.21 c0.30v/s Ratio Perm c0.15 0.03 0.13 0.04v/c Ratio 0.63 0.14 0.21 0.34 0.07 0.47Uniform Delay, d1 24.2 21.3 5.2 5.8 4.7 6.5Progression Factor 1.00 1.00 1.00 1.00 1.00 1.00Incremental Delay, d2 4.1 0.2 1.7 0.4 0.3 0.7Delay (s) 28.3 21.5 6.9 6.2 5.0 7.2Level of Service C C A A A AApproach Delay (s) 28.3 21.5 6.2 7.1Approach LOS C C A A
Intersection SummaryHCM 2000 Control Delay 9.4 HCM 2000 Level of Service AHCM 2000 Volume to Capacity ratio 0.51Actuated Cycle Length (s) 70.0 Sum of lost time (s) 9.0Intersection Capacity Utilization 61.4% ICU Level of Service BAnalysis Period (min) 15c Critical Lane Group

HCM Unsignalized Intersection Capacity Analysis Children's Hospital5: MLK Way & 54th Street Existing AM
Fehr & Peers Synchro 8 Report
Movement EBL EBT EBR WBL WBT WBR NBU NBL NBT NBR SBL SBTLane ConfigurationsVolume (veh/h) 4 3 43 5 3 8 10 15 1505 10 5 1485Sign Control Stop Stop Free FreeGrade 0% 0% 0% 0%Peak Hour Factor 1.00 1.00 1.00 1.00 1.00 1.00 1.00 1.00 1.00 1.00 1.00 1.00Hourly flow rate (vph) 4 3 43 5 3 8 0 15 1505 10 5 1485Pedestrians 7 6 8Lane Width (ft) 12.0 12.0 12.0Walking Speed (ft/s) 4.0 4.0 4.0Percent Blockage 1 1 1Right turn flare (veh)Median type None NoneMedian storage veh)Upstream signal (ft) 299 294pX, platoon unblocked 0.87 0.87 0.80 0.87 0.87 0.86 0.00 0.80 0.86vC, conflicting volume 2047 3056 514 2104 3055 513 0 1499 1521vC1, stage 1 conf volvC2, stage 2 conf volvCu, unblocked vol 605 1765 0 670 1763 0 0 754 1040tC, single (s) 7.5 6.5 6.9 7.5 6.5 6.9 0.0 4.1 4.1tC, 2 stage (s)tF (s) 3.5 4.0 3.3 3.5 4.0 3.3 0.0 2.2 2.2p0 queue free % 99 96 95 98 96 99 0 98 99cM capacity (veh/h) 311 71 863 266 71 935 0 679 574
Direction, Lane # EB 1 WB 1 NB 1 NB 2 NB 3 SB 1 SB 2 SB 3Volume Total 50 16 391 752 386 376 742 378Volume Left 4 5 15 0 0 5 0 0Volume Right 43 8 0 0 10 0 0 7cSH 476 230 679 1700 1700 574 1700 1700Volume to Capacity 0.11 0.07 0.02 0.44 0.23 0.01 0.44 0.22Queue Length 95th (ft) 9 6 2 0 0 1 0 0Control Delay (s) 13.4 21.8 0.7 0.0 0.0 0.3 0.0 0.0Lane LOS B C A AApproach Delay (s) 13.4 21.8 0.2 0.1Approach LOS B C
Intersection SummaryAverage Delay 0.5Intersection Capacity Utilization 59.7% ICU Level of Service BAnalysis Period (min) 15
HCM Unsignalized Intersection Capacity Analysis Children's Hospital5: MLK Way & 54th Street Existing AM
Fehr & Peers Synchro 8 Report
Movement SBRLane ConfigurationsVolume (veh/h) 7Sign ControlGradePeak Hour Factor 1.00Hourly flow rate (vph) 7PedestriansLane Width (ft)Walking Speed (ft/s)Percent BlockageRight turn flare (veh)Median typeMedian storage veh)Upstream signal (ft)pX, platoon unblockedvC, conflicting volumevC1, stage 1 conf volvC2, stage 2 conf volvCu, unblocked voltC, single (s)tC, 2 stage (s)tF (s)p0 queue free %cM capacity (veh/h)
Direction, Lane #

HCM Unsignalized Intersection Capacity Analysis Children's Hospital6: Dover Street & 54th Street Existing AM
Fehr & Peers Synchro 8 Report
Movement EBL EBT EBR WBL WBT WBR NBL NBT NBR SBL SBT SBRLane ConfigurationsVolume (veh/h) 5 5 6 4 6 9 8 17 11 4 33 5Sign Control Stop Stop Free FreeGrade 0% 0% 0% 0%Peak Hour Factor 1.00 1.00 1.00 1.00 1.00 1.00 1.00 1.00 1.00 1.00 1.00 1.00Hourly flow rate (vph) 5 5 6 4 6 9 8 17 11 4 33 5Pedestrians 10 14 2 6Lane Width (ft) 12.0 12.0 12.0 12.0Walking Speed (ft/s) 4.0 4.0 4.0 4.0Percent Blockage 1 1 0 1Right turn flare (veh)Median type None NoneMedian storage veh)Upstream signal (ft)pX, platoon unblockedvC, conflicting volume 110 112 48 106 108 42 48 42vC1, stage 1 conf volvC2, stage 2 conf volvCu, unblocked vol 110 112 48 106 108 42 48 42tC, single (s) 7.1 6.5 6.2 7.1 6.5 6.2 4.1 4.1tC, 2 stage (s)tF (s) 3.5 4.0 3.3 3.5 4.0 3.3 2.2 2.2p0 queue free % 99 99 99 100 99 99 99 100cM capacity (veh/h) 831 761 1017 839 764 1017 1559 1562
Direction, Lane # EB 1 WB 1 NB 1 SB 1Volume Total 16 19 36 42Volume Left 5 4 8 4Volume Right 6 9 11 5cSH 865 885 1559 1562Volume to Capacity 0.02 0.02 0.01 0.00Queue Length 95th (ft) 1 2 0 0Control Delay (s) 9.2 9.2 1.7 0.7Lane LOS A A A AApproach Delay (s) 9.2 9.2 1.7 0.7Approach LOS A A
Intersection SummaryAverage Delay 3.6Intersection Capacity Utilization 19.4% ICU Level of Service AAnalysis Period (min) 15
HCM Unsignalized Intersection Capacity Analysis Children's Hospital7: Shattuck Ave & 54th Street Existing AM
Fehr & Peers Synchro 8 Report
Movement EBL EBR NBL NBT SBT SBRLane ConfigurationsVolume (veh/h) 1 14 12 487 587 5Sign Control Stop Free FreeGrade 0% 0% 0%Peak Hour Factor 1.00 1.00 1.00 1.00 1.00 1.00Hourly flow rate (vph) 1 14 12 487 587 5Pedestrians 9 2 1Lane Width (ft) 12.0 12.0 12.0Walking Speed (ft/s) 4.0 4.0 4.0Percent Blockage 1 0 0Right turn flare (veh)Median type None NoneMedian storage veh)Upstream signal (ft) 550 282pX, platoon unblocked 0.81 0.81 0.81vC, conflicting volume 1110 600 601vC1, stage 1 conf volvC2, stage 2 conf volvCu, unblocked vol 1018 387 387tC, single (s) 6.4 6.2 4.1tC, 2 stage (s)tF (s) 3.5 3.3 2.2p0 queue free % 100 97 99cM capacity (veh/h) 210 533 939
Direction, Lane # EB 1 NB 1 SB 1Volume Total 15 499 592Volume Left 1 12 0Volume Right 14 0 5cSH 483 939 1700Volume to Capacity 0.03 0.01 0.35Queue Length 95th (ft) 2 1 0Control Delay (s) 12.7 0.4 0.0Lane LOS B AApproach Delay (s) 12.7 0.4 0.0Approach LOS B
Intersection SummaryAverage Delay 0.3Intersection Capacity Utilization 45.9% ICU Level of Service AAnalysis Period (min) 15
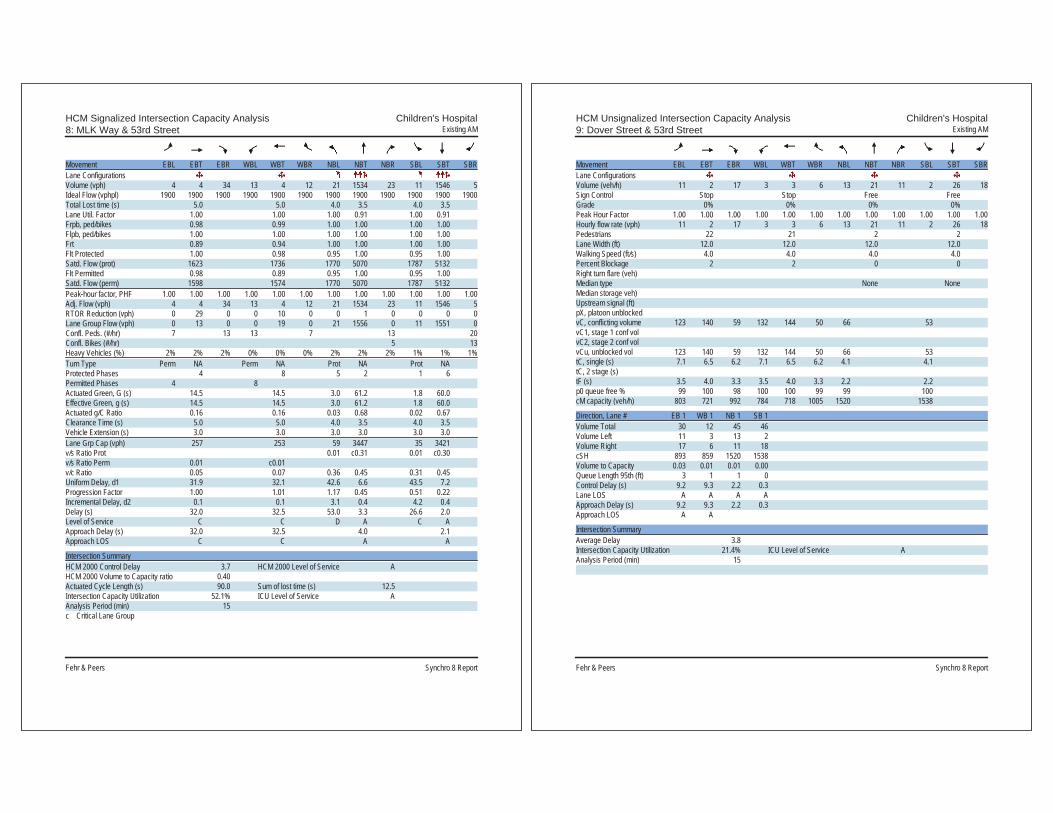
HCM Signalized Intersection Capacity Analysis Children's Hospital8: MLK Way & 53rd Street Existing AM
Fehr & Peers Synchro 8 Report
Movement EBL EBT EBR WBL WBT WBR NBL NBT NBR SBL SBT SBRLane ConfigurationsVolume (vph) 4 4 34 13 4 12 21 1534 23 11 1546 5Ideal Flow (vphpl) 1900 1900 1900 1900 1900 1900 1900 1900 1900 1900 1900 1900Total Lost time (s) 5.0 5.0 4.0 3.5 4.0 3.5Lane Util. Factor 1.00 1.00 1.00 0.91 1.00 0.91Frpb, ped/bikes 0.98 0.99 1.00 1.00 1.00 1.00Flpb, ped/bikes 1.00 1.00 1.00 1.00 1.00 1.00Frt 0.89 0.94 1.00 1.00 1.00 1.00Flt Protected 1.00 0.98 0.95 1.00 0.95 1.00Satd. Flow (prot) 1623 1736 1770 5070 1787 5132Flt Permitted 0.98 0.89 0.95 1.00 0.95 1.00Satd. Flow (perm) 1598 1574 1770 5070 1787 5132Peak-hour factor, PHF 1.00 1.00 1.00 1.00 1.00 1.00 1.00 1.00 1.00 1.00 1.00 1.00Adj. Flow (vph) 4 4 34 13 4 12 21 1534 23 11 1546 5RTOR Reduction (vph) 0 29 0 0 10 0 0 1 0 0 0 0Lane Group Flow (vph) 0 13 0 0 19 0 21 1556 0 11 1551 0Confl. Peds. (#/hr) 7 13 13 7 13 20Confl. Bikes (#/hr) 5 13Heavy Vehicles (%) 2% 2% 2% 0% 0% 0% 2% 2% 2% 1% 1% 1%Turn Type Perm NA Perm NA Prot NA Prot NAProtected Phases 4 8 5 2 1 6Permitted Phases 4 8Actuated Green, G (s) 14.5 14.5 3.0 61.2 1.8 60.0Effective Green, g (s) 14.5 14.5 3.0 61.2 1.8 60.0Actuated g/C Ratio 0.16 0.16 0.03 0.68 0.02 0.67Clearance Time (s) 5.0 5.0 4.0 3.5 4.0 3.5Vehicle Extension (s) 3.0 3.0 3.0 3.0 3.0 3.0Lane Grp Cap (vph) 257 253 59 3447 35 3421v/s Ratio Prot 0.01 c0.31 0.01 c0.30v/s Ratio Perm 0.01 c0.01v/c Ratio 0.05 0.07 0.36 0.45 0.31 0.45Uniform Delay, d1 31.9 32.1 42.6 6.6 43.5 7.2Progression Factor 1.00 1.01 1.17 0.45 0.51 0.22Incremental Delay, d2 0.1 0.1 3.1 0.4 4.2 0.4Delay (s) 32.0 32.5 53.0 3.3 26.6 2.0Level of Service C C D A C AApproach Delay (s) 32.0 32.5 4.0 2.1Approach LOS C C A A
Intersection SummaryHCM 2000 Control Delay 3.7 HCM 2000 Level of Service AHCM 2000 Volume to Capacity ratio 0.40Actuated Cycle Length (s) 90.0 Sum of lost time (s) 12.5Intersection Capacity Utilization 52.1% ICU Level of Service AAnalysis Period (min) 15c Critical Lane Group
HCM Unsignalized Intersection Capacity Analysis Children's Hospital9: Dover Street & 53rd Street Existing AM
Fehr & Peers Synchro 8 Report
Movement EBL EBT EBR WBL WBT WBR NBL NBT NBR SBL SBT SBRLane ConfigurationsVolume (veh/h) 11 2 17 3 3 6 13 21 11 2 26 18Sign Control Stop Stop Free FreeGrade 0% 0% 0% 0%Peak Hour Factor 1.00 1.00 1.00 1.00 1.00 1.00 1.00 1.00 1.00 1.00 1.00 1.00Hourly flow rate (vph) 11 2 17 3 3 6 13 21 11 2 26 18Pedestrians 22 21 2 2Lane Width (ft) 12.0 12.0 12.0 12.0Walking Speed (ft/s) 4.0 4.0 4.0 4.0Percent Blockage 2 2 0 0Right turn flare (veh)Median type None NoneMedian storage veh)Upstream signal (ft)pX, platoon unblockedvC, conflicting volume 123 140 59 132 144 50 66 53vC1, stage 1 conf volvC2, stage 2 conf volvCu, unblocked vol 123 140 59 132 144 50 66 53tC, single (s) 7.1 6.5 6.2 7.1 6.5 6.2 4.1 4.1tC, 2 stage (s)tF (s) 3.5 4.0 3.3 3.5 4.0 3.3 2.2 2.2p0 queue free % 99 100 98 100 100 99 99 100cM capacity (veh/h) 803 721 992 784 718 1005 1520 1538
Direction, Lane # EB 1 WB 1 NB 1 SB 1Volume Total 30 12 45 46Volume Left 11 3 13 2Volume Right 17 6 11 18cSH 893 859 1520 1538Volume to Capacity 0.03 0.01 0.01 0.00Queue Length 95th (ft) 3 1 1 0Control Delay (s) 9.2 9.3 2.2 0.3Lane LOS A A A AApproach Delay (s) 9.2 9.3 2.2 0.3Approach LOS A A
Intersection SummaryAverage Delay 3.8Intersection Capacity Utilization 21.4% ICU Level of Service AAnalysis Period (min) 15
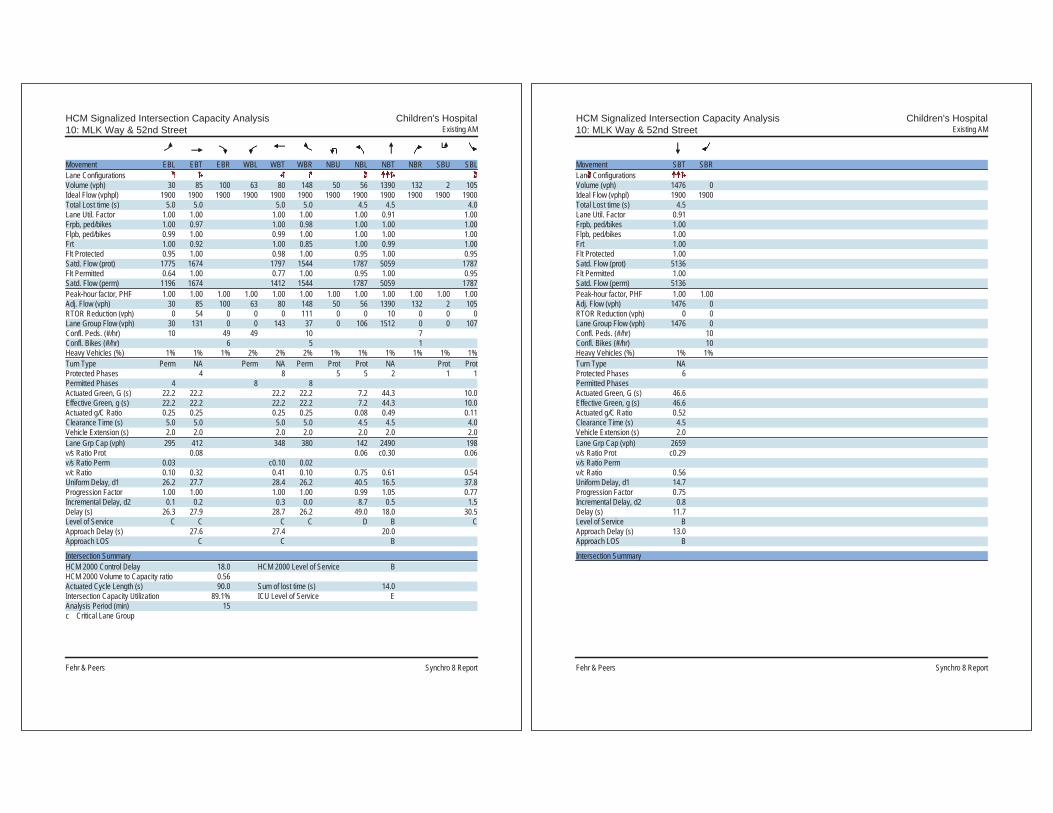
HCM Signalized Intersection Capacity Analysis Children's Hospital10: MLK Way & 52nd Street Existing AM
Fehr & Peers Synchro 8 Report
Movement EBL EBT EBR WBL WBT WBR NBU NBL NBT NBR SBU SBLLane ConfigurationsVolume (vph) 30 85 100 63 80 148 50 56 1390 132 2 105Ideal Flow (vphpl) 1900 1900 1900 1900 1900 1900 1900 1900 1900 1900 1900 1900Total Lost time (s) 5.0 5.0 5.0 5.0 4.5 4.5 4.0Lane Util. Factor 1.00 1.00 1.00 1.00 1.00 0.91 1.00Frpb, ped/bikes 1.00 0.97 1.00 0.98 1.00 1.00 1.00Flpb, ped/bikes 0.99 1.00 0.99 1.00 1.00 1.00 1.00Frt 1.00 0.92 1.00 0.85 1.00 0.99 1.00Flt Protected 0.95 1.00 0.98 1.00 0.95 1.00 0.95Satd. Flow (prot) 1775 1674 1797 1544 1787 5059 1787Flt Permitted 0.64 1.00 0.77 1.00 0.95 1.00 0.95Satd. Flow (perm) 1196 1674 1412 1544 1787 5059 1787Peak-hour factor, PHF 1.00 1.00 1.00 1.00 1.00 1.00 1.00 1.00 1.00 1.00 1.00 1.00Adj. Flow (vph) 30 85 100 63 80 148 50 56 1390 132 2 105RTOR Reduction (vph) 0 54 0 0 0 111 0 0 10 0 0 0Lane Group Flow (vph) 30 131 0 0 143 37 0 106 1512 0 0 107Confl. Peds. (#/hr) 10 49 49 10 7Confl. Bikes (#/hr) 6 5 1Heavy Vehicles (%) 1% 1% 1% 2% 2% 2% 1% 1% 1% 1% 1% 1%Turn Type Perm NA Perm NA Perm Prot Prot NA Prot ProtProtected Phases 4 8 5 5 2 1 1Permitted Phases 4 8 8Actuated Green, G (s) 22.2 22.2 22.2 22.2 7.2 44.3 10.0Effective Green, g (s) 22.2 22.2 22.2 22.2 7.2 44.3 10.0Actuated g/C Ratio 0.25 0.25 0.25 0.25 0.08 0.49 0.11Clearance Time (s) 5.0 5.0 5.0 5.0 4.5 4.5 4.0Vehicle Extension (s) 2.0 2.0 2.0 2.0 2.0 2.0 2.0Lane Grp Cap (vph) 295 412 348 380 142 2490 198v/s Ratio Prot 0.08 0.06 c0.30 0.06v/s Ratio Perm 0.03 c0.10 0.02v/c Ratio 0.10 0.32 0.41 0.10 0.75 0.61 0.54Uniform Delay, d1 26.2 27.7 28.4 26.2 40.5 16.5 37.8Progression Factor 1.00 1.00 1.00 1.00 0.99 1.05 0.77Incremental Delay, d2 0.1 0.2 0.3 0.0 8.7 0.5 1.5Delay (s) 26.3 27.9 28.7 26.2 49.0 18.0 30.5Level of Service C C C C D B CApproach Delay (s) 27.6 27.4 20.0Approach LOS C C B
Intersection SummaryHCM 2000 Control Delay 18.0 HCM 2000 Level of Service BHCM 2000 Volume to Capacity ratio 0.56Actuated Cycle Length (s) 90.0 Sum of lost time (s) 14.0Intersection Capacity Utilization 89.1% ICU Level of Service EAnalysis Period (min) 15c Critical Lane Group
HCM Signalized Intersection Capacity Analysis Children's Hospital10: MLK Way & 52nd Street Existing AM
Fehr & Peers Synchro 8 Report
Movement SBT SBRLane ConfigurationsVolume (vph) 1476 0Ideal Flow (vphpl) 1900 1900Total Lost time (s) 4.5Lane Util. Factor 0.91Frpb, ped/bikes 1.00Flpb, ped/bikes 1.00Frt 1.00Flt Protected 1.00Satd. Flow (prot) 5136Flt Permitted 1.00Satd. Flow (perm) 5136Peak-hour factor, PHF 1.00 1.00Adj. Flow (vph) 1476 0RTOR Reduction (vph) 0 0Lane Group Flow (vph) 1476 0Confl. Peds. (#/hr) 10Confl. Bikes (#/hr) 10Heavy Vehicles (%) 1% 1%Turn Type NAProtected Phases 6Permitted PhasesActuated Green, G (s) 46.6Effective Green, g (s) 46.6Actuated g/C Ratio 0.52Clearance Time (s) 4.5Vehicle Extension (s) 2.0Lane Grp Cap (vph) 2659v/s Ratio Prot c0.29v/s Ratio Permv/c Ratio 0.56Uniform Delay, d1 14.7Progression Factor 0.75Incremental Delay, d2 0.8Delay (s) 11.7Level of Service BApproach Delay (s) 13.0Approach LOS B
Intersection Summary

HCM Signalized Intersection Capacity Analysis Children's Hospital11: 52nd Street & Garage Existing AM
Fehr & Peers Synchro 8 Report
Movement EBL EBT EBR WBL WBT WBR NBL NBT NBR SBL SBT SBRLane ConfigurationsVolume (vph) 112 202 8 6 265 82 15 7 10 13 2 13Ideal Flow (vphpl) 1900 1900 1900 1900 1900 1900 1900 1900 1900 1900 1900 1900Total Lost time (s) 3.0 3.0 3.0 3.0Lane Util. Factor 0.95 0.95 1.00 1.00Frpb, ped/bikes 1.00 0.99 0.96 0.99Flpb, ped/bikes 1.00 1.00 1.00 0.94Frt 1.00 0.97 0.96 0.94Flt Protected 0.98 1.00 0.98 0.98Satd. Flow (prot) 3441 3432 1465 1629Flt Permitted 0.76 0.95 0.93 0.94Satd. Flow (perm) 2667 3263 1400 1562Peak-hour factor, PHF 1.00 1.00 1.00 1.00 1.00 1.00 1.00 1.00 1.00 1.00 1.00 1.00Adj. Flow (vph) 112 202 8 6 265 82 15 7 10 13 2 13RTOR Reduction (vph) 0 3 0 0 57 0 0 5 0 0 7 0Lane Group Flow (vph) 0 319 0 0 296 0 0 27 0 0 21 0Confl. Peds. (#/hr) 17 55 55 17 202 202Confl. Bikes (#/hr) 6 5 1Heavy Vehicles (%) 2% 2% 2% 0% 0% 0% 16% 16% 16% 0% 0% 0%Turn Type Prot NA Perm NA Perm NA Perm NAProtected Phases 5 2 6 4 8Permitted Phases 6 4 8Actuated Green, G (s) 21.0 14.0 23.0 23.0Effective Green, g (s) 21.0 14.0 23.0 23.0Actuated g/C Ratio 0.42 0.28 0.46 0.46Clearance Time (s) 3.0 3.0 3.0 3.0Lane Grp Cap (vph) 1182 913 644 718v/s Ratio Prot c0.02v/s Ratio Perm 0.09 c0.09 c0.02 0.01v/c Ratio 0.27 0.32 0.04 0.03Uniform Delay, d1 9.5 14.3 7.4 7.4Progression Factor 1.00 1.00 1.00 1.00Incremental Delay, d2 0.6 0.9 0.1 0.1Delay (s) 10.0 15.2 7.6 7.5Level of Service B B A AApproach Delay (s) 10.0 15.2 7.6 7.5Approach LOS B B A A
Intersection SummaryHCM 2000 Control Delay 12.3 HCM 2000 Level of Service BHCM 2000 Volume to Capacity ratio 0.16Actuated Cycle Length (s) 50.0 Sum of lost time (s) 9.0Intersection Capacity Utilization 52.5% ICU Level of Service AAnalysis Period (min) 15c Critical Lane Group
HCM Unsignalized Intersection Capacity Analysis Children's Hospital12: 52nd Street & Dover Street Existing AM
Fehr & Peers Synchro 8 Report
Movement EBL EBT EBR WBL WBT WBR NBL NBT NBR SBL SBT SBRLane ConfigurationsVolume (veh/h) 19 202 1 11 324 27 3 0 7 30 3 23Sign Control Free Free Stop StopGrade 0% 0% 0% 0%Peak Hour Factor 1.00 1.00 1.00 1.00 1.00 1.00 1.00 1.00 1.00 1.00 1.00 1.00Hourly flow rate (vph) 19 202 1 11 324 27 3 0 7 30 3 23Pedestrians 20 10 12 23Lane Width (ft) 12.0 12.0 12.0 12.0Walking Speed (ft/s) 4.0 4.0 4.0 4.0Percent Blockage 2 1 1 2Right turn flare (veh)Median type None NoneMedian storage veh)Upstream signal (ft) 312 647pX, platoon unblocked 0.94 0.96 0.96 0.96 0.96 0.96 0.96 0.94vC, conflicting volume 374 215 656 648 224 640 636 380vC1, stage 1 conf volvC2, stage 2 conf volvCu, unblocked vol 297 157 519 510 167 501 497 304tC, single (s) 4.1 4.1 7.2 6.6 6.3 7.1 6.5 6.2tC, 2 stage (s)tF (s) 2.2 2.2 3.6 4.1 3.4 3.5 4.0 3.3p0 queue free % 98 99 99 100 99 93 99 97cM capacity (veh/h) 1155 1353 391 413 805 428 433 668
Direction, Lane # EB 1 WB 1 NB 1 SB 1Volume Total 222 362 10 56Volume Left 19 11 3 30Volume Right 1 27 7 23cSH 1155 1353 611 503Volume to Capacity 0.02 0.01 0.02 0.11Queue Length 95th (ft) 1 1 1 9Control Delay (s) 0.8 0.3 11.0 13.1Lane LOS A A B BApproach Delay (s) 0.8 0.3 11.0 13.1Approach LOS B B
Intersection SummaryAverage Delay 1.8Intersection Capacity Utilization 37.9% ICU Level of Service AAnalysis Period (min) 15
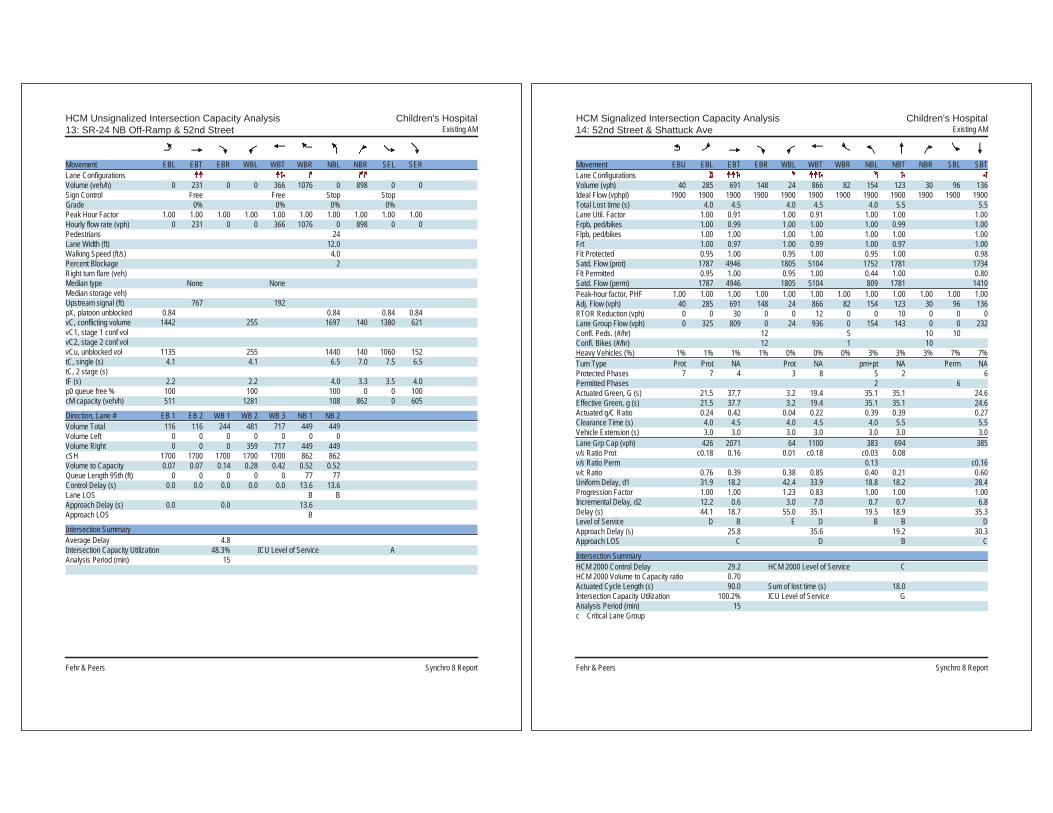
HCM Unsignalized Intersection Capacity Analysis Children's Hospital13: SR-24 NB Off-Ramp & 52nd Street Existing AM
Fehr & Peers Synchro 8 Report
Movement EBL EBT EBR WBL WBT WBR NBL NBR SEL SERLane ConfigurationsVolume (veh/h) 0 231 0 0 366 1076 0 898 0 0Sign Control Free Free Stop StopGrade 0% 0% 0% 0%Peak Hour Factor 1.00 1.00 1.00 1.00 1.00 1.00 1.00 1.00 1.00 1.00Hourly flow rate (vph) 0 231 0 0 366 1076 0 898 0 0Pedestrians 24Lane Width (ft) 12.0Walking Speed (ft/s) 4.0Percent Blockage 2Right turn flare (veh)Median type None NoneMedian storage veh)Upstream signal (ft) 767 192pX, platoon unblocked 0.84 0.84 0.84 0.84vC, conflicting volume 1442 255 1697 140 1380 621vC1, stage 1 conf volvC2, stage 2 conf volvCu, unblocked vol 1135 255 1440 140 1060 152tC, single (s) 4.1 4.1 6.5 7.0 7.5 6.5tC, 2 stage (s)tF (s) 2.2 2.2 4.0 3.3 3.5 4.0p0 queue free % 100 100 100 0 0 100cM capacity (veh/h) 511 1281 108 862 0 605
Direction, Lane # EB 1 EB 2 WB 1 WB 2 WB 3 NB 1 NB 2Volume Total 116 116 244 481 717 449 449Volume Left 0 0 0 0 0 0 0Volume Right 0 0 0 359 717 449 449cSH 1700 1700 1700 1700 1700 862 862Volume to Capacity 0.07 0.07 0.14 0.28 0.42 0.52 0.52Queue Length 95th (ft) 0 0 0 0 0 77 77Control Delay (s) 0.0 0.0 0.0 0.0 0.0 13.6 13.6Lane LOS B BApproach Delay (s) 0.0 0.0 13.6Approach LOS B
Intersection SummaryAverage Delay 4.8Intersection Capacity Utilization 48.3% ICU Level of Service AAnalysis Period (min) 15
HCM Signalized Intersection Capacity Analysis Children's Hospital14: 52nd Street & Shattuck Ave Existing AM
Fehr & Peers Synchro 8 Report
Movement EBU EBL EBT EBR WBL WBT WBR NBL NBT NBR SBL SBTLane ConfigurationsVolume (vph) 40 285 691 148 24 866 82 154 123 30 96 136Ideal Flow (vphpl) 1900 1900 1900 1900 1900 1900 1900 1900 1900 1900 1900 1900Total Lost time (s) 4.0 4.5 4.0 4.5 4.0 5.5 5.5Lane Util. Factor 1.00 0.91 1.00 0.91 1.00 1.00 1.00Frpb, ped/bikes 1.00 0.99 1.00 1.00 1.00 0.99 1.00Flpb, ped/bikes 1.00 1.00 1.00 1.00 1.00 1.00 1.00Frt 1.00 0.97 1.00 0.99 1.00 0.97 1.00Flt Protected 0.95 1.00 0.95 1.00 0.95 1.00 0.98Satd. Flow (prot) 1787 4946 1805 5104 1752 1781 1734Flt Permitted 0.95 1.00 0.95 1.00 0.44 1.00 0.80Satd. Flow (perm) 1787 4946 1805 5104 809 1781 1410Peak-hour factor, PHF 1.00 1.00 1.00 1.00 1.00 1.00 1.00 1.00 1.00 1.00 1.00 1.00Adj. Flow (vph) 40 285 691 148 24 866 82 154 123 30 96 136RTOR Reduction (vph) 0 0 30 0 0 12 0 0 10 0 0 0Lane Group Flow (vph) 0 325 809 0 24 936 0 154 143 0 0 232Confl. Peds. (#/hr) 12 5 10 10Confl. Bikes (#/hr) 12 1 10Heavy Vehicles (%) 1% 1% 1% 1% 0% 0% 0% 3% 3% 3% 7% 7%Turn Type Prot Prot NA Prot NA pm+pt NA Perm NAProtected Phases 7 7 4 3 8 5 2 6Permitted Phases 2 6Actuated Green, G (s) 21.5 37.7 3.2 19.4 35.1 35.1 24.6Effective Green, g (s) 21.5 37.7 3.2 19.4 35.1 35.1 24.6Actuated g/C Ratio 0.24 0.42 0.04 0.22 0.39 0.39 0.27Clearance Time (s) 4.0 4.5 4.0 4.5 4.0 5.5 5.5Vehicle Extension (s) 3.0 3.0 3.0 3.0 3.0 3.0 3.0Lane Grp Cap (vph) 426 2071 64 1100 383 694 385v/s Ratio Prot c0.18 0.16 0.01 c0.18 c0.03 0.08v/s Ratio Perm 0.13 c0.16v/c Ratio 0.76 0.39 0.38 0.85 0.40 0.21 0.60Uniform Delay, d1 31.9 18.2 42.4 33.9 18.8 18.2 28.4Progression Factor 1.00 1.00 1.23 0.83 1.00 1.00 1.00Incremental Delay, d2 12.2 0.6 3.0 7.0 0.7 0.7 6.8Delay (s) 44.1 18.7 55.0 35.1 19.5 18.9 35.3Level of Service D B E D B B DApproach Delay (s) 25.8 35.6 19.2 30.3Approach LOS C D B C
Intersection SummaryHCM 2000 Control Delay 29.2 HCM 2000 Level of Service CHCM 2000 Volume to Capacity ratio 0.70Actuated Cycle Length (s) 90.0 Sum of lost time (s) 18.0Intersection Capacity Utilization 100.2% ICU Level of Service GAnalysis Period (min) 15c Critical Lane Group

HCM Signalized Intersection Capacity Analysis Children's Hospital14: 52nd Street & Shattuck Ave Existing AM
Fehr & Peers Synchro 8 Report
Movement SBRLane ConfigurationsVolume (vph) 376Ideal Flow (vphpl) 1900Total Lost time (s) 5.5Lane Util. Factor 1.00Frpb, ped/bikes 0.94Flpb, ped/bikes 1.00Frt 0.85Flt Protected 1.00Satd. Flow (prot) 1419Flt Permitted 1.00Satd. Flow (perm) 1419Peak-hour factor, PHF 1.00Adj. Flow (vph) 376RTOR Reduction (vph) 273Lane Group Flow (vph) 103Confl. Peds. (#/hr) 16Confl. Bikes (#/hr) 41Heavy Vehicles (%) 7%Turn Type PermProtected PhasesPermitted Phases 6Actuated Green, G (s) 24.6Effective Green, g (s) 24.6Actuated g/C Ratio 0.27Clearance Time (s) 5.5Vehicle Extension (s) 3.0Lane Grp Cap (vph) 387v/s Ratio Protv/s Ratio Perm 0.07v/c Ratio 0.27Uniform Delay, d1 25.6Progression Factor 1.00Incremental Delay, d2 1.7Delay (s) 27.3Level of Service CApproach Delay (s)Approach LOS
Intersection Summary
HCM Signalized Intersection Capacity Analysis Children's Hospital15: Telegraph Ave & 52nd Street/Claremont Ave Existing AM
Fehr & Peers Synchro 8 Report
Movement EBL EBT EBR WBL WBT WBR NBL NBT NBR SBL SBT SBRLane ConfigurationsVolume (vph) 6 0 6 94 52 154 0 665 117 64 598 269Ideal Flow (vphpl) 1900 1900 1900 1900 1900 1900 1900 1900 1900 1900 1900 1900Lane Width 12 12 12 12 12 12 12 16 12 12 12 12Total Lost time (s) 4.5 4.5 4.5 4.5 4.5 4.5Lane Util. Factor 1.00 0.95 0.95 0.95 1.00 0.95Frpb, ped/bikes 0.98 1.00 0.99 0.99 1.00 0.97Flpb, ped/bikes 1.00 1.00 1.00 1.00 1.00 1.00Frt 0.93 1.00 0.89 0.98 1.00 0.95Flt Protected 0.98 0.95 1.00 1.00 0.95 1.00Satd. Flow (prot) 1576 1698 1569 3853 1770 3282Flt Permitted 0.98 0.95 1.00 1.00 0.95 1.00Satd. Flow (perm) 1576 1698 1569 3853 1770 3282Peak-hour factor, PHF 1.00 1.00 1.00 1.00 1.00 1.00 1.00 1.00 1.00 1.00 1.00 1.00Adj. Flow (vph) 6 0 6 94 52 154 0 665 117 64 598 269RTOR Reduction (vph) 0 12 0 0 119 0 0 10 0 0 36 0Lane Group Flow (vph) 0 0 0 85 96 0 0 772 0 64 831 0Confl. Peds. (#/hr) 4 4 22 18 22Confl. Bikes (#/hr) 1 2 33 27Heavy Vehicles (%) 8% 8% 8% 1% 1% 1% 3% 3% 3% 2% 2% 2%Turn Type Split NA Split NA Perm NA Prot NAProtected Phases 4 4 8 8 2 1 6Permitted Phases 2Actuated Green, G (s) 1.1 15.4 15.4 48.2 7.3 60.0Effective Green, g (s) 1.1 15.4 15.4 48.2 7.3 60.0Actuated g/C Ratio 0.01 0.17 0.17 0.54 0.08 0.67Clearance Time (s) 4.5 4.5 4.5 4.5 4.5 4.5Vehicle Extension (s) 3.0 3.0 3.0 3.0 3.0 3.0Lane Grp Cap (vph) 19 290 268 2063 143 2188v/s Ratio Prot c0.00 0.05 c0.06 0.20 0.04 c0.25v/s Ratio Permv/c Ratio 0.01 0.29 0.36 0.37 0.45 0.38Uniform Delay, d1 43.9 32.6 32.9 12.1 39.4 6.7Progression Factor 1.00 1.00 1.00 0.97 1.00 1.00Incremental Delay, d2 0.1 0.6 0.8 0.5 2.2 0.5Delay (s) 44.0 33.1 33.8 12.2 41.7 7.2Level of Service D C C B D AApproach Delay (s) 44.0 33.6 12.2 9.6Approach LOS D C B A
Intersection SummaryHCM 2000 Control Delay 14.3 HCM 2000 Level of Service BHCM 2000 Volume to Capacity ratio 0.39Actuated Cycle Length (s) 90.0 Sum of lost time (s) 18.0Intersection Capacity Utilization 70.2% ICU Level of Service CAnalysis Period (min) 15c Critical Lane Group

HCM Signalized Intersection Capacity Analysis Children's Hospital16: Telegraph Ave & 51St Street Existing AM
Fehr & Peers Synchro 8 Report
Movement EBL EBT EBR WBL WBT WBR NBL NBT NBR SBL SBT SBRLane ConfigurationsVolume (vph) 228 488 68 101 530 238 90 320 58 147 511 38Ideal Flow (vphpl) 1900 1900 1900 1900 1900 1900 1900 1900 1900 1900 1900 1900Total Lost time (s) 4.0 4.0 4.0 3.5 4.0 4.5 4.0 3.5Lane Util. Factor 0.97 0.95 1.00 0.95 1.00 0.95 1.00 0.95Frpb, ped/bikes 1.00 0.99 1.00 0.98 1.00 0.99 1.00 0.99Flpb, ped/bikes 1.00 1.00 1.00 1.00 1.00 1.00 1.00 1.00Frt 1.00 0.98 1.00 0.95 1.00 0.98 1.00 0.99Flt Protected 0.95 1.00 0.95 1.00 0.95 1.00 0.95 1.00Satd. Flow (prot) 3400 3417 1787 3349 1719 3324 1752 3447Flt Permitted 0.95 1.00 0.95 1.00 0.95 1.00 0.95 1.00Satd. Flow (perm) 3400 3417 1787 3349 1719 3324 1752 3447Peak-hour factor, PHF 1.00 1.00 1.00 1.00 1.00 1.00 1.00 1.00 1.00 1.00 1.00 1.00Adj. Flow (vph) 228 488 68 101 530 238 90 320 58 147 511 38RTOR Reduction (vph) 0 12 0 0 56 0 0 16 0 0 5 0Lane Group Flow (vph) 228 544 0 101 712 0 90 362 0 147 544 0Confl. Peds. (#/hr) 31 31 30 37Confl. Bikes (#/hr) 9 7 27 27Heavy Vehicles (%) 3% 3% 3% 1% 1% 1% 5% 5% 5% 3% 3% 3%Turn Type Prot NA Prot NA Prot NA Prot NAProtected Phases 7 4 3 8 5 2 1 6Permitted PhasesActuated Green, G (s) 11.2 29.0 8.6 26.9 8.4 24.9 11.0 28.5Effective Green, g (s) 11.2 29.0 8.6 26.9 8.4 24.9 11.0 28.5Actuated g/C Ratio 0.12 0.32 0.10 0.30 0.09 0.28 0.12 0.32Clearance Time (s) 4.0 4.0 4.0 3.5 4.0 4.5 4.0 3.5Vehicle Extension (s) 3.0 3.0 3.0 3.0 3.0 3.0 3.0 3.0Lane Grp Cap (vph) 423 1101 170 1000 160 919 214 1091v/s Ratio Prot c0.07 c0.16 0.06 c0.21 0.05 0.11 c0.08 c0.16v/s Ratio Permv/c Ratio 0.54 0.49 0.59 0.71 0.56 0.39 0.69 0.50Uniform Delay, d1 37.0 24.6 39.0 28.1 39.0 26.4 37.8 24.9Progression Factor 1.29 0.79 1.00 1.00 1.00 1.00 1.01 0.86Incremental Delay, d2 1.2 1.5 5.5 4.3 4.5 1.3 8.5 1.6Delay (s) 49.0 21.0 44.5 32.4 43.5 27.7 46.7 23.1Level of Service D C D C D C D CApproach Delay (s) 29.1 33.8 30.7 28.1Approach LOS C C C C
Intersection SummaryHCM 2000 Control Delay 30.6 HCM 2000 Level of Service CHCM 2000 Volume to Capacity ratio 0.62Actuated Cycle Length (s) 90.0 Sum of lost time (s) 16.5Intersection Capacity Utilization 69.9% ICU Level of Service CAnalysis Period (min) 15c Critical Lane Group
HCM Signalized Intersection Capacity Analysis Children's Hospital17: SB SR-24 On-Ramp & MLK Way & NB SR-24 Off-Ramp Existing AM
Fehr & Peers Synchro 8 Report
Movement EBL EBT EBR WBL WBT WBR NBL NBT NBR SBL SBT SBRLane ConfigurationsVolume (vph) 148 0 0 0 0 1501 0 0 0 0 1417 233Ideal Flow (vphpl) 1900 1900 1900 1900 1900 1900 1900 1900 1900 1900 1900 1900Total Lost time (s) 4.0 4.0 4.0 4.0Lane Util. Factor 0.97 1.00 0.95 0.88Frpb, ped/bikes 1.00 1.00 1.00 1.00Flpb, ped/bikes 1.00 1.00 1.00 1.00Frt 1.00 0.86 1.00 0.85Flt Protected 0.95 1.00 1.00 1.00Satd. Flow (prot) 3273 1627 3574 2814Flt Permitted 0.95 1.00 1.00 1.00Satd. Flow (perm) 3273 1627 3574 2814Peak-hour factor, PHF 1.00 1.00 1.00 1.00 1.00 1.00 1.00 1.00 1.00 1.00 1.00 1.00Adj. Flow (vph) 148 0 0 0 0 1501 0 0 0 0 1417 233RTOR Reduction (vph) 0 0 0 0 0 0 0 0 0 0 0 0Lane Group Flow (vph) 148 0 0 0 0 1501 0 0 0 0 1417 233Confl. Bikes (#/hr) 2Heavy Vehicles (%) 7% 7% 2% 2% 1% 1% 2% 2% 2% 2% 1% 1%Turn Type Prot Free NA customProtected Phases 2 6 FreePermitted Phases FreeActuated Green, G (s) 8.0 45.0 29.0 45.0Effective Green, g (s) 8.0 45.0 29.0 45.0Actuated g/C Ratio 0.18 1.00 0.64 1.00Clearance Time (s) 4.0 4.0Lane Grp Cap (vph) 581 1627 2303 2814v/s Ratio Prot 0.05 0.40 0.08v/s Ratio Perm c0.92v/c Ratio 0.25 0.92 0.62 0.08Uniform Delay, d1 15.9 0.0 4.7 0.0Progression Factor 1.00 1.00 1.73 1.00Incremental Delay, d2 1.1 10.2 1.1 0.0Delay (s) 17.0 10.2 9.2 0.0Level of Service B B A AApproach Delay (s) 17.0 10.2 0.0 7.9Approach LOS B B A A
Intersection SummaryHCM 2000 Control Delay 9.4 HCM 2000 Level of Service AHCM 2000 Volume to Capacity ratio 1.12Actuated Cycle Length (s) 45.0 Sum of lost time (s) 8.0Intersection Capacity Utilization 50.1% ICU Level of Service AAnalysis Period (min) 15c Critical Lane Group

HCM Unsignalized Intersection Capacity Analysis Children's Hospital18: West Street & 52nd Street Existing AM
Fehr & Peers Synchro 8 Report
Movement EBL EBT EBR WBL WBT WBR NBL NBT NBR SBL SBT SBRLane ConfigurationsSign Control Stop Stop Stop StopVolume (vph) 0 159 10 57 72 0 22 0 71 2 43 5Peak Hour Factor 1.00 1.00 1.00 1.00 1.00 1.00 1.00 1.00 1.00 1.00 1.00 1.00Hourly flow rate (vph) 0 159 10 57 72 0 22 0 71 2 43 5
Direction, Lane # EB 1 WB 1 NB 1 NB 2 SB 1Volume Total (vph) 169 129 22 71 50Volume Left (vph) 0 57 22 0 2Volume Right (vph) 10 0 0 71 5Hadj (s) -0.02 0.12 0.50 -0.70 -0.02Departure Headway (s) 4.4 4.6 5.7 4.5 4.8Degree Utilization, x 0.21 0.16 0.04 0.09 0.07Capacity (veh/h) 792 751 591 739 693Control Delay (s) 8.5 8.4 7.8 6.8 8.1Approach Delay (s) 8.5 8.4 7.0 8.1Approach LOS A A A A
Intersection SummaryDelay 8.1Level of Service AIntersection Capacity Utilization 36.2% ICU Level of Service AAnalysis Period (min) 15
HCM Unsignalized Intersection Capacity Analysis Children's Hospital19: Genoa Street & 52nd Street Existing AM
Fehr & Peers Synchro 8 Report
Movement EBL EBT EBR WBL WBT WBR NBL NBT NBR SBL SBT SBRLane ConfigurationsSign Control Stop Stop Stop StopVolume (vph) 5 144 1 4 77 20 1 0 3 15 0 3Peak Hour Factor 1.00 1.00 1.00 1.00 1.00 1.00 1.00 1.00 1.00 1.00 1.00 1.00Hourly flow rate (vph) 5 144 1 4 77 20 1 0 3 15 0 3
Direction, Lane # EB 1 WB 1 NB 1 SB 1Volume Total (vph) 150 101 4 18Volume Left (vph) 5 4 1 15Volume Right (vph) 1 20 3 3Hadj (s) 0.02 -0.11 -0.40 0.07Departure Headway (s) 4.1 4.0 4.1 4.5Degree Utilization, x 0.17 0.11 0.00 0.02Capacity (veh/h) 872 890 827 744Control Delay (s) 7.9 7.5 7.1 7.6Approach Delay (s) 7.9 7.5 7.1 7.6Approach LOS A A A A
Intersection SummaryDelay 7.7Level of Service AIntersection Capacity Utilization 21.4% ICU Level of Service AAnalysis Period (min) 15

HCM Unsignalized Intersection Capacity Analysis Children's Hospital20: Genoa Street & 55th Street Existing AM
Fehr & Peers Synchro 8 Report
Movement EBL EBT EBR WBL WBT WBR NBL NBT NBR SBL SBT SBRLane ConfigurationsVolume (veh/h) 2 354 0 4 312 10 6 11 14 32 12 8Sign Control Free Free Stop StopGrade 0% 0% 0% 0%Peak Hour Factor 1.00 1.00 1.00 1.00 1.00 1.00 1.00 1.00 1.00 1.00 1.00 1.00Hourly flow rate (vph) 2 354 0 4 312 10 6 11 14 32 12 8Pedestrians 8 2 10 11Lane Width (ft) 12.0 12.0 12.0 12.0Walking Speed (ft/s) 4.0 4.0 4.0 4.0Percent Blockage 1 0 1 1Right turn flare (veh)Median type None NoneMedian storage veh)Upstream signal (ft) 721pX, platoon unblockedvC, conflicting volume 333 364 715 709 366 716 704 336vC1, stage 1 conf volvC2, stage 2 conf volvCu, unblocked vol 333 364 715 709 366 716 704 336tC, single (s) 4.1 4.1 7.1 6.5 6.2 7.1 6.5 6.2tC, 2 stage (s)tF (s) 2.2 2.2 3.5 4.0 3.3 3.5 4.0 3.3p0 queue free % 100 100 98 97 98 90 97 99cM capacity (veh/h) 1221 1196 325 353 677 321 353 695
Direction, Lane # EB 1 WB 1 NB 1 SB 1Volume Total 356 326 31 52Volume Left 2 4 6 32Volume Right 0 10 14 8cSH 1221 1196 441 358Volume to Capacity 0.00 0.00 0.07 0.15Queue Length 95th (ft) 0 0 6 13Control Delay (s) 0.1 0.1 13.8 16.7Lane LOS A A B CApproach Delay (s) 0.1 0.1 13.8 16.7Approach LOS B C
Intersection SummaryAverage Delay 1.8Intersection Capacity Utilization 35.4% ICU Level of Service AAnalysis Period (min) 15
HCM Signalized Intersection Capacity Analysis Children's Hospital 1: MLK Way & 55th Street Existing PM
Fehr & Peers Synchro 8 Report
Movement EBL EBT EBR WBL WBT WBR NBU NBL NBT NBR SBL SBTLane ConfigurationsVolume (vph) 12 247 161 49 137 42 13 197 1578 87 86 1294Ideal Flow (vphpl) 1900 1900 1900 1900 1900 1900 1900 1900 1900 1900 1900 1900Total Lost time (s) 5.0 5.0 4.5 5.0 4.5 5.0Lane Util. Factor 1.00 1.00 1.00 0.91 1.00 0.91Frpb, ped/bikes 0.99 0.99 1.00 1.00 1.00 1.00Flpb, ped/bikes 1.00 1.00 1.00 1.00 1.00 1.00Frt 0.95 0.98 1.00 0.99 1.00 1.00Flt Protected 1.00 0.99 0.95 1.00 0.95 1.00Satd. Flow (prot) 1756 1751 1770 5026 1770 5074Flt Permitted 0.99 0.70 0.95 1.00 0.95 1.00Satd. Flow (perm) 1739 1233 1770 5026 1770 5074Peak-hour factor, PHF 1.00 1.00 1.00 1.00 1.00 1.00 1.00 1.00 1.00 1.00 1.00 1.00Adj. Flow (vph) 12 247 161 49 137 42 13 197 1578 87 86 1294RTOR Reduction (vph) 0 24 0 0 9 0 0 0 5 0 0 1Lane Group Flow (vph) 0 396 0 0 219 0 0 210 1660 0 86 1307Confl. Peds. (#/hr) 11 15 15 11 12 20 20Confl. Bikes (#/hr) 16 12 15Heavy Vehicles (%) 1% 1% 1% 4% 4% 4% 2% 2% 2% 2% 2% 2%Turn Type Perm NA Perm NA Prot Prot NA Prot NAProtected Phases 4 8 5 5 2 1 6Permitted Phases 4 8Actuated Green, G (s) 28.2 28.2 22.4 48.9 8.4 34.9Effective Green, g (s) 28.2 28.2 22.4 48.9 8.4 34.9Actuated g/C Ratio 0.28 0.28 0.22 0.49 0.08 0.35Clearance Time (s) 5.0 5.0 4.5 5.0 4.5 5.0Vehicle Extension (s) 3.0 3.0 3.0 3.0 3.0 3.0Lane Grp Cap (vph) 490 347 396 2457 148 1770v/s Ratio Prot 0.12 c0.33 0.05 c0.26v/s Ratio Perm c0.23 0.18v/c Ratio 0.81 0.63 0.53 0.68 0.58 0.74Uniform Delay, d1 33.4 31.3 34.2 19.5 44.1 28.5Progression Factor 1.00 1.00 0.48 0.32 1.00 1.00Incremental Delay, d2 9.4 3.7 1.2 1.3 5.7 2.8Delay (s) 42.8 35.0 17.4 7.5 49.8 31.3Level of Service D D B A D CApproach Delay (s) 42.8 35.0 8.6 32.5Approach LOS D D A C
Intersection SummaryHCM 2000 Control Delay 22.3 HCM 2000 Level of Service CHCM 2000 Volume to Capacity ratio 0.76Actuated Cycle Length (s) 100.0 Sum of lost time (s) 14.5Intersection Capacity Utilization 84.9% ICU Level of Service EAnalysis Period (min) 15c Critical Lane Group

HCM Signalized Intersection Capacity Analysis Children's Hospital 1: MLK Way & 55th Street Existing PM
Fehr & Peers Synchro 8 Report
Movement SBRLane ConfigurationsVolume (vph) 14Ideal Flow (vphpl) 1900Total Lost time (s)Lane Util. FactorFrpb, ped/bikesFlpb, ped/bikesFrtFlt ProtectedSatd. Flow (prot)Flt PermittedSatd. Flow (perm)Peak-hour factor, PHF 1.00Adj. Flow (vph) 14RTOR Reduction (vph) 0Lane Group Flow (vph) 0Confl. Peds. (#/hr) 12Confl. Bikes (#/hr) 15Heavy Vehicles (%) 2%Turn TypeProtected PhasesPermitted PhasesActuated Green, G (s)Effective Green, g (s)Actuated g/C RatioClearance Time (s)Vehicle Extension (s)Lane Grp Cap (vph)v/s Ratio Protv/s Ratio Permv/c RatioUniform Delay, d1Progression FactorIncremental Delay, d2Delay (s)Level of ServiceApproach Delay (s)Approach LOS
Intersection Summary
HCM Unsignalized Intersection Capacity Analysis Children's Hospital 2: Dover Street & 55th Street Existing PM
Fehr & Peers Synchro 8 Report
Movement EBL EBT EBR WBL WBT WBR NBL NBT NBR SBL SBT SBRLane ConfigurationsVolume (veh/h) 17 390 9 6 174 9 12 12 22 11 9 30Sign Control Free Free Stop StopGrade 0% 0% 0% 0%Peak Hour Factor 1.00 1.00 1.00 1.00 1.00 1.00 1.00 1.00 1.00 1.00 1.00 1.00Hourly flow rate (vph) 17 390 9 6 174 9 12 12 22 11 9 30Pedestrians 4 13 7 17Lane Width (ft) 12.0 12.0 12.0 12.0Walking Speed (ft/s) 4.0 4.0 4.0 4.0Percent Blockage 0 1 1 1Right turn flare (veh)Median type None NoneMedian storage veh)Upstream signal (ft) 641 677pX, platoon unblocked 0.99 0.99 0.99 0.99 0.99 0.99vC, conflicting volume 200 406 664 648 414 677 648 200vC1, stage 1 conf volvC2, stage 2 conf volvCu, unblocked vol 200 391 653 636 400 666 636 200tC, single (s) 4.1 4.1 7.1 6.5 6.2 7.1 6.5 6.2tC, 2 stage (s)tF (s) 2.2 2.2 3.5 4.0 3.3 3.5 4.0 3.3p0 queue free % 99 99 97 97 97 97 98 96cM capacity (veh/h) 1335 1134 344 378 635 327 374 824
Direction, Lane # EB 1 WB 1 NB 1 SB 1Volume Total 416 189 46 50Volume Left 17 6 12 11Volume Right 9 9 22 30cSH 1335 1134 454 532Volume to Capacity 0.01 0.01 0.10 0.09Queue Length 95th (ft) 1 0 8 8Control Delay (s) 0.4 0.3 13.8 12.5Lane LOS A A B BApproach Delay (s) 0.4 0.3 13.8 12.5Approach LOS B B
Intersection SummaryAverage Delay 2.1Intersection Capacity Utilization 42.5% ICU Level of Service AAnalysis Period (min) 15
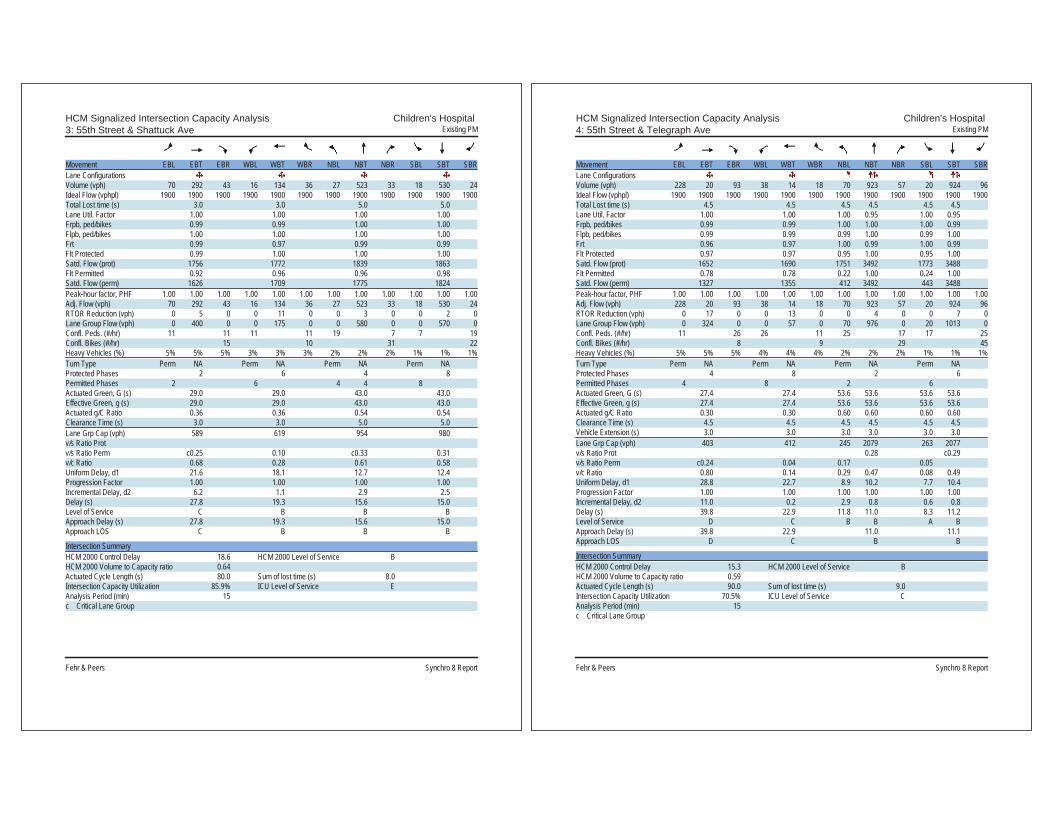
HCM Signalized Intersection Capacity Analysis Children's Hospital 3: 55th Street & Shattuck Ave Existing PM
Fehr & Peers Synchro 8 Report
Movement EBL EBT EBR WBL WBT WBR NBL NBT NBR SBL SBT SBRLane ConfigurationsVolume (vph) 70 292 43 16 134 36 27 523 33 18 530 24Ideal Flow (vphpl) 1900 1900 1900 1900 1900 1900 1900 1900 1900 1900 1900 1900Total Lost time (s) 3.0 3.0 5.0 5.0Lane Util. Factor 1.00 1.00 1.00 1.00Frpb, ped/bikes 0.99 0.99 1.00 1.00Flpb, ped/bikes 1.00 1.00 1.00 1.00Frt 0.99 0.97 0.99 0.99Flt Protected 0.99 1.00 1.00 1.00Satd. Flow (prot) 1756 1772 1839 1863Flt Permitted 0.92 0.96 0.96 0.98Satd. Flow (perm) 1626 1709 1775 1824Peak-hour factor, PHF 1.00 1.00 1.00 1.00 1.00 1.00 1.00 1.00 1.00 1.00 1.00 1.00Adj. Flow (vph) 70 292 43 16 134 36 27 523 33 18 530 24RTOR Reduction (vph) 0 5 0 0 11 0 0 3 0 0 2 0Lane Group Flow (vph) 0 400 0 0 175 0 0 580 0 0 570 0Confl. Peds. (#/hr) 11 11 11 11 19 7 7 19Confl. Bikes (#/hr) 15 10 31 22Heavy Vehicles (%) 5% 5% 5% 3% 3% 3% 2% 2% 2% 1% 1% 1%Turn Type Perm NA Perm NA Perm NA Perm NAProtected Phases 2 6 4 8Permitted Phases 2 6 4 4 8Actuated Green, G (s) 29.0 29.0 43.0 43.0Effective Green, g (s) 29.0 29.0 43.0 43.0Actuated g/C Ratio 0.36 0.36 0.54 0.54Clearance Time (s) 3.0 3.0 5.0 5.0Lane Grp Cap (vph) 589 619 954 980v/s Ratio Protv/s Ratio Perm c0.25 0.10 c0.33 0.31v/c Ratio 0.68 0.28 0.61 0.58Uniform Delay, d1 21.6 18.1 12.7 12.4Progression Factor 1.00 1.00 1.00 1.00Incremental Delay, d2 6.2 1.1 2.9 2.5Delay (s) 27.8 19.3 15.6 15.0Level of Service C B B BApproach Delay (s) 27.8 19.3 15.6 15.0Approach LOS C B B B
Intersection SummaryHCM 2000 Control Delay 18.6 HCM 2000 Level of Service BHCM 2000 Volume to Capacity ratio 0.64Actuated Cycle Length (s) 80.0 Sum of lost time (s) 8.0Intersection Capacity Utilization 85.9% ICU Level of Service EAnalysis Period (min) 15c Critical Lane Group
HCM Signalized Intersection Capacity Analysis Children's Hospital 4: 55th Street & Telegraph Ave Existing PM
Fehr & Peers Synchro 8 Report
Movement EBL EBT EBR WBL WBT WBR NBL NBT NBR SBL SBT SBRLane ConfigurationsVolume (vph) 228 20 93 38 14 18 70 923 57 20 924 96Ideal Flow (vphpl) 1900 1900 1900 1900 1900 1900 1900 1900 1900 1900 1900 1900Total Lost time (s) 4.5 4.5 4.5 4.5 4.5 4.5Lane Util. Factor 1.00 1.00 1.00 0.95 1.00 0.95Frpb, ped/bikes 0.99 0.99 1.00 1.00 1.00 0.99Flpb, ped/bikes 0.99 0.99 0.99 1.00 0.99 1.00Frt 0.96 0.97 1.00 0.99 1.00 0.99Flt Protected 0.97 0.97 0.95 1.00 0.95 1.00Satd. Flow (prot) 1652 1690 1751 3492 1773 3488Flt Permitted 0.78 0.78 0.22 1.00 0.24 1.00Satd. Flow (perm) 1327 1355 412 3492 443 3488Peak-hour factor, PHF 1.00 1.00 1.00 1.00 1.00 1.00 1.00 1.00 1.00 1.00 1.00 1.00Adj. Flow (vph) 228 20 93 38 14 18 70 923 57 20 924 96RTOR Reduction (vph) 0 17 0 0 13 0 0 4 0 0 7 0Lane Group Flow (vph) 0 324 0 0 57 0 70 976 0 20 1013 0Confl. Peds. (#/hr) 11 26 26 11 25 17 17 25Confl. Bikes (#/hr) 8 9 29 45Heavy Vehicles (%) 5% 5% 5% 4% 4% 4% 2% 2% 2% 1% 1% 1%Turn Type Perm NA Perm NA Perm NA Perm NAProtected Phases 4 8 2 6Permitted Phases 4 8 2 6Actuated Green, G (s) 27.4 27.4 53.6 53.6 53.6 53.6Effective Green, g (s) 27.4 27.4 53.6 53.6 53.6 53.6Actuated g/C Ratio 0.30 0.30 0.60 0.60 0.60 0.60Clearance Time (s) 4.5 4.5 4.5 4.5 4.5 4.5Vehicle Extension (s) 3.0 3.0 3.0 3.0 3.0 3.0Lane Grp Cap (vph) 403 412 245 2079 263 2077v/s Ratio Prot 0.28 c0.29v/s Ratio Perm c0.24 0.04 0.17 0.05v/c Ratio 0.80 0.14 0.29 0.47 0.08 0.49Uniform Delay, d1 28.8 22.7 8.9 10.2 7.7 10.4Progression Factor 1.00 1.00 1.00 1.00 1.00 1.00Incremental Delay, d2 11.0 0.2 2.9 0.8 0.6 0.8Delay (s) 39.8 22.9 11.8 11.0 8.3 11.2Level of Service D C B B A BApproach Delay (s) 39.8 22.9 11.0 11.1Approach LOS D C B B
Intersection SummaryHCM 2000 Control Delay 15.3 HCM 2000 Level of Service BHCM 2000 Volume to Capacity ratio 0.59Actuated Cycle Length (s) 90.0 Sum of lost time (s) 9.0Intersection Capacity Utilization 70.5% ICU Level of Service CAnalysis Period (min) 15c Critical Lane Group
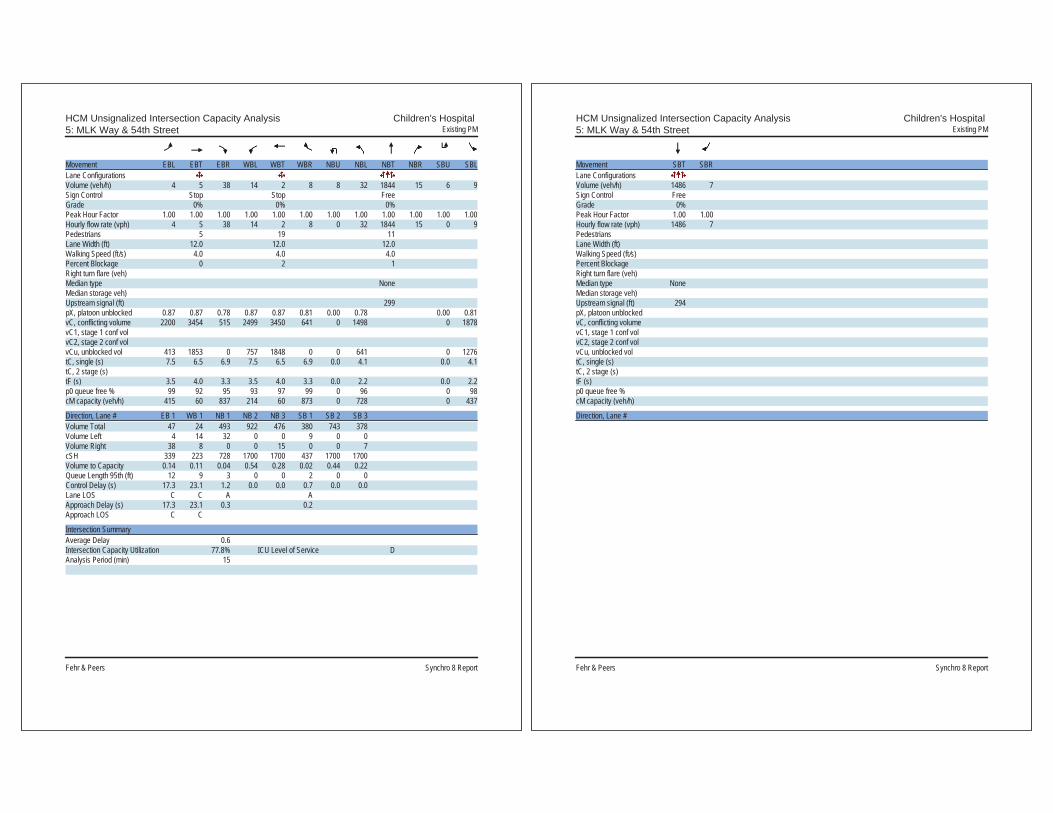
HCM Unsignalized Intersection Capacity Analysis Children's Hospital 5: MLK Way & 54th Street Existing PM
Fehr & Peers Synchro 8 Report
Movement EBL EBT EBR WBL WBT WBR NBU NBL NBT NBR SBU SBLLane ConfigurationsVolume (veh/h) 4 5 38 14 2 8 8 32 1844 15 6 9Sign Control Stop Stop FreeGrade 0% 0% 0%Peak Hour Factor 1.00 1.00 1.00 1.00 1.00 1.00 1.00 1.00 1.00 1.00 1.00 1.00Hourly flow rate (vph) 4 5 38 14 2 8 0 32 1844 15 0 9Pedestrians 5 19 11Lane Width (ft) 12.0 12.0 12.0Walking Speed (ft/s) 4.0 4.0 4.0Percent Blockage 0 2 1Right turn flare (veh)Median type NoneMedian storage veh)Upstream signal (ft) 299pX, platoon unblocked 0.87 0.87 0.78 0.87 0.87 0.81 0.00 0.78 0.00 0.81vC, conflicting volume 2200 3454 515 2499 3450 641 0 1498 0 1878vC1, stage 1 conf volvC2, stage 2 conf volvCu, unblocked vol 413 1853 0 757 1848 0 0 641 0 1276tC, single (s) 7.5 6.5 6.9 7.5 6.5 6.9 0.0 4.1 0.0 4.1tC, 2 stage (s)tF (s) 3.5 4.0 3.3 3.5 4.0 3.3 0.0 2.2 0.0 2.2p0 queue free % 99 92 95 93 97 99 0 96 0 98cM capacity (veh/h) 415 60 837 214 60 873 0 728 0 437
Direction, Lane # EB 1 WB 1 NB 1 NB 2 NB 3 SB 1 SB 2 SB 3Volume Total 47 24 493 922 476 380 743 378Volume Left 4 14 32 0 0 9 0 0Volume Right 38 8 0 0 15 0 0 7cSH 339 223 728 1700 1700 437 1700 1700Volume to Capacity 0.14 0.11 0.04 0.54 0.28 0.02 0.44 0.22Queue Length 95th (ft) 12 9 3 0 0 2 0 0Control Delay (s) 17.3 23.1 1.2 0.0 0.0 0.7 0.0 0.0Lane LOS C C A AApproach Delay (s) 17.3 23.1 0.3 0.2Approach LOS C C
Intersection SummaryAverage Delay 0.6Intersection Capacity Utilization 77.8% ICU Level of Service DAnalysis Period (min) 15
HCM Unsignalized Intersection Capacity Analysis Children's Hospital 5: MLK Way & 54th Street Existing PM
Fehr & Peers Synchro 8 Report
Movement SBT SBRLane ConfigurationsVolume (veh/h) 1486 7Sign Control FreeGrade 0%Peak Hour Factor 1.00 1.00Hourly flow rate (vph) 1486 7PedestriansLane Width (ft)Walking Speed (ft/s)Percent BlockageRight turn flare (veh)Median type NoneMedian storage veh)Upstream signal (ft) 294pX, platoon unblockedvC, conflicting volumevC1, stage 1 conf volvC2, stage 2 conf volvCu, unblocked voltC, single (s)tC, 2 stage (s)tF (s)p0 queue free %cM capacity (veh/h)
Direction, Lane #

HCM Unsignalized Intersection Capacity Analysis Children's Hospital 6: Dover Street & 54th Street Existing PM
Fehr & Peers Synchro 8 Report
Movement EBL EBT EBR WBL WBT WBR NBL NBT NBR SBL SBT SBRLane ConfigurationsVolume (veh/h) 8 10 4 2 5 11 8 31 4 7 17 2Sign Control Stop Stop Free FreeGrade 0% 0% 0% 0%Peak Hour Factor 1.00 1.00 1.00 1.00 1.00 1.00 1.00 1.00 1.00 1.00 1.00 1.00Hourly flow rate (vph) 8 10 4 2 5 11 8 31 4 7 17 2Pedestrians 12 8 6 3Lane Width (ft) 12.0 12.0 12.0 12.0Walking Speed (ft/s) 4.0 4.0 4.0 4.0Percent Blockage 1 1 1 0Right turn flare (veh)Median type None NoneMedian storage veh)Upstream signal (ft)pX, platoon unblockedvC, conflicting volume 110 103 36 104 102 44 31 43vC1, stage 1 conf volvC2, stage 2 conf volvCu, unblocked vol 110 103 36 104 102 44 31 43tC, single (s) 7.1 6.5 6.2 7.1 6.5 6.2 4.1 4.1tC, 2 stage (s)tF (s) 3.5 4.0 3.3 3.5 4.0 3.3 2.2 2.2p0 queue free % 99 99 100 100 99 99 99 100cM capacity (veh/h) 832 770 1027 842 771 1022 1579 1568
Direction, Lane # EB 1 WB 1 NB 1 SB 1Volume Total 22 18 43 26Volume Left 8 2 8 7Volume Right 4 11 4 2cSH 831 918 1579 1568Volume to Capacity 0.03 0.02 0.01 0.00Queue Length 95th (ft) 2 1 0 0Control Delay (s) 9.5 9.0 1.4 2.0Lane LOS A A A AApproach Delay (s) 9.5 9.0 1.4 2.0Approach LOS A A
Intersection SummaryAverage Delay 4.4Intersection Capacity Utilization 18.4% ICU Level of Service AAnalysis Period (min) 15
HCM Unsignalized Intersection Capacity Analysis Children's Hospital 7: Shattuck Ave & 54th Street Existing PM
Fehr & Peers Synchro 8 Report
Movement EBL EBR NBL NBT SBT SBRLane ConfigurationsVolume (veh/h) 3 14 11 601 614 3Sign Control Stop Free FreeGrade 0% 0% 0%Peak Hour Factor 1.00 1.00 1.00 1.00 1.00 1.00Hourly flow rate (vph) 3 14 11 601 614 3Pedestrians 25 1Lane Width (ft) 12.0 12.0Walking Speed (ft/s) 4.0 4.0Percent Blockage 2 0Right turn flare (veh)Median type None NoneMedian storage veh)Upstream signal (ft) 550 282pX, platoon unblocked 0.83 0.79 0.79vC, conflicting volume 1264 640 642vC1, stage 1 conf volvC2, stage 2 conf volvCu, unblocked vol 1023 416 418tC, single (s) 6.4 6.2 4.1tC, 2 stage (s)tF (s) 3.5 3.3 2.2p0 queue free % 99 97 99cM capacity (veh/h) 211 498 886
Direction, Lane # EB 1 NB 1 SB 1Volume Total 17 612 617Volume Left 3 11 0Volume Right 14 0 3cSH 401 886 1700Volume to Capacity 0.04 0.01 0.36Queue Length 95th (ft) 3 1 0Control Delay (s) 14.4 0.3 0.0Lane LOS B AApproach Delay (s) 14.4 0.3 0.0Approach LOS B
Intersection SummaryAverage Delay 0.4Intersection Capacity Utilization 50.4% ICU Level of Service AAnalysis Period (min) 15
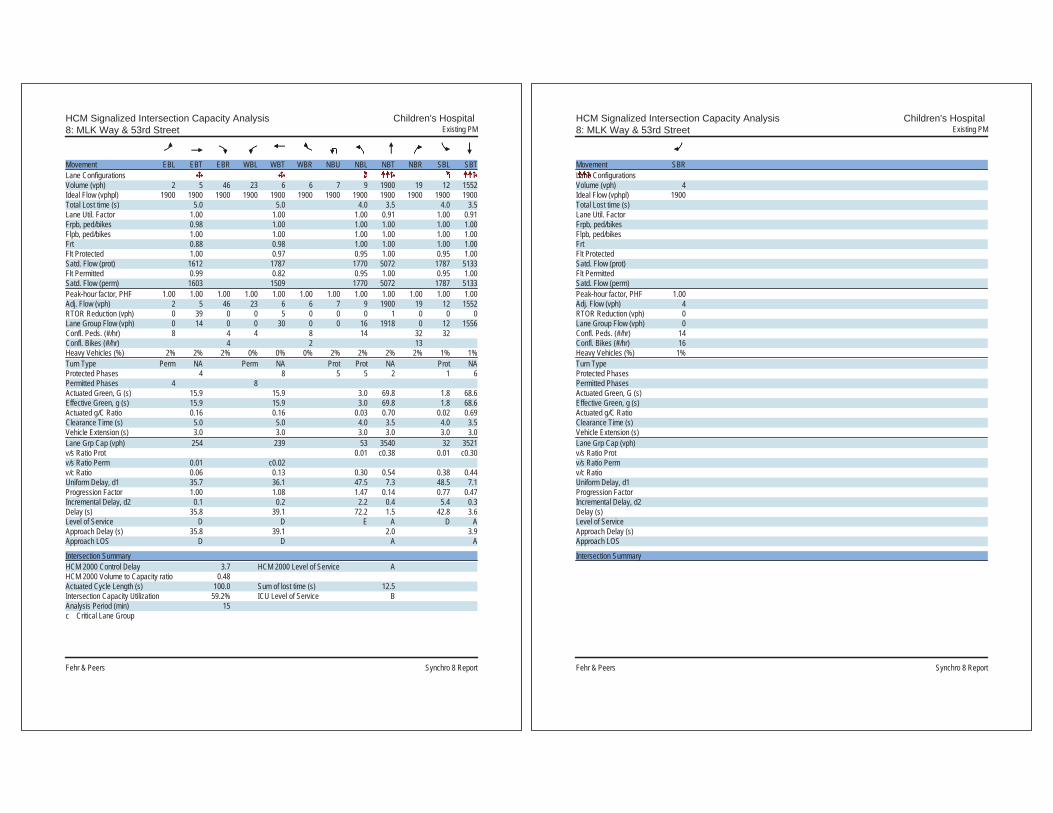
HCM Signalized Intersection Capacity Analysis Children's Hospital 8: MLK Way & 53rd Street Existing PM
Fehr & Peers Synchro 8 Report
Movement EBL EBT EBR WBL WBT WBR NBU NBL NBT NBR SBL SBTLane ConfigurationsVolume (vph) 2 5 46 23 6 6 7 9 1900 19 12 1552Ideal Flow (vphpl) 1900 1900 1900 1900 1900 1900 1900 1900 1900 1900 1900 1900Total Lost time (s) 5.0 5.0 4.0 3.5 4.0 3.5Lane Util. Factor 1.00 1.00 1.00 0.91 1.00 0.91Frpb, ped/bikes 0.98 1.00 1.00 1.00 1.00 1.00Flpb, ped/bikes 1.00 1.00 1.00 1.00 1.00 1.00Frt 0.88 0.98 1.00 1.00 1.00 1.00Flt Protected 1.00 0.97 0.95 1.00 0.95 1.00Satd. Flow (prot) 1612 1787 1770 5072 1787 5133Flt Permitted 0.99 0.82 0.95 1.00 0.95 1.00Satd. Flow (perm) 1603 1509 1770 5072 1787 5133Peak-hour factor, PHF 1.00 1.00 1.00 1.00 1.00 1.00 1.00 1.00 1.00 1.00 1.00 1.00Adj. Flow (vph) 2 5 46 23 6 6 7 9 1900 19 12 1552RTOR Reduction (vph) 0 39 0 0 5 0 0 0 1 0 0 0Lane Group Flow (vph) 0 14 0 0 30 0 0 16 1918 0 12 1556Confl. Peds. (#/hr) 8 4 4 8 14 32 32Confl. Bikes (#/hr) 4 2 13Heavy Vehicles (%) 2% 2% 2% 0% 0% 0% 2% 2% 2% 2% 1% 1%Turn Type Perm NA Perm NA Prot Prot NA Prot NAProtected Phases 4 8 5 5 2 1 6Permitted Phases 4 8Actuated Green, G (s) 15.9 15.9 3.0 69.8 1.8 68.6Effective Green, g (s) 15.9 15.9 3.0 69.8 1.8 68.6Actuated g/C Ratio 0.16 0.16 0.03 0.70 0.02 0.69Clearance Time (s) 5.0 5.0 4.0 3.5 4.0 3.5Vehicle Extension (s) 3.0 3.0 3.0 3.0 3.0 3.0Lane Grp Cap (vph) 254 239 53 3540 32 3521v/s Ratio Prot 0.01 c0.38 0.01 c0.30v/s Ratio Perm 0.01 c0.02v/c Ratio 0.06 0.13 0.30 0.54 0.38 0.44Uniform Delay, d1 35.7 36.1 47.5 7.3 48.5 7.1Progression Factor 1.00 1.08 1.47 0.14 0.77 0.47Incremental Delay, d2 0.1 0.2 2.2 0.4 5.4 0.3Delay (s) 35.8 39.1 72.2 1.5 42.8 3.6Level of Service D D E A D AApproach Delay (s) 35.8 39.1 2.0 3.9Approach LOS D D A A
Intersection SummaryHCM 2000 Control Delay 3.7 HCM 2000 Level of Service AHCM 2000 Volume to Capacity ratio 0.48Actuated Cycle Length (s) 100.0 Sum of lost time (s) 12.5Intersection Capacity Utilization 59.2% ICU Level of Service BAnalysis Period (min) 15c Critical Lane Group
HCM Signalized Intersection Capacity Analysis Children's Hospital 8: MLK Way & 53rd Street Existing PM
Fehr & Peers Synchro 8 Report
Movement SBRLane ConfigurationsVolume (vph) 4Ideal Flow (vphpl) 1900Total Lost time (s)Lane Util. FactorFrpb, ped/bikesFlpb, ped/bikesFrtFlt ProtectedSatd. Flow (prot)Flt PermittedSatd. Flow (perm)Peak-hour factor, PHF 1.00Adj. Flow (vph) 4RTOR Reduction (vph) 0Lane Group Flow (vph) 0Confl. Peds. (#/hr) 14Confl. Bikes (#/hr) 16Heavy Vehicles (%) 1%Turn TypeProtected PhasesPermitted PhasesActuated Green, G (s)Effective Green, g (s)Actuated g/C RatioClearance Time (s)Vehicle Extension (s)Lane Grp Cap (vph)v/s Ratio Protv/s Ratio Permv/c RatioUniform Delay, d1Progression FactorIncremental Delay, d2Delay (s)Level of ServiceApproach Delay (s)Approach LOS
Intersection Summary
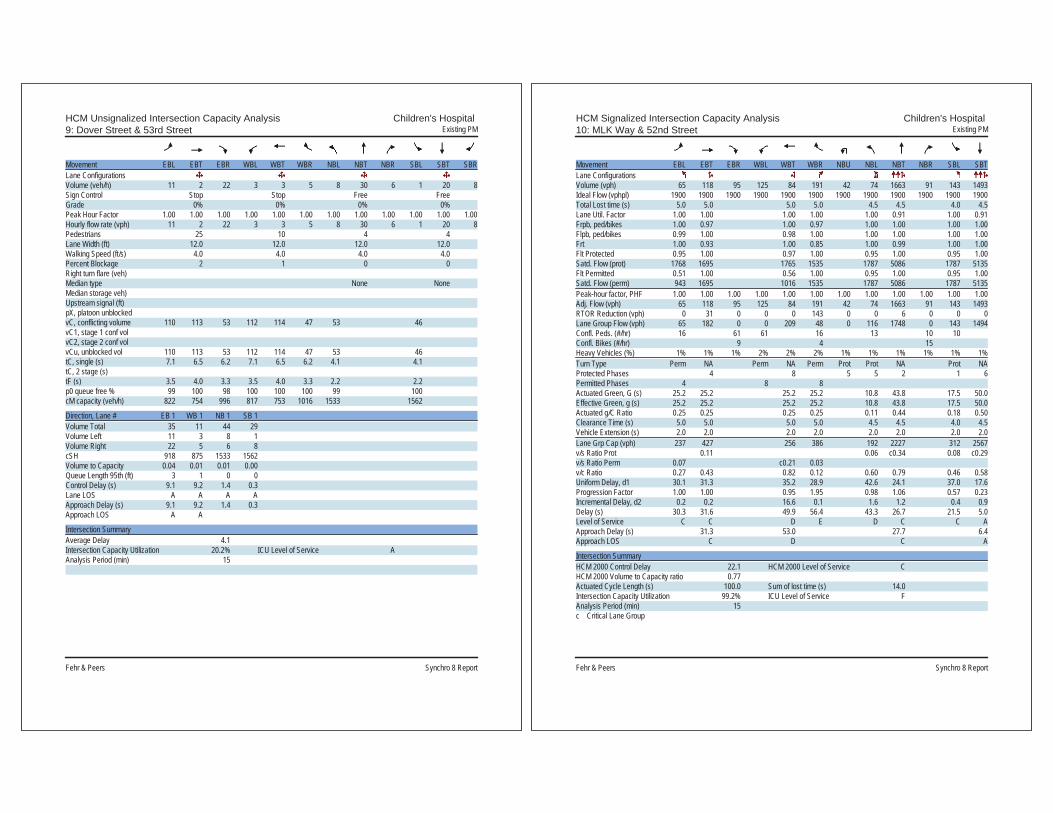
HCM Unsignalized Intersection Capacity Analysis Children's Hospital 9: Dover Street & 53rd Street Existing PM
Fehr & Peers Synchro 8 Report
Movement EBL EBT EBR WBL WBT WBR NBL NBT NBR SBL SBT SBRLane ConfigurationsVolume (veh/h) 11 2 22 3 3 5 8 30 6 1 20 8Sign Control Stop Stop Free FreeGrade 0% 0% 0% 0%Peak Hour Factor 1.00 1.00 1.00 1.00 1.00 1.00 1.00 1.00 1.00 1.00 1.00 1.00Hourly flow rate (vph) 11 2 22 3 3 5 8 30 6 1 20 8Pedestrians 25 10 4 4Lane Width (ft) 12.0 12.0 12.0 12.0Walking Speed (ft/s) 4.0 4.0 4.0 4.0Percent Blockage 2 1 0 0Right turn flare (veh)Median type None NoneMedian storage veh)Upstream signal (ft)pX, platoon unblockedvC, conflicting volume 110 113 53 112 114 47 53 46vC1, stage 1 conf volvC2, stage 2 conf volvCu, unblocked vol 110 113 53 112 114 47 53 46tC, single (s) 7.1 6.5 6.2 7.1 6.5 6.2 4.1 4.1tC, 2 stage (s)tF (s) 3.5 4.0 3.3 3.5 4.0 3.3 2.2 2.2p0 queue free % 99 100 98 100 100 100 99 100cM capacity (veh/h) 822 754 996 817 753 1016 1533 1562
Direction, Lane # EB 1 WB 1 NB 1 SB 1Volume Total 35 11 44 29Volume Left 11 3 8 1Volume Right 22 5 6 8cSH 918 875 1533 1562Volume to Capacity 0.04 0.01 0.01 0.00Queue Length 95th (ft) 3 1 0 0Control Delay (s) 9.1 9.2 1.4 0.3Lane LOS A A A AApproach Delay (s) 9.1 9.2 1.4 0.3Approach LOS A A
Intersection SummaryAverage Delay 4.1Intersection Capacity Utilization 20.2% ICU Level of Service AAnalysis Period (min) 15
HCM Signalized Intersection Capacity Analysis Children's Hospital 10: MLK Way & 52nd Street Existing PM
Fehr & Peers Synchro 8 Report
Movement EBL EBT EBR WBL WBT WBR NBU NBL NBT NBR SBL SBTLane ConfigurationsVolume (vph) 65 118 95 125 84 191 42 74 1663 91 143 1493Ideal Flow (vphpl) 1900 1900 1900 1900 1900 1900 1900 1900 1900 1900 1900 1900Total Lost time (s) 5.0 5.0 5.0 5.0 4.5 4.5 4.0 4.5Lane Util. Factor 1.00 1.00 1.00 1.00 1.00 0.91 1.00 0.91Frpb, ped/bikes 1.00 0.97 1.00 0.97 1.00 1.00 1.00 1.00Flpb, ped/bikes 0.99 1.00 0.98 1.00 1.00 1.00 1.00 1.00Frt 1.00 0.93 1.00 0.85 1.00 0.99 1.00 1.00Flt Protected 0.95 1.00 0.97 1.00 0.95 1.00 0.95 1.00Satd. Flow (prot) 1768 1695 1765 1535 1787 5086 1787 5135Flt Permitted 0.51 1.00 0.56 1.00 0.95 1.00 0.95 1.00Satd. Flow (perm) 943 1695 1016 1535 1787 5086 1787 5135Peak-hour factor, PHF 1.00 1.00 1.00 1.00 1.00 1.00 1.00 1.00 1.00 1.00 1.00 1.00Adj. Flow (vph) 65 118 95 125 84 191 42 74 1663 91 143 1493RTOR Reduction (vph) 0 31 0 0 0 143 0 0 6 0 0 0Lane Group Flow (vph) 65 182 0 0 209 48 0 116 1748 0 143 1494Confl. Peds. (#/hr) 16 61 61 16 13 10 10Confl. Bikes (#/hr) 9 4 15Heavy Vehicles (%) 1% 1% 1% 2% 2% 2% 1% 1% 1% 1% 1% 1%Turn Type Perm NA Perm NA Perm Prot Prot NA Prot NAProtected Phases 4 8 5 5 2 1 6Permitted Phases 4 8 8Actuated Green, G (s) 25.2 25.2 25.2 25.2 10.8 43.8 17.5 50.0Effective Green, g (s) 25.2 25.2 25.2 25.2 10.8 43.8 17.5 50.0Actuated g/C Ratio 0.25 0.25 0.25 0.25 0.11 0.44 0.18 0.50Clearance Time (s) 5.0 5.0 5.0 5.0 4.5 4.5 4.0 4.5Vehicle Extension (s) 2.0 2.0 2.0 2.0 2.0 2.0 2.0 2.0Lane Grp Cap (vph) 237 427 256 386 192 2227 312 2567v/s Ratio Prot 0.11 0.06 c0.34 0.08 c0.29v/s Ratio Perm 0.07 c0.21 0.03v/c Ratio 0.27 0.43 0.82 0.12 0.60 0.79 0.46 0.58Uniform Delay, d1 30.1 31.3 35.2 28.9 42.6 24.1 37.0 17.6Progression Factor 1.00 1.00 0.95 1.95 0.98 1.06 0.57 0.23Incremental Delay, d2 0.2 0.2 16.6 0.1 1.6 1.2 0.4 0.9Delay (s) 30.3 31.6 49.9 56.4 43.3 26.7 21.5 5.0Level of Service C C D E D C C AApproach Delay (s) 31.3 53.0 27.7 6.4Approach LOS C D C A
Intersection SummaryHCM 2000 Control Delay 22.1 HCM 2000 Level of Service CHCM 2000 Volume to Capacity ratio 0.77Actuated Cycle Length (s) 100.0 Sum of lost time (s) 14.0Intersection Capacity Utilization 99.2% ICU Level of Service FAnalysis Period (min) 15c Critical Lane Group

HCM Signalized Intersection Capacity Analysis Children's Hospital 10: MLK Way & 52nd Street Existing PM
Fehr & Peers Synchro 8 Report
Movement SBRLane ConfigurationsVolume (vph) 1Ideal Flow (vphpl) 1900Total Lost time (s)Lane Util. FactorFrpb, ped/bikesFlpb, ped/bikesFrtFlt ProtectedSatd. Flow (prot)Flt PermittedSatd. Flow (perm)Peak-hour factor, PHF 1.00Adj. Flow (vph) 1RTOR Reduction (vph) 0Lane Group Flow (vph) 0Confl. Peds. (#/hr) 13Confl. Bikes (#/hr) 17Heavy Vehicles (%) 1%Turn TypeProtected PhasesPermitted PhasesActuated Green, G (s)Effective Green, g (s)Actuated g/C RatioClearance Time (s)Vehicle Extension (s)Lane Grp Cap (vph)v/s Ratio Protv/s Ratio Permv/c RatioUniform Delay, d1Progression FactorIncremental Delay, d2Delay (s)Level of ServiceApproach Delay (s)Approach LOS
Intersection Summary
HCM Signalized Intersection Capacity Analysis Children's Hospital 11: 52nd Street & Garage Existing PM
Fehr & Peers Synchro 8 Report
Movement EBL EBT EBR WBL WBT WBR NBL NBT NBR SBL SBT SBRLane ConfigurationsVolume (vph) 17 333 5 11 308 17 25 3 13 63 4 73Ideal Flow (vphpl) 1900 1900 1900 1900 1900 1900 1900 1900 1900 1900 1900 1900Total Lost time (s) 3.0 3.0 3.0 3.0Lane Util. Factor 0.95 0.95 1.00 1.00Frpb, ped/bikes 1.00 1.00 0.95 0.99Flpb, ped/bikes 1.00 1.00 1.00 0.94Frt 1.00 0.99 0.96 0.93Flt Protected 1.00 1.00 0.97 0.98Satd. Flow (prot) 3513 3556 1452 1617Flt Permitted 0.94 0.94 0.87 0.89Satd. Flow (perm) 3323 3357 1301 1470Peak-hour factor, PHF 1.00 1.00 1.00 1.00 1.00 1.00 1.00 1.00 1.00 1.00 1.00 1.00Adj. Flow (vph) 17 333 5 11 308 17 25 3 13 63 4 73RTOR Reduction (vph) 0 2 0 0 8 0 0 7 0 0 39 0Lane Group Flow (vph) 0 353 0 0 328 0 0 34 0 0 101 0Confl. Peds. (#/hr) 25 59 59 25 208 208Confl. Bikes (#/hr) 10 6 1Heavy Vehicles (%) 2% 2% 2% 0% 0% 0% 16% 16% 16% 0% 0% 0%Turn Type Prot NA Perm NA Perm NA Perm NAProtected Phases 5 2 6 4 8Permitted Phases 6 4 8Actuated Green, G (s) 21.0 14.0 23.0 23.0Effective Green, g (s) 21.0 14.0 23.0 23.0Actuated g/C Ratio 0.42 0.28 0.46 0.46Clearance Time (s) 3.0 3.0 3.0 3.0Lane Grp Cap (vph) 1410 939 598 676v/s Ratio Prot c0.02v/s Ratio Perm 0.09 c0.10 0.03 c0.07v/c Ratio 0.25 0.35 0.06 0.15Uniform Delay, d1 9.4 14.4 7.5 7.8Progression Factor 1.64 1.00 1.00 1.00Incremental Delay, d2 0.4 1.0 0.2 0.5Delay (s) 15.8 15.4 7.7 8.3Level of Service B B A AApproach Delay (s) 15.8 15.4 7.7 8.3Approach LOS B B A A
Intersection SummaryHCM 2000 Control Delay 14.1 HCM 2000 Level of Service BHCM 2000 Volume to Capacity ratio 0.23Actuated Cycle Length (s) 50.0 Sum of lost time (s) 9.0Intersection Capacity Utilization 47.9% ICU Level of Service AAnalysis Period (min) 15c Critical Lane Group

HCM Unsignalized Intersection Capacity Analysis Children's Hospital 12: 52nd Street & Dover Street Existing PM
Fehr & Peers Synchro 8 Report
Movement EBL EBT EBR WBL WBT WBR NBL NBT NBR SBL SBT SBRLane ConfigurationsVolume (veh/h) 18 382 7 5 326 26 5 2 8 36 1 13Sign Control Free Free Stop StopGrade 0% 0% 0% 0%Peak Hour Factor 1.00 1.00 1.00 1.00 1.00 1.00 1.00 1.00 1.00 1.00 1.00 1.00Hourly flow rate (vph) 18 382 7 5 326 26 5 2 8 36 1 13Pedestrians 37 7 35 15Lane Width (ft) 12.0 12.0 12.0 12.0Walking Speed (ft/s) 4.0 4.0 4.0 4.0Percent Blockage 3 1 3 1Right turn flare (veh)Median type None NoneMedian storage veh)Upstream signal (ft) 312 647pX, platoon unblocked 0.93 0.90 0.93 0.93 0.90 0.93 0.93 0.93vC, conflicting volume 367 424 856 834 428 802 824 391vC1, stage 1 conf volvC2, stage 2 conf volvCu, unblocked vol 276 299 631 607 303 572 597 302tC, single (s) 4.1 4.1 7.2 6.6 6.3 7.1 6.5 6.2tC, 2 stage (s)tF (s) 2.2 2.2 3.6 4.1 3.4 3.5 4.0 3.3p0 queue free % 98 100 98 99 99 90 100 98cM capacity (veh/h) 1171 1103 313 351 621 372 368 658
Direction, Lane # EB 1 WB 1 NB 1 SB 1Volume Total 407 357 15 50Volume Left 18 5 5 36Volume Right 7 26 8 13cSH 1171 1103 434 420Volume to Capacity 0.02 0.00 0.03 0.12Queue Length 95th (ft) 1 0 3 10Control Delay (s) 0.5 0.2 13.6 14.7Lane LOS A A B BApproach Delay (s) 0.5 0.2 13.6 14.7Approach LOS B B
Intersection SummaryAverage Delay 1.5Intersection Capacity Utilization 49.0% ICU Level of Service AAnalysis Period (min) 15
HCM Unsignalized Intersection Capacity Analysis Children's Hospital 13: SR-24 NB Off-Ramp & 52nd Street Existing PM
Fehr & Peers Synchro 8 Report
Movement EBL EBT EBR WBL WBT WBR NBL NBR SEL SERLane ConfigurationsVolume (veh/h) 0 423 0 0 364 996 0 1024 0 0Sign Control Free Free Stop StopGrade 0% 0% 0% 0%Peak Hour Factor 1.00 1.00 1.00 1.00 1.00 1.00 1.00 1.00 1.00 1.00Hourly flow rate (vph) 0 423 0 0 364 996 0 1024 0 0Pedestrians 33 9Lane Width (ft) 12.0 0.0Walking Speed (ft/s) 4.0 4.0Percent Blockage 3 0Right turn flare (veh)Median type None NoneMedian storage veh)Upstream signal (ft) 767 192pX, platoon unblocked 0.84 0.84 0.84 0.84vC, conflicting volume 1369 456 1825 244 1608 829vC1, stage 1 conf volvC2, stage 2 conf volvCu, unblocked vol 1057 456 1600 244 1342 413tC, single (s) 4.1 4.1 6.5 7.0 7.5 6.5tC, 2 stage (s)tF (s) 2.2 2.2 4.0 3.3 3.5 4.0p0 queue free % 100 100 100 0 0 100cM capacity (veh/h) 549 1071 86 732 0 431
Direction, Lane # EB 1 EB 2 WB 1 WB 2 WB 3 NB 1 NB 2Volume Total 212 212 243 453 664 512 512Volume Left 0 0 0 0 0 0 0Volume Right 0 0 0 332 664 512 512cSH 1700 1700 1700 1700 1700 732 732Volume to Capacity 0.12 0.12 0.14 0.27 0.39 0.70 0.70Queue Length 95th (ft) 0 0 0 0 0 144 144Control Delay (s) 0.0 0.0 0.0 0.0 0.0 20.5 20.5Lane LOS C CApproach Delay (s) 0.0 0.0 20.5Approach LOS C
Intersection SummaryAverage Delay 7.5Intersection Capacity Utilization 55.3% ICU Level of Service BAnalysis Period (min) 15

HCM Signalized Intersection Capacity Analysis Children's Hospital 14: 52nd Street & Shattuck Ave Existing PM
Fehr & Peers Synchro 8 Report
Movement EBU EBL EBT EBR WBL WBT WBR NBL NBT NBR SBL SBTLane ConfigurationsVolume (vph) 40 302 913 172 35 829 129 146 207 40 140 143Ideal Flow (vphpl) 1900 1900 1900 1900 1900 1900 1900 1900 1900 1900 1900 1900Total Lost time (s) 4.0 4.5 4.0 4.5 4.0 5.5 5.5Lane Util. Factor 1.00 0.91 1.00 0.91 1.00 1.00 1.00Frpb, ped/bikes 1.00 0.99 1.00 0.99 1.00 0.99 1.00Flpb, ped/bikes 1.00 1.00 1.00 1.00 1.00 1.00 0.99Frt 1.00 0.98 1.00 0.98 1.00 0.98 1.00Flt Protected 0.95 1.00 0.95 1.00 0.95 1.00 0.98Satd. Flow (prot) 1787 4955 1805 5037 1747 1783 1716Flt Permitted 0.95 1.00 0.95 1.00 0.30 1.00 0.72Satd. Flow (perm) 1787 4955 1805 5037 554 1783 1268Peak-hour factor, PHF 1.00 1.00 1.00 1.00 1.00 1.00 1.00 1.00 1.00 1.00 1.00 1.00Adj. Flow (vph) 40 302 913 172 35 829 129 146 207 40 140 143RTOR Reduction (vph) 0 0 23 0 0 19 0 0 6 0 0 0Lane Group Flow (vph) 0 342 1062 0 35 939 0 146 241 0 0 283Confl. Peds. (#/hr) 11 14 14 11 18 22 22Confl. Bikes (#/hr) 13 8 30Heavy Vehicles (%) 1% 1% 1% 1% 0% 0% 0% 3% 3% 3% 7% 7%Turn Type Prot Prot NA Prot NA pm+pt NA Perm NAProtected Phases 7 7 4 3 8 5 2 6Permitted Phases 2 6Actuated Green, G (s) 33.5 57.2 3.9 27.6 34.9 34.9 25.4Effective Green, g (s) 33.5 57.2 3.9 27.6 34.9 34.9 25.4Actuated g/C Ratio 0.30 0.52 0.04 0.25 0.32 0.32 0.23Clearance Time (s) 4.0 4.5 4.0 4.5 4.0 5.5 5.5Vehicle Extension (s) 3.0 3.0 3.0 3.0 3.0 3.0 3.0Lane Grp Cap (vph) 544 2576 63 1263 235 565 292v/s Ratio Prot c0.19 0.21 0.02 c0.19 c0.03 0.14v/s Ratio Perm 0.17 c0.22v/c Ratio 0.63 0.41 0.56 0.74 0.62 0.43 0.97Uniform Delay, d1 32.9 16.1 52.2 37.9 31.3 29.6 41.9Progression Factor 1.00 1.00 1.00 1.00 1.00 1.00 1.00Incremental Delay, d2 5.4 0.5 10.2 4.0 5.0 2.3 45.4Delay (s) 38.3 16.6 62.4 41.9 36.4 32.0 87.3Level of Service D B E D D C FApproach Delay (s) 21.8 42.7 33.6 59.2Approach LOS C D C E
Intersection SummaryHCM 2000 Control Delay 36.0 HCM 2000 Level of Service DHCM 2000 Volume to Capacity ratio 0.76Actuated Cycle Length (s) 110.0 Sum of lost time (s) 18.0Intersection Capacity Utilization 99.9% ICU Level of Service FAnalysis Period (min) 15c Critical Lane Group
HCM Signalized Intersection Capacity Analysis Children's Hospital 14: 52nd Street & Shattuck Ave Existing PM
Fehr & Peers Synchro 8 Report
Movement SBRLane ConfigurationsVolume (vph) 346Ideal Flow (vphpl) 1900Total Lost time (s) 5.5Lane Util. Factor 1.00Frpb, ped/bikes 0.94Flpb, ped/bikes 1.00Frt 0.85Flt Protected 1.00Satd. Flow (prot) 1421Flt Permitted 1.00Satd. Flow (perm) 1421Peak-hour factor, PHF 1.00Adj. Flow (vph) 346RTOR Reduction (vph) 266Lane Group Flow (vph) 80Confl. Peds. (#/hr) 18Confl. Bikes (#/hr) 27Heavy Vehicles (%) 7%Turn Type PermProtected PhasesPermitted Phases 6Actuated Green, G (s) 25.4Effective Green, g (s) 25.4Actuated g/C Ratio 0.23Clearance Time (s) 5.5Vehicle Extension (s) 3.0Lane Grp Cap (vph) 328v/s Ratio Protv/s Ratio Perm 0.06v/c Ratio 0.24Uniform Delay, d1 34.5Progression Factor 1.00Incremental Delay, d2 1.8Delay (s) 36.2Level of Service DApproach Delay (s)Approach LOS
Intersection Summary
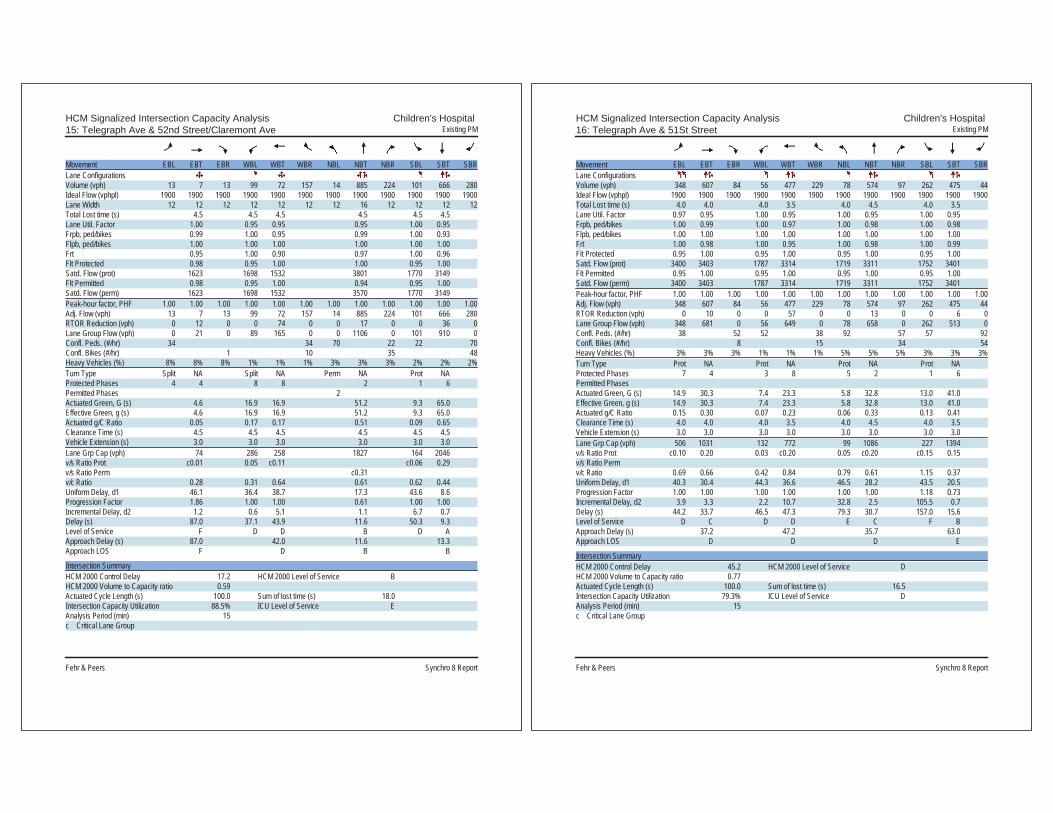
HCM Signalized Intersection Capacity Analysis Children's Hospital 15: Telegraph Ave & 52nd Street/Claremont Ave Existing PM
Fehr & Peers Synchro 8 Report
Movement EBL EBT EBR WBL WBT WBR NBL NBT NBR SBL SBT SBRLane ConfigurationsVolume (vph) 13 7 13 99 72 157 14 885 224 101 666 280Ideal Flow (vphpl) 1900 1900 1900 1900 1900 1900 1900 1900 1900 1900 1900 1900Lane Width 12 12 12 12 12 12 12 16 12 12 12 12Total Lost time (s) 4.5 4.5 4.5 4.5 4.5 4.5Lane Util. Factor 1.00 0.95 0.95 0.95 1.00 0.95Frpb, ped/bikes 0.99 1.00 0.95 0.99 1.00 0.93Flpb, ped/bikes 1.00 1.00 1.00 1.00 1.00 1.00Frt 0.95 1.00 0.90 0.97 1.00 0.96Flt Protected 0.98 0.95 1.00 1.00 0.95 1.00Satd. Flow (prot) 1623 1698 1532 3801 1770 3149Flt Permitted 0.98 0.95 1.00 0.94 0.95 1.00Satd. Flow (perm) 1623 1698 1532 3570 1770 3149Peak-hour factor, PHF 1.00 1.00 1.00 1.00 1.00 1.00 1.00 1.00 1.00 1.00 1.00 1.00Adj. Flow (vph) 13 7 13 99 72 157 14 885 224 101 666 280RTOR Reduction (vph) 0 12 0 0 74 0 0 17 0 0 36 0Lane Group Flow (vph) 0 21 0 89 165 0 0 1106 0 101 910 0Confl. Peds. (#/hr) 34 34 70 22 22 70Confl. Bikes (#/hr) 1 10 35 48Heavy Vehicles (%) 8% 8% 8% 1% 1% 1% 3% 3% 3% 2% 2% 2%Turn Type Split NA Split NA Perm NA Prot NAProtected Phases 4 4 8 8 2 1 6Permitted Phases 2Actuated Green, G (s) 4.6 16.9 16.9 51.2 9.3 65.0Effective Green, g (s) 4.6 16.9 16.9 51.2 9.3 65.0Actuated g/C Ratio 0.05 0.17 0.17 0.51 0.09 0.65Clearance Time (s) 4.5 4.5 4.5 4.5 4.5 4.5Vehicle Extension (s) 3.0 3.0 3.0 3.0 3.0 3.0Lane Grp Cap (vph) 74 286 258 1827 164 2046v/s Ratio Prot c0.01 0.05 c0.11 c0.06 0.29v/s Ratio Perm c0.31v/c Ratio 0.28 0.31 0.64 0.61 0.62 0.44Uniform Delay, d1 46.1 36.4 38.7 17.3 43.6 8.6Progression Factor 1.86 1.00 1.00 0.61 1.00 1.00Incremental Delay, d2 1.2 0.6 5.1 1.1 6.7 0.7Delay (s) 87.0 37.1 43.9 11.6 50.3 9.3Level of Service F D D B D AApproach Delay (s) 87.0 42.0 11.6 13.3Approach LOS F D B B
Intersection SummaryHCM 2000 Control Delay 17.2 HCM 2000 Level of Service BHCM 2000 Volume to Capacity ratio 0.59Actuated Cycle Length (s) 100.0 Sum of lost time (s) 18.0Intersection Capacity Utilization 88.5% ICU Level of Service EAnalysis Period (min) 15c Critical Lane Group
HCM Signalized Intersection Capacity Analysis Children's Hospital 16: Telegraph Ave & 51St Street Existing PM
Fehr & Peers Synchro 8 Report
Movement EBL EBT EBR WBL WBT WBR NBL NBT NBR SBL SBT SBRLane ConfigurationsVolume (vph) 348 607 84 56 477 229 78 574 97 262 475 44Ideal Flow (vphpl) 1900 1900 1900 1900 1900 1900 1900 1900 1900 1900 1900 1900Total Lost time (s) 4.0 4.0 4.0 3.5 4.0 4.5 4.0 3.5Lane Util. Factor 0.97 0.95 1.00 0.95 1.00 0.95 1.00 0.95Frpb, ped/bikes 1.00 0.99 1.00 0.97 1.00 0.98 1.00 0.98Flpb, ped/bikes 1.00 1.00 1.00 1.00 1.00 1.00 1.00 1.00Frt 1.00 0.98 1.00 0.95 1.00 0.98 1.00 0.99Flt Protected 0.95 1.00 0.95 1.00 0.95 1.00 0.95 1.00Satd. Flow (prot) 3400 3403 1787 3314 1719 3311 1752 3401Flt Permitted 0.95 1.00 0.95 1.00 0.95 1.00 0.95 1.00Satd. Flow (perm) 3400 3403 1787 3314 1719 3311 1752 3401Peak-hour factor, PHF 1.00 1.00 1.00 1.00 1.00 1.00 1.00 1.00 1.00 1.00 1.00 1.00Adj. Flow (vph) 348 607 84 56 477 229 78 574 97 262 475 44RTOR Reduction (vph) 0 10 0 0 57 0 0 13 0 0 6 0Lane Group Flow (vph) 348 681 0 56 649 0 78 658 0 262 513 0Confl. Peds. (#/hr) 38 52 52 38 92 57 57 92Confl. Bikes (#/hr) 8 15 34 54Heavy Vehicles (%) 3% 3% 3% 1% 1% 1% 5% 5% 5% 3% 3% 3%Turn Type Prot NA Prot NA Prot NA Prot NAProtected Phases 7 4 3 8 5 2 1 6Permitted PhasesActuated Green, G (s) 14.9 30.3 7.4 23.3 5.8 32.8 13.0 41.0Effective Green, g (s) 14.9 30.3 7.4 23.3 5.8 32.8 13.0 41.0Actuated g/C Ratio 0.15 0.30 0.07 0.23 0.06 0.33 0.13 0.41Clearance Time (s) 4.0 4.0 4.0 3.5 4.0 4.5 4.0 3.5Vehicle Extension (s) 3.0 3.0 3.0 3.0 3.0 3.0 3.0 3.0Lane Grp Cap (vph) 506 1031 132 772 99 1086 227 1394v/s Ratio Prot c0.10 0.20 0.03 c0.20 0.05 c0.20 c0.15 0.15v/s Ratio Permv/c Ratio 0.69 0.66 0.42 0.84 0.79 0.61 1.15 0.37Uniform Delay, d1 40.3 30.4 44.3 36.6 46.5 28.2 43.5 20.5Progression Factor 1.00 1.00 1.00 1.00 1.00 1.00 1.18 0.73Incremental Delay, d2 3.9 3.3 2.2 10.7 32.8 2.5 105.5 0.7Delay (s) 44.2 33.7 46.5 47.3 79.3 30.7 157.0 15.6Level of Service D C D D E C F BApproach Delay (s) 37.2 47.2 35.7 63.0Approach LOS D D D E
Intersection SummaryHCM 2000 Control Delay 45.2 HCM 2000 Level of Service DHCM 2000 Volume to Capacity ratio 0.77Actuated Cycle Length (s) 100.0 Sum of lost time (s) 16.5Intersection Capacity Utilization 79.3% ICU Level of Service DAnalysis Period (min) 15c Critical Lane Group

HCM Signalized Intersection Capacity Analysis Children's Hospital 17: SB SR-24 On-Ramp & MLK Way & NB SR-24 Off-Ramp Existing PM
Fehr & Peers Synchro 8 Report
Movement EBL EBT EBR WBL WBT WBR NBL NBT NBR SBL SBT SBRLane ConfigurationsVolume (vph) 268 0 0 0 0 1614 0 0 0 0 1547 235Ideal Flow (vphpl) 1900 1900 1900 1900 1900 1900 1900 1900 1900 1900 1900 1900Total Lost time (s) 4.0 4.0 4.0 4.0Lane Util. Factor 0.97 1.00 0.95 0.88Frpb, ped/bikes 1.00 1.00 1.00 1.00Flpb, ped/bikes 1.00 1.00 1.00 1.00Frt 1.00 0.86 1.00 0.85Flt Protected 0.95 1.00 1.00 1.00Satd. Flow (prot) 3273 1627 3574 2814Flt Permitted 0.95 1.00 1.00 1.00Satd. Flow (perm) 3273 1627 3574 2814Peak-hour factor, PHF 1.00 1.00 1.00 1.00 1.00 1.00 1.00 1.00 1.00 1.00 1.00 1.00Adj. Flow (vph) 268 0 0 0 0 1614 0 0 0 0 1547 235RTOR Reduction (vph) 0 0 0 0 0 0 0 0 0 0 0 0Lane Group Flow (vph) 268 0 0 0 0 1614 0 0 0 0 1547 235Confl. Peds. (#/hr) 2 2 18 18Confl. Bikes (#/hr) 9 12Heavy Vehicles (%) 7% 7% 2% 2% 1% 1% 2% 2% 2% 2% 1% 1%Turn Type Prot Free NA customProtected Phases 2 6 FreePermitted Phases FreeActuated Green, G (s) 13.0 50.0 29.0 50.0Effective Green, g (s) 13.0 50.0 29.0 50.0Actuated g/C Ratio 0.26 1.00 0.58 1.00Clearance Time (s) 4.0 4.0Lane Grp Cap (vph) 850 1627 2072 2814v/s Ratio Prot 0.08 0.43 0.08v/s Ratio Perm c0.99v/c Ratio 0.32 0.99 0.75 0.08Uniform Delay, d1 14.9 0.0 7.8 0.0Progression Factor 1.00 1.00 2.66 1.00Incremental Delay, d2 1.0 20.5 2.1 0.0Delay (s) 15.9 20.5 22.8 0.0Level of Service B C C AApproach Delay (s) 15.9 20.5 0.0 19.8Approach LOS B C A B
Intersection SummaryHCM 2000 Control Delay 19.8 HCM 2000 Level of Service BHCM 2000 Volume to Capacity ratio 1.18Actuated Cycle Length (s) 50.0 Sum of lost time (s) 8.0Intersection Capacity Utilization 57.1% ICU Level of Service BAnalysis Period (min) 15c Critical Lane Group
HCM Unsignalized Intersection Capacity Analysis Children's Hospital 18: West Street & 52nd Street Existing PM
Fehr & Peers Synchro 8 Report
Movement EBL EBT EBR WBL WBT WBR NBL NBT NBR SBL SBT SBRLane ConfigurationsSign Control Stop Stop Stop StopVolume (vph) 0 112 8 83 94 0 43 0 134 6 52 4Peak Hour Factor 1.00 1.00 1.00 1.00 1.00 1.00 1.00 1.00 1.00 1.00 1.00 1.00Hourly flow rate (vph) 0 112 8 83 94 0 43 0 134 6 52 4
Direction, Lane # EB 1 WB 1 NB 1 NB 2 SB 1Volume Total (vph) 120 177 43 134 62Volume Left (vph) 0 83 43 0 6Volume Right (vph) 8 0 0 134 4Hadj (s) -0.02 0.13 0.50 -0.70 0.01Departure Headway (s) 4.7 4.8 5.8 4.6 5.0Degree Utilization, x 0.16 0.23 0.07 0.17 0.09Capacity (veh/h) 717 715 588 736 667Control Delay (s) 8.5 9.2 8.0 7.3 8.4Approach Delay (s) 8.5 9.2 7.5 8.4Approach LOS A A A A
Intersection SummaryDelay 8.4Level of Service AIntersection Capacity Utilization 35.8% ICU Level of Service AAnalysis Period (min) 15

HCM Unsignalized Intersection Capacity Analysis Children's Hospital 19: Genoa Street & 52nd Street Existing PM
Fehr & Peers Synchro 8 Report
Movement EBL EBT EBR WBL WBT WBR NBL NBT NBR SBL SBT SBRLane ConfigurationsSign Control Stop Stop Stop StopVolume (vph) 1 110 2 2 97 36 2 0 3 11 0 3Peak Hour Factor 1.00 1.00 1.00 1.00 1.00 1.00 1.00 1.00 1.00 1.00 1.00 1.00Hourly flow rate (vph) 1 110 2 2 97 36 2 0 3 11 0 3
Direction, Lane # EB 1 WB 1 NB 1 SB 1Volume Total (vph) 113 135 5 14Volume Left (vph) 1 2 2 11Volume Right (vph) 2 36 3 3Hadj (s) 0.01 -0.16 -0.28 0.03Departure Headway (s) 4.1 3.9 4.1 4.4Degree Utilization, x 0.13 0.15 0.01 0.02Capacity (veh/h) 869 912 809 753Control Delay (s) 7.7 7.6 7.2 7.5Approach Delay (s) 7.7 7.6 7.2 7.5Approach LOS A A A A
Intersection SummaryDelay 7.6Level of Service AIntersection Capacity Utilization 20.3% ICU Level of Service AAnalysis Period (min) 15
HCM Unsignalized Intersection Capacity Analysis Children's Hospital 20: Genoa Street & 55th Street Existing PM
Fehr & Peers Synchro 8 Report
Movement EBL EBT EBR WBL WBT WBR NBL NBT NBR SBL SBT SBRLane ConfigurationsVolume (veh/h) 12 370 1 10 338 29 8 18 29 27 3 10Sign Control Free Free Stop StopGrade 0% 0% 0% 0%Peak Hour Factor 1.00 1.00 1.00 1.00 1.00 1.00 1.00 1.00 1.00 1.00 1.00 1.00Hourly flow rate (vph) 12 370 1 10 338 29 8 18 29 27 3 10Pedestrians 5 7 3Lane Width (ft) 12.0 12.0 12.0Walking Speed (ft/s) 4.0 4.0 4.0Percent Blockage 0 1 0Right turn flare (veh)Median type None NoneMedian storage veh)Upstream signal (ft) 721pX, platoon unblockedvC, conflicting volume 370 378 790 792 378 808 778 360vC1, stage 1 conf volvC2, stage 2 conf volvCu, unblocked vol 370 378 790 792 378 808 778 360tC, single (s) 4.1 4.1 7.1 6.5 6.2 7.1 6.5 6.2tC, 2 stage (s)tF (s) 2.2 2.2 3.5 4.0 3.3 3.5 4.0 3.3p0 queue free % 99 99 97 94 96 90 99 99cM capacity (veh/h) 1191 1185 294 315 670 268 319 679
Direction, Lane # EB 1 WB 1 NB 1 SB 1Volume Total 383 377 55 40Volume Left 12 10 8 27Volume Right 1 29 29 10cSH 1191 1185 431 320Volume to Capacity 0.01 0.01 0.13 0.12Queue Length 95th (ft) 1 1 11 11Control Delay (s) 0.4 0.3 14.6 17.8Lane LOS A A B CApproach Delay (s) 0.4 0.3 14.6 17.8Approach LOS B C
Intersection SummaryAverage Delay 2.1Intersection Capacity Utilization 40.3% ICU Level of Service AAnalysis Period (min) 15

Appendix C LOS Calculation Worksheets – 2020 No Project
Conditions
HCM Signalized Intersection Capacity Analysis Children's Hospital1: MLK Way & 55th Street 2020 AM No Project
Fehr & Peers Synchro 8 Report
Movement EBL EBT EBR WBL WBT WBR NBU NBL NBT NBR SBL SBTLane ConfigurationsVolume (vph) 20 180 230 60 240 80 20 150 1380 60 90 1330Ideal Flow (vphpl) 1900 1900 1900 1900 1900 1900 1900 1900 1900 1900 1900 1900Total Lost time (s) 5.0 5.0 4.5 5.0 4.5 5.0Lane Util. Factor 1.00 1.00 1.00 0.91 1.00 0.91Frpb, ped/bikes 0.98 0.99 1.00 1.00 1.00 1.00Flpb, ped/bikes 1.00 1.00 1.00 1.00 1.00 1.00Frt 0.93 0.97 1.00 0.99 1.00 0.99Flt Protected 1.00 0.99 0.95 1.00 0.95 1.00Satd. Flow (prot) 1703 1747 1770 5036 1770 5046Flt Permitted 0.98 0.77 0.95 1.00 0.95 1.00Satd. Flow (perm) 1664 1360 1770 5036 1770 5046Peak-hour factor, PHF 1.00 1.00 1.00 1.00 1.00 1.00 1.00 1.00 1.00 1.00 1.00 1.00Adj. Flow (vph) 20 180 230 60 240 80 20 150 1380 60 90 1330RTOR Reduction (vph) 0 52 0 0 12 0 0 0 4 0 0 4Lane Group Flow (vph) 0 378 0 0 368 0 0 170 1436 0 90 1376Confl. Peds. (#/hr) 10 19 19 10 28Confl. Bikes (#/hr) 21 20 8Heavy Vehicles (%) 1% 1% 1% 4% 4% 4% 2% 2% 2% 2% 2% 2%Turn Type Perm NA Perm NA Prot Prot NA Prot NAProtected Phases 4 8 5 5 2 1 6Permitted Phases 4 8Actuated Green, G (s) 27.7 27.7 14.4 41.8 6.0 33.4Effective Green, g (s) 27.7 27.7 14.4 41.8 6.0 33.4Actuated g/C Ratio 0.31 0.31 0.16 0.46 0.07 0.37Clearance Time (s) 5.0 5.0 4.5 5.0 4.5 5.0Vehicle Extension (s) 3.0 3.0 3.0 3.0 3.0 3.0Lane Grp Cap (vph) 512 418 283 2338 118 1872v/s Ratio Prot 0.10 c0.29 0.05 c0.27v/s Ratio Perm 0.23 c0.27v/c Ratio 0.74 0.88 0.60 0.61 0.76 0.74Uniform Delay, d1 27.9 29.6 35.1 18.1 41.3 24.5Progression Factor 1.00 1.00 0.54 0.20 1.00 1.00Incremental Delay, d2 5.5 19.0 3.3 1.1 24.8 2.6Delay (s) 33.4 48.6 22.1 4.7 66.1 27.1Level of Service C D C A E CApproach Delay (s) 33.4 48.6 6.6 29.5Approach LOS C D A C
Intersection SummaryHCM 2000 Control Delay 22.3 HCM 2000 Level of Service CHCM 2000 Volume to Capacity ratio 0.78Actuated Cycle Length (s) 90.0 Sum of lost time (s) 14.5Intersection Capacity Utilization 90.0% ICU Level of Service EAnalysis Period (min) 15c Critical Lane Group

HCM Signalized Intersection Capacity Analysis Children's Hospital1: MLK Way & 55th Street 2020 AM No Project
Fehr & Peers Synchro 8 Report
Movement SBRLane ConfigurationsVolume (vph) 50Ideal Flow (vphpl) 1900Total Lost time (s)Lane Util. FactorFrpb, ped/bikesFlpb, ped/bikesFrtFlt ProtectedSatd. Flow (prot)Flt PermittedSatd. Flow (perm)Peak-hour factor, PHF 1.00Adj. Flow (vph) 50RTOR Reduction (vph) 0Lane Group Flow (vph) 0Confl. Peds. (#/hr) 16Confl. Bikes (#/hr) 10Heavy Vehicles (%) 2%Turn TypeProtected PhasesPermitted PhasesActuated Green, G (s)Effective Green, g (s)Actuated g/C RatioClearance Time (s)Vehicle Extension (s)Lane Grp Cap (vph)v/s Ratio Protv/s Ratio Permv/c RatioUniform Delay, d1Progression FactorIncremental Delay, d2Delay (s)Level of ServiceApproach Delay (s)Approach LOS
Intersection Summary
HCM Unsignalized Intersection Capacity Analysis Children's Hospital2: Dover Street & 55th Street 2020 AM No Project
Fehr & Peers Synchro 8 Report
Movement EBL EBT EBR WBL WBT WBR NBL NBT NBR SBL SBT SBRLane ConfigurationsVolume (veh/h) 30 290 10 30 320 10 10 10 20 10 10 30Sign Control Free Free Stop StopGrade 0% 0% 0% 0%Peak Hour Factor 1.00 1.00 1.00 1.00 1.00 1.00 1.00 1.00 1.00 1.00 1.00 1.00Hourly flow rate (vph) 30 290 10 30 320 10 10 10 20 10 10 30Pedestrians 12 26 20 8Lane Width (ft) 12.0 12.0 12.0 12.0Walking Speed (ft/s) 4.0 4.0 4.0 4.0Percent Blockage 1 2 2 1Right turn flare (veh)Median type None NoneMedian storage veh)Upstream signal (ft) 641 677pX, platoon unblocked 0.91 0.91 0.91 0.91 0.91 0.91vC, conflicting volume 338 320 807 773 341 799 773 345vC1, stage 1 conf volvC2, stage 2 conf volvCu, unblocked vol 220 320 737 699 341 728 699 228tC, single (s) 4.1 4.1 7.1 6.5 6.2 7.1 6.5 6.2tC, 2 stage (s)tF (s) 2.2 2.2 3.5 4.0 3.3 3.5 4.0 3.3p0 queue free % 98 98 96 97 97 96 97 96cM capacity (veh/h) 1201 1208 263 309 679 267 306 722
Direction, Lane # EB 1 WB 1 NB 1 SB 1Volume Total 330 360 40 50Volume Left 30 30 10 10Volume Right 10 10 20 30cSH 1201 1208 401 447Volume to Capacity 0.02 0.02 0.10 0.11Queue Length 95th (ft) 2 2 8 9Control Delay (s) 1.0 0.9 15.0 14.1Lane LOS A A B BApproach Delay (s) 1.0 0.9 15.0 14.1Approach LOS B B
Intersection SummaryAverage Delay 2.5Intersection Capacity Utilization 40.9% ICU Level of Service AAnalysis Period (min) 15

HCM Signalized Intersection Capacity Analysis Children's Hospital3: 55th Street & Shattuck Ave 2020 AM No Project
Fehr & Peers Synchro 8 Report
Movement EBL EBT EBR WBL WBT WBR NBL NBT NBR SBL SBT SBRLane ConfigurationsVolume (vph) 60 220 60 30 270 50 40 460 30 30 570 40Ideal Flow (vphpl) 1900 1900 1900 1900 1900 1900 1900 1900 1900 1900 1900 1900Total Lost time (s) 3.0 3.0 5.0 5.0Lane Util. Factor 1.00 1.00 1.00 1.00Frpb, ped/bikes 0.99 0.99 1.00 1.00Flpb, ped/bikes 1.00 1.00 1.00 1.00Frt 0.98 0.98 0.99 0.99Flt Protected 0.99 1.00 1.00 1.00Satd. Flow (prot) 1724 1787 1836 1855Flt Permitted 0.85 0.96 0.93 0.96Satd. Flow (perm) 1484 1722 1710 1792Peak-hour factor, PHF 1.00 1.00 1.00 1.00 1.00 1.00 1.00 1.00 1.00 1.00 1.00 1.00Adj. Flow (vph) 60 220 60 30 270 50 40 460 30 30 570 40RTOR Reduction (vph) 0 10 0 0 8 0 0 3 0 0 3 0Lane Group Flow (vph) 0 330 0 0 342 0 0 527 0 0 637 0Confl. Peds. (#/hr) 8 17 17 8 10 23 23 10Confl. Bikes (#/hr) 29 13 17 32Heavy Vehicles (%) 5% 5% 5% 3% 3% 3% 2% 2% 2% 1% 1% 1%Turn Type Perm NA Perm NA Perm NA Perm NAProtected Phases 2 6 4 8Permitted Phases 2 6 4 4 8Actuated Green, G (s) 25.0 25.0 47.0 47.0Effective Green, g (s) 25.0 25.0 47.0 47.0Actuated g/C Ratio 0.31 0.31 0.59 0.59Clearance Time (s) 3.0 3.0 5.0 5.0Lane Grp Cap (vph) 463 538 1004 1052v/s Ratio Protv/s Ratio Perm c0.22 0.20 0.31 c0.36v/c Ratio 0.71 0.64 0.53 0.61Uniform Delay, d1 24.3 23.6 9.8 10.6Progression Factor 1.00 1.00 1.00 1.00Incremental Delay, d2 9.0 5.7 2.0 2.6Delay (s) 33.4 29.3 11.8 13.2Level of Service C C B BApproach Delay (s) 33.4 29.3 11.8 13.2Approach LOS C C B B
Intersection SummaryHCM 2000 Control Delay 19.5 HCM 2000 Level of Service BHCM 2000 Volume to Capacity ratio 0.64Actuated Cycle Length (s) 80.0 Sum of lost time (s) 8.0Intersection Capacity Utilization 80.2% ICU Level of Service DAnalysis Period (min) 15c Critical Lane Group
HCM Signalized Intersection Capacity Analysis Children's Hospital4: 55th Street & Telegraph Ave 2020 AM No Project
Fehr & Peers Synchro 8 Report
Movement EBL EBT EBR WBL WBT WBR NBL NBT NBR SBL SBT SBRLane ConfigurationsVolume (vph) 150 20 90 40 10 10 70 850 50 40 980 260Ideal Flow (vphpl) 1900 1900 1900 1900 1900 1900 1900 1900 1900 1900 1900 1900Total Lost time (s) 4.5 4.5 4.5 4.5 4.5 4.5Lane Util. Factor 1.00 1.00 1.00 0.95 1.00 0.95Frpb, ped/bikes 0.99 0.99 1.00 0.99 1.00 0.98Flpb, ped/bikes 1.00 0.99 1.00 1.00 0.99 1.00Frt 0.95 0.98 1.00 0.99 1.00 0.97Flt Protected 0.97 0.97 0.95 1.00 0.95 1.00Satd. Flow (prot) 1645 1709 1762 3491 1767 3409Flt Permitted 0.79 0.76 0.17 1.00 0.28 1.00Satd. Flow (perm) 1334 1337 317 3491 522 3409Peak-hour factor, PHF 1.00 1.00 1.00 1.00 1.00 1.00 1.00 1.00 1.00 1.00 1.00 1.00Adj. Flow (vph) 150 20 90 40 10 10 70 850 50 40 980 260RTOR Reduction (vph) 0 32 0 0 8 0 0 5 0 0 26 0Lane Group Flow (vph) 0 228 0 0 53 0 70 895 0 40 1214 0Confl. Peds. (#/hr) 8 15 15 8 17 23 23 17Confl. Bikes (#/hr) 20 20 56 36Heavy Vehicles (%) 5% 5% 5% 4% 4% 4% 2% 2% 2% 1% 1% 1%Turn Type Perm NA Perm NA Perm NA Perm NAProtected Phases 4 8 2 6Permitted Phases 4 8 2 6Actuated Green, G (s) 17.5 17.5 43.5 43.5 43.5 43.5Effective Green, g (s) 17.5 17.5 43.5 43.5 43.5 43.5Actuated g/C Ratio 0.25 0.25 0.62 0.62 0.62 0.62Clearance Time (s) 4.5 4.5 4.5 4.5 4.5 4.5Vehicle Extension (s) 3.0 3.0 3.0 3.0 3.0 3.0Lane Grp Cap (vph) 333 334 196 2169 324 2118v/s Ratio Prot 0.26 c0.36v/s Ratio Perm c0.17 0.04 0.22 0.08v/c Ratio 0.68 0.16 0.36 0.41 0.12 0.57Uniform Delay, d1 23.7 20.5 6.4 6.7 5.4 7.8Progression Factor 1.00 1.00 1.00 1.00 1.00 1.00Incremental Delay, d2 5.7 0.2 5.0 0.6 0.8 1.1Delay (s) 29.5 20.7 11.5 7.3 6.2 8.9Level of Service C C B A A AApproach Delay (s) 29.5 20.7 7.6 8.8Approach LOS C C A A
Intersection SummaryHCM 2000 Control Delay 10.7 HCM 2000 Level of Service BHCM 2000 Volume to Capacity ratio 0.60Actuated Cycle Length (s) 70.0 Sum of lost time (s) 9.0Intersection Capacity Utilization 68.8% ICU Level of Service CAnalysis Period (min) 15c Critical Lane Group

HCM Unsignalized Intersection Capacity Analysis Children's Hospital5: MLK Way & 54th Street 2020 AM No Project
Fehr & Peers Synchro 8 Report
Movement EBL EBT EBR WBL WBT WBR NBU NBL NBT NBR SBL SBTLane ConfigurationsVolume (veh/h) 10 10 50 10 10 10 10 20 1560 20 20 1590Sign Control Stop Stop Free FreeGrade 0% 0% 0% 0%Peak Hour Factor 1.00 1.00 1.00 1.00 1.00 1.00 1.00 1.00 1.00 1.00 1.00 1.00Hourly flow rate (vph) 10 10 50 10 10 10 0 20 1560 20 20 1590Pedestrians 10 8 11Lane Width (ft) 12.0 12.0 12.0Walking Speed (ft/s) 4.0 4.0 4.0Percent Blockage 1 1 1Right turn flare (veh)Median type None NoneMedian storage veh)Upstream signal (ft) 299 294pX, platoon unblocked 0.85 0.85 0.77 0.85 0.85 0.84 0.00 0.77 0.84vC, conflicting volume 2220 3273 556 2254 3268 538 0 1610 1588vC1, stage 1 conf volvC2, stage 2 conf volvCu, unblocked vol 527 1761 0 567 1756 0 0 751 1015tC, single (s) 7.5 6.5 6.9 7.5 6.5 6.9 0.0 4.1 4.1tC, 2 stage (s)tF (s) 3.5 4.0 3.3 3.5 4.0 3.3 0.0 2.2 2.2p0 queue free % 97 85 94 96 85 99 0 97 96cM capacity (veh/h) 306 67 826 270 68 906 0 653 568
Direction, Lane # EB 1 WB 1 NB 1 NB 2 NB 3 SB 1 SB 2 SB 3Volume Total 70 30 410 780 410 418 795 408Volume Left 10 10 20 0 0 20 0 0Volume Right 50 10 0 0 20 0 0 10cSH 289 153 653 1700 1700 568 1700 1700Volume to Capacity 0.24 0.20 0.03 0.46 0.24 0.04 0.47 0.24Queue Length 95th (ft) 23 17 2 0 0 3 0 0Control Delay (s) 21.4 34.2 0.9 0.0 0.0 1.1 0.0 0.0Lane LOS C D A AApproach Delay (s) 21.4 34.2 0.2 0.3Approach LOS C D
Intersection SummaryAverage Delay 1.0Intersection Capacity Utilization 66.3% ICU Level of Service CAnalysis Period (min) 15
HCM Unsignalized Intersection Capacity Analysis Children's Hospital5: MLK Way & 54th Street 2020 AM No Project
Fehr & Peers Synchro 8 Report
Movement SBRLane ConfigurationsVolume (veh/h) 10Sign ControlGradePeak Hour Factor 1.00Hourly flow rate (vph) 10PedestriansLane Width (ft)Walking Speed (ft/s)Percent BlockageRight turn flare (veh)Median typeMedian storage veh)Upstream signal (ft)pX, platoon unblockedvC, conflicting volumevC1, stage 1 conf volvC2, stage 2 conf volvCu, unblocked voltC, single (s)tC, 2 stage (s)tF (s)p0 queue free %cM capacity (veh/h)
Direction, Lane #

HCM Unsignalized Intersection Capacity Analysis Children's Hospital6: Dover Street & 54th Street 2020 AM No Project
Fehr & Peers Synchro 8 Report
Movement EBL EBT EBR WBL WBT WBR NBL NBT NBR SBL SBT SBRLane ConfigurationsVolume (veh/h) 10 10 10 10 10 10 10 20 20 10 40 10Sign Control Stop Stop Free FreeGrade 0% 0% 0% 0%Peak Hour Factor 1.00 1.00 1.00 1.00 1.00 1.00 1.00 1.00 1.00 1.00 1.00 1.00Hourly flow rate (vph) 10 10 10 10 10 10 10 20 20 10 40 10Pedestrians 13 19 3 8Lane Width (ft) 12.0 12.0 12.0 12.0Walking Speed (ft/s) 4.0 4.0 4.0 4.0Percent Blockage 1 2 0 1Right turn flare (veh)Median type None NoneMedian storage veh)Upstream signal (ft)pX, platoon unblockedvC, conflicting volume 151 157 61 152 152 57 63 59vC1, stage 1 conf volvC2, stage 2 conf volvCu, unblocked vol 151 157 61 152 152 57 63 59tC, single (s) 7.1 6.5 6.2 7.1 6.5 6.2 4.1 4.1tC, 2 stage (s)tF (s) 3.5 4.0 3.3 3.5 4.0 3.3 2.2 2.2p0 queue free % 99 99 99 99 99 99 99 99cM capacity (veh/h) 767 710 996 765 714 992 1536 1533
Direction, Lane # EB 1 WB 1 NB 1 SB 1Volume Total 30 30 50 60Volume Left 10 10 10 10Volume Right 10 10 20 10cSH 807 807 1536 1533Volume to Capacity 0.04 0.04 0.01 0.01Queue Length 95th (ft) 3 3 0 0Control Delay (s) 9.6 9.6 1.5 1.3Lane LOS A A A AApproach Delay (s) 9.6 9.6 1.5 1.3Approach LOS A A
Intersection SummaryAverage Delay 4.3Intersection Capacity Utilization 21.1% ICU Level of Service AAnalysis Period (min) 15
HCM Unsignalized Intersection Capacity Analysis Children's Hospital7: Shattuck Ave & 54th Street 2020 AM No Project
Fehr & Peers Synchro 8 Report
Movement EBL EBR NBL NBT SBT SBRLane ConfigurationsVolume (veh/h) 10 20 20 520 630 10Sign Control Stop Free FreeGrade 0% 0% 0%Peak Hour Factor 1.00 1.00 1.00 1.00 1.00 1.00Hourly flow rate (vph) 10 20 20 520 630 10Pedestrians 12 3 2Lane Width (ft) 12.0 12.0 12.0Walking Speed (ft/s) 4.0 4.0 4.0Percent Blockage 1 0 0Right turn flare (veh)Median type None NoneMedian storage veh)Upstream signal (ft) 550 282pX, platoon unblocked 0.79 0.79 0.79vC, conflicting volume 1209 650 652vC1, stage 1 conf volvC2, stage 2 conf volvCu, unblocked vol 1130 420 423tC, single (s) 6.4 6.2 4.1tC, 2 stage (s)tF (s) 3.5 3.3 2.2p0 queue free % 94 96 98cM capacity (veh/h) 173 495 886
Direction, Lane # EB 1 NB 1 SB 1Volume Total 30 540 640Volume Left 10 20 0Volume Right 20 0 10cSH 305 886 1700Volume to Capacity 0.10 0.02 0.38Queue Length 95th (ft) 8 2 0Control Delay (s) 18.1 0.6 0.0Lane LOS C AApproach Delay (s) 18.1 0.6 0.0Approach LOS C
Intersection SummaryAverage Delay 0.7Intersection Capacity Utilization 54.5% ICU Level of Service AAnalysis Period (min) 15

HCM Signalized Intersection Capacity Analysis Children's Hospital8: MLK Way & 53rd Street 2020 AM No Project
Fehr & Peers Synchro 8 Report
Movement EBL EBT EBR WBL WBT WBR NBL NBT NBR SBL SBT SBRLane ConfigurationsVolume (vph) 10 10 40 20 10 20 30 1590 30 20 1650 10Ideal Flow (vphpl) 1900 1900 1900 1900 1900 1900 1900 1900 1900 1900 1900 1900Total Lost time (s) 5.0 5.0 4.0 3.5 4.0 3.5Lane Util. Factor 1.00 1.00 1.00 0.91 1.00 0.91Frpb, ped/bikes 0.98 0.99 1.00 1.00 1.00 1.00Flpb, ped/bikes 1.00 1.00 1.00 1.00 1.00 1.00Frt 0.91 0.95 1.00 1.00 1.00 1.00Flt Protected 0.99 0.98 0.95 1.00 0.95 1.00Satd. Flow (prot) 1653 1742 1770 5065 1787 5128Flt Permitted 0.96 0.88 0.95 1.00 0.95 1.00Satd. Flow (perm) 1595 1569 1770 5065 1787 5128Peak-hour factor, PHF 1.00 1.00 1.00 1.00 1.00 1.00 1.00 1.00 1.00 1.00 1.00 1.00Adj. Flow (vph) 10 10 40 20 10 20 30 1590 30 20 1650 10RTOR Reduction (vph) 0 33 0 0 16 0 0 1 0 0 0 0Lane Group Flow (vph) 0 27 0 0 34 0 30 1619 0 20 1660 0Confl. Peds. (#/hr) 10 17 17 10 17 26Confl. Bikes (#/hr) 7 17Heavy Vehicles (%) 2% 2% 2% 0% 0% 0% 2% 2% 2% 1% 1% 1%Turn Type Perm NA Perm NA Prot NA Prot NAProtected Phases 4 8 5 2 1 6Permitted Phases 4 8Actuated Green, G (s) 15.8 15.8 4.5 58.1 3.6 57.2Effective Green, g (s) 15.8 15.8 4.5 58.1 3.6 57.2Actuated g/C Ratio 0.18 0.18 0.05 0.65 0.04 0.64Clearance Time (s) 5.0 5.0 4.0 3.5 4.0 3.5Vehicle Extension (s) 3.0 3.0 3.0 3.0 3.0 3.0Lane Grp Cap (vph) 280 275 88 3269 71 3259v/s Ratio Prot 0.02 c0.32 0.01 c0.32v/s Ratio Perm 0.02 c0.02v/c Ratio 0.10 0.12 0.34 0.50 0.28 0.51Uniform Delay, d1 31.1 31.3 41.3 8.3 41.9 8.8Progression Factor 1.00 1.02 1.17 0.41 0.53 0.25Incremental Delay, d2 0.2 0.2 1.8 0.4 1.6 0.4Delay (s) 31.3 32.1 50.3 3.8 23.9 2.7Level of Service C C D A C AApproach Delay (s) 31.3 32.1 4.7 2.9Approach LOS C C A A
Intersection SummaryHCM 2000 Control Delay 4.7 HCM 2000 Level of Service AHCM 2000 Volume to Capacity ratio 0.44Actuated Cycle Length (s) 90.0 Sum of lost time (s) 12.5Intersection Capacity Utilization 56.8% ICU Level of Service BAnalysis Period (min) 15c Critical Lane Group
HCM Unsignalized Intersection Capacity Analysis Children's Hospital9: Dover Street & 53rd Street 2020 AM No Project
Fehr & Peers Synchro 8 Report
Movement EBL EBT EBR WBL WBT WBR NBL NBT NBR SBL SBT SBRLane ConfigurationsVolume (veh/h) 20 10 30 10 10 10 20 30 20 10 30 20Sign Control Stop Stop Free FreeGrade 0% 0% 0% 0%Peak Hour Factor 1.00 1.00 1.00 1.00 1.00 1.00 1.00 1.00 1.00 1.00 1.00 1.00Hourly flow rate (vph) 20 10 30 10 10 10 20 30 20 10 30 20Pedestrians 29 28 3 3Lane Width (ft) 12.0 12.0 12.0 12.0Walking Speed (ft/s) 4.0 4.0 4.0 4.0Percent Blockage 2 2 0 0Right turn flare (veh)Median type None NoneMedian storage veh)Upstream signal (ft)pX, platoon unblockedvC, conflicting volume 187 207 72 206 207 71 79 78vC1, stage 1 conf volvC2, stage 2 conf volvCu, unblocked vol 187 207 72 206 207 71 79 78tC, single (s) 7.1 6.5 6.2 7.1 6.5 6.2 4.1 4.1tC, 2 stage (s)tF (s) 3.5 4.0 3.3 3.5 4.0 3.3 2.2 2.2p0 queue free % 97 98 97 99 98 99 99 99cM capacity (veh/h) 703 648 969 670 648 971 1495 1497
Direction, Lane # EB 1 WB 1 NB 1 SB 1Volume Total 60 30 70 60Volume Left 20 10 20 10Volume Right 30 10 20 20cSH 802 738 1495 1497Volume to Capacity 0.07 0.04 0.01 0.01Queue Length 95th (ft) 6 3 1 1Control Delay (s) 9.9 10.1 2.2 1.3Lane LOS A B A AApproach Delay (s) 9.9 10.1 2.2 1.3Approach LOS A B
Intersection SummaryAverage Delay 5.1Intersection Capacity Utilization 23.2% ICU Level of Service AAnalysis Period (min) 15

HCM Signalized Intersection Capacity Analysis Children's Hospital10: MLK Way & 52nd Street 2020 AM No Project
Fehr & Peers Synchro 8 Report
Movement EBL EBT EBR WBL WBT WBR NBU NBL NBT NBR SBU SBLLane ConfigurationsVolume (vph) 40 100 110 80 90 170 60 80 1430 150 10 120Ideal Flow (vphpl) 1900 1900 1900 1900 1900 1900 1900 1900 1900 1900 1900 1900Total Lost time (s) 5.0 5.0 5.0 5.0 4.5 4.5 4.0Lane Util. Factor 1.00 1.00 1.00 1.00 1.00 0.91 1.00Frpb, ped/bikes 1.00 0.96 1.00 0.97 1.00 1.00 1.00Flpb, ped/bikes 0.99 1.00 0.98 1.00 1.00 1.00 1.00Frt 1.00 0.92 1.00 0.85 1.00 0.99 1.00Flt Protected 0.95 1.00 0.98 1.00 0.95 1.00 0.95Satd. Flow (prot) 1772 1667 1786 1537 1787 5050 1787Flt Permitted 0.59 1.00 0.67 1.00 0.95 1.00 0.95Satd. Flow (perm) 1105 1667 1218 1537 1787 5050 1787Peak-hour factor, PHF 1.00 1.00 1.00 1.00 1.00 1.00 1.00 1.00 1.00 1.00 1.00 1.00Adj. Flow (vph) 40 100 110 80 90 170 60 80 1430 150 10 120RTOR Reduction (vph) 0 50 0 0 0 127 0 0 12 0 0 0Lane Group Flow (vph) 40 160 0 0 170 43 0 140 1568 0 0 130Confl. Peds. (#/hr) 13 64 64 13 10Confl. Bikes (#/hr) 8 7 2Heavy Vehicles (%) 1% 1% 1% 2% 2% 2% 1% 1% 1% 1% 1% 1%Turn Type Perm NA Perm NA Perm Prot Prot NA Prot ProtProtected Phases 4 8 5 5 2 1 1Permitted Phases 4 8 8Actuated Green, G (s) 22.8 22.8 22.8 22.8 7.5 41.2 12.5Effective Green, g (s) 22.8 22.8 22.8 22.8 7.5 41.2 12.5Actuated g/C Ratio 0.25 0.25 0.25 0.25 0.08 0.46 0.14Clearance Time (s) 5.0 5.0 5.0 5.0 4.5 4.5 4.0Vehicle Extension (s) 2.0 2.0 2.0 2.0 2.0 2.0 2.0Lane Grp Cap (vph) 279 422 308 389 148 2311 248v/s Ratio Prot 0.10 c0.08 c0.31 0.07v/s Ratio Perm 0.04 c0.14 0.03v/c Ratio 0.14 0.38 0.55 0.11 0.95 0.68 0.52Uniform Delay, d1 26.0 27.8 29.2 25.8 41.0 19.2 36.0Progression Factor 1.00 1.00 1.00 1.00 1.00 1.07 0.78Incremental Delay, d2 0.1 0.2 1.2 0.0 34.8 0.7 0.8Delay (s) 26.1 28.0 30.4 25.9 75.7 21.3 28.9Level of Service C C C C E C CApproach Delay (s) 27.7 28.1 25.7Approach LOS C C C
Intersection SummaryHCM 2000 Control Delay 21.2 HCM 2000 Level of Service CHCM 2000 Volume to Capacity ratio 0.66Actuated Cycle Length (s) 90.0 Sum of lost time (s) 14.0Intersection Capacity Utilization 94.9% ICU Level of Service FAnalysis Period (min) 15c Critical Lane Group
HCM Signalized Intersection Capacity Analysis Children's Hospital10: MLK Way & 52nd Street 2020 AM No Project
Fehr & Peers Synchro 8 Report
Movement SBT SBRLane ConfigurationsVolume (vph) 1570 0Ideal Flow (vphpl) 1900 1900Total Lost time (s) 4.5Lane Util. Factor 0.91Frpb, ped/bikes 1.00Flpb, ped/bikes 1.00Frt 1.00Flt Protected 1.00Satd. Flow (prot) 5136Flt Permitted 1.00Satd. Flow (perm) 5136Peak-hour factor, PHF 1.00 1.00Adj. Flow (vph) 1570 0RTOR Reduction (vph) 0 0Lane Group Flow (vph) 1570 0Confl. Peds. (#/hr) 13Confl. Bikes (#/hr) 13Heavy Vehicles (%) 1% 1%Turn Type NAProtected Phases 6Permitted PhasesActuated Green, G (s) 45.7Effective Green, g (s) 45.7Actuated g/C Ratio 0.51Clearance Time (s) 4.5Vehicle Extension (s) 2.0Lane Grp Cap (vph) 2607v/s Ratio Prot c0.31v/s Ratio Permv/c Ratio 0.60Uniform Delay, d1 15.7Progression Factor 0.77Incremental Delay, d2 0.9Delay (s) 13.0Level of Service BApproach Delay (s) 14.2Approach LOS B
Intersection Summary

HCM Signalized Intersection Capacity Analysis Children's Hospital11: 52nd Street & Garage 2020 AM No Project
Fehr & Peers Synchro 8 Report
Movement EBL EBT EBR WBL WBT WBR NBL NBT NBR SBL SBT SBRLane ConfigurationsVolume (vph) 112 230 8 6 300 82 15 7 10 13 2 13Ideal Flow (vphpl) 1900 1900 1900 1900 1900 1900 1900 1900 1900 1900 1900 1900Total Lost time (s) 3.0 3.0 3.0 3.0Lane Util. Factor 0.95 0.95 1.00 1.00Frpb, ped/bikes 1.00 0.99 0.94 0.99Flpb, ped/bikes 1.00 1.00 1.00 0.92Frt 1.00 0.97 0.96 0.94Flt Protected 0.98 1.00 0.98 0.98Satd. Flow (prot) 3443 3438 1447 1598Flt Permitted 0.75 0.95 0.93 0.94Satd. Flow (perm) 2636 3268 1383 1532Peak-hour factor, PHF 1.00 1.00 1.00 1.00 1.00 1.00 1.00 1.00 1.00 1.00 1.00 1.00Adj. Flow (vph) 112 230 8 6 300 82 15 7 10 13 2 13RTOR Reduction (vph) 0 3 0 0 48 0 0 5 0 0 7 0Lane Group Flow (vph) 0 347 0 0 340 0 0 27 0 0 21 0Confl. Peds. (#/hr) 23 72 72 23 263 263Confl. Bikes (#/hr) 8 7 2Heavy Vehicles (%) 2% 2% 2% 0% 0% 0% 16% 16% 16% 0% 0% 0%Turn Type Prot NA Perm NA Perm NA Perm NAProtected Phases 5 2 6 4 8Permitted Phases 6 4 8Actuated Green, G (s) 21.0 14.0 23.0 23.0Effective Green, g (s) 21.0 14.0 23.0 23.0Actuated g/C Ratio 0.42 0.28 0.46 0.46Clearance Time (s) 3.0 3.0 3.0 3.0Lane Grp Cap (vph) 1171 915 636 704v/s Ratio Prot c0.02v/s Ratio Perm 0.10 c0.10 c0.02 0.01v/c Ratio 0.30 0.37 0.04 0.03Uniform Delay, d1 9.6 14.5 7.4 7.4Progression Factor 1.00 1.00 1.00 1.00Incremental Delay, d2 0.6 1.2 0.1 0.1Delay (s) 10.2 15.6 7.6 7.5Level of Service B B A AApproach Delay (s) 10.2 15.6 7.6 7.5Approach LOS B B A A
Intersection SummaryHCM 2000 Control Delay 12.7 HCM 2000 Level of Service BHCM 2000 Volume to Capacity ratio 0.18Actuated Cycle Length (s) 50.0 Sum of lost time (s) 9.0Intersection Capacity Utilization 52.5% ICU Level of Service AAnalysis Period (min) 15c Critical Lane Group
HCM Unsignalized Intersection Capacity Analysis Children's Hospital12: 52nd Street & Dover Street 2020 AM No Project
Fehr & Peers Synchro 8 Report
Movement EBL EBT EBR WBL WBT WBR NBL NBT NBR SBL SBT SBRLane ConfigurationsVolume (veh/h) 30 230 1 11 360 40 3 0 7 40 3 30Sign Control Free Free Stop StopGrade 0% 0% 0% 0%Peak Hour Factor 1.00 1.00 1.00 1.00 1.00 1.00 1.00 1.00 1.00 1.00 1.00 1.00Hourly flow rate (vph) 30 230 1 11 360 40 3 0 7 40 3 30Pedestrians 26 13 16 30Lane Width (ft) 12.0 12.0 12.0 12.0Walking Speed (ft/s) 4.0 4.0 4.0 4.0Percent Blockage 2 1 1 3Right turn flare (veh)Median type None NoneMedian storage veh)Upstream signal (ft) 312 647pX, platoon unblocked 0.90 0.94 0.93 0.93 0.94 0.93 0.93 0.90vC, conflicting volume 430 247 766 758 260 742 739 436vC1, stage 1 conf volvC2, stage 2 conf volvCu, unblocked vol 304 166 560 552 180 534 530 311tC, single (s) 4.1 4.1 7.2 6.6 6.3 7.1 6.5 6.2tC, 2 stage (s)tF (s) 2.2 2.2 3.6 4.1 3.4 3.5 4.0 3.3p0 queue free % 97 99 99 100 99 90 99 95cM capacity (veh/h) 1091 1314 341 370 773 384 392 626
Direction, Lane # EB 1 WB 1 NB 1 SB 1Volume Total 261 411 10 73Volume Left 30 11 3 40Volume Right 1 40 7 30cSH 1091 1314 560 457Volume to Capacity 0.03 0.01 0.02 0.16Queue Length 95th (ft) 2 1 1 14Control Delay (s) 1.2 0.3 11.5 14.4Lane LOS A A B BApproach Delay (s) 1.2 0.3 11.5 14.4Approach LOS B B
Intersection SummaryAverage Delay 2.1Intersection Capacity Utilization 44.8% ICU Level of Service AAnalysis Period (min) 15
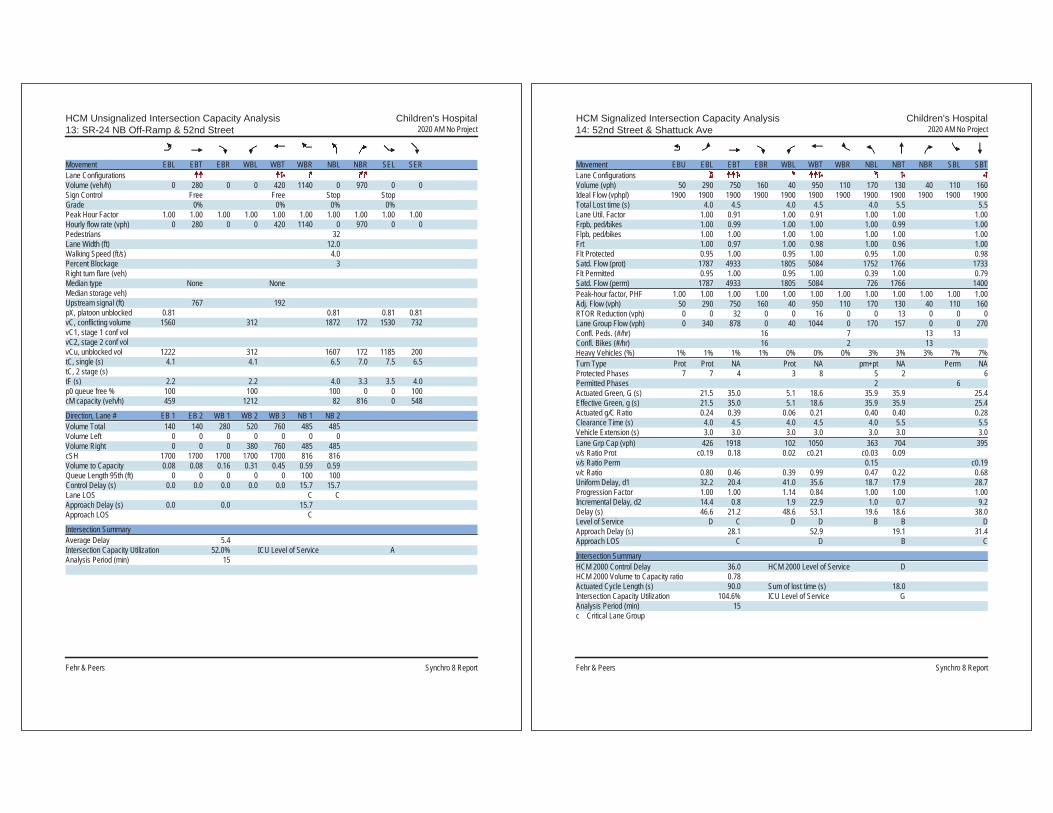
HCM Unsignalized Intersection Capacity Analysis Children's Hospital13: SR-24 NB Off-Ramp & 52nd Street 2020 AM No Project
Fehr & Peers Synchro 8 Report
Movement EBL EBT EBR WBL WBT WBR NBL NBR SEL SERLane ConfigurationsVolume (veh/h) 0 280 0 0 420 1140 0 970 0 0Sign Control Free Free Stop StopGrade 0% 0% 0% 0%Peak Hour Factor 1.00 1.00 1.00 1.00 1.00 1.00 1.00 1.00 1.00 1.00Hourly flow rate (vph) 0 280 0 0 420 1140 0 970 0 0Pedestrians 32Lane Width (ft) 12.0Walking Speed (ft/s) 4.0Percent Blockage 3Right turn flare (veh)Median type None NoneMedian storage veh)Upstream signal (ft) 767 192pX, platoon unblocked 0.81 0.81 0.81 0.81vC, conflicting volume 1560 312 1872 172 1530 732vC1, stage 1 conf volvC2, stage 2 conf volvCu, unblocked vol 1222 312 1607 172 1185 200tC, single (s) 4.1 4.1 6.5 7.0 7.5 6.5tC, 2 stage (s)tF (s) 2.2 2.2 4.0 3.3 3.5 4.0p0 queue free % 100 100 100 0 0 100cM capacity (veh/h) 459 1212 82 816 0 548
Direction, Lane # EB 1 EB 2 WB 1 WB 2 WB 3 NB 1 NB 2Volume Total 140 140 280 520 760 485 485Volume Left 0 0 0 0 0 0 0Volume Right 0 0 0 380 760 485 485cSH 1700 1700 1700 1700 1700 816 816Volume to Capacity 0.08 0.08 0.16 0.31 0.45 0.59 0.59Queue Length 95th (ft) 0 0 0 0 0 100 100Control Delay (s) 0.0 0.0 0.0 0.0 0.0 15.7 15.7Lane LOS C CApproach Delay (s) 0.0 0.0 15.7Approach LOS C
Intersection SummaryAverage Delay 5.4Intersection Capacity Utilization 52.0% ICU Level of Service AAnalysis Period (min) 15
HCM Signalized Intersection Capacity Analysis Children's Hospital14: 52nd Street & Shattuck Ave 2020 AM No Project
Fehr & Peers Synchro 8 Report
Movement EBU EBL EBT EBR WBL WBT WBR NBL NBT NBR SBL SBTLane ConfigurationsVolume (vph) 50 290 750 160 40 950 110 170 130 40 110 160Ideal Flow (vphpl) 1900 1900 1900 1900 1900 1900 1900 1900 1900 1900 1900 1900Total Lost time (s) 4.0 4.5 4.0 4.5 4.0 5.5 5.5Lane Util. Factor 1.00 0.91 1.00 0.91 1.00 1.00 1.00Frpb, ped/bikes 1.00 0.99 1.00 1.00 1.00 0.99 1.00Flpb, ped/bikes 1.00 1.00 1.00 1.00 1.00 1.00 1.00Frt 1.00 0.97 1.00 0.98 1.00 0.96 1.00Flt Protected 0.95 1.00 0.95 1.00 0.95 1.00 0.98Satd. Flow (prot) 1787 4933 1805 5084 1752 1766 1733Flt Permitted 0.95 1.00 0.95 1.00 0.39 1.00 0.79Satd. Flow (perm) 1787 4933 1805 5084 726 1766 1400Peak-hour factor, PHF 1.00 1.00 1.00 1.00 1.00 1.00 1.00 1.00 1.00 1.00 1.00 1.00Adj. Flow (vph) 50 290 750 160 40 950 110 170 130 40 110 160RTOR Reduction (vph) 0 0 32 0 0 16 0 0 13 0 0 0Lane Group Flow (vph) 0 340 878 0 40 1044 0 170 157 0 0 270Confl. Peds. (#/hr) 16 7 13 13Confl. Bikes (#/hr) 16 2 13Heavy Vehicles (%) 1% 1% 1% 1% 0% 0% 0% 3% 3% 3% 7% 7%Turn Type Prot Prot NA Prot NA pm+pt NA Perm NAProtected Phases 7 7 4 3 8 5 2 6Permitted Phases 2 6Actuated Green, G (s) 21.5 35.0 5.1 18.6 35.9 35.9 25.4Effective Green, g (s) 21.5 35.0 5.1 18.6 35.9 35.9 25.4Actuated g/C Ratio 0.24 0.39 0.06 0.21 0.40 0.40 0.28Clearance Time (s) 4.0 4.5 4.0 4.5 4.0 5.5 5.5Vehicle Extension (s) 3.0 3.0 3.0 3.0 3.0 3.0 3.0Lane Grp Cap (vph) 426 1918 102 1050 363 704 395v/s Ratio Prot c0.19 0.18 0.02 c0.21 c0.03 0.09v/s Ratio Perm 0.15 c0.19v/c Ratio 0.80 0.46 0.39 0.99 0.47 0.22 0.68Uniform Delay, d1 32.2 20.4 41.0 35.6 18.7 17.9 28.7Progression Factor 1.00 1.00 1.14 0.84 1.00 1.00 1.00Incremental Delay, d2 14.4 0.8 1.9 22.9 1.0 0.7 9.2Delay (s) 46.6 21.2 48.6 53.1 19.6 18.6 38.0Level of Service D C D D B B DApproach Delay (s) 28.1 52.9 19.1 31.4Approach LOS C D B C
Intersection SummaryHCM 2000 Control Delay 36.0 HCM 2000 Level of Service DHCM 2000 Volume to Capacity ratio 0.78Actuated Cycle Length (s) 90.0 Sum of lost time (s) 18.0Intersection Capacity Utilization 104.6% ICU Level of Service GAnalysis Period (min) 15c Critical Lane Group

HCM Signalized Intersection Capacity Analysis Children's Hospital14: 52nd Street & Shattuck Ave 2020 AM No Project
Fehr & Peers Synchro 8 Report
Movement SBRLane ConfigurationsVolume (vph) 390Ideal Flow (vphpl) 1900Total Lost time (s) 5.5Lane Util. Factor 1.00Frpb, ped/bikes 0.93Flpb, ped/bikes 1.00Frt 0.85Flt Protected 1.00Satd. Flow (prot) 1398Flt Permitted 1.00Satd. Flow (perm) 1398Peak-hour factor, PHF 1.00Adj. Flow (vph) 390RTOR Reduction (vph) 280Lane Group Flow (vph) 110Confl. Peds. (#/hr) 21Confl. Bikes (#/hr) 54Heavy Vehicles (%) 7%Turn Type PermProtected PhasesPermitted Phases 6Actuated Green, G (s) 25.4Effective Green, g (s) 25.4Actuated g/C Ratio 0.28Clearance Time (s) 5.5Vehicle Extension (s) 3.0Lane Grp Cap (vph) 394v/s Ratio Protv/s Ratio Perm 0.08v/c Ratio 0.28Uniform Delay, d1 25.2Progression Factor 1.00Incremental Delay, d2 1.8Delay (s) 26.9Level of Service CApproach Delay (s)Approach LOS
Intersection Summary
HCM Signalized Intersection Capacity Analysis Children's Hospital15: Telegraph Ave & 52nd Street/Claremont Ave 2020 AM No Project
Fehr & Peers Synchro 8 Report
Movement EBL EBT EBR WBL WBT WBR NBL NBT NBR SBL SBT SBRLane ConfigurationsVolume (vph) 10 10 10 110 60 180 10 780 130 90 700 340Ideal Flow (vphpl) 1900 1900 1900 1900 1900 1900 1900 1900 1900 1900 1900 1900Lane Width 12 12 12 12 12 12 12 16 12 12 12 12Total Lost time (s) 4.5 4.5 4.5 4.5 4.5 4.5Lane Util. Factor 1.00 0.95 0.95 0.95 1.00 0.95Frpb, ped/bikes 0.99 1.00 0.98 0.99 1.00 0.96Flpb, ped/bikes 1.00 1.00 1.00 1.00 1.00 1.00Frt 0.95 1.00 0.89 0.98 1.00 0.95Flt Protected 0.98 0.95 1.00 1.00 0.95 1.00Satd. Flow (prot) 1641 1698 1565 3849 1770 3244Flt Permitted 0.98 0.95 1.00 0.94 0.95 1.00Satd. Flow (perm) 1641 1698 1565 3627 1770 3244Peak-hour factor, PHF 1.00 1.00 1.00 1.00 1.00 1.00 1.00 1.00 1.00 1.00 1.00 1.00Adj. Flow (vph) 10 10 10 110 60 180 10 780 130 90 700 340RTOR Reduction (vph) 0 10 0 0 119 0 0 11 0 0 46 0Lane Group Flow (vph) 0 21 0 99 132 0 0 909 0 90 994 0Confl. Peds. (#/hr) 6 6 29 24 29Confl. Bikes (#/hr) 2 3 43 36Heavy Vehicles (%) 8% 8% 8% 1% 1% 1% 3% 3% 3% 2% 2% 2%Turn Type Split NA Split NA Perm NA Prot NAProtected Phases 4 4 8 8 2 1 6Permitted Phases 2Actuated Green, G (s) 4.5 15.7 15.7 43.9 7.9 56.3Effective Green, g (s) 4.5 15.7 15.7 43.9 7.9 56.3Actuated g/C Ratio 0.05 0.17 0.17 0.49 0.09 0.63Clearance Time (s) 4.5 4.5 4.5 4.5 4.5 4.5Vehicle Extension (s) 3.0 3.0 3.0 3.0 3.0 3.0Lane Grp Cap (vph) 82 296 273 1769 155 2029v/s Ratio Prot c0.01 0.06 c0.08 0.05 c0.31v/s Ratio Perm 0.25v/c Ratio 0.25 0.33 0.48 0.51 0.58 0.49Uniform Delay, d1 41.1 32.6 33.5 15.8 39.5 9.1Progression Factor 1.56 1.00 1.00 0.96 1.00 1.00Incremental Delay, d2 1.0 0.7 1.4 0.9 5.4 0.8Delay (s) 65.2 33.2 34.8 16.1 44.9 9.9Level of Service E C C B D AApproach Delay (s) 65.2 34.4 16.1 12.7Approach LOS E C B B
Intersection SummaryHCM 2000 Control Delay 17.8 HCM 2000 Level of Service BHCM 2000 Volume to Capacity ratio 0.50Actuated Cycle Length (s) 90.0 Sum of lost time (s) 18.0Intersection Capacity Utilization 82.8% ICU Level of Service EAnalysis Period (min) 15c Critical Lane Group

HCM Signalized Intersection Capacity Analysis Children's Hospital16: Telegraph Ave & 51St Street 2020 AM No Project
Fehr & Peers Synchro 8 Report
Movement EBL EBT EBR WBL WBT WBR NBL NBT NBR SBL SBT SBRLane ConfigurationsVolume (vph) 270 530 80 120 560 270 110 380 70 180 590 50Ideal Flow (vphpl) 1900 1900 1900 1900 1900 1900 1900 1900 1900 1900 1900 1900Total Lost time (s) 4.0 4.0 4.0 3.5 4.0 4.5 4.0 3.5Lane Util. Factor 0.97 0.95 1.00 0.95 1.00 0.95 1.00 0.95Frpb, ped/bikes 1.00 0.99 1.00 0.98 1.00 0.99 1.00 0.99Flpb, ped/bikes 1.00 1.00 1.00 1.00 1.00 1.00 1.00 1.00Frt 1.00 0.98 1.00 0.95 1.00 0.98 1.00 0.99Flt Protected 0.95 1.00 0.95 1.00 0.95 1.00 0.95 1.00Satd. Flow (prot) 3400 3404 1787 3322 1719 3313 1752 3433Flt Permitted 0.95 1.00 0.95 1.00 0.95 1.00 0.95 1.00Satd. Flow (perm) 3400 3404 1787 3322 1719 3313 1752 3433Peak-hour factor, PHF 1.00 1.00 1.00 1.00 1.00 1.00 1.00 1.00 1.00 1.00 1.00 1.00Adj. Flow (vph) 270 530 80 120 560 270 110 380 70 180 590 50RTOR Reduction (vph) 0 13 0 0 64 0 0 16 0 0 6 0Lane Group Flow (vph) 270 597 0 120 766 0 110 434 0 180 634 0Confl. Peds. (#/hr) 41 41 39 49Confl. Bikes (#/hr) 12 10 36 36Heavy Vehicles (%) 3% 3% 3% 1% 1% 1% 5% 5% 5% 3% 3% 3%Turn Type Prot NA Prot NA Prot NA Prot NAProtected Phases 7 4 3 8 5 2 1 6Permitted PhasesActuated Green, G (s) 12.0 27.0 10.4 25.9 8.9 24.5 11.6 28.2Effective Green, g (s) 12.0 27.0 10.4 25.9 8.9 24.5 11.6 28.2Actuated g/C Ratio 0.13 0.30 0.12 0.29 0.10 0.27 0.13 0.31Clearance Time (s) 4.0 4.0 4.0 3.5 4.0 4.5 4.0 3.5Vehicle Extension (s) 3.0 3.0 3.0 3.0 3.0 3.0 3.0 3.0Lane Grp Cap (vph) 453 1021 206 955 169 901 225 1075v/s Ratio Prot c0.08 0.18 0.07 c0.23 0.06 0.13 c0.10 c0.18v/s Ratio Permv/c Ratio 0.60 0.58 0.58 0.80 0.65 0.48 0.80 0.59Uniform Delay, d1 36.7 26.7 37.7 29.7 39.1 27.4 38.1 26.0Progression Factor 1.24 0.93 1.00 1.00 1.00 1.00 1.29 0.74Incremental Delay, d2 1.9 2.2 4.2 7.1 8.7 1.8 16.7 2.2Delay (s) 47.5 27.1 41.9 36.7 47.7 29.3 65.8 21.3Level of Service D C D D D C E CApproach Delay (s) 33.3 37.4 32.9 31.1Approach LOS C D C C
Intersection SummaryHCM 2000 Control Delay 33.9 HCM 2000 Level of Service CHCM 2000 Volume to Capacity ratio 0.72Actuated Cycle Length (s) 90.0 Sum of lost time (s) 16.5Intersection Capacity Utilization 75.0% ICU Level of Service DAnalysis Period (min) 15c Critical Lane Group
HCM Signalized Intersection Capacity Analysis Children's Hospital17: SB SR-24 On-Ramp & MLK Way & NB SR-24 Off-Ramp 2020 AM No Project
Fehr & Peers Synchro 8 Report
Movement EBL EBT EBR WBL WBT WBR NBL NBT NBR SBL SBT SBRLane ConfigurationsVolume (vph) 190 0 0 0 0 1550 0 0 0 0 1520 250Ideal Flow (vphpl) 1900 1900 1900 1900 1900 1900 1900 1900 1900 1900 1900 1900Total Lost time (s) 4.0 4.0 4.0 4.0Lane Util. Factor 0.97 1.00 0.95 0.88Frpb, ped/bikes 1.00 1.00 1.00 1.00Flpb, ped/bikes 1.00 1.00 1.00 1.00Frt 1.00 0.86 1.00 0.85Flt Protected 0.95 1.00 1.00 1.00Satd. Flow (prot) 3273 1627 3574 2814Flt Permitted 0.95 1.00 1.00 1.00Satd. Flow (perm) 3273 1627 3574 2814Peak-hour factor, PHF 1.00 1.00 1.00 1.00 1.00 1.00 1.00 1.00 1.00 1.00 1.00 1.00Adj. Flow (vph) 190 0 0 0 0 1550 0 0 0 0 1520 250RTOR Reduction (vph) 0 0 0 0 0 0 0 0 0 0 0 0Lane Group Flow (vph) 190 0 0 0 0 1550 0 0 0 0 1520 250Confl. Peds. (#/hr) 8Confl. Bikes (#/hr) 3Heavy Vehicles (%) 7% 7% 2% 2% 1% 1% 2% 2% 2% 2% 1% 1%Turn Type Prot Free NA customProtected Phases 2 6 FreePermitted Phases FreeActuated Green, G (s) 8.0 45.0 29.0 45.0Effective Green, g (s) 8.0 45.0 29.0 45.0Actuated g/C Ratio 0.18 1.00 0.64 1.00Clearance Time (s) 4.0 4.0Lane Grp Cap (vph) 581 1627 2303 2814v/s Ratio Prot 0.06 0.43 0.09v/s Ratio Perm c0.95v/c Ratio 0.33 0.95 0.66 0.09Uniform Delay, d1 16.2 0.0 4.9 0.0Progression Factor 1.00 1.00 1.76 1.00Incremental Delay, d2 1.5 13.6 1.2 0.1Delay (s) 17.6 13.6 9.9 0.1Level of Service B B A AApproach Delay (s) 17.6 13.6 0.0 8.5Approach LOS B B A A
Intersection SummaryHCM 2000 Control Delay 11.3 HCM 2000 Level of Service BHCM 2000 Volume to Capacity ratio 1.16Actuated Cycle Length (s) 45.0 Sum of lost time (s) 8.0Intersection Capacity Utilization 54.1% ICU Level of Service AAnalysis Period (min) 15c Critical Lane Group

HCM Unsignalized Intersection Capacity Analysis Children's Hospital18: West Street & 52nd Street 2020 AM No Project
Fehr & Peers Synchro 8 Report
Movement EBL EBT EBR WBL WBT WBR NBL NBT NBR SBL SBT SBRLane ConfigurationsSign Control Stop Stop Stop StopVolume (vph) 0 170 20 70 100 0 30 0 80 10 50 10Peak Hour Factor 1.00 1.00 1.00 1.00 1.00 1.00 1.00 1.00 1.00 1.00 1.00 1.00Hourly flow rate (vph) 0 170 20 70 100 0 30 0 80 10 50 10
Direction, Lane # EB 1 WB 1 NB 1 NB 2 SB 1Volume Total (vph) 190 170 30 80 70Volume Left (vph) 0 70 30 0 10Volume Right (vph) 20 0 0 80 10Hadj (s) -0.05 0.12 0.50 -0.70 -0.02Departure Headway (s) 4.5 4.7 5.9 4.7 5.0Degree Utilization, x 0.24 0.22 0.05 0.11 0.10Capacity (veh/h) 763 727 567 703 661Control Delay (s) 8.9 9.0 8.1 7.1 8.5Approach Delay (s) 8.9 9.0 7.4 8.5Approach LOS A A A A
Intersection SummaryDelay 8.6Level of Service AIntersection Capacity Utilization 41.5% ICU Level of Service AAnalysis Period (min) 15
HCM Unsignalized Intersection Capacity Analysis Children's Hospital19: Genoa Street & 52nd Street 2020 AM No Project
Fehr & Peers Synchro 8 Report
Movement EBL EBT EBR WBL WBT WBR NBL NBT NBR SBL SBT SBRLane ConfigurationsSign Control Stop Stop Stop StopVolume (vph) 10 160 10 10 100 30 10 0 10 20 10 10Peak Hour Factor 1.00 1.00 1.00 1.00 1.00 1.00 1.00 1.00 1.00 1.00 1.00 1.00Hourly flow rate (vph) 10 160 10 10 100 30 10 0 10 20 10 10
Direction, Lane # EB 1 WB 1 NB 1 SB 1Volume Total (vph) 180 140 20 40Volume Left (vph) 10 10 10 20Volume Right (vph) 10 30 10 10Hadj (s) -0.01 -0.11 -0.20 -0.05Departure Headway (s) 4.2 4.1 4.4 4.6Degree Utilization, x 0.21 0.16 0.02 0.05Capacity (veh/h) 843 855 747 726Control Delay (s) 8.3 7.9 7.6 7.8Approach Delay (s) 8.3 7.9 7.6 7.8Approach LOS A A A A
Intersection SummaryDelay 8.0Level of Service AIntersection Capacity Utilization 24.1% ICU Level of Service AAnalysis Period (min) 15
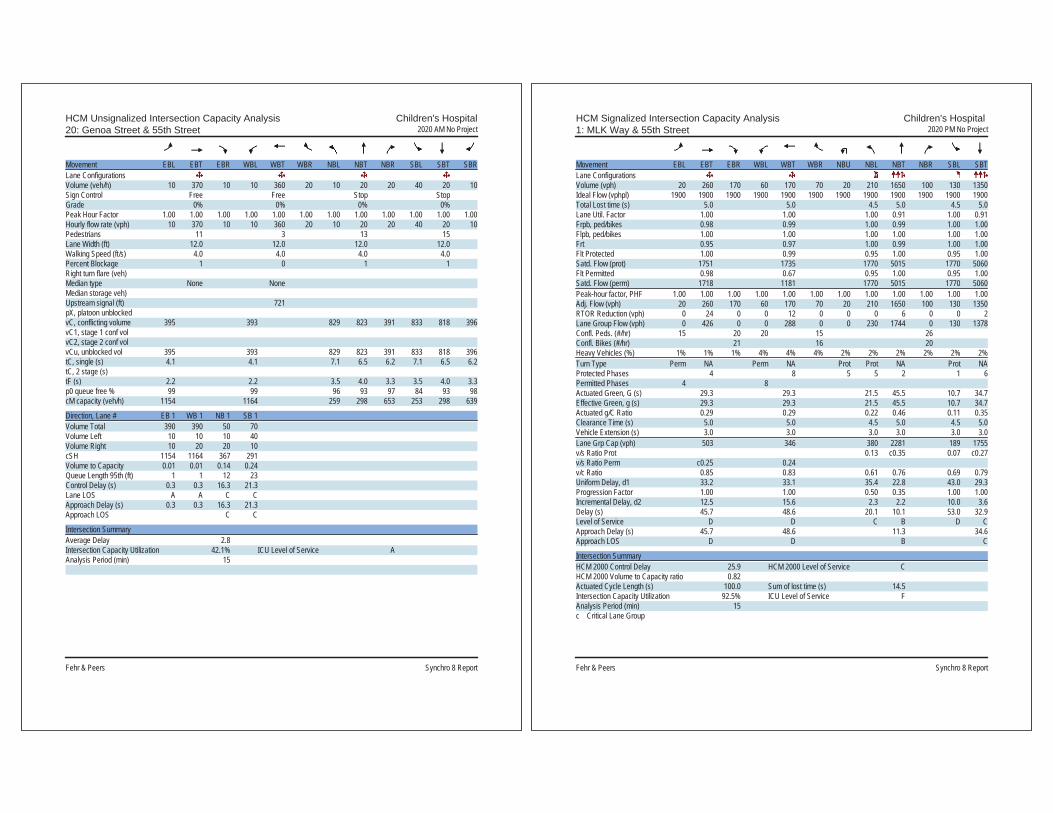
HCM Unsignalized Intersection Capacity Analysis Children's Hospital20: Genoa Street & 55th Street 2020 AM No Project
Fehr & Peers Synchro 8 Report
Movement EBL EBT EBR WBL WBT WBR NBL NBT NBR SBL SBT SBRLane ConfigurationsVolume (veh/h) 10 370 10 10 360 20 10 20 20 40 20 10Sign Control Free Free Stop StopGrade 0% 0% 0% 0%Peak Hour Factor 1.00 1.00 1.00 1.00 1.00 1.00 1.00 1.00 1.00 1.00 1.00 1.00Hourly flow rate (vph) 10 370 10 10 360 20 10 20 20 40 20 10Pedestrians 11 3 13 15Lane Width (ft) 12.0 12.0 12.0 12.0Walking Speed (ft/s) 4.0 4.0 4.0 4.0Percent Blockage 1 0 1 1Right turn flare (veh)Median type None NoneMedian storage veh)Upstream signal (ft) 721pX, platoon unblockedvC, conflicting volume 395 393 829 823 391 833 818 396vC1, stage 1 conf volvC2, stage 2 conf volvCu, unblocked vol 395 393 829 823 391 833 818 396tC, single (s) 4.1 4.1 7.1 6.5 6.2 7.1 6.5 6.2tC, 2 stage (s)tF (s) 2.2 2.2 3.5 4.0 3.3 3.5 4.0 3.3p0 queue free % 99 99 96 93 97 84 93 98cM capacity (veh/h) 1154 1164 259 298 653 253 298 639
Direction, Lane # EB 1 WB 1 NB 1 SB 1Volume Total 390 390 50 70Volume Left 10 10 10 40Volume Right 10 20 20 10cSH 1154 1164 367 291Volume to Capacity 0.01 0.01 0.14 0.24Queue Length 95th (ft) 1 1 12 23Control Delay (s) 0.3 0.3 16.3 21.3Lane LOS A A C CApproach Delay (s) 0.3 0.3 16.3 21.3Approach LOS C C
Intersection SummaryAverage Delay 2.8Intersection Capacity Utilization 42.1% ICU Level of Service AAnalysis Period (min) 15
HCM Signalized Intersection Capacity Analysis Children's Hospital 1: MLK Way & 55th Street 2020 PM No Project
Fehr & Peers Synchro 8 Report
Movement EBL EBT EBR WBL WBT WBR NBU NBL NBT NBR SBL SBTLane ConfigurationsVolume (vph) 20 260 170 60 170 70 20 210 1650 100 130 1350Ideal Flow (vphpl) 1900 1900 1900 1900 1900 1900 1900 1900 1900 1900 1900 1900Total Lost time (s) 5.0 5.0 4.5 5.0 4.5 5.0Lane Util. Factor 1.00 1.00 1.00 0.91 1.00 0.91Frpb, ped/bikes 0.98 0.99 1.00 0.99 1.00 1.00Flpb, ped/bikes 1.00 1.00 1.00 1.00 1.00 1.00Frt 0.95 0.97 1.00 0.99 1.00 1.00Flt Protected 1.00 0.99 0.95 1.00 0.95 1.00Satd. Flow (prot) 1751 1735 1770 5015 1770 5060Flt Permitted 0.98 0.67 0.95 1.00 0.95 1.00Satd. Flow (perm) 1718 1181 1770 5015 1770 5060Peak-hour factor, PHF 1.00 1.00 1.00 1.00 1.00 1.00 1.00 1.00 1.00 1.00 1.00 1.00Adj. Flow (vph) 20 260 170 60 170 70 20 210 1650 100 130 1350RTOR Reduction (vph) 0 24 0 0 12 0 0 0 6 0 0 2Lane Group Flow (vph) 0 426 0 0 288 0 0 230 1744 0 130 1378Confl. Peds. (#/hr) 15 20 20 15 26Confl. Bikes (#/hr) 21 16 20Heavy Vehicles (%) 1% 1% 1% 4% 4% 4% 2% 2% 2% 2% 2% 2%Turn Type Perm NA Perm NA Prot Prot NA Prot NAProtected Phases 4 8 5 5 2 1 6Permitted Phases 4 8Actuated Green, G (s) 29.3 29.3 21.5 45.5 10.7 34.7Effective Green, g (s) 29.3 29.3 21.5 45.5 10.7 34.7Actuated g/C Ratio 0.29 0.29 0.22 0.46 0.11 0.35Clearance Time (s) 5.0 5.0 4.5 5.0 4.5 5.0Vehicle Extension (s) 3.0 3.0 3.0 3.0 3.0 3.0Lane Grp Cap (vph) 503 346 380 2281 189 1755v/s Ratio Prot 0.13 c0.35 0.07 c0.27v/s Ratio Perm c0.25 0.24v/c Ratio 0.85 0.83 0.61 0.76 0.69 0.79Uniform Delay, d1 33.2 33.1 35.4 22.8 43.0 29.3Progression Factor 1.00 1.00 0.50 0.35 1.00 1.00Incremental Delay, d2 12.5 15.6 2.3 2.2 10.0 3.6Delay (s) 45.7 48.6 20.1 10.1 53.0 32.9Level of Service D D C B D CApproach Delay (s) 45.7 48.6 11.3 34.6Approach LOS D D B C
Intersection SummaryHCM 2000 Control Delay 25.9 HCM 2000 Level of Service CHCM 2000 Volume to Capacity ratio 0.82Actuated Cycle Length (s) 100.0 Sum of lost time (s) 14.5Intersection Capacity Utilization 92.5% ICU Level of Service FAnalysis Period (min) 15c Critical Lane Group

HCM Signalized Intersection Capacity Analysis Children's Hospital 1: MLK Way & 55th Street 2020 PM No Project
Fehr & Peers Synchro 8 Report
Movement SBRLane ConfigurationsVolume (vph) 30Ideal Flow (vphpl) 1900Total Lost time (s)Lane Util. FactorFrpb, ped/bikesFlpb, ped/bikesFrtFlt ProtectedSatd. Flow (prot)Flt PermittedSatd. Flow (perm)Peak-hour factor, PHF 1.00Adj. Flow (vph) 30RTOR Reduction (vph) 0Lane Group Flow (vph) 0Confl. Peds. (#/hr) 16Confl. Bikes (#/hr) 20Heavy Vehicles (%) 2%Turn TypeProtected PhasesPermitted PhasesActuated Green, G (s)Effective Green, g (s)Actuated g/C RatioClearance Time (s)Vehicle Extension (s)Lane Grp Cap (vph)v/s Ratio Protv/s Ratio Permv/c RatioUniform Delay, d1Progression FactorIncremental Delay, d2Delay (s)Level of ServiceApproach Delay (s)Approach LOS
Intersection Summary
HCM Unsignalized Intersection Capacity Analysis Children's Hospital 2: Dover Street & 55th Street 2020 PM No Project
Fehr & Peers Synchro 8 Report
Movement EBL EBT EBR WBL WBT WBR NBL NBT NBR SBL SBT SBRLane ConfigurationsVolume (veh/h) 30 440 20 10 230 20 20 20 30 20 20 40Sign Control Free Free Stop StopGrade 0% 0% 0% 0%Peak Hour Factor 1.00 1.00 1.00 1.00 1.00 1.00 1.00 1.00 1.00 1.00 1.00 1.00Hourly flow rate (vph) 30 440 20 10 230 20 20 20 30 20 20 40Pedestrians 6 17 10 23Lane Width (ft) 12.0 12.0 12.0 12.0Walking Speed (ft/s) 4.0 4.0 4.0 4.0Percent Blockage 1 1 1 2Right turn flare (veh)Median type None NoneMedian storage veh)Upstream signal (ft) 641 677pX, platoon unblockedvC, conflicting volume 273 470 836 813 477 850 813 269vC1, stage 1 conf volvC2, stage 2 conf volvCu, unblocked vol 273 470 836 813 477 850 813 269tC, single (s) 4.1 4.1 7.1 6.5 6.2 7.1 6.5 6.2tC, 2 stage (s)tF (s) 2.2 2.2 3.5 4.0 3.3 3.5 4.0 3.3p0 queue free % 98 99 92 93 95 91 93 95cM capacity (veh/h) 1249 1072 244 296 579 232 293 749
Direction, Lane # EB 1 WB 1 NB 1 SB 1Volume Total 490 260 70 80Volume Left 30 10 20 20Volume Right 20 20 30 40cSH 1249 1072 348 385Volume to Capacity 0.02 0.01 0.20 0.21Queue Length 95th (ft) 2 1 18 19Control Delay (s) 0.7 0.4 17.9 16.8Lane LOS A A C CApproach Delay (s) 0.7 0.4 17.9 16.8Approach LOS C C
Intersection SummaryAverage Delay 3.4Intersection Capacity Utilization 52.3% ICU Level of Service AAnalysis Period (min) 15

HCM Signalized Intersection Capacity Analysis Children's Hospital 3: 55th Street & Shattuck Ave 2020 PM No Project
Fehr & Peers Synchro 8 Report
Movement EBL EBT EBR WBL WBT WBR NBL NBT NBR SBL SBT SBRLane ConfigurationsVolume (vph) 90 330 60 30 160 50 50 560 40 30 550 40Ideal Flow (vphpl) 1900 1900 1900 1900 1900 1900 1900 1900 1900 1900 1900 1900Total Lost time (s) 3.0 3.0 5.0 5.0Lane Util. Factor 1.00 1.00 1.00 1.00Frpb, ped/bikes 0.99 0.99 1.00 1.00Flpb, ped/bikes 1.00 1.00 1.00 1.00Frt 0.98 0.97 0.99 0.99Flt Protected 0.99 0.99 1.00 1.00Satd. Flow (prot) 1745 1760 1833 1853Flt Permitted 0.90 0.93 0.92 0.96Satd. Flow (perm) 1580 1642 1696 1774Peak-hour factor, PHF 1.00 1.00 1.00 1.00 1.00 1.00 1.00 1.00 1.00 1.00 1.00 1.00Adj. Flow (vph) 90 330 60 30 160 50 50 560 40 30 550 40RTOR Reduction (vph) 0 6 0 0 12 0 0 3 0 0 3 0Lane Group Flow (vph) 0 474 0 0 228 0 0 647 0 0 617 0Confl. Peds. (#/hr) 15 15 15 15 25 10 10 25Confl. Bikes (#/hr) 20 13 41 29Heavy Vehicles (%) 5% 5% 5% 3% 3% 3% 2% 2% 2% 1% 1% 1%Turn Type Perm NA Perm NA Perm NA Perm NAProtected Phases 2 6 4 8Permitted Phases 2 6 4 4 8Actuated Green, G (s) 29.0 29.0 43.0 43.0Effective Green, g (s) 29.0 29.0 43.0 43.0Actuated g/C Ratio 0.36 0.36 0.54 0.54Clearance Time (s) 3.0 3.0 5.0 5.0Lane Grp Cap (vph) 572 595 911 953v/s Ratio Protv/s Ratio Perm c0.30 0.14 c0.38 0.35v/c Ratio 0.83 0.38 0.71 0.65Uniform Delay, d1 23.2 18.9 13.8 13.1Progression Factor 1.00 1.00 1.00 1.00Incremental Delay, d2 13.0 1.9 4.7 3.4Delay (s) 36.2 20.7 18.5 16.5Level of Service D C B BApproach Delay (s) 36.2 20.7 18.5 16.5Approach LOS D C B B
Intersection SummaryHCM 2000 Control Delay 22.4 HCM 2000 Level of Service CHCM 2000 Volume to Capacity ratio 0.76Actuated Cycle Length (s) 80.0 Sum of lost time (s) 8.0Intersection Capacity Utilization 97.5% ICU Level of Service FAnalysis Period (min) 15c Critical Lane Group
HCM Signalized Intersection Capacity Analysis Children's Hospital 4: 55th Street & Telegraph Ave 2020 PM No Project
Fehr & Peers Synchro 8 Report
Movement EBL EBT EBR WBL WBT WBR NBL NBT NBR SBL SBT SBRLane ConfigurationsVolume (vph) 240 30 120 50 20 20 90 1030 70 20 990 110Ideal Flow (vphpl) 1900 1900 1900 1900 1900 1900 1900 1900 1900 1900 1900 1900Total Lost time (s) 4.5 4.5 4.5 4.5 4.5 4.5Lane Util. Factor 1.00 1.00 1.00 0.95 1.00 0.95Frpb, ped/bikes 0.98 0.99 1.00 0.99 1.00 0.99Flpb, ped/bikes 0.99 0.99 0.99 1.00 0.99 1.00Frt 0.96 0.97 1.00 0.99 1.00 0.98Flt Protected 0.97 0.97 0.95 1.00 0.95 1.00Satd. Flow (prot) 1637 1695 1750 3483 1773 3473Flt Permitted 0.78 0.74 0.19 1.00 0.19 1.00Satd. Flow (perm) 1313 1293 349 3483 354 3473Peak-hour factor, PHF 1.00 1.00 1.00 1.00 1.00 1.00 1.00 1.00 1.00 1.00 1.00 1.00Adj. Flow (vph) 240 30 120 50 20 20 90 1030 70 20 990 110RTOR Reduction (vph) 0 19 0 0 13 0 0 5 0 0 8 0Lane Group Flow (vph) 0 371 0 0 77 0 90 1095 0 20 1092 0Confl. Peds. (#/hr) 15 34 34 15 33 23 23 33Confl. Bikes (#/hr) 11 12 38 59Heavy Vehicles (%) 5% 5% 5% 4% 4% 4% 2% 2% 2% 1% 1% 1%Turn Type Perm NA Perm NA Perm NA Perm NAProtected Phases 4 8 2 6Permitted Phases 4 8 2 6Actuated Green, G (s) 29.7 29.7 51.3 51.3 51.3 51.3Effective Green, g (s) 29.7 29.7 51.3 51.3 51.3 51.3Actuated g/C Ratio 0.33 0.33 0.57 0.57 0.57 0.57Clearance Time (s) 4.5 4.5 4.5 4.5 4.5 4.5Vehicle Extension (s) 3.0 3.0 3.0 3.0 3.0 3.0Lane Grp Cap (vph) 433 426 198 1985 201 1979v/s Ratio Prot c0.31 0.31v/s Ratio Perm c0.28 0.06 0.26 0.06v/c Ratio 0.86 0.18 0.45 0.55 0.10 0.55Uniform Delay, d1 28.2 21.5 11.2 12.1 8.8 12.1Progression Factor 1.00 1.00 1.00 1.00 1.00 1.00Incremental Delay, d2 15.2 0.2 7.4 1.1 1.0 1.1Delay (s) 43.3 21.7 18.6 13.2 9.8 13.3Level of Service D C B B A BApproach Delay (s) 43.3 21.7 13.7 13.2Approach LOS D C B B
Intersection SummaryHCM 2000 Control Delay 17.9 HCM 2000 Level of Service BHCM 2000 Volume to Capacity ratio 0.66Actuated Cycle Length (s) 90.0 Sum of lost time (s) 9.0Intersection Capacity Utilization 76.6% ICU Level of Service DAnalysis Period (min) 15c Critical Lane Group

HCM Unsignalized Intersection Capacity Analysis Children's Hospital 5: MLK Way & 54th Street 2020 PM No Project
Fehr & Peers Synchro 8 Report
Movement EBL EBT EBR WBL WBT WBR NBU NBL NBT NBR SBU SBLLane ConfigurationsVolume (veh/h) 10 10 50 20 10 10 10 40 1930 20 10 20Sign Control Stop Stop FreeGrade 0% 0% 0%Peak Hour Factor 1.00 1.00 1.00 1.00 1.00 1.00 1.00 1.00 1.00 1.00 1.00 1.00Hourly flow rate (vph) 10 10 50 20 10 10 0 40 1930 20 0 20Pedestrians 7 25 15Lane Width (ft) 12.0 12.0 12.0Walking Speed (ft/s) 4.0 4.0 4.0Percent Blockage 1 2 1Right turn flare (veh)Median type NoneMedian storage veh)Upstream signal (ft) 299pX, platoon unblocked 0.87 0.87 0.76 0.87 0.87 0.78 0.00 0.76 0.00 0.78vC, conflicting volume 2335 3652 545 2668 3652 678 0 1567 0 1975vC1, stage 1 conf volvC2, stage 2 conf volvCu, unblocked vol 324 1841 0 707 1841 0 0 640 0 1278tC, single (s) 7.5 6.5 6.9 7.5 6.5 6.9 0.0 4.1 0.0 4.1tC, 2 stage (s)tF (s) 3.5 4.0 3.3 3.5 4.0 3.3 0.0 2.2 0.0 2.2p0 queue free % 98 83 94 90 83 99 0 94 0 95cM capacity (veh/h) 409 58 814 202 58 837 0 710 0 418
Direction, Lane # EB 1 WB 1 NB 1 NB 2 NB 3 SB 1 SB 2 SB 3Volume Total 70 40 522 965 502 405 770 405Volume Left 10 20 40 0 0 20 0 0Volume Right 50 10 0 0 20 0 0 20cSH 270 141 710 1700 1700 418 1700 1700Volume to Capacity 0.26 0.28 0.06 0.57 0.30 0.05 0.45 0.24Queue Length 95th (ft) 25 27 4 0 0 4 0 0Control Delay (s) 22.9 40.4 1.5 0.0 0.0 1.5 0.0 0.0Lane LOS C E A AApproach Delay (s) 22.9 40.4 0.4 0.4Approach LOS C E
Intersection SummaryAverage Delay 1.3Intersection Capacity Utilization 88.1% ICU Level of Service EAnalysis Period (min) 15
HCM Unsignalized Intersection Capacity Analysis Children's Hospital 5: MLK Way & 54th Street 2020 PM No Project
Fehr & Peers Synchro 8 Report
Movement SBT SBRLane ConfigurationsVolume (veh/h) 1540 20Sign Control FreeGrade 0%Peak Hour Factor 1.00 1.00Hourly flow rate (vph) 1540 20PedestriansLane Width (ft)Walking Speed (ft/s)Percent BlockageRight turn flare (veh)Median type NoneMedian storage veh)Upstream signal (ft) 294pX, platoon unblockedvC, conflicting volumevC1, stage 1 conf volvC2, stage 2 conf volvCu, unblocked voltC, single (s)tC, 2 stage (s)tF (s)p0 queue free %cM capacity (veh/h)
Direction, Lane #

HCM Unsignalized Intersection Capacity Analysis Children's Hospital 6: Dover Street & 54th Street 2020 PM No Project
Fehr & Peers Synchro 8 Report
Movement EBL EBT EBR WBL WBT WBR NBL NBT NBR SBL SBT SBRLane ConfigurationsVolume (veh/h) 10 20 10 10 10 20 10 40 10 10 30 10Sign Control Stop Stop Free FreeGrade 0% 0% 0% 0%Peak Hour Factor 1.00 1.00 1.00 1.00 1.00 1.00 1.00 1.00 1.00 1.00 1.00 1.00Hourly flow rate (vph) 10 20 10 10 10 20 10 40 10 10 30 10Pedestrians 16 11 8 4Lane Width (ft) 12.0 12.0 12.0 12.0Walking Speed (ft/s) 4.0 4.0 4.0 4.0Percent Blockage 1 1 1 0Right turn flare (veh)Median type None NoneMedian storage veh)Upstream signal (ft)pX, platoon unblockedvC, conflicting volume 165 152 59 159 152 60 56 61vC1, stage 1 conf volvC2, stage 2 conf volvCu, unblocked vol 165 152 59 159 152 60 56 61tC, single (s) 7.1 6.5 6.2 7.1 6.5 6.2 4.1 4.1tC, 2 stage (s)tF (s) 3.5 4.0 3.3 3.5 4.0 3.3 2.2 2.2p0 queue free % 99 97 99 99 99 98 99 99cM capacity (veh/h) 746 717 992 753 717 999 1541 1541
Direction, Lane # EB 1 WB 1 NB 1 SB 1Volume Total 40 40 60 50Volume Left 10 10 10 10Volume Right 10 20 10 10cSH 779 847 1541 1541Volume to Capacity 0.05 0.05 0.01 0.01Queue Length 95th (ft) 4 4 0 0Control Delay (s) 9.9 9.5 1.3 1.5Lane LOS A A A AApproach Delay (s) 9.9 9.5 1.3 1.5Approach LOS A A
Intersection SummaryAverage Delay 4.9Intersection Capacity Utilization 20.3% ICU Level of Service AAnalysis Period (min) 15
HCM Unsignalized Intersection Capacity Analysis Children's Hospital 7: Shattuck Ave & 54th Street 2020 PM No Project
Fehr & Peers Synchro 8 Report
Movement EBL EBR NBL NBT SBT SBRLane ConfigurationsVolume (veh/h) 10 20 20 660 650 10Sign Control Stop Free FreeGrade 0% 0% 0%Peak Hour Factor 1.00 1.00 1.00 1.00 1.00 1.00Hourly flow rate (vph) 10 20 20 660 650 10Pedestrians 33 2Lane Width (ft) 12.0 12.0Walking Speed (ft/s) 4.0 4.0Percent Blockage 3 0Right turn flare (veh)Median type None NoneMedian storage veh)Upstream signal (ft) 550 282pX, platoon unblocked 0.82 0.77 0.77vC, conflicting volume 1390 688 693vC1, stage 1 conf volvC2, stage 2 conf volvCu, unblocked vol 1110 444 451tC, single (s) 6.4 6.2 4.1tC, 2 stage (s)tF (s) 3.5 3.3 2.2p0 queue free % 94 96 98cM capacity (veh/h) 181 462 830
Direction, Lane # EB 1 NB 1 SB 1Volume Total 30 680 660Volume Left 10 20 0Volume Right 20 0 10cSH 304 830 1700Volume to Capacity 0.10 0.02 0.39Queue Length 95th (ft) 8 2 0Control Delay (s) 18.1 0.6 0.0Lane LOS C AApproach Delay (s) 18.1 0.6 0.0Approach LOS C
Intersection SummaryAverage Delay 0.7Intersection Capacity Utilization 60.9% ICU Level of Service BAnalysis Period (min) 15

HCM Signalized Intersection Capacity Analysis Children's Hospital 8: MLK Way & 53rd Street 2020 PM No Project
Fehr & Peers Synchro 8 Report
Movement EBL EBT EBR WBL WBT WBR NBU NBL NBT NBR SBL SBTLane ConfigurationsVolume (vph) 10 10 60 30 10 10 10 10 1980 30 20 1610Ideal Flow (vphpl) 1900 1900 1900 1900 1900 1900 1900 1900 1900 1900 1900 1900Total Lost time (s) 5.0 5.0 4.0 3.5 4.0 3.5Lane Util. Factor 1.00 1.00 1.00 0.91 1.00 0.91Frpb, ped/bikes 0.98 1.00 1.00 1.00 1.00 1.00Flpb, ped/bikes 1.00 1.00 1.00 1.00 1.00 1.00Frt 0.90 0.97 1.00 1.00 1.00 1.00Flt Protected 0.99 0.97 0.95 1.00 0.95 1.00Satd. Flow (prot) 1631 1782 1770 5063 1787 5128Flt Permitted 0.97 0.81 0.95 1.00 0.95 1.00Satd. Flow (perm) 1587 1490 1770 5063 1787 5128Peak-hour factor, PHF 1.00 1.00 1.00 1.00 1.00 1.00 1.00 1.00 1.00 1.00 1.00 1.00Adj. Flow (vph) 10 10 60 30 10 10 10 10 1980 30 20 1610RTOR Reduction (vph) 0 50 0 0 8 0 0 0 1 0 0 0Lane Group Flow (vph) 0 30 0 0 42 0 0 20 2009 0 20 1620Confl. Peds. (#/hr) 11 6 6 11 42Confl. Bikes (#/hr) 6 3 17Heavy Vehicles (%) 2% 2% 2% 0% 0% 0% 2% 2% 2% 2% 1% 1%Turn Type Perm NA Perm NA Prot Prot NA Prot NAProtected Phases 4 8 5 5 2 1 6Permitted Phases 4 8Actuated Green, G (s) 16.1 16.1 3.1 67.8 3.6 68.3Effective Green, g (s) 16.1 16.1 3.1 67.8 3.6 68.3Actuated g/C Ratio 0.16 0.16 0.03 0.68 0.04 0.68Clearance Time (s) 5.0 5.0 4.0 3.5 4.0 3.5Vehicle Extension (s) 3.0 3.0 3.0 3.0 3.0 3.0Lane Grp Cap (vph) 255 239 54 3432 64 3502v/s Ratio Prot 0.01 c0.40 0.01 c0.32v/s Ratio Perm 0.02 c0.03v/c Ratio 0.12 0.17 0.37 0.59 0.31 0.46Uniform Delay, d1 35.9 36.2 47.5 8.6 47.0 7.3Progression Factor 1.00 1.06 1.46 0.14 0.78 0.48Incremental Delay, d2 0.2 0.3 2.7 0.5 1.9 0.3Delay (s) 36.1 38.9 71.9 1.7 38.5 3.8Level of Service D D E A D AApproach Delay (s) 36.1 38.9 2.3 4.2Approach LOS D D A A
Intersection SummaryHCM 2000 Control Delay 4.4 HCM 2000 Level of Service AHCM 2000 Volume to Capacity ratio 0.52Actuated Cycle Length (s) 100.0 Sum of lost time (s) 12.5Intersection Capacity Utilization 63.3% ICU Level of Service BAnalysis Period (min) 15c Critical Lane Group
HCM Signalized Intersection Capacity Analysis Children's Hospital 8: MLK Way & 53rd Street 2020 PM No Project
Fehr & Peers Synchro 8 Report
Movement SBRLane ConfigurationsVolume (vph) 10Ideal Flow (vphpl) 1900Total Lost time (s)Lane Util. FactorFrpb, ped/bikesFlpb, ped/bikesFrtFlt ProtectedSatd. Flow (prot)Flt PermittedSatd. Flow (perm)Peak-hour factor, PHF 1.00Adj. Flow (vph) 10RTOR Reduction (vph) 0Lane Group Flow (vph) 0Confl. Peds. (#/hr) 19Confl. Bikes (#/hr) 21Heavy Vehicles (%) 1%Turn TypeProtected PhasesPermitted PhasesActuated Green, G (s)Effective Green, g (s)Actuated g/C RatioClearance Time (s)Vehicle Extension (s)Lane Grp Cap (vph)v/s Ratio Protv/s Ratio Permv/c RatioUniform Delay, d1Progression FactorIncremental Delay, d2Delay (s)Level of ServiceApproach Delay (s)Approach LOS
Intersection Summary
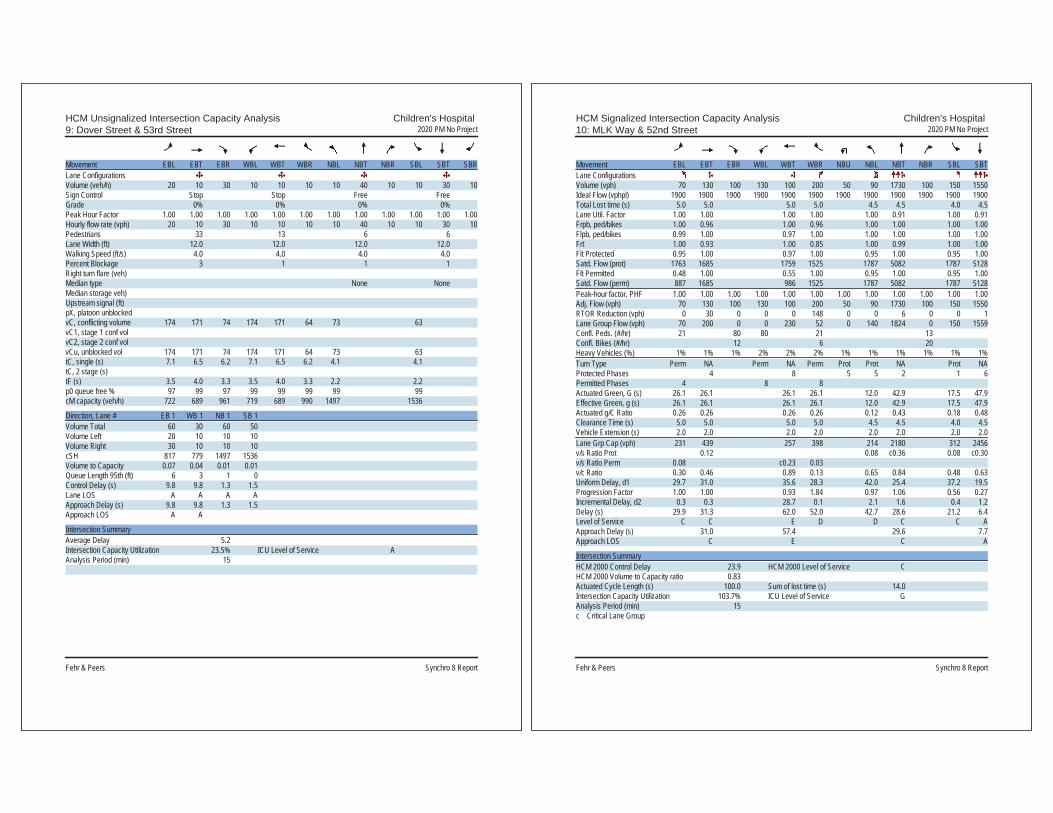
HCM Unsignalized Intersection Capacity Analysis Children's Hospital 9: Dover Street & 53rd Street 2020 PM No Project
Fehr & Peers Synchro 8 Report
Movement EBL EBT EBR WBL WBT WBR NBL NBT NBR SBL SBT SBRLane ConfigurationsVolume (veh/h) 20 10 30 10 10 10 10 40 10 10 30 10Sign Control Stop Stop Free FreeGrade 0% 0% 0% 0%Peak Hour Factor 1.00 1.00 1.00 1.00 1.00 1.00 1.00 1.00 1.00 1.00 1.00 1.00Hourly flow rate (vph) 20 10 30 10 10 10 10 40 10 10 30 10Pedestrians 33 13 6 6Lane Width (ft) 12.0 12.0 12.0 12.0Walking Speed (ft/s) 4.0 4.0 4.0 4.0Percent Blockage 3 1 1 1Right turn flare (veh)Median type None NoneMedian storage veh)Upstream signal (ft)pX, platoon unblockedvC, conflicting volume 174 171 74 174 171 64 73 63vC1, stage 1 conf volvC2, stage 2 conf volvCu, unblocked vol 174 171 74 174 171 64 73 63tC, single (s) 7.1 6.5 6.2 7.1 6.5 6.2 4.1 4.1tC, 2 stage (s)tF (s) 3.5 4.0 3.3 3.5 4.0 3.3 2.2 2.2p0 queue free % 97 99 97 99 99 99 99 99cM capacity (veh/h) 722 689 961 719 689 990 1497 1536
Direction, Lane # EB 1 WB 1 NB 1 SB 1Volume Total 60 30 60 50Volume Left 20 10 10 10Volume Right 30 10 10 10cSH 817 779 1497 1536Volume to Capacity 0.07 0.04 0.01 0.01Queue Length 95th (ft) 6 3 1 0Control Delay (s) 9.8 9.8 1.3 1.5Lane LOS A A A AApproach Delay (s) 9.8 9.8 1.3 1.5Approach LOS A A
Intersection SummaryAverage Delay 5.2Intersection Capacity Utilization 23.5% ICU Level of Service AAnalysis Period (min) 15
HCM Signalized Intersection Capacity Analysis Children's Hospital 10: MLK Way & 52nd Street 2020 PM No Project
Fehr & Peers Synchro 8 Report
Movement EBL EBT EBR WBL WBT WBR NBU NBL NBT NBR SBL SBTLane ConfigurationsVolume (vph) 70 130 100 130 100 200 50 90 1730 100 150 1550Ideal Flow (vphpl) 1900 1900 1900 1900 1900 1900 1900 1900 1900 1900 1900 1900Total Lost time (s) 5.0 5.0 5.0 5.0 4.5 4.5 4.0 4.5Lane Util. Factor 1.00 1.00 1.00 1.00 1.00 0.91 1.00 0.91Frpb, ped/bikes 1.00 0.96 1.00 0.96 1.00 1.00 1.00 1.00Flpb, ped/bikes 0.99 1.00 0.97 1.00 1.00 1.00 1.00 1.00Frt 1.00 0.93 1.00 0.85 1.00 0.99 1.00 1.00Flt Protected 0.95 1.00 0.97 1.00 0.95 1.00 0.95 1.00Satd. Flow (prot) 1763 1685 1759 1525 1787 5082 1787 5128Flt Permitted 0.48 1.00 0.55 1.00 0.95 1.00 0.95 1.00Satd. Flow (perm) 887 1685 986 1525 1787 5082 1787 5128Peak-hour factor, PHF 1.00 1.00 1.00 1.00 1.00 1.00 1.00 1.00 1.00 1.00 1.00 1.00Adj. Flow (vph) 70 130 100 130 100 200 50 90 1730 100 150 1550RTOR Reduction (vph) 0 30 0 0 0 148 0 0 6 0 0 1Lane Group Flow (vph) 70 200 0 0 230 52 0 140 1824 0 150 1559Confl. Peds. (#/hr) 21 80 80 21 13Confl. Bikes (#/hr) 12 6 20Heavy Vehicles (%) 1% 1% 1% 2% 2% 2% 1% 1% 1% 1% 1% 1%Turn Type Perm NA Perm NA Perm Prot Prot NA Prot NAProtected Phases 4 8 5 5 2 1 6Permitted Phases 4 8 8Actuated Green, G (s) 26.1 26.1 26.1 26.1 12.0 42.9 17.5 47.9Effective Green, g (s) 26.1 26.1 26.1 26.1 12.0 42.9 17.5 47.9Actuated g/C Ratio 0.26 0.26 0.26 0.26 0.12 0.43 0.18 0.48Clearance Time (s) 5.0 5.0 5.0 5.0 4.5 4.5 4.0 4.5Vehicle Extension (s) 2.0 2.0 2.0 2.0 2.0 2.0 2.0 2.0Lane Grp Cap (vph) 231 439 257 398 214 2180 312 2456v/s Ratio Prot 0.12 0.08 c0.36 0.08 c0.30v/s Ratio Perm 0.08 c0.23 0.03v/c Ratio 0.30 0.46 0.89 0.13 0.65 0.84 0.48 0.63Uniform Delay, d1 29.7 31.0 35.6 28.3 42.0 25.4 37.2 19.5Progression Factor 1.00 1.00 0.93 1.84 0.97 1.06 0.56 0.27Incremental Delay, d2 0.3 0.3 28.7 0.1 2.1 1.6 0.4 1.2Delay (s) 29.9 31.3 62.0 52.0 42.7 28.6 21.2 6.4Level of Service C C E D D C C AApproach Delay (s) 31.0 57.4 29.6 7.7Approach LOS C E C A
Intersection SummaryHCM 2000 Control Delay 23.9 HCM 2000 Level of Service CHCM 2000 Volume to Capacity ratio 0.83Actuated Cycle Length (s) 100.0 Sum of lost time (s) 14.0Intersection Capacity Utilization 103.7% ICU Level of Service GAnalysis Period (min) 15c Critical Lane Group

HCM Signalized Intersection Capacity Analysis Children's Hospital 10: MLK Way & 52nd Street 2020 PM No Project
Fehr & Peers Synchro 8 Report
Movement SBRLane ConfigurationsVolume (vph) 10Ideal Flow (vphpl) 1900Total Lost time (s)Lane Util. FactorFrpb, ped/bikesFlpb, ped/bikesFrtFlt ProtectedSatd. Flow (prot)Flt PermittedSatd. Flow (perm)Peak-hour factor, PHF 1.00Adj. Flow (vph) 10RTOR Reduction (vph) 0Lane Group Flow (vph) 0Confl. Peds. (#/hr) 17Confl. Bikes (#/hr) 23Heavy Vehicles (%) 1%Turn TypeProtected PhasesPermitted PhasesActuated Green, G (s)Effective Green, g (s)Actuated g/C RatioClearance Time (s)Vehicle Extension (s)Lane Grp Cap (vph)v/s Ratio Protv/s Ratio Permv/c RatioUniform Delay, d1Progression FactorIncremental Delay, d2Delay (s)Level of ServiceApproach Delay (s)Approach LOS
Intersection Summary
HCM Signalized Intersection Capacity Analysis Children's Hospital 11: 52nd Street & Garage 2020 PM No Project
Fehr & Peers Synchro 8 Report
Movement EBL EBT EBR WBL WBT WBR NBL NBT NBR SBL SBT SBRLane ConfigurationsVolume (vph) 17 350 5 11 320 17 25 3 13 63 4 73Ideal Flow (vphpl) 1900 1900 1900 1900 1900 1900 1900 1900 1900 1900 1900 1900Total Lost time (s) 3.0 3.0 3.0 3.0Lane Util. Factor 0.95 0.95 1.00 1.00Frpb, ped/bikes 1.00 1.00 0.94 0.99Flpb, ped/bikes 1.00 1.00 1.00 0.92Frt 1.00 0.99 0.96 0.93Flt Protected 1.00 1.00 0.97 0.98Satd. Flow (prot) 3516 3553 1432 1587Flt Permitted 0.94 0.94 0.87 0.89Satd. Flow (perm) 3327 3354 1284 1442Peak-hour factor, PHF 1.00 1.00 1.00 1.00 1.00 1.00 1.00 1.00 1.00 1.00 1.00 1.00Adj. Flow (vph) 17 350 5 11 320 17 25 3 13 63 4 73RTOR Reduction (vph) 0 2 0 0 7 0 0 7 0 0 39 0Lane Group Flow (vph) 0 370 0 0 341 0 0 34 0 0 101 0Confl. Peds. (#/hr) 77 77 33 271 271Confl. Bikes (#/hr) 13 8 2Heavy Vehicles (%) 2% 2% 2% 0% 0% 0% 16% 16% 16% 0% 0% 0%Turn Type Prot NA Perm NA Perm NA Perm NAProtected Phases 5 2 6 4 8Permitted Phases 6 4 8Actuated Green, G (s) 21.0 14.0 23.0 23.0Effective Green, g (s) 21.0 14.0 23.0 23.0Actuated g/C Ratio 0.42 0.28 0.46 0.46Clearance Time (s) 3.0 3.0 3.0 3.0Lane Grp Cap (vph) 1412 939 590 663v/s Ratio Prot c0.02v/s Ratio Perm 0.09 c0.10 0.03 c0.07v/c Ratio 0.26 0.36 0.06 0.15Uniform Delay, d1 9.5 14.4 7.5 7.8Progression Factor 1.61 1.00 1.00 1.00Incremental Delay, d2 0.4 1.1 0.2 0.5Delay (s) 15.6 15.5 7.7 8.3Level of Service B B A AApproach Delay (s) 15.6 15.5 7.7 8.3Approach LOS B B A A
Intersection SummaryHCM 2000 Control Delay 14.1 HCM 2000 Level of Service BHCM 2000 Volume to Capacity ratio 0.24Actuated Cycle Length (s) 50.0 Sum of lost time (s) 9.0Intersection Capacity Utilization 48.3% ICU Level of Service AAnalysis Period (min) 15c Critical Lane Group
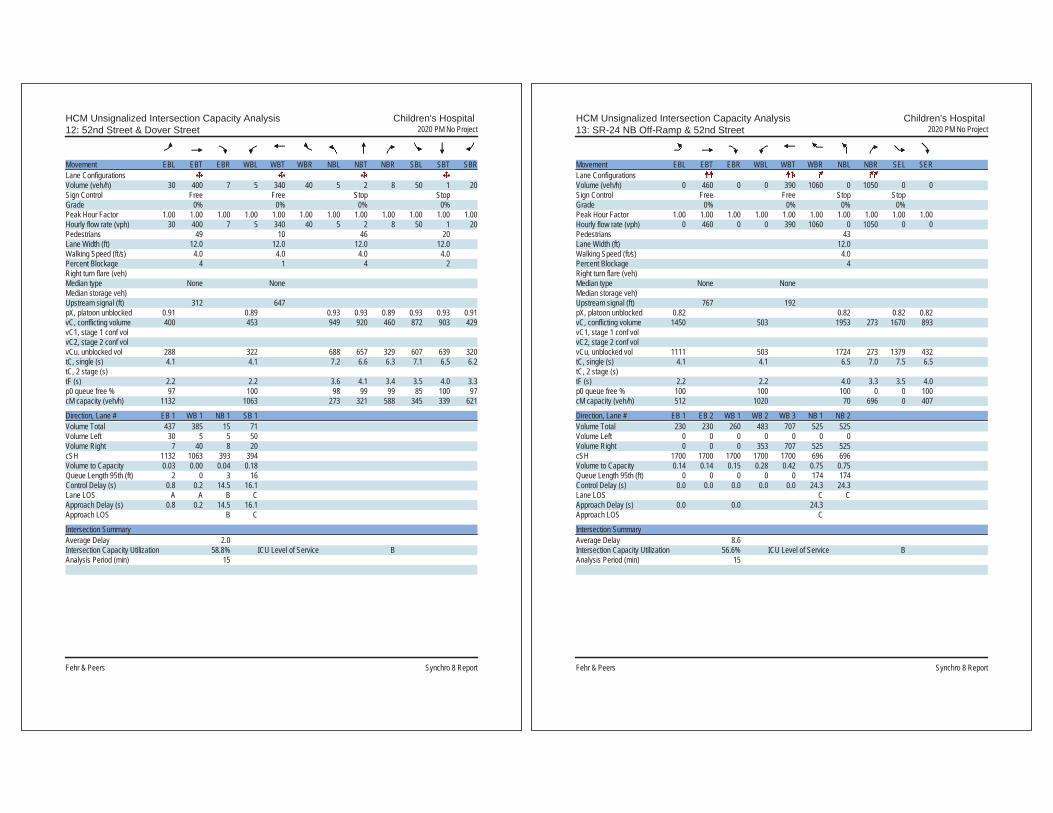
HCM Unsignalized Intersection Capacity Analysis Children's Hospital 12: 52nd Street & Dover Street 2020 PM No Project
Fehr & Peers Synchro 8 Report
Movement EBL EBT EBR WBL WBT WBR NBL NBT NBR SBL SBT SBRLane ConfigurationsVolume (veh/h) 30 400 7 5 340 40 5 2 8 50 1 20Sign Control Free Free Stop StopGrade 0% 0% 0% 0%Peak Hour Factor 1.00 1.00 1.00 1.00 1.00 1.00 1.00 1.00 1.00 1.00 1.00 1.00Hourly flow rate (vph) 30 400 7 5 340 40 5 2 8 50 1 20Pedestrians 49 10 46 20Lane Width (ft) 12.0 12.0 12.0 12.0Walking Speed (ft/s) 4.0 4.0 4.0 4.0Percent Blockage 4 1 4 2Right turn flare (veh)Median type None NoneMedian storage veh)Upstream signal (ft) 312 647pX, platoon unblocked 0.91 0.89 0.93 0.93 0.89 0.93 0.93 0.91vC, conflicting volume 400 453 949 920 460 872 903 429vC1, stage 1 conf volvC2, stage 2 conf volvCu, unblocked vol 288 322 688 657 329 607 639 320tC, single (s) 4.1 4.1 7.2 6.6 6.3 7.1 6.5 6.2tC, 2 stage (s)tF (s) 2.2 2.2 3.6 4.1 3.4 3.5 4.0 3.3p0 queue free % 97 100 98 99 99 85 100 97cM capacity (veh/h) 1132 1063 273 321 588 345 339 621
Direction, Lane # EB 1 WB 1 NB 1 SB 1Volume Total 437 385 15 71Volume Left 30 5 5 50Volume Right 7 40 8 20cSH 1132 1063 393 394Volume to Capacity 0.03 0.00 0.04 0.18Queue Length 95th (ft) 2 0 3 16Control Delay (s) 0.8 0.2 14.5 16.1Lane LOS A A B CApproach Delay (s) 0.8 0.2 14.5 16.1Approach LOS B C
Intersection SummaryAverage Delay 2.0Intersection Capacity Utilization 58.8% ICU Level of Service BAnalysis Period (min) 15
HCM Unsignalized Intersection Capacity Analysis Children's Hospital 13: SR-24 NB Off-Ramp & 52nd Street 2020 PM No Project
Fehr & Peers Synchro 8 Report
Movement EBL EBT EBR WBL WBT WBR NBL NBR SEL SERLane ConfigurationsVolume (veh/h) 0 460 0 0 390 1060 0 1050 0 0Sign Control Free Free Stop StopGrade 0% 0% 0% 0%Peak Hour Factor 1.00 1.00 1.00 1.00 1.00 1.00 1.00 1.00 1.00 1.00Hourly flow rate (vph) 0 460 0 0 390 1060 0 1050 0 0Pedestrians 43Lane Width (ft) 12.0Walking Speed (ft/s) 4.0Percent Blockage 4Right turn flare (veh)Median type None NoneMedian storage veh)Upstream signal (ft) 767 192pX, platoon unblocked 0.82 0.82 0.82 0.82vC, conflicting volume 1450 503 1953 273 1670 893vC1, stage 1 conf volvC2, stage 2 conf volvCu, unblocked vol 1111 503 1724 273 1379 432tC, single (s) 4.1 4.1 6.5 7.0 7.5 6.5tC, 2 stage (s)tF (s) 2.2 2.2 4.0 3.3 3.5 4.0p0 queue free % 100 100 100 0 0 100cM capacity (veh/h) 512 1020 70 696 0 407
Direction, Lane # EB 1 EB 2 WB 1 WB 2 WB 3 NB 1 NB 2Volume Total 230 230 260 483 707 525 525Volume Left 0 0 0 0 0 0 0Volume Right 0 0 0 353 707 525 525cSH 1700 1700 1700 1700 1700 696 696Volume to Capacity 0.14 0.14 0.15 0.28 0.42 0.75 0.75Queue Length 95th (ft) 0 0 0 0 0 174 174Control Delay (s) 0.0 0.0 0.0 0.0 0.0 24.3 24.3Lane LOS C CApproach Delay (s) 0.0 0.0 24.3Approach LOS C
Intersection SummaryAverage Delay 8.6Intersection Capacity Utilization 56.6% ICU Level of Service BAnalysis Period (min) 15

HCM Signalized Intersection Capacity Analysis Children's Hospital 14: 52nd Street & Shattuck Ave 2020 PM No Project
Fehr & Peers Synchro 8 Report
Movement EBU EBL EBT EBR WBL WBT WBR NBL NBT NBR SBL SBTLane ConfigurationsVolume (vph) 50 320 950 190 60 880 150 160 240 60 150 150Ideal Flow (vphpl) 1900 1900 1900 1900 1900 1900 1900 1900 1900 1900 1900 1900Total Lost time (s) 4.0 4.5 4.0 4.5 4.0 5.5 5.5Lane Util. Factor 1.00 0.91 1.00 0.91 1.00 1.00 1.00Frpb, ped/bikes 1.00 0.98 1.00 0.99 1.00 0.99 1.00Flpb, ped/bikes 1.00 1.00 1.00 1.00 1.00 1.00 0.99Frt 1.00 0.97 1.00 0.98 1.00 0.97 1.00Flt Protected 0.95 1.00 0.95 1.00 0.95 1.00 0.98Satd. Flow (prot) 1787 4930 1805 5012 1752 1764 1712Flt Permitted 0.95 1.00 0.95 1.00 0.29 1.00 0.69Satd. Flow (perm) 1787 4930 1805 5012 527 1764 1218Peak-hour factor, PHF 1.00 1.00 1.00 1.00 1.00 1.00 1.00 1.00 1.00 1.00 1.00 1.00Adj. Flow (vph) 50 320 950 190 60 880 150 160 240 60 150 150RTOR Reduction (vph) 0 0 26 0 0 21 0 0 8 0 0 0Lane Group Flow (vph) 0 370 1114 0 60 1009 0 160 292 0 0 300Confl. Peds. (#/hr) 19 19 15 29 29Confl. Bikes (#/hr) 17 11 39Heavy Vehicles (%) 1% 1% 1% 1% 0% 0% 0% 3% 3% 3% 7% 7%Turn Type Prot Prot NA Prot NA pm+pt NA Perm NAProtected Phases 7 7 4 3 8 5 2 6Permitted Phases 2 6Actuated Green, G (s) 33.5 55.1 5.2 26.8 35.7 35.7 26.2Effective Green, g (s) 33.5 55.1 5.2 26.8 35.7 35.7 26.2Actuated g/C Ratio 0.30 0.50 0.05 0.24 0.32 0.32 0.24Clearance Time (s) 4.0 4.5 4.0 4.5 4.0 5.5 5.5Vehicle Extension (s) 3.0 3.0 3.0 3.0 3.0 3.0 3.0Lane Grp Cap (vph) 544 2469 85 1221 232 572 290v/s Ratio Prot c0.21 0.23 0.03 c0.20 c0.03 0.17v/s Ratio Perm 0.19 c0.25v/c Ratio 0.68 0.45 0.71 0.83 0.69 0.51 1.03Uniform Delay, d1 33.6 17.7 51.6 39.4 32.2 30.1 41.9Progression Factor 1.00 1.00 1.00 1.00 1.00 1.00 1.00Incremental Delay, d2 6.7 0.6 23.3 6.5 8.3 3.2 62.1Delay (s) 40.3 18.3 75.0 45.9 40.5 33.3 104.0Level of Service D B E D D C FApproach Delay (s) 23.7 47.5 35.8 66.8Approach LOS C D D E
Intersection SummaryHCM 2000 Control Delay 39.8 HCM 2000 Level of Service DHCM 2000 Volume to Capacity ratio 0.83Actuated Cycle Length (s) 110.0 Sum of lost time (s) 18.0Intersection Capacity Utilization 104.4% ICU Level of Service GAnalysis Period (min) 15c Critical Lane Group
HCM Signalized Intersection Capacity Analysis Children's Hospital 14: 52nd Street & Shattuck Ave 2020 PM No Project
Fehr & Peers Synchro 8 Report
Movement SBRLane ConfigurationsVolume (vph) 360Ideal Flow (vphpl) 1900Total Lost time (s) 5.5Lane Util. Factor 1.00Frpb, ped/bikes 0.93Flpb, ped/bikes 1.00Frt 0.85Flt Protected 1.00Satd. Flow (prot) 1400Flt Permitted 1.00Satd. Flow (perm) 1400Peak-hour factor, PHF 1.00Adj. Flow (vph) 360RTOR Reduction (vph) 274Lane Group Flow (vph) 86Confl. Peds. (#/hr) 24Confl. Bikes (#/hr) 36Heavy Vehicles (%) 7%Turn Type PermProtected PhasesPermitted Phases 6Actuated Green, G (s) 26.2Effective Green, g (s) 26.2Actuated g/C Ratio 0.24Clearance Time (s) 5.5Vehicle Extension (s) 3.0Lane Grp Cap (vph) 333v/s Ratio Protv/s Ratio Perm 0.06v/c Ratio 0.26Uniform Delay, d1 34.0Progression Factor 1.00Incremental Delay, d2 1.9Delay (s) 35.9Level of Service DApproach Delay (s)Approach LOS
Intersection Summary

HCM Signalized Intersection Capacity Analysis Children's Hospital 15: Telegraph Ave & 52nd Street/Claremont Ave 2020 PM No Project
Fehr & Peers Synchro 8 Report
Movement EBL EBT EBR WBL WBT WBR NBL NBT NBR SBL SBT SBRLane ConfigurationsVolume (vph) 20 20 20 140 80 180 20 1000 270 140 720 300Ideal Flow (vphpl) 1900 1900 1900 1900 1900 1900 1900 1900 1900 1900 1900 1900Lane Width 12 12 12 12 12 12 12 16 12 12 12 12Total Lost time (s) 4.5 4.5 4.5 4.5 4.5 4.5Lane Util. Factor 1.00 0.95 0.95 0.95 1.00 0.95Frpb, ped/bikes 0.99 1.00 0.94 0.98 1.00 0.91Flpb, ped/bikes 1.00 1.00 1.00 1.00 1.00 1.00Frt 0.95 1.00 0.90 0.97 1.00 0.96Flt Protected 0.98 0.95 1.00 1.00 0.95 1.00Satd. Flow (prot) 1642 1698 1513 3777 1770 3089Flt Permitted 0.98 0.95 1.00 0.93 0.95 1.00Satd. Flow (perm) 1642 1698 1513 3505 1770 3089Peak-hour factor, PHF 1.00 1.00 1.00 1.00 1.00 1.00 1.00 1.00 1.00 1.00 1.00 1.00Adj. Flow (vph) 20 20 20 140 80 180 20 1000 270 140 720 300RTOR Reduction (vph) 0 19 0 0 73 0 0 21 0 0 38 0Lane Group Flow (vph) 0 41 0 126 201 0 0 1269 0 140 982 0Confl. Peds. (#/hr) 45 45 91 29 91Confl. Bikes (#/hr) 2 13 46 63Heavy Vehicles (%) 8% 8% 8% 1% 1% 1% 3% 3% 3% 2% 2% 2%Turn Type Split NA Split NA Perm NA Prot NAProtected Phases 4 4 8 8 2 1 6Permitted Phases 2Actuated Green, G (s) 6.2 18.0 18.0 45.9 11.9 62.3Effective Green, g (s) 6.2 18.0 18.0 45.9 11.9 62.3Actuated g/C Ratio 0.06 0.18 0.18 0.46 0.12 0.62Clearance Time (s) 4.5 4.5 4.5 4.5 4.5 4.5Vehicle Extension (s) 3.0 3.0 3.0 3.0 3.0 3.0Lane Grp Cap (vph) 101 305 272 1608 210 1924v/s Ratio Prot c0.03 0.07 c0.13 c0.08 0.32v/s Ratio Perm c0.36v/c Ratio 0.41 0.41 0.74 0.79 0.67 0.51Uniform Delay, d1 45.1 36.3 38.8 23.0 42.2 10.4Progression Factor 1.80 1.00 1.00 0.57 1.00 1.00Incremental Delay, d2 1.2 0.9 10.0 2.7 7.8 1.0Delay (s) 82.6 37.2 48.8 15.8 49.9 11.4Level of Service F D D B D BApproach Delay (s) 82.6 45.2 15.8 16.0Approach LOS F D B B
Intersection SummaryHCM 2000 Control Delay 21.3 HCM 2000 Level of Service CHCM 2000 Volume to Capacity ratio 0.73Actuated Cycle Length (s) 100.0 Sum of lost time (s) 18.0Intersection Capacity Utilization 100.7% ICU Level of Service GAnalysis Period (min) 15c Critical Lane Group
HCM Signalized Intersection Capacity Analysis Children's Hospital 16: Telegraph Ave & 51St Street 2020 PM No Project
Fehr & Peers Synchro 8 Report
Movement EBL EBT EBR WBL WBT WBR NBL NBT NBR SBL SBT SBRLane ConfigurationsVolume (vph) 360 660 100 70 520 240 100 690 120 280 540 60Ideal Flow (vphpl) 1900 1900 1900 1900 1900 1900 1900 1900 1900 1900 1900 1900Total Lost time (s) 4.0 4.0 4.0 3.5 4.0 4.5 4.0 3.5Lane Util. Factor 0.97 0.95 1.00 0.95 1.00 0.95 1.00 0.95Frpb, ped/bikes 1.00 0.98 1.00 0.97 1.00 0.98 1.00 0.97Flpb, ped/bikes 1.00 1.00 1.00 1.00 1.00 1.00 1.00 1.00Frt 1.00 0.98 1.00 0.95 1.00 0.98 1.00 0.98Flt Protected 0.95 1.00 0.95 1.00 0.95 1.00 0.95 1.00Satd. Flow (prot) 3400 3384 1787 3299 1719 3293 1752 3363Flt Permitted 0.95 1.00 0.95 1.00 0.95 1.00 0.95 1.00Satd. Flow (perm) 3400 3384 1787 3299 1719 3293 1752 3363Peak-hour factor, PHF 1.00 1.00 1.00 1.00 1.00 1.00 1.00 1.00 1.00 1.00 1.00 1.00Adj. Flow (vph) 360 660 100 70 520 240 100 690 120 280 540 60RTOR Reduction (vph) 0 11 0 0 54 0 0 14 0 0 9 0Lane Group Flow (vph) 360 749 0 70 706 0 100 796 0 280 591 0Confl. Peds. (#/hr) 68 50 75 120Confl. Bikes (#/hr) 11 20 45 71Heavy Vehicles (%) 3% 3% 3% 1% 1% 1% 5% 5% 5% 3% 3% 3%Turn Type Prot NA Prot NA Prot NA Prot NAProtected Phases 7 4 3 8 5 2 1 6Permitted PhasesActuated Green, G (s) 15.1 29.9 8.0 23.3 7.8 32.6 13.0 38.8Effective Green, g (s) 15.1 29.9 8.0 23.3 7.8 32.6 13.0 38.8Actuated g/C Ratio 0.15 0.30 0.08 0.23 0.08 0.33 0.13 0.39Clearance Time (s) 4.0 4.0 4.0 3.5 4.0 4.5 4.0 3.5Vehicle Extension (s) 3.0 3.0 3.0 3.0 3.0 3.0 3.0 3.0Lane Grp Cap (vph) 513 1011 142 768 134 1073 227 1304v/s Ratio Prot c0.11 0.22 0.04 c0.21 0.06 c0.24 c0.16 0.18v/s Ratio Permv/c Ratio 0.70 0.74 0.49 0.92 0.75 0.74 1.23 0.45Uniform Delay, d1 40.3 31.6 44.1 37.4 45.1 30.0 43.5 22.7Progression Factor 1.00 1.00 1.00 1.00 1.00 1.00 1.22 0.70Incremental Delay, d2 4.3 4.9 2.7 17.9 20.0 4.6 134.2 1.0Delay (s) 44.6 36.4 46.7 55.4 65.2 34.6 187.2 16.9Level of Service D D D E E C F BApproach Delay (s) 39.1 54.6 37.9 71.1Approach LOS D D D E
Intersection SummaryHCM 2000 Control Delay 49.8 HCM 2000 Level of Service DHCM 2000 Volume to Capacity ratio 0.86Actuated Cycle Length (s) 100.0 Sum of lost time (s) 16.5Intersection Capacity Utilization 86.5% ICU Level of Service EAnalysis Period (min) 15c Critical Lane Group

HCM Signalized Intersection Capacity Analysis Children's Hospital 17: SB SR-24 On-Ramp & MLK Way & NB SR-24 Off-Ramp 2020 PM No Project
Fehr & Peers Synchro 8 Report
Movement EBL EBT EBR WBL WBT WBR NBL NBT NBR SBL SBT SBRLane ConfigurationsVolume (vph) 300 0 0 0 0 1670 0 0 0 0 1620 240Ideal Flow (vphpl) 1900 1900 1900 1900 1900 1900 1900 1900 1900 1900 1900 1900Total Lost time (s) 4.0 4.0 4.0 4.0Lane Util. Factor 0.97 1.00 0.95 0.88Frpb, ped/bikes 1.00 1.00 1.00 1.00Flpb, ped/bikes 1.00 1.00 1.00 1.00Frt 1.00 0.86 1.00 0.85Flt Protected 0.95 1.00 1.00 1.00Satd. Flow (prot) 3273 1627 3574 2814Flt Permitted 0.95 1.00 1.00 1.00Satd. Flow (perm) 3273 1627 3574 2814Peak-hour factor, PHF 1.00 1.00 1.00 1.00 1.00 1.00 1.00 1.00 1.00 1.00 1.00 1.00Adj. Flow (vph) 300 0 0 0 0 1670 0 0 0 0 1620 240RTOR Reduction (vph) 0 0 0 0 0 0 0 0 0 0 0 0Lane Group Flow (vph) 300 0 0 0 0 1670 0 0 0 0 1620 240Confl. Peds. (#/hr) 3Confl. Bikes (#/hr) 12Heavy Vehicles (%) 7% 7% 2% 2% 1% 1% 2% 2% 2% 2% 1% 1%Turn Type Prot Free NA customProtected Phases 2 6 FreePermitted Phases FreeActuated Green, G (s) 13.0 50.0 29.0 50.0Effective Green, g (s) 13.0 50.0 29.0 50.0Actuated g/C Ratio 0.26 1.00 0.58 1.00Clearance Time (s) 4.0 4.0Lane Grp Cap (vph) 850 1627 2072 2814v/s Ratio Prot 0.09 0.45 0.09v/s Ratio Perm c1.03v/c Ratio 0.35 1.03 0.78 0.09Uniform Delay, d1 15.1 25.0 8.1 0.0Progression Factor 1.00 1.00 2.66 1.00Incremental Delay, d2 1.2 29.3 2.4 0.0Delay (s) 16.2 54.3 23.8 0.0Level of Service B D C AApproach Delay (s) 16.2 54.3 0.0 20.8Approach LOS B D A C
Intersection SummaryHCM 2000 Control Delay 35.0 HCM 2000 Level of Service DHCM 2000 Volume to Capacity ratio 1.22Actuated Cycle Length (s) 50.0 Sum of lost time (s) 8.0Intersection Capacity Utilization 60.0% ICU Level of Service BAnalysis Period (min) 15c Critical Lane Group
HCM Unsignalized Intersection Capacity Analysis Children's Hospital 18: West Street & 52nd Street 2020 PM No Project
Fehr & Peers Synchro 8 Report
Movement EBL EBT EBR WBL WBT WBR NBL NBT NBR SBL SBT SBRLane ConfigurationsSign Control Stop Stop Stop StopVolume (vph) 0 140 10 90 110 0 50 0 140 10 60 10Peak Hour Factor 1.00 1.00 1.00 1.00 1.00 1.00 1.00 1.00 1.00 1.00 1.00 1.00Hourly flow rate (vph) 0 140 10 90 110 0 50 0 140 10 60 10
Direction, Lane # EB 1 WB 1 NB 1 NB 2 SB 1Volume Total (vph) 150 200 50 140 80Volume Left (vph) 0 90 50 0 10Volume Right (vph) 10 0 0 140 10Hadj (s) -0.02 0.12 0.50 -0.70 -0.02Departure Headway (s) 4.8 4.9 6.0 4.8 5.1Degree Utilization, x 0.20 0.27 0.08 0.19 0.11Capacity (veh/h) 695 693 567 704 640Control Delay (s) 9.0 9.7 8.3 7.7 8.8Approach Delay (s) 9.0 9.7 7.8 8.8Approach LOS A A A A
Intersection SummaryDelay 8.8Level of Service AIntersection Capacity Utilization 42.7% ICU Level of Service AAnalysis Period (min) 15

HCM Unsignalized Intersection Capacity Analysis Children's Hospital 19: Genoa Street & 52nd Street 2020 PM No Project
Fehr & Peers Synchro 8 Report
Movement EBL EBT EBR WBL WBT WBR NBL NBT NBR SBL SBT SBRLane ConfigurationsSign Control Stop Stop Stop StopVolume (vph) 10 130 10 10 110 50 10 0 10 20 10 10Peak Hour Factor 1.00 1.00 1.00 1.00 1.00 1.00 1.00 1.00 1.00 1.00 1.00 1.00Hourly flow rate (vph) 10 130 10 10 110 50 10 0 10 20 10 10
Direction, Lane # EB 1 WB 1 NB 1 SB 1Volume Total (vph) 150 170 20 40Volume Left (vph) 10 10 10 20Volume Right (vph) 10 50 10 10Hadj (s) -0.01 -0.16 -0.20 -0.05Departure Headway (s) 4.2 4.0 4.4 4.6Degree Utilization, x 0.17 0.19 0.02 0.05Capacity (veh/h) 837 874 748 727Control Delay (s) 8.1 8.0 7.5 7.8Approach Delay (s) 8.1 8.0 7.5 7.8Approach LOS A A A A
Intersection SummaryDelay 8.0Level of Service AIntersection Capacity Utilization 23.5% ICU Level of Service AAnalysis Period (min) 15
HCM Unsignalized Intersection Capacity Analysis Children's Hospital 20: Genoa Street & 55th Street 2020 PM No Project
Fehr & Peers Synchro 8 Report
Movement EBL EBT EBR WBL WBT WBR NBL NBT NBR SBL SBT SBRLane ConfigurationsVolume (veh/h) 20 380 10 20 380 40 10 20 40 40 10 20Sign Control Free Free Stop StopGrade 0% 0% 0% 0%Peak Hour Factor 1.00 1.00 1.00 1.00 1.00 1.00 1.00 1.00 1.00 1.00 1.00 1.00Hourly flow rate (vph) 20 380 10 20 380 40 10 20 40 40 10 20Pedestrians 7 10 4Lane Width (ft) 12.0 12.0 12.0Walking Speed (ft/s) 4.0 4.0 4.0Percent Blockage 1 1 0Right turn flare (veh)Median type None NoneMedian storage veh)Upstream signal (ft) 721pX, platoon unblockedvC, conflicting volume 424 400 907 899 395 919 884 411vC1, stage 1 conf volvC2, stage 2 conf volvCu, unblocked vol 424 400 907 899 395 919 884 411tC, single (s) 4.1 4.1 7.1 6.5 6.2 7.1 6.5 6.2tC, 2 stage (s)tF (s) 2.2 2.2 3.5 4.0 3.3 3.5 4.0 3.3p0 queue free % 98 98 96 93 94 81 96 97cM capacity (veh/h) 1137 1160 232 268 653 215 271 635
Direction, Lane # EB 1 WB 1 NB 1 SB 1Volume Total 410 440 70 70Volume Left 20 20 10 40Volume Right 10 40 40 20cSH 1137 1160 391 275Volume to Capacity 0.02 0.02 0.18 0.25Queue Length 95th (ft) 1 1 16 25Control Delay (s) 0.6 0.5 16.2 22.5Lane LOS A A C CApproach Delay (s) 0.6 0.5 16.2 22.5Approach LOS C C
Intersection SummaryAverage Delay 3.2Intersection Capacity Utilization 47.4% ICU Level of Service AAnalysis Period (min) 15

Appendix D LOS Calculation Worksheets – 2035 No Project
Conditions
HCM Signalized Intersection Capacity Analysis Children's Hospital1: MLK Way & 55th Street 2035 AM No Project
Fehr & Peers Synchro 8 Report
Movement EBL EBT EBR WBL WBT WBR NBU NBL NBT NBR SBL SBTLane ConfigurationsVolume (vph) 20 200 250 60 270 100 20 180 1440 60 160 1520Ideal Flow (vphpl) 1900 1900 1900 1900 1900 1900 1900 1900 1900 1900 1900 1900Total Lost time (s) 5.0 5.0 4.5 5.0 4.5 5.0Lane Util. Factor 1.00 1.00 1.00 0.91 1.00 0.91Frpb, ped/bikes 0.98 0.99 1.00 1.00 1.00 1.00Flpb, ped/bikes 1.00 1.00 1.00 1.00 1.00 1.00Frt 0.93 0.97 1.00 0.99 1.00 0.99Flt Protected 1.00 0.99 0.95 1.00 0.95 1.00Satd. Flow (prot) 1702 1741 1770 5036 1770 5037Flt Permitted 0.98 0.79 0.95 1.00 0.95 1.00Satd. Flow (perm) 1663 1383 1770 5036 1770 5037Peak-hour factor, PHF 1.00 1.00 1.00 1.00 1.00 1.00 1.00 1.00 1.00 1.00 1.00 1.00Adj. Flow (vph) 20 200 250 60 270 100 20 180 1440 60 160 1520RTOR Reduction (vph) 0 50 0 0 13 0 0 0 5 0 0 5Lane Group Flow (vph) 0 420 0 0 417 0 0 200 1495 0 160 1585Confl. Peds. (#/hr) 11 21 21 11 32Confl. Bikes (#/hr) 24 23 9Heavy Vehicles (%) 1% 1% 1% 4% 4% 4% 2% 2% 2% 2% 2% 2%Turn Type Perm NA Perm NA Prot Prot NA Prot NAProtected Phases 4 8 5 5 2 1 6Permitted Phases 4 8Actuated Green, G (s) 29.4 29.4 13.5 38.6 7.5 32.6Effective Green, g (s) 29.4 29.4 13.5 38.6 7.5 32.6Actuated g/C Ratio 0.33 0.33 0.15 0.43 0.08 0.36Clearance Time (s) 5.0 5.0 4.5 5.0 4.5 5.0Vehicle Extension (s) 3.0 3.0 3.0 3.0 3.0 3.0Lane Grp Cap (vph) 543 451 265 2159 147 1824v/s Ratio Prot 0.11 c0.30 0.09 c0.31v/s Ratio Perm 0.25 c0.30v/c Ratio 0.77 0.92 0.75 0.69 1.09 0.87Uniform Delay, d1 27.3 29.2 36.7 20.9 41.2 26.7Progression Factor 1.00 1.00 0.53 0.28 1.00 1.00Incremental Delay, d2 6.8 24.5 10.4 1.7 99.9 5.9Delay (s) 34.1 53.8 30.0 7.5 141.1 32.7Level of Service C D C A F CApproach Delay (s) 34.1 53.8 10.1 42.6Approach LOS C D B D
Intersection SummaryHCM 2000 Control Delay 30.1 HCM 2000 Level of Service CHCM 2000 Volume to Capacity ratio 0.88Actuated Cycle Length (s) 90.0 Sum of lost time (s) 14.5Intersection Capacity Utilization 99.5% ICU Level of Service FAnalysis Period (min) 15c Critical Lane Group

HCM Signalized Intersection Capacity Analysis Children's Hospital1: MLK Way & 55th Street 2035 AM No Project
Fehr & Peers Synchro 8 Report
Movement SBRLane ConfigurationsVolume (vph) 70Ideal Flow (vphpl) 1900Total Lost time (s)Lane Util. FactorFrpb, ped/bikesFlpb, ped/bikesFrtFlt ProtectedSatd. Flow (prot)Flt PermittedSatd. Flow (perm)Peak-hour factor, PHF 1.00Adj. Flow (vph) 70RTOR Reduction (vph) 0Lane Group Flow (vph) 0Confl. Peds. (#/hr) 18Confl. Bikes (#/hr) 11Heavy Vehicles (%) 2%Turn TypeProtected PhasesPermitted PhasesActuated Green, G (s)Effective Green, g (s)Actuated g/C RatioClearance Time (s)Vehicle Extension (s)Lane Grp Cap (vph)v/s Ratio Protv/s Ratio Permv/c RatioUniform Delay, d1Progression FactorIncremental Delay, d2Delay (s)Level of ServiceApproach Delay (s)Approach LOS
Intersection Summary
HCM Unsignalized Intersection Capacity Analysis Children's Hospital2: Dover Street & 55th Street 2035 AM No Project
Fehr & Peers Synchro 8 Report
Movement EBL EBT EBR WBL WBT WBR NBL NBT NBR SBL SBT SBRLane ConfigurationsVolume (veh/h) 30 370 10 30 370 10 10 10 20 10 10 30Sign Control Free Free Stop StopGrade 0% 0% 0% 0%Peak Hour Factor 1.00 1.00 1.00 1.00 1.00 1.00 1.00 1.00 1.00 1.00 1.00 1.00Hourly flow rate (vph) 30 370 10 30 370 10 10 10 20 10 10 30Pedestrians 14 30 23 9Lane Width (ft) 12.0 12.0 12.0 12.0Walking Speed (ft/s) 4.0 4.0 4.0 4.0Percent Blockage 1 3 2 1Right turn flare (veh)Median type None NoneMedian storage veh)Upstream signal (ft) 641 677pX, platoon unblocked 0.89 0.89 0.89 0.89 0.89 0.89vC, conflicting volume 389 403 942 907 428 934 907 398vC1, stage 1 conf volvC2, stage 2 conf volvCu, unblocked vol 256 403 875 836 428 866 836 266tC, single (s) 4.1 4.1 7.1 6.5 6.2 7.1 6.5 6.2tC, 2 stage (s)tF (s) 2.2 2.2 3.5 4.0 3.3 3.5 4.0 3.3p0 queue free % 97 97 95 96 97 95 96 96cM capacity (veh/h) 1145 1123 205 252 604 208 249 675
Direction, Lane # EB 1 WB 1 NB 1 SB 1Volume Total 410 410 40 50Volume Left 30 30 10 10Volume Right 10 10 20 30cSH 1145 1123 329 377Volume to Capacity 0.03 0.03 0.12 0.13Queue Length 95th (ft) 2 2 10 11Control Delay (s) 0.9 0.9 17.5 16.0Lane LOS A A C CApproach Delay (s) 0.9 0.9 17.5 16.0Approach LOS C C
Intersection SummaryAverage Delay 2.4Intersection Capacity Utilization 45.2% ICU Level of Service AAnalysis Period (min) 15

HCM Signalized Intersection Capacity Analysis Children's Hospital3: 55th Street & Shattuck Ave 2035 AM No Project
Fehr & Peers Synchro 8 Report
Movement EBL EBT EBR WBL WBT WBR NBL NBT NBR SBL SBT SBRLane ConfigurationsVolume (vph) 80 260 80 40 290 70 50 520 30 30 620 50Ideal Flow (vphpl) 1900 1900 1900 1900 1900 1900 1900 1900 1900 1900 1900 1900Total Lost time (s) 3.0 3.0 5.0 5.0Lane Util. Factor 1.00 1.00 1.00 1.00Frpb, ped/bikes 0.98 0.99 1.00 1.00Flpb, ped/bikes 1.00 1.00 1.00 1.00Frt 0.97 0.98 0.99 0.99Flt Protected 0.99 1.00 1.00 1.00Satd. Flow (prot) 1715 1774 1837 1852Flt Permitted 0.77 0.92 0.91 0.96Satd. Flow (perm) 1339 1639 1675 1787Peak-hour factor, PHF 1.00 1.00 1.00 1.00 1.00 1.00 1.00 1.00 1.00 1.00 1.00 1.00Adj. Flow (vph) 80 260 80 40 290 70 50 520 30 30 620 50RTOR Reduction (vph) 0 10 0 0 10 0 0 2 0 0 3 0Lane Group Flow (vph) 0 410 0 0 390 0 0 598 0 0 697 0Confl. Peds. (#/hr) 9 20 20 9 11 26 26 11Confl. Bikes (#/hr) 33 15 20 36Heavy Vehicles (%) 5% 5% 5% 3% 3% 3% 2% 2% 2% 1% 1% 1%Turn Type Perm NA Perm NA Perm NA Perm NAProtected Phases 2 6 4 8Permitted Phases 2 6 4 4 8Actuated Green, G (s) 25.0 25.0 47.0 47.0Effective Green, g (s) 25.0 25.0 47.0 47.0Actuated g/C Ratio 0.31 0.31 0.59 0.59Clearance Time (s) 3.0 3.0 5.0 5.0Lane Grp Cap (vph) 418 512 984 1049v/s Ratio Protv/s Ratio Perm c0.31 0.24 0.36 c0.39v/c Ratio 0.98 0.76 0.61 0.66Uniform Delay, d1 27.3 24.8 10.6 11.2Progression Factor 1.00 1.00 1.00 1.00Incremental Delay, d2 39.3 10.3 2.8 3.3Delay (s) 66.6 35.1 13.4 14.5Level of Service E D B BApproach Delay (s) 66.6 35.1 13.4 14.5Approach LOS E D B B
Intersection SummaryHCM 2000 Control Delay 28.4 HCM 2000 Level of Service CHCM 2000 Volume to Capacity ratio 0.77Actuated Cycle Length (s) 80.0 Sum of lost time (s) 8.0Intersection Capacity Utilization 95.0% ICU Level of Service FAnalysis Period (min) 15c Critical Lane Group
HCM Signalized Intersection Capacity Analysis Children's Hospital4: 55th Street & Telegraph Ave 2035 AM No Project
Fehr & Peers Synchro 8 Report
Movement EBL EBT EBR WBL WBT WBR NBL NBT NBR SBL SBT SBRLane ConfigurationsVolume (vph) 180 20 100 50 10 10 80 1130 60 40 1340 300Ideal Flow (vphpl) 1900 1900 1900 1900 1900 1900 1900 1900 1900 1900 1900 1900Total Lost time (s) 4.5 4.5 4.5 4.5 4.5 4.5Lane Util. Factor 1.00 1.00 1.00 0.95 1.00 0.95Frpb, ped/bikes 0.98 0.99 1.00 0.99 1.00 0.98Flpb, ped/bikes 1.00 0.99 1.00 1.00 0.99 1.00Frt 0.95 0.98 1.00 0.99 1.00 0.97Flt Protected 0.97 0.97 0.95 1.00 0.95 1.00Satd. Flow (prot) 1645 1710 1770 3493 1775 3424Flt Permitted 0.78 0.72 0.10 1.00 0.18 1.00Satd. Flow (perm) 1314 1279 179 3493 329 3424Peak-hour factor, PHF 1.00 1.00 1.00 1.00 1.00 1.00 1.00 1.00 1.00 1.00 1.00 1.00Adj. Flow (vph) 180 20 100 50 10 10 80 1130 60 40 1340 300RTOR Reduction (vph) 0 20 0 0 7 0 0 4 0 0 23 0Lane Group Flow (vph) 0 280 0 0 63 0 80 1186 0 40 1617 0Confl. Peds. (#/hr) 9 17 17 9 20 26 26 20Confl. Bikes (#/hr) 23 23 65 41Heavy Vehicles (%) 5% 5% 5% 4% 4% 4% 2% 2% 2% 1% 1% 1%Turn Type Perm NA Perm NA Perm NA Perm NAProtected Phases 4 8 2 6Permitted Phases 4 8 2 6Actuated Green, G (s) 19.4 19.4 41.6 41.6 41.6 41.6Effective Green, g (s) 19.4 19.4 41.6 41.6 41.6 41.6Actuated g/C Ratio 0.28 0.28 0.59 0.59 0.59 0.59Clearance Time (s) 4.5 4.5 4.5 4.5 4.5 4.5Vehicle Extension (s) 3.0 3.0 3.0 3.0 3.0 3.0Lane Grp Cap (vph) 364 354 106 2075 195 2034v/s Ratio Prot 0.34 c0.47v/s Ratio Perm c0.21 0.05 0.45 0.12v/c Ratio 0.77 0.18 0.75 0.57 0.21 0.80Uniform Delay, d1 23.3 19.2 10.4 8.7 6.6 10.9Progression Factor 1.00 1.00 1.00 1.00 1.00 1.00Incremental Delay, d2 9.7 0.2 38.7 1.1 2.4 3.3Delay (s) 32.9 19.5 49.1 9.9 8.9 14.2Level of Service C B D A A BApproach Delay (s) 32.9 19.5 12.3 14.1Approach LOS C B B B
Intersection SummaryHCM 2000 Control Delay 15.3 HCM 2000 Level of Service BHCM 2000 Volume to Capacity ratio 0.79Actuated Cycle Length (s) 70.0 Sum of lost time (s) 9.0Intersection Capacity Utilization 81.8% ICU Level of Service DAnalysis Period (min) 15c Critical Lane Group
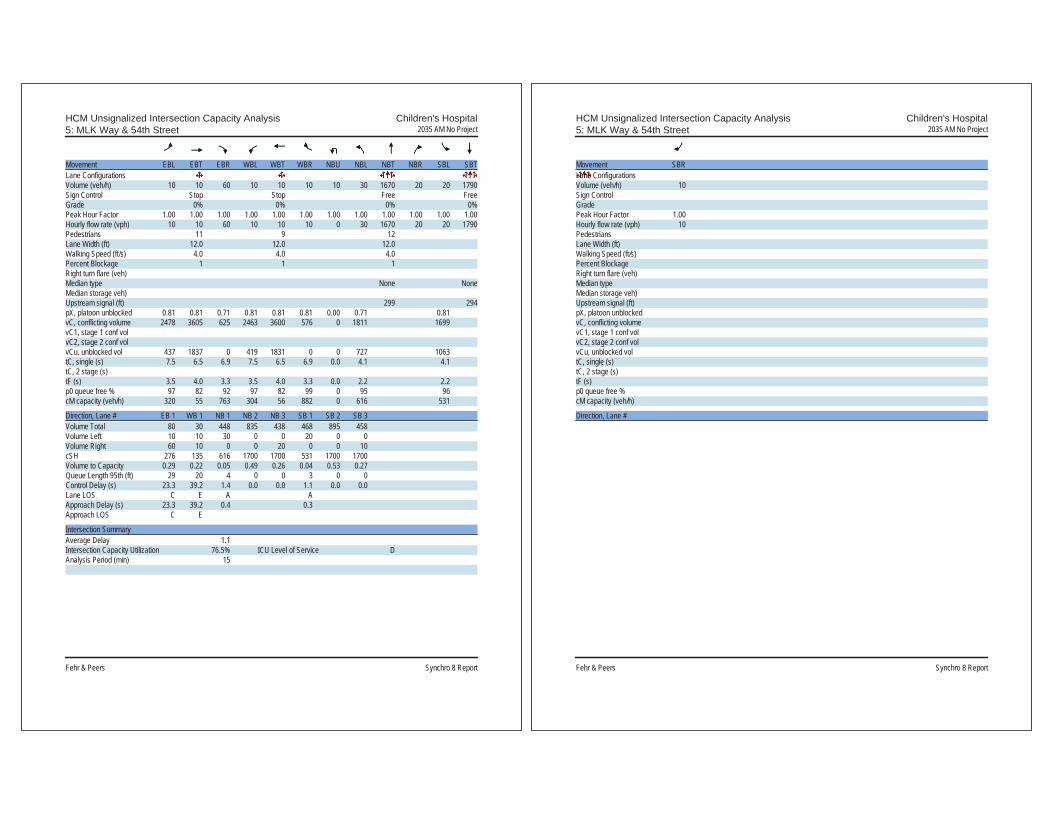
HCM Unsignalized Intersection Capacity Analysis Children's Hospital5: MLK Way & 54th Street 2035 AM No Project
Fehr & Peers Synchro 8 Report
Movement EBL EBT EBR WBL WBT WBR NBU NBL NBT NBR SBL SBTLane ConfigurationsVolume (veh/h) 10 10 60 10 10 10 10 30 1670 20 20 1790Sign Control Stop Stop Free FreeGrade 0% 0% 0% 0%Peak Hour Factor 1.00 1.00 1.00 1.00 1.00 1.00 1.00 1.00 1.00 1.00 1.00 1.00Hourly flow rate (vph) 10 10 60 10 10 10 0 30 1670 20 20 1790Pedestrians 11 9 12Lane Width (ft) 12.0 12.0 12.0Walking Speed (ft/s) 4.0 4.0 4.0Percent Blockage 1 1 1Right turn flare (veh)Median type None NoneMedian storage veh)Upstream signal (ft) 299 294pX, platoon unblocked 0.81 0.81 0.71 0.81 0.81 0.81 0.00 0.71 0.81vC, conflicting volume 2478 3605 625 2463 3600 576 0 1811 1699vC1, stage 1 conf volvC2, stage 2 conf volvCu, unblocked vol 437 1837 0 419 1831 0 0 727 1063tC, single (s) 7.5 6.5 6.9 7.5 6.5 6.9 0.0 4.1 4.1tC, 2 stage (s)tF (s) 3.5 4.0 3.3 3.5 4.0 3.3 0.0 2.2 2.2p0 queue free % 97 82 92 97 82 99 0 95 96cM capacity (veh/h) 320 55 763 304 56 882 0 616 531
Direction, Lane # EB 1 WB 1 NB 1 NB 2 NB 3 SB 1 SB 2 SB 3Volume Total 80 30 448 835 438 468 895 458Volume Left 10 10 30 0 0 20 0 0Volume Right 60 10 0 0 20 0 0 10cSH 276 135 616 1700 1700 531 1700 1700Volume to Capacity 0.29 0.22 0.05 0.49 0.26 0.04 0.53 0.27Queue Length 95th (ft) 29 20 4 0 0 3 0 0Control Delay (s) 23.3 39.2 1.4 0.0 0.0 1.1 0.0 0.0Lane LOS C E A AApproach Delay (s) 23.3 39.2 0.4 0.3Approach LOS C E
Intersection SummaryAverage Delay 1.1Intersection Capacity Utilization 76.5% ICU Level of Service DAnalysis Period (min) 15
HCM Unsignalized Intersection Capacity Analysis Children's Hospital5: MLK Way & 54th Street 2035 AM No Project
Fehr & Peers Synchro 8 Report
Movement SBRLane ConfigurationsVolume (veh/h) 10Sign ControlGradePeak Hour Factor 1.00Hourly flow rate (vph) 10PedestriansLane Width (ft)Walking Speed (ft/s)Percent BlockageRight turn flare (veh)Median typeMedian storage veh)Upstream signal (ft)pX, platoon unblockedvC, conflicting volumevC1, stage 1 conf volvC2, stage 2 conf volvCu, unblocked voltC, single (s)tC, 2 stage (s)tF (s)p0 queue free %cM capacity (veh/h)
Direction, Lane #

HCM Unsignalized Intersection Capacity Analysis Children's Hospital6: Dover Street & 54th Street 2035 AM No Project
Fehr & Peers Synchro 8 Report
Movement EBL EBT EBR WBL WBT WBR NBL NBT NBR SBL SBT SBRLane ConfigurationsVolume (veh/h) 10 10 10 10 10 10 10 20 20 10 40 10Sign Control Stop Stop Free FreeGrade 0% 0% 0% 0%Peak Hour Factor 1.00 1.00 1.00 1.00 1.00 1.00 1.00 1.00 1.00 1.00 1.00 1.00Hourly flow rate (vph) 10 10 10 10 10 10 10 20 20 10 40 10Pedestrians 15 21 3 9Lane Width (ft) 12.0 12.0 12.0 12.0Walking Speed (ft/s) 4.0 4.0 4.0 4.0Percent Blockage 1 2 0 1Right turn flare (veh)Median type None NoneMedian storage veh)Upstream signal (ft)pX, platoon unblockedvC, conflicting volume 154 161 63 154 156 60 65 61vC1, stage 1 conf volvC2, stage 2 conf volvCu, unblocked vol 154 161 63 154 156 60 65 61tC, single (s) 7.1 6.5 6.2 7.1 6.5 6.2 4.1 4.1tC, 2 stage (s)tF (s) 3.5 4.0 3.3 3.5 4.0 3.3 2.2 2.2p0 queue free % 99 99 99 99 99 99 99 99cM capacity (veh/h) 759 704 992 759 708 986 1531 1528
Direction, Lane # EB 1 WB 1 NB 1 SB 1Volume Total 30 30 50 60Volume Left 10 10 10 10Volume Right 10 10 20 10cSH 801 801 1531 1528Volume to Capacity 0.04 0.04 0.01 0.01Queue Length 95th (ft) 3 3 0 0Control Delay (s) 9.7 9.7 1.5 1.3Lane LOS A A A AApproach Delay (s) 9.7 9.7 1.5 1.3Approach LOS A A
Intersection SummaryAverage Delay 4.3Intersection Capacity Utilization 21.7% ICU Level of Service AAnalysis Period (min) 15
HCM Unsignalized Intersection Capacity Analysis Children's Hospital7: Shattuck Ave & 54th Street 2035 AM No Project
Fehr & Peers Synchro 8 Report
Movement EBL EBR NBL NBT SBT SBRLane ConfigurationsVolume (veh/h) 10 20 20 590 710 10Sign Control Stop Free FreeGrade 0% 0% 0%Peak Hour Factor 1.00 1.00 1.00 1.00 1.00 1.00Hourly flow rate (vph) 10 20 20 590 710 10Pedestrians 14 3 2Lane Width (ft) 12.0 12.0 12.0Walking Speed (ft/s) 4.0 4.0 4.0Percent Blockage 1 0 0Right turn flare (veh)Median type None NoneMedian storage veh)Upstream signal (ft) 550 282pX, platoon unblocked 0.75 0.75 0.75vC, conflicting volume 1361 732 734vC1, stage 1 conf volvC2, stage 2 conf volvCu, unblocked vol 1315 478 481tC, single (s) 6.4 6.2 4.1tC, 2 stage (s)tF (s) 3.5 3.3 2.2p0 queue free % 92 95 98cM capacity (veh/h) 127 438 804
Direction, Lane # EB 1 NB 1 SB 1Volume Total 30 610 720Volume Left 10 20 0Volume Right 20 0 10cSH 241 804 1700Volume to Capacity 0.12 0.02 0.42Queue Length 95th (ft) 10 2 0Control Delay (s) 22.0 0.7 0.0Lane LOS C AApproach Delay (s) 22.0 0.7 0.0Approach LOS C
Intersection SummaryAverage Delay 0.8Intersection Capacity Utilization 58.2% ICU Level of Service BAnalysis Period (min) 15

HCM Signalized Intersection Capacity Analysis Children's Hospital8: MLK Way & 53rd Street 2035 AM No Project
Fehr & Peers Synchro 8 Report
Movement EBL EBT EBR WBL WBT WBR NBL NBT NBR SBL SBT SBRLane ConfigurationsVolume (vph) 10 10 50 20 10 20 30 1700 40 20 1850 10Ideal Flow (vphpl) 1900 1900 1900 1900 1900 1900 1900 1900 1900 1900 1900 1900Total Lost time (s) 5.0 5.0 4.0 3.5 4.0 3.5Lane Util. Factor 1.00 1.00 1.00 0.91 1.00 0.91Frpb, ped/bikes 0.98 0.99 1.00 1.00 1.00 1.00Flpb, ped/bikes 1.00 1.00 1.00 1.00 1.00 1.00Frt 0.90 0.95 1.00 1.00 1.00 1.00Flt Protected 0.99 0.98 0.95 1.00 0.95 1.00Satd. Flow (prot) 1639 1740 1770 5059 1787 5129Flt Permitted 0.96 0.88 0.95 1.00 0.95 1.00Satd. Flow (perm) 1589 1562 1770 5059 1787 5129Peak-hour factor, PHF 1.00 1.00 1.00 1.00 1.00 1.00 1.00 1.00 1.00 1.00 1.00 1.00Adj. Flow (vph) 10 10 50 20 10 20 30 1700 40 20 1850 10RTOR Reduction (vph) 0 41 0 0 16 0 0 1 0 0 0 0Lane Group Flow (vph) 0 29 0 0 34 0 30 1739 0 20 1860 0Confl. Peds. (#/hr) 11 20 20 11 20 30Confl. Bikes (#/hr) 8 20Heavy Vehicles (%) 2% 2% 2% 0% 0% 0% 2% 2% 2% 1% 1% 1%Turn Type Perm NA Perm NA Prot NA Prot NAProtected Phases 4 8 5 2 1 6Permitted Phases 4 8Actuated Green, G (s) 15.8 15.8 4.5 58.1 3.6 57.2Effective Green, g (s) 15.8 15.8 4.5 58.1 3.6 57.2Actuated g/C Ratio 0.18 0.18 0.05 0.65 0.04 0.64Clearance Time (s) 5.0 5.0 4.0 3.5 4.0 3.5Vehicle Extension (s) 3.0 3.0 3.0 3.0 3.0 3.0Lane Grp Cap (vph) 278 274 88 3265 71 3259v/s Ratio Prot 0.02 c0.34 0.01 c0.36v/s Ratio Perm 0.02 c0.02v/c Ratio 0.10 0.12 0.34 0.53 0.28 0.57Uniform Delay, d1 31.2 31.3 41.3 8.6 41.9 9.4Progression Factor 1.00 1.00 1.19 0.43 0.50 0.26Incremental Delay, d2 0.2 0.2 1.7 0.5 1.2 0.4Delay (s) 31.3 31.6 51.0 4.2 22.2 2.9Level of Service C C D A C AApproach Delay (s) 31.3 31.6 5.0 3.1Approach LOS C C A A
Intersection SummaryHCM 2000 Control Delay 4.9 HCM 2000 Level of Service AHCM 2000 Volume to Capacity ratio 0.49Actuated Cycle Length (s) 90.0 Sum of lost time (s) 12.5Intersection Capacity Utilization 62.7% ICU Level of Service BAnalysis Period (min) 15c Critical Lane Group
HCM Unsignalized Intersection Capacity Analysis Children's Hospital9: Dover Street & 53rd Street 2035 AM No Project
Fehr & Peers Synchro 8 Report
Movement EBL EBT EBR WBL WBT WBR NBL NBT NBR SBL SBT SBRLane ConfigurationsVolume (veh/h) 20 10 30 10 10 10 20 30 20 10 30 20Sign Control Stop Stop Free FreeGrade 0% 0% 0% 0%Peak Hour Factor 1.00 1.00 1.00 1.00 1.00 1.00 1.00 1.00 1.00 1.00 1.00 1.00Hourly flow rate (vph) 20 10 30 10 10 10 20 30 20 10 30 20Pedestrians 33 32 3 3Lane Width (ft) 12.0 12.0 12.0 12.0Walking Speed (ft/s) 4.0 4.0 4.0 4.0Percent Blockage 3 3 0 0Right turn flare (veh)Median type None NoneMedian storage veh)Upstream signal (ft)pX, platoon unblockedvC, conflicting volume 191 215 76 210 215 75 83 82vC1, stage 1 conf volvC2, stage 2 conf volvCu, unblocked vol 191 215 76 210 215 75 83 82tC, single (s) 7.1 6.5 6.2 7.1 6.5 6.2 4.1 4.1tC, 2 stage (s)tF (s) 3.5 4.0 3.3 3.5 4.0 3.3 2.2 2.2p0 queue free % 97 98 97 98 98 99 99 99cM capacity (veh/h) 693 637 961 660 637 963 1485 1487
Direction, Lane # EB 1 WB 1 NB 1 SB 1Volume Total 60 30 70 60Volume Left 20 10 20 10Volume Right 30 10 20 20cSH 792 727 1485 1487Volume to Capacity 0.08 0.04 0.01 0.01Queue Length 95th (ft) 6 3 1 1Control Delay (s) 9.9 10.2 2.2 1.3Lane LOS A B A AApproach Delay (s) 9.9 10.2 2.2 1.3Approach LOS A B
Intersection SummaryAverage Delay 5.1Intersection Capacity Utilization 23.5% ICU Level of Service AAnalysis Period (min) 15

HCM Signalized Intersection Capacity Analysis Children's Hospital10: MLK Way & 52nd Street 2035 AM No Project
Fehr & Peers Synchro 8 Report
Movement EBL EBT EBR WBL WBT WBR NBU NBL NBT NBR SBU SBLLane ConfigurationsVolume (vph) 50 100 120 90 110 210 60 110 1500 180 10 140Ideal Flow (vphpl) 1900 1900 1900 1900 1900 1900 1900 1900 1900 1900 1900 1900Total Lost time (s) 5.0 5.0 5.0 5.0 4.5 4.5 4.0Lane Util. Factor 1.00 1.00 1.00 1.00 1.00 0.91 1.00Frpb, ped/bikes 1.00 0.96 1.00 0.97 1.00 1.00 1.00Flpb, ped/bikes 0.99 1.00 0.98 1.00 1.00 1.00 1.00Frt 1.00 0.92 1.00 0.85 1.00 0.98 1.00Flt Protected 0.95 1.00 0.98 1.00 0.95 1.00 0.95Satd. Flow (prot) 1770 1650 1786 1534 1787 5038 1787Flt Permitted 0.54 1.00 0.64 1.00 0.95 1.00 0.95Satd. Flow (perm) 1012 1650 1171 1534 1787 5038 1787Peak-hour factor, PHF 1.00 1.00 1.00 1.00 1.00 1.00 1.00 1.00 1.00 1.00 1.00 1.00Adj. Flow (vph) 50 100 120 90 110 210 60 110 1500 180 10 140RTOR Reduction (vph) 0 54 0 0 0 155 0 0 14 0 0 0Lane Group Flow (vph) 50 166 0 0 200 55 0 170 1666 0 0 150Confl. Peds. (#/hr) 15 74 74 15 11Confl. Bikes (#/hr) 9 8 2Heavy Vehicles (%) 1% 1% 1% 2% 2% 2% 1% 1% 1% 1% 1% 1%Turn Type Perm NA Perm NA Perm Prot Prot NA Prot ProtProtected Phases 4 8 5 5 2 1 1Permitted Phases 4 8 8Actuated Green, G (s) 23.5 23.5 23.5 23.5 7.5 40.5 12.5Effective Green, g (s) 23.5 23.5 23.5 23.5 7.5 40.5 12.5Actuated g/C Ratio 0.26 0.26 0.26 0.26 0.08 0.45 0.14Clearance Time (s) 5.0 5.0 5.0 5.0 4.5 4.5 4.0Vehicle Extension (s) 2.0 2.0 2.0 2.0 2.0 2.0 2.0Lane Grp Cap (vph) 264 430 305 400 148 2267 248v/s Ratio Prot 0.10 c0.10 c0.33 0.08v/s Ratio Perm 0.05 c0.17 0.04v/c Ratio 0.19 0.39 0.66 0.14 1.15 0.73 0.60Uniform Delay, d1 25.8 27.3 29.6 25.5 41.2 20.3 36.4Progression Factor 1.00 1.00 1.00 1.00 1.00 1.09 0.85Incremental Delay, d2 0.1 0.2 3.8 0.1 93.4 0.9 2.5Delay (s) 26.0 27.5 33.5 25.5 134.7 23.0 33.6Level of Service C C C C F C CApproach Delay (s) 27.2 29.4 33.3Approach LOS C C C
Intersection SummaryHCM 2000 Control Delay 25.8 HCM 2000 Level of Service CHCM 2000 Volume to Capacity ratio 0.75Actuated Cycle Length (s) 90.0 Sum of lost time (s) 14.0Intersection Capacity Utilization 100.9% ICU Level of Service GAnalysis Period (min) 15c Critical Lane Group
HCM Signalized Intersection Capacity Analysis Children's Hospital10: MLK Way & 52nd Street 2035 AM No Project
Fehr & Peers Synchro 8 Report
Movement SBT SBRLane ConfigurationsVolume (vph) 1760 0Ideal Flow (vphpl) 1900 1900Total Lost time (s) 4.5Lane Util. Factor 0.91Frpb, ped/bikes 1.00Flpb, ped/bikes 1.00Frt 1.00Flt Protected 1.00Satd. Flow (prot) 5136Flt Permitted 1.00Satd. Flow (perm) 5136Peak-hour factor, PHF 1.00 1.00Adj. Flow (vph) 1760 0RTOR Reduction (vph) 0 0Lane Group Flow (vph) 1760 0Confl. Peds. (#/hr) 15Confl. Bikes (#/hr) 15Heavy Vehicles (%) 1% 1%Turn Type NAProtected Phases 6Permitted PhasesActuated Green, G (s) 45.0Effective Green, g (s) 45.0Actuated g/C Ratio 0.50Clearance Time (s) 4.5Vehicle Extension (s) 2.0Lane Grp Cap (vph) 2568v/s Ratio Prot c0.34v/s Ratio Permv/c Ratio 0.69Uniform Delay, d1 17.1Progression Factor 0.87Incremental Delay, d2 1.3Delay (s) 16.2Level of Service BApproach Delay (s) 17.6Approach LOS B
Intersection Summary
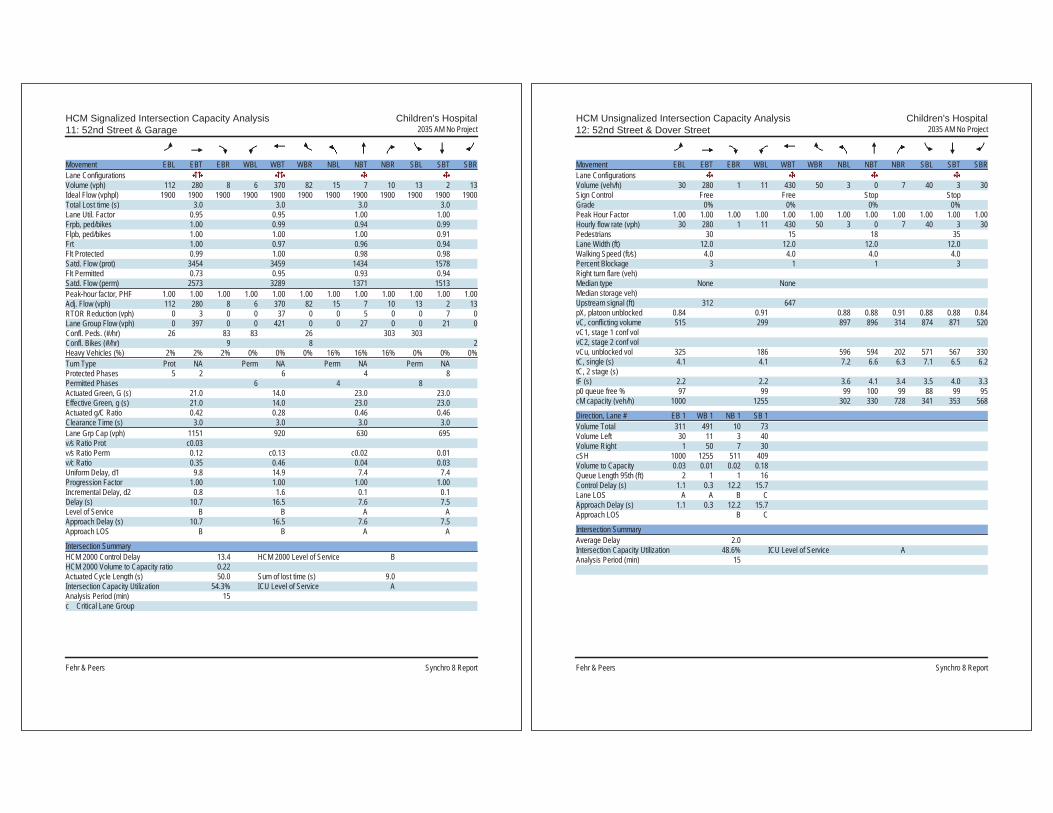
HCM Signalized Intersection Capacity Analysis Children's Hospital11: 52nd Street & Garage 2035 AM No Project
Fehr & Peers Synchro 8 Report
Movement EBL EBT EBR WBL WBT WBR NBL NBT NBR SBL SBT SBRLane ConfigurationsVolume (vph) 112 280 8 6 370 82 15 7 10 13 2 13Ideal Flow (vphpl) 1900 1900 1900 1900 1900 1900 1900 1900 1900 1900 1900 1900Total Lost time (s) 3.0 3.0 3.0 3.0Lane Util. Factor 0.95 0.95 1.00 1.00Frpb, ped/bikes 1.00 0.99 0.94 0.99Flpb, ped/bikes 1.00 1.00 1.00 0.91Frt 1.00 0.97 0.96 0.94Flt Protected 0.99 1.00 0.98 0.98Satd. Flow (prot) 3454 3459 1434 1578Flt Permitted 0.73 0.95 0.93 0.94Satd. Flow (perm) 2573 3289 1371 1513Peak-hour factor, PHF 1.00 1.00 1.00 1.00 1.00 1.00 1.00 1.00 1.00 1.00 1.00 1.00Adj. Flow (vph) 112 280 8 6 370 82 15 7 10 13 2 13RTOR Reduction (vph) 0 3 0 0 37 0 0 5 0 0 7 0Lane Group Flow (vph) 0 397 0 0 421 0 0 27 0 0 21 0Confl. Peds. (#/hr) 26 83 83 26 303 303Confl. Bikes (#/hr) 9 8 2Heavy Vehicles (%) 2% 2% 2% 0% 0% 0% 16% 16% 16% 0% 0% 0%Turn Type Prot NA Perm NA Perm NA Perm NAProtected Phases 5 2 6 4 8Permitted Phases 6 4 8Actuated Green, G (s) 21.0 14.0 23.0 23.0Effective Green, g (s) 21.0 14.0 23.0 23.0Actuated g/C Ratio 0.42 0.28 0.46 0.46Clearance Time (s) 3.0 3.0 3.0 3.0Lane Grp Cap (vph) 1151 920 630 695v/s Ratio Prot c0.03v/s Ratio Perm 0.12 c0.13 c0.02 0.01v/c Ratio 0.35 0.46 0.04 0.03Uniform Delay, d1 9.8 14.9 7.4 7.4Progression Factor 1.00 1.00 1.00 1.00Incremental Delay, d2 0.8 1.6 0.1 0.1Delay (s) 10.7 16.5 7.6 7.5Level of Service B B A AApproach Delay (s) 10.7 16.5 7.6 7.5Approach LOS B B A A
Intersection SummaryHCM 2000 Control Delay 13.4 HCM 2000 Level of Service BHCM 2000 Volume to Capacity ratio 0.22Actuated Cycle Length (s) 50.0 Sum of lost time (s) 9.0Intersection Capacity Utilization 54.3% ICU Level of Service AAnalysis Period (min) 15c Critical Lane Group
HCM Unsignalized Intersection Capacity Analysis Children's Hospital12: 52nd Street & Dover Street 2035 AM No Project
Fehr & Peers Synchro 8 Report
Movement EBL EBT EBR WBL WBT WBR NBL NBT NBR SBL SBT SBRLane ConfigurationsVolume (veh/h) 30 280 1 11 430 50 3 0 7 40 3 30Sign Control Free Free Stop StopGrade 0% 0% 0% 0%Peak Hour Factor 1.00 1.00 1.00 1.00 1.00 1.00 1.00 1.00 1.00 1.00 1.00 1.00Hourly flow rate (vph) 30 280 1 11 430 50 3 0 7 40 3 30Pedestrians 30 15 18 35Lane Width (ft) 12.0 12.0 12.0 12.0Walking Speed (ft/s) 4.0 4.0 4.0 4.0Percent Blockage 3 1 1 3Right turn flare (veh)Median type None NoneMedian storage veh)Upstream signal (ft) 312 647pX, platoon unblocked 0.84 0.91 0.88 0.88 0.91 0.88 0.88 0.84vC, conflicting volume 515 299 897 896 314 874 871 520vC1, stage 1 conf volvC2, stage 2 conf volvCu, unblocked vol 325 186 596 594 202 571 567 330tC, single (s) 4.1 4.1 7.2 6.6 6.3 7.1 6.5 6.2tC, 2 stage (s)tF (s) 2.2 2.2 3.6 4.1 3.4 3.5 4.0 3.3p0 queue free % 97 99 99 100 99 88 99 95cM capacity (veh/h) 1000 1255 302 330 728 341 353 568
Direction, Lane # EB 1 WB 1 NB 1 SB 1Volume Total 311 491 10 73Volume Left 30 11 3 40Volume Right 1 50 7 30cSH 1000 1255 511 409Volume to Capacity 0.03 0.01 0.02 0.18Queue Length 95th (ft) 2 1 1 16Control Delay (s) 1.1 0.3 12.2 15.7Lane LOS A A B CApproach Delay (s) 1.1 0.3 12.2 15.7Approach LOS B C
Intersection SummaryAverage Delay 2.0Intersection Capacity Utilization 48.6% ICU Level of Service AAnalysis Period (min) 15

HCM Unsignalized Intersection Capacity Analysis Children's Hospital13: SR-24 NB Off-Ramp & 52nd Street 2035 AM No Project
Fehr & Peers Synchro 8 Report
Movement EBL EBT EBR WBL WBT WBR NBL NBR SEL SERLane ConfigurationsVolume (veh/h) 0 330 0 0 500 1270 0 1100 0 0Sign Control Free Free Stop StopGrade 0% 0% 0% 0%Peak Hour Factor 1.00 1.00 1.00 1.00 1.00 1.00 1.00 1.00 1.00 1.00Hourly flow rate (vph) 0 330 0 0 500 1270 0 1100 0 0Pedestrians 36Lane Width (ft) 12.0Walking Speed (ft/s) 4.0Percent Blockage 3Right turn flare (veh)Median type None NoneMedian storage veh)Upstream signal (ft) 767 192pX, platoon unblocked 0.80 0.80 0.80 0.80vC, conflicting volume 1770 366 2136 201 1765 866vC1, stage 1 conf volvC2, stage 2 conf volvCu, unblocked vol 1461 366 1919 201 1455 330tC, single (s) 4.1 4.1 6.5 7.0 7.5 6.5tC, 2 stage (s)tF (s) 2.2 2.2 4.0 3.3 3.5 4.0p0 queue free % 100 100 100 0 0 100cM capacity (veh/h) 366 1153 52 779 0 456
Direction, Lane # EB 1 EB 2 WB 1 WB 2 WB 3 NB 1 NB 2Volume Total 165 165 333 590 847 550 550Volume Left 0 0 0 0 0 0 0Volume Right 0 0 0 423 847 550 550cSH 1700 1700 1700 1700 1700 779 779Volume to Capacity 0.10 0.10 0.20 0.35 0.50 0.71 0.71Queue Length 95th (ft) 0 0 0 0 0 149 149Control Delay (s) 0.0 0.0 0.0 0.0 0.0 19.9 19.9Lane LOS C CApproach Delay (s) 0.0 0.0 19.9Approach LOS C
Intersection SummaryAverage Delay 6.8Intersection Capacity Utilization 57.2% ICU Level of Service BAnalysis Period (min) 15
HCM Signalized Intersection Capacity Analysis Children's Hospital14: 52nd Street & Shattuck Ave 2035 AM No Project
Fehr & Peers Synchro 8 Report
Movement EBU EBL EBT EBR WBL WBT WBR NBL NBT NBR SBL SBTLane ConfigurationsVolume (vph) 50 300 920 160 50 1130 150 180 150 60 140 190Ideal Flow (vphpl) 1900 1900 1900 1900 1900 1900 1900 1900 1900 1900 1900 1900Total Lost time (s) 4.0 4.5 4.0 4.5 4.0 5.5 5.5Lane Util. Factor 1.00 0.91 1.00 0.91 1.00 1.00 1.00Frpb, ped/bikes 1.00 0.99 1.00 0.99 1.00 0.99 1.00Flpb, ped/bikes 1.00 1.00 1.00 1.00 1.00 1.00 1.00Frt 1.00 0.98 1.00 0.98 1.00 0.96 1.00Flt Protected 0.95 1.00 0.95 1.00 0.95 1.00 0.98Satd. Flow (prot) 1787 4960 1805 5069 1752 1748 1731Flt Permitted 0.95 1.00 0.95 1.00 0.31 1.00 0.77Satd. Flow (perm) 1787 4960 1805 5069 578 1748 1356Peak-hour factor, PHF 1.00 1.00 1.00 1.00 1.00 1.00 1.00 1.00 1.00 1.00 1.00 1.00Adj. Flow (vph) 50 300 920 160 50 1130 150 180 150 60 140 190RTOR Reduction (vph) 0 0 23 0 0 18 0 0 16 0 0 0Lane Group Flow (vph) 0 350 1057 0 50 1262 0 180 194 0 0 330Confl. Peds. (#/hr) 18 8 15 15Confl. Bikes (#/hr) 18 2 15Heavy Vehicles (%) 1% 1% 1% 1% 0% 0% 0% 3% 3% 3% 7% 7%Turn Type Prot Prot NA Prot NA pm+pt NA Perm NAProtected Phases 7 7 4 3 8 5 2 6Permitted Phases 2 6Actuated Green, G (s) 21.5 34.6 5.5 18.6 35.9 35.9 25.4Effective Green, g (s) 21.5 34.6 5.5 18.6 35.9 35.9 25.4Actuated g/C Ratio 0.24 0.38 0.06 0.21 0.40 0.40 0.28Clearance Time (s) 4.0 4.5 4.0 4.5 4.0 5.5 5.5Vehicle Extension (s) 3.0 3.0 3.0 3.0 3.0 3.0 3.0Lane Grp Cap (vph) 426 1906 110 1047 315 697 382v/s Ratio Prot c0.20 0.21 0.03 c0.25 c0.04 0.11v/s Ratio Perm 0.19 c0.24v/c Ratio 0.82 0.55 0.45 1.21 0.57 0.28 0.86Uniform Delay, d1 32.4 21.7 40.8 35.7 19.3 18.3 30.7Progression Factor 1.00 1.00 1.05 0.88 1.00 1.00 1.00Incremental Delay, d2 16.2 1.2 1.9 98.4 2.5 1.0 22.0Delay (s) 48.6 22.8 44.7 129.9 21.8 19.3 52.7Level of Service D C D F C B DApproach Delay (s) 29.1 126.7 20.4 38.6Approach LOS C F C D
Intersection SummaryHCM 2000 Control Delay 63.4 HCM 2000 Level of Service EHCM 2000 Volume to Capacity ratio 0.92Actuated Cycle Length (s) 90.0 Sum of lost time (s) 18.0Intersection Capacity Utilization 111.1% ICU Level of Service HAnalysis Period (min) 15c Critical Lane Group

HCM Signalized Intersection Capacity Analysis Children's Hospital14: 52nd Street & Shattuck Ave 2035 AM No Project
Fehr & Peers Synchro 8 Report
Movement SBRLane ConfigurationsVolume (vph) 410Ideal Flow (vphpl) 1900Total Lost time (s) 5.5Lane Util. Factor 1.00Frpb, ped/bikes 0.92Flpb, ped/bikes 1.00Frt 0.85Flt Protected 1.00Satd. Flow (prot) 1385Flt Permitted 1.00Satd. Flow (perm) 1385Peak-hour factor, PHF 1.00Adj. Flow (vph) 410RTOR Reduction (vph) 292Lane Group Flow (vph) 118Confl. Peds. (#/hr) 24Confl. Bikes (#/hr) 62Heavy Vehicles (%) 7%Turn Type PermProtected PhasesPermitted Phases 6Actuated Green, G (s) 25.4Effective Green, g (s) 25.4Actuated g/C Ratio 0.28Clearance Time (s) 5.5Vehicle Extension (s) 3.0Lane Grp Cap (vph) 390v/s Ratio Protv/s Ratio Perm 0.09v/c Ratio 0.30Uniform Delay, d1 25.3Progression Factor 1.00Incremental Delay, d2 2.0Delay (s) 27.3Level of Service CApproach Delay (s)Approach LOS
Intersection Summary
HCM Signalized Intersection Capacity Analysis Children's Hospital15: Telegraph Ave & 52nd Street/Claremont Ave 2035 AM No Project
Fehr & Peers Synchro 8 Report
Movement EBL EBT EBR WBL WBT WBR NBL NBT NBR SBL SBT SBRLane ConfigurationsVolume (vph) 10 10 10 120 70 230 10 1010 140 130 900 480Ideal Flow (vphpl) 1900 1900 1900 1900 1900 1900 1900 1900 1900 1900 1900 1900Lane Width 12 12 12 12 12 12 12 16 12 12 12 12Total Lost time (s) 4.5 4.5 4.5 4.5 4.5 4.5Lane Util. Factor 1.00 0.95 0.95 0.95 1.00 0.95Frpb, ped/bikes 0.99 1.00 0.98 0.99 1.00 0.96Flpb, ped/bikes 1.00 1.00 1.00 1.00 1.00 1.00Frt 0.95 1.00 0.89 0.98 1.00 0.95Flt Protected 0.98 0.95 1.00 1.00 0.95 1.00Satd. Flow (prot) 1641 1698 1560 3863 1770 3210Flt Permitted 0.98 0.95 1.00 0.94 0.95 1.00Satd. Flow (perm) 1641 1698 1560 3627 1770 3210Peak-hour factor, PHF 1.00 1.00 1.00 1.00 1.00 1.00 1.00 1.00 1.00 1.00 1.00 1.00Adj. Flow (vph) 10 10 10 120 70 230 10 1010 140 130 900 480RTOR Reduction (vph) 0 10 0 0 129 0 0 9 0 0 57 0Lane Group Flow (vph) 0 21 0 108 183 0 0 1151 0 130 1323 0Confl. Peds. (#/hr) 6 6 33 27 33Confl. Bikes (#/hr) 2 3 50 41Heavy Vehicles (%) 8% 8% 8% 1% 1% 1% 3% 3% 3% 2% 2% 2%Turn Type Split NA Split NA Perm NA Prot NAProtected Phases 4 4 8 8 2 1 6Permitted Phases 2Actuated Green, G (s) 4.5 17.1 17.1 40.6 9.8 54.9Effective Green, g (s) 4.5 17.1 17.1 40.6 9.8 54.9Actuated g/C Ratio 0.05 0.19 0.19 0.45 0.11 0.61Clearance Time (s) 4.5 4.5 4.5 4.5 4.5 4.5Vehicle Extension (s) 3.0 3.0 3.0 3.0 3.0 3.0Lane Grp Cap (vph) 82 322 296 1636 192 1958v/s Ratio Prot c0.01 0.06 c0.12 0.07 c0.41v/s Ratio Perm 0.32v/c Ratio 0.25 0.34 0.62 0.70 0.68 0.68Uniform Delay, d1 41.1 31.5 33.5 19.9 38.6 11.6Progression Factor 1.49 1.00 1.00 0.94 1.00 1.00Incremental Delay, d2 0.8 0.6 3.8 1.8 9.1 1.9Delay (s) 62.2 32.2 37.3 20.5 47.7 13.5Level of Service E C D C D BApproach Delay (s) 62.2 36.0 20.5 16.5Approach LOS E D C B
Intersection SummaryHCM 2000 Control Delay 21.0 HCM 2000 Level of Service CHCM 2000 Volume to Capacity ratio 0.68Actuated Cycle Length (s) 90.0 Sum of lost time (s) 18.0Intersection Capacity Utilization 101.4% ICU Level of Service GAnalysis Period (min) 15c Critical Lane Group

HCM Signalized Intersection Capacity Analysis Children's Hospital16: Telegraph Ave & 51St Street 2035 AM No Project
Fehr & Peers Synchro 8 Report
Movement EBL EBT EBR WBL WBT WBR NBL NBT NBR SBL SBT SBRLane ConfigurationsVolume (vph) 330 660 100 130 590 320 130 510 80 220 740 70Ideal Flow (vphpl) 1900 1900 1900 1900 1900 1900 1900 1900 1900 1900 1900 1900Total Lost time (s) 4.0 4.0 4.0 3.5 4.0 4.5 4.0 3.5Lane Util. Factor 0.97 0.95 1.00 0.95 1.00 0.95 1.00 0.95Frpb, ped/bikes 1.00 0.99 1.00 0.97 1.00 0.99 1.00 0.99Flpb, ped/bikes 1.00 1.00 1.00 1.00 1.00 1.00 1.00 1.00Frt 1.00 0.98 1.00 0.95 1.00 0.98 1.00 0.99Flt Protected 0.95 1.00 0.95 1.00 0.95 1.00 0.95 1.00Satd. Flow (prot) 3400 3399 1787 3292 1719 3324 1752 3420Flt Permitted 0.95 1.00 0.95 1.00 0.95 1.00 0.95 1.00Satd. Flow (perm) 3400 3399 1787 3292 1719 3324 1752 3420Peak-hour factor, PHF 1.00 1.00 1.00 1.00 1.00 1.00 1.00 1.00 1.00 1.00 1.00 1.00Adj. Flow (vph) 330 660 100 130 590 320 130 510 80 220 740 70RTOR Reduction (vph) 0 13 0 0 80 0 0 13 0 0 8 0Lane Group Flow (vph) 330 747 0 130 830 0 130 577 0 220 802 0Confl. Peds. (#/hr) 47 47 45 56Confl. Bikes (#/hr) 14 11 41 41Heavy Vehicles (%) 3% 3% 3% 1% 1% 1% 5% 5% 5% 3% 3% 3%Turn Type Prot NA Prot NA Prot NA Prot NAProtected Phases 7 4 3 8 5 2 1 6Permitted PhasesActuated Green, G (s) 12.9 27.3 10.6 25.5 10.7 23.6 12.0 25.9Effective Green, g (s) 12.9 27.3 10.6 25.5 10.7 23.6 12.0 25.9Actuated g/C Ratio 0.14 0.30 0.12 0.28 0.12 0.26 0.13 0.29Clearance Time (s) 4.0 4.0 4.0 3.5 4.0 4.5 4.0 3.5Vehicle Extension (s) 3.0 3.0 3.0 3.0 3.0 3.0 3.0 3.0Lane Grp Cap (vph) 487 1031 210 932 204 871 233 984v/s Ratio Prot c0.10 0.22 0.07 c0.25 0.08 0.17 c0.13 c0.23v/s Ratio Permv/c Ratio 0.68 0.72 0.62 0.89 0.64 0.66 0.94 0.82Uniform Delay, d1 36.6 28.0 37.8 30.9 37.8 29.6 38.7 29.8Progression Factor 1.22 1.02 1.00 1.00 1.00 1.00 1.24 0.83Incremental Delay, d2 3.1 3.7 5.3 12.5 6.4 3.9 37.5 6.0Delay (s) 47.8 32.3 43.1 43.4 44.2 33.6 85.5 30.8Level of Service D C D D D C F CApproach Delay (s) 37.0 43.4 35.5 42.5Approach LOS D D D D
Intersection SummaryHCM 2000 Control Delay 39.9 HCM 2000 Level of Service DHCM 2000 Volume to Capacity ratio 0.86Actuated Cycle Length (s) 90.0 Sum of lost time (s) 16.5Intersection Capacity Utilization 81.6% ICU Level of Service DAnalysis Period (min) 15c Critical Lane Group
HCM Signalized Intersection Capacity Analysis Children's Hospital17: SB SR-24 On-Ramp & MLK Way & NB SR-24 Off-Ramp 2035 AM No Project
Fehr & Peers Synchro 8 Report
Movement EBL EBT EBR WBL WBT WBR NBL NBT NBR SBL SBT SBRLane ConfigurationsVolume (vph) 260 0 0 0 0 1610 0 0 0 0 1720 260Ideal Flow (vphpl) 1900 1900 1900 1900 1900 1900 1900 1900 1900 1900 1900 1900Total Lost time (s) 4.0 4.0 4.0 4.0Lane Util. Factor 0.97 1.00 0.95 0.88Frpb, ped/bikes 1.00 1.00 1.00 1.00Flpb, ped/bikes 1.00 1.00 1.00 1.00Frt 1.00 0.86 1.00 0.85Flt Protected 0.95 1.00 1.00 1.00Satd. Flow (prot) 3273 1627 3574 2814Flt Permitted 0.95 1.00 1.00 1.00Satd. Flow (perm) 3273 1627 3574 2814Peak-hour factor, PHF 1.00 1.00 1.00 1.00 1.00 1.00 1.00 1.00 1.00 1.00 1.00 1.00Adj. Flow (vph) 260 0 0 0 0 1610 0 0 0 0 1720 260RTOR Reduction (vph) 0 0 0 0 0 0 0 0 0 0 0 0Lane Group Flow (vph) 260 0 0 0 0 1610 0 0 0 0 1720 260Confl. Peds. (#/hr) 9Confl. Bikes (#/hr) 3Heavy Vehicles (%) 7% 7% 2% 2% 1% 1% 2% 2% 2% 2% 1% 1%Turn Type Prot Free NA customProtected Phases 2 6 FreePermitted Phases FreeActuated Green, G (s) 8.0 45.0 29.0 45.0Effective Green, g (s) 8.0 45.0 29.0 45.0Actuated g/C Ratio 0.18 1.00 0.64 1.00Clearance Time (s) 4.0 4.0Lane Grp Cap (vph) 581 1627 2303 2814v/s Ratio Prot 0.08 0.48 0.09v/s Ratio Perm c0.99v/c Ratio 0.45 0.99 0.75 0.09Uniform Delay, d1 16.5 0.0 5.5 0.0Progression Factor 1.00 1.00 2.06 1.00Incremental Delay, d2 2.5 20.0 1.7 0.0Delay (s) 19.0 20.0 13.0 0.0Level of Service B B B AApproach Delay (s) 19.0 20.0 0.0 11.3Approach LOS B B A B
Intersection SummaryHCM 2000 Control Delay 15.4 HCM 2000 Level of Service BHCM 2000 Volume to Capacity ratio 1.20Actuated Cycle Length (s) 45.0 Sum of lost time (s) 8.0Intersection Capacity Utilization 61.6% ICU Level of Service BAnalysis Period (min) 15c Critical Lane Group
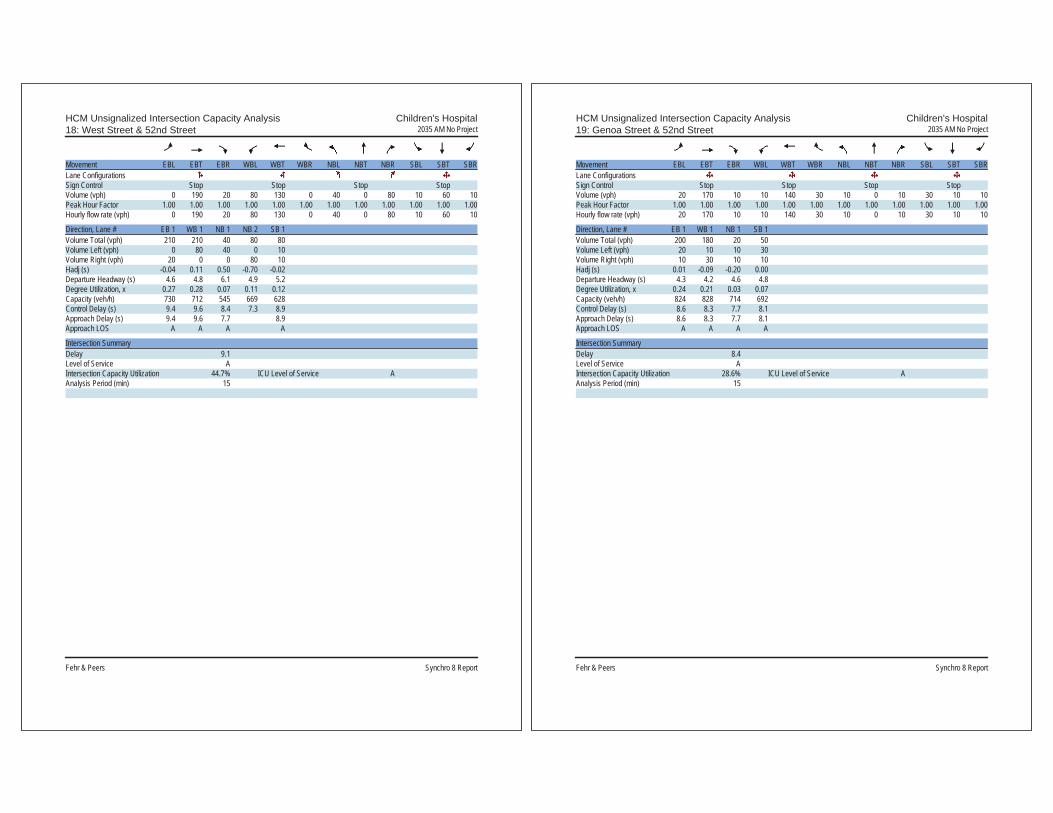
HCM Unsignalized Intersection Capacity Analysis Children's Hospital18: West Street & 52nd Street 2035 AM No Project
Fehr & Peers Synchro 8 Report
Movement EBL EBT EBR WBL WBT WBR NBL NBT NBR SBL SBT SBRLane ConfigurationsSign Control Stop Stop Stop StopVolume (vph) 0 190 20 80 130 0 40 0 80 10 60 10Peak Hour Factor 1.00 1.00 1.00 1.00 1.00 1.00 1.00 1.00 1.00 1.00 1.00 1.00Hourly flow rate (vph) 0 190 20 80 130 0 40 0 80 10 60 10
Direction, Lane # EB 1 WB 1 NB 1 NB 2 SB 1Volume Total (vph) 210 210 40 80 80Volume Left (vph) 0 80 40 0 10Volume Right (vph) 20 0 0 80 10Hadj (s) -0.04 0.11 0.50 -0.70 -0.02Departure Headway (s) 4.6 4.8 6.1 4.9 5.2Degree Utilization, x 0.27 0.28 0.07 0.11 0.12Capacity (veh/h) 730 712 545 669 628Control Delay (s) 9.4 9.6 8.4 7.3 8.9Approach Delay (s) 9.4 9.6 7.7 8.9Approach LOS A A A A
Intersection SummaryDelay 9.1Level of Service AIntersection Capacity Utilization 44.7% ICU Level of Service AAnalysis Period (min) 15
HCM Unsignalized Intersection Capacity Analysis Children's Hospital19: Genoa Street & 52nd Street 2035 AM No Project
Fehr & Peers Synchro 8 Report
Movement EBL EBT EBR WBL WBT WBR NBL NBT NBR SBL SBT SBRLane ConfigurationsSign Control Stop Stop Stop StopVolume (vph) 20 170 10 10 140 30 10 0 10 30 10 10Peak Hour Factor 1.00 1.00 1.00 1.00 1.00 1.00 1.00 1.00 1.00 1.00 1.00 1.00Hourly flow rate (vph) 20 170 10 10 140 30 10 0 10 30 10 10
Direction, Lane # EB 1 WB 1 NB 1 SB 1Volume Total (vph) 200 180 20 50Volume Left (vph) 20 10 10 30Volume Right (vph) 10 30 10 10Hadj (s) 0.01 -0.09 -0.20 0.00Departure Headway (s) 4.3 4.2 4.6 4.8Degree Utilization, x 0.24 0.21 0.03 0.07Capacity (veh/h) 824 828 714 692Control Delay (s) 8.6 8.3 7.7 8.1Approach Delay (s) 8.6 8.3 7.7 8.1Approach LOS A A A A
Intersection SummaryDelay 8.4Level of Service AIntersection Capacity Utilization 28.6% ICU Level of Service AAnalysis Period (min) 15

HCM Unsignalized Intersection Capacity Analysis Children's Hospital20: Genoa Street & 55th Street 2035 AM No Project
Fehr & Peers Synchro 8 Report
Movement EBL EBT EBR WBL WBT WBR NBL NBT NBR SBL SBT SBRLane ConfigurationsVolume (veh/h) 10 400 10 10 440 20 10 20 20 40 20 10Sign Control Free Free Stop StopGrade 0% 0% 0% 0%Peak Hour Factor 1.00 1.00 1.00 1.00 1.00 1.00 1.00 1.00 1.00 1.00 1.00 1.00Hourly flow rate (vph) 10 400 10 10 440 20 10 20 20 40 20 10Pedestrians 12 3 15 17Lane Width (ft) 12.0 12.0 12.0 12.0Walking Speed (ft/s) 4.0 4.0 4.0 4.0Percent Blockage 1 0 1 1Right turn flare (veh)Median type None NoneMedian storage veh)Upstream signal (ft) 721pX, platoon unblockedvC, conflicting volume 477 425 942 937 423 945 932 479vC1, stage 1 conf volvC2, stage 2 conf volvCu, unblocked vol 477 425 942 937 423 945 932 479tC, single (s) 4.1 4.1 7.1 6.5 6.2 7.1 6.5 6.2tC, 2 stage (s)tF (s) 2.2 2.2 3.5 4.0 3.3 3.5 4.0 3.3p0 queue free % 99 99 95 92 97 81 92 98cM capacity (veh/h) 1075 1131 214 255 626 209 255 573
Direction, Lane # EB 1 WB 1 NB 1 SB 1Volume Total 420 470 50 70Volume Left 10 10 10 40Volume Right 10 20 20 10cSH 1075 1131 318 244Volume to Capacity 0.01 0.01 0.16 0.29Queue Length 95th (ft) 1 1 14 29Control Delay (s) 0.3 0.3 18.4 25.6Lane LOS A A C DApproach Delay (s) 0.3 0.3 18.4 25.6Approach LOS C D
Intersection SummaryAverage Delay 2.9Intersection Capacity Utilization 46.5% ICU Level of Service AAnalysis Period (min) 15
HCM Signalized Intersection Capacity Analysis Children's Hospital 1: MLK Way & 55th Street 2035 PM No Project
Fehr & Peers Synchro 8 Report
Movement EBL EBT EBR WBL WBT WBR NBU NBL NBT NBR SBL SBTLane ConfigurationsVolume (vph) 20 270 180 60 240 110 20 210 1770 110 200 1470Ideal Flow (vphpl) 1900 1900 1900 1900 1900 1900 1900 1900 1900 1900 1900 1900Total Lost time (s) 5.0 5.0 4.5 5.0 4.5 5.0Lane Util. Factor 1.00 1.00 1.00 0.91 1.00 0.91Frpb, ped/bikes 0.98 0.99 1.00 0.99 1.00 1.00Flpb, ped/bikes 1.00 1.00 1.00 1.00 1.00 1.00Frt 0.95 0.96 1.00 0.99 1.00 1.00Flt Protected 1.00 0.99 0.95 1.00 0.95 1.00Satd. Flow (prot) 1747 1728 1770 5010 1770 5054Flt Permitted 0.97 0.75 0.95 1.00 0.95 1.00Satd. Flow (perm) 1707 1310 1770 5010 1770 5054Peak-hour factor, PHF 1.00 1.00 1.00 1.00 1.00 1.00 1.00 1.00 1.00 1.00 1.00 1.00Adj. Flow (vph) 20 270 180 60 240 110 20 210 1770 110 200 1470RTOR Reduction (vph) 0 23 0 0 14 0 0 0 6 0 0 3Lane Group Flow (vph) 0 447 0 0 396 0 0 230 1874 0 200 1507Confl. Peds. (#/hr) 17 23 23 17 30Confl. Bikes (#/hr) 24 18 23Heavy Vehicles (%) 1% 1% 1% 4% 4% 4% 2% 2% 2% 2% 2% 2%Turn Type Perm NA Perm NA Prot Prot NA Prot NAProtected Phases 4 8 5 5 2 1 6Permitted Phases 4 8Actuated Green, G (s) 31.7 31.7 21.5 42.3 11.5 32.3Effective Green, g (s) 31.7 31.7 21.5 42.3 11.5 32.3Actuated g/C Ratio 0.32 0.32 0.22 0.42 0.12 0.32Clearance Time (s) 5.0 5.0 4.5 5.0 4.5 5.0Vehicle Extension (s) 3.0 3.0 3.0 3.0 3.0 3.0Lane Grp Cap (vph) 541 415 380 2119 203 1632v/s Ratio Prot 0.13 c0.37 0.11 c0.30v/s Ratio Perm 0.26 c0.30v/c Ratio 0.83 0.96 0.61 0.88 0.99 0.92Uniform Delay, d1 31.6 33.5 35.4 26.6 44.2 32.7Progression Factor 1.00 1.00 0.51 0.37 1.00 1.00Incremental Delay, d2 10.0 32.5 2.2 4.8 58.5 10.3Delay (s) 41.6 66.0 20.2 14.6 102.6 42.9Level of Service D E C B F DApproach Delay (s) 41.6 66.0 15.2 49.9Approach LOS D E B D
Intersection SummaryHCM 2000 Control Delay 34.9 HCM 2000 Level of Service CHCM 2000 Volume to Capacity ratio 0.95Actuated Cycle Length (s) 100.0 Sum of lost time (s) 14.5Intersection Capacity Utilization 104.8% ICU Level of Service GAnalysis Period (min) 15c Critical Lane Group

HCM Signalized Intersection Capacity Analysis Children's Hospital 1: MLK Way & 55th Street 2035 PM No Project
Fehr & Peers Synchro 8 Report
Movement SBRLane ConfigurationsVolume (vph) 40Ideal Flow (vphpl) 1900Total Lost time (s)Lane Util. FactorFrpb, ped/bikesFlpb, ped/bikesFrtFlt ProtectedSatd. Flow (prot)Flt PermittedSatd. Flow (perm)Peak-hour factor, PHF 1.00Adj. Flow (vph) 40RTOR Reduction (vph) 0Lane Group Flow (vph) 0Confl. Peds. (#/hr) 18Confl. Bikes (#/hr) 23Heavy Vehicles (%) 2%Turn TypeProtected PhasesPermitted PhasesActuated Green, G (s)Effective Green, g (s)Actuated g/C RatioClearance Time (s)Vehicle Extension (s)Lane Grp Cap (vph)v/s Ratio Protv/s Ratio Permv/c RatioUniform Delay, d1Progression FactorIncremental Delay, d2Delay (s)Level of ServiceApproach Delay (s)Approach LOS
Intersection Summary
HCM Unsignalized Intersection Capacity Analysis Children's Hospital 2: Dover Street & 55th Street 2035 PM No Project
Fehr & Peers Synchro 8 Report
Movement EBL EBT EBR WBL WBT WBR NBL NBT NBR SBL SBT SBRLane ConfigurationsVolume (veh/h) 30 530 20 10 330 20 20 20 30 20 20 40Sign Control Free Free Stop StopGrade 0% 0% 0% 0%Peak Hour Factor 1.00 1.00 1.00 1.00 1.00 1.00 1.00 1.00 1.00 1.00 1.00 1.00Hourly flow rate (vph) 30 530 20 10 330 20 20 20 30 20 20 40Pedestrians 6 20 11 26Lane Width (ft) 12.0 12.0 12.0 12.0Walking Speed (ft/s) 4.0 4.0 4.0 4.0Percent Blockage 1 2 1 2Right turn flare (veh)Median type None NoneMedian storage veh)Upstream signal (ft) 641 677pX, platoon unblocked 0.96 0.96 0.96 0.96 0.96 0.96vC, conflicting volume 376 561 1027 1007 571 1046 1007 372vC1, stage 1 conf volvC2, stage 2 conf volvCu, unblocked vol 328 561 1007 986 571 1027 986 324tC, single (s) 4.1 4.1 7.1 6.5 6.2 7.1 6.5 6.2tC, 2 stage (s)tF (s) 2.2 2.2 3.5 4.0 3.3 3.5 4.0 3.3p0 queue free % 97 99 89 91 94 88 91 94cM capacity (veh/h) 1140 991 174 224 511 163 221 667
Direction, Lane # EB 1 WB 1 NB 1 SB 1Volume Total 580 360 70 80Volume Left 30 10 20 20Volume Right 20 20 30 40cSH 1140 991 266 293Volume to Capacity 0.03 0.01 0.26 0.27Queue Length 95th (ft) 2 1 26 27Control Delay (s) 0.7 0.3 23.3 21.8Lane LOS A A C CApproach Delay (s) 0.7 0.3 23.3 21.8Approach LOS C C
Intersection SummaryAverage Delay 3.6Intersection Capacity Utilization 59.4% ICU Level of Service BAnalysis Period (min) 15

HCM Signalized Intersection Capacity Analysis Children's Hospital 3: 55th Street & Shattuck Ave 2035 PM No Project
Fehr & Peers Synchro 8 Report
Movement EBL EBT EBR WBL WBT WBR NBL NBT NBR SBL SBT SBRLane ConfigurationsVolume (vph) 110 390 70 30 210 50 80 630 50 30 580 60Ideal Flow (vphpl) 1900 1900 1900 1900 1900 1900 1900 1900 1900 1900 1900 1900Total Lost time (s) 3.0 3.0 5.0 5.0Lane Util. Factor 1.00 1.00 1.00 1.00Frpb, ped/bikes 0.99 0.99 1.00 0.99Flpb, ped/bikes 1.00 1.00 1.00 1.00Frt 0.98 0.98 0.99 0.99Flt Protected 0.99 0.99 0.99 1.00Satd. Flow (prot) 1744 1773 1827 1843Flt Permitted 0.85 0.92 0.88 0.95Satd. Flow (perm) 1495 1641 1613 1757Peak-hour factor, PHF 1.00 1.00 1.00 1.00 1.00 1.00 1.00 1.00 1.00 1.00 1.00 1.00Adj. Flow (vph) 110 390 70 30 210 50 80 630 50 30 580 60RTOR Reduction (vph) 0 6 0 0 10 0 0 3 0 0 5 0Lane Group Flow (vph) 0 564 0 0 280 0 0 757 0 0 665 0Confl. Peds. (#/hr) 17 17 17 17 29 11 11 29Confl. Bikes (#/hr) 23 15 47 33Heavy Vehicles (%) 5% 5% 5% 3% 3% 3% 2% 2% 2% 1% 1% 1%Turn Type Perm NA Perm NA Perm NA Perm NAProtected Phases 2 6 4 8Permitted Phases 2 6 4 4 8Actuated Green, G (s) 29.0 29.0 43.0 43.0Effective Green, g (s) 29.0 29.0 43.0 43.0Actuated g/C Ratio 0.36 0.36 0.54 0.54Clearance Time (s) 3.0 3.0 5.0 5.0Lane Grp Cap (vph) 541 594 866 944v/s Ratio Protv/s Ratio Perm c0.38 0.17 c0.47 0.38v/c Ratio 1.04 0.47 0.87 0.70Uniform Delay, d1 25.5 19.6 16.1 13.8Progression Factor 1.00 1.00 1.00 1.00Incremental Delay, d2 50.0 2.7 11.9 4.4Delay (s) 75.5 22.3 28.0 18.2Level of Service E C C BApproach Delay (s) 75.5 22.3 28.0 18.2Approach LOS E C C B
Intersection SummaryHCM 2000 Control Delay 36.2 HCM 2000 Level of Service DHCM 2000 Volume to Capacity ratio 0.94Actuated Cycle Length (s) 80.0 Sum of lost time (s) 8.0Intersection Capacity Utilization 126.2% ICU Level of Service HAnalysis Period (min) 15c Critical Lane Group
HCM Signalized Intersection Capacity Analysis Children's Hospital 4: 55th Street & Telegraph Ave 2035 PM No Project
Fehr & Peers Synchro 8 Report
Movement EBL EBT EBR WBL WBT WBR NBL NBT NBR SBL SBT SBRLane ConfigurationsVolume (vph) 260 30 170 50 20 20 130 1240 70 20 1130 120Ideal Flow (vphpl) 1900 1900 1900 1900 1900 1900 1900 1900 1900 1900 1900 1900Total Lost time (s) 4.5 4.5 4.5 4.5 4.5 4.5Lane Util. Factor 1.00 1.00 1.00 0.95 1.00 0.95Frpb, ped/bikes 0.98 0.99 1.00 0.99 1.00 0.99Flpb, ped/bikes 0.99 0.99 1.00 1.00 1.00 1.00Frt 0.95 0.97 1.00 0.99 1.00 0.99Flt Protected 0.97 0.97 0.95 1.00 0.95 1.00Satd. Flow (prot) 1617 1694 1770 3490 1787 3470Flt Permitted 0.79 0.72 0.13 1.00 0.12 1.00Satd. Flow (perm) 1315 1255 248 3490 220 3470Peak-hour factor, PHF 1.00 1.00 1.00 1.00 1.00 1.00 1.00 1.00 1.00 1.00 1.00 1.00Adj. Flow (vph) 260 30 170 50 20 20 130 1240 70 20 1130 120RTOR Reduction (vph) 0 25 0 0 12 0 0 4 0 0 8 0Lane Group Flow (vph) 0 435 0 0 78 0 130 1306 0 20 1242 0Confl. Peds. (#/hr) 17 39 39 17 38 26 26 38Confl. Bikes (#/hr) 12 14 44 68Heavy Vehicles (%) 5% 5% 5% 4% 4% 4% 2% 2% 2% 1% 1% 1%Turn Type Perm NA Perm NA Perm NA Perm NAProtected Phases 4 8 2 6Permitted Phases 4 8 2 6Actuated Green, G (s) 32.7 32.7 48.3 48.3 48.3 48.3Effective Green, g (s) 32.7 32.7 48.3 48.3 48.3 48.3Actuated g/C Ratio 0.36 0.36 0.54 0.54 0.54 0.54Clearance Time (s) 4.5 4.5 4.5 4.5 4.5 4.5Vehicle Extension (s) 3.0 3.0 3.0 3.0 3.0 3.0Lane Grp Cap (vph) 477 455 133 1872 118 1862v/s Ratio Prot 0.37 0.36v/s Ratio Perm c0.33 0.06 c0.52 0.09v/c Ratio 0.91 0.17 0.98 0.70 0.17 0.67Uniform Delay, d1 27.3 19.5 20.3 15.4 10.6 15.0Progression Factor 1.00 1.00 1.00 1.00 1.00 1.00Incremental Delay, d2 21.7 0.2 72.2 2.2 3.1 1.9Delay (s) 49.0 19.6 92.6 17.6 13.7 17.0Level of Service D B F B B BApproach Delay (s) 49.0 19.6 24.4 16.9Approach LOS D B C B
Intersection SummaryHCM 2000 Control Delay 24.8 HCM 2000 Level of Service CHCM 2000 Volume to Capacity ratio 0.95Actuated Cycle Length (s) 90.0 Sum of lost time (s) 9.0Intersection Capacity Utilization 87.5% ICU Level of Service EAnalysis Period (min) 15c Critical Lane Group
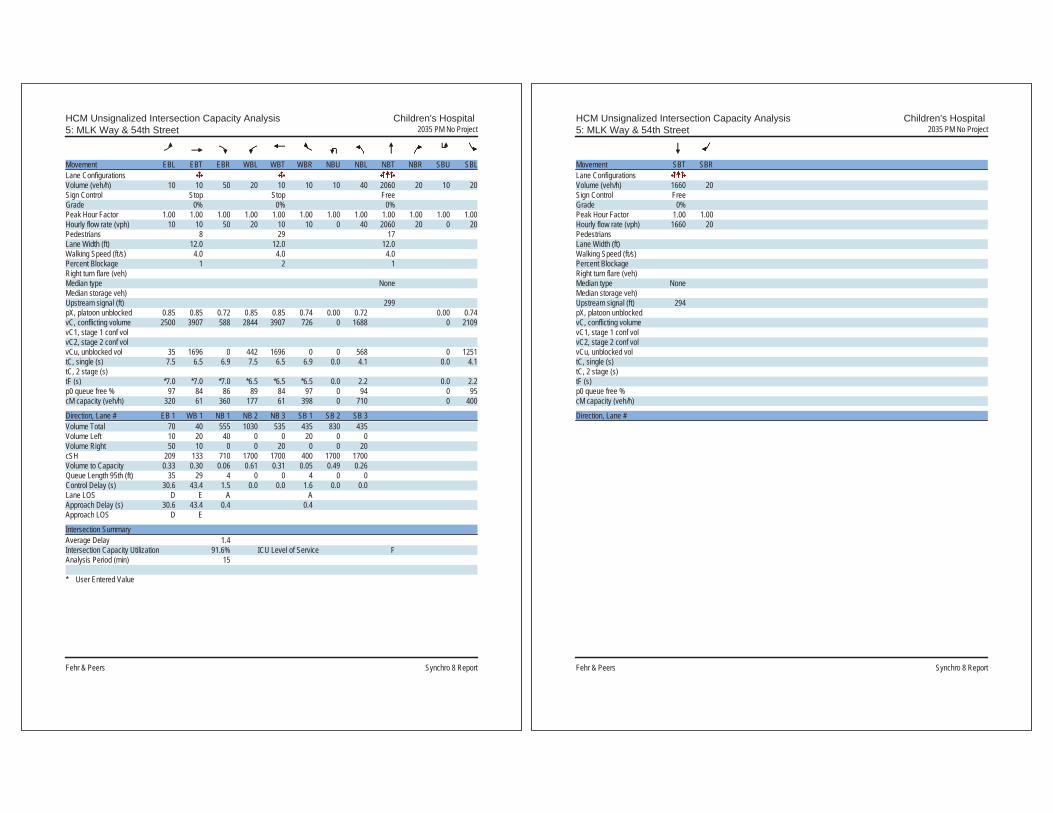
HCM Unsignalized Intersection Capacity Analysis Children's Hospital 5: MLK Way & 54th Street 2035 PM No Project
Fehr & Peers Synchro 8 Report
Movement EBL EBT EBR WBL WBT WBR NBU NBL NBT NBR SBU SBLLane ConfigurationsVolume (veh/h) 10 10 50 20 10 10 10 40 2060 20 10 20Sign Control Stop Stop FreeGrade 0% 0% 0%Peak Hour Factor 1.00 1.00 1.00 1.00 1.00 1.00 1.00 1.00 1.00 1.00 1.00 1.00Hourly flow rate (vph) 10 10 50 20 10 10 0 40 2060 20 0 20Pedestrians 8 29 17Lane Width (ft) 12.0 12.0 12.0Walking Speed (ft/s) 4.0 4.0 4.0Percent Blockage 1 2 1Right turn flare (veh)Median type NoneMedian storage veh)Upstream signal (ft) 299pX, platoon unblocked 0.85 0.85 0.72 0.85 0.85 0.74 0.00 0.72 0.00 0.74vC, conflicting volume 2500 3907 588 2844 3907 726 0 1688 0 2109vC1, stage 1 conf volvC2, stage 2 conf volvCu, unblocked vol 35 1696 0 442 1696 0 0 568 0 1251tC, single (s) 7.5 6.5 6.9 7.5 6.5 6.9 0.0 4.1 0.0 4.1tC, 2 stage (s)tF (s) *7.0 *7.0 *7.0 *6.5 *6.5 *6.5 0.0 2.2 0.0 2.2p0 queue free % 97 84 86 89 84 97 0 94 0 95cM capacity (veh/h) 320 61 360 177 61 398 0 710 0 400
Direction, Lane # EB 1 WB 1 NB 1 NB 2 NB 3 SB 1 SB 2 SB 3Volume Total 70 40 555 1030 535 435 830 435Volume Left 10 20 40 0 0 20 0 0Volume Right 50 10 0 0 20 0 0 20cSH 209 133 710 1700 1700 400 1700 1700Volume to Capacity 0.33 0.30 0.06 0.61 0.31 0.05 0.49 0.26Queue Length 95th (ft) 35 29 4 0 0 4 0 0Control Delay (s) 30.6 43.4 1.5 0.0 0.0 1.6 0.0 0.0Lane LOS D E A AApproach Delay (s) 30.6 43.4 0.4 0.4Approach LOS D E
Intersection SummaryAverage Delay 1.4Intersection Capacity Utilization 91.6% ICU Level of Service FAnalysis Period (min) 15
* User Entered Value
HCM Unsignalized Intersection Capacity Analysis Children's Hospital 5: MLK Way & 54th Street 2035 PM No Project
Fehr & Peers Synchro 8 Report
Movement SBT SBRLane ConfigurationsVolume (veh/h) 1660 20Sign Control FreeGrade 0%Peak Hour Factor 1.00 1.00Hourly flow rate (vph) 1660 20PedestriansLane Width (ft)Walking Speed (ft/s)Percent BlockageRight turn flare (veh)Median type NoneMedian storage veh)Upstream signal (ft) 294pX, platoon unblockedvC, conflicting volumevC1, stage 1 conf volvC2, stage 2 conf volvCu, unblocked voltC, single (s)tC, 2 stage (s)tF (s)p0 queue free %cM capacity (veh/h)
Direction, Lane #

HCM Unsignalized Intersection Capacity Analysis Children's Hospital 6: Dover Street & 54th Street 2035 PM No Project
Fehr & Peers Synchro 8 Report
Movement EBL EBT EBR WBL WBT WBR NBL NBT NBR SBL SBT SBRLane ConfigurationsVolume (veh/h) 10 20 10 10 10 20 10 50 10 10 30 10Sign Control Stop Stop Free FreeGrade 0% 0% 0% 0%Peak Hour Factor 1.00 1.00 1.00 1.00 1.00 1.00 1.00 1.00 1.00 1.00 1.00 1.00Hourly flow rate (vph) 10 20 10 10 10 20 10 50 10 10 30 10Pedestrians 18 12 9 5Lane Width (ft) 12.0 12.0 12.0 12.0Walking Speed (ft/s) 4.0 4.0 4.0 4.0Percent Blockage 1 1 1 0Right turn flare (veh)Median type None NoneMedian storage veh)Upstream signal (ft)pX, platoon unblockedvC, conflicting volume 178 165 62 171 165 72 58 72vC1, stage 1 conf volvC2, stage 2 conf volvCu, unblocked vol 178 165 62 171 165 72 58 72tC, single (s) 7.1 6.5 6.2 7.1 6.5 6.2 4.1 4.1tC, 2 stage (s)tF (s) 3.5 4.0 3.3 3.5 4.0 3.3 2.2 2.2p0 queue free % 99 97 99 99 99 98 99 99cM capacity (veh/h) 728 704 986 737 704 982 1536 1526
Direction, Lane # EB 1 WB 1 NB 1 SB 1Volume Total 40 40 70 50Volume Left 10 10 10 10Volume Right 10 20 10 10cSH 765 831 1536 1526Volume to Capacity 0.05 0.05 0.01 0.01Queue Length 95th (ft) 4 4 0 0Control Delay (s) 10.0 9.6 1.1 1.5Lane LOS A A A AApproach Delay (s) 10.0 9.6 1.1 1.5Approach LOS A A
Intersection SummaryAverage Delay 4.7Intersection Capacity Utilization 21.1% ICU Level of Service AAnalysis Period (min) 15
HCM Unsignalized Intersection Capacity Analysis Children's Hospital 7: Shattuck Ave & 54th Street 2035 PM No Project
Fehr & Peers Synchro 8 Report
Movement EBL EBR NBL NBT SBT SBRLane ConfigurationsVolume (veh/h) 10 20 20 770 700 10Sign Control Stop Free FreeGrade 0% 0% 0%Peak Hour Factor 1.00 1.00 1.00 1.00 1.00 1.00Hourly flow rate (vph) 10 20 20 770 700 10Pedestrians 38 2Lane Width (ft) 12.0 12.0Walking Speed (ft/s) 4.0 4.0Percent Blockage 3 0Right turn flare (veh)Median type None NoneMedian storage veh)Upstream signal (ft) 550 282pX, platoon unblocked 0.81 0.74 0.74vC, conflicting volume 1555 743 748vC1, stage 1 conf volvC2, stage 2 conf volvCu, unblocked vol 1168 476 482tC, single (s) 6.4 6.2 4.1tC, 2 stage (s)tF (s) 3.5 3.3 2.2p0 queue free % 94 95 97cM capacity (veh/h) 165 425 773
Direction, Lane # EB 1 NB 1 SB 1Volume Total 30 790 710Volume Left 10 20 0Volume Right 20 0 10cSH 278 773 1700Volume to Capacity 0.11 0.03 0.42Queue Length 95th (ft) 9 2 0Control Delay (s) 19.5 0.7 0.0Lane LOS C AApproach Delay (s) 19.5 0.7 0.0Approach LOS C
Intersection SummaryAverage Delay 0.7Intersection Capacity Utilization 66.6% ICU Level of Service CAnalysis Period (min) 15

HCM Signalized Intersection Capacity Analysis Children's Hospital 8: MLK Way & 53rd Street 2035 PM No Project
Fehr & Peers Synchro 8 Report
Movement EBL EBT EBR WBL WBT WBR NBU NBL NBT NBR SBL SBTLane ConfigurationsVolume (vph) 10 10 60 40 10 10 10 10 2110 30 30 1720Ideal Flow (vphpl) 1900 1900 1900 1900 1900 1900 1900 1900 1900 1900 1900 1900Total Lost time (s) 5.0 5.0 4.0 3.5 4.0 3.5Lane Util. Factor 1.00 1.00 1.00 0.91 1.00 0.91Frpb, ped/bikes 0.98 1.00 1.00 1.00 1.00 1.00Flpb, ped/bikes 1.00 1.00 1.00 1.00 1.00 1.00Frt 0.90 0.98 1.00 1.00 1.00 1.00Flt Protected 0.99 0.97 0.95 1.00 0.95 1.00Satd. Flow (prot) 1632 1785 1770 5063 1787 5128Flt Permitted 0.97 0.82 0.95 1.00 0.95 1.00Satd. Flow (perm) 1585 1510 1770 5063 1787 5128Peak-hour factor, PHF 1.00 1.00 1.00 1.00 1.00 1.00 1.00 1.00 1.00 1.00 1.00 1.00Adj. Flow (vph) 10 10 60 40 10 10 10 10 2110 30 30 1720RTOR Reduction (vph) 0 50 0 0 8 0 0 0 1 0 0 0Lane Group Flow (vph) 0 30 0 0 52 0 0 20 2139 0 30 1730Confl. Peds. (#/hr) 12 6 6 12 48Confl. Bikes (#/hr) 6 3 20Heavy Vehicles (%) 2% 2% 2% 0% 0% 0% 2% 2% 2% 2% 1% 1%Turn Type Perm NA Perm NA Prot Prot NA Prot NAProtected Phases 4 8 5 5 2 1 6Permitted Phases 4 8Actuated Green, G (s) 16.4 16.4 3.1 64.7 6.4 68.0Effective Green, g (s) 16.4 16.4 3.1 64.7 6.4 68.0Actuated g/C Ratio 0.16 0.16 0.03 0.65 0.06 0.68Clearance Time (s) 5.0 5.0 4.0 3.5 4.0 3.5Vehicle Extension (s) 3.0 3.0 3.0 3.0 3.0 3.0Lane Grp Cap (vph) 259 247 54 3275 114 3487v/s Ratio Prot 0.01 c0.42 0.02 c0.34v/s Ratio Perm 0.02 c0.03v/c Ratio 0.12 0.21 0.37 0.65 0.26 0.50Uniform Delay, d1 35.6 36.2 47.5 10.8 44.6 7.7Progression Factor 1.00 1.05 1.45 0.14 0.76 0.50Incremental Delay, d2 0.2 0.4 2.3 0.6 0.6 0.3Delay (s) 35.8 38.2 71.2 2.0 34.3 4.1Level of Service D D E A C AApproach Delay (s) 35.8 38.2 2.7 4.6Approach LOS D D A A
Intersection SummaryHCM 2000 Control Delay 4.7 HCM 2000 Level of Service AHCM 2000 Volume to Capacity ratio 0.58Actuated Cycle Length (s) 100.0 Sum of lost time (s) 12.5Intersection Capacity Utilization 66.8% ICU Level of Service CAnalysis Period (min) 15c Critical Lane Group
HCM Signalized Intersection Capacity Analysis Children's Hospital 8: MLK Way & 53rd Street 2035 PM No Project
Fehr & Peers Synchro 8 Report
Movement SBRLane ConfigurationsVolume (vph) 10Ideal Flow (vphpl) 1900Total Lost time (s)Lane Util. FactorFrpb, ped/bikesFlpb, ped/bikesFrtFlt ProtectedSatd. Flow (prot)Flt PermittedSatd. Flow (perm)Peak-hour factor, PHF 1.00Adj. Flow (vph) 10RTOR Reduction (vph) 0Lane Group Flow (vph) 0Confl. Peds. (#/hr) 21Confl. Bikes (#/hr) 24Heavy Vehicles (%) 1%Turn TypeProtected PhasesPermitted PhasesActuated Green, G (s)Effective Green, g (s)Actuated g/C RatioClearance Time (s)Vehicle Extension (s)Lane Grp Cap (vph)v/s Ratio Protv/s Ratio Permv/c RatioUniform Delay, d1Progression FactorIncremental Delay, d2Delay (s)Level of ServiceApproach Delay (s)Approach LOS
Intersection Summary
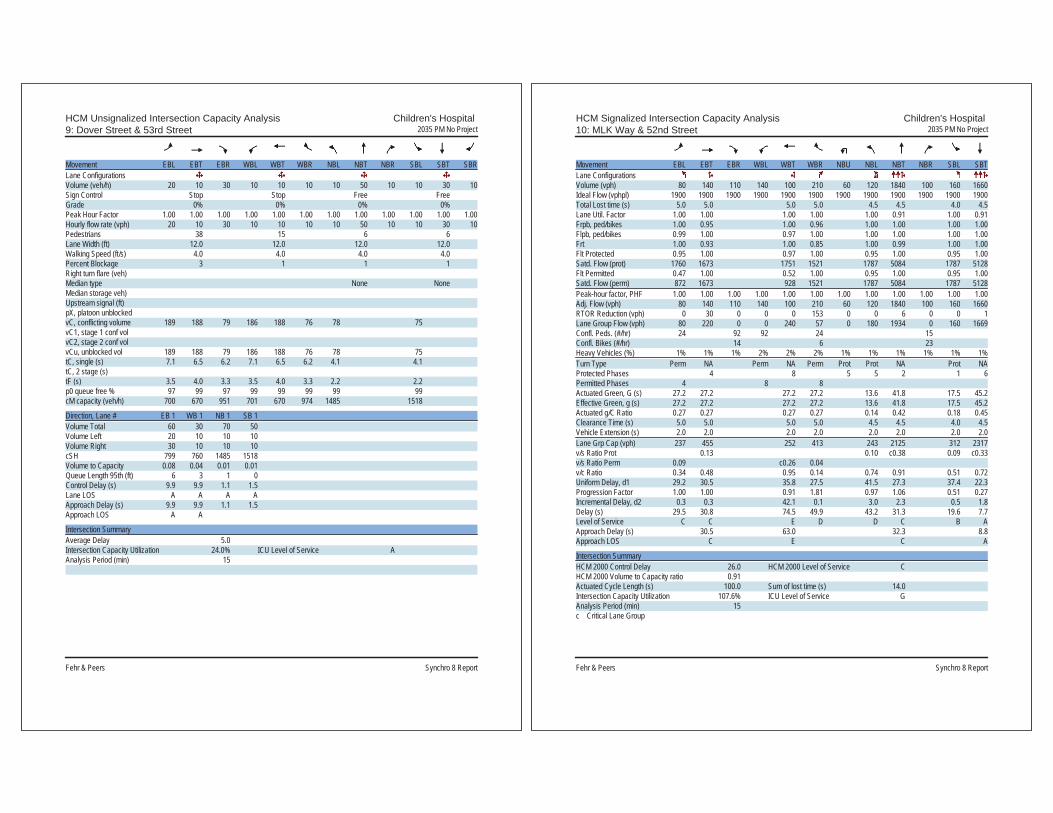
HCM Unsignalized Intersection Capacity Analysis Children's Hospital 9: Dover Street & 53rd Street 2035 PM No Project
Fehr & Peers Synchro 8 Report
Movement EBL EBT EBR WBL WBT WBR NBL NBT NBR SBL SBT SBRLane ConfigurationsVolume (veh/h) 20 10 30 10 10 10 10 50 10 10 30 10Sign Control Stop Stop Free FreeGrade 0% 0% 0% 0%Peak Hour Factor 1.00 1.00 1.00 1.00 1.00 1.00 1.00 1.00 1.00 1.00 1.00 1.00Hourly flow rate (vph) 20 10 30 10 10 10 10 50 10 10 30 10Pedestrians 38 15 6 6Lane Width (ft) 12.0 12.0 12.0 12.0Walking Speed (ft/s) 4.0 4.0 4.0 4.0Percent Blockage 3 1 1 1Right turn flare (veh)Median type None NoneMedian storage veh)Upstream signal (ft)pX, platoon unblockedvC, conflicting volume 189 188 79 186 188 76 78 75vC1, stage 1 conf volvC2, stage 2 conf volvCu, unblocked vol 189 188 79 186 188 76 78 75tC, single (s) 7.1 6.5 6.2 7.1 6.5 6.2 4.1 4.1tC, 2 stage (s)tF (s) 3.5 4.0 3.3 3.5 4.0 3.3 2.2 2.2p0 queue free % 97 99 97 99 99 99 99 99cM capacity (veh/h) 700 670 951 701 670 974 1485 1518
Direction, Lane # EB 1 WB 1 NB 1 SB 1Volume Total 60 30 70 50Volume Left 20 10 10 10Volume Right 30 10 10 10cSH 799 760 1485 1518Volume to Capacity 0.08 0.04 0.01 0.01Queue Length 95th (ft) 6 3 1 0Control Delay (s) 9.9 9.9 1.1 1.5Lane LOS A A A AApproach Delay (s) 9.9 9.9 1.1 1.5Approach LOS A A
Intersection SummaryAverage Delay 5.0Intersection Capacity Utilization 24.0% ICU Level of Service AAnalysis Period (min) 15
HCM Signalized Intersection Capacity Analysis Children's Hospital 10: MLK Way & 52nd Street 2035 PM No Project
Fehr & Peers Synchro 8 Report
Movement EBL EBT EBR WBL WBT WBR NBU NBL NBT NBR SBL SBTLane ConfigurationsVolume (vph) 80 140 110 140 100 210 60 120 1840 100 160 1660Ideal Flow (vphpl) 1900 1900 1900 1900 1900 1900 1900 1900 1900 1900 1900 1900Total Lost time (s) 5.0 5.0 5.0 5.0 4.5 4.5 4.0 4.5Lane Util. Factor 1.00 1.00 1.00 1.00 1.00 0.91 1.00 0.91Frpb, ped/bikes 1.00 0.95 1.00 0.96 1.00 1.00 1.00 1.00Flpb, ped/bikes 0.99 1.00 0.97 1.00 1.00 1.00 1.00 1.00Frt 1.00 0.93 1.00 0.85 1.00 0.99 1.00 1.00Flt Protected 0.95 1.00 0.97 1.00 0.95 1.00 0.95 1.00Satd. Flow (prot) 1760 1673 1751 1521 1787 5084 1787 5128Flt Permitted 0.47 1.00 0.52 1.00 0.95 1.00 0.95 1.00Satd. Flow (perm) 872 1673 928 1521 1787 5084 1787 5128Peak-hour factor, PHF 1.00 1.00 1.00 1.00 1.00 1.00 1.00 1.00 1.00 1.00 1.00 1.00Adj. Flow (vph) 80 140 110 140 100 210 60 120 1840 100 160 1660RTOR Reduction (vph) 0 30 0 0 0 153 0 0 6 0 0 1Lane Group Flow (vph) 80 220 0 0 240 57 0 180 1934 0 160 1669Confl. Peds. (#/hr) 24 92 92 24 15Confl. Bikes (#/hr) 14 6 23Heavy Vehicles (%) 1% 1% 1% 2% 2% 2% 1% 1% 1% 1% 1% 1%Turn Type Perm NA Perm NA Perm Prot Prot NA Prot NAProtected Phases 4 8 5 5 2 1 6Permitted Phases 4 8 8Actuated Green, G (s) 27.2 27.2 27.2 27.2 13.6 41.8 17.5 45.2Effective Green, g (s) 27.2 27.2 27.2 27.2 13.6 41.8 17.5 45.2Actuated g/C Ratio 0.27 0.27 0.27 0.27 0.14 0.42 0.18 0.45Clearance Time (s) 5.0 5.0 5.0 5.0 4.5 4.5 4.0 4.5Vehicle Extension (s) 2.0 2.0 2.0 2.0 2.0 2.0 2.0 2.0Lane Grp Cap (vph) 237 455 252 413 243 2125 312 2317v/s Ratio Prot 0.13 0.10 c0.38 0.09 c0.33v/s Ratio Perm 0.09 c0.26 0.04v/c Ratio 0.34 0.48 0.95 0.14 0.74 0.91 0.51 0.72Uniform Delay, d1 29.2 30.5 35.8 27.5 41.5 27.3 37.4 22.3Progression Factor 1.00 1.00 0.91 1.81 0.97 1.06 0.51 0.27Incremental Delay, d2 0.3 0.3 42.1 0.1 3.0 2.3 0.5 1.8Delay (s) 29.5 30.8 74.5 49.9 43.2 31.3 19.6 7.7Level of Service C C E D D C B AApproach Delay (s) 30.5 63.0 32.3 8.8Approach LOS C E C A
Intersection SummaryHCM 2000 Control Delay 26.0 HCM 2000 Level of Service CHCM 2000 Volume to Capacity ratio 0.91Actuated Cycle Length (s) 100.0 Sum of lost time (s) 14.0Intersection Capacity Utilization 107.6% ICU Level of Service GAnalysis Period (min) 15c Critical Lane Group

HCM Signalized Intersection Capacity Analysis Children's Hospital 10: MLK Way & 52nd Street 2035 PM No Project
Fehr & Peers Synchro 8 Report
Movement SBRLane ConfigurationsVolume (vph) 10Ideal Flow (vphpl) 1900Total Lost time (s)Lane Util. FactorFrpb, ped/bikesFlpb, ped/bikesFrtFlt ProtectedSatd. Flow (prot)Flt PermittedSatd. Flow (perm)Peak-hour factor, PHF 1.00Adj. Flow (vph) 10RTOR Reduction (vph) 0Lane Group Flow (vph) 0Confl. Peds. (#/hr) 20Confl. Bikes (#/hr) 26Heavy Vehicles (%) 1%Turn TypeProtected PhasesPermitted PhasesActuated Green, G (s)Effective Green, g (s)Actuated g/C RatioClearance Time (s)Vehicle Extension (s)Lane Grp Cap (vph)v/s Ratio Protv/s Ratio Permv/c RatioUniform Delay, d1Progression FactorIncremental Delay, d2Delay (s)Level of ServiceApproach Delay (s)Approach LOS
Intersection Summary
HCM Signalized Intersection Capacity Analysis Children's Hospital 11: 52nd Street & Garage 2035 PM No Project
Fehr & Peers Synchro 8 Report
Movement EBL EBT EBR WBL WBT WBR NBL NBT NBR SBL SBT SBRLane ConfigurationsVolume (vph) 17 370 5 11 340 17 25 3 13 63 4 73Ideal Flow (vphpl) 1900 1900 1900 1900 1900 1900 1900 1900 1900 1900 1900 1900Total Lost time (s) 3.0 3.0 3.0 3.0Lane Util. Factor 0.95 0.95 1.00 1.00Frpb, ped/bikes 1.00 1.00 0.93 0.99Flpb, ped/bikes 1.00 1.00 1.00 0.91Frt 1.00 0.99 0.96 0.93Flt Protected 1.00 1.00 0.97 0.98Satd. Flow (prot) 3516 3554 1419 1567Flt Permitted 0.94 0.94 0.87 0.89Satd. Flow (perm) 3327 3354 1273 1424Peak-hour factor, PHF 1.00 1.00 1.00 1.00 1.00 1.00 1.00 1.00 1.00 1.00 1.00 1.00Adj. Flow (vph) 17 370 5 11 340 17 25 3 13 63 4 73RTOR Reduction (vph) 0 2 0 0 7 0 0 7 0 0 39 0Lane Group Flow (vph) 0 390 0 0 361 0 0 34 0 0 101 0Confl. Peds. (#/hr) 89 89 38 312 312Confl. Bikes (#/hr) 15 9 2Heavy Vehicles (%) 2% 2% 2% 0% 0% 0% 16% 16% 16% 0% 0% 0%Turn Type Prot NA Perm NA Perm NA Perm NAProtected Phases 5 2 6 4 8Permitted Phases 6 4 8Actuated Green, G (s) 21.0 14.0 23.0 23.0Effective Green, g (s) 21.0 14.0 23.0 23.0Actuated g/C Ratio 0.42 0.28 0.46 0.46Clearance Time (s) 3.0 3.0 3.0 3.0Lane Grp Cap (vph) 1412 939 585 655v/s Ratio Prot c0.02v/s Ratio Perm 0.09 c0.11 0.03 c0.07v/c Ratio 0.28 0.38 0.06 0.15Uniform Delay, d1 9.5 14.5 7.5 7.8Progression Factor 1.60 1.00 1.00 1.00Incremental Delay, d2 0.4 1.2 0.2 0.5Delay (s) 15.6 15.7 7.7 8.3Level of Service B B A AApproach Delay (s) 15.6 15.7 7.7 8.3Approach LOS B B A A
Intersection SummaryHCM 2000 Control Delay 14.2 HCM 2000 Level of Service BHCM 2000 Volume to Capacity ratio 0.25Actuated Cycle Length (s) 50.0 Sum of lost time (s) 9.0Intersection Capacity Utilization 48.8% ICU Level of Service AAnalysis Period (min) 15c Critical Lane Group
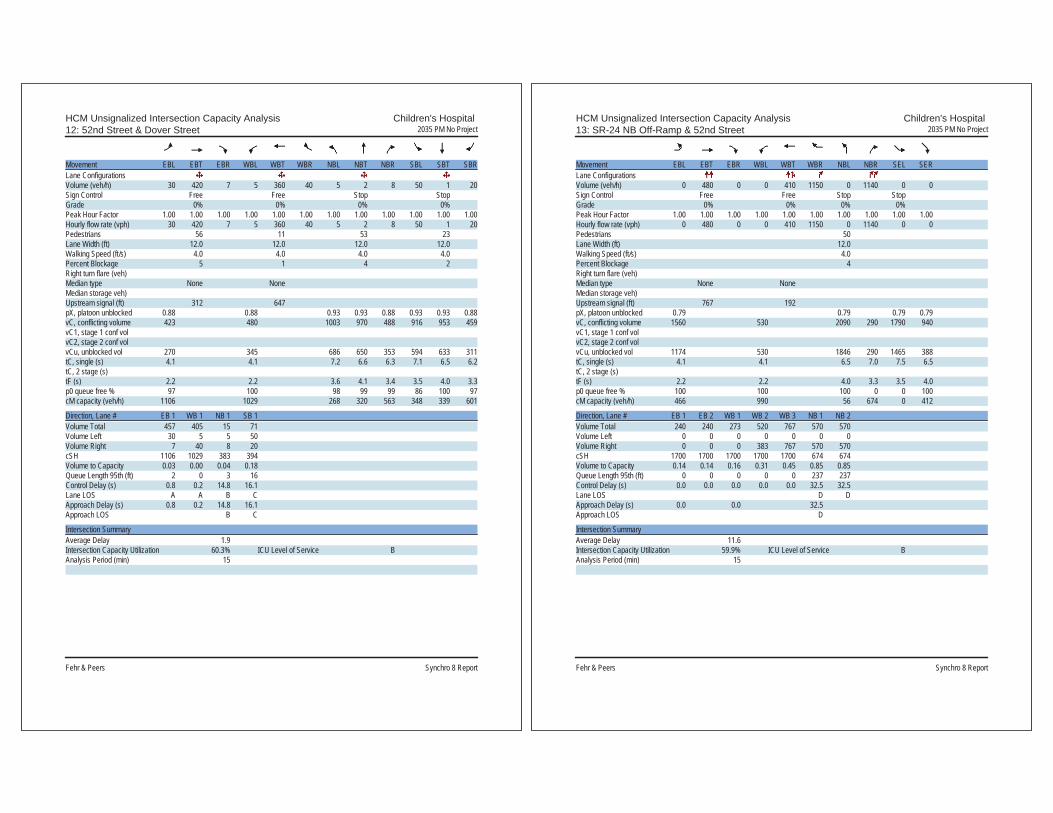
HCM Unsignalized Intersection Capacity Analysis Children's Hospital 12: 52nd Street & Dover Street 2035 PM No Project
Fehr & Peers Synchro 8 Report
Movement EBL EBT EBR WBL WBT WBR NBL NBT NBR SBL SBT SBRLane ConfigurationsVolume (veh/h) 30 420 7 5 360 40 5 2 8 50 1 20Sign Control Free Free Stop StopGrade 0% 0% 0% 0%Peak Hour Factor 1.00 1.00 1.00 1.00 1.00 1.00 1.00 1.00 1.00 1.00 1.00 1.00Hourly flow rate (vph) 30 420 7 5 360 40 5 2 8 50 1 20Pedestrians 56 11 53 23Lane Width (ft) 12.0 12.0 12.0 12.0Walking Speed (ft/s) 4.0 4.0 4.0 4.0Percent Blockage 5 1 4 2Right turn flare (veh)Median type None NoneMedian storage veh)Upstream signal (ft) 312 647pX, platoon unblocked 0.88 0.88 0.93 0.93 0.88 0.93 0.93 0.88vC, conflicting volume 423 480 1003 970 488 916 953 459vC1, stage 1 conf volvC2, stage 2 conf volvCu, unblocked vol 270 345 686 650 353 594 633 311tC, single (s) 4.1 4.1 7.2 6.6 6.3 7.1 6.5 6.2tC, 2 stage (s)tF (s) 2.2 2.2 3.6 4.1 3.4 3.5 4.0 3.3p0 queue free % 97 100 98 99 99 86 100 97cM capacity (veh/h) 1106 1029 268 320 563 348 339 601
Direction, Lane # EB 1 WB 1 NB 1 SB 1Volume Total 457 405 15 71Volume Left 30 5 5 50Volume Right 7 40 8 20cSH 1106 1029 383 394Volume to Capacity 0.03 0.00 0.04 0.18Queue Length 95th (ft) 2 0 3 16Control Delay (s) 0.8 0.2 14.8 16.1Lane LOS A A B CApproach Delay (s) 0.8 0.2 14.8 16.1Approach LOS B C
Intersection SummaryAverage Delay 1.9Intersection Capacity Utilization 60.3% ICU Level of Service BAnalysis Period (min) 15
HCM Unsignalized Intersection Capacity Analysis Children's Hospital 13: SR-24 NB Off-Ramp & 52nd Street 2035 PM No Project
Fehr & Peers Synchro 8 Report
Movement EBL EBT EBR WBL WBT WBR NBL NBR SEL SERLane ConfigurationsVolume (veh/h) 0 480 0 0 410 1150 0 1140 0 0Sign Control Free Free Stop StopGrade 0% 0% 0% 0%Peak Hour Factor 1.00 1.00 1.00 1.00 1.00 1.00 1.00 1.00 1.00 1.00Hourly flow rate (vph) 0 480 0 0 410 1150 0 1140 0 0Pedestrians 50Lane Width (ft) 12.0Walking Speed (ft/s) 4.0Percent Blockage 4Right turn flare (veh)Median type None NoneMedian storage veh)Upstream signal (ft) 767 192pX, platoon unblocked 0.79 0.79 0.79 0.79vC, conflicting volume 1560 530 2090 290 1790 940vC1, stage 1 conf volvC2, stage 2 conf volvCu, unblocked vol 1174 530 1846 290 1465 388tC, single (s) 4.1 4.1 6.5 7.0 7.5 6.5tC, 2 stage (s)tF (s) 2.2 2.2 4.0 3.3 3.5 4.0p0 queue free % 100 100 100 0 0 100cM capacity (veh/h) 466 990 56 674 0 412
Direction, Lane # EB 1 EB 2 WB 1 WB 2 WB 3 NB 1 NB 2Volume Total 240 240 273 520 767 570 570Volume Left 0 0 0 0 0 0 0Volume Right 0 0 0 383 767 570 570cSH 1700 1700 1700 1700 1700 674 674Volume to Capacity 0.14 0.14 0.16 0.31 0.45 0.85 0.85Queue Length 95th (ft) 0 0 0 0 0 237 237Control Delay (s) 0.0 0.0 0.0 0.0 0.0 32.5 32.5Lane LOS D DApproach Delay (s) 0.0 0.0 32.5Approach LOS D
Intersection SummaryAverage Delay 11.6Intersection Capacity Utilization 59.9% ICU Level of Service BAnalysis Period (min) 15

HCM Signalized Intersection Capacity Analysis Children's Hospital 14: 52nd Street & Shattuck Ave 2035 PM No Project
Fehr & Peers Synchro 8 Report
Movement EBU EBL EBT EBR WBL WBT WBR NBL NBT NBR SBL SBTLane ConfigurationsVolume (vph) 50 350 1020 200 90 960 180 170 290 100 170 170Ideal Flow (vphpl) 1900 1900 1900 1900 1900 1900 1900 1900 1900 1900 1900 1900Total Lost time (s) 4.0 4.5 4.0 4.5 4.0 5.5 5.5Lane Util. Factor 1.00 0.91 1.00 0.91 1.00 1.00 1.00Frpb, ped/bikes 1.00 0.98 1.00 0.99 1.00 0.98 1.00Flpb, ped/bikes 1.00 1.00 1.00 1.00 1.00 1.00 0.99Frt 1.00 0.98 1.00 0.98 1.00 0.96 1.00Flt Protected 0.95 1.00 0.95 1.00 0.95 1.00 0.98Satd. Flow (prot) 1787 4926 1805 4991 1752 1737 1714Flt Permitted 0.95 1.00 0.95 1.00 0.24 1.00 0.52Satd. Flow (perm) 1787 4926 1805 4991 436 1737 921Peak-hour factor, PHF 1.00 1.00 1.00 1.00 1.00 1.00 1.00 1.00 1.00 1.00 1.00 1.00Adj. Flow (vph) 50 350 1020 200 90 960 180 170 290 100 170 170RTOR Reduction (vph) 0 0 26 0 0 24 0 0 11 0 0 0Lane Group Flow (vph) 0 400 1194 0 90 1116 0 170 379 0 0 340Confl. Peds. (#/hr) 21 21 17 33 33Confl. Bikes (#/hr) 20 12 45Heavy Vehicles (%) 1% 1% 1% 1% 0% 0% 0% 3% 3% 3% 7% 7%Turn Type Prot Prot NA Prot NA pm+pt NA Perm NAProtected Phases 7 7 4 3 8 5 2 6Permitted Phases 2 6Actuated Green, G (s) 33.5 53.0 6.5 26.0 36.5 36.5 27.0Effective Green, g (s) 33.5 53.0 6.5 26.0 36.5 36.5 27.0Actuated g/C Ratio 0.30 0.48 0.06 0.24 0.33 0.33 0.25Clearance Time (s) 4.0 4.5 4.0 4.5 4.0 5.5 5.5Vehicle Extension (s) 3.0 3.0 3.0 3.0 3.0 3.0 3.0Lane Grp Cap (vph) 544 2373 106 1179 210 576 226v/s Ratio Prot c0.22 0.24 0.05 c0.22 c0.04 0.22v/s Ratio Perm 0.23 c0.37v/c Ratio 0.74 0.50 0.85 0.95 0.81 0.66 1.50Uniform Delay, d1 34.3 19.5 51.3 41.3 33.5 31.4 41.5Progression Factor 1.00 1.00 1.00 1.00 1.00 1.00 1.00Incremental Delay, d2 8.6 0.8 43.4 16.1 20.1 5.8 248.7Delay (s) 42.9 20.3 94.6 57.4 53.5 37.2 290.2Level of Service D C F E D D FApproach Delay (s) 25.8 60.2 42.1 155.8Approach LOS C E D F
Intersection SummaryHCM 2000 Control Delay 60.9 HCM 2000 Level of Service EHCM 2000 Volume to Capacity ratio 1.03Actuated Cycle Length (s) 110.0 Sum of lost time (s) 18.0Intersection Capacity Utilization 109.8% ICU Level of Service HAnalysis Period (min) 15c Critical Lane Group
HCM Signalized Intersection Capacity Analysis Children's Hospital 14: 52nd Street & Shattuck Ave 2035 PM No Project
Fehr & Peers Synchro 8 Report
Movement SBRLane ConfigurationsVolume (vph) 380Ideal Flow (vphpl) 1900Total Lost time (s) 5.5Lane Util. Factor 1.00Frpb, ped/bikes 0.92Flpb, ped/bikes 1.00Frt 0.85Flt Protected 1.00Satd. Flow (prot) 1389Flt Permitted 1.00Satd. Flow (perm) 1389Peak-hour factor, PHF 1.00Adj. Flow (vph) 380RTOR Reduction (vph) 287Lane Group Flow (vph) 93Confl. Peds. (#/hr) 27Confl. Bikes (#/hr) 41Heavy Vehicles (%) 7%Turn Type PermProtected PhasesPermitted Phases 6Actuated Green, G (s) 27.0Effective Green, g (s) 27.0Actuated g/C Ratio 0.25Clearance Time (s) 5.5Vehicle Extension (s) 3.0Lane Grp Cap (vph) 340v/s Ratio Protv/s Ratio Perm 0.07v/c Ratio 0.27Uniform Delay, d1 33.6Progression Factor 1.00Incremental Delay, d2 2.0Delay (s) 35.6Level of Service DApproach Delay (s)Approach LOS
Intersection Summary
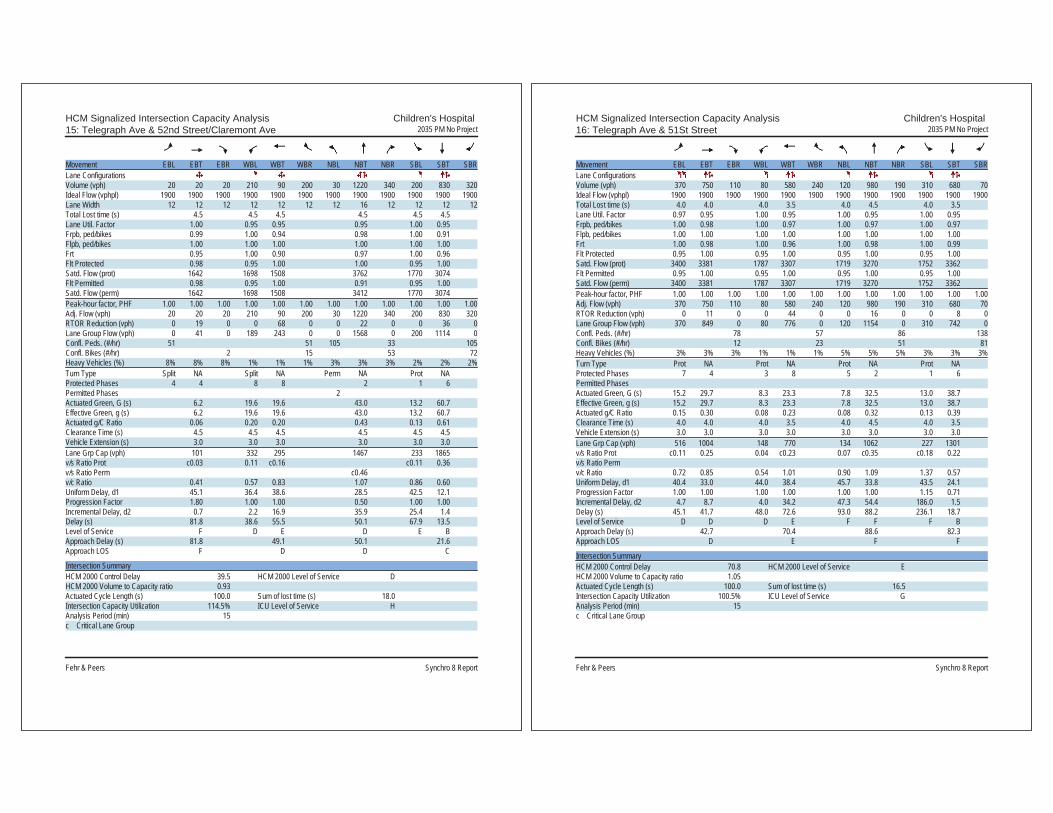
HCM Signalized Intersection Capacity Analysis Children's Hospital 15: Telegraph Ave & 52nd Street/Claremont Ave 2035 PM No Project
Fehr & Peers Synchro 8 Report
Movement EBL EBT EBR WBL WBT WBR NBL NBT NBR SBL SBT SBRLane ConfigurationsVolume (vph) 20 20 20 210 90 200 30 1220 340 200 830 320Ideal Flow (vphpl) 1900 1900 1900 1900 1900 1900 1900 1900 1900 1900 1900 1900Lane Width 12 12 12 12 12 12 12 16 12 12 12 12Total Lost time (s) 4.5 4.5 4.5 4.5 4.5 4.5Lane Util. Factor 1.00 0.95 0.95 0.95 1.00 0.95Frpb, ped/bikes 0.99 1.00 0.94 0.98 1.00 0.91Flpb, ped/bikes 1.00 1.00 1.00 1.00 1.00 1.00Frt 0.95 1.00 0.90 0.97 1.00 0.96Flt Protected 0.98 0.95 1.00 1.00 0.95 1.00Satd. Flow (prot) 1642 1698 1508 3762 1770 3074Flt Permitted 0.98 0.95 1.00 0.91 0.95 1.00Satd. Flow (perm) 1642 1698 1508 3412 1770 3074Peak-hour factor, PHF 1.00 1.00 1.00 1.00 1.00 1.00 1.00 1.00 1.00 1.00 1.00 1.00Adj. Flow (vph) 20 20 20 210 90 200 30 1220 340 200 830 320RTOR Reduction (vph) 0 19 0 0 68 0 0 22 0 0 36 0Lane Group Flow (vph) 0 41 0 189 243 0 0 1568 0 200 1114 0Confl. Peds. (#/hr) 51 51 105 33 105Confl. Bikes (#/hr) 2 15 53 72Heavy Vehicles (%) 8% 8% 8% 1% 1% 1% 3% 3% 3% 2% 2% 2%Turn Type Split NA Split NA Perm NA Prot NAProtected Phases 4 4 8 8 2 1 6Permitted Phases 2Actuated Green, G (s) 6.2 19.6 19.6 43.0 13.2 60.7Effective Green, g (s) 6.2 19.6 19.6 43.0 13.2 60.7Actuated g/C Ratio 0.06 0.20 0.20 0.43 0.13 0.61Clearance Time (s) 4.5 4.5 4.5 4.5 4.5 4.5Vehicle Extension (s) 3.0 3.0 3.0 3.0 3.0 3.0Lane Grp Cap (vph) 101 332 295 1467 233 1865v/s Ratio Prot c0.03 0.11 c0.16 c0.11 0.36v/s Ratio Perm c0.46v/c Ratio 0.41 0.57 0.83 1.07 0.86 0.60Uniform Delay, d1 45.1 36.4 38.6 28.5 42.5 12.1Progression Factor 1.80 1.00 1.00 0.50 1.00 1.00Incremental Delay, d2 0.7 2.2 16.9 35.9 25.4 1.4Delay (s) 81.8 38.6 55.5 50.1 67.9 13.5Level of Service F D E D E BApproach Delay (s) 81.8 49.1 50.1 21.6Approach LOS F D D C
Intersection SummaryHCM 2000 Control Delay 39.5 HCM 2000 Level of Service DHCM 2000 Volume to Capacity ratio 0.93Actuated Cycle Length (s) 100.0 Sum of lost time (s) 18.0Intersection Capacity Utilization 114.5% ICU Level of Service HAnalysis Period (min) 15c Critical Lane Group
HCM Signalized Intersection Capacity Analysis Children's Hospital 16: Telegraph Ave & 51St Street 2035 PM No Project
Fehr & Peers Synchro 8 Report
Movement EBL EBT EBR WBL WBT WBR NBL NBT NBR SBL SBT SBRLane ConfigurationsVolume (vph) 370 750 110 80 580 240 120 980 190 310 680 70Ideal Flow (vphpl) 1900 1900 1900 1900 1900 1900 1900 1900 1900 1900 1900 1900Total Lost time (s) 4.0 4.0 4.0 3.5 4.0 4.5 4.0 3.5Lane Util. Factor 0.97 0.95 1.00 0.95 1.00 0.95 1.00 0.95Frpb, ped/bikes 1.00 0.98 1.00 0.97 1.00 0.97 1.00 0.97Flpb, ped/bikes 1.00 1.00 1.00 1.00 1.00 1.00 1.00 1.00Frt 1.00 0.98 1.00 0.96 1.00 0.98 1.00 0.99Flt Protected 0.95 1.00 0.95 1.00 0.95 1.00 0.95 1.00Satd. Flow (prot) 3400 3381 1787 3307 1719 3270 1752 3362Flt Permitted 0.95 1.00 0.95 1.00 0.95 1.00 0.95 1.00Satd. Flow (perm) 3400 3381 1787 3307 1719 3270 1752 3362Peak-hour factor, PHF 1.00 1.00 1.00 1.00 1.00 1.00 1.00 1.00 1.00 1.00 1.00 1.00Adj. Flow (vph) 370 750 110 80 580 240 120 980 190 310 680 70RTOR Reduction (vph) 0 11 0 0 44 0 0 16 0 0 8 0Lane Group Flow (vph) 370 849 0 80 776 0 120 1154 0 310 742 0Confl. Peds. (#/hr) 78 57 86 138Confl. Bikes (#/hr) 12 23 51 81Heavy Vehicles (%) 3% 3% 3% 1% 1% 1% 5% 5% 5% 3% 3% 3%Turn Type Prot NA Prot NA Prot NA Prot NAProtected Phases 7 4 3 8 5 2 1 6Permitted PhasesActuated Green, G (s) 15.2 29.7 8.3 23.3 7.8 32.5 13.0 38.7Effective Green, g (s) 15.2 29.7 8.3 23.3 7.8 32.5 13.0 38.7Actuated g/C Ratio 0.15 0.30 0.08 0.23 0.08 0.32 0.13 0.39Clearance Time (s) 4.0 4.0 4.0 3.5 4.0 4.5 4.0 3.5Vehicle Extension (s) 3.0 3.0 3.0 3.0 3.0 3.0 3.0 3.0Lane Grp Cap (vph) 516 1004 148 770 134 1062 227 1301v/s Ratio Prot c0.11 0.25 0.04 c0.23 0.07 c0.35 c0.18 0.22v/s Ratio Permv/c Ratio 0.72 0.85 0.54 1.01 0.90 1.09 1.37 0.57Uniform Delay, d1 40.4 33.0 44.0 38.4 45.7 33.8 43.5 24.1Progression Factor 1.00 1.00 1.00 1.00 1.00 1.00 1.15 0.71Incremental Delay, d2 4.7 8.7 4.0 34.2 47.3 54.4 186.0 1.5Delay (s) 45.1 41.7 48.0 72.6 93.0 88.2 236.1 18.7Level of Service D D D E F F F BApproach Delay (s) 42.7 70.4 88.6 82.3Approach LOS D E F F
Intersection SummaryHCM 2000 Control Delay 70.8 HCM 2000 Level of Service EHCM 2000 Volume to Capacity ratio 1.05Actuated Cycle Length (s) 100.0 Sum of lost time (s) 16.5Intersection Capacity Utilization 100.5% ICU Level of Service GAnalysis Period (min) 15c Critical Lane Group

HCM Signalized Intersection Capacity Analysis Children's Hospital 17: SB SR-24 On-Ramp & MLK Way & NB SR-24 Off-Ramp 2035 PM No Project
Fehr & Peers Synchro 8 Report
Movement EBL EBT EBR WBL WBT WBR NBL NBT NBR SBL SBT SBRLane ConfigurationsVolume (vph) 340 0 0 0 0 1780 0 0 0 0 1750 250Ideal Flow (vphpl) 1900 1900 1900 1900 1900 1900 1900 1900 1900 1900 1900 1900Total Lost time (s) 4.0 4.0 4.0 4.0Lane Util. Factor 0.97 1.00 0.95 0.88Frpb, ped/bikes 1.00 1.00 1.00 1.00Flpb, ped/bikes 1.00 1.00 1.00 1.00Frt 1.00 0.86 1.00 0.85Flt Protected 0.95 1.00 1.00 1.00Satd. Flow (prot) 3273 1627 3574 2814Flt Permitted 0.95 1.00 1.00 1.00Satd. Flow (perm) 3273 1627 3574 2814Peak-hour factor, PHF 1.00 1.00 1.00 1.00 1.00 1.00 1.00 1.00 1.00 1.00 1.00 1.00Adj. Flow (vph) 340 0 0 0 0 1780 0 0 0 0 1750 250RTOR Reduction (vph) 0 0 0 0 0 0 0 0 0 0 0 0Lane Group Flow (vph) 340 0 0 0 0 1780 0 0 0 0 1750 250Confl. Peds. (#/hr) 3Confl. Bikes (#/hr) 14Heavy Vehicles (%) 7% 7% 2% 2% 1% 1% 2% 2% 2% 2% 1% 1%Turn Type Prot Free NA customProtected Phases 2 6 FreePermitted Phases FreeActuated Green, G (s) 13.0 50.0 29.0 50.0Effective Green, g (s) 13.0 50.0 29.0 50.0Actuated g/C Ratio 0.26 1.00 0.58 1.00Clearance Time (s) 4.0 4.0Lane Grp Cap (vph) 850 1627 2072 2814v/s Ratio Prot 0.10 0.49 0.09v/s Ratio Perm c1.09v/c Ratio 0.40 1.09 0.84 0.09Uniform Delay, d1 15.3 25.0 8.6 0.0Progression Factor 1.00 1.00 2.69 1.00Incremental Delay, d2 1.4 52.7 3.2 0.0Delay (s) 16.7 77.7 26.5 0.0Level of Service B E C AApproach Delay (s) 16.7 77.7 0.0 23.2Approach LOS B E A C
Intersection SummaryHCM 2000 Control Delay 46.2 HCM 2000 Level of Service DHCM 2000 Volume to Capacity ratio 1.30Actuated Cycle Length (s) 50.0 Sum of lost time (s) 8.0Intersection Capacity Utilization 64.7% ICU Level of Service CAnalysis Period (min) 15c Critical Lane Group
HCM Unsignalized Intersection Capacity Analysis Children's Hospital 18: West Street & 52nd Street 2035 PM No Project
Fehr & Peers Synchro 8 Report
Movement EBL EBT EBR WBL WBT WBR NBL NBT NBR SBL SBT SBRLane ConfigurationsSign Control Stop Stop Stop StopVolume (vph) 0 160 10 100 140 0 60 0 150 10 70 10Peak Hour Factor 1.00 1.00 1.00 1.00 1.00 1.00 1.00 1.00 1.00 1.00 1.00 1.00Hourly flow rate (vph) 0 160 10 100 140 0 60 0 150 10 70 10
Direction, Lane # EB 1 WB 1 NB 1 NB 2 SB 1Volume Total (vph) 170 240 60 150 90Volume Left (vph) 0 100 60 0 10Volume Right (vph) 10 0 0 150 10Hadj (s) -0.02 0.12 0.50 -0.70 -0.01Departure Headway (s) 5.0 5.0 6.2 5.0 5.4Degree Utilization, x 0.24 0.33 0.10 0.21 0.13Capacity (veh/h) 667 675 546 670 606Control Delay (s) 9.5 10.5 8.7 8.1 9.2Approach Delay (s) 9.5 10.5 8.2 9.2Approach LOS A B A A
Intersection SummaryDelay 9.4Level of Service AIntersection Capacity Utilization 46.1% ICU Level of Service AAnalysis Period (min) 15

HCM Unsignalized Intersection Capacity Analysis Children's Hospital 19: Genoa Street & 52nd Street 2035 PM No Project
Fehr & Peers Synchro 8 Report
Movement EBL EBT EBR WBL WBT WBR NBL NBT NBR SBL SBT SBRLane ConfigurationsSign Control Stop Stop Stop StopVolume (vph) 10 150 10 20 130 50 10 0 10 20 10 10Peak Hour Factor 1.00 1.00 1.00 1.00 1.00 1.00 1.00 1.00 1.00 1.00 1.00 1.00Hourly flow rate (vph) 10 150 10 20 130 50 10 0 10 20 10 10
Direction, Lane # EB 1 WB 1 NB 1 SB 1Volume Total (vph) 170 200 20 40Volume Left (vph) 10 20 10 20Volume Right (vph) 10 50 10 10Hadj (s) -0.01 -0.13 -0.20 -0.05Departure Headway (s) 4.2 4.1 4.5 4.7Degree Utilization, x 0.20 0.23 0.03 0.05Capacity (veh/h) 829 861 723 704Control Delay (s) 8.3 8.3 7.7 7.9Approach Delay (s) 8.3 8.3 7.7 7.9Approach LOS A A A A
Intersection SummaryDelay 8.2Level of Service AIntersection Capacity Utilization 28.2% ICU Level of Service AAnalysis Period (min) 15
HCM Unsignalized Intersection Capacity Analysis Children's Hospital 20: Genoa Street & 55th Street 2035 PM No Project
Fehr & Peers Synchro 8 Report
Movement EBL EBT EBR WBL WBT WBR NBL NBT NBR SBL SBT SBRLane ConfigurationsVolume (veh/h) 20 390 10 20 450 40 10 20 40 40 10 20Sign Control Free Free Stop StopGrade 0% 0% 0% 0%Peak Hour Factor 1.00 1.00 1.00 1.00 1.00 1.00 1.00 1.00 1.00 1.00 1.00 1.00Hourly flow rate (vph) 20 390 10 20 450 40 10 20 40 40 10 20Pedestrians 8 11 5Lane Width (ft) 12.0 12.0 12.0Walking Speed (ft/s) 4.0 4.0 4.0Percent Blockage 1 1 0Right turn flare (veh)Median type None NoneMedian storage veh)Upstream signal (ft) 721pX, platoon unblockedvC, conflicting volume 495 411 989 981 406 1000 966 483vC1, stage 1 conf volvC2, stage 2 conf volvCu, unblocked vol 495 411 989 981 406 1000 966 483tC, single (s) 4.1 4.1 7.1 6.5 6.2 7.1 6.5 6.2tC, 2 stage (s)tF (s) 2.2 2.2 3.5 4.0 3.3 3.5 4.0 3.3p0 queue free % 98 98 95 92 94 79 96 97cM capacity (veh/h) 1069 1148 202 239 643 187 242 577
Direction, Lane # EB 1 WB 1 NB 1 SB 1Volume Total 420 510 70 70Volume Left 20 20 10 40Volume Right 10 40 40 20cSH 1069 1148 358 241Volume to Capacity 0.02 0.02 0.20 0.29Queue Length 95th (ft) 1 1 18 29Control Delay (s) 0.6 0.5 17.5 25.9Lane LOS A A C DApproach Delay (s) 0.6 0.5 17.5 25.9Approach LOS C D
Intersection SummaryAverage Delay 3.3Intersection Capacity Utilization 51.2% ICU Level of Service AAnalysis Period (min) 15

Appendix E
Transportation Impact Analysis Assumptions Memorandum
1330 Broadway | Suite 833 | Oakland, CA 94612 | (510) 834-3200
www.fehrandpeers.com
MEMORANDUM
Date: Janurary 20, 2014
To: Heather Klein, City of Oakland
Shannon Allen, LSA
From: Sam Tabibnia
Subject: Children’s Hospital and Research Center Oakland – Transportation Impact
Analysis Assumptions
WC12-2940
This memorandum summarizes the assumptions that Fehr & Peers proposes to use in preparing
the transportation impact analysis for the proposed expansion of Children’s Hospital and
Research Center Oakland (CHRCO).
This memorandum contains the following sections:
1. Existing Hospital Characteristics summarizes the characteristics of the existing hospital,
including various buildings, population groups, and parking facilities.
2. Data Collection summarizes the data collected by Fehr & Peers and additional data
provided by CHRCO.
3. Project Description describes the various components of the proposed project.
4. Transportation Characteristics describes the transportation characteristics of the
proposed project including mode share, trip generation, and trip distribution. This
section also lists the study intersections to be analyzed in the project environmental
document.
5. Planned Transportation Network Changes summarizes the planned changes to the
transportation network in the project vicinity.
We will use the information and assumptions presented in this memorandum to analyze the
impacts of the proposed project on the transportation network as part of the environmental
document for the project.

Heather Klein and Shannon Allen
January 20, 2014
Page 2 of 17
1. EXISTING HOSPITAL CHARACTERISTICS
The characteristics of the existing hospital, including various buildings, parking facilities and
population types at the hospital are described below.
Location
As shown on Figure 1, CHCRO is located at 52nd Street and Martin Luther King Junior Way,
adjacent to State Route (SR) 24 in Oakland, CA. The main campus consists of the following major
buildings:
Main Hospital – located at 747 52nd Street, the main hospital is bound by Martin Luther
King Junior Way to the west, 52nd Street to the north, and SR 24 to the east and south.
The hospital consists of several interconnected buildings that provide the main in-patient
services at the hospital. The 280,000 square feet of building space house the emergency
department and cafeteria, as well as various patient care departments. The Main Hospital
provides 170 beds. The pick-up/drop off area and the emergency department access
occurs at the Main Plaza, which can be accessed from both 52nd Street and Martin Luther
King Junior Way. In addition, the Bruce Lyon Memorial Research Center and several
temporary trailers are also located adjacent to the Main Hospital.
Outpatient Center Building 1 (OPC-1) – this 116,000 square-foot building is located on
the north side of 52nd street east of Martin Luther King Junior Way and serves
outpatients. Departments located in this building include Anesthesiology, Orthopedics,
Neurology, Rheumatology, Sports Medicine, and other clinics.
In addition, CHRCO owns and operates several former residential buildings along 52nd, 53rd, and
Dover Streets.
Population
Population groups that use the hospital include the following:
Patients/Visitors – About 1,480 patients and visitors visit the hospital on a typical
weekday. About 610 patients are treated as outpatients, and 270 are either in inpatient
beds or visit the Emergency Room. There are also about 600 visitors, which also includes
vendors and contractors, at the hospital on a typical weekday,.1
Employees – CHRCO has approximately 2,170 employees at the main campus, with about
160 employees at OPC-1, 1,760 employees at the main hospital, and 245 physicians.
About 66 percent of the main hospital employees work during the day shift (between
7:00 AM and 3:00 PM), 24 percent work during the evening shift (between 3:00 PM and
11:00 PM), and 10 percent work during the night shift. OPC-1 staff primarily work during
1 Based on data provided by CHRCO in October 2013.
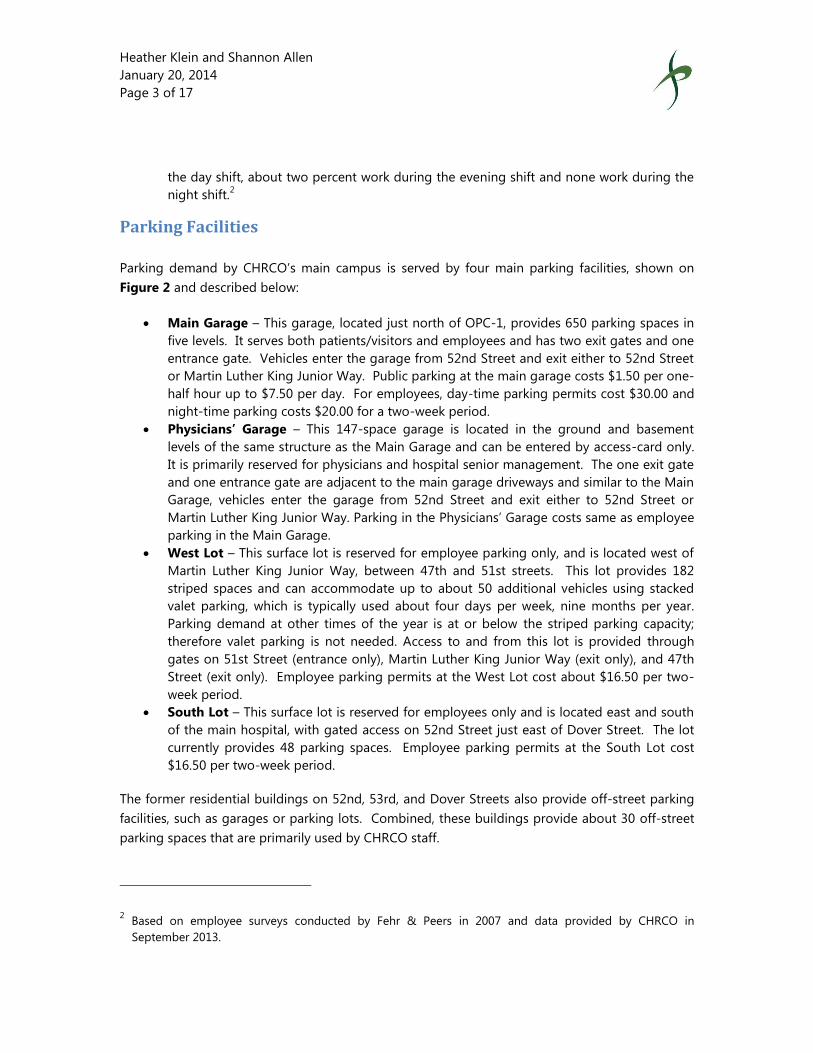
Heather Klein and Shannon Allen
January 20, 2014
Page 3 of 17
the day shift, about two percent work during the evening shift and none work during the
night shift.2
Parking Facilities
Parking demand by CHRCO’s main campus is served by four main parking facilities, shown on
Figure 2 and described below:
Main Garage – This garage, located just north of OPC-1, provides 650 parking spaces in
five levels. It serves both patients/visitors and employees and has two exit gates and one
entrance gate. Vehicles enter the garage from 52nd Street and exit either to 52nd Street
or Martin Luther King Junior Way. Public parking at the main garage costs $1.50 per one-
half hour up to $7.50 per day. For employees, day-time parking permits cost $30.00 and
night-time parking costs $20.00 for a two-week period.
Physicians’ Garage – This 147-space garage is located in the ground and basement
levels of the same structure as the Main Garage and can be entered by access-card only.
It is primarily reserved for physicians and hospital senior management. The one exit gate
and one entrance gate are adjacent to the main garage driveways and similar to the Main
Garage, vehicles enter the garage from 52nd Street and exit either to 52nd Street or
Martin Luther King Junior Way. Parking in the Physicians’ Garage costs same as employee
parking in the Main Garage.
West Lot – This surface lot is reserved for employee parking only, and is located west of
Martin Luther King Junior Way, between 47th and 51st streets. This lot provides 182
striped spaces and can accommodate up to about 50 additional vehicles using stacked
valet parking, which is typically used about four days per week, nine months per year.
Parking demand at other times of the year is at or below the striped parking capacity;
therefore valet parking is not needed. Access to and from this lot is provided through
gates on 51st Street (entrance only), Martin Luther King Junior Way (exit only), and 47th
Street (exit only). Employee parking permits at the West Lot cost about $16.50 per two-
week period.
South Lot – This surface lot is reserved for employees only and is located east and south
of the main hospital, with gated access on 52nd Street just east of Dover Street. The lot
currently provides 48 parking spaces. Employee parking permits at the South Lot cost
$16.50 per two-week period.
The former residential buildings on 52nd, 53rd, and Dover Streets also provide off-street parking
facilities, such as garages or parking lots. Combined, these buildings provide about 30 off-street
parking spaces that are primarily used by CHRCO staff.
2 Based on employee surveys conducted by Fehr & Peers in 2007 and data provided by CHRCO in
September 2013.

Heather Klein and Shannon Allen
January 20, 2014
Page 4 of 17
Since the streets adjacent to the main campus provide unrestricted on-street parking, they are
also used by CHRCO employees and patients/visitors.
2. DATA COLLECTION
Various data collected by Fehr & Peers is summarized below:
Driveway Counts – Fehr & Peers counted vehicles entering and exiting the following
locations for a 48-hour period on Tuesday and Wednesday, September 18 and 19, 20133:
o Main and Physicians’ Garages
o Main Plaza
o West Lot
o South Lot
Patient/Visitor in-person surveys, consisting of a maximum of six questions, were
conducted at the entrances to the Main Hospital and OPC-1 on November 6, 2007.
Appendix A summarizes the results of the patient/visitor survey.4
Employee mailback surveys, consisting of 12 questions were distributed by the hospital
administration in December 2007. Appendix B summarizes the results of the employee
survey.
In addition, CHRCO staff also provided data on current parking occupancies at different parking
facilities, as well as data on existing and expected number of employees and patients/visitors at
CHRCO’s main campus. Based on data provided by CHRCO, staffing levels and number of
patient/visitors to the site fluctuates throughout the year. Typically, winter months (January,
February) have the highest amount of activity, while summer months (June through August) have
the lowest amount of activity. Data collected in September represents above average activity at
the hospital. Thus, data presented in this memorandum is conservative in estimating typical
conditions at the hospital and no further adjustments to the collected September 2013 data are
necessary.
3 The traffic data was collected on these days because they correspond to above-typical level of activity at
CHRCO. Thus, the analysis that will be completed for the Draft EIR will represent typical peak conditions at
the CHRCO main campus.
4 Both the patient/visitor and employee surveys were conducted in 2007. Appendix C estimates the
automobile trip generation for the existing site using the survey results and provides a comparison to the
observed automobile trip generation in September 2013. The difference between the estimated and
observed trip generation is less than five percent, which is within the expected daily fluctuation indicating
that the results of the surveys continue to remain valid.
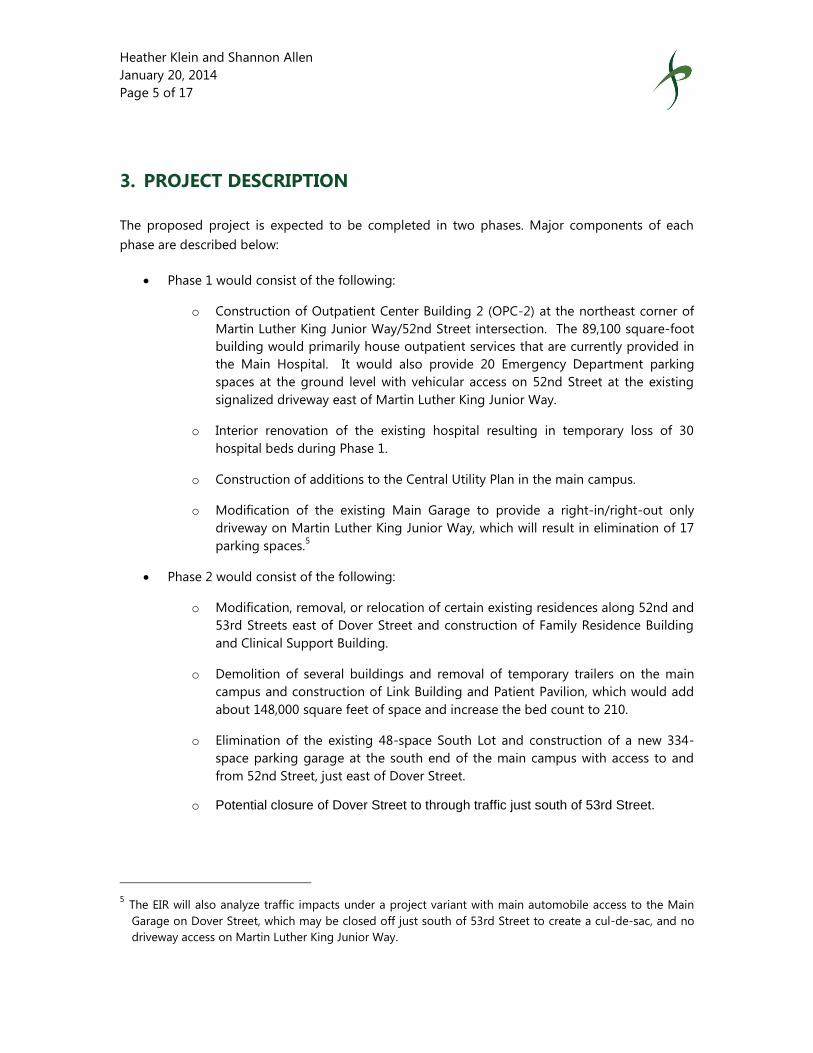
Heather Klein and Shannon Allen
January 20, 2014
Page 5 of 17
3. PROJECT DESCRIPTION
The proposed project is expected to be completed in two phases. Major components of each
phase are described below:
Phase 1 would consist of the following:
o Construction of Outpatient Center Building 2 (OPC-2) at the northeast corner of
Martin Luther King Junior Way/52nd Street intersection. The 89,100 square-foot
building would primarily house outpatient services that are currently provided in
the Main Hospital. It would also provide 20 Emergency Department parking
spaces at the ground level with vehicular access on 52nd Street at the existing
signalized driveway east of Martin Luther King Junior Way.
o Interior renovation of the existing hospital resulting in temporary loss of 30
hospital beds during Phase 1.
o Construction of additions to the Central Utility Plan in the main campus.
o Modification of the existing Main Garage to provide a right-in/right-out only
driveway on Martin Luther King Junior Way, which will result in elimination of 17
parking spaces.5
Phase 2 would consist of the following:
o Modification, removal, or relocation of certain existing residences along 52nd and
53rd Streets east of Dover Street and construction of Family Residence Building
and Clinical Support Building.
o Demolition of several buildings and removal of temporary trailers on the main
campus and construction of Link Building and Patient Pavilion, which would add
about 148,000 square feet of space and increase the bed count to 210.
o Elimination of the existing 48-space South Lot and construction of a new 334-
space parking garage at the south end of the main campus with access to and
from 52nd Street, just east of Dover Street.
o Potential closure of Dover Street to through traffic just south of 53rd Street.
5 The EIR will also analyze traffic impacts under a project variant with main automobile access to the Main
Garage on Dover Street, which may be closed off just south of 53rd Street to create a cul-de-sac, and no
driveway access on Martin Luther King Junior Way.
Heather Klein and Shannon Allen
January 20, 2014
Page 6 of 17
Table 1 summarizes various aspects of the proposed project after completion of each phase of
the project, including population forecasts provided by CHRCO. Based on communications with
CHRCO in October and November 2013, these population forecasts are based on estimated
demand for various services that reflect budgetary and operational constraints, such as potential
competition with other medical centers and recent population trends at CHRCO. For example,
total number of patient/visitors at CHRCO decreased by about 10 percent between 2007 and
2013. Thus, the forecasted increase in population are independent of and not proportional to the
increase in the size of the Hospital.
After completion of Phase 2, CHRCO would have about 46 percent more space than current
conditions. The number of employees, patient, and visitors are expected to increase by about 9
percent, 13 percent, and 26 percent, respectively.
4. TRANSPORTATION CHARACTERISTICS
Data collected by Fehr & Peers and provided by CHRCO were used to estimate transportation
characteristics of the hospital, estimate trip generation for the proposed project, and select
appropriate intersections for analysis in the project EIR. These are summarized below.
Current Transportation Demand Management (TDM) Strategies
Currently, CHRCO has in place the following TDM strategies reducing the number of single-
occupant vehicle trips and encouraging other modes such as transit and biking:
BART Shuttle – CHRCO operates a free shuttle between the MacArthur BART Station and
the main campus for its employees, patients, and visitors. Currently, the shuttles operate
on weekdays from 6:00 AM to midnight with approximately 15 minute headways. CHRCO
operate 24-passenger shuttles during the day and eight-passenger shuttles during the
evening and night. The shuttles currently transport about 455 passengers each day.6
Commuter Tax Incentive – Employees have the option to deduct a predetermined
amount from their paychecks to be used for transit-related expenses.
Bicycle Parking – Bicycle parking for approximately 40 bicycle parking spaces is provided
on the ground level of the Main Garage.
TDM Management – CHRCO has an on-site parking and shuttle manager. In addition,
transportation information is provided to all new employees during orientation.
6 May 2013 ridership data provided by CHRCO.
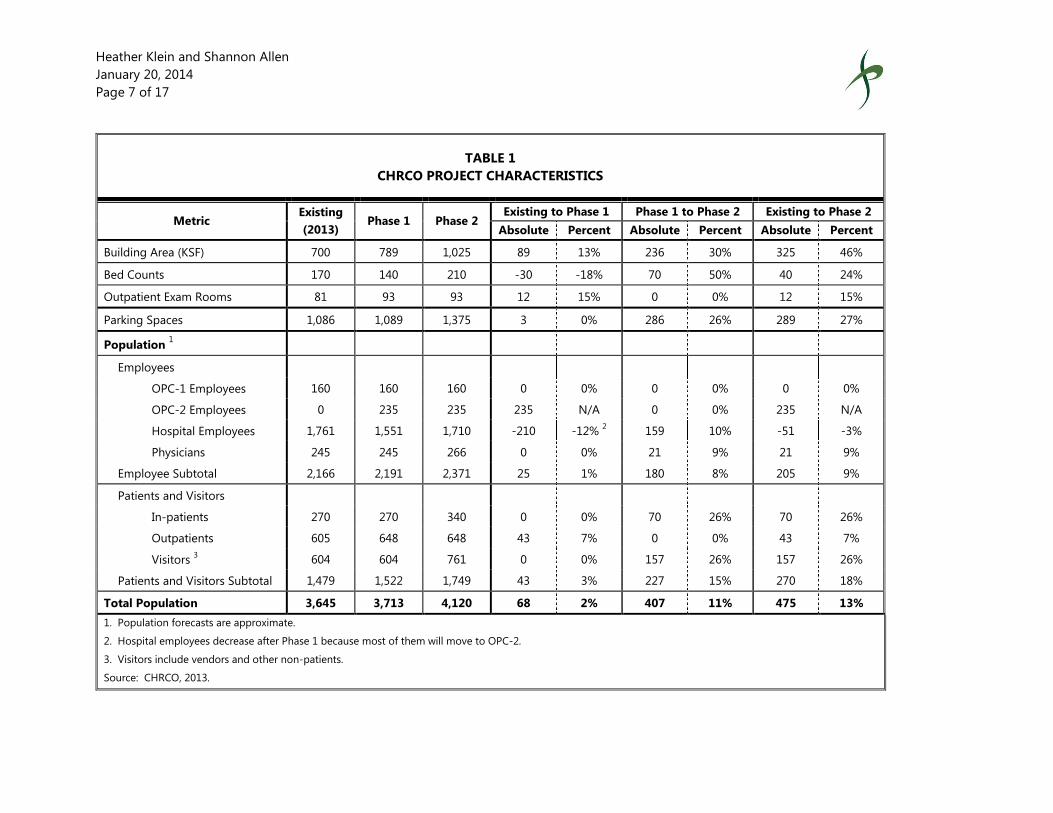
Heather Klein and Shannon Allen
January 20, 2014
Page 7 of 17
TABLE 1
CHRCO PROJECT CHARACTERISTICS
Metric Existing
(2013) Phase 1 Phase 2
Existing to Phase 1 Phase 1 to Phase 2 Existing to Phase 2
Absolute Percent Absolute Percent Absolute Percent
Building Area (KSF) 700 789 1,025 89 13% 236 30% 325 46%
Bed Counts 170 140 210 -30 -18% 70 50% 40 24%
Outpatient Exam Rooms 81 93 93 12 15% 0 0% 12 15%
Parking Spaces 1,086 1,089 1,375 3 0% 286 26% 289 27%
Population 1
Employees
OPC-1 Employees 160 160 160 0 0% 0 0% 0 0%
OPC-2 Employees 0 235 235 235 N/A 0 0% 235 N/A
Hospital Employees 1,761 1,551 1,710 -210 -12% 2 159 10% -51 -3%
Physicians 245 245 266 0 0% 21 9% 21 9%
Employee Subtotal 2,166 2,191 2,371 25 1% 180 8% 205 9%
Patients and Visitors
In-patients 270 270 340 0 0% 70 26% 70 26%
Outpatients 605 648 648 43 7% 0 0% 43 7%
Visitors 3 604 604 761 0 0% 157 26% 157 26%
Patients and Visitors Subtotal 1,479 1,522 1,749 43 3% 227 15% 270 18%
Total Population 3,645 3,713 4,120 68 2% 407 11% 475 13%
1. Population forecasts are approximate.
2. Hospital employees decrease after Phase 1 because most of them will move to OPC-2.
3. Visitors include vendors and other non-patients.
Source: CHRCO, 2013.
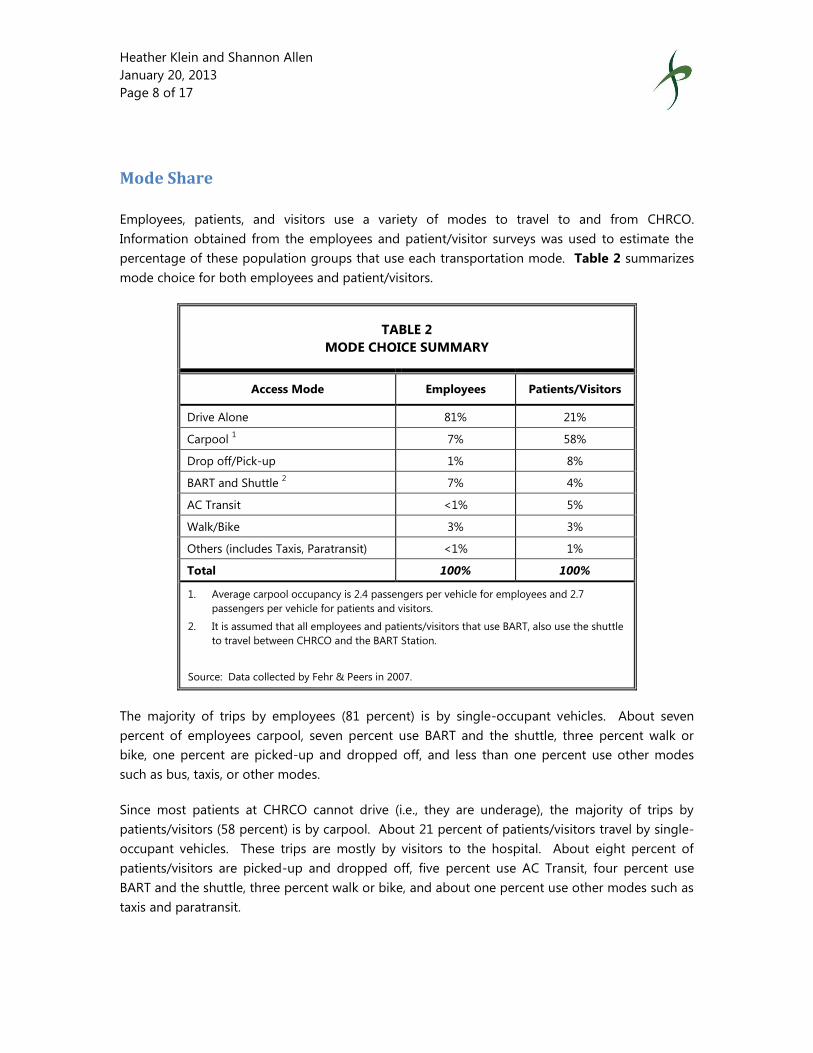
Heather Klein and Shannon Allen
January 20, 2013
Page 8 of 17
Mode Share
Employees, patients, and visitors use a variety of modes to travel to and from CHRCO.
Information obtained from the employees and patient/visitor surveys was used to estimate the
percentage of these population groups that use each transportation mode. Table 2 summarizes
mode choice for both employees and patient/visitors.
TABLE 2
MODE CHOICE SUMMARY
Access Mode Employees Patients/Visitors
Drive Alone 81% 21%
Carpool 1 7% 58%
Drop off/Pick-up 1% 8%
BART and Shuttle 2 7% 4%
AC Transit <1% 5%
Walk/Bike 3% 3%
Others (includes Taxis, Paratransit) <1% 1%
Total 100% 100%
1. Average carpool occupancy is 2.4 passengers per vehicle for employees and 2.7
passengers per vehicle for patients and visitors.
2. It is assumed that all employees and patients/visitors that use BART, also use the shuttle
to travel between CHRCO and the BART Station.
Source: Data collected by Fehr & Peers in 2007.
The majority of trips by employees (81 percent) is by single-occupant vehicles. About seven
percent of employees carpool, seven percent use BART and the shuttle, three percent walk or
bike, one percent are picked-up and dropped off, and less than one percent use other modes
such as bus, taxis, or other modes.
Since most patients at CHRCO cannot drive (i.e., they are underage), the majority of trips by
patients/visitors (58 percent) is by carpool. About 21 percent of patients/visitors travel by single-
occupant vehicles. These trips are mostly by visitors to the hospital. About eight percent of
patients/visitors are picked-up and dropped off, five percent use AC Transit, four percent use
BART and the shuttle, three percent walk or bike, and about one percent use other modes such as
taxis and paratransit.

Heather Klein and Shannon Allen
January 20, 2013
Page 9 of 17
Current Vehicle Trip Generation
The amount of traffic currently generated by CHRCO is primarily estimated based on driveway
counts collected in September 2013. Although traffic data was collected over a two-day period,
the day with the highest amount of traffic was selected for analysis. Drop-off/pick-ups and on-
street parking are accounted for by using data from the employee and patient/visitor surveys and
observations at the site. Figure 3 shows the inbound, outbound, and total vehicle trip generation
profile by hour for a typical weekday. See Appendix D for more detailed information by parking
facility.
As shown on Figure 3, total traffic generated by the site peaks between 7:30 and 8:30 AM and
between 4:30 and 5:30 PM.7 Most traffic enters the site during the morning peak, while most
traffic exits the site during the peak afternoon period.
Table 3 summarizes the daily and AM and PM peak hour vehicle trip generation by parking
facility. Currently, CHRCO generates about 5,690 vehicle trips (both in and out) on a typical
weekday. The site generates about 450 trips during the AM peak hour (7:30 to 8:30 AM) and
about 470 trips during the PM peak hour (4:30 to 5:30 PM). As shown in Table 3, slightly less than
half of all trips are to and from the Main Garage, while about 15 percent use on-street parking.
Based on the driveway counts, results of the patient/visitor and employee surveys, and parking
data provided by CHRCO, it is estimated that about 70 percent of all trips are generated by site
employees.
Trip Generation Comparison
Table 4 compares the observed trip generation rates at CHRCO with data published for hospitals
by Institute of Transportation Engineers’ (ITE) Trip Generation Manual, 9th Edition for different
variables. In comparison to ITE data, the observed trip generation rates at CHRCO based on size
(thousand square feet) and employees are about 25 to 40 percent lower, while the trip generation
rates based on number of beds is about 100 percent or more higher.
7 As previously stated on page 2 of this memorandum, the day shift at the hospital, which has the highest
number of employees, ends at 3:00 PM. However, based on observations, the afternoon peak hour of
traffic is between 4:30 and 5:30 PM. Note that as shown on Figure 3, the hour before the peak hour (3:30
to 4:30 PM), which generally corresponds with the end of the day shift at the hospital, generates only
slightly fewer trips. In addition, as shown in Question 4 in Appendix B, more CHRCO employees, which
includes both hospital and OPC-1 employees, leave between 4:00 PM and 6:00 PM, indicating that many
employees routinely continue to work after their shift ends. In addition, the peak hour traffic also includes
patients and visitors.

Heather Klein and Shannon Allen
January 20, 2013
Page 10 of 17
TABLE 3
CURRENT TRIP GENERATION SUMMARY
Facility
Daily
Total
AM Peak Hour
(7:30 – 8:30 AM)
PM Peak Hour
(4:30 – 5:30 PM)
In Out Total In Out Total
Main Garage 2,730 146 71 217 51 177 228
Physicians Garage 450 30 27 57 5 26 31
West Lot 490 42 6 48 2 48 50
South Lot 240 14 3 17 8 17 25
Main Plaza 910 26 24 50 28 31 59
Other/On-Street 1 870 40 16 56 20 56 76
Total 5,690 298 147 445 114 355 469
1. Other trips include trips by drop-off/pick-up of employees and patients/visitors, delivery trucks, etc. Trips by vehicles parking on-street estimated based on the results of the employee and patient/visitor surveys.
Source: Fehr & Peers, 2013.
TABLE 4
TRIP GENERATION RATE COMPARISON
Source Daily AM Peak Hour PM Peak Hour
CHRCO 1
Rate per KSF 8.13 0.64 0.67
Rate per Employee 2.63 0.21 0.22
Rate per Bed 33.47 2.62 2.76
ITE 2
Rate per KSF 13.22 0.95 0.93
Rate per Employee 4.50 0.31 0.29
Rate per Bed 12.94 1.32 1.42
1. Based on CHRCO characteristics presented in Tables 2 and total project trip generation presented in Table 3.
2. Based on average rates published in ITE Trip Generation (9th Edition) for land use category 610 (Hospital)
Source: Fehr & Peers, 2013.

Heather Klein and Shannon Allen
January 20, 2013
Page 11 of 17
Various factors, such as setting (urban or suburban), shift change times, types of services provided
(inpatient or outpatient), or types of patients (children or adults) may account for the difference in
ITE data and observed trip generation at CHRCO.
Vehicle Trip Generation Rates
As shown in Table 1, the proposed project would increase the size of CHRCO by about 46 percent
at buildout, while the number of employees and patient/visitors are expected to increase by nine
percent and 18 percent, respectively. Population is not expected to increase at the same rate as
the overall size because the proposed facilities would be designed to accommodate current
design standards and patient-care technologies that require more building square footage per
patient.
For example, the Pediatric and Neonatal Intensive Care Unit (PICU and NICU) in the current
hospital are ward-style with about 300 square feet per bed; in comparison, the PICU and NICU in
the proposed hospital would be in single or double-occupancy rooms with about 500 to 590
square feet per bed.
Since building square footage per bed and per staff would increase regardless of an increase in
staff and/or patients, building square footage is not the best indicator of the amount of traffic the
future project would generate.
The increased activity and associated traffic will be caused by the increase in the number of
employees and patients/ visitors. Therefore, projected increases in total population (employees
and patient/visitors combined) are used to calculate trip generation for the project. This
presumes that the future hospital would continue to have similar characteristics as the existing
hospital, such as similar services, similar parking supply, and continue to provide the BART shuttle
service.
Based on the current population of 3,645 (2,166 employees and 1,479 patients/visitors) and
current trip generation counts, CHRCO has the following automobile trip generation rates per
population:
Daily = 1.56 trips per person8
AM Peak Hour = 0.12 trips per person9 (67% in, 33% out)
8 Based on 5,690 daily trips (Table 3) divided by population of 3,645 (Table 1)
9 Based on 445 AM peak hour trips (Table 3) divided by population of 3,645 (Table 1)

Heather Klein and Shannon Allen
January 20, 2013
Page 12 of 17
PM Peak Hour = 0.13 trips per person10
(24% in, 76% out)
Proposed Project Trip Generation
As shown in Table 1, CHRCO population is estimated to increase by about 13 percent while the
project size would increase by about 46 percent at project buildout. As previously described, the
population forecasts in Table 1 were estimated independent of the project size. They are
generally based on current trends and other budgetary and operational constraints at CHRCO and
present best estimates for activity levels at CHRCO at buildout.
Since automobile trip generation is correlated to population, this analysis proposes to modify the
population estimates prepared by CHRCO to present a more conservative analysis of project
traffic impacts in the EIR based on a higher activity level than can be accommodated at the site.
As previously discussed, the overall square footage of the proposed project would not be an
accurate indicator of overall level of activity at CHRCO. Thus, this analysis uses other
characteristics of the physical space to estimate an increase in total population proportional to
the increase in space.
As shown in Table 1, the project would increase the number of exam rooms (indicator of
outpatient activity) by about 15 percent and the number of beds (indicator of inpatient activity)
by about 24 percent. Therefore, this analysis will increase the project population related to
outpatient services by 15 percent and inpatient services by 24 percent. Under these conservative
assumptions, CHRCO total population would increase by about 4 percent after Phase 1 and 22
percent after Phase 2, which are higher than the forecasted increase of 2 percent at the end of
Phase 1 and 13 percent at Phase 2 that was previously presented. The proposed estimates in
population increase are more conservative than the population forecasts estimated by CHRCO
and less likely to occur; however, they will result in a more conservative traffic impact analysis for
the EIR that reflects the increase in size of the proposed project but account for the
decompression of current services in a larger hospital.
Based on the trip generation rates described above, Table 5 summarizes project trip generation
at the end of Phases 1 and 2. At the end of Phase 1, the proposed project is estimated to
generate about 240 additional daily trips and 18 additional AM peak hour and 19 additional PM
peak hour trips. At buildout, the proposed project is estimated to generate about 1,230
additional daily, 96 additional AM peak hour, and 102 additional PM peak hour automobile trips.
10 Based on 469 PM peak hour trips (Table 3) divided by population of 3,645 (Table 1)
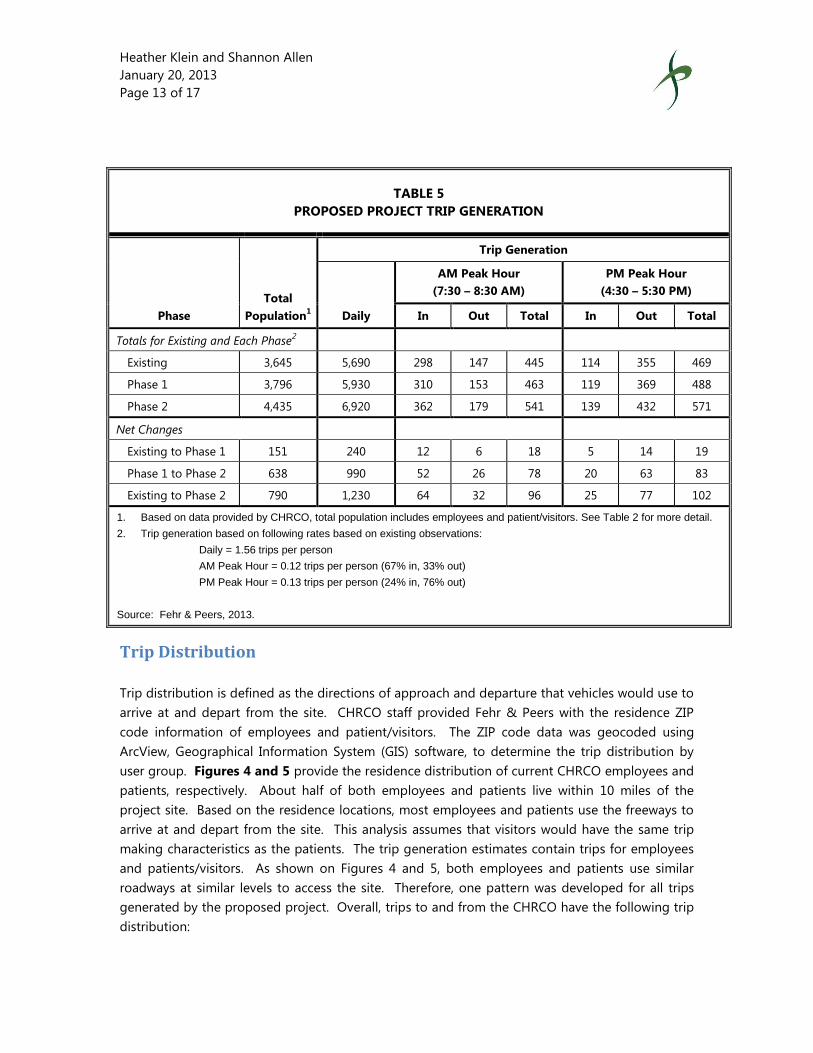
Heather Klein and Shannon Allen
January 20, 2013
Page 13 of 17
TABLE 5
PROPOSED PROJECT TRIP GENERATION
Phase
Total
Population1
Trip Generation
Daily
AM Peak Hour
(7:30 – 8:30 AM)
PM Peak Hour
(4:30 – 5:30 PM)
In Out Total In Out Total
Totals for Existing and Each Phase2
Existing 3,645 5,690 298 147 445 114 355 469
Phase 1 3,796 5,930 310 153 463 119 369 488
Phase 2 4,435 6,920 362 179 541 139 432 571
Net Changes
Existing to Phase 1 151 240 12 6 18 5 14 19
Phase 1 to Phase 2 638 990 52 26 78 20 63 83
Existing to Phase 2 790 1,230 64 32 96 25 77 102
1. Based on data provided by CHRCO, total population includes employees and patient/visitors. See Table 2 for more detail.
2. Trip generation based on following rates based on existing observations:
Daily = 1.56 trips per person
AM Peak Hour = 0.12 trips per person (67% in, 33% out)
PM Peak Hour = 0.13 trips per person (24% in, 76% out)
Source: Fehr & Peers, 2013.
Trip Distribution
Trip distribution is defined as the directions of approach and departure that vehicles would use to
arrive at and depart from the site. CHRCO staff provided Fehr & Peers with the residence ZIP
code information of employees and patient/visitors. The ZIP code data was geocoded using
ArcView, Geographical Information System (GIS) software, to determine the trip distribution by
user group. Figures 4 and 5 provide the residence distribution of current CHRCO employees and
patients, respectively. About half of both employees and patients live within 10 miles of the
project site. Based on the residence locations, most employees and patients use the freeways to
arrive at and depart from the site. This analysis assumes that visitors would have the same trip
making characteristics as the patients. The trip generation estimates contain trips for employees
and patients/visitors. As shown on Figures 4 and 5, both employees and patients use similar
roadways at similar levels to access the site. Therefore, one pattern was developed for all trips
generated by the proposed project. Overall, trips to and from the CHRCO have the following trip
distribution:

Heather Klein and Shannon Allen
January 20, 2013
Page 14 of 17
I-80 (West), 3 percent
I-80 (East), 17 percent
I-580 (East), 30 percent
I-980, 22 percent
SR 24 (East), 13 percent
Local (Martin Luther King Jr. Way,
Telegraph Avenue, etc.), 15 percent
All freeways, except SR 24 (East) can be accessed from the on-ramp and off-ramp on Martin
Luther king Junior Way, just south of the project site. The nearest access to and from SR 24 (East)
is provided through ramps on Telegraph Avenue northeast of the project site.
Trip Assignment and Study Intersections
The new trips generated by the proposed project, as shown in Table 5, were assigned to the
roadway network according to the trip distribution described in the previous section. Figure 6
shows the resulting peak hour trip assignment by roadway segment at buildout, assuming that all
vehicles would use the major streets, such as Martin Luther King Junior Way, Telegraph Avenue,
and 52nd Street, to travel to and from the site.
Based on the proposed trip assignment, the following intersections are proposed for analysis:
1. Martin Luther King Junior Way/55th
Street
2. Dover Street/55th Street
3. Shattuck Avenue/55th Street
4. Telegraph Avenue/55th Street
5. Martin Luther King Junior Way/54th
Street
6. Dover Street/54th Street
7. Shattuck Avenue/54th Street
8. Martin Luther King Junior Way/53rd
Street
9. Dover Street/53rd Street
10. Martin Luther King Junior Way/52nd
Street
11. 52nd Street/CHRCO Garage Driveways
12. 52nd Street/Dover Street/Hospital
Driveway
13. 52nd Street/SR 24 On-Ramp/SR 24 Off-
Ramp
14. 52nd Street/Shattuck Avenue
15. 52nd Street/Telegraph Avenue/Claremont
Avenue
16. 51st Street/Telegraph Avenue
17. 47th Street/SR 24 On-Ramp/SR 24 Off-
Ramp/Martin Luther King Junior Way
18. West Street/52nd Street
19. Genoa Street/52nd Street
20. Genoa Street/55th Street
We will analyze traffic operations at these intersections for the highest hour during the AM peak
period (7:00 AM to 9:00 AM) and during the PM peak period (3:00 PM to 6:00 PM).

Heather Klein and Shannon Allen
January 20, 2013
Page 15 of 17
These intersections were generally selected to identify likely locations where the proposed project
may significantly alter travel patterns. In general, study intersections were selected if they provide
immediate access to the project site, or where the proposed project would increase traffic
volumes by 50 or more peak-hour vehicle at signalized intersections, or ten or more peak hour
vehicles on the controlled approach of unsignalized intersections.
Considering the current level of congestion on main arterials, such as Martin Luther King Junior
Way and Telegraph Avenue, the additional traffic generated by the proposed project, or changes
in traffic patterns caused by the proposed project, may result in additional traffic on the adjacent
residential streets. Therefore, intersections along these residential streets that may be affected by
the proposed project are also included in the list of study intersections.
Construction of new parking facilities, elimination of existing parking facilities, and potential
changes in parking supply and/or access points of existing parking facilities, would also affect
traffic patterns in the project vicinity. The traffic assignment shown on Figure 6 does not reflect
these changes, because they would only affect intersections in the immediate vicinity of the
project site and are not expected to require analysis of additional intersections. The EIR will
address these changes in traffic patterns.
The project analysis in the EIR will assume that a right-in/right-out only driveway on Martin Luther
King Junior Way would provide access to the existing Main Garage and that Dover Street between
52nd and 53rd Street would continue to remain open to through automobile traffic. The EIR will
analyze project variants that assume access to the Main Garage would be provided through a
driveway on Dover Street and that Dover Street would be closed to through traffic just south of
53rd Street.
5. PLANNED TRANSPORTATION NETWORK CHANGES
This section summarizes planned changes to the transportation network in the vicinity of the
proposed project. Planned changes include improvement projects planned by the City of
Oakland or mitigation measures proposed by other development projects. These are changes
that are not related to the proposed project and would be implemented regardless of the CHRCO
project. Changes that have full approval and funding would be assumed in the analysis of future
conditions in the project EIR. However, not all of the planned changes have finalized design
plans, full approvals, and/or funding. Changes lacking final design, full approval, and/or full
funding are not considered reasonably foreseeable, and therefore would not be assumed in the
analysis of future conditions. Planned changes by travel mode are summarized below

Heather Klein and Shannon Allen
January 20, 2013
Page 16 of 17
Planned Roadway Changes
There are no planned roadway changes in the vicinity of the proposed project or at any of the
recommended study intersections.
Planned Transit Changes
There are no planned changes to the transit service in the vicinity of the proposed project.
Planned Bicycle/Pedestrian Changes
Planned bicycle facilities in the project vicinity include:
City of Oakland is designing a combination of Class 2 bicycle lanes and Class 3A arterial
bicycle routes on Shattuck Avenue between Telegraph Avenue and the City of Berkeley.
Since the project would not modify the existing travel lane configurations or controls at
the study intersections, it would not affect the intersection operations analysis. This
project is approved, fully funded, and scheduled to be completed in 2013. Therefore, this
project will be assumed in the analysis of existing and future conditions.
In addition, the City of Oakland Bicycle Master Plan Update, as adopted in December 2007,
proposes the following improvements to the bicycle facilities in the project vicinity:
Provide Class 2 bicycle lanes along Telegraph Avenue. Telegraph Avenue (Aileen Street
to 20th Street) is provisionally designated as part of the proposed bikeway network. The
City of Oakland is currently studying various options for Telegraph Avenue as part of a
Complete Streets project. Currently, there is no finalized design, and the improvement
does not have full funding or approval. Therefore, this project will not be assumed in the
analysis of future conditions.
Class 3A Arterial Bicycle Routes on 51st Street/Pleasant Valley Avenue, east of Shattuck
Avenue. Since the project would not modify the existing travel lane configurations or
controls at the study intersections, it would not affect the intersection operations analysis.
Currently, there is no funding for this improvement. Therefore, this project will not be
assumed in the analysis of future conditions.
In addition, the Caldecott Tunnel Improvement Project Settlement Agreement includes the
following improvement projects in the vicinity of CHRCO:
Claremont Avenue /52nd Street/Telegraph Avenue intersection – Eliminate the slip right-
turn lane from northbound Telegraph Avenue to Claremont Avenue, upgrade traffic
signal control equipment to allow countdown pedestrian signal heads. This improvement
is currently not expected to be funded. Therefore, it is not included in the analysis of
future conditions.

Heather Klein and Shannon Allen
January 20, 2013
Page 17 of 17
52nd Street/Shattuck Avenue intersection - Install a traffic signal at eastbound SR 24 off-
ramp on 52nd Street just west of Shattuck Avenue and coordinate with the existing
signal, Tee 52nd Street into 51st Street. This improvement is currently not expected to be
funded. Therefore, it is not included in the analysis of future conditions.
Attachments:
Figures:
Figure 1 - Project Location
Figure 2 - Main Campus
Figure 3 - Weekday Vehicle Trip Generation
Profile
Figure 4 - Patient Residence Distribution by ZIP
Code
Figure 5 - Employee Residence Distribution by
ZIP Code
Figure 6 - Peak Hour Traffic Assignment and
Proposed Study Intersections
Appendices:
Appendix A - CHRCO – Patient/Visitor Survey
Results
Appendix B - CHRCO – Employee Survey
Results
Appendix C - Survey Results Validation
Appendix D - CHRCO Trip Generation Data
Summary

40th St
42nd St
45th St
Adel
ine
St
Wes
t St
Mar
ket S
t
Hollis St
34th St
Aileen St
Tele
grap
h Av
e
46th St
52nd St
57th St
56th St
35th St
Web
ster
St
Shaf
ter A
ve
San Pablo Ave
41st St
Park Ave
MacArthur Blvd
47th St
30th St
33rd St
Shellmound St
44th St
Apgar St
Horton St
Pera
lta St
38th St
Wood St
32nd St
55th St
Stanford Ave
Genoa St
Broa
dway
43rd St
39th St
49th St
Shattuck Ave
53rd St54th St
Man
ila A
veO
pal S
t
28th St
Mile
s Ave
Ettie St
Louise St
Arlington Ave
Uni
on S
t
31st St
Mag
nolia
St
Lind
en S
tHannah St
Doyle St
Lowell St
Ches
tnut
St
Helen St
Lusk
St
Christie Ave
48th St
Vallejo St
Emery St
Gaskill St
37th St
Beaudry St
36th St
Clare
mont A
ve
Grand Ave
Bay St
Brockhurst St
Cavour St
Fremont St
Watts St
Piedmont Ave
59th St
Frontage Rd
Rich St
Law
ton
Ave
Filb
ert S
t
26th St
Wake Ave
Yerba Buena Ave
50th St
Powell St
Ruby
St
Elm
St
Peladeau St
Emer
ald
St
Ensi
gn D
r
Halleck St
Hubbard St
Engineer Rd
Clar
ke S
t
Beac
h St
Howe St
Lock
sley A
ve
Essex St
Salem St
Man
dela
Pkw
y
Haven St
Avon St
Marshall St
Sherwin St
Harlan St
Redondo Ave
Landregan St
Vice
nte
Way
Emery Bay Dr
Latim
er P
l
Temescal Cir
Ando
ver S
t
33rd St
34th St
41st St
Broa
dway
32nd St
Doyle St
43rd St
Ruby
St
Lind
en S
t
Emery St
48th St
Lind
en S
t
47th St
39th St
45th St
Clar
ke S
t
45th St
Pleasant Valley Ave
56th St
Web
ster
St
53rd St
Dover St
34th St
55th St
36th St
32nd St
54th St
Yerba Buena Ave
53rd St
Haven St
47th St
51st St
32nd St
54th St
44th St
38th St
55th St
49th St
37th St
41st St
Powell St
24CALIFORNIA
CHRCOMAIN
CAMPUS
CHRCOMAIN
CAMPUS
880
80
580
580
80
580
980
O A K L A N D
E M E R Y V I L L E
Figure 1.
WC12-2940_1_ProjLoc
Project Location
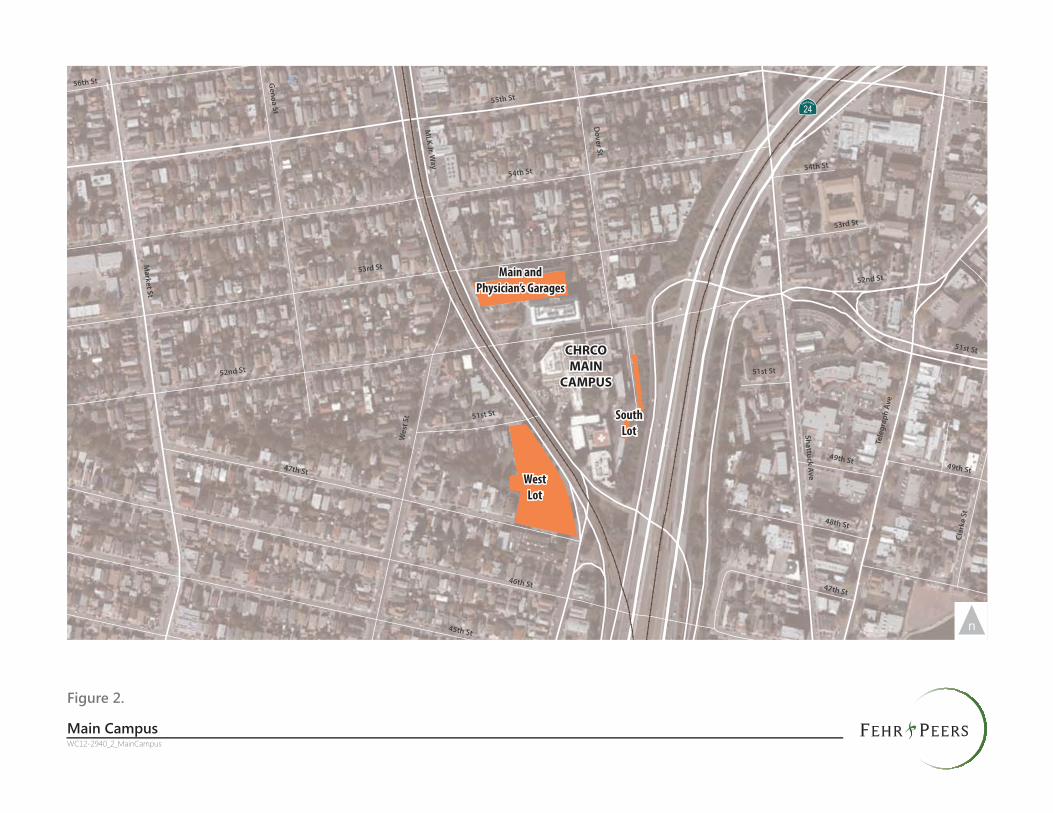
45th St
45th St
55th St
52nd St
46th St
54th St
53rd StMarket St
44th St
47th St
51st St
52nd St
Shattuck Ave
Genoa St
Wes
t St
49th St
56th St
48th St
Clar
ke S
t
Web
ster
St
Clare
mont A
ve
50th St
Redondo Ave
Vice
nte
Way
51st St
51st St
Dover St
54th St
56th St
47th St
48th St
49th St
53rd St
MLK Jr. W
ay
Tele
grap
h Av
e
24CALIFORNIA
CHRCOMAIN
CAMPUS
Main andPhysician’s Garages
SouthLot
WestLot
CHRCOMAIN
CAMPUS
SouthLot
WestLot
Main andPhysician’s Garages
Figure 2.
WC12-2940_2_MainCampus
Main Campus

0
50
100
150
200
250
300
350
400
450
500
12:00 AM 2:00 AM 4:00 AM 6:00 AM 8:00 AM 10:00 AM 12:00 PM 2:00 PM 4:00 PM 6:00 PM 8:00 PM 10:00 PM 12:00 AM
Vehi
cle
Trip
s
Hour Starting
Figure 3 - Weekday Vehicle Trip Generation Profile
Inbound
Outbound
Total
PM Peak Hour (4:30 to 5:30 PM)
AM Peak Hour (7:30 to 8:30 AM)
Figure 3.
WC12-2940_3_WkdyTripGen
Weekday Vehicle Trip Generation Profile
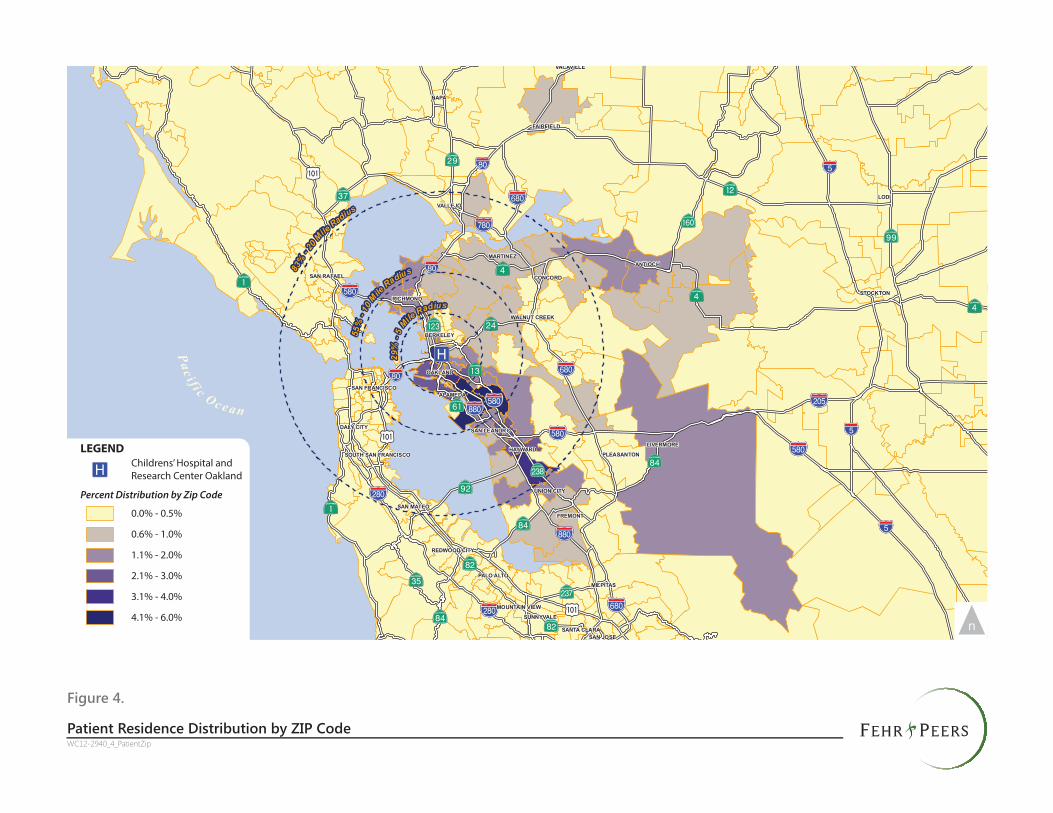
Æq!"c$ %&p(
IÆ %&n(
%&j(
!"c$
%&n(
IÆ
%&n(
?ÙE
?ÝE?̀E %&p(
AÉE
A»E
?îE
?ÞE
%&r(
?ÔE
2 9%
- 5Mile
Radius
55%
- 10 Mile
Radius83%
- 20 Mile
Radius
?ÔE
?}E
A½E
%&t(
?ÙE
!"c$
AÌE
AâE
AdE
%&t(A½E
AËE
A»EIÆ%&j( %&p(
%&f(
%&n(
!"̂$
A½E
?þE
Pac i fi c Oc ean
!"̂$
!"̂$
?ÙE
AÎE
?õE
LODI
ANTIOCH
MILPITAS
MARTINEZ
LIVERMORE
PLEASANTON
NAPA
VALLEJO
OAKLAND
HAYWARD
FREMONT
CONCORD
ALAMEDA
STOCKTON
SAN JOSE
RICHMOND
BERKELEY
VACAVILLE
SUNNYVALE
SAN MATEO
PALO ALTO
FAIRFIELD
DALY CITY
UNION CITY
SAN RAFAEL
SANTA CLARA
SAN LEANDRO
WALNUT CREEK
REDWOOD CITY
SAN FRANCISCO
MOUNTAIN VIEW
SOUTH SAN FRANCISCO
CHILDREN'S HOSPITAL OAKLANDCURRENT PATIENT RESIDENCE DISTRIBUTION BY ZIP CODE
Figure 4February 2009WC07-2489\GIS\MXD\PatientsByZip_lndscp2.mxd
LEGENDChildrens’ Hospital andResearch Center Oakland
Percent Distribution by Zip Code
0.0% - 0.5%
0.6% - 1.0%
1.1% - 2.0%
2.1% - 3.0%
3.1% - 4.0%
4.1% - 6.0%
Figure 4.
WC12-2940_4_PatientZip
Patient Residence Distribution by ZIP Code

Æq!"c$ %&p(
IÆ %&n(
%&j(
!"c$
%&n(
IÆ
%&n(
?ÙE
?ÝE?̀E %&p(
AÉE
A»E
?îE
?ÞE
%&r(
?ÔE
2 9%
- 5Mile
Radius
48%
- 10 Mile
Radius81%
- 20 Mile
Radius
?ÔE
?}E
A½E
%&t(
?ÙE
!"c$
AÌE
AâE
AdE
%&t(A½E
AËE
A»EIÆ%&j( %&p(
%&f(
%&n(
!"̂$
A½E
?þE
Pac i fi c Oc ean
!"̂$
!"̂$
?ÙE
AÎE
?õE
NAPA
LODIVALLEJO
OAKLAND
HAYWARD
FREMONT
CONCORD
ANTIOCH
ALAMEDA
STOCKTON
SAN JOSE
MILPITAS
MARTINEZ
VACAVILLE
SUNNYVALE
SAN MATEO
PALO ALTO
LIVERMORE
FAIRFIELD
DALY CITY
UNION CITY
SAN RAFAEL
PLEASANTON
SANTA CLARA
SAN LEANDRO
WALNUT CREEK
REDWOOD CITY
SAN FRANCISCO
MOUNTAIN VIEW
SOUTH SAN FRANCISCO
RICHMOND
BERKELEY
CHILDREN'S HOSPITAL OAKLANDCURRENT EMPLOYEE RESIDENCE DISTRIBUTION BY ZIP CODE
Figure 5February 2009WC07-2489\GIS\MXD\EmployeesByZip_lndscp2.mxd
Children's Hospital Oakland
LEGENDChildrens’ Hospital andResearch Center Oakland
Percent Distribution by Zip Code
0.0% - 0.5%
0.6% - 1.0%
1.1% - 2.0%
2.1% - 3.0%
3.1% - 4.0%
> 4.1%
Figure 5.
WC12-2940_5_EmployeeZip
Employee Residence Distribution by ZIP Code

45th St
45th St
55th St
52nd St
46th St
54th St
53rd St
Market St
44th St
47th St
51st St
52nd St
Shattuck Ave
Genoa St
Wes
t St
49th St
56th St
48th St
Clar
ke S
t
Web
ster
St
Shaf
ter A
veM
iles A
ve
Clare
mont A
ve
Cavour St
50th St
Avon St
Redondo Ave
Vice
nte
Way
Clifton St
51st St
51st St
Dover St
54th St
56th St
47th St
48th St
49th St
53rd St
MLK Jr. W
ay
Tele
grap
h Av
e
12
34
56
7
89
101819
20
1112
13 14 15
16
17
24CALIFORNIA
CHRCOMAIN
CAMPUS
CHRCOMAIN
CAMPUS
LEGEND
Street Segment with 50 orMore Peak Hour Project Trips
Street Segment with between10 to 50 Peak Hour Project Trips
Study Intersection1
Figure 6.
WC12-2940_6_TrafAssgnStudyLoc
Peak Hour Traffic Assignment and Proposed Study Intersection Locations

100 Pringle Avenue, Suite 600 Walnut Creek, CA 94596 (925) 930-7100 Fax (925) 933-7090 www.fehrandpeers.com
Appendix A
Children’s Hospital Oakland – Patient/Visitor Survey Results
Fehr & Peers conducted in-person surveys of Hospital patients and visitors on November 8th, 2007 between 6:30 AM and 6:30 PM. The surveys of entering patients and visitors were conducted at the main entrance of the Hospital and the Outpatient Center. A sample survey is provided on Figure 1.
As part of the survey, 428 parties were interviewed. Based on data provided by hospital administration, about 995 parties visited the hospital on that day. This corresponds to a 43 percent survey response rate. The 95 percent confidence interval1 for a sample size of 428 out of a population of 995 is plus-or-minus 3.6 percent.
The survey questions followed by responses to each survey question are summarized below.
Question 1: Time of Arrival
Paitent/visitor arrivals peak at about 9:30 to 10:30 AM and also between 1:30 and 2:30 PM. It decreases in the mid-day between 11:30 AM and 12:30 PM.
1 Confidence interval is a statistical term to describe the reliability of survey results. For example, 95 percent confidence interval of plus-or-minus 2.8 percent means that we can be 95 percent certain that the true percentage of the population would be between 3.6 percent above or below the survey result.
0
10
20
30
40
50
60
70
6:30
AM
7:30
AM
8:30
AM
9:30 A
M
10:3
0 AM
11:3
0 AM
12:3
0 PM
1:30
PM
2:30
PM
3:30 P
M
4:30 P
M
5:30 P
M
Time
Num
ber
of S
urve
ys

Page 2 of 4
Question 2: What is the purpose of this visit?
About 58 percent of visiting parties were outpatient-related and 31 percent were there for inpatient services (13 percent were inpatients and 18 percent were visiting inpatients). About three percent were there for sales or supply-related reasons.
Question 3: How did you get to the hospital today?
About 58 percent of patients/visitors carpooled and 8 percent were dropped off at the hospital. About 21 percent drove alone and 12 percent traveled using bus, bicycle, walking, or BART.
About 79 percent of outpatient trips traveled in a carpool of two or more people, compared to 57 percent of inpatient trips. Only 11 percent of outpatient trips were drive-alone trips, compared with 24 percent of inpatient trips.
About 51 percent of carpools consisted of two people, and higher carpool occupancy occurred less often than lower occupancy. The average vehicle occupancy for carpools, including the driver, is 2.7 persons per vehicle.
Out-patient58%
Other6%
Not Specified2%
Sales/Supply3%
Cafeteria0.2%
Inpatient13%
Visit Inpatient18%
Carpool 58%
Drove Alone 21%
Other 1%
BART 4%
Bus 5%Bicycle/Walk 3%
Dropped Off 8%
0
20
40
60
80
100
120
140
160
SixFiveFourThreeTwoNumber of People per Carpool
Num
ber
of S
urve
ys

Page 3 of 4
Question 4: If you were a passenger, were you dropped off and did the driver park in the area?
Of the 35 parties that indicated they were dropped off, 17 indicated the driver parked in the area, 6 indicated the driver did not park in the area, and 12 did not specify. As a percentage of the 23 respondents who specified, 74 percent parked in the area and 26 percent did not.
Of the 17 passengers who indicated the driver parked in the area, 13 specified where the driver parked; 46 percent parked in the main garage, and the remainder parked on-street.
Question 5: Where did the driver park?
About 69 percent of drivers parked in the main garage, and 29 percent parked on-street. Among the drivers who parked on-street, 83 percent parked within two blocks of the hospital.
About 73 percent of outpatient visitors parked in the main garage, compared with 61 percent of inpatient visitors and 64 percent of sales/supply visitors.
Local Garage or Lot
2%
Within 1 block9%
Within 2 blocks15%
Main Garage69%
Within 3 blocks
4%
More than 3 blocks
1%
0
2
4
6
8
10
12
14
Parked inGarage
Parkedon-street
Parked inArea
Did NotPark inArea
Did NotSpecify

Page 4 of 4
Question 6: How long do you expect to be at the hospital?
About 55 percent of parties expected to stay at the hospital between 30 minutes and two hours, 10 percent expected to stay for less than half an hour, and 12 percent expected to stay for more than four hours. About 52 percent of parties that drove private vehicles and expected to be at the hospital for less than 30 minutes consisted of one person; only 22 percent of parties expecting to be at the hospital for more than 30 minutes and drove personal vehicles consisted of one person. An average of 69 percent of drivers parked in the main garage, but 39 percent of parties expecting to stay less than 30 minutes and 84 percent of parties expecting to stay longer than four hours did so.
1/2 to 1 hour27%
1 to 2 hours28%
2 to 4 hours14%
Less than 1/2 hour10%More than 4
hours12%
Not Specified9%

CHILDREN’S HOSPITAL OAKLAND VISITOR SURVEY 1. Please indicate time of arrival: _____________AM PM
2. What is the purpose of this visit? Inpatient Visit Inpatient Out-patient Visit/Accompany out-patient Sales/Supply Cafeteria Other (please specify) ____________________ 3. How did you get to the hospital today? Drive Alone Carpool # people in car Circle one: Driver or Passenger Bus (AC Transit) Shuttle (Children’s Hospital) BART Motorcycle Bicycle/Walk Other (please specify) ____________________ 4. If you were a passenger, were you dropped off and did the driver park in the area? Dropped off Parked in area Did not park in area 5. If you arrived by car, where did you or the driver park? Main Garage Other Garages and Lots On-street: Within 1 block Within 2 blocks Within 3 blocks More than 3 blocks 6. How long do you expect to be at the hospital? Less than ½-hour ½ to 1-hour > 1 to 2 hours > 2 to 4 hours > 4 hours

100 Pringle Avenue, Suite 600 Walnut Creek, CA 94596 (925) 930-7100 Fax (925) 933-7090 www.fehrandpeers.com
Appendix B
Children’s Hospital Oakland – Employee Survey Results
Fehr & Peers conducted mailback surveys of Hospital employees in December 2007. The surveys were distributed and collected by the hospital administration to all staff at the main campus. A sample survey is provided as an attachment.
At the time, the hospital had approximately 2,220 employees at the main campus. Of these, 779 surveys were returned, corresponding to a 35 percent respond rate. The 95 percent confidence interval1 for a sample size of 779 out of a population of 2,220 is plus-or-minus 2.8 percent.
The survey questions followed by responses to each survey question are summarized below.
Question 1: What is your primary work location?
About 62 percent of survey respondents work in the main hospital building, 14 percent work in the outpatient center, and four percent work at the Bruce Lyon Memorial Building or the Psychiatry/Human Resources building. The remaining 20 percent of employees primarily worked offsite; data from their surveys were not included in the rest of the responses and not used in the analysis.
Question 2: What type of schedule do you work?
About 59 percent of survey respondents work a full-time schedule, 36 percent work part-time, and three percent work on-call.
1 Confidence interval is a statistical term to describe the reliability of survey results. For example, 95 percent confidence interval of plus-or-minus 2.8 percent means that we can be 95 percent certain that the true percentage of the population would be between 2.8 percent above or below the survey result.
Main HospitalBuilding, 62%
Off-site, 20%
Other On-site, 4%
Outpatient Center, 14%
Full-Time59%
Part-Time36%
On-Call3%
Other2%

Page 2 of 6
Question 3: Did you take any days off during the week of December 2, 2007?
No Days Off55%
Normal Day Off31%
Another Work Site2%
Other12%
About 57 percent of survey respondents reported they took no days off, 30 percent took a normal day off, and two percent reported to another work site during the week of December 2, 2007.
Question 4: What time did you start and end work each day?
0
20
40
60
80
100
120
140
160
12:00
AM
1:00 A
M
2:00 A
M
3:00 A
M
4:00 A
M
5:00 A
M
6:00 A
M
7:00 A
M
8:00 A
M
9:00 A
M
10:00
AM
11:00
AM
12:00
PM
1:00 P
M
2:00 P
M
3:00 P
M
4:00 P
M
5:00 P
M
6:00 P
M
7:00 P
M
8:00 P
M
9:00 P
M
10:00
PM
11:00
PM
Time of Day
Num
ber o
f Sur
veys
Start of ShiftEnd of Shift
About 71 percent of survey respondents started work between 6:00 and 10:00 AM. About 14 percent started work between 3:00 and 4:00 PM and about 7 percent started work between 11:00 PM and midnight. Similarly, about 70 percent ended work between 3:00 and 8:00 PM, 14 percent between 11 PM and midnight, and 8 percent between 7:00 and 8:00 AM.
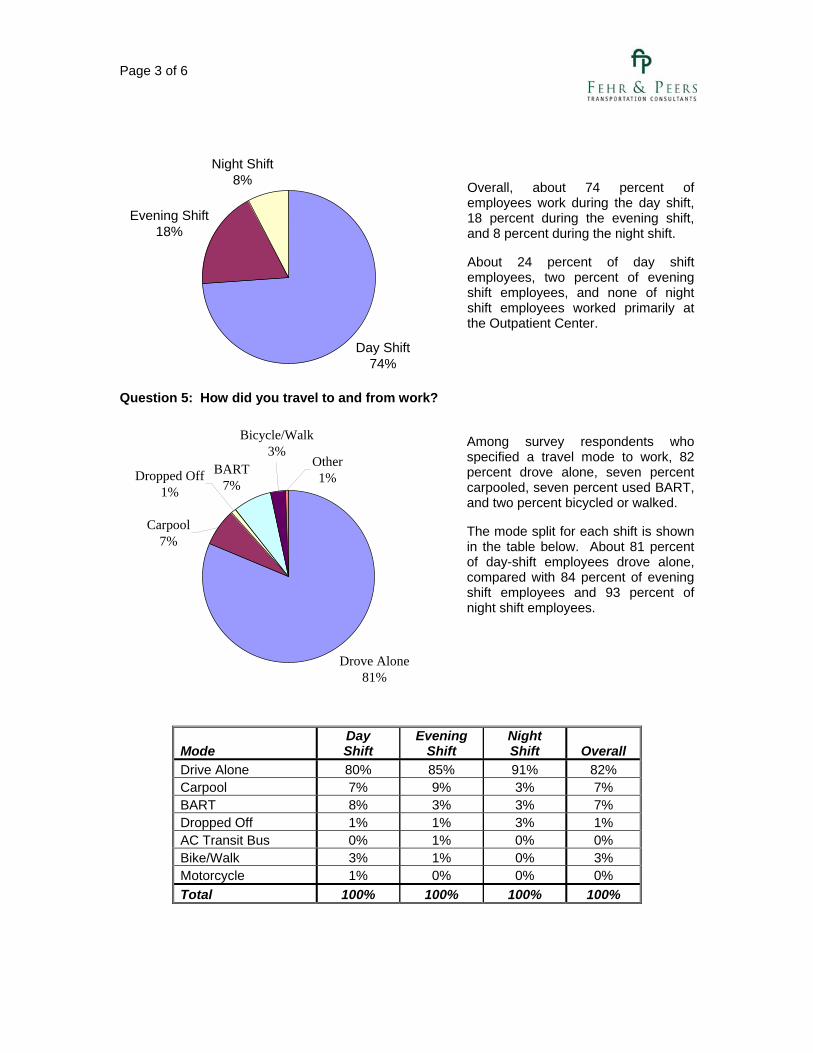
Page 3 of 6
Night Shift
Evening Shift18%
8%
Day Shift74%
Overall, about 74 percent of employees work during the day shift, 18 percent during the evening shift, and 8 percent during the night shift.
About 24 percent of day shift employees, two percent of evening shift employees, and none of night shift employees worked primarily at the Outpatient Center.
Question 5: How did you travel to and from work?
Drove Alone81%
BART7%
Carpool7%
Dropped Off1%
Bicycle/Walk3%
Other1%
Among survey respondents who specified a travel mode to work, 82 percent drove alone, seven percent carpooled, seven percent used BART, and two percent bicycled or walked.
The mode split for each shift is shown in the table below. About 81 percent of day-shift employees drove alone, compared with 84 percent of evening shift employees and 93 percent of night shift employees.
Mode Day Shift
Evening Shift
Night Shift Overall
Drive Alone 80% 85% 91% 82% Carpool 7% 9% 3% 7% BART 8% 3% 3% 7% Dropped Off 1% 1% 3% 1% AC Transit Bus 0% 1% 0% 0% Bike/Walk 3% 1% 0% 3% Motorcycle 1% 0% 0% 0% Total 100% 100% 100% 100%

Page 4 of 6
Question 6: If you drove in a carpool, how many people were in the vehicle?
About 70 percent of carpools consisted of two people, about 25 percent consisted of three people and the remaining five percent consisted of four or more people. The average vehicle occupancy for carpools, including the driver, is 2.4 persons per vehicle.
0
5
10
15
20
25
30
35
2 3 4 5
Number of People (Including Driver)
Num
ber o
f Sur
veys
Question 7: If you drove alone or were a passenger in a carpool, where did the driver park?
About 47 percent of drivers parked in the main garage, 25 percent parked in the West Lot, one percent parked in the Church Lot, eight percent parked on the street, one percent parked in the South Lot, three percent parked in other facilities and 16 percent of the employees who drove alone or were a passenger in a carpool did not specify where th
West Lot25%
Church Lot1%
South Lot1%
Other2%
Did Not Specify16%
On-Street8%
Main Garage/ Physicians'
Garage47%
ey parked.
About 83 percent of day shift employees who specified a parking location parked in the facilities operated by Children’s Hospital (i.e., Main Garage, West Lot, Church Lot, and South Lot); 95 percent of evening shift and 97 percent of night shift employees used these facilities.

Page 5 of 6
Question 8: If you parked on the street, how many blocks from Children’s Hospital did you park?
0
5
10
15
20
25
30
1-2 2-3 3-4 4-5 5-6
Number of Blocks Away
Num
ber o
f Sur
veys
Over half the survey respondents who parked on street parked within two blocks of the hospital. About a third parked between 2 and 3 blocks away, and a little more than 10 percent parked more than 3 blocks away.
Question 9: If you parked beyond walking distance to Children’s Hospital, how did you reach the hospital?
0
1
2
3
4
5
6
7
8
9
Children's Shuttle Other Other Shuttle
Mode
Num
ber o
f Sur
veys
Of the 17 survey respondents who indicated they parked beyond walking distance to Children’s Hospital, 6 used the Children’s Hospital Shuttle, and 1 use another shuttle. Of the 10 who stated they used another mode, one specified “taxi” and one specified “car,” but the other 8 did not specify how they reached the hospital.
Question 10: If you used BART, how did you reach the hospital from the BART station?
0
5
10
15
20
25
30
35
40
Children's Walk/Bike Other Shuttle Other
Num
ber o
f Sur
veys About 88 percent of BART users
traveled between the hospital and the MacArthur BART Station using the Children’s Hospital Shuttle. Others either walked or biked, used other shuttles, or other travel modes.
Shuttle
Mode

Page 6 of 6
11. Please indicate the number of times each day you travel off-campus by car during the course of your shift.
Less than 184%
2 or Less4%
3 or Less1%
More than 31%
Exactly 110%
About 84 percent of survey respondents travel off-campus less than one time per day by car. About 12 percent travel off-campus between one and two times a day by car, and 4 percent travel off-campus two or more times a day by car. This corresponds to about 0.26 round trips off-campus per employee, or 0.52 one-way trips.
Question 12: Please indicate the number of times each day you travel off-campus by walking or shuttle during the course of your shift.
Less than 185%
Exactly 110%
More than 31%
3 or Less1%
2 or Less3%
About 85 percent of survey respondents travel off-campus less than once per day by walking or shuttle. About 11 percent travel off-campus between 1 and 2 times a day, and four percent travel off-campus twice or more times a day by walking or shuttle. This corresponds to an average of 0.24 round trips off-campus per employee, or 0.48 trips accounting for trips both to and from the hospital.
Question 13: Comments
In addition to the specific questions included in the survey, the employees were asked to provide comments related to transportation and parking. This chart includes comments from all surveyed employees, not just those who work at the main campus. The most common issue in the employee comments was the need for additional parking supply, followed by concerns about crime, parking costs, shuttle services, the desire for designated staff parking, garage parking space size, pedestrian safety, and maintenance.
Parking Supply, 27% Safety - Crime,
24%
Parking Costs, 19%
Maintenance, 3%
Safety - Pedestrain, 3%
Spaces are too small, 5%
Shuttle Services, 12%
Designated Employee/Staff
Parking, 7%

a.m. / p.m.
a.m. / p.m.
a.m. / p.m.
a.m. / p.m.

Appendix C ‐ Survey Result Validation
Total Staff = 2,166
% on‐site on typical day = 90%
Staff Survey Results Day Evening Night
% Staff by Shift 74% 18% 8%
Drive Alone Mode Share 80% 85% 91%
Carpool Mode Share 7% 9% 3%
Dropped off Mode Share 1% 1% 3%
Trips per Staff per Day 2.5 2.5 2.5
Passengers per Carpool 2.4 2.4 2.4
Auto Trips per Day
Drive Alone Mode Share 2,885 746 355
Carpool 84 26 4
Dropped off 58 14 19
Total 3,027 786 377
Total Estimated Staff Daily Trip Generation = 4,190
Total Patients/Visitors = 1,456
Patient/Visitor Survey Results
All
Drive Alone Mode Share 21%
Carpool Mode Share 60%
Dropped off Mode Share 6%
Trips per Patient/Visitor per Day 2.5
Passengers per Carpool 2.7
Auto Trips per Day
Drive Alone Mode Share 764
Carpool 647
Dropped off 349
Total Estimated Patient/Visitor Daily Trip Generation = 1,761
Total Estimated Daily Trip Generation = 5,951
Total Observed Trip Generation = 5,690
% Difference = 4.6%
10/15/2013

Appendix D ‐ CHRCO Trip Generation by Hour and Parking Facility
Main Garage Physicians Garage West Lot South Lot Main Plaza Other/On‐Street Total
Hour Start In Out Total In Out Total In Out Total In Out Total In Out Total In Out Total In Out Total
12:30 AM 3 9 12 0 3 3 1 4 5 0 3 3 5 7 12 2 4 6 11 30 41
1:30 AM 2 7 9 1 2 3 0 1 1 1 2 3 5 4 9 1 2 3 10 18 28
2:30 AM 3 3 6 0 1 1 0 1 1 0 0 0 0 2 2 1 1 2 4 8 12
3:30 AM 3 4 7 0 1 1 1 2 3 0 0 0 8 7 15 2 2 4 14 16 30
4:30 AM 8 2 10 1 1 2 2 0 2 1 1 2 5 5 10 3 1 4 20 10 30
5:30 AM 45 6 51 6 1 7 27 0 27 1 4 5 8 7 15 15 3 18 102 21 123
6:30 AM 168 22 190 17 9 26 41 2 43 6 3 9 16 19 35 38 6 44 286 61 347
7:30 AM 146 71 217 30 27 57 42 6 48 14 3 17 26 24 50 40 16 56 298 147 445
8:30 AM 167 37 204 42 12 54 25 2 27 8 5 13 23 31 54 43 11 54 308 98 406
9:30 AM 85 49 134 34 11 45 8 0 8 10 4 14 28 28 56 34 15 49 199 107 306
10:30 AM 90 75 165 14 10 24 18 2 20 10 4 14 26 28 54 35 23 58 193 142 335
11:30 AM 76 97 173 9 12 21 7 2 9 8 9 17 29 29 58 27 30 57 156 179 335
12:30 PM 99 86 185 10 6 16 2 4 6 11 8 19 41 40 81 31 30 61 194 174 368
1:30 PM 106 80 186 10 6 16 17 5 22 6 9 15 29 28 57 35 27 62 203 155 358
2:30 PM 82 120 202 7 18 25 28 22 50 7 5 12 37 37 74 30 38 68 191 240 431
3:30 PM 47 179 226 3 28 31 4 58 62 9 12 21 23 31 54 17 57 74 103 365 468
4:30 PM 51 177 228 5 26 31 2 48 50 8 17 25 28 31 59 20 56 76 114 355 469
5:30 PM 28 118 146 5 14 19 1 14 15 6 6 12 19 25 44 10 36 46 69 213 282
6:30 PM 50 52 102 3 9 12 2 11 13 7 9 16 21 23 44 17 18 35 100 122 222
7:30 PM 14 62 76 1 7 8 2 11 13 2 5 7 14 15 29 7 17 24 40 117 157
8:30 PM 16 26 42 2 3 5 4 5 9 2 6 8 13 14 27 6 9 15 43 63 106
9:30 PM 13 25 38 3 5 8 2 3 5 3 4 7 10 8 18 5 8 13 36 53 89
10:30 PM 50 22 72 18 6 24 4 8 12 0 1 1 14 14 28 12 9 21 98 60 158
11:30 PM 5 40 45 1 9 10 3 35 38 1 3 4 9 13 22 3 15 18 22 115 137
Total 1,357 1,369 2,726 222 227 449 243 246 489 121 123 244 437 470 907 434 434 868 2,814 2,869 5,683
Garage data based on data collected on September 18, 2013
10/15/2013
g p ,
10/15/2013
Appendix F
LOS Calculation Worksheets – Existing Plus Phase 1 Conditions

HCM Signalized Intersection Capacity Analysis Children's Hospital1: MLK Way & 55th Street Existing AM Plus Phase 1
Fehr & Peers Synchro 8 Report
Movement EBL EBT EBR WBL WBT WBR NBU NBL NBT NBR SBL SBTLane ConfigurationsVolume (vph) 13 170 219 54 217 57 14 127 1341 59 52 1241Ideal Flow (vphpl) 1900 1900 1900 1900 1900 1900 1900 1900 1900 1900 1900 1900Total Lost time (s) 5.0 5.0 4.5 5.0 4.5 5.0Lane Util. Factor 1.00 1.00 1.00 0.91 1.00 0.91Frpb, ped/bikes 0.98 1.00 1.00 1.00 1.00 1.00Flpb, ped/bikes 1.00 1.00 1.00 1.00 1.00 1.00Frt 0.93 0.98 1.00 0.99 1.00 1.00Flt Protected 1.00 0.99 0.95 1.00 0.95 1.00Satd. Flow (prot) 1707 1759 1770 5039 1770 5064Flt Permitted 0.98 0.77 0.95 1.00 0.95 1.00Satd. Flow (perm) 1683 1364 1770 5039 1770 5064Peak-hour factor, PHF 1.00 1.00 1.00 1.00 1.00 1.00 1.00 1.00 1.00 1.00 1.00 1.00Adj. Flow (vph) 13 170 219 54 217 57 14 127 1341 59 52 1241RTOR Reduction (vph) 0 56 0 0 10 0 0 0 4 0 0 2Lane Group Flow (vph) 0 346 0 0 318 0 0 141 1396 0 52 1266Confl. Peds. (#/hr) 7 14 14 7 21Confl. Bikes (#/hr) 16 15 6Heavy Vehicles (%) 1% 1% 1% 4% 4% 4% 2% 2% 2% 2% 2% 2%Turn Type Perm NA Perm NA Prot Prot NA Prot NAProtected Phases 4 8 5 5 2 1 6Permitted Phases 4 8Actuated Green, G (s) 25.9 25.9 15.3 45.1 4.5 34.3Effective Green, g (s) 25.9 25.9 15.3 45.1 4.5 34.3Actuated g/C Ratio 0.29 0.29 0.17 0.50 0.05 0.38Clearance Time (s) 5.0 5.0 4.5 5.0 4.5 5.0Vehicle Extension (s) 3.0 3.0 3.0 3.0 3.0 3.0Lane Grp Cap (vph) 484 392 300 2525 88 1929v/s Ratio Prot 0.08 c0.28 0.03 c0.25v/s Ratio Perm 0.21 c0.23v/c Ratio 0.72 0.81 0.47 0.55 0.59 0.66Uniform Delay, d1 28.7 29.8 33.7 15.5 41.8 23.0Progression Factor 1.00 1.00 0.52 0.14 1.00 1.00Incremental Delay, d2 5.0 12.0 1.1 0.8 10.2 1.8Delay (s) 33.7 41.8 18.7 2.9 52.0 24.7Level of Service C D B A D CApproach Delay (s) 33.7 41.8 4.4 25.8Approach LOS C D A C
Intersection SummaryHCM 2000 Control Delay 19.0 HCM 2000 Level of Service BHCM 2000 Volume to Capacity ratio 0.70Actuated Cycle Length (s) 90.0 Sum of lost time (s) 14.5Intersection Capacity Utilization 85.3% ICU Level of Service EAnalysis Period (min) 15c Critical Lane Group
HCM Signalized Intersection Capacity Analysis Children's Hospital1: MLK Way & 55th Street Existing AM Plus Phase 1
Fehr & Peers Synchro 8 Report
Movement SBRLane ConfigurationsVolume (vph) 27Ideal Flow (vphpl) 1900Total Lost time (s)Lane Util. FactorFrpb, ped/bikesFlpb, ped/bikesFrtFlt ProtectedSatd. Flow (prot)Flt PermittedSatd. Flow (perm)Peak-hour factor, PHF 1.00Adj. Flow (vph) 27RTOR Reduction (vph) 0Lane Group Flow (vph) 0Confl. Peds. (#/hr) 12Confl. Bikes (#/hr) 7Heavy Vehicles (%) 2%Turn TypeProtected PhasesPermitted PhasesActuated Green, G (s)Effective Green, g (s)Actuated g/C RatioClearance Time (s)Vehicle Extension (s)Lane Grp Cap (vph)v/s Ratio Protv/s Ratio Permv/c RatioUniform Delay, d1Progression FactorIncremental Delay, d2Delay (s)Level of ServiceApproach Delay (s)Approach LOS
Intersection Summary

HCM Unsignalized Intersection Capacity Analysis Children's Hospital2: Dover Street & 55th Street Existing AM Plus Phase 1
Fehr & Peers Synchro 8 Report
Movement EBL EBT EBR WBL WBT WBR NBL NBT NBR SBL SBT SBRLane ConfigurationsVolume (veh/h) 18 259 6 20 296 6 7 8 11 8 6 21Sign Control Free Free Stop StopGrade 0% 0% 0% 0%Peak Hour Factor 1.00 1.00 1.00 1.00 1.00 1.00 1.00 1.00 1.00 1.00 1.00 1.00Hourly flow rate (vph) 18 259 6 20 296 6 7 8 11 8 6 21Pedestrians 9 20 15 6Lane Width (ft) 12.0 12.0 12.0 12.0Walking Speed (ft/s) 4.0 4.0 4.0 4.0Percent Blockage 1 2 1 1Right turn flare (veh)Median type None NoneMedian storage veh)Upstream signal (ft) 641 677pX, platoon unblocked 0.91 0.91 0.91 0.91 0.91 0.91vC, conflicting volume 308 280 685 661 297 678 661 314vC1, stage 1 conf volvC2, stage 2 conf volvCu, unblocked vol 185 280 601 575 297 593 575 192tC, single (s) 4.1 4.1 7.1 6.5 6.2 7.1 6.5 6.2tC, 2 stage (s)tF (s) 2.2 2.2 3.5 4.0 3.3 3.5 4.0 3.3p0 queue free % 99 98 98 98 98 98 98 97cM capacity (veh/h) 1237 1255 341 373 726 344 369 758
Direction, Lane # EB 1 WB 1 NB 1 SB 1Volume Total 283 322 26 35Volume Left 18 20 7 8Volume Right 6 6 11 21cSH 1237 1255 455 521Volume to Capacity 0.01 0.02 0.06 0.07Queue Length 95th (ft) 1 1 5 5Control Delay (s) 0.6 0.6 13.4 12.4Lane LOS A A B BApproach Delay (s) 0.6 0.6 13.4 12.4Approach LOS B B
Intersection SummaryAverage Delay 1.8Intersection Capacity Utilization 36.7% ICU Level of Service AAnalysis Period (min) 15
HCM Signalized Intersection Capacity Analysis Children's Hospital3: 55th Street & Shattuck Ave Existing AM Plus Phase 1
Fehr & Peers Synchro 8 Report
Movement EBL EBT EBR WBL WBT WBR NBL NBT NBR SBL SBT SBRLane ConfigurationsVolume (vph) 50 197 40 25 250 31 28 430 24 25 544 28Ideal Flow (vphpl) 1900 1900 1900 1900 1900 1900 1900 1900 1900 1900 1900 1900Total Lost time (s) 3.0 3.0 5.0 5.0Lane Util. Factor 1.00 1.00 1.00 1.00Frpb, ped/bikes 0.99 1.00 1.00 1.00Flpb, ped/bikes 1.00 1.00 1.00 1.00Frt 0.98 0.99 0.99 0.99Flt Protected 0.99 1.00 1.00 1.00Satd. Flow (prot) 1742 1803 1841 1861Flt Permitted 0.90 0.96 0.95 0.97Satd. Flow (perm) 1580 1743 1759 1813Peak-hour factor, PHF 1.00 1.00 1.00 1.00 1.00 1.00 1.00 1.00 1.00 1.00 1.00 1.00Adj. Flow (vph) 50 197 40 25 250 31 28 430 24 25 544 28RTOR Reduction (vph) 0 8 0 0 5 0 0 2 0 0 2 0Lane Group Flow (vph) 0 279 0 0 301 0 0 480 0 0 595 0Confl. Peds. (#/hr) 6 13 13 6 7 17 17 7Confl. Bikes (#/hr) 22 10 13 24Heavy Vehicles (%) 5% 5% 5% 3% 3% 3% 2% 2% 2% 1% 1% 1%Turn Type Perm NA Perm NA Perm NA Perm NAProtected Phases 2 6 4 8Permitted Phases 2 6 4 4 8Actuated Green, G (s) 25.0 25.0 47.0 47.0Effective Green, g (s) 25.0 25.0 47.0 47.0Actuated g/C Ratio 0.31 0.31 0.59 0.59Clearance Time (s) 3.0 3.0 5.0 5.0Lane Grp Cap (vph) 493 544 1033 1065v/s Ratio Protv/s Ratio Perm c0.18 0.17 0.27 c0.33v/c Ratio 0.57 0.55 0.46 0.56Uniform Delay, d1 23.0 22.9 9.4 10.1Progression Factor 1.00 1.00 1.00 1.00Incremental Delay, d2 4.7 4.0 1.5 2.1Delay (s) 27.6 26.9 10.9 12.2Level of Service C C B BApproach Delay (s) 27.6 26.9 10.9 12.2Approach LOS C C B B
Intersection SummaryHCM 2000 Control Delay 17.2 HCM 2000 Level of Service BHCM 2000 Volume to Capacity ratio 0.56Actuated Cycle Length (s) 80.0 Sum of lost time (s) 8.0Intersection Capacity Utilization 73.8% ICU Level of Service DAnalysis Period (min) 15c Critical Lane Group

HCM Signalized Intersection Capacity Analysis Children's Hospital4: 55th Street & Telegraph Ave Existing AM Plus Phase 1
Fehr & Peers Synchro 8 Report
Movement EBL EBT EBR WBL WBT WBR NBL NBT NBR SBL SBT SBRLane ConfigurationsVolume (vph) 146 14 77 32 10 9 58 707 40 27 810 236Ideal Flow (vphpl) 1900 1900 1900 1900 1900 1900 1900 1900 1900 1900 1900 1900Total Lost time (s) 4.5 4.5 4.5 4.5 4.5 4.5Lane Util. Factor 1.00 1.00 1.00 0.95 1.00 0.95Frpb, ped/bikes 0.99 0.99 1.00 1.00 1.00 0.99Flpb, ped/bikes 1.00 1.00 1.00 1.00 0.99 1.00Frt 0.96 0.98 1.00 0.99 1.00 0.97Flt Protected 0.97 0.97 0.95 1.00 0.95 1.00Satd. Flow (prot) 1654 1713 1761 3496 1768 3406Flt Permitted 0.78 0.79 0.23 1.00 0.35 1.00Satd. Flow (perm) 1333 1404 429 3496 643 3406Peak-hour factor, PHF 1.00 1.00 1.00 1.00 1.00 1.00 1.00 1.00 1.00 1.00 1.00 1.00Adj. Flow (vph) 146 14 77 32 10 9 58 707 40 27 810 236RTOR Reduction (vph) 0 30 0 0 7 0 0 4 0 0 29 0Lane Group Flow (vph) 0 207 0 0 44 0 58 743 0 27 1017 0Confl. Peds. (#/hr) 6 11 11 6 13 17 17 13Confl. Bikes (#/hr) 15 15 43 27Heavy Vehicles (%) 5% 5% 5% 4% 4% 4% 2% 2% 2% 1% 1% 1%Turn Type Perm NA Perm NA Perm NA Perm NAProtected Phases 4 8 2 6Permitted Phases 4 8 2 6Actuated Green, G (s) 16.7 16.7 44.3 44.3 44.3 44.3Effective Green, g (s) 16.7 16.7 44.3 44.3 44.3 44.3Actuated g/C Ratio 0.24 0.24 0.63 0.63 0.63 0.63Clearance Time (s) 4.5 4.5 4.5 4.5 4.5 4.5Vehicle Extension (s) 3.0 3.0 3.0 3.0 3.0 3.0Lane Grp Cap (vph) 318 334 271 2212 406 2155v/s Ratio Prot 0.21 c0.30v/s Ratio Perm c0.16 0.03 0.14 0.04v/c Ratio 0.65 0.13 0.21 0.34 0.07 0.47Uniform Delay, d1 24.0 21.0 5.5 6.0 4.9 6.7Progression Factor 1.00 1.00 1.00 1.00 1.00 1.00Incremental Delay, d2 4.7 0.2 1.8 0.4 0.3 0.7Delay (s) 28.8 21.1 7.3 6.4 5.2 7.5Level of Service C C A A A AApproach Delay (s) 28.8 21.1 6.5 7.4Approach LOS C C A A
Intersection SummaryHCM 2000 Control Delay 9.7 HCM 2000 Level of Service AHCM 2000 Volume to Capacity ratio 0.52Actuated Cycle Length (s) 70.0 Sum of lost time (s) 9.0Intersection Capacity Utilization 62.0% ICU Level of Service BAnalysis Period (min) 15c Critical Lane Group
HCM Unsignalized Intersection Capacity Analysis Children's Hospital5: MLK Way & 54th Street Existing AM Plus Phase 1
Fehr & Peers Synchro 8 Report
Movement EBL EBT EBR WBL WBT WBR NBU NBL NBT NBR SBL SBTLane ConfigurationsVolume (veh/h) 4 3 43 5 3 8 10 15 1517 10 5 1488Sign Control Stop Stop Free FreeGrade 0% 0% 0% 0%Peak Hour Factor 1.00 1.00 1.00 1.00 1.00 1.00 1.00 1.00 1.00 1.00 1.00 1.00Hourly flow rate (vph) 4 3 43 5 3 8 0 15 1517 10 5 1488Pedestrians 7 6 8Lane Width (ft) 12.0 12.0 12.0Walking Speed (ft/s) 4.0 4.0 4.0Percent Blockage 1 1 1Right turn flare (veh)Median type None NoneMedian storage veh)Upstream signal (ft) 299 294pX, platoon unblocked 0.87 0.87 0.80 0.87 0.87 0.86 0.00 0.80 0.86vC, conflicting volume 2054 3072 514 2116 3070 517 0 1502 1533vC1, stage 1 conf volvC2, stage 2 conf volvCu, unblocked vol 586 1756 0 658 1754 0 0 749 1041tC, single (s) 7.5 6.5 6.9 7.5 6.5 6.9 0.0 4.1 4.1tC, 2 stage (s)tF (s) 3.5 4.0 3.3 *5.0 *5.0 *5.0 0.0 2.2 2.2p0 queue free % 99 96 95 98 96 99 0 98 99cM capacity (veh/h) 318 72 861 214 68 615 0 680 572
Direction, Lane # EB 1 WB 1 NB 1 NB 2 NB 3 SB 1 SB 2 SB 3Volume Total 50 16 394 758 389 377 744 379Volume Left 4 5 15 0 0 5 0 0Volume Right 43 8 0 0 10 0 0 7cSH 479 198 680 1700 1700 572 1700 1700Volume to Capacity 0.10 0.08 0.02 0.45 0.23 0.01 0.44 0.22Queue Length 95th (ft) 9 7 2 0 0 1 0 0Control Delay (s) 13.4 24.8 0.7 0.0 0.0 0.3 0.0 0.0Lane LOS B C A AApproach Delay (s) 13.4 24.8 0.2 0.1Approach LOS B C
Intersection SummaryAverage Delay 0.5Intersection Capacity Utilization 59.9% ICU Level of Service BAnalysis Period (min) 15
* User Entered Value

HCM Unsignalized Intersection Capacity Analysis Children's Hospital5: MLK Way & 54th Street Existing AM Plus Phase 1
Fehr & Peers Synchro 8 Report
Movement SBRLane ConfigurationsVolume (veh/h) 7Sign ControlGradePeak Hour Factor 1.00Hourly flow rate (vph) 7PedestriansLane Width (ft)Walking Speed (ft/s)Percent BlockageRight turn flare (veh)Median typeMedian storage veh)Upstream signal (ft)pX, platoon unblockedvC, conflicting volumevC1, stage 1 conf volvC2, stage 2 conf volvCu, unblocked voltC, single (s)tC, 2 stage (s)tF (s)p0 queue free %cM capacity (veh/h)
Direction, Lane #
HCM Unsignalized Intersection Capacity Analysis Children's Hospital6: Dover Street & 54th Street Existing AM Plus Phase 1
Fehr & Peers Synchro 8 Report
Movement EBL EBT EBR WBL WBT WBR NBL NBT NBR SBL SBT SBRLane ConfigurationsVolume (veh/h) 5 5 6 4 6 9 8 17 11 4 33 5Sign Control Stop Stop Free FreeGrade 0% 0% 0% 0%Peak Hour Factor 1.00 1.00 1.00 1.00 1.00 1.00 1.00 1.00 1.00 1.00 1.00 1.00Hourly flow rate (vph) 5 5 6 4 6 9 8 17 11 4 33 5Pedestrians 10 14 2 6Lane Width (ft) 12.0 12.0 12.0 12.0Walking Speed (ft/s) 4.0 4.0 4.0 4.0Percent Blockage 1 1 0 1Right turn flare (veh)Median type None NoneMedian storage veh)Upstream signal (ft)pX, platoon unblockedvC, conflicting volume 110 112 48 106 108 42 48 42vC1, stage 1 conf volvC2, stage 2 conf volvCu, unblocked vol 110 112 48 106 108 42 48 42tC, single (s) 7.1 6.5 6.2 7.1 6.5 6.2 4.1 4.1tC, 2 stage (s)tF (s) 3.5 4.0 3.3 3.5 4.0 3.3 2.2 2.2p0 queue free % 99 99 99 100 99 99 99 100cM capacity (veh/h) 831 761 1017 839 764 1017 1559 1562
Direction, Lane # EB 1 WB 1 NB 1 SB 1Volume Total 16 19 36 42Volume Left 5 4 8 4Volume Right 6 9 11 5cSH 865 885 1559 1562Volume to Capacity 0.02 0.02 0.01 0.00Queue Length 95th (ft) 1 2 0 0Control Delay (s) 9.2 9.2 1.7 0.7Lane LOS A A A AApproach Delay (s) 9.2 9.2 1.7 0.7Approach LOS A A
Intersection SummaryAverage Delay 3.6Intersection Capacity Utilization 19.4% ICU Level of Service AAnalysis Period (min) 15

HCM Unsignalized Intersection Capacity Analysis Children's Hospital7: Shattuck Ave & 54th Street Existing AM Plus Phase 1
Fehr & Peers Synchro 8 Report
Movement EBL EBR NBL NBT SBT SBRLane ConfigurationsVolume (veh/h) 1 14 12 487 587 5Sign Control Stop Free FreeGrade 0% 0% 0%Peak Hour Factor 1.00 1.00 1.00 1.00 1.00 1.00Hourly flow rate (vph) 1 14 12 487 587 5Pedestrians 9 2 1Lane Width (ft) 12.0 12.0 12.0Walking Speed (ft/s) 4.0 4.0 4.0Percent Blockage 1 0 0Right turn flare (veh)Median type None NoneMedian storage veh)Upstream signal (ft) 550 282pX, platoon unblocked 0.81 0.81 0.81vC, conflicting volume 1110 600 601vC1, stage 1 conf volvC2, stage 2 conf volvCu, unblocked vol 1005 386 387tC, single (s) 6.4 6.2 4.1tC, 2 stage (s)tF (s) 3.5 3.3 2.2p0 queue free % 100 97 99cM capacity (veh/h) 214 533 939
Direction, Lane # EB 1 NB 1 SB 1Volume Total 15 499 592Volume Left 1 12 0Volume Right 14 0 5cSH 485 939 1700Volume to Capacity 0.03 0.01 0.35Queue Length 95th (ft) 2 1 0Control Delay (s) 12.7 0.4 0.0Lane LOS B AApproach Delay (s) 12.7 0.4 0.0Approach LOS B
Intersection SummaryAverage Delay 0.3Intersection Capacity Utilization 45.9% ICU Level of Service AAnalysis Period (min) 15
HCM Signalized Intersection Capacity Analysis Children's Hospital8: MLK Way & 53rd Street Existing AM Plus Phase 1
Fehr & Peers Synchro 8 Report
Movement EBL EBT EBR WBL WBT WBR NBL NBT NBR SBL SBT SBRLane ConfigurationsVolume (vph) 4 4 34 13 4 12 21 1546 30 11 1549 5Ideal Flow (vphpl) 1900 1900 1900 1900 1900 1900 1900 1900 1900 1900 1900 1900Total Lost time (s) 5.0 5.0 4.0 3.5 4.0 3.5Lane Util. Factor 1.00 1.00 1.00 0.91 1.00 0.91Frpb, ped/bikes 0.98 0.99 1.00 1.00 1.00 1.00Flpb, ped/bikes 1.00 1.00 1.00 1.00 1.00 1.00Frt 0.89 0.94 1.00 1.00 1.00 1.00Flt Protected 1.00 0.98 0.95 1.00 0.95 1.00Satd. Flow (prot) 1623 1736 1770 5065 1787 5132Flt Permitted 0.98 0.89 0.95 1.00 0.95 1.00Satd. Flow (perm) 1598 1574 1770 5065 1787 5132Peak-hour factor, PHF 1.00 1.00 1.00 1.00 1.00 1.00 1.00 1.00 1.00 1.00 1.00 1.00Adj. Flow (vph) 4 4 34 13 4 12 21 1546 30 11 1549 5RTOR Reduction (vph) 0 29 0 0 10 0 0 1 0 0 0 0Lane Group Flow (vph) 0 13 0 0 19 0 21 1575 0 11 1554 0Confl. Peds. (#/hr) 7 13 13 7 13 20Confl. Bikes (#/hr) 5 13Heavy Vehicles (%) 2% 2% 2% 0% 0% 0% 2% 2% 2% 1% 1% 1%Turn Type Perm NA Perm NA Prot NA Prot NAProtected Phases 4 8 5 2 1 6Permitted Phases 4 8Actuated Green, G (s) 14.5 14.5 3.0 61.2 1.8 60.0Effective Green, g (s) 14.5 14.5 3.0 61.2 1.8 60.0Actuated g/C Ratio 0.16 0.16 0.03 0.68 0.02 0.67Clearance Time (s) 5.0 5.0 4.0 3.5 4.0 3.5Vehicle Extension (s) 3.0 3.0 3.0 3.0 3.0 3.0Lane Grp Cap (vph) 257 253 59 3444 35 3421v/s Ratio Prot 0.01 c0.31 0.01 c0.30v/s Ratio Perm 0.01 c0.01v/c Ratio 0.05 0.07 0.36 0.46 0.31 0.45Uniform Delay, d1 31.9 32.1 42.6 6.7 43.5 7.2Progression Factor 1.00 1.01 1.17 0.49 0.51 0.22Incremental Delay, d2 0.1 0.1 3.1 0.4 4.2 0.4Delay (s) 32.0 32.6 53.0 3.7 26.5 2.0Level of Service C C D A C AApproach Delay (s) 32.0 32.6 4.3 2.1Approach LOS C C A A
Intersection SummaryHCM 2000 Control Delay 3.9 HCM 2000 Level of Service AHCM 2000 Volume to Capacity ratio 0.40Actuated Cycle Length (s) 90.0 Sum of lost time (s) 12.5Intersection Capacity Utilization 52.5% ICU Level of Service AAnalysis Period (min) 15c Critical Lane Group

HCM Unsignalized Intersection Capacity Analysis Children's Hospital9: Dover Street & 53rd Street Existing AM Plus Phase 1
Fehr & Peers Synchro 8 Report
Movement EBL EBT EBR WBL WBT WBR NBL NBT NBR SBL SBT SBRLane ConfigurationsVolume (veh/h) 11 2 24 3 3 6 13 21 11 2 26 18Sign Control Stop Stop Free FreeGrade 0% 0% 0% 0%Peak Hour Factor 1.00 1.00 1.00 1.00 1.00 1.00 1.00 1.00 1.00 1.00 1.00 1.00Hourly flow rate (vph) 11 2 24 3 3 6 13 21 11 2 26 18Pedestrians 22 21 2 2Lane Width (ft) 12.0 12.0 12.0 12.0Walking Speed (ft/s) 4.0 4.0 4.0 4.0Percent Blockage 2 2 0 0Right turn flare (veh)Median type None NoneMedian storage veh)Upstream signal (ft)pX, platoon unblockedvC, conflicting volume 123 140 59 140 144 50 66 53vC1, stage 1 conf volvC2, stage 2 conf volvCu, unblocked vol 123 140 59 140 144 50 66 53tC, single (s) 7.1 6.5 6.2 7.1 6.5 6.2 4.1 4.1tC, 2 stage (s)tF (s) 3.5 4.0 3.3 3.5 4.0 3.3 2.2 2.2p0 queue free % 99 100 98 100 100 99 99 100cM capacity (veh/h) 803 721 992 770 718 1005 1520 1538
Direction, Lane # EB 1 WB 1 NB 1 SB 1Volume Total 37 12 45 46Volume Left 11 3 13 2Volume Right 24 6 11 18cSH 910 854 1520 1538Volume to Capacity 0.04 0.01 0.01 0.00Queue Length 95th (ft) 3 1 1 0Control Delay (s) 9.1 9.3 2.2 0.3Lane LOS A A A AApproach Delay (s) 9.1 9.3 2.2 0.3Approach LOS A A
Intersection SummaryAverage Delay 4.0Intersection Capacity Utilization 21.4% ICU Level of Service AAnalysis Period (min) 15
HCM Signalized Intersection Capacity Analysis Children's Hospital10: MLK Way & 52nd Street Existing AM Plus Phase 1
Fehr & Peers Synchro 8 Report
Movement EBL EBT EBR WBL WBT WBR NBU NBL NBT NBR SBU SBLLane ConfigurationsVolume (vph) 38 77 100 65 80 235 50 56 1475 53 25 84Ideal Flow (vphpl) 1900 1900 1900 1900 1900 1900 1900 1900 1900 1900 1900 1900Total Lost time (s) 5.0 5.0 5.0 5.0 4.5 4.5 4.0Lane Util. Factor 1.00 1.00 1.00 1.00 1.00 0.91 1.00Frpb, ped/bikes 1.00 0.97 1.00 0.98 1.00 1.00 1.00Flpb, ped/bikes 0.99 1.00 0.99 1.00 1.00 1.00 1.00Frt 1.00 0.92 1.00 0.85 1.00 0.99 1.00Flt Protected 0.95 1.00 0.98 1.00 0.95 1.00 0.95Satd. Flow (prot) 1775 1665 1796 1544 1787 5105 1787Flt Permitted 0.64 1.00 0.77 1.00 0.95 1.00 0.95Satd. Flow (perm) 1189 1665 1423 1544 1787 5105 1787Peak-hour factor, PHF 1.00 1.00 1.00 1.00 1.00 1.00 1.00 1.00 1.00 1.00 1.00 1.00Adj. Flow (vph) 38 77 100 65 80 235 50 56 1475 53 25 84RTOR Reduction (vph) 0 60 0 0 0 177 0 0 4 0 0 0Lane Group Flow (vph) 38 117 0 0 145 58 0 106 1524 0 0 109Confl. Peds. (#/hr) 10 49 49 10 7Confl. Bikes (#/hr) 6 5 1Heavy Vehicles (%) 1% 1% 1% 2% 2% 2% 1% 1% 1% 1% 1% 1%Turn Type Perm NA Perm NA Perm Prot Prot NA Prot ProtProtected Phases 4 8 5 5 2 1 1Permitted Phases 4 8 8Actuated Green, G (s) 22.2 22.2 22.2 22.2 7.2 44.3 10.0Effective Green, g (s) 22.2 22.2 22.2 22.2 7.2 44.3 10.0Actuated g/C Ratio 0.25 0.25 0.25 0.25 0.08 0.49 0.11Clearance Time (s) 5.0 5.0 5.0 5.0 4.5 4.5 4.0Vehicle Extension (s) 2.0 2.0 2.0 2.0 2.0 2.0 2.0Lane Grp Cap (vph) 293 410 351 380 142 2512 198v/s Ratio Prot 0.07 0.06 c0.30 0.06v/s Ratio Perm 0.03 c0.10 0.04v/c Ratio 0.13 0.29 0.41 0.15 0.75 0.61 0.55Uniform Delay, d1 26.4 27.5 28.4 26.5 40.5 16.5 37.9Progression Factor 1.00 1.00 1.00 1.00 0.99 1.05 0.77Incremental Delay, d2 0.1 0.1 0.3 0.1 8.6 0.5 1.7Delay (s) 26.5 27.6 28.7 26.6 48.9 18.0 30.8Level of Service C C C C D B CApproach Delay (s) 27.4 27.4 20.0Approach LOS C C B
Intersection SummaryHCM 2000 Control Delay 18.3 HCM 2000 Level of Service BHCM 2000 Volume to Capacity ratio 0.56Actuated Cycle Length (s) 90.0 Sum of lost time (s) 14.0Intersection Capacity Utilization 92.9% ICU Level of Service FAnalysis Period (min) 15c Critical Lane Group

HCM Signalized Intersection Capacity Analysis Children's Hospital10: MLK Way & 52nd Street Existing AM Plus Phase 1
Fehr & Peers Synchro 8 Report
Movement SBT SBRLane ConfigurationsVolume (vph) 1477 0Ideal Flow (vphpl) 1900 1900Total Lost time (s) 4.5Lane Util. Factor 0.91Frpb, ped/bikes 1.00Flpb, ped/bikes 1.00Frt 1.00Flt Protected 1.00Satd. Flow (prot) 5136Flt Permitted 1.00Satd. Flow (perm) 5136Peak-hour factor, PHF 1.00 1.00Adj. Flow (vph) 1477 0RTOR Reduction (vph) 0 0Lane Group Flow (vph) 1477 0Confl. Peds. (#/hr) 10Confl. Bikes (#/hr) 10Heavy Vehicles (%) 1% 1%Turn Type NAProtected Phases 6Permitted PhasesActuated Green, G (s) 46.6Effective Green, g (s) 46.6Actuated g/C Ratio 0.52Clearance Time (s) 4.5Vehicle Extension (s) 2.0Lane Grp Cap (vph) 2659v/s Ratio Prot c0.29v/s Ratio Permv/c Ratio 0.56Uniform Delay, d1 14.7Progression Factor 0.75Incremental Delay, d2 0.8Delay (s) 11.8Level of Service BApproach Delay (s) 13.1Approach LOS B
Intersection Summary
HCM Signalized Intersection Capacity Analysis Children's Hospital11: 52nd Street & Garage Existing AM Plus Phase 1
Fehr & Peers Synchro 8 Report
Movement EBL EBT EBR WBL WBT WBR NBL NBT NBR SBL SBT SBRLane ConfigurationsVolume (vph) 4 202 8 6 352 2 15 7 10 0 2 15Ideal Flow (vphpl) 1900 1900 1900 1900 1900 1900 1900 1900 1900 1900 1900 1900Total Lost time (s) 3.0 3.0 3.0 3.0Lane Util. Factor 0.95 0.95 1.00 1.00Frpb, ped/bikes 1.00 1.00 0.96 0.99Flpb, ped/bikes 1.00 1.00 1.00 1.00Frt 0.99 1.00 0.96 0.88Flt Protected 1.00 1.00 0.98 1.00Satd. Flow (prot) 3499 3598 1465 1655Flt Permitted 0.95 0.95 0.94 1.00Satd. Flow (perm) 3341 3425 1404 1655Peak-hour factor, PHF 1.00 1.00 1.00 1.00 1.00 1.00 1.00 1.00 1.00 1.00 1.00 1.00Adj. Flow (vph) 4 202 8 6 352 2 15 7 10 0 2 15RTOR Reduction (vph) 0 5 0 0 1 0 0 5 0 0 8 0Lane Group Flow (vph) 0 209 0 0 359 0 0 27 0 0 9 0Confl. Peds. (#/hr) 17 55 55 17 202 202Confl. Bikes (#/hr) 6 5 1Heavy Vehicles (%) 2% 2% 2% 0% 0% 0% 16% 16% 16% 0% 0% 0%Turn Type Prot NA Perm NA Perm NA NAProtected Phases 5 2 6 4 8Permitted Phases 6 4 8Actuated Green, G (s) 21.0 14.0 23.0 23.0Effective Green, g (s) 21.0 14.0 23.0 23.0Actuated g/C Ratio 0.42 0.28 0.46 0.46Clearance Time (s) 3.0 3.0 3.0 3.0Lane Grp Cap (vph) 1415 959 645 761v/s Ratio Prot c0.01 0.01v/s Ratio Perm 0.05 c0.10 c0.02v/c Ratio 0.15 0.37 0.04 0.01Uniform Delay, d1 9.0 14.5 7.4 7.3Progression Factor 1.00 1.00 1.00 1.00Incremental Delay, d2 0.2 1.1 0.1 0.0Delay (s) 9.2 15.6 7.6 7.4Level of Service A B A AApproach Delay (s) 9.2 15.6 7.6 7.4Approach LOS A B A A
Intersection SummaryHCM 2000 Control Delay 12.8 HCM 2000 Level of Service BHCM 2000 Volume to Capacity ratio 0.17Actuated Cycle Length (s) 50.0 Sum of lost time (s) 9.0Intersection Capacity Utilization 39.9% ICU Level of Service AAnalysis Period (min) 15c Critical Lane Group

HCM Unsignalized Intersection Capacity Analysis Children's Hospital12: 52nd Street & Dover Street Existing AM Plus Phase 1
Fehr & Peers Synchro 8 Report
Movement EBL EBT EBR WBL WBT WBR NBL NBT NBR SBL SBT SBRLane ConfigurationsVolume (veh/h) 19 189 1 11 329 27 3 0 7 35 3 25Sign Control Free Free Stop StopGrade 0% 0% 0% 0%Peak Hour Factor 1.00 1.00 1.00 1.00 1.00 1.00 1.00 1.00 1.00 1.00 1.00 1.00Hourly flow rate (vph) 19 189 1 11 329 27 3 0 7 35 3 25Pedestrians 20 10 12 23Lane Width (ft) 12.0 12.0 12.0 12.0Walking Speed (ft/s) 4.0 4.0 4.0 4.0Percent Blockage 2 1 1 2Right turn flare (veh)Median type None NoneMedian storage veh)Upstream signal (ft) 312 647pX, platoon unblocked 0.91 0.95 0.93 0.93 0.95 0.93 0.93 0.91vC, conflicting volume 379 202 650 640 212 632 628 386vC1, stage 1 conf volvC2, stage 2 conf volvCu, unblocked vol 266 132 467 456 142 447 442 273tC, single (s) 4.1 4.1 7.2 6.6 6.3 7.1 6.5 6.2tC, 2 stage (s)tF (s) 2.2 2.2 3.6 4.1 3.4 3.5 4.0 3.3p0 queue free % 98 99 99 100 99 92 99 96cM capacity (veh/h) 1151 1371 412 433 824 454 454 675
Direction, Lane # EB 1 WB 1 NB 1 SB 1Volume Total 209 367 10 63Volume Left 19 11 3 35Volume Right 1 27 7 25cSH 1151 1371 634 522Volume to Capacity 0.02 0.01 0.02 0.12Queue Length 95th (ft) 1 1 1 10Control Delay (s) 0.9 0.3 10.8 12.8Lane LOS A A B BApproach Delay (s) 0.9 0.3 10.8 12.8Approach LOS B B
Intersection SummaryAverage Delay 1.9Intersection Capacity Utilization 38.5% ICU Level of Service AAnalysis Period (min) 15
HCM Unsignalized Intersection Capacity Analysis Children's Hospital13: SR-24 NB Off-Ramp & 52nd Street Existing AM Plus Phase 1
Fehr & Peers Synchro 8 Report
Movement EBL EBT EBR WBL WBT WBR NBL NBR SEL SERLane ConfigurationsVolume (veh/h) 0 223 0 0 371 1076 0 898 0 0Sign Control Free Free Stop StopGrade 0% 0% 0% 0%Peak Hour Factor 1.00 1.00 1.00 1.00 1.00 1.00 1.00 1.00 1.00 1.00Hourly flow rate (vph) 0 223 0 0 371 1076 0 898 0 0Pedestrians 24Lane Width (ft) 12.0Walking Speed (ft/s) 4.0Percent Blockage 2Right turn flare (veh)Median type None NoneMedian storage veh)Upstream signal (ft) 767 192pX, platoon unblocked 0.83 0.83 0.83 0.83vC, conflicting volume 1447 247 1694 136 1380 618vC1, stage 1 conf volvC2, stage 2 conf volvCu, unblocked vol 1132 247 1429 136 1052 135tC, single (s) 4.1 4.1 6.5 7.0 7.5 6.5tC, 2 stage (s)tF (s) 2.2 2.2 4.0 3.3 3.5 4.0p0 queue free % 100 100 100 0 0 100cM capacity (veh/h) 510 1290 109 867 0 615
Direction, Lane # EB 1 EB 2 WB 1 WB 2 WB 3 NB 1 NB 2Volume Total 112 112 247 482 717 449 449Volume Left 0 0 0 0 0 0 0Volume Right 0 0 0 359 717 449 449cSH 1700 1700 1700 1700 1700 867 867Volume to Capacity 0.07 0.07 0.15 0.28 0.42 0.52 0.52Queue Length 95th (ft) 0 0 0 0 0 76 76Control Delay (s) 0.0 0.0 0.0 0.0 0.0 13.5 13.5Lane LOS B BApproach Delay (s) 0.0 0.0 13.5Approach LOS B
Intersection SummaryAverage Delay 4.7Intersection Capacity Utilization 48.2% ICU Level of Service AAnalysis Period (min) 15

HCM Signalized Intersection Capacity Analysis Children's Hospital14: 52nd Street & Shattuck Ave Existing AM Plus Phase 1
Fehr & Peers Synchro 8 Report
Movement EBU EBL EBT EBR WBL WBT WBR NBL NBT NBR SBL SBTLane ConfigurationsVolume (vph) 40 285 683 148 24 871 82 154 123 30 96 136Ideal Flow (vphpl) 1900 1900 1900 1900 1900 1900 1900 1900 1900 1900 1900 1900Total Lost time (s) 4.0 4.5 4.0 4.5 4.0 5.5 5.5Lane Util. Factor 1.00 0.91 1.00 0.91 1.00 1.00 1.00Frpb, ped/bikes 1.00 0.99 1.00 1.00 1.00 0.99 1.00Flpb, ped/bikes 1.00 1.00 1.00 1.00 1.00 1.00 1.00Frt 1.00 0.97 1.00 0.99 1.00 0.97 1.00Flt Protected 0.95 1.00 0.95 1.00 0.95 1.00 0.98Satd. Flow (prot) 1787 4944 1805 5105 1752 1781 1734Flt Permitted 0.95 1.00 0.95 1.00 0.44 1.00 0.80Satd. Flow (perm) 1787 4944 1805 5105 809 1781 1410Peak-hour factor, PHF 1.00 1.00 1.00 1.00 1.00 1.00 1.00 1.00 1.00 1.00 1.00 1.00Adj. Flow (vph) 40 285 683 148 24 871 82 154 123 30 96 136RTOR Reduction (vph) 0 0 31 0 0 12 0 0 10 0 0 0Lane Group Flow (vph) 0 325 800 0 24 941 0 154 143 0 0 232Confl. Peds. (#/hr) 12 5 10 10Confl. Bikes (#/hr) 12 1 10Heavy Vehicles (%) 1% 1% 1% 1% 0% 0% 0% 3% 3% 3% 7% 7%Turn Type Prot Prot NA Prot NA pm+pt NA Perm NAProtected Phases 7 7 4 3 8 5 2 6Permitted Phases 2 6Actuated Green, G (s) 21.5 37.7 3.2 19.4 35.1 35.1 24.6Effective Green, g (s) 21.5 37.7 3.2 19.4 35.1 35.1 24.6Actuated g/C Ratio 0.24 0.42 0.04 0.22 0.39 0.39 0.27Clearance Time (s) 4.0 4.5 4.0 4.5 4.0 5.5 5.5Vehicle Extension (s) 3.0 3.0 3.0 3.0 3.0 3.0 3.0Lane Grp Cap (vph) 426 2070 64 1100 383 694 385v/s Ratio Prot c0.18 0.16 0.01 c0.18 c0.03 0.08v/s Ratio Perm 0.13 c0.16v/c Ratio 0.76 0.39 0.38 0.86 0.40 0.21 0.60Uniform Delay, d1 31.9 18.1 42.4 34.0 18.8 18.2 28.4Progression Factor 1.00 1.00 1.22 0.83 1.00 1.00 1.00Incremental Delay, d2 12.2 0.5 3.0 7.2 0.7 0.7 6.8Delay (s) 44.1 18.7 54.7 35.5 19.5 18.9 35.3Level of Service D B D D B B DApproach Delay (s) 25.8 36.0 19.2 30.3Approach LOS C D B C
Intersection SummaryHCM 2000 Control Delay 29.3 HCM 2000 Level of Service CHCM 2000 Volume to Capacity ratio 0.70Actuated Cycle Length (s) 90.0 Sum of lost time (s) 18.0Intersection Capacity Utilization 100.3% ICU Level of Service GAnalysis Period (min) 15c Critical Lane Group
HCM Signalized Intersection Capacity Analysis Children's Hospital14: 52nd Street & Shattuck Ave Existing AM Plus Phase 1
Fehr & Peers Synchro 8 Report
Movement SBRLane ConfigurationsVolume (vph) 376Ideal Flow (vphpl) 1900Total Lost time (s) 5.5Lane Util. Factor 1.00Frpb, ped/bikes 0.94Flpb, ped/bikes 1.00Frt 0.85Flt Protected 1.00Satd. Flow (prot) 1419Flt Permitted 1.00Satd. Flow (perm) 1419Peak-hour factor, PHF 1.00Adj. Flow (vph) 376RTOR Reduction (vph) 273Lane Group Flow (vph) 103Confl. Peds. (#/hr) 16Confl. Bikes (#/hr) 41Heavy Vehicles (%) 7%Turn Type PermProtected PhasesPermitted Phases 6Actuated Green, G (s) 24.6Effective Green, g (s) 24.6Actuated g/C Ratio 0.27Clearance Time (s) 5.5Vehicle Extension (s) 3.0Lane Grp Cap (vph) 387v/s Ratio Protv/s Ratio Perm 0.07v/c Ratio 0.27Uniform Delay, d1 25.6Progression Factor 1.00Incremental Delay, d2 1.7Delay (s) 27.3Level of Service CApproach Delay (s)Approach LOS
Intersection Summary

HCM Signalized Intersection Capacity Analysis Children's Hospital15: Telegraph Ave & 52nd Street/Claremont Ave Existing AM Plus Phase 1
Fehr & Peers Synchro 8 Report
Movement EBL EBT EBR WBL WBT WBR NBL NBT NBR SBL SBT SBRLane ConfigurationsVolume (vph) 6 0 6 94 52 154 0 657 117 64 598 273Ideal Flow (vphpl) 1900 1900 1900 1900 1900 1900 1900 1900 1900 1900 1900 1900Lane Width 12 12 12 12 12 12 12 16 12 12 12 12Total Lost time (s) 4.5 4.5 4.5 4.5 4.5 4.5Lane Util. Factor 1.00 0.95 0.95 0.95 1.00 0.95Frpb, ped/bikes 0.98 1.00 0.99 0.99 1.00 0.97Flpb, ped/bikes 1.00 1.00 1.00 1.00 1.00 1.00Frt 0.93 1.00 0.89 0.98 1.00 0.95Flt Protected 0.98 0.95 1.00 1.00 0.95 1.00Satd. Flow (prot) 1576 1698 1569 3852 1770 3280Flt Permitted 0.98 0.95 1.00 1.00 0.95 1.00Satd. Flow (perm) 1576 1698 1569 3852 1770 3280Peak-hour factor, PHF 1.00 1.00 1.00 1.00 1.00 1.00 1.00 1.00 1.00 1.00 1.00 1.00Adj. Flow (vph) 6 0 6 94 52 154 0 657 117 64 598 273RTOR Reduction (vph) 0 12 0 0 119 0 0 11 0 0 37 0Lane Group Flow (vph) 0 0 0 85 96 0 0 763 0 64 834 0Confl. Peds. (#/hr) 4 4 22 18 22Confl. Bikes (#/hr) 1 2 33 27Heavy Vehicles (%) 8% 8% 8% 1% 1% 1% 3% 3% 3% 2% 2% 2%Turn Type Split NA Split NA NA Prot NAProtected Phases 4 4 8 8 2 1 6Permitted Phases 2Actuated Green, G (s) 1.1 15.4 15.4 48.2 7.3 60.0Effective Green, g (s) 1.1 15.4 15.4 48.2 7.3 60.0Actuated g/C Ratio 0.01 0.17 0.17 0.54 0.08 0.67Clearance Time (s) 4.5 4.5 4.5 4.5 4.5 4.5Vehicle Extension (s) 3.0 3.0 3.0 3.0 3.0 3.0Lane Grp Cap (vph) 19 290 268 2062 143 2186v/s Ratio Prot c0.00 0.05 c0.06 0.20 0.04 c0.25v/s Ratio Permv/c Ratio 0.01 0.29 0.36 0.37 0.45 0.38Uniform Delay, d1 43.9 32.6 32.9 12.1 39.4 6.7Progression Factor 1.00 1.00 1.00 0.95 1.00 1.00Incremental Delay, d2 0.1 0.6 0.8 0.4 2.2 0.5Delay (s) 44.0 33.1 33.8 11.9 41.7 7.2Level of Service D C C B D AApproach Delay (s) 44.0 33.6 11.9 9.6Approach LOS D C B A
Intersection SummaryHCM 2000 Control Delay 14.2 HCM 2000 Level of Service BHCM 2000 Volume to Capacity ratio 0.39Actuated Cycle Length (s) 90.0 Sum of lost time (s) 18.0Intersection Capacity Utilization 70.1% ICU Level of Service CAnalysis Period (min) 15c Critical Lane Group
HCM Signalized Intersection Capacity Analysis Children's Hospital16: Telegraph Ave & 51St Street Existing AM Plus Phase 1
Fehr & Peers Synchro 8 Report
Movement EBL EBT EBR WBL WBT WBR NBL NBT NBR SBL SBT SBRLane ConfigurationsVolume (vph) 220 488 68 101 530 238 91 320 58 147 511 38Ideal Flow (vphpl) 1900 1900 1900 1900 1900 1900 1900 1900 1900 1900 1900 1900Total Lost time (s) 4.0 4.0 4.0 3.5 4.0 4.5 4.0 3.5Lane Util. Factor 0.97 0.95 1.00 0.95 1.00 0.95 1.00 0.95Frpb, ped/bikes 1.00 0.99 1.00 0.98 1.00 0.99 1.00 0.99Flpb, ped/bikes 1.00 1.00 1.00 1.00 1.00 1.00 1.00 1.00Frt 1.00 0.98 1.00 0.95 1.00 0.98 1.00 0.99Flt Protected 0.95 1.00 0.95 1.00 0.95 1.00 0.95 1.00Satd. Flow (prot) 3400 3417 1787 3349 1719 3324 1752 3447Flt Permitted 0.95 1.00 0.95 1.00 0.95 1.00 0.95 1.00Satd. Flow (perm) 3400 3417 1787 3349 1719 3324 1752 3447Peak-hour factor, PHF 1.00 1.00 1.00 1.00 1.00 1.00 1.00 1.00 1.00 1.00 1.00 1.00Adj. Flow (vph) 220 488 68 101 530 238 91 320 58 147 511 38RTOR Reduction (vph) 0 12 0 0 56 0 0 16 0 0 5 0Lane Group Flow (vph) 220 544 0 101 712 0 91 362 0 147 544 0Confl. Peds. (#/hr) 31 31 30 37Confl. Bikes (#/hr) 9 7 27 27Heavy Vehicles (%) 3% 3% 3% 1% 1% 1% 5% 5% 5% 3% 3% 3%Turn Type Prot NA Prot NA Prot NA Prot NAProtected Phases 7 4 3 8 5 2 1 6Permitted PhasesActuated Green, G (s) 11.0 29.0 8.6 27.1 8.4 24.9 11.0 28.5Effective Green, g (s) 11.0 29.0 8.6 27.1 8.4 24.9 11.0 28.5Actuated g/C Ratio 0.12 0.32 0.10 0.30 0.09 0.28 0.12 0.32Clearance Time (s) 4.0 4.0 4.0 3.5 4.0 4.5 4.0 3.5Vehicle Extension (s) 3.0 3.0 3.0 3.0 3.0 3.0 3.0 3.0Lane Grp Cap (vph) 415 1101 170 1008 160 919 214 1091v/s Ratio Prot c0.06 0.16 0.06 c0.21 0.05 0.11 c0.08 c0.16v/s Ratio Permv/c Ratio 0.53 0.49 0.59 0.71 0.57 0.39 0.69 0.50Uniform Delay, d1 37.1 24.6 39.0 27.9 39.1 26.4 37.8 24.9Progression Factor 1.28 0.79 1.00 1.00 1.00 1.00 1.01 0.86Incremental Delay, d2 1.2 1.5 5.5 4.2 4.6 1.3 8.5 1.6Delay (s) 48.8 20.9 44.5 32.1 43.6 27.7 46.7 23.1Level of Service D C D C D C D CApproach Delay (s) 28.8 33.5 30.8 28.1Approach LOS C C C C
Intersection SummaryHCM 2000 Control Delay 30.4 HCM 2000 Level of Service CHCM 2000 Volume to Capacity ratio 0.62Actuated Cycle Length (s) 90.0 Sum of lost time (s) 16.5Intersection Capacity Utilization 69.6% ICU Level of Service CAnalysis Period (min) 15c Critical Lane Group

HCM Signalized Intersection Capacity Analysis Children's Hospital17: SB SR-24 On-Ramp & MLK Way & NB SR-24 Off-Ramp Existing AM Plus Phase 1
Fehr & Peers Synchro 8 Report
Movement EBL EBT EBR WBL WBT WBR NBL NBT NBR SBL SBT SBRLane ConfigurationsVolume (vph) 149 0 0 0 0 1506 0 0 0 0 1419 234Ideal Flow (vphpl) 1900 1900 1900 1900 1900 1900 1900 1900 1900 1900 1900 1900Total Lost time (s) 4.0 4.0 4.0 4.0Lane Util. Factor 0.97 1.00 0.95 0.88Frpb, ped/bikes 1.00 1.00 1.00 1.00Flpb, ped/bikes 1.00 1.00 1.00 1.00Frt 1.00 0.86 1.00 0.85Flt Protected 0.95 1.00 1.00 1.00Satd. Flow (prot) 3273 1627 3574 2814Flt Permitted 0.95 1.00 1.00 1.00Satd. Flow (perm) 3273 1627 3574 2814Peak-hour factor, PHF 1.00 1.00 1.00 1.00 1.00 1.00 1.00 1.00 1.00 1.00 1.00 1.00Adj. Flow (vph) 149 0 0 0 0 1506 0 0 0 0 1419 234RTOR Reduction (vph) 0 0 0 0 0 0 0 0 0 0 0 0Lane Group Flow (vph) 149 0 0 0 0 1506 0 0 0 0 1419 234Confl. Bikes (#/hr) 2Heavy Vehicles (%) 7% 7% 2% 2% 1% 1% 2% 2% 2% 2% 1% 1%Turn Type Prot Free NA customProtected Phases 2 6 FreePermitted Phases FreeActuated Green, G (s) 8.0 45.0 29.0 45.0Effective Green, g (s) 8.0 45.0 29.0 45.0Actuated g/C Ratio 0.18 1.00 0.64 1.00Clearance Time (s) 4.0 4.0Lane Grp Cap (vph) 581 1627 2303 2814v/s Ratio Prot 0.05 0.40 0.08v/s Ratio Perm c0.93v/c Ratio 0.26 0.93 0.62 0.08Uniform Delay, d1 15.9 0.0 4.7 0.0Progression Factor 1.00 1.00 1.73 1.00Incremental Delay, d2 1.1 10.5 1.1 0.0Delay (s) 17.0 10.5 9.2 0.0Level of Service B B A AApproach Delay (s) 17.0 10.5 0.0 7.9Approach LOS B B A A
Intersection SummaryHCM 2000 Control Delay 9.5 HCM 2000 Level of Service AHCM 2000 Volume to Capacity ratio 1.13Actuated Cycle Length (s) 45.0 Sum of lost time (s) 8.0Intersection Capacity Utilization 50.1% ICU Level of Service AAnalysis Period (min) 15c Critical Lane Group
HCM Unsignalized Intersection Capacity Analysis Children's Hospital18: West Street & 52nd Street Existing AM Plus Phase 1
Fehr & Peers Synchro 8 Report
Movement EBL EBT EBR WBL WBT WBR NBL NBT NBR SBL SBT SBRLane ConfigurationsSign Control Stop Stop Stop StopVolume (vph) 0 159 10 57 72 0 22 0 71 2 43 5Peak Hour Factor 1.00 1.00 1.00 1.00 1.00 1.00 1.00 1.00 1.00 1.00 1.00 1.00Hourly flow rate (vph) 0 159 10 57 72 0 22 0 71 2 43 5
Direction, Lane # EB 1 WB 1 NB 1 NB 2 SB 1Volume Total (vph) 169 129 22 71 50Volume Left (vph) 0 57 22 0 2Volume Right (vph) 10 0 0 71 5Hadj (s) -0.02 0.12 0.50 -0.70 -0.02Departure Headway (s) 4.4 4.6 5.7 4.5 4.8Degree Utilization, x 0.21 0.16 0.04 0.09 0.07Capacity (veh/h) 792 751 591 739 693Control Delay (s) 8.5 8.4 7.8 6.8 8.1Approach Delay (s) 8.5 8.4 7.0 8.1Approach LOS A A A A
Intersection SummaryDelay 8.1Level of Service AIntersection Capacity Utilization 36.2% ICU Level of Service AAnalysis Period (min) 15

HCM Unsignalized Intersection Capacity Analysis Children's Hospital19: Genoa Street & 52nd Street Existing AM Plus Phase 1
Fehr & Peers Synchro 8 Report
Movement EBL EBT EBR WBL WBT WBR NBL NBT NBR SBL SBT SBRLane ConfigurationsSign Control Stop Stop Stop StopVolume (vph) 5 144 1 4 77 20 1 0 3 15 0 3Peak Hour Factor 1.00 1.00 1.00 1.00 1.00 1.00 1.00 1.00 1.00 1.00 1.00 1.00Hourly flow rate (vph) 5 144 1 4 77 20 1 0 3 15 0 3
Direction, Lane # EB 1 WB 1 NB 1 SB 1Volume Total (vph) 150 101 4 18Volume Left (vph) 5 4 1 15Volume Right (vph) 1 20 3 3Hadj (s) 0.02 -0.11 -0.40 0.07Departure Headway (s) 4.1 4.0 4.1 4.5Degree Utilization, x 0.17 0.11 0.00 0.02Capacity (veh/h) 872 890 827 744Control Delay (s) 7.9 7.5 7.1 7.6Approach Delay (s) 7.9 7.5 7.1 7.6Approach LOS A A A A
Intersection SummaryDelay 7.7Level of Service AIntersection Capacity Utilization 21.4% ICU Level of Service AAnalysis Period (min) 15
HCM Unsignalized Intersection Capacity Analysis Children's Hospital20: Genoa Street & 55th Street Existing AM Plus Phase 1
Fehr & Peers Synchro 8 Report
Movement EBL EBT EBR WBL WBT WBR NBL NBT NBR SBL SBT SBRLane ConfigurationsVolume (veh/h) 2 354 0 4 312 10 6 11 14 32 12 8Sign Control Free Free Stop StopGrade 0% 0% 0% 0%Peak Hour Factor 1.00 1.00 1.00 1.00 1.00 1.00 1.00 1.00 1.00 1.00 1.00 1.00Hourly flow rate (vph) 2 354 0 4 312 10 6 11 14 32 12 8Pedestrians 8 2 10 11Lane Width (ft) 12.0 12.0 12.0 12.0Walking Speed (ft/s) 4.0 4.0 4.0 4.0Percent Blockage 1 0 1 1Right turn flare (veh)Median type None NoneMedian storage veh)Upstream signal (ft) 721pX, platoon unblockedvC, conflicting volume 333 364 715 709 366 716 704 336vC1, stage 1 conf volvC2, stage 2 conf volvCu, unblocked vol 333 364 715 709 366 716 704 336tC, single (s) 4.1 4.1 7.1 6.5 6.2 7.1 6.5 6.2tC, 2 stage (s)tF (s) 2.2 2.2 3.5 4.0 3.3 3.5 4.0 3.3p0 queue free % 100 100 98 97 98 90 97 99cM capacity (veh/h) 1221 1196 325 353 677 321 353 695
Direction, Lane # EB 1 WB 1 NB 1 SB 1Volume Total 356 326 31 52Volume Left 2 4 6 32Volume Right 0 10 14 8cSH 1221 1196 441 358Volume to Capacity 0.00 0.00 0.07 0.15Queue Length 95th (ft) 0 0 6 13Control Delay (s) 0.1 0.1 13.8 16.7Lane LOS A A B CApproach Delay (s) 0.1 0.1 13.8 16.7Approach LOS B C
Intersection SummaryAverage Delay 1.8Intersection Capacity Utilization 35.4% ICU Level of Service AAnalysis Period (min) 15

HCM Unsignalized Intersection Capacity Analysis Children's Hospital21: MLK Way & RIRO Main Garage Existing AM Plus Phase 1
Fehr & Peers Synchro 8 Report
Movement WBL WBR NBT NBR SBL SBTLane ConfigurationsVolume (veh/h) 0 34 1572 201 0 1596Sign Control Stop Free FreeGrade 0% 0% 0%Peak Hour Factor 1.00 1.00 1.00 1.00 1.00 1.00Hourly flow rate (vph) 0 34 1572 201 0 1596PedestriansLane Width (ft)Walking Speed (ft/s)Percent BlockageRight turn flare (veh)Median type None NoneMedian storage veh)Upstream signal (ft) 154 137pX, platoon unblocked 0.86 0.78 0.78vC, conflicting volume 2204 624 1773vC1, stage 1 conf volvC2, stage 2 conf volvCu, unblocked vol 682 0 1026tC, single (s) 6.8 6.9 4.1tC, 2 stage (s)tF (s) 3.5 3.3 2.2p0 queue free % 100 96 100cM capacity (veh/h) 329 851 528
Direction, Lane # WB 1 NB 1 NB 2 NB 3 SB 1 SB 2 SB 3Volume Total 34 629 629 515 532 532 532Volume Left 0 0 0 0 0 0 0Volume Right 34 0 0 201 0 0 0cSH 851 1700 1700 1700 1700 1700 1700Volume to Capacity 0.04 0.37 0.37 0.30 0.31 0.31 0.31Queue Length 95th (ft) 3 0 0 0 0 0 0Control Delay (s) 9.4 0.0 0.0 0.0 0.0 0.0 0.0Lane LOS AApproach Delay (s) 9.4 0.0 0.0Approach LOS A
Intersection SummaryAverage Delay 0.1Intersection Capacity Utilization 44.8% ICU Level of Service AAnalysis Period (min) 15
HCM Unsignalized Intersection Capacity Analysis Children's Hospital22: MLK Way & RIRO Main Plaza Existing AM Plus Phase 1
Fehr & Peers Synchro 8 Report
Movement WBL WBR NBT NBR SBL SBTLane ConfigurationsVolume (veh/h) 0 1 1630 25 0 1692Sign Control Stop Free FreeGrade 0% 0% 0%Peak Hour Factor 1.00 1.00 1.00 1.00 1.00 1.00Hourly flow rate (vph) 0 1 1630 25 0 1692PedestriansLane Width (ft)Walking Speed (ft/s)Percent BlockageRight turn flare (veh)Median type None NoneMedian storage veh)Upstream signal (ft) 424 204pX, platoon unblocked 0.81vC, conflicting volume 2206 556 1655vC1, stage 1 conf volvC2, stage 2 conf volvCu, unblocked vol 1652 556 1655tC, single (s) 6.8 6.9 4.1tC, 2 stage (s)tF (s) 3.5 3.3 2.2p0 queue free % 100 100 100cM capacity (veh/h) 72 475 386
Direction, Lane # WB 1 NB 1 NB 2 NB 3 SB 1 SB 2 SB 3Volume Total 1 652 652 351 564 564 564Volume Left 0 0 0 0 0 0 0Volume Right 1 0 0 25 0 0 0cSH 475 1700 1700 1700 1700 1700 1700Volume to Capacity 0.00 0.38 0.38 0.21 0.33 0.33 0.33Queue Length 95th (ft) 0 0 0 0 0 0 0Control Delay (s) 12.6 0.0 0.0 0.0 0.0 0.0 0.0Lane LOS BApproach Delay (s) 12.6 0.0 0.0Approach LOS B
Intersection SummaryAverage Delay 0.0Intersection Capacity Utilization 42.0% ICU Level of Service AAnalysis Period (min) 15

HCM Unsignalized Intersection Capacity Analysis Children's Hospital24: 51St Street & 52nd Street Existing AM Plus Phase 1
Fehr & Peers Synchro 8 Report
Intersection Sign configuration not allowed in HCM analysis.
HCM Signalized Intersection Capacity Analysis Children's Hospital 1: MLK Way & 55th Street

HCM Signalized Intersection Capacity Analysis Children's Hospital 1: MLK Way & 55th Street
HCM Unsignalized Intersection Capacity Analysis Children's Hospital 2: Dover Street & 55th Street
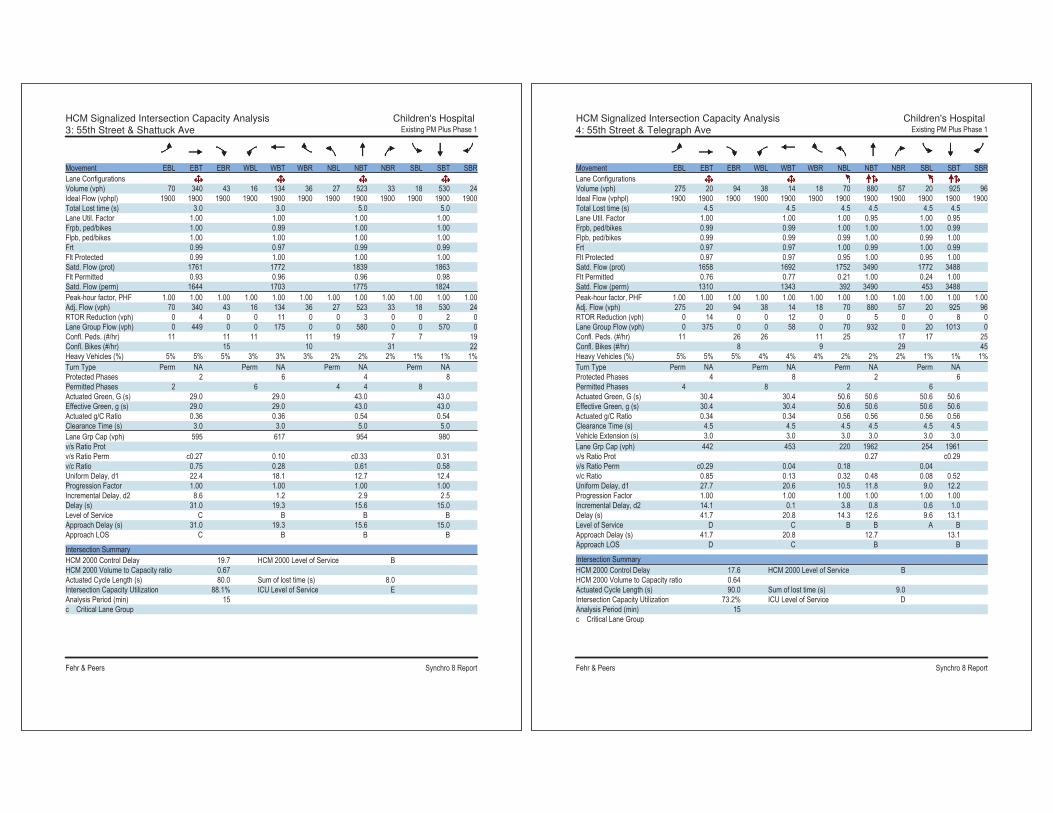
HCM Signalized Intersection Capacity Analysis Children's Hospital 3: 55th Street & Shattuck Ave
HCM Signalized Intersection Capacity Analysis Children's Hospital 4: 55th Street & Telegraph Ave

HCM Unsignalized Intersection Capacity Analysis Children's Hospital 5: MLK Way & 54th Street
HCM Unsignalized Intersection Capacity Analysis Children's Hospital 5: MLK Way & 54th Street

HCM Unsignalized Intersection Capacity Analysis Children's Hospital 6: Dover Street & 54th Street
HCM Unsignalized Intersection Capacity Analysis Children's Hospital 7: Shattuck Ave & 54th Street
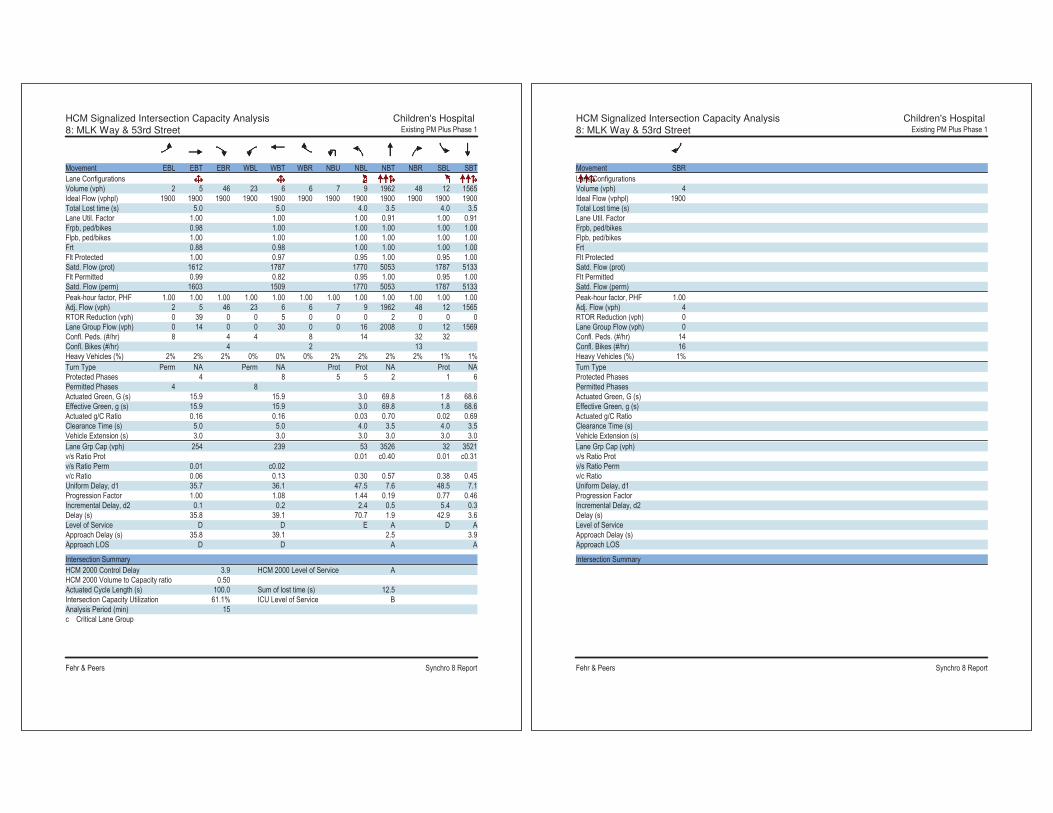
HCM Signalized Intersection Capacity Analysis Children's Hospital 8: MLK Way & 53rd Street
HCM Signalized Intersection Capacity Analysis Children's Hospital 8: MLK Way & 53rd Street

HCM Unsignalized Intersection Capacity Analysis Children's Hospital 9: Dover Street & 53rd Street
HCM Signalized Intersection Capacity Analysis Children's Hospital 10: MLK Way & 52nd Street
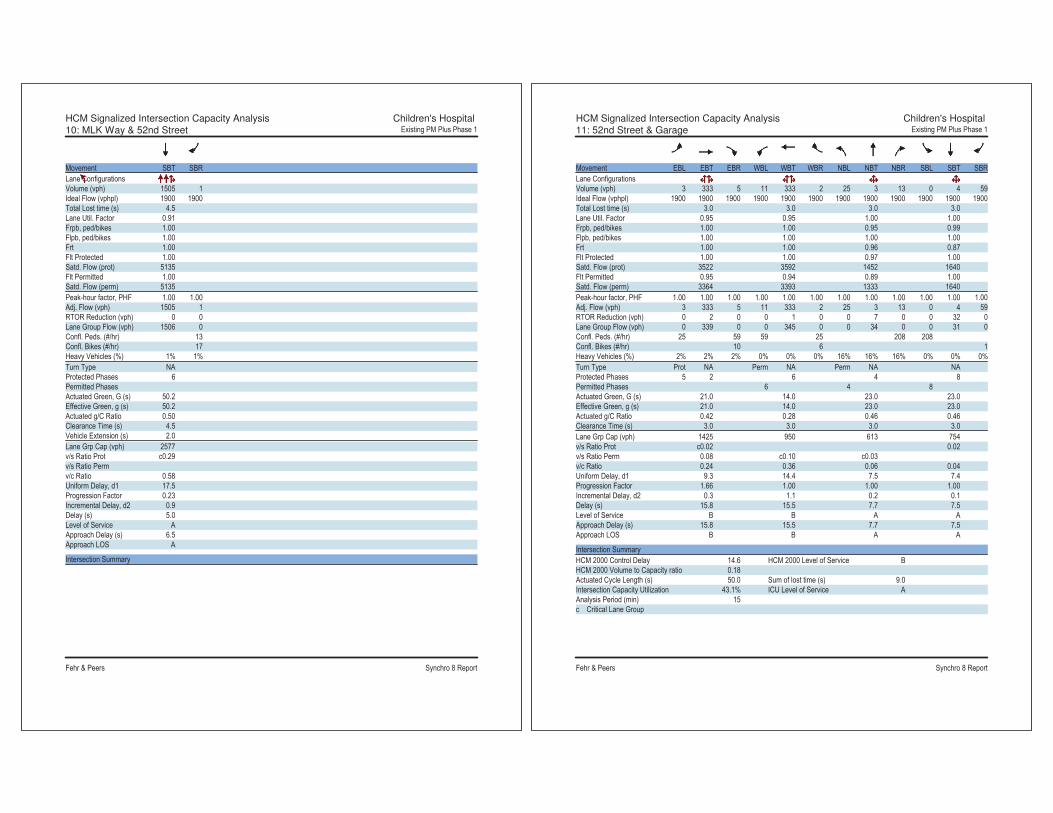
HCM Signalized Intersection Capacity Analysis Children's Hospital 10: MLK Way & 52nd Street
HCM Signalized Intersection Capacity Analysis Children's Hospital 11: 52nd Street & Garage
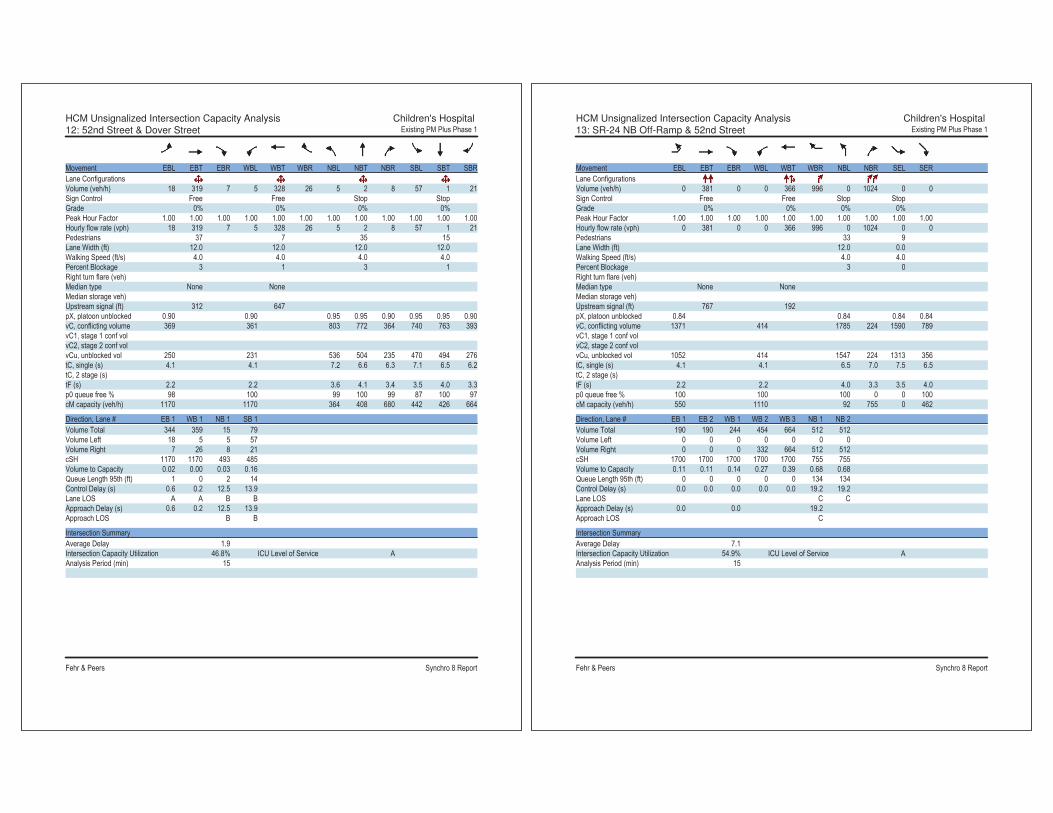
HCM Unsignalized Intersection Capacity Analysis Children's Hospital 12: 52nd Street & Dover Street
HCM Unsignalized Intersection Capacity Analysis Children's Hospital 13: SR-24 NB Off-Ramp & 52nd Street

HCM Signalized Intersection Capacity Analysis Children's Hospital 14: 52nd Street & Shattuck Ave
HCM Signalized Intersection Capacity Analysis Children's Hospital 14: 52nd Street & Shattuck Ave
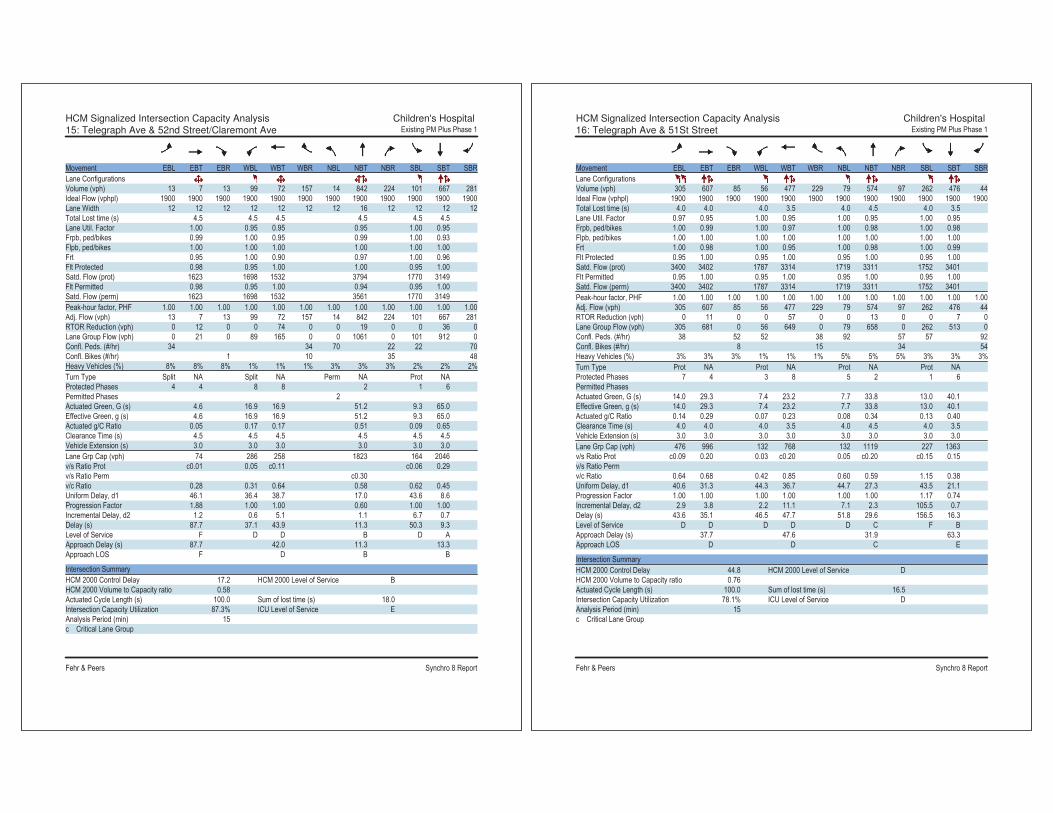
HCM Signalized Intersection Capacity Analysis Children's Hospital 15: Telegraph Ave & 52nd Street/Claremont Ave
HCM Signalized Intersection Capacity Analysis Children's Hospital 16: Telegraph Ave & 51St Street

HCM Signalized Intersection Capacity Analysis Children's Hospital 17: SB SR-24 On-Ramp & MLK Way & NB SR-24 Off-Ramp
HCM Unsignalized Intersection Capacity Analysis Children's Hospital 18: West Street & 52nd Street

HCM Unsignalized Intersection Capacity Analysis Children's Hospital 19: Genoa Street & 52nd Street
HCM Unsignalized Intersection Capacity Analysis Children's Hospital 20: Genoa Street & 55th Street

HCM Unsignalized Intersection Capacity Analysis Children's Hospital 21: MLK Way & RIRO Main Garage
Appendix G LOS Calculation Worksheets – Existing Plus Phase
2 Conditions

HCM Signalized Intersection Capacity Analysis Children's Hospital1: MLK Way & 55th Street Existing AM Plus Phase 2
Fehr & Peers Synchro 8 Report
Movement EBL EBT EBR WBL WBT WBR NBU NBL NBT NBR SBL SBTLane ConfigurationsVolume (vph) 13 170 219 54 217 57 14 127 1346 59 52 1250Ideal Flow (vphpl) 1900 1900 1900 1900 1900 1900 1900 1900 1900 1900 1900 1900Total Lost time (s) 5.0 5.0 4.5 5.0 4.5 5.0Lane Util. Factor 1.00 1.00 1.00 0.91 1.00 0.91Frpb, ped/bikes 0.98 1.00 1.00 1.00 1.00 1.00Flpb, ped/bikes 1.00 1.00 1.00 1.00 1.00 1.00Frt 0.93 0.98 1.00 0.99 1.00 1.00Flt Protected 1.00 0.99 0.95 1.00 0.95 1.00Satd. Flow (prot) 1707 1759 1770 5039 1770 5064Flt Permitted 0.98 0.77 0.95 1.00 0.95 1.00Satd. Flow (perm) 1683 1364 1770 5039 1770 5064Peak-hour factor, PHF 1.00 1.00 1.00 1.00 1.00 1.00 1.00 1.00 1.00 1.00 1.00 1.00Adj. Flow (vph) 13 170 219 54 217 57 14 127 1346 59 52 1250RTOR Reduction (vph) 0 56 0 0 10 0 0 0 4 0 0 2Lane Group Flow (vph) 0 346 0 0 318 0 0 141 1401 0 52 1275Confl. Peds. (#/hr) 7 14 14 7 21Confl. Bikes (#/hr) 16 15 6Heavy Vehicles (%) 1% 1% 1% 4% 4% 4% 2% 2% 2% 2% 2% 2%Turn Type Perm NA Perm NA Prot Prot NA Prot NAProtected Phases 4 8 5 5 2 1 6Permitted Phases 4 8Actuated Green, G (s) 25.9 25.9 15.3 45.1 4.5 34.3Effective Green, g (s) 25.9 25.9 15.3 45.1 4.5 34.3Actuated g/C Ratio 0.29 0.29 0.17 0.50 0.05 0.38Clearance Time (s) 5.0 5.0 4.5 5.0 4.5 5.0Vehicle Extension (s) 3.0 3.0 3.0 3.0 3.0 3.0Lane Grp Cap (vph) 484 392 300 2525 88 1929v/s Ratio Prot 0.08 c0.28 0.03 c0.25v/s Ratio Perm 0.21 c0.23v/c Ratio 0.72 0.81 0.47 0.55 0.59 0.66Uniform Delay, d1 28.7 29.8 33.7 15.5 41.8 23.0Progression Factor 1.00 1.00 0.52 0.12 1.00 1.00Incremental Delay, d2 5.0 12.0 1.1 0.8 10.2 1.8Delay (s) 33.7 41.8 18.7 2.6 52.0 24.8Level of Service C D B A D CApproach Delay (s) 33.7 41.8 4.1 25.9Approach LOS C D A C
Intersection SummaryHCM 2000 Control Delay 18.9 HCM 2000 Level of Service BHCM 2000 Volume to Capacity ratio 0.71Actuated Cycle Length (s) 90.0 Sum of lost time (s) 14.5Intersection Capacity Utilization 85.5% ICU Level of Service EAnalysis Period (min) 15c Critical Lane Group
HCM Signalized Intersection Capacity Analysis Children's Hospital1: MLK Way & 55th Street Existing AM Plus Phase 2
Fehr & Peers Synchro 8 Report
Movement SBRLane ConfigurationsVolume (vph) 27Ideal Flow (vphpl) 1900Total Lost time (s)Lane Util. FactorFrpb, ped/bikesFlpb, ped/bikesFrtFlt ProtectedSatd. Flow (prot)Flt PermittedSatd. Flow (perm)Peak-hour factor, PHF 1.00Adj. Flow (vph) 27RTOR Reduction (vph) 0Lane Group Flow (vph) 0Confl. Peds. (#/hr) 12Confl. Bikes (#/hr) 7Heavy Vehicles (%) 2%Turn TypeProtected PhasesPermitted PhasesActuated Green, G (s)Effective Green, g (s)Actuated g/C RatioClearance Time (s)Vehicle Extension (s)Lane Grp Cap (vph)v/s Ratio Protv/s Ratio Permv/c RatioUniform Delay, d1Progression FactorIncremental Delay, d2Delay (s)Level of ServiceApproach Delay (s)Approach LOS
Intersection Summary

HCM Unsignalized Intersection Capacity Analysis Children's Hospital2: Dover Street & 55th Street Existing AM Plus Phase 2
Fehr & Peers Synchro 8 Report
Movement EBL EBT EBR WBL WBT WBR NBL NBT NBR SBL SBT SBRLane ConfigurationsVolume (veh/h) 18 259 6 23 296 6 7 8 13 8 6 21Sign Control Free Free Stop StopGrade 0% 0% 0% 0%Peak Hour Factor 1.00 1.00 1.00 1.00 1.00 1.00 1.00 1.00 1.00 1.00 1.00 1.00Hourly flow rate (vph) 18 259 6 23 296 6 7 8 13 8 6 21Pedestrians 9 20 15 6Lane Width (ft) 12.0 12.0 12.0 12.0Walking Speed (ft/s) 4.0 4.0 4.0 4.0Percent Blockage 1 2 1 1Right turn flare (veh)Median type None NoneMedian storage veh)Upstream signal (ft) 641 677pX, platoon unblocked 0.90 0.90 0.90 0.90 0.90 0.90vC, conflicting volume 308 280 691 667 297 686 667 314vC1, stage 1 conf volvC2, stage 2 conf volvCu, unblocked vol 182 280 606 579 297 600 579 189tC, single (s) 4.1 4.1 7.1 6.5 6.2 7.1 6.5 6.2tC, 2 stage (s)tF (s) 2.2 2.2 3.5 4.0 3.3 3.5 4.0 3.3p0 queue free % 99 98 98 98 98 98 98 97cM capacity (veh/h) 1238 1255 338 369 726 338 365 760
Direction, Lane # EB 1 WB 1 NB 1 SB 1Volume Total 283 325 28 35Volume Left 18 23 7 8Volume Right 6 6 13 21cSH 1238 1255 464 517Volume to Capacity 0.01 0.02 0.06 0.07Queue Length 95th (ft) 1 1 5 5Control Delay (s) 0.6 0.7 13.3 12.5Lane LOS A A B BApproach Delay (s) 0.6 0.7 13.3 12.5Approach LOS B B
Intersection SummaryAverage Delay 1.8Intersection Capacity Utilization 37.7% ICU Level of Service AAnalysis Period (min) 15
HCM Signalized Intersection Capacity Analysis Children's Hospital3: 55th Street & Shattuck Ave Existing AM Plus Phase 2
Fehr & Peers Synchro 8 Report
Movement EBL EBT EBR WBL WBT WBR NBL NBT NBR SBL SBT SBRLane ConfigurationsVolume (vph) 50 199 40 27 253 31 28 430 25 25 544 28Ideal Flow (vphpl) 1900 1900 1900 1900 1900 1900 1900 1900 1900 1900 1900 1900Total Lost time (s) 3.0 3.0 5.0 5.0Lane Util. Factor 1.00 1.00 1.00 1.00Frpb, ped/bikes 0.99 1.00 1.00 1.00Flpb, ped/bikes 1.00 1.00 1.00 1.00Frt 0.98 0.99 0.99 0.99Flt Protected 0.99 1.00 1.00 1.00Satd. Flow (prot) 1743 1803 1840 1861Flt Permitted 0.90 0.96 0.95 0.97Satd. Flow (perm) 1578 1740 1759 1813Peak-hour factor, PHF 1.00 1.00 1.00 1.00 1.00 1.00 1.00 1.00 1.00 1.00 1.00 1.00Adj. Flow (vph) 50 199 40 27 253 31 28 430 25 25 544 28RTOR Reduction (vph) 0 8 0 0 5 0 0 2 0 0 2 0Lane Group Flow (vph) 0 281 0 0 306 0 0 481 0 0 595 0Confl. Peds. (#/hr) 6 13 13 6 7 17 17 7Confl. Bikes (#/hr) 22 10 13 24Heavy Vehicles (%) 5% 5% 5% 3% 3% 3% 2% 2% 2% 1% 1% 1%Turn Type Perm NA Perm NA Perm NA Perm NAProtected Phases 2 6 4 8Permitted Phases 2 6 4 4 8Actuated Green, G (s) 25.0 25.0 47.0 47.0Effective Green, g (s) 25.0 25.0 47.0 47.0Actuated g/C Ratio 0.31 0.31 0.59 0.59Clearance Time (s) 3.0 3.0 5.0 5.0Lane Grp Cap (vph) 493 543 1033 1065v/s Ratio Protv/s Ratio Perm c0.18 0.18 0.27 c0.33v/c Ratio 0.57 0.56 0.47 0.56Uniform Delay, d1 23.0 23.0 9.4 10.1Progression Factor 1.00 1.00 1.00 1.00Incremental Delay, d2 4.7 4.2 1.5 2.1Delay (s) 27.8 27.1 10.9 12.2Level of Service C C B BApproach Delay (s) 27.8 27.1 10.9 12.2Approach LOS C C B B
Intersection SummaryHCM 2000 Control Delay 17.3 HCM 2000 Level of Service BHCM 2000 Volume to Capacity ratio 0.56Actuated Cycle Length (s) 80.0 Sum of lost time (s) 8.0Intersection Capacity Utilization 73.4% ICU Level of Service DAnalysis Period (min) 15c Critical Lane Group

HCM Signalized Intersection Capacity Analysis Children's Hospital4: 55th Street & Telegraph Ave Existing AM Plus Phase 2
Fehr & Peers Synchro 8 Report
Movement EBL EBT EBR WBL WBT WBR NBL NBT NBR SBL SBT SBRLane ConfigurationsVolume (vph) 149 14 77 32 10 9 58 715 40 27 826 241Ideal Flow (vphpl) 1900 1900 1900 1900 1900 1900 1900 1900 1900 1900 1900 1900Total Lost time (s) 4.5 4.5 4.5 4.5 4.5 4.5Lane Util. Factor 1.00 1.00 1.00 0.95 1.00 0.95Frpb, ped/bikes 0.99 0.99 1.00 1.00 1.00 0.99Flpb, ped/bikes 1.00 1.00 1.00 1.00 0.99 1.00Frt 0.96 0.98 1.00 0.99 1.00 0.97Flt Protected 0.97 0.97 0.95 1.00 0.95 1.00Satd. Flow (prot) 1655 1713 1761 3497 1768 3406Flt Permitted 0.78 0.79 0.22 1.00 0.34 1.00Satd. Flow (perm) 1332 1403 416 3497 636 3406Peak-hour factor, PHF 1.00 1.00 1.00 1.00 1.00 1.00 1.00 1.00 1.00 1.00 1.00 1.00Adj. Flow (vph) 149 14 77 32 10 9 58 715 40 27 826 241RTOR Reduction (vph) 0 29 0 0 7 0 0 4 0 0 29 0Lane Group Flow (vph) 0 211 0 0 44 0 58 751 0 27 1038 0Confl. Peds. (#/hr) 6 11 11 6 13 17 17 13Confl. Bikes (#/hr) 15 15 43 27Heavy Vehicles (%) 5% 5% 5% 4% 4% 4% 2% 2% 2% 1% 1% 1%Turn Type Perm NA Perm NA Perm NA Perm NAProtected Phases 4 8 2 6Permitted Phases 4 8 2 6Actuated Green, G (s) 16.8 16.8 44.2 44.2 44.2 44.2Effective Green, g (s) 16.8 16.8 44.2 44.2 44.2 44.2Actuated g/C Ratio 0.24 0.24 0.63 0.63 0.63 0.63Clearance Time (s) 4.5 4.5 4.5 4.5 4.5 4.5Vehicle Extension (s) 3.0 3.0 3.0 3.0 3.0 3.0Lane Grp Cap (vph) 319 336 262 2208 401 2150v/s Ratio Prot 0.21 c0.30v/s Ratio Perm c0.16 0.03 0.14 0.04v/c Ratio 0.66 0.13 0.22 0.34 0.07 0.48Uniform Delay, d1 24.0 20.9 5.5 6.1 5.0 6.8Progression Factor 1.00 1.00 1.00 1.00 1.00 1.00Incremental Delay, d2 5.1 0.2 1.9 0.4 0.3 0.8Delay (s) 29.1 21.1 7.5 6.5 5.3 7.6Level of Service C C A A A AApproach Delay (s) 29.1 21.1 6.5 7.6Approach LOS C C A A
Intersection SummaryHCM 2000 Control Delay 9.9 HCM 2000 Level of Service AHCM 2000 Volume to Capacity ratio 0.53Actuated Cycle Length (s) 70.0 Sum of lost time (s) 9.0Intersection Capacity Utilization 62.8% ICU Level of Service BAnalysis Period (min) 15c Critical Lane Group
HCM Unsignalized Intersection Capacity Analysis Children's Hospital5: MLK Way & 54th Street Existing AM Plus Phase 2
Fehr & Peers Synchro 8 Report
Movement EBL EBT EBR WBL WBT WBR NBU NBL NBT NBR SBL SBTLane ConfigurationsVolume (veh/h) 4 3 43 5 3 8 10 15 1522 10 5 1497Sign Control Stop Stop Free FreeGrade 0% 0% 0% 0%Peak Hour Factor 1.00 1.00 1.00 1.00 1.00 1.00 1.00 1.00 1.00 1.00 1.00 1.00Hourly flow rate (vph) 4 3 43 5 3 8 0 15 1522 10 5 1497Pedestrians 7 6 8Lane Width (ft) 12.0 12.0 12.0Walking Speed (ft/s) 4.0 4.0 4.0Percent Blockage 1 1 1Right turn flare (veh)Median type None NoneMedian storage veh)Upstream signal (ft) 299 294pX, platoon unblocked 0.87 0.87 0.80 0.87 0.87 0.86 0.00 0.80 0.86vC, conflicting volume 2064 3086 518 2124 3084 518 0 1511 1538vC1, stage 1 conf volvC2, stage 2 conf volvCu, unblocked vol 585 1761 0 655 1759 0 0 750 1044tC, single (s) 7.5 6.5 6.9 7.5 6.5 6.9 0.0 4.1 4.1tC, 2 stage (s)tF (s) 3.5 4.0 3.3 *5.0 *5.0 *5.0 0.0 2.2 2.2p0 queue free % 99 96 95 98 96 99 0 98 99cM capacity (veh/h) 318 71 859 214 67 614 0 677 570
Direction, Lane # EB 1 WB 1 NB 1 NB 2 NB 3 SB 1 SB 2 SB 3Volume Total 50 16 396 761 390 379 748 381Volume Left 4 5 15 0 0 5 0 0Volume Right 43 8 0 0 10 0 0 7cSH 477 197 677 1700 1700 570 1700 1700Volume to Capacity 0.10 0.08 0.02 0.45 0.23 0.01 0.44 0.22Queue Length 95th (ft) 9 7 2 0 0 1 0 0Control Delay (s) 13.4 24.9 0.7 0.0 0.0 0.3 0.0 0.0Lane LOS B C A AApproach Delay (s) 13.4 24.9 0.2 0.1Approach LOS B C
Intersection SummaryAverage Delay 0.5Intersection Capacity Utilization 60.0% ICU Level of Service BAnalysis Period (min) 15
* User Entered Value

HCM Unsignalized Intersection Capacity Analysis Children's Hospital5: MLK Way & 54th Street Existing AM Plus Phase 2
Fehr & Peers Synchro 8 Report
Movement SBRLane ConfigurationsVolume (veh/h) 7Sign ControlGradePeak Hour Factor 1.00Hourly flow rate (vph) 7PedestriansLane Width (ft)Walking Speed (ft/s)Percent BlockageRight turn flare (veh)Median typeMedian storage veh)Upstream signal (ft)pX, platoon unblockedvC, conflicting volumevC1, stage 1 conf volvC2, stage 2 conf volvCu, unblocked voltC, single (s)tC, 2 stage (s)tF (s)p0 queue free %cM capacity (veh/h)
Direction, Lane #
HCM Unsignalized Intersection Capacity Analysis Children's Hospital6: Dover Street & 54th Street Existing AM Plus Phase 2
Fehr & Peers Synchro 8 Report
Movement EBL EBT EBR WBL WBT WBR NBL NBT NBR SBL SBT SBRLane ConfigurationsVolume (veh/h) 5 5 6 4 6 9 8 19 11 4 36 5Sign Control Stop Stop Free FreeGrade 0% 0% 0% 0%Peak Hour Factor 1.00 1.00 1.00 1.00 1.00 1.00 1.00 1.00 1.00 1.00 1.00 1.00Hourly flow rate (vph) 5 5 6 4 6 9 8 19 11 4 36 5Pedestrians 10 14 2 6Lane Width (ft) 12.0 12.0 12.0 12.0Walking Speed (ft/s) 4.0 4.0 4.0 4.0Percent Blockage 1 1 0 1Right turn flare (veh)Median type None NoneMedian storage veh)Upstream signal (ft)pX, platoon unblockedvC, conflicting volume 115 116 50 112 114 44 51 44vC1, stage 1 conf volvC2, stage 2 conf volvCu, unblocked vol 115 116 50 112 114 44 51 44tC, single (s) 7.1 6.5 6.2 7.1 6.5 6.2 4.1 4.1tC, 2 stage (s)tF (s) 3.5 4.0 3.3 3.5 4.0 3.3 2.2 2.2p0 queue free % 99 99 99 100 99 99 99 100cM capacity (veh/h) 825 756 1013 832 759 1014 1555 1559
Direction, Lane # EB 1 WB 1 NB 1 SB 1Volume Total 16 19 38 45Volume Left 5 4 8 4Volume Right 6 9 11 5cSH 860 880 1555 1559Volume to Capacity 0.02 0.02 0.01 0.00Queue Length 95th (ft) 1 2 0 0Control Delay (s) 9.3 9.2 1.6 0.7Lane LOS A A A AApproach Delay (s) 9.3 9.2 1.6 0.7Approach LOS A A
Intersection SummaryAverage Delay 3.5Intersection Capacity Utilization 19.5% ICU Level of Service AAnalysis Period (min) 15

HCM Unsignalized Intersection Capacity Analysis Children's Hospital7: Shattuck Ave & 54th Street Existing AM Plus Phase 2
Fehr & Peers Synchro 8 Report
Movement EBL EBR NBL NBT SBT SBRLane ConfigurationsVolume (veh/h) 1 14 12 488 589 5Sign Control Stop Free FreeGrade 0% 0% 0%Peak Hour Factor 1.00 1.00 1.00 1.00 1.00 1.00Hourly flow rate (vph) 1 14 12 488 589 5Pedestrians 9 2 1Lane Width (ft) 12.0 12.0 12.0Walking Speed (ft/s) 4.0 4.0 4.0Percent Blockage 1 0 0Right turn flare (veh)Median type None NoneMedian storage veh)Upstream signal (ft) 550 282pX, platoon unblocked 0.81 0.81 0.81vC, conflicting volume 1114 602 603vC1, stage 1 conf volvC2, stage 2 conf volvCu, unblocked vol 1009 388 389tC, single (s) 6.4 6.2 4.1tC, 2 stage (s)tF (s) 3.5 3.3 2.2p0 queue free % 100 97 99cM capacity (veh/h) 213 531 937
Direction, Lane # EB 1 NB 1 SB 1Volume Total 15 500 594Volume Left 1 12 0Volume Right 14 0 5cSH 483 937 1700Volume to Capacity 0.03 0.01 0.35Queue Length 95th (ft) 2 1 0Control Delay (s) 12.7 0.4 0.0Lane LOS B AApproach Delay (s) 12.7 0.4 0.0Approach LOS B
Intersection SummaryAverage Delay 0.3Intersection Capacity Utilization 46.0% ICU Level of Service AAnalysis Period (min) 15
HCM Signalized Intersection Capacity Analysis Children's Hospital8: MLK Way & 53rd Street Existing AM Plus Phase 2
Fehr & Peers Synchro 8 Report
Movement EBL EBT EBR WBL WBT WBR NBL NBT NBR SBL SBT SBRLane ConfigurationsVolume (vph) 4 4 34 13 4 12 21 1551 30 11 1558 5Ideal Flow (vphpl) 1900 1900 1900 1900 1900 1900 1900 1900 1900 1900 1900 1900Total Lost time (s) 5.0 5.0 4.0 3.5 4.0 3.5Lane Util. Factor 1.00 1.00 1.00 0.91 1.00 0.91Frpb, ped/bikes 0.98 0.99 1.00 1.00 1.00 1.00Flpb, ped/bikes 1.00 1.00 1.00 1.00 1.00 1.00Frt 0.89 0.94 1.00 1.00 1.00 1.00Flt Protected 1.00 0.98 0.95 1.00 0.95 1.00Satd. Flow (prot) 1623 1736 1770 5065 1787 5132Flt Permitted 0.98 0.89 0.95 1.00 0.95 1.00Satd. Flow (perm) 1598 1574 1770 5065 1787 5132Peak-hour factor, PHF 1.00 1.00 1.00 1.00 1.00 1.00 1.00 1.00 1.00 1.00 1.00 1.00Adj. Flow (vph) 4 4 34 13 4 12 21 1551 30 11 1558 5RTOR Reduction (vph) 0 29 0 0 10 0 0 1 0 0 0 0Lane Group Flow (vph) 0 13 0 0 19 0 21 1580 0 11 1563 0Confl. Peds. (#/hr) 7 13 13 7 13 20Confl. Bikes (#/hr) 5 13Heavy Vehicles (%) 2% 2% 2% 0% 0% 0% 2% 2% 2% 1% 1% 1%Turn Type Perm NA Perm NA Prot NA Prot NAProtected Phases 4 8 5 2 1 6Permitted Phases 4 8Actuated Green, G (s) 14.5 14.5 3.0 61.2 1.8 60.0Effective Green, g (s) 14.5 14.5 3.0 61.2 1.8 60.0Actuated g/C Ratio 0.16 0.16 0.03 0.68 0.02 0.67Clearance Time (s) 5.0 5.0 4.0 3.5 4.0 3.5Vehicle Extension (s) 3.0 3.0 3.0 3.0 3.0 3.0Lane Grp Cap (vph) 257 253 59 3444 35 3421v/s Ratio Prot 0.01 c0.31 0.01 c0.30v/s Ratio Perm 0.01 c0.01v/c Ratio 0.05 0.07 0.36 0.46 0.31 0.46Uniform Delay, d1 31.9 32.1 42.6 6.7 43.5 7.2Progression Factor 1.00 1.01 1.18 0.49 0.52 0.22Incremental Delay, d2 0.1 0.1 2.9 0.4 4.2 0.4Delay (s) 32.0 32.7 53.1 3.6 26.6 2.0Level of Service C C D A C AApproach Delay (s) 32.0 32.7 4.3 2.1Approach LOS C C A A
Intersection SummaryHCM 2000 Control Delay 3.8 HCM 2000 Level of Service AHCM 2000 Volume to Capacity ratio 0.40Actuated Cycle Length (s) 90.0 Sum of lost time (s) 12.5Intersection Capacity Utilization 52.6% ICU Level of Service AAnalysis Period (min) 15c Critical Lane Group

HCM Unsignalized Intersection Capacity Analysis Children's Hospital9: Dover Street & 53rd Street Existing AM Plus Phase 2
Fehr & Peers Synchro 8 Report
Movement EBL EBT EBR WBL WBT WBR NBL NBT NBR SBL SBT SBRLane ConfigurationsVolume (veh/h) 11 2 24 3 3 6 13 23 11 2 29 18Sign Control Stop Stop Free FreeGrade 0% 0% 0% 0%Peak Hour Factor 1.00 1.00 1.00 1.00 1.00 1.00 1.00 1.00 1.00 1.00 1.00 1.00Hourly flow rate (vph) 11 2 24 3 3 6 13 23 11 2 29 18Pedestrians 22 21 2 2Lane Width (ft) 12.0 12.0 12.0 12.0Walking Speed (ft/s) 4.0 4.0 4.0 4.0Percent Blockage 2 2 0 0Right turn flare (veh)Median type None NoneMedian storage veh)Upstream signal (ft)pX, platoon unblockedvC, conflicting volume 128 145 62 144 148 52 69 55vC1, stage 1 conf volvC2, stage 2 conf volvCu, unblocked vol 128 145 62 144 148 52 69 55tC, single (s) 7.1 6.5 6.2 7.1 6.5 6.2 4.1 4.1tC, 2 stage (s)tF (s) 3.5 4.0 3.3 3.5 4.0 3.3 2.2 2.2p0 queue free % 99 100 98 100 100 99 99 100cM capacity (veh/h) 797 716 988 765 713 1003 1516 1536
Direction, Lane # EB 1 WB 1 NB 1 SB 1Volume Total 37 12 47 49Volume Left 11 3 13 2Volume Right 24 6 11 18cSH 905 850 1516 1536Volume to Capacity 0.04 0.01 0.01 0.00Queue Length 95th (ft) 3 1 1 0Control Delay (s) 9.1 9.3 2.1 0.3Lane LOS A A A AApproach Delay (s) 9.1 9.3 2.1 0.3Approach LOS A A
Intersection SummaryAverage Delay 3.9Intersection Capacity Utilization 21.5% ICU Level of Service AAnalysis Period (min) 15
HCM Signalized Intersection Capacity Analysis Children's Hospital10: MLK Way & 52nd Street Existing AM Plus Phase 2
Fehr & Peers Synchro 8 Report
Movement EBL EBT EBR WBL WBT WBR NBU NBL NBT NBR SBU SBLLane ConfigurationsVolume (vph) 38 80 100 82 82 241 50 56 1474 109 25 93Ideal Flow (vphpl) 1900 1900 1900 1900 1900 1900 1900 1900 1900 1900 1900 1900Total Lost time (s) 5.0 5.0 5.0 5.0 4.5 4.5 4.0Lane Util. Factor 1.00 1.00 1.00 1.00 1.00 0.91 1.00Frpb, ped/bikes 1.00 0.97 1.00 0.98 1.00 1.00 1.00Flpb, ped/bikes 0.99 1.00 0.98 1.00 1.00 1.00 1.00Frt 1.00 0.92 1.00 0.85 1.00 0.99 1.00Flt Protected 0.95 1.00 0.98 1.00 0.95 1.00 0.95Satd. Flow (prot) 1775 1668 1788 1544 1787 5070 1787Flt Permitted 0.60 1.00 0.71 1.00 0.95 1.00 0.95Satd. Flow (perm) 1127 1668 1297 1544 1787 5070 1787Peak-hour factor, PHF 1.00 1.00 1.00 1.00 1.00 1.00 1.00 1.00 1.00 1.00 1.00 1.00Adj. Flow (vph) 38 80 100 82 82 241 50 56 1474 109 25 93RTOR Reduction (vph) 0 57 0 0 0 180 0 0 8 0 0 0Lane Group Flow (vph) 38 123 0 0 164 61 0 106 1575 0 0 118Confl. Peds. (#/hr) 10 49 49 10 7Confl. Bikes (#/hr) 6 5 1Heavy Vehicles (%) 1% 1% 1% 2% 2% 2% 1% 1% 1% 1% 1% 1%Turn Type Perm NA Perm NA Perm Prot Prot NA Prot ProtProtected Phases 4 8 5 5 2 1 1Permitted Phases 4 8 8Actuated Green, G (s) 22.7 22.7 22.7 22.7 7.2 41.3 12.5Effective Green, g (s) 22.7 22.7 22.7 22.7 7.2 41.3 12.5Actuated g/C Ratio 0.25 0.25 0.25 0.25 0.08 0.46 0.14Clearance Time (s) 5.0 5.0 5.0 5.0 4.5 4.5 4.0Vehicle Extension (s) 2.0 2.0 2.0 2.0 2.0 2.0 2.0Lane Grp Cap (vph) 284 420 327 389 142 2326 248v/s Ratio Prot 0.07 0.06 c0.31 0.07v/s Ratio Perm 0.03 c0.13 0.04v/c Ratio 0.13 0.29 0.50 0.16 0.75 0.68 0.48Uniform Delay, d1 26.0 27.2 28.8 26.2 40.5 19.1 35.7Progression Factor 1.00 1.00 1.00 1.00 0.99 1.06 0.77Incremental Delay, d2 0.1 0.1 0.4 0.1 8.1 0.7 0.5Delay (s) 26.1 27.3 29.2 26.3 48.4 21.0 27.9Level of Service C C C C D C CApproach Delay (s) 27.1 27.5 22.7Approach LOS C C C
Intersection SummaryHCM 2000 Control Delay 19.6 HCM 2000 Level of Service BHCM 2000 Volume to Capacity ratio 0.62Actuated Cycle Length (s) 90.0 Sum of lost time (s) 14.0Intersection Capacity Utilization 94.9% ICU Level of Service FAnalysis Period (min) 15c Critical Lane Group

HCM Signalized Intersection Capacity Analysis Children's Hospital10: MLK Way & 52nd Street Existing AM Plus Phase 2
Fehr & Peers Synchro 8 Report
Movement SBT SBRLane ConfigurationsVolume (vph) 1477 0Ideal Flow (vphpl) 1900 1900Total Lost time (s) 4.5Lane Util. Factor 0.91Frpb, ped/bikes 1.00Flpb, ped/bikes 1.00Frt 1.00Flt Protected 1.00Satd. Flow (prot) 5136Flt Permitted 1.00Satd. Flow (perm) 5136Peak-hour factor, PHF 1.00 1.00Adj. Flow (vph) 1477 0RTOR Reduction (vph) 0 0Lane Group Flow (vph) 1477 0Confl. Peds. (#/hr) 10Confl. Bikes (#/hr) 10Heavy Vehicles (%) 1% 1%Turn Type NAProtected Phases 6Permitted PhasesActuated Green, G (s) 46.1Effective Green, g (s) 46.1Actuated g/C Ratio 0.51Clearance Time (s) 4.5Vehicle Extension (s) 2.0Lane Grp Cap (vph) 2630v/s Ratio Prot c0.29v/s Ratio Permv/c Ratio 0.56Uniform Delay, d1 15.0Progression Factor 0.75Incremental Delay, d2 0.8Delay (s) 12.0Level of Service BApproach Delay (s) 13.2Approach LOS B
Intersection Summary
HCM Signalized Intersection Capacity Analysis Children's Hospital11: 52nd Street & Garage Existing AM Plus Phase 2
Fehr & Peers Synchro 8 Report
Movement EBL EBT EBR WBL WBT WBR NBL NBT NBR SBL SBT SBRLane ConfigurationsVolume (vph) 4 274 4 3 385 2 7 3 5 0 2 15Ideal Flow (vphpl) 1900 1900 1900 1900 1900 1900 1900 1900 1900 1900 1900 1900Total Lost time (s) 3.0 3.0 3.0 3.0Lane Util. Factor 1.00 1.00 1.00 1.00Frpb, ped/bikes 1.00 1.00 0.95 0.99Flpb, ped/bikes 1.00 1.00 1.00 1.00Frt 1.00 1.00 0.95 0.88Flt Protected 1.00 1.00 0.98 1.00Satd. Flow (prot) 1854 1897 1457 1655Flt Permitted 1.00 1.00 0.95 1.00Satd. Flow (perm) 1848 1894 1418 1655Peak-hour factor, PHF 1.00 1.00 1.00 1.00 1.00 1.00 1.00 1.00 1.00 1.00 1.00 1.00Adj. Flow (vph) 4 274 4 3 385 2 7 3 5 0 2 15RTOR Reduction (vph) 0 1 0 0 1 0 0 3 0 0 8 0Lane Group Flow (vph) 0 281 0 0 389 0 0 12 0 0 9 0Confl. Peds. (#/hr) 17 55 55 17 202 202Confl. Bikes (#/hr) 6 5 1Heavy Vehicles (%) 2% 2% 2% 0% 0% 0% 16% 16% 16% 0% 0% 0%Turn Type Perm NA Perm NA Perm NA NAProtected Phases 2 6 4 8Permitted Phases 2 6 4 8Actuated Green, G (s) 21.0 21.0 23.0 23.0Effective Green, g (s) 21.0 21.0 23.0 23.0Actuated g/C Ratio 0.42 0.42 0.46 0.46Clearance Time (s) 3.0 3.0 3.0 3.0Lane Grp Cap (vph) 776 795 652 761v/s Ratio Prot 0.01v/s Ratio Perm 0.15 c0.21 c0.01v/c Ratio 0.36 0.49 0.02 0.01Uniform Delay, d1 9.9 10.6 7.4 7.3Progression Factor 1.00 1.00 1.00 1.00Incremental Delay, d2 1.3 2.2 0.1 0.0Delay (s) 11.2 12.7 7.4 7.4Level of Service B B A AApproach Delay (s) 11.2 12.7 7.4 7.4Approach LOS B B A A
Intersection SummaryHCM 2000 Control Delay 11.9 HCM 2000 Level of Service BHCM 2000 Volume to Capacity ratio 0.24Actuated Cycle Length (s) 50.0 Sum of lost time (s) 6.0Intersection Capacity Utilization 47.9% ICU Level of Service AAnalysis Period (min) 15c Critical Lane Group

HCM Unsignalized Intersection Capacity Analysis Children's Hospital12: 52nd Street & Dover Street Existing AM Plus Phase 2
Fehr & Peers Synchro 8 Report
Movement EBL EBT EBR WBL WBT WBR NBL NBT NBR SBL SBT SBRLane ConfigurationsVolume (veh/h) 19 184 73 42 326 27 36 2 26 35 6 25Sign Control Free Free Stop StopGrade 0% 0% 0% 0%Peak Hour Factor 1.00 1.00 1.00 1.00 1.00 1.00 1.00 1.00 1.00 1.00 1.00 1.00Hourly flow rate (vph) 19 184 73 42 326 27 36 2 26 35 6 25Pedestrians 20 10 12 23Lane Width (ft) 12.0 12.0 12.0 12.0Walking Speed (ft/s) 4.0 4.0 4.0 4.0Percent Blockage 2 1 1 2Right turn flare (veh)Median type None NoneMedian storage veh)Upstream signal (ft) 312 647pX, platoon unblocked 0.88 0.91 0.93 0.93 0.91 0.93 0.93 0.88vC, conflicting volume 376 269 742 730 242 742 754 382vC1, stage 1 conf volvC2, stage 2 conf volvCu, unblocked vol 229 146 465 452 117 465 477 237tC, single (s) 4.1 4.1 7.2 6.6 6.3 7.1 6.5 6.2tC, 2 stage (s)tF (s) 2.2 2.2 3.6 4.1 3.4 3.5 4.0 3.3p0 queue free % 98 97 91 100 97 92 99 96cM capacity (veh/h) 1156 1298 402 422 816 420 421 689
Direction, Lane # EB 1 WB 1 NB 1 SB 1Volume Total 276 395 64 66Volume Left 19 42 36 35Volume Right 73 27 26 25cSH 1156 1298 508 493Volume to Capacity 0.02 0.03 0.13 0.13Queue Length 95th (ft) 1 3 11 11Control Delay (s) 0.7 1.1 13.1 13.4Lane LOS A A B BApproach Delay (s) 0.7 1.1 13.1 13.4Approach LOS B B
Intersection SummaryAverage Delay 3.0Intersection Capacity Utilization 47.2% ICU Level of Service AAnalysis Period (min) 15
HCM Unsignalized Intersection Capacity Analysis Children's Hospital13: SR-24 NB Off-Ramp & 52nd Street Existing AM Plus Phase 2
Fehr & Peers Synchro 8 Report
Movement EBL EBT EBR WBL WBT WBR NBL NBR SEL SERLane ConfigurationsVolume (veh/h) 0 237 0 0 399 1076 0 898 0 0Sign Control Free Free Stop StopGrade 0% 0% 0% 0%Peak Hour Factor 1.00 1.00 1.00 1.00 1.00 1.00 1.00 1.00 1.00 1.00Hourly flow rate (vph) 0 237 0 0 399 1076 0 898 0 0Pedestrians 24Lane Width (ft) 12.0Walking Speed (ft/s) 4.0Percent Blockage 2Right turn flare (veh)Median type None NoneMedian storage veh)Upstream signal (ft) 767 192pX, platoon unblocked 0.82 0.82 0.82 0.82vC, conflicting volume 1475 261 1736 142 1416 660vC1, stage 1 conf volvC2, stage 2 conf volvCu, unblocked vol 1150 261 1467 142 1078 162tC, single (s) 4.1 4.1 6.5 7.0 7.5 6.5tC, 2 stage (s)tF (s) 2.2 2.2 4.0 3.3 3.5 4.0p0 queue free % 100 100 100 0 0 100cM capacity (veh/h) 497 1274 102 859 0 589
Direction, Lane # EB 1 EB 2 WB 1 WB 2 WB 3 NB 1 NB 2Volume Total 118 118 266 492 717 449 449Volume Left 0 0 0 0 0 0 0Volume Right 0 0 0 359 717 449 449cSH 1700 1700 1700 1700 1700 859 859Volume to Capacity 0.07 0.07 0.16 0.29 0.42 0.52 0.52Queue Length 95th (ft) 0 0 0 0 0 78 78Control Delay (s) 0.0 0.0 0.0 0.0 0.0 13.7 13.7Lane LOS B BApproach Delay (s) 0.0 0.0 13.7Approach LOS B
Intersection SummaryAverage Delay 4.7Intersection Capacity Utilization 48.4% ICU Level of Service AAnalysis Period (min) 15

HCM Signalized Intersection Capacity Analysis Children's Hospital14: 52nd Street & Shattuck Ave Existing AM Plus Phase 2
Fehr & Peers Synchro 8 Report
Movement EBU EBL EBT EBR WBL WBT WBR NBL NBT NBR SBL SBTLane ConfigurationsVolume (vph) 40 286 696 148 24 897 82 154 123 30 96 136Ideal Flow (vphpl) 1900 1900 1900 1900 1900 1900 1900 1900 1900 1900 1900 1900Total Lost time (s) 4.0 4.5 4.0 4.5 4.0 5.5 5.5Lane Util. Factor 1.00 0.91 1.00 0.91 1.00 1.00 1.00Frpb, ped/bikes 1.00 0.99 1.00 1.00 1.00 0.99 1.00Flpb, ped/bikes 1.00 1.00 1.00 1.00 1.00 1.00 1.00Frt 1.00 0.97 1.00 0.99 1.00 0.97 1.00Flt Protected 0.95 1.00 0.95 1.00 0.95 1.00 0.98Satd. Flow (prot) 1787 4947 1805 5107 1752 1781 1734Flt Permitted 0.95 1.00 0.95 1.00 0.44 1.00 0.80Satd. Flow (perm) 1787 4947 1805 5107 809 1781 1410Peak-hour factor, PHF 1.00 1.00 1.00 1.00 1.00 1.00 1.00 1.00 1.00 1.00 1.00 1.00Adj. Flow (vph) 40 286 696 148 24 897 82 154 123 30 96 136RTOR Reduction (vph) 0 0 30 0 0 12 0 0 10 0 0 0Lane Group Flow (vph) 0 326 814 0 24 967 0 154 143 0 0 232Confl. Peds. (#/hr) 12 5 10 10Confl. Bikes (#/hr) 12 1 10Heavy Vehicles (%) 1% 1% 1% 1% 0% 0% 0% 3% 3% 3% 7% 7%Turn Type Prot Prot NA Prot NA pm+pt NA Perm NAProtected Phases 7 7 4 3 8 5 2 6Permitted Phases 2 6Actuated Green, G (s) 21.5 37.7 3.2 19.4 35.1 35.1 24.6Effective Green, g (s) 21.5 37.7 3.2 19.4 35.1 35.1 24.6Actuated g/C Ratio 0.24 0.42 0.04 0.22 0.39 0.39 0.27Clearance Time (s) 4.0 4.5 4.0 4.5 4.0 5.5 5.5Vehicle Extension (s) 3.0 3.0 3.0 3.0 3.0 3.0 3.0Lane Grp Cap (vph) 426 2072 64 1100 383 694 385v/s Ratio Prot c0.18 0.16 0.01 c0.19 c0.03 0.08v/s Ratio Perm 0.13 c0.16v/c Ratio 0.77 0.39 0.38 0.88 0.40 0.21 0.60Uniform Delay, d1 31.9 18.2 42.4 34.2 18.8 18.2 28.4Progression Factor 1.00 1.00 1.22 0.84 1.00 1.00 1.00Incremental Delay, d2 12.3 0.6 3.1 8.6 0.7 0.7 6.8Delay (s) 44.2 18.7 54.6 37.3 19.5 18.9 35.3Level of Service D B D D B B DApproach Delay (s) 25.9 37.7 19.2 30.3Approach LOS C D B C
Intersection SummaryHCM 2000 Control Delay 29.9 HCM 2000 Level of Service CHCM 2000 Volume to Capacity ratio 0.71Actuated Cycle Length (s) 90.0 Sum of lost time (s) 18.0Intersection Capacity Utilization 101.0% ICU Level of Service GAnalysis Period (min) 15c Critical Lane Group
HCM Signalized Intersection Capacity Analysis Children's Hospital14: 52nd Street & Shattuck Ave Existing AM Plus Phase 2
Fehr & Peers Synchro 8 Report
Movement SBRLane ConfigurationsVolume (vph) 378Ideal Flow (vphpl) 1900Total Lost time (s) 5.5Lane Util. Factor 1.00Frpb, ped/bikes 0.94Flpb, ped/bikes 1.00Frt 0.85Flt Protected 1.00Satd. Flow (prot) 1419Flt Permitted 1.00Satd. Flow (perm) 1419Peak-hour factor, PHF 1.00Adj. Flow (vph) 378RTOR Reduction (vph) 275Lane Group Flow (vph) 103Confl. Peds. (#/hr) 16Confl. Bikes (#/hr) 41Heavy Vehicles (%) 7%Turn Type PermProtected PhasesPermitted Phases 6Actuated Green, G (s) 24.6Effective Green, g (s) 24.6Actuated g/C Ratio 0.27Clearance Time (s) 5.5Vehicle Extension (s) 3.0Lane Grp Cap (vph) 387v/s Ratio Protv/s Ratio Perm 0.07v/c Ratio 0.27Uniform Delay, d1 25.6Progression Factor 1.00Incremental Delay, d2 1.7Delay (s) 27.3Level of Service CApproach Delay (s)Approach LOS
Intersection Summary

HCM Signalized Intersection Capacity Analysis Children's Hospital15: Telegraph Ave & 52nd Street/Claremont Ave Existing AM Plus Phase 2
Fehr & Peers Synchro 8 Report
Movement EBL EBT EBR WBL WBT WBR NBL NBT NBR SBL SBT SBRLane ConfigurationsVolume (vph) 6 0 6 94 52 154 0 665 117 64 598 289Ideal Flow (vphpl) 1900 1900 1900 1900 1900 1900 1900 1900 1900 1900 1900 1900Lane Width 12 12 12 12 12 12 12 16 12 12 12 12Total Lost time (s) 4.5 4.5 4.5 4.5 4.5 4.5Lane Util. Factor 1.00 0.95 0.95 0.95 1.00 0.95Frpb, ped/bikes 0.98 1.00 0.99 0.99 1.00 0.97Flpb, ped/bikes 1.00 1.00 1.00 1.00 1.00 1.00Frt 0.93 1.00 0.89 0.98 1.00 0.95Flt Protected 0.98 0.95 1.00 1.00 0.95 1.00Satd. Flow (prot) 1576 1698 1569 3853 1770 3270Flt Permitted 0.98 0.95 1.00 1.00 0.95 1.00Satd. Flow (perm) 1576 1698 1569 3853 1770 3270Peak-hour factor, PHF 1.00 1.00 1.00 1.00 1.00 1.00 1.00 1.00 1.00 1.00 1.00 1.00Adj. Flow (vph) 6 0 6 94 52 154 0 665 117 64 598 289RTOR Reduction (vph) 0 12 0 0 119 0 0 10 0 0 40 0Lane Group Flow (vph) 0 0 0 85 96 0 0 772 0 64 847 0Confl. Peds. (#/hr) 4 4 22 18 22Confl. Bikes (#/hr) 1 2 33 27Heavy Vehicles (%) 8% 8% 8% 1% 1% 1% 3% 3% 3% 2% 2% 2%Turn Type Split NA Split NA NA Prot NAProtected Phases 4 4 8 8 2 1 6Permitted Phases 2Actuated Green, G (s) 1.1 15.4 15.4 48.2 7.3 60.0Effective Green, g (s) 1.1 15.4 15.4 48.2 7.3 60.0Actuated g/C Ratio 0.01 0.17 0.17 0.54 0.08 0.67Clearance Time (s) 4.5 4.5 4.5 4.5 4.5 4.5Vehicle Extension (s) 3.0 3.0 3.0 3.0 3.0 3.0Lane Grp Cap (vph) 19 290 268 2063 143 2180v/s Ratio Prot c0.00 0.05 c0.06 0.20 0.04 c0.26v/s Ratio Permv/c Ratio 0.01 0.29 0.36 0.37 0.45 0.39Uniform Delay, d1 43.9 32.6 32.9 12.1 39.4 6.7Progression Factor 1.00 1.00 1.00 0.97 1.00 1.00Incremental Delay, d2 0.1 0.6 0.8 0.5 2.2 0.5Delay (s) 44.0 33.1 33.8 12.2 41.7 7.3Level of Service D C C B D AApproach Delay (s) 44.0 33.6 12.2 9.6Approach LOS D C B A
Intersection SummaryHCM 2000 Control Delay 14.3 HCM 2000 Level of Service BHCM 2000 Volume to Capacity ratio 0.40Actuated Cycle Length (s) 90.0 Sum of lost time (s) 18.0Intersection Capacity Utilization 70.8% ICU Level of Service CAnalysis Period (min) 15c Critical Lane Group
HCM Signalized Intersection Capacity Analysis Children's Hospital16: Telegraph Ave & 51St Street Existing AM Plus Phase 2
Fehr & Peers Synchro 8 Report
Movement EBL EBT EBR WBL WBT WBR NBL NBT NBR SBL SBT SBRLane ConfigurationsVolume (vph) 228 490 71 101 534 238 97 320 58 147 511 38Ideal Flow (vphpl) 1900 1900 1900 1900 1900 1900 1900 1900 1900 1900 1900 1900Total Lost time (s) 4.0 4.0 4.0 3.5 4.0 4.5 4.0 3.5Lane Util. Factor 0.97 0.95 1.00 0.95 1.00 0.95 1.00 0.95Frpb, ped/bikes 1.00 0.99 1.00 0.98 1.00 0.99 1.00 0.99Flpb, ped/bikes 1.00 1.00 1.00 1.00 1.00 1.00 1.00 1.00Frt 1.00 0.98 1.00 0.95 1.00 0.98 1.00 0.99Flt Protected 0.95 1.00 0.95 1.00 0.95 1.00 0.95 1.00Satd. Flow (prot) 3400 3414 1787 3350 1719 3324 1752 3447Flt Permitted 0.95 1.00 0.95 1.00 0.95 1.00 0.95 1.00Satd. Flow (perm) 3400 3414 1787 3350 1719 3324 1752 3447Peak-hour factor, PHF 1.00 1.00 1.00 1.00 1.00 1.00 1.00 1.00 1.00 1.00 1.00 1.00Adj. Flow (vph) 228 490 71 101 534 238 97 320 58 147 511 38RTOR Reduction (vph) 0 12 0 0 55 0 0 16 0 0 5 0Lane Group Flow (vph) 228 549 0 101 717 0 97 362 0 147 544 0Confl. Peds. (#/hr) 31 31 30 37Confl. Bikes (#/hr) 9 7 27 27Heavy Vehicles (%) 3% 3% 3% 1% 1% 1% 5% 5% 5% 3% 3% 3%Turn Type Prot NA Prot NA Prot NA Prot NAProtected Phases 7 4 3 8 5 2 1 6Permitted PhasesActuated Green, G (s) 11.2 29.0 8.6 26.9 8.6 24.9 11.0 28.3Effective Green, g (s) 11.2 29.0 8.6 26.9 8.6 24.9 11.0 28.3Actuated g/C Ratio 0.12 0.32 0.10 0.30 0.10 0.28 0.12 0.31Clearance Time (s) 4.0 4.0 4.0 3.5 4.0 4.5 4.0 3.5Vehicle Extension (s) 3.0 3.0 3.0 3.0 3.0 3.0 3.0 3.0Lane Grp Cap (vph) 423 1100 170 1001 164 919 214 1083v/s Ratio Prot c0.07 c0.16 0.06 c0.21 0.06 0.11 c0.08 c0.16v/s Ratio Permv/c Ratio 0.54 0.50 0.59 0.72 0.59 0.39 0.69 0.50Uniform Delay, d1 37.0 24.6 39.0 28.1 39.0 26.4 37.8 25.1Progression Factor 1.29 0.79 1.00 1.00 1.00 1.00 1.01 0.86Incremental Delay, d2 1.2 1.5 5.5 4.4 5.6 1.3 8.4 1.6Delay (s) 49.0 21.1 44.5 32.5 44.6 27.7 46.6 23.3Level of Service D C D C D C D CApproach Delay (s) 29.2 33.9 31.2 28.2Approach LOS C C C C
Intersection SummaryHCM 2000 Control Delay 30.7 HCM 2000 Level of Service CHCM 2000 Volume to Capacity ratio 0.62Actuated Cycle Length (s) 90.0 Sum of lost time (s) 16.5Intersection Capacity Utilization 70.0% ICU Level of Service CAnalysis Period (min) 15c Critical Lane Group

HCM Signalized Intersection Capacity Analysis Children's Hospital17: SB SR-24 On-Ramp & MLK Way & NB SR-24 Off-Ramp Existing AM Plus Phase 2
Fehr & Peers Synchro 8 Report
Movement EBL EBT EBR WBL WBT WBR NBL NBT NBR SBL SBT SBRLane ConfigurationsVolume (vph) 151 0 0 0 0 1535 0 0 0 0 1435 235Ideal Flow (vphpl) 1900 1900 1900 1900 1900 1900 1900 1900 1900 1900 1900 1900Total Lost time (s) 4.0 4.0 4.0 4.0Lane Util. Factor 0.97 1.00 0.95 0.88Frpb, ped/bikes 1.00 1.00 1.00 1.00Flpb, ped/bikes 1.00 1.00 1.00 1.00Frt 1.00 0.86 1.00 0.85Flt Protected 0.95 1.00 1.00 1.00Satd. Flow (prot) 3273 1627 3574 2814Flt Permitted 0.95 1.00 1.00 1.00Satd. Flow (perm) 3273 1627 3574 2814Peak-hour factor, PHF 1.00 1.00 1.00 1.00 1.00 1.00 1.00 1.00 1.00 1.00 1.00 1.00Adj. Flow (vph) 151 0 0 0 0 1535 0 0 0 0 1435 235RTOR Reduction (vph) 0 0 0 0 0 0 0 0 0 0 0 0Lane Group Flow (vph) 151 0 0 0 0 1535 0 0 0 0 1435 235Confl. Bikes (#/hr) 2Heavy Vehicles (%) 7% 7% 2% 2% 1% 1% 2% 2% 2% 2% 1% 1%Turn Type Prot Free NA customProtected Phases 2 6 FreePermitted Phases FreeActuated Green, G (s) 8.0 45.0 29.0 45.0Effective Green, g (s) 8.0 45.0 29.0 45.0Actuated g/C Ratio 0.18 1.00 0.64 1.00Clearance Time (s) 4.0 4.0Lane Grp Cap (vph) 581 1627 2303 2814v/s Ratio Prot 0.05 0.40 0.08v/s Ratio Perm c0.94v/c Ratio 0.26 0.94 0.62 0.08Uniform Delay, d1 15.9 0.0 4.8 0.0Progression Factor 1.00 1.00 1.72 1.00Incremental Delay, d2 1.1 12.4 1.1 0.0Delay (s) 17.0 12.4 9.3 0.0Level of Service B B A AApproach Delay (s) 17.0 12.4 0.0 8.0Approach LOS B B A A
Intersection SummaryHCM 2000 Control Delay 10.4 HCM 2000 Level of Service BHCM 2000 Volume to Capacity ratio 1.15Actuated Cycle Length (s) 45.0 Sum of lost time (s) 8.0Intersection Capacity Utilization 50.6% ICU Level of Service AAnalysis Period (min) 15c Critical Lane Group
HCM Unsignalized Intersection Capacity Analysis Children's Hospital18: West Street & 52nd Street Existing AM Plus Phase 2
Fehr & Peers Synchro 8 Report
Movement EBL EBT EBR WBL WBT WBR NBL NBT NBR SBL SBT SBRLane ConfigurationsSign Control Stop Stop Stop StopVolume (vph) 0 162 10 57 74 0 22 0 71 2 43 5Peak Hour Factor 1.00 1.00 1.00 1.00 1.00 1.00 1.00 1.00 1.00 1.00 1.00 1.00Hourly flow rate (vph) 0 162 10 57 74 0 22 0 71 2 43 5
Direction, Lane # EB 1 WB 1 NB 1 NB 2 SB 1Volume Total (vph) 172 131 22 71 50Volume Left (vph) 0 57 22 0 2Volume Right (vph) 10 0 0 71 5Hadj (s) -0.02 0.12 0.50 -0.70 -0.02Departure Headway (s) 4.4 4.6 5.8 4.6 4.8Degree Utilization, x 0.21 0.17 0.04 0.09 0.07Capacity (veh/h) 792 751 589 736 691Control Delay (s) 8.5 8.5 7.8 6.8 8.2Approach Delay (s) 8.5 8.5 7.0 8.2Approach LOS A A A A
Intersection SummaryDelay 8.2Level of Service AIntersection Capacity Utilization 36.4% ICU Level of Service AAnalysis Period (min) 15

HCM Unsignalized Intersection Capacity Analysis Children's Hospital19: Genoa Street & 52nd Street Existing AM Plus Phase 2
Fehr & Peers Synchro 8 Report
Movement EBL EBT EBR WBL WBT WBR NBL NBT NBR SBL SBT SBRLane ConfigurationsSign Control Stop Stop Stop StopVolume (vph) 5 147 1 4 79 20 1 0 3 15 0 3Peak Hour Factor 1.00 1.00 1.00 1.00 1.00 1.00 1.00 1.00 1.00 1.00 1.00 1.00Hourly flow rate (vph) 5 147 1 4 79 20 1 0 3 15 0 3
Direction, Lane # EB 1 WB 1 NB 1 SB 1Volume Total (vph) 153 103 4 18Volume Left (vph) 5 4 1 15Volume Right (vph) 1 20 3 3Hadj (s) 0.02 -0.11 -0.40 0.07Departure Headway (s) 4.1 4.0 4.1 4.5Degree Utilization, x 0.17 0.11 0.00 0.02Capacity (veh/h) 872 888 824 742Control Delay (s) 7.9 7.5 7.1 7.6Approach Delay (s) 7.9 7.5 7.1 7.6Approach LOS A A A A
Intersection SummaryDelay 7.7Level of Service AIntersection Capacity Utilization 21.6% ICU Level of Service AAnalysis Period (min) 15
HCM Unsignalized Intersection Capacity Analysis Children's Hospital20: Genoa Street & 55th Street Existing AM Plus Phase 2
Fehr & Peers Synchro 8 Report
Movement EBL EBT EBR WBL WBT WBR NBL NBT NBR SBL SBT SBRLane ConfigurationsVolume (veh/h) 2 354 0 4 312 10 6 11 14 32 12 8Sign Control Free Free Stop StopGrade 0% 0% 0% 0%Peak Hour Factor 1.00 1.00 1.00 1.00 1.00 1.00 1.00 1.00 1.00 1.00 1.00 1.00Hourly flow rate (vph) 2 354 0 4 312 10 6 11 14 32 12 8Pedestrians 8 2 10 11Lane Width (ft) 12.0 12.0 12.0 12.0Walking Speed (ft/s) 4.0 4.0 4.0 4.0Percent Blockage 1 0 1 1Right turn flare (veh)Median type None NoneMedian storage veh)Upstream signal (ft) 721pX, platoon unblockedvC, conflicting volume 333 364 715 709 366 716 704 336vC1, stage 1 conf volvC2, stage 2 conf volvCu, unblocked vol 333 364 715 709 366 716 704 336tC, single (s) 4.1 4.1 7.1 6.5 6.2 7.1 6.5 6.2tC, 2 stage (s)tF (s) 2.2 2.2 3.5 4.0 3.3 3.5 4.0 3.3p0 queue free % 100 100 98 97 98 90 97 99cM capacity (veh/h) 1221 1196 325 353 677 321 353 695
Direction, Lane # EB 1 WB 1 NB 1 SB 1Volume Total 356 326 31 52Volume Left 2 4 6 32Volume Right 0 10 14 8cSH 1221 1196 441 358Volume to Capacity 0.00 0.00 0.07 0.15Queue Length 95th (ft) 0 0 6 13Control Delay (s) 0.1 0.1 13.8 16.7Lane LOS A A B CApproach Delay (s) 0.1 0.1 13.8 16.7Approach LOS B C
Intersection SummaryAverage Delay 1.8Intersection Capacity Utilization 35.4% ICU Level of Service AAnalysis Period (min) 15
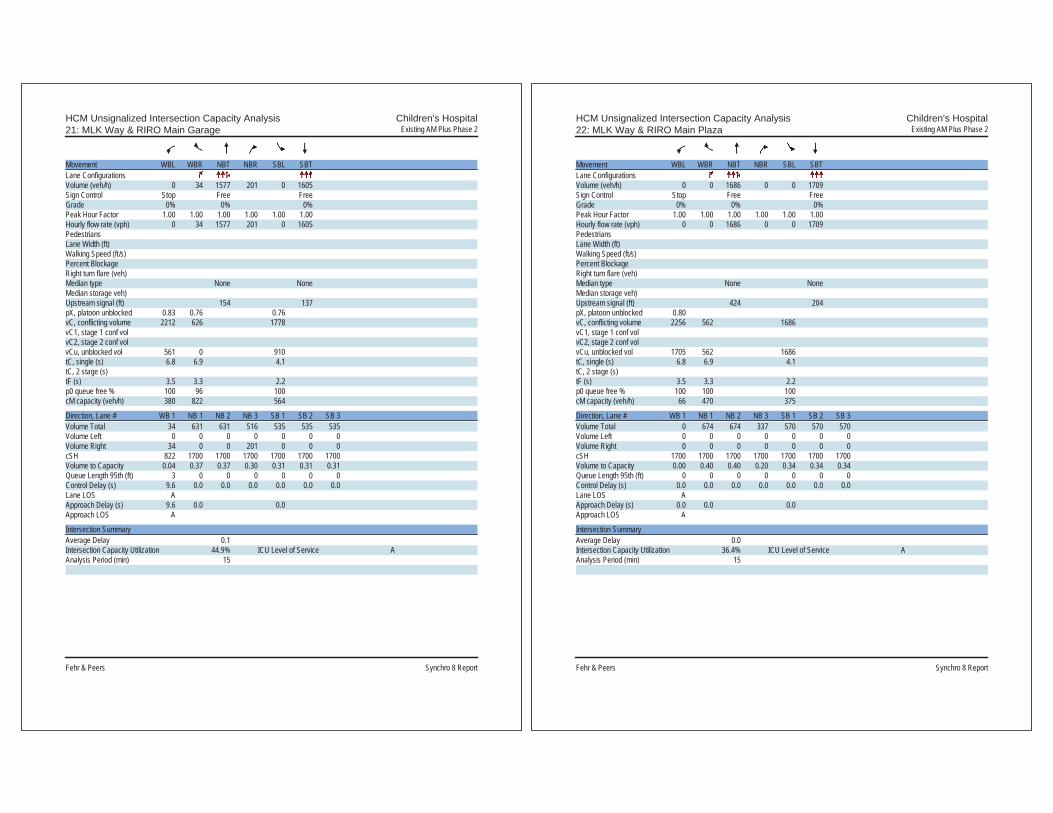
HCM Unsignalized Intersection Capacity Analysis Children's Hospital21: MLK Way & RIRO Main Garage Existing AM Plus Phase 2
Fehr & Peers Synchro 8 Report
Movement WBL WBR NBT NBR SBL SBTLane ConfigurationsVolume (veh/h) 0 34 1577 201 0 1605Sign Control Stop Free FreeGrade 0% 0% 0%Peak Hour Factor 1.00 1.00 1.00 1.00 1.00 1.00Hourly flow rate (vph) 0 34 1577 201 0 1605PedestriansLane Width (ft)Walking Speed (ft/s)Percent BlockageRight turn flare (veh)Median type None NoneMedian storage veh)Upstream signal (ft) 154 137pX, platoon unblocked 0.83 0.76 0.76vC, conflicting volume 2212 626 1778vC1, stage 1 conf volvC2, stage 2 conf volvCu, unblocked vol 561 0 910tC, single (s) 6.8 6.9 4.1tC, 2 stage (s)tF (s) 3.5 3.3 2.2p0 queue free % 100 96 100cM capacity (veh/h) 380 822 564
Direction, Lane # WB 1 NB 1 NB 2 NB 3 SB 1 SB 2 SB 3Volume Total 34 631 631 516 535 535 535Volume Left 0 0 0 0 0 0 0Volume Right 34 0 0 201 0 0 0cSH 822 1700 1700 1700 1700 1700 1700Volume to Capacity 0.04 0.37 0.37 0.30 0.31 0.31 0.31Queue Length 95th (ft) 3 0 0 0 0 0 0Control Delay (s) 9.6 0.0 0.0 0.0 0.0 0.0 0.0Lane LOS AApproach Delay (s) 9.6 0.0 0.0Approach LOS A
Intersection SummaryAverage Delay 0.1Intersection Capacity Utilization 44.9% ICU Level of Service AAnalysis Period (min) 15
HCM Unsignalized Intersection Capacity Analysis Children's Hospital22: MLK Way & RIRO Main Plaza Existing AM Plus Phase 2
Fehr & Peers Synchro 8 Report
Movement WBL WBR NBT NBR SBL SBTLane ConfigurationsVolume (veh/h) 0 0 1686 0 0 1709Sign Control Stop Free FreeGrade 0% 0% 0%Peak Hour Factor 1.00 1.00 1.00 1.00 1.00 1.00Hourly flow rate (vph) 0 0 1686 0 0 1709PedestriansLane Width (ft)Walking Speed (ft/s)Percent BlockageRight turn flare (veh)Median type None NoneMedian storage veh)Upstream signal (ft) 424 204pX, platoon unblocked 0.80vC, conflicting volume 2256 562 1686vC1, stage 1 conf volvC2, stage 2 conf volvCu, unblocked vol 1705 562 1686tC, single (s) 6.8 6.9 4.1tC, 2 stage (s)tF (s) 3.5 3.3 2.2p0 queue free % 100 100 100cM capacity (veh/h) 66 470 375
Direction, Lane # WB 1 NB 1 NB 2 NB 3 SB 1 SB 2 SB 3Volume Total 0 674 674 337 570 570 570Volume Left 0 0 0 0 0 0 0Volume Right 0 0 0 0 0 0 0cSH 1700 1700 1700 1700 1700 1700 1700Volume to Capacity 0.00 0.40 0.40 0.20 0.34 0.34 0.34Queue Length 95th (ft) 0 0 0 0 0 0 0Control Delay (s) 0.0 0.0 0.0 0.0 0.0 0.0 0.0Lane LOS AApproach Delay (s) 0.0 0.0 0.0Approach LOS A
Intersection SummaryAverage Delay 0.0Intersection Capacity Utilization 36.4% ICU Level of Service AAnalysis Period (min) 15

HCM Unsignalized Intersection Capacity Analysis Children's Hospital24: 51St Street & 52nd Street Existing AM Plus Phase 2
Fehr & Peers Synchro 8 Report
Intersection Sign configuration not allowed in HCM analysis.
HCM Signalized Intersection Capacity Analysis Children's Hospital 1: MLK Way & 55th Street

HCM Signalized Intersection Capacity Analysis Children's Hospital 1: MLK Way & 55th Street
HCM Unsignalized Intersection Capacity Analysis Children's Hospital 2: Dover Street & 55th Street

HCM Signalized Intersection Capacity Analysis Children's Hospital 3: 55th Street & Shattuck Ave
HCM Signalized Intersection Capacity Analysis Children's Hospital 4: 55th Street & Telegraph Ave

HCM Unsignalized Intersection Capacity Analysis Children's Hospital 5: MLK Way & 54th Street
HCM Unsignalized Intersection Capacity Analysis Children's Hospital 5: MLK Way & 54th Street

HCM Unsignalized Intersection Capacity Analysis Children's Hospital 6: Dover Street & 54th Street
HCM Unsignalized Intersection Capacity Analysis Children's Hospital 7: Shattuck Ave & 54th Street

HCM Signalized Intersection Capacity Analysis Children's Hospital 8: MLK Way & 53rd Street
HCM Signalized Intersection Capacity Analysis Children's Hospital 8: MLK Way & 53rd Street

HCM Unsignalized Intersection Capacity Analysis Children's Hospital 9: Dover Street & 53rd Street
HCM Signalized Intersection Capacity Analysis Children's Hospital 10: MLK Way & 52nd Street

HCM Signalized Intersection Capacity Analysis Children's Hospital 10: MLK Way & 52nd Street
HCM Signalized Intersection Capacity Analysis Children's Hospital 11: 52nd Street & Garage

HCM Unsignalized Intersection Capacity Analysis Children's Hospital 12: 52nd Street & Dover Street
HCM Unsignalized Intersection Capacity Analysis Children's Hospital 13: SR-24 NB Off-Ramp & 52nd Street

HCM Signalized Intersection Capacity Analysis Children's Hospital 14: 52nd Street & Shattuck Ave
HCM Signalized Intersection Capacity Analysis Children's Hospital 14: 52nd Street & Shattuck Ave
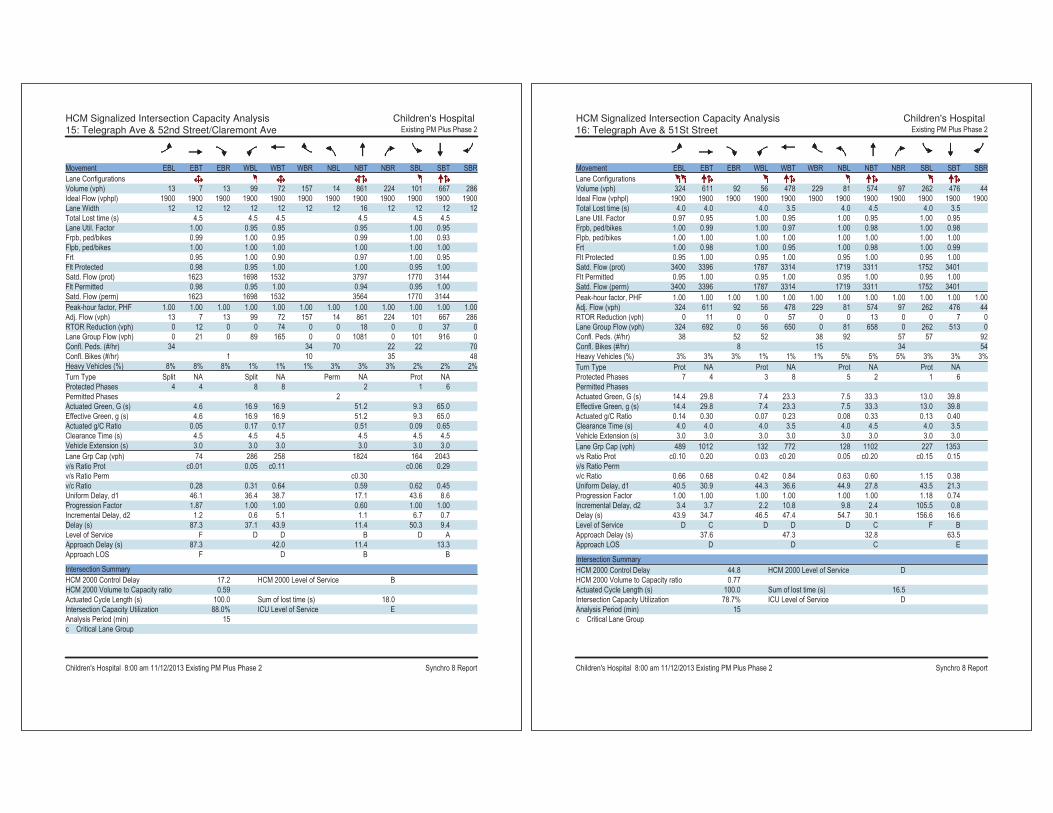
HCM Signalized Intersection Capacity Analysis Children's Hospital 15: Telegraph Ave & 52nd Street/Claremont Ave
HCM Signalized Intersection Capacity Analysis Children's Hospital 16: Telegraph Ave & 51St Street
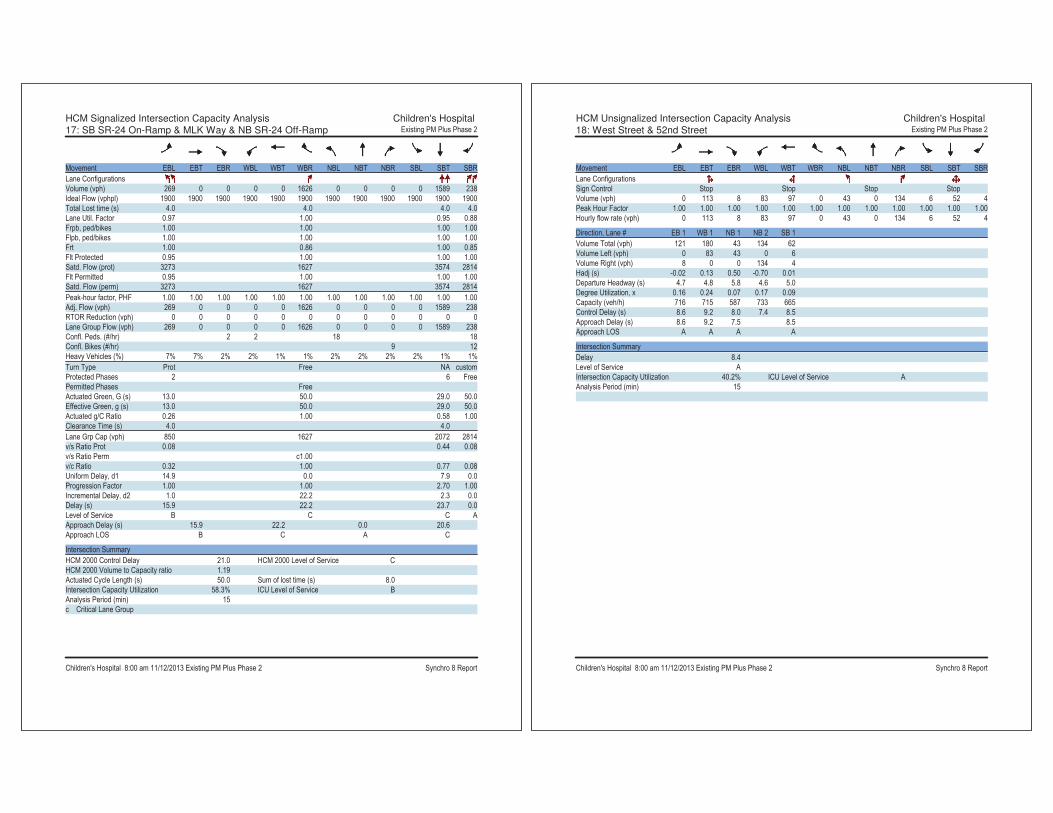
HCM Signalized Intersection Capacity Analysis Children's Hospital 17: SB SR-24 On-Ramp & MLK Way & NB SR-24 Off-Ramp
HCM Unsignalized Intersection Capacity Analysis Children's Hospital 18: West Street & 52nd Street

HCM Unsignalized Intersection Capacity Analysis Children's Hospital 19: Genoa Street & 52nd Street
HCM Unsignalized Intersection Capacity Analysis Children's Hospital 20: Genoa Street & 55th Street
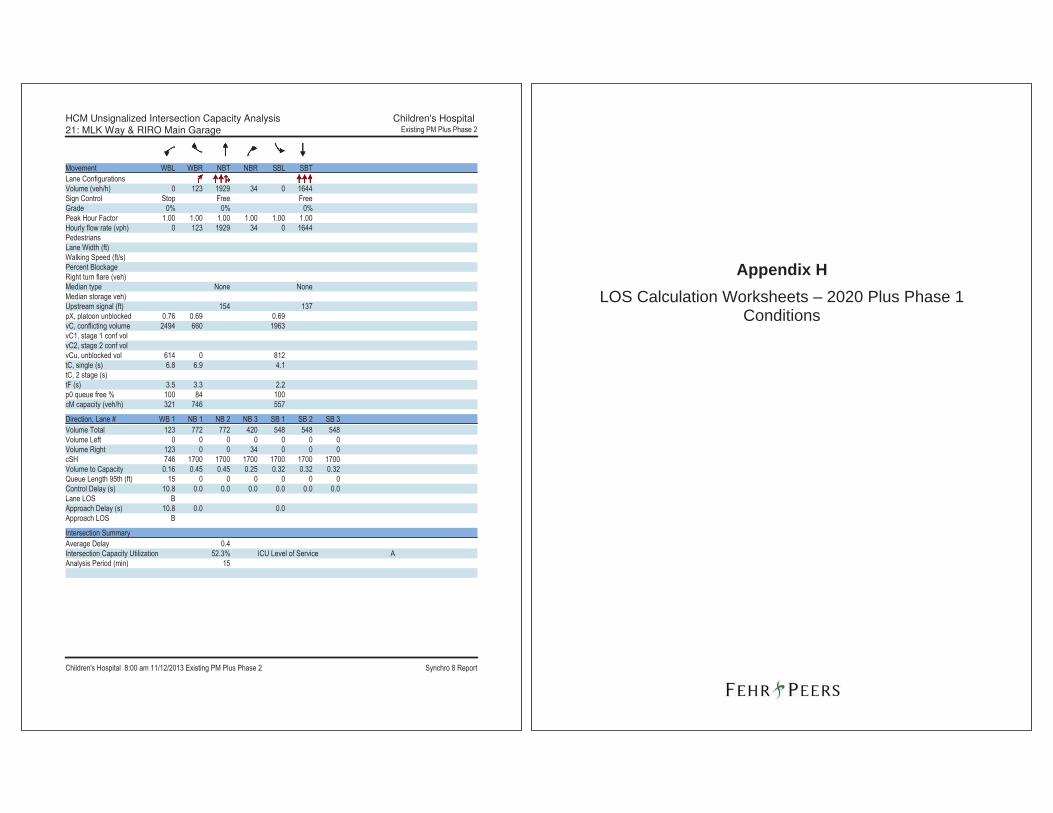
HCM Unsignalized Intersection Capacity Analysis Children's Hospital 21: MLK Way & RIRO Main Garage
Appendix H LOS Calculation Worksheets – 2020 Plus Phase 1
Conditions

HCM Signalized Intersection Capacity Analysis Children's Hospital1: MLK Way & 55th Street 2020 AM Plus Phase 1
Fehr & Peers Synchro 8 Report
Movement EBL EBT EBR WBL WBT WBR NBU NBL NBT NBR SBL SBTLane ConfigurationsVolume (vph) 20 180 230 60 240 80 21 150 1381 70 90 1332Ideal Flow (vphpl) 1900 1900 1900 1900 1900 1900 1900 1900 1900 1900 1900 1900Total Lost time (s) 5.0 5.0 4.5 5.0 4.5 5.0Lane Util. Factor 1.00 1.00 1.00 0.91 1.00 0.91Frpb, ped/bikes 0.98 0.99 1.00 1.00 1.00 1.00Flpb, ped/bikes 1.00 1.00 1.00 1.00 1.00 1.00Frt 0.93 0.97 1.00 0.99 1.00 0.99Flt Protected 1.00 0.99 0.95 1.00 0.95 1.00Satd. Flow (prot) 1703 1747 1770 5028 1770 5046Flt Permitted 0.98 0.77 0.95 1.00 0.95 1.00Satd. Flow (perm) 1664 1360 1770 5028 1770 5046Peak-hour factor, PHF 1.00 1.00 1.00 1.00 1.00 1.00 1.00 1.00 1.00 1.00 1.00 1.00Adj. Flow (vph) 20 180 230 60 240 80 21 150 1381 70 90 1332RTOR Reduction (vph) 0 52 0 0 12 0 0 0 5 0 0 4Lane Group Flow (vph) 0 378 0 0 368 0 0 171 1446 0 90 1378Confl. Peds. (#/hr) 10 19 19 10 28Confl. Bikes (#/hr) 21 20 8Heavy Vehicles (%) 1% 1% 1% 4% 4% 4% 2% 2% 2% 2% 2% 2%Turn Type Perm NA Perm NA Prot Prot NA Prot NAProtected Phases 4 8 5 5 2 1 6Permitted Phases 4 8Actuated Green, G (s) 27.7 27.7 14.4 41.8 6.0 33.4Effective Green, g (s) 27.7 27.7 14.4 41.8 6.0 33.4Actuated g/C Ratio 0.31 0.31 0.16 0.46 0.07 0.37Clearance Time (s) 5.0 5.0 4.5 5.0 4.5 5.0Vehicle Extension (s) 3.0 3.0 3.0 3.0 3.0 3.0Lane Grp Cap (vph) 512 418 283 2335 118 1872v/s Ratio Prot 0.10 c0.29 0.05 c0.27v/s Ratio Perm 0.23 c0.27v/c Ratio 0.74 0.88 0.60 0.62 0.76 0.74Uniform Delay, d1 27.9 29.6 35.2 18.1 41.3 24.5Progression Factor 1.00 1.00 0.54 0.22 1.00 1.00Incremental Delay, d2 5.5 19.0 3.3 1.1 24.8 2.6Delay (s) 33.4 48.6 22.2 5.0 66.1 27.1Level of Service C D C A E CApproach Delay (s) 33.4 48.6 6.8 29.5Approach LOS C D A C
Intersection SummaryHCM 2000 Control Delay 22.4 HCM 2000 Level of Service CHCM 2000 Volume to Capacity ratio 0.78Actuated Cycle Length (s) 90.0 Sum of lost time (s) 14.5Intersection Capacity Utilization 90.1% ICU Level of Service EAnalysis Period (min) 15c Critical Lane Group
HCM Signalized Intersection Capacity Analysis Children's Hospital1: MLK Way & 55th Street 2020 AM Plus Phase 1
Fehr & Peers Synchro 8 Report
Movement SBRLane ConfigurationsVolume (vph) 50Ideal Flow (vphpl) 1900Total Lost time (s)Lane Util. FactorFrpb, ped/bikesFlpb, ped/bikesFrtFlt ProtectedSatd. Flow (prot)Flt PermittedSatd. Flow (perm)Peak-hour factor, PHF 1.00Adj. Flow (vph) 50RTOR Reduction (vph) 0Lane Group Flow (vph) 0Confl. Peds. (#/hr) 16Confl. Bikes (#/hr) 10Heavy Vehicles (%) 2%Turn TypeProtected PhasesPermitted PhasesActuated Green, G (s)Effective Green, g (s)Actuated g/C RatioClearance Time (s)Vehicle Extension (s)Lane Grp Cap (vph)v/s Ratio Protv/s Ratio Permv/c RatioUniform Delay, d1Progression FactorIncremental Delay, d2Delay (s)Level of ServiceApproach Delay (s)Approach LOS
Intersection Summary

HCM Unsignalized Intersection Capacity Analysis Children's Hospital2: Dover Street & 55th Street 2020 AM Plus Phase 1
Fehr & Peers Synchro 8 Report
Movement EBL EBT EBR WBL WBT WBR NBL NBT NBR SBL SBT SBRLane ConfigurationsVolume (veh/h) 30 300 10 30 320 10 10 10 20 10 10 30Sign Control Free Free Stop StopGrade 0% 0% 0% 0%Peak Hour Factor 1.00 1.00 1.00 1.00 1.00 1.00 1.00 1.00 1.00 1.00 1.00 1.00Hourly flow rate (vph) 30 300 10 30 320 10 10 10 20 10 10 30Pedestrians 12 26 20 8Lane Width (ft) 12.0 12.0 12.0 12.0Walking Speed (ft/s) 4.0 4.0 4.0 4.0Percent Blockage 1 2 2 1Right turn flare (veh)Median type None NoneMedian storage veh)Upstream signal (ft) 641 677pX, platoon unblocked 0.89 0.89 0.89 0.89 0.89 0.89vC, conflicting volume 338 330 817 783 351 809 783 345vC1, stage 1 conf volvC2, stage 2 conf volvCu, unblocked vol 196 330 733 695 351 724 695 204tC, single (s) 4.1 4.1 7.1 6.5 6.2 7.1 6.5 6.2tC, 2 stage (s)tF (s) 2.2 2.2 3.5 4.0 3.3 3.5 4.0 3.3p0 queue free % 98 97 96 97 97 96 97 96cM capacity (veh/h) 1203 1198 260 305 671 263 302 731
Direction, Lane # EB 1 WB 1 NB 1 SB 1Volume Total 340 360 40 50Volume Left 30 30 10 10Volume Right 10 10 20 30cSH 1203 1198 395 445Volume to Capacity 0.02 0.03 0.10 0.11Queue Length 95th (ft) 2 2 8 9Control Delay (s) 0.9 0.9 15.1 14.1Lane LOS A A C BApproach Delay (s) 0.9 0.9 15.1 14.1Approach LOS C B
Intersection SummaryAverage Delay 2.5Intersection Capacity Utilization 41.1% ICU Level of Service AAnalysis Period (min) 15
HCM Signalized Intersection Capacity Analysis Children's Hospital3: 55th Street & Shattuck Ave 2020 AM Plus Phase 1
Fehr & Peers Synchro 8 Report
Movement EBL EBT EBR WBL WBT WBR NBL NBT NBR SBL SBT SBRLane ConfigurationsVolume (vph) 60 230 60 30 270 50 40 460 30 30 570 40Ideal Flow (vphpl) 1900 1900 1900 1900 1900 1900 1900 1900 1900 1900 1900 1900Total Lost time (s) 3.0 3.0 5.0 5.0Lane Util. Factor 1.00 1.00 1.00 1.00Frpb, ped/bikes 0.99 0.99 1.00 1.00Flpb, ped/bikes 1.00 1.00 1.00 1.00Frt 0.98 0.98 0.99 0.99Flt Protected 0.99 1.00 1.00 1.00Satd. Flow (prot) 1727 1787 1836 1855Flt Permitted 0.86 0.96 0.93 0.96Satd. Flow (perm) 1491 1719 1710 1792Peak-hour factor, PHF 1.00 1.00 1.00 1.00 1.00 1.00 1.00 1.00 1.00 1.00 1.00 1.00Adj. Flow (vph) 60 230 60 30 270 50 40 460 30 30 570 40RTOR Reduction (vph) 0 10 0 0 8 0 0 3 0 0 3 0Lane Group Flow (vph) 0 340 0 0 342 0 0 527 0 0 637 0Confl. Peds. (#/hr) 8 17 17 8 10 23 23 10Confl. Bikes (#/hr) 29 13 17 32Heavy Vehicles (%) 5% 5% 5% 3% 3% 3% 2% 2% 2% 1% 1% 1%Turn Type Perm NA Perm NA Perm NA Perm NAProtected Phases 2 6 4 8Permitted Phases 2 6 4 4 8Actuated Green, G (s) 25.0 25.0 47.0 47.0Effective Green, g (s) 25.0 25.0 47.0 47.0Actuated g/C Ratio 0.31 0.31 0.59 0.59Clearance Time (s) 3.0 3.0 5.0 5.0Lane Grp Cap (vph) 465 537 1004 1052v/s Ratio Protv/s Ratio Perm c0.23 0.20 0.31 c0.36v/c Ratio 0.73 0.64 0.53 0.61Uniform Delay, d1 24.5 23.6 9.8 10.6Progression Factor 1.00 1.00 1.00 1.00Incremental Delay, d2 9.8 5.7 2.0 2.6Delay (s) 34.3 29.3 11.8 13.2Level of Service C C B BApproach Delay (s) 34.3 29.3 11.8 13.2Approach LOS C C B B
Intersection SummaryHCM 2000 Control Delay 19.8 HCM 2000 Level of Service BHCM 2000 Volume to Capacity ratio 0.65Actuated Cycle Length (s) 80.0 Sum of lost time (s) 8.0Intersection Capacity Utilization 80.7% ICU Level of Service DAnalysis Period (min) 15c Critical Lane Group
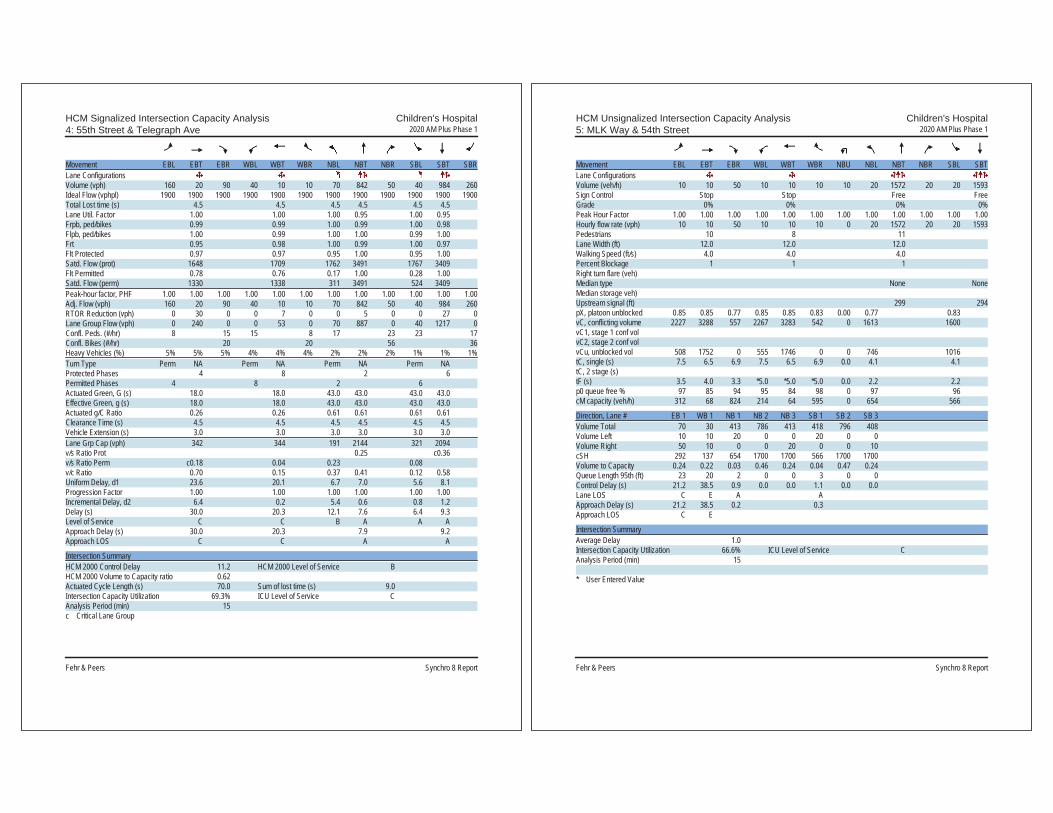
HCM Signalized Intersection Capacity Analysis Children's Hospital4: 55th Street & Telegraph Ave 2020 AM Plus Phase 1
Fehr & Peers Synchro 8 Report
Movement EBL EBT EBR WBL WBT WBR NBL NBT NBR SBL SBT SBRLane ConfigurationsVolume (vph) 160 20 90 40 10 10 70 842 50 40 984 260Ideal Flow (vphpl) 1900 1900 1900 1900 1900 1900 1900 1900 1900 1900 1900 1900Total Lost time (s) 4.5 4.5 4.5 4.5 4.5 4.5Lane Util. Factor 1.00 1.00 1.00 0.95 1.00 0.95Frpb, ped/bikes 0.99 0.99 1.00 0.99 1.00 0.98Flpb, ped/bikes 1.00 0.99 1.00 1.00 0.99 1.00Frt 0.95 0.98 1.00 0.99 1.00 0.97Flt Protected 0.97 0.97 0.95 1.00 0.95 1.00Satd. Flow (prot) 1648 1709 1762 3491 1767 3409Flt Permitted 0.78 0.76 0.17 1.00 0.28 1.00Satd. Flow (perm) 1330 1338 311 3491 524 3409Peak-hour factor, PHF 1.00 1.00 1.00 1.00 1.00 1.00 1.00 1.00 1.00 1.00 1.00 1.00Adj. Flow (vph) 160 20 90 40 10 10 70 842 50 40 984 260RTOR Reduction (vph) 0 30 0 0 7 0 0 5 0 0 27 0Lane Group Flow (vph) 0 240 0 0 53 0 70 887 0 40 1217 0Confl. Peds. (#/hr) 8 15 15 8 17 23 23 17Confl. Bikes (#/hr) 20 20 56 36Heavy Vehicles (%) 5% 5% 5% 4% 4% 4% 2% 2% 2% 1% 1% 1%Turn Type Perm NA Perm NA Perm NA Perm NAProtected Phases 4 8 2 6Permitted Phases 4 8 2 6Actuated Green, G (s) 18.0 18.0 43.0 43.0 43.0 43.0Effective Green, g (s) 18.0 18.0 43.0 43.0 43.0 43.0Actuated g/C Ratio 0.26 0.26 0.61 0.61 0.61 0.61Clearance Time (s) 4.5 4.5 4.5 4.5 4.5 4.5Vehicle Extension (s) 3.0 3.0 3.0 3.0 3.0 3.0Lane Grp Cap (vph) 342 344 191 2144 321 2094v/s Ratio Prot 0.25 c0.36v/s Ratio Perm c0.18 0.04 0.23 0.08v/c Ratio 0.70 0.15 0.37 0.41 0.12 0.58Uniform Delay, d1 23.6 20.1 6.7 7.0 5.6 8.1Progression Factor 1.00 1.00 1.00 1.00 1.00 1.00Incremental Delay, d2 6.4 0.2 5.4 0.6 0.8 1.2Delay (s) 30.0 20.3 12.1 7.6 6.4 9.3Level of Service C C B A A AApproach Delay (s) 30.0 20.3 7.9 9.2Approach LOS C C A A
Intersection SummaryHCM 2000 Control Delay 11.2 HCM 2000 Level of Service BHCM 2000 Volume to Capacity ratio 0.62Actuated Cycle Length (s) 70.0 Sum of lost time (s) 9.0Intersection Capacity Utilization 69.3% ICU Level of Service CAnalysis Period (min) 15c Critical Lane Group
HCM Unsignalized Intersection Capacity Analysis Children's Hospital5: MLK Way & 54th Street 2020 AM Plus Phase 1
Fehr & Peers Synchro 8 Report
Movement EBL EBT EBR WBL WBT WBR NBU NBL NBT NBR SBL SBTLane ConfigurationsVolume (veh/h) 10 10 50 10 10 10 10 20 1572 20 20 1593Sign Control Stop Stop Free FreeGrade 0% 0% 0% 0%Peak Hour Factor 1.00 1.00 1.00 1.00 1.00 1.00 1.00 1.00 1.00 1.00 1.00 1.00Hourly flow rate (vph) 10 10 50 10 10 10 0 20 1572 20 20 1593Pedestrians 10 8 11Lane Width (ft) 12.0 12.0 12.0Walking Speed (ft/s) 4.0 4.0 4.0Percent Blockage 1 1 1Right turn flare (veh)Median type None NoneMedian storage veh)Upstream signal (ft) 299 294pX, platoon unblocked 0.85 0.85 0.77 0.85 0.85 0.83 0.00 0.77 0.83vC, conflicting volume 2227 3288 557 2267 3283 542 0 1613 1600vC1, stage 1 conf volvC2, stage 2 conf volvCu, unblocked vol 508 1752 0 555 1746 0 0 746 1016tC, single (s) 7.5 6.5 6.9 7.5 6.5 6.9 0.0 4.1 4.1tC, 2 stage (s)tF (s) 3.5 4.0 3.3 *5.0 *5.0 *5.0 0.0 2.2 2.2p0 queue free % 97 85 94 95 84 98 0 97 96cM capacity (veh/h) 312 68 824 214 64 595 0 654 566
Direction, Lane # EB 1 WB 1 NB 1 NB 2 NB 3 SB 1 SB 2 SB 3Volume Total 70 30 413 786 413 418 796 408Volume Left 10 10 20 0 0 20 0 0Volume Right 50 10 0 0 20 0 0 10cSH 292 137 654 1700 1700 566 1700 1700Volume to Capacity 0.24 0.22 0.03 0.46 0.24 0.04 0.47 0.24Queue Length 95th (ft) 23 20 2 0 0 3 0 0Control Delay (s) 21.2 38.5 0.9 0.0 0.0 1.1 0.0 0.0Lane LOS C E A AApproach Delay (s) 21.2 38.5 0.2 0.3Approach LOS C E
Intersection SummaryAverage Delay 1.0Intersection Capacity Utilization 66.6% ICU Level of Service CAnalysis Period (min) 15
* User Entered Value
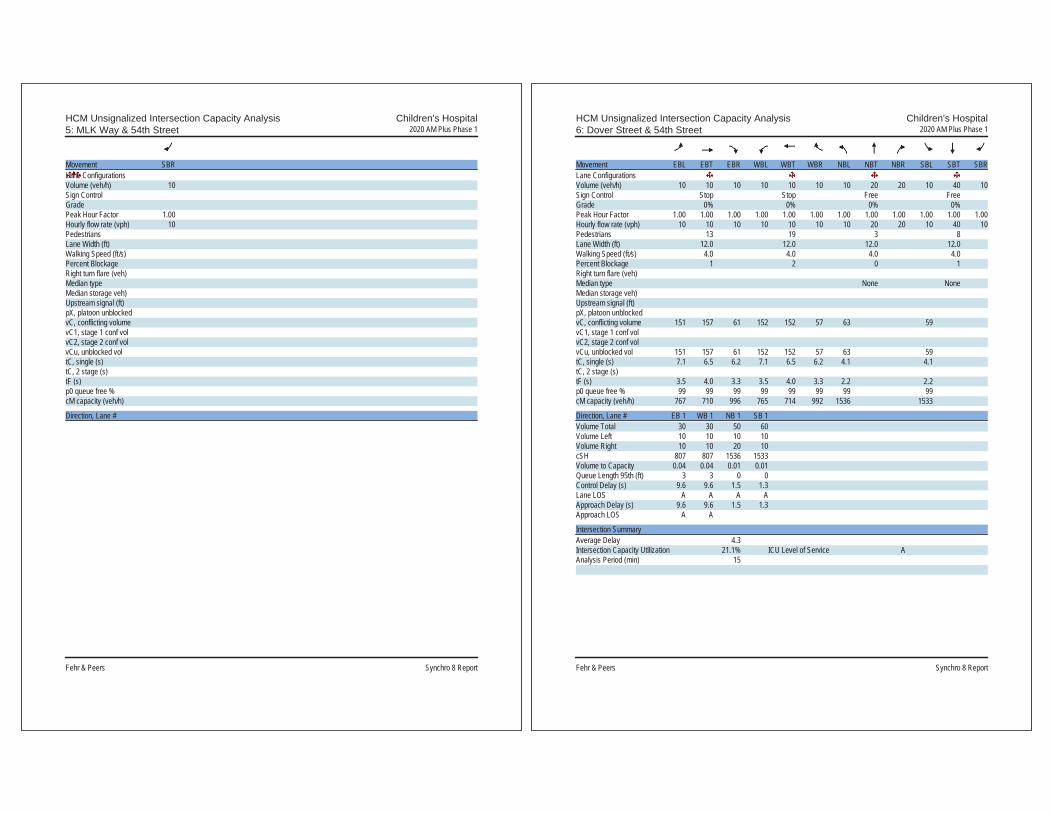
HCM Unsignalized Intersection Capacity Analysis Children's Hospital5: MLK Way & 54th Street 2020 AM Plus Phase 1
Fehr & Peers Synchro 8 Report
Movement SBRLane ConfigurationsVolume (veh/h) 10Sign ControlGradePeak Hour Factor 1.00Hourly flow rate (vph) 10PedestriansLane Width (ft)Walking Speed (ft/s)Percent BlockageRight turn flare (veh)Median typeMedian storage veh)Upstream signal (ft)pX, platoon unblockedvC, conflicting volumevC1, stage 1 conf volvC2, stage 2 conf volvCu, unblocked voltC, single (s)tC, 2 stage (s)tF (s)p0 queue free %cM capacity (veh/h)
Direction, Lane #
HCM Unsignalized Intersection Capacity Analysis Children's Hospital6: Dover Street & 54th Street 2020 AM Plus Phase 1
Fehr & Peers Synchro 8 Report
Movement EBL EBT EBR WBL WBT WBR NBL NBT NBR SBL SBT SBRLane ConfigurationsVolume (veh/h) 10 10 10 10 10 10 10 20 20 10 40 10Sign Control Stop Stop Free FreeGrade 0% 0% 0% 0%Peak Hour Factor 1.00 1.00 1.00 1.00 1.00 1.00 1.00 1.00 1.00 1.00 1.00 1.00Hourly flow rate (vph) 10 10 10 10 10 10 10 20 20 10 40 10Pedestrians 13 19 3 8Lane Width (ft) 12.0 12.0 12.0 12.0Walking Speed (ft/s) 4.0 4.0 4.0 4.0Percent Blockage 1 2 0 1Right turn flare (veh)Median type None NoneMedian storage veh)Upstream signal (ft)pX, platoon unblockedvC, conflicting volume 151 157 61 152 152 57 63 59vC1, stage 1 conf volvC2, stage 2 conf volvCu, unblocked vol 151 157 61 152 152 57 63 59tC, single (s) 7.1 6.5 6.2 7.1 6.5 6.2 4.1 4.1tC, 2 stage (s)tF (s) 3.5 4.0 3.3 3.5 4.0 3.3 2.2 2.2p0 queue free % 99 99 99 99 99 99 99 99cM capacity (veh/h) 767 710 996 765 714 992 1536 1533
Direction, Lane # EB 1 WB 1 NB 1 SB 1Volume Total 30 30 50 60Volume Left 10 10 10 10Volume Right 10 10 20 10cSH 807 807 1536 1533Volume to Capacity 0.04 0.04 0.01 0.01Queue Length 95th (ft) 3 3 0 0Control Delay (s) 9.6 9.6 1.5 1.3Lane LOS A A A AApproach Delay (s) 9.6 9.6 1.5 1.3Approach LOS A A
Intersection SummaryAverage Delay 4.3Intersection Capacity Utilization 21.1% ICU Level of Service AAnalysis Period (min) 15

HCM Unsignalized Intersection Capacity Analysis Children's Hospital7: Shattuck Ave & 54th Street 2020 AM Plus Phase 1
Fehr & Peers Synchro 8 Report
Movement EBL EBR NBL NBT SBT SBRLane ConfigurationsVolume (veh/h) 10 20 20 520 630 10Sign Control Stop Free FreeGrade 0% 0% 0%Peak Hour Factor 1.00 1.00 1.00 1.00 1.00 1.00Hourly flow rate (vph) 10 20 20 520 630 10Pedestrians 12 3 2Lane Width (ft) 12.0 12.0 12.0Walking Speed (ft/s) 4.0 4.0 4.0Percent Blockage 1 0 0Right turn flare (veh)Median type None NoneMedian storage veh)Upstream signal (ft) 550 282pX, platoon unblocked 0.79 0.79 0.79vC, conflicting volume 1209 650 652vC1, stage 1 conf volvC2, stage 2 conf volvCu, unblocked vol 1118 419 422tC, single (s) 6.4 6.2 4.1tC, 2 stage (s)tF (s) 3.5 3.3 2.2p0 queue free % 94 96 98cM capacity (veh/h) 176 496 886
Direction, Lane # EB 1 NB 1 SB 1Volume Total 30 540 640Volume Left 10 20 0Volume Right 20 0 10cSH 309 886 1700Volume to Capacity 0.10 0.02 0.38Queue Length 95th (ft) 8 2 0Control Delay (s) 17.9 0.6 0.0Lane LOS C AApproach Delay (s) 17.9 0.6 0.0Approach LOS C
Intersection SummaryAverage Delay 0.7Intersection Capacity Utilization 54.5% ICU Level of Service AAnalysis Period (min) 15
HCM Signalized Intersection Capacity Analysis Children's Hospital8: MLK Way & 53rd Street 2020 AM Plus Phase 1
Fehr & Peers Synchro 8 Report
Movement EBL EBT EBR WBL WBT WBR NBL NBT NBR SBL SBT SBRLane ConfigurationsVolume (vph) 10 10 40 20 10 20 30 1602 37 20 1653 10Ideal Flow (vphpl) 1900 1900 1900 1900 1900 1900 1900 1900 1900 1900 1900 1900Total Lost time (s) 5.0 5.0 4.0 3.5 4.0 3.5Lane Util. Factor 1.00 1.00 1.00 0.91 1.00 0.91Frpb, ped/bikes 0.98 0.99 1.00 1.00 1.00 1.00Flpb, ped/bikes 1.00 1.00 1.00 1.00 1.00 1.00Frt 0.91 0.95 1.00 1.00 1.00 1.00Flt Protected 0.99 0.98 0.95 1.00 0.95 1.00Satd. Flow (prot) 1653 1742 1770 5060 1787 5128Flt Permitted 0.96 0.88 0.95 1.00 0.95 1.00Satd. Flow (perm) 1595 1569 1770 5060 1787 5128Peak-hour factor, PHF 1.00 1.00 1.00 1.00 1.00 1.00 1.00 1.00 1.00 1.00 1.00 1.00Adj. Flow (vph) 10 10 40 20 10 20 30 1602 37 20 1653 10RTOR Reduction (vph) 0 33 0 0 16 0 0 1 0 0 0 0Lane Group Flow (vph) 0 27 0 0 34 0 30 1638 0 20 1663 0Confl. Peds. (#/hr) 10 17 17 10 17 26Confl. Bikes (#/hr) 7 17Heavy Vehicles (%) 2% 2% 2% 0% 0% 0% 2% 2% 2% 1% 1% 1%Turn Type Perm NA Perm NA Prot NA Prot NAProtected Phases 4 8 5 2 1 6Permitted Phases 4 8Actuated Green, G (s) 15.8 15.8 4.5 58.1 3.6 57.2Effective Green, g (s) 15.8 15.8 4.5 58.1 3.6 57.2Actuated g/C Ratio 0.18 0.18 0.05 0.65 0.04 0.64Clearance Time (s) 5.0 5.0 4.0 3.5 4.0 3.5Vehicle Extension (s) 3.0 3.0 3.0 3.0 3.0 3.0Lane Grp Cap (vph) 280 275 88 3266 71 3259v/s Ratio Prot 0.02 c0.32 0.01 c0.32v/s Ratio Perm 0.02 c0.02v/c Ratio 0.10 0.12 0.34 0.50 0.28 0.51Uniform Delay, d1 31.1 31.3 41.3 8.4 41.9 8.8Progression Factor 1.00 1.03 1.17 0.46 0.53 0.26Incremental Delay, d2 0.2 0.2 1.8 0.4 1.6 0.4Delay (s) 31.3 32.3 50.0 4.3 24.0 2.7Level of Service C C D A C AApproach Delay (s) 31.3 32.3 5.1 2.9Approach LOS C C A A
Intersection SummaryHCM 2000 Control Delay 4.9 HCM 2000 Level of Service AHCM 2000 Volume to Capacity ratio 0.44Actuated Cycle Length (s) 90.0 Sum of lost time (s) 12.5Intersection Capacity Utilization 56.9% ICU Level of Service BAnalysis Period (min) 15c Critical Lane Group

HCM Unsignalized Intersection Capacity Analysis Children's Hospital9: Dover Street & 53rd Street 2020 AM Plus Phase 1
Fehr & Peers Synchro 8 Report
Movement EBL EBT EBR WBL WBT WBR NBL NBT NBR SBL SBT SBRLane ConfigurationsVolume (veh/h) 20 10 37 10 10 10 20 30 20 10 30 20Sign Control Stop Stop Free FreeGrade 0% 0% 0% 0%Peak Hour Factor 1.00 1.00 1.00 1.00 1.00 1.00 1.00 1.00 1.00 1.00 1.00 1.00Hourly flow rate (vph) 20 10 37 10 10 10 20 30 20 10 30 20Pedestrians 29 28 3 3Lane Width (ft) 12.0 12.0 12.0 12.0Walking Speed (ft/s) 4.0 4.0 4.0 4.0Percent Blockage 2 2 0 0Right turn flare (veh)Median type None NoneMedian storage veh)Upstream signal (ft)pX, platoon unblockedvC, conflicting volume 187 207 72 213 207 71 79 78vC1, stage 1 conf volvC2, stage 2 conf volvCu, unblocked vol 187 207 72 213 207 71 79 78tC, single (s) 7.1 6.5 6.2 7.1 6.5 6.2 4.1 4.1tC, 2 stage (s)tF (s) 3.5 4.0 3.3 3.5 4.0 3.3 2.2 2.2p0 queue free % 97 98 96 98 98 99 99 99cM capacity (veh/h) 703 648 969 658 648 971 1495 1497
Direction, Lane # EB 1 WB 1 NB 1 SB 1Volume Total 67 30 70 60Volume Left 20 10 20 10Volume Right 37 10 20 20cSH 817 733 1495 1497Volume to Capacity 0.08 0.04 0.01 0.01Queue Length 95th (ft) 7 3 1 1Control Delay (s) 9.8 10.1 2.2 1.3Lane LOS A B A AApproach Delay (s) 9.8 10.1 2.2 1.3Approach LOS A B
Intersection SummaryAverage Delay 5.2Intersection Capacity Utilization 23.5% ICU Level of Service AAnalysis Period (min) 15
HCM Signalized Intersection Capacity Analysis Children's Hospital10: MLK Way & 52nd Street 2020 AM Plus Phase 1
Fehr & Peers Synchro 8 Report
Movement EBL EBT EBR WBL WBT WBR NBU NBL NBT NBR SBU SBLLane ConfigurationsVolume (vph) 48 92 110 82 90 257 60 80 1515 71 33 99Ideal Flow (vphpl) 1900 1900 1900 1900 1900 1900 1900 1900 1900 1900 1900 1900Total Lost time (s) 5.0 5.0 5.0 5.0 4.5 4.5 4.0Lane Util. Factor 1.00 1.00 1.00 1.00 1.00 0.91 1.00Frpb, ped/bikes 1.00 0.96 1.00 0.97 1.00 1.00 1.00Flpb, ped/bikes 0.99 1.00 0.98 1.00 1.00 1.00 1.00Frt 1.00 0.92 1.00 0.85 1.00 0.99 1.00Flt Protected 0.95 1.00 0.98 1.00 0.95 1.00 0.95Satd. Flow (prot) 1772 1659 1785 1537 1787 5095 1787Flt Permitted 0.59 1.00 0.67 1.00 0.95 1.00 0.95Satd. Flow (perm) 1098 1659 1232 1537 1787 5095 1787Peak-hour factor, PHF 1.00 1.00 1.00 1.00 1.00 1.00 1.00 1.00 1.00 1.00 1.00 1.00Adj. Flow (vph) 48 92 110 82 90 257 60 80 1515 71 33 99RTOR Reduction (vph) 0 55 0 0 0 180 0 0 5 0 0 0Lane Group Flow (vph) 48 147 0 0 172 77 0 140 1581 0 0 132Confl. Peds. (#/hr) 13 64 64 13 10Confl. Bikes (#/hr) 8 7 2Heavy Vehicles (%) 1% 1% 1% 2% 2% 2% 1% 1% 1% 1% 1% 1%Turn Type Perm NA Perm NA Perm Prot Prot NA Prot ProtProtected Phases 4 8 5 5 2 1 1Permitted Phases 4 8 8Actuated Green, G (s) 22.8 22.8 22.8 22.8 7.5 41.2 12.5Effective Green, g (s) 22.8 22.8 22.8 22.8 7.5 41.2 12.5Actuated g/C Ratio 0.25 0.25 0.25 0.25 0.08 0.46 0.14Clearance Time (s) 5.0 5.0 5.0 5.0 4.5 4.5 4.0Vehicle Extension (s) 2.0 2.0 2.0 2.0 2.0 2.0 2.0Lane Grp Cap (vph) 278 420 312 389 148 2332 248v/s Ratio Prot 0.09 c0.08 c0.31 0.07v/s Ratio Perm 0.04 c0.14 0.05v/c Ratio 0.17 0.35 0.55 0.20 0.95 0.68 0.53Uniform Delay, d1 26.2 27.5 29.2 26.4 41.0 19.2 36.0Progression Factor 1.00 1.00 1.00 1.00 1.00 1.07 0.78Incremental Delay, d2 0.1 0.2 1.2 0.1 34.6 0.7 1.0Delay (s) 26.3 27.7 30.4 26.5 75.5 21.3 29.1Level of Service C C C C E C CApproach Delay (s) 27.5 28.0 25.7Approach LOS C C C
Intersection SummaryHCM 2000 Control Delay 21.3 HCM 2000 Level of Service CHCM 2000 Volume to Capacity ratio 0.66Actuated Cycle Length (s) 90.0 Sum of lost time (s) 14.0Intersection Capacity Utilization 98.3% ICU Level of Service FAnalysis Period (min) 15c Critical Lane Group

HCM Signalized Intersection Capacity Analysis Children's Hospital10: MLK Way & 52nd Street 2020 AM Plus Phase 1
Fehr & Peers Synchro 8 Report
Movement SBT SBRLane ConfigurationsVolume (vph) 1571 0Ideal Flow (vphpl) 1900 1900Total Lost time (s) 4.5Lane Util. Factor 0.91Frpb, ped/bikes 1.00Flpb, ped/bikes 1.00Frt 1.00Flt Protected 1.00Satd. Flow (prot) 5136Flt Permitted 1.00Satd. Flow (perm) 5136Peak-hour factor, PHF 1.00 1.00Adj. Flow (vph) 1571 0RTOR Reduction (vph) 0 0Lane Group Flow (vph) 1571 0Confl. Peds. (#/hr) 13Confl. Bikes (#/hr) 13Heavy Vehicles (%) 1% 1%Turn Type NAProtected Phases 6Permitted PhasesActuated Green, G (s) 45.7Effective Green, g (s) 45.7Actuated g/C Ratio 0.51Clearance Time (s) 4.5Vehicle Extension (s) 2.0Lane Grp Cap (vph) 2607v/s Ratio Prot c0.31v/s Ratio Permv/c Ratio 0.60Uniform Delay, d1 15.7Progression Factor 0.77Incremental Delay, d2 0.9Delay (s) 13.0Level of Service BApproach Delay (s) 14.3Approach LOS B
Intersection Summary
HCM Signalized Intersection Capacity Analysis Children's Hospital11: 52nd Street & Garage 2020 AM Plus Phase 1
Fehr & Peers Synchro 8 Report
Movement EBL EBT EBR WBL WBT WBR NBL NBT NBR SBL SBT SBRLane ConfigurationsVolume (vph) 4 230 8 6 387 2 15 7 10 0 2 15Ideal Flow (vphpl) 1900 1900 1900 1900 1900 1900 1900 1900 1900 1900 1900 1900Total Lost time (s) 3.0 3.0 3.0 3.0Lane Util. Factor 0.95 0.95 1.00 1.00Frpb, ped/bikes 0.99 1.00 0.94 0.99Flpb, ped/bikes 1.00 1.00 1.00 1.00Frt 1.00 1.00 0.96 0.88Flt Protected 1.00 1.00 0.98 1.00Satd. Flow (prot) 3500 3598 1447 1655Flt Permitted 0.95 0.95 0.94 1.00Satd. Flow (perm) 3341 3425 1386 1655Peak-hour factor, PHF 1.00 1.00 1.00 1.00 1.00 1.00 1.00 1.00 1.00 1.00 1.00 1.00Adj. Flow (vph) 4 230 8 6 387 2 15 7 10 0 2 15RTOR Reduction (vph) 0 5 0 0 1 0 0 5 0 0 8 0Lane Group Flow (vph) 0 237 0 0 394 0 0 27 0 0 9 0Confl. Peds. (#/hr) 23 72 72 23 263 263Confl. Bikes (#/hr) 8 7 2Heavy Vehicles (%) 2% 2% 2% 0% 0% 0% 16% 16% 16% 0% 0% 0%Turn Type Prot NA Perm NA Perm NA NAProtected Phases 5 2 6 4 8Permitted Phases 6 4 8Actuated Green, G (s) 21.0 14.0 23.0 23.0Effective Green, g (s) 21.0 14.0 23.0 23.0Actuated g/C Ratio 0.42 0.28 0.46 0.46Clearance Time (s) 3.0 3.0 3.0 3.0Lane Grp Cap (vph) 1415 959 637 761v/s Ratio Prot c0.01 0.01v/s Ratio Perm 0.06 c0.12 c0.02v/c Ratio 0.17 0.41 0.04 0.01Uniform Delay, d1 9.0 14.6 7.4 7.3Progression Factor 1.00 1.00 1.00 1.00Incremental Delay, d2 0.3 1.3 0.1 0.0Delay (s) 9.3 16.0 7.6 7.4Level of Service A B A AApproach Delay (s) 9.3 16.0 7.6 7.4Approach LOS A B A A
Intersection SummaryHCM 2000 Control Delay 13.0 HCM 2000 Level of Service BHCM 2000 Volume to Capacity ratio 0.18Actuated Cycle Length (s) 50.0 Sum of lost time (s) 9.0Intersection Capacity Utilization 40.9% ICU Level of Service AAnalysis Period (min) 15c Critical Lane Group

HCM Unsignalized Intersection Capacity Analysis Children's Hospital12: 52nd Street & Dover Street 2020 AM Plus Phase 1
Fehr & Peers Synchro 8 Report
Movement EBL EBT EBR WBL WBT WBR NBL NBT NBR SBL SBT SBRLane ConfigurationsVolume (veh/h) 30 217 1 11 365 40 3 0 7 45 3 32Sign Control Free Free Stop StopGrade 0% 0% 0% 0%Peak Hour Factor 1.00 1.00 1.00 1.00 1.00 1.00 1.00 1.00 1.00 1.00 1.00 1.00Hourly flow rate (vph) 30 217 1 11 365 40 3 0 7 45 3 32Pedestrians 26 13 16 30Lane Width (ft) 12.0 12.0 12.0 12.0Walking Speed (ft/s) 4.0 4.0 4.0 4.0Percent Blockage 2 1 1 3Right turn flare (veh)Median type None NoneMedian storage veh)Upstream signal (ft) 312 647pX, platoon unblocked 0.87 0.94 0.90 0.90 0.94 0.90 0.90 0.87vC, conflicting volume 435 234 760 750 246 734 731 441vC1, stage 1 conf volvC2, stage 2 conf volvCu, unblocked vol 278 147 521 510 160 493 489 285tC, single (s) 4.1 4.1 7.2 6.6 6.3 7.1 6.5 6.2tC, 2 stage (s)tF (s) 2.2 2.2 3.6 4.1 3.4 3.5 4.0 3.3p0 queue free % 97 99 99 100 99 89 99 95cM capacity (veh/h) 1087 1330 353 382 789 400 405 631
Direction, Lane # EB 1 WB 1 NB 1 SB 1Volume Total 248 416 10 80Volume Left 30 11 3 45Volume Right 1 40 7 32cSH 1087 1330 576 469Volume to Capacity 0.03 0.01 0.02 0.17Queue Length 95th (ft) 2 1 1 15Control Delay (s) 1.3 0.3 11.4 14.3Lane LOS A A B BApproach Delay (s) 1.3 0.3 11.4 14.3Approach LOS B B
Intersection SummaryAverage Delay 2.2Intersection Capacity Utilization 44.6% ICU Level of Service AAnalysis Period (min) 15
HCM Unsignalized Intersection Capacity Analysis Children's Hospital13: SR-24 NB Off-Ramp & 52nd Street 2020 AM Plus Phase 1
Fehr & Peers Synchro 8 Report
Movement EBL EBT EBR WBL WBT WBR NBL NBR SEL SERLane ConfigurationsVolume (veh/h) 0 272 0 0 425 1140 0 970 0 0Sign Control Free Free Stop StopGrade 0% 0% 0% 0%Peak Hour Factor 1.00 1.00 1.00 1.00 1.00 1.00 1.00 1.00 1.00 1.00Hourly flow rate (vph) 0 272 0 0 425 1140 0 970 0 0Pedestrians 32Lane Width (ft) 12.0Walking Speed (ft/s) 4.0Percent Blockage 3Right turn flare (veh)Median type None NoneMedian storage veh)Upstream signal (ft) 767 192pX, platoon unblocked 0.81 0.81 0.81 0.81vC, conflicting volume 1565 304 1869 168 1531 729vC1, stage 1 conf volvC2, stage 2 conf volvCu, unblocked vol 1221 304 1598 168 1179 185tC, single (s) 4.1 4.1 6.5 7.0 7.5 6.5tC, 2 stage (s)tF (s) 2.2 2.2 4.0 3.3 3.5 4.0p0 queue free % 100 100 100 0 0 100cM capacity (veh/h) 457 1220 83 821 0 556
Direction, Lane # EB 1 EB 2 WB 1 WB 2 WB 3 NB 1 NB 2Volume Total 136 136 283 522 760 485 485Volume Left 0 0 0 0 0 0 0Volume Right 0 0 0 380 760 485 485cSH 1700 1700 1700 1700 1700 821 821Volume to Capacity 0.08 0.08 0.17 0.31 0.45 0.59 0.59Queue Length 95th (ft) 0 0 0 0 0 99 99Control Delay (s) 0.0 0.0 0.0 0.0 0.0 15.5 15.5Lane LOS C CApproach Delay (s) 0.0 0.0 15.5Approach LOS C
Intersection SummaryAverage Delay 5.4Intersection Capacity Utilization 51.9% ICU Level of Service AAnalysis Period (min) 15

HCM Signalized Intersection Capacity Analysis Children's Hospital14: 52nd Street & Shattuck Ave 2020 AM Plus Phase 1
Fehr & Peers Synchro 8 Report
Movement EBU EBL EBT EBR WBL WBT WBR NBL NBT NBR SBL SBTLane ConfigurationsVolume (vph) 50 290 742 160 40 955 110 170 130 40 110 160Ideal Flow (vphpl) 1900 1900 1900 1900 1900 1900 1900 1900 1900 1900 1900 1900Total Lost time (s) 4.0 4.5 4.0 4.5 4.0 5.5 5.5Lane Util. Factor 1.00 0.91 1.00 0.91 1.00 1.00 1.00Frpb, ped/bikes 1.00 0.99 1.00 1.00 1.00 0.99 1.00Flpb, ped/bikes 1.00 1.00 1.00 1.00 1.00 1.00 1.00Frt 1.00 0.97 1.00 0.98 1.00 0.96 1.00Flt Protected 0.95 1.00 0.95 1.00 0.95 1.00 0.98Satd. Flow (prot) 1787 4932 1805 5085 1752 1766 1733Flt Permitted 0.95 1.00 0.95 1.00 0.39 1.00 0.79Satd. Flow (perm) 1787 4932 1805 5085 726 1766 1400Peak-hour factor, PHF 1.00 1.00 1.00 1.00 1.00 1.00 1.00 1.00 1.00 1.00 1.00 1.00Adj. Flow (vph) 50 290 742 160 40 955 110 170 130 40 110 160RTOR Reduction (vph) 0 0 32 0 0 15 0 0 13 0 0 0Lane Group Flow (vph) 0 340 870 0 40 1050 0 170 157 0 0 270Confl. Peds. (#/hr) 16 7 13 13Confl. Bikes (#/hr) 16 2 13Heavy Vehicles (%) 1% 1% 1% 1% 0% 0% 0% 3% 3% 3% 7% 7%Turn Type Prot Prot NA Prot NA pm+pt NA Perm NAProtected Phases 7 7 4 3 8 5 2 6Permitted Phases 2 6Actuated Green, G (s) 21.5 35.0 5.1 18.6 35.9 35.9 25.4Effective Green, g (s) 21.5 35.0 5.1 18.6 35.9 35.9 25.4Actuated g/C Ratio 0.24 0.39 0.06 0.21 0.40 0.40 0.28Clearance Time (s) 4.0 4.5 4.0 4.5 4.0 5.5 5.5Vehicle Extension (s) 3.0 3.0 3.0 3.0 3.0 3.0 3.0Lane Grp Cap (vph) 426 1918 102 1050 363 704 395v/s Ratio Prot c0.19 0.18 0.02 c0.21 c0.03 0.09v/s Ratio Perm 0.15 c0.19v/c Ratio 0.80 0.45 0.39 1.00 0.47 0.22 0.68Uniform Delay, d1 32.2 20.4 41.0 35.7 18.7 17.9 28.7Progression Factor 1.00 1.00 1.14 0.85 1.00 1.00 1.00Incremental Delay, d2 14.4 0.8 1.9 24.3 1.0 0.7 9.2Delay (s) 46.6 21.2 48.6 54.5 19.6 18.6 38.0Level of Service D C D D B B DApproach Delay (s) 28.1 54.3 19.1 31.4Approach LOS C D B C
Intersection SummaryHCM 2000 Control Delay 36.5 HCM 2000 Level of Service DHCM 2000 Volume to Capacity ratio 0.78Actuated Cycle Length (s) 90.0 Sum of lost time (s) 18.0Intersection Capacity Utilization 104.7% ICU Level of Service GAnalysis Period (min) 15c Critical Lane Group
HCM Signalized Intersection Capacity Analysis Children's Hospital14: 52nd Street & Shattuck Ave 2020 AM Plus Phase 1
Fehr & Peers Synchro 8 Report
Movement SBRLane ConfigurationsVolume (vph) 390Ideal Flow (vphpl) 1900Total Lost time (s) 5.5Lane Util. Factor 1.00Frpb, ped/bikes 0.93Flpb, ped/bikes 1.00Frt 0.85Flt Protected 1.00Satd. Flow (prot) 1398Flt Permitted 1.00Satd. Flow (perm) 1398Peak-hour factor, PHF 1.00Adj. Flow (vph) 390RTOR Reduction (vph) 280Lane Group Flow (vph) 110Confl. Peds. (#/hr) 21Confl. Bikes (#/hr) 54Heavy Vehicles (%) 7%Turn Type PermProtected PhasesPermitted Phases 6Actuated Green, G (s) 25.4Effective Green, g (s) 25.4Actuated g/C Ratio 0.28Clearance Time (s) 5.5Vehicle Extension (s) 3.0Lane Grp Cap (vph) 394v/s Ratio Protv/s Ratio Perm 0.08v/c Ratio 0.28Uniform Delay, d1 25.2Progression Factor 1.00Incremental Delay, d2 1.8Delay (s) 26.9Level of Service CApproach Delay (s)Approach LOS
Intersection Summary
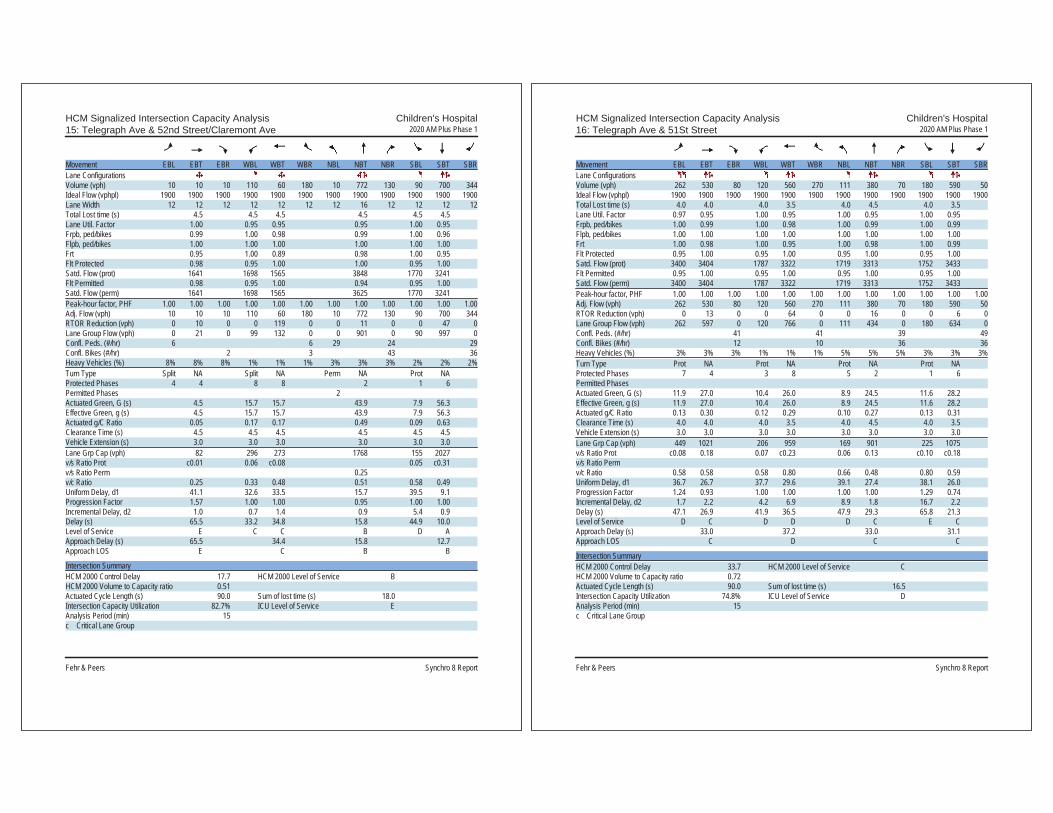
HCM Signalized Intersection Capacity Analysis Children's Hospital15: Telegraph Ave & 52nd Street/Claremont Ave 2020 AM Plus Phase 1
Fehr & Peers Synchro 8 Report
Movement EBL EBT EBR WBL WBT WBR NBL NBT NBR SBL SBT SBRLane ConfigurationsVolume (vph) 10 10 10 110 60 180 10 772 130 90 700 344Ideal Flow (vphpl) 1900 1900 1900 1900 1900 1900 1900 1900 1900 1900 1900 1900Lane Width 12 12 12 12 12 12 12 16 12 12 12 12Total Lost time (s) 4.5 4.5 4.5 4.5 4.5 4.5Lane Util. Factor 1.00 0.95 0.95 0.95 1.00 0.95Frpb, ped/bikes 0.99 1.00 0.98 0.99 1.00 0.96Flpb, ped/bikes 1.00 1.00 1.00 1.00 1.00 1.00Frt 0.95 1.00 0.89 0.98 1.00 0.95Flt Protected 0.98 0.95 1.00 1.00 0.95 1.00Satd. Flow (prot) 1641 1698 1565 3848 1770 3241Flt Permitted 0.98 0.95 1.00 0.94 0.95 1.00Satd. Flow (perm) 1641 1698 1565 3625 1770 3241Peak-hour factor, PHF 1.00 1.00 1.00 1.00 1.00 1.00 1.00 1.00 1.00 1.00 1.00 1.00Adj. Flow (vph) 10 10 10 110 60 180 10 772 130 90 700 344RTOR Reduction (vph) 0 10 0 0 119 0 0 11 0 0 47 0Lane Group Flow (vph) 0 21 0 99 132 0 0 901 0 90 997 0Confl. Peds. (#/hr) 6 6 29 24 29Confl. Bikes (#/hr) 2 3 43 36Heavy Vehicles (%) 8% 8% 8% 1% 1% 1% 3% 3% 3% 2% 2% 2%Turn Type Split NA Split NA Perm NA Prot NAProtected Phases 4 4 8 8 2 1 6Permitted Phases 2Actuated Green, G (s) 4.5 15.7 15.7 43.9 7.9 56.3Effective Green, g (s) 4.5 15.7 15.7 43.9 7.9 56.3Actuated g/C Ratio 0.05 0.17 0.17 0.49 0.09 0.63Clearance Time (s) 4.5 4.5 4.5 4.5 4.5 4.5Vehicle Extension (s) 3.0 3.0 3.0 3.0 3.0 3.0Lane Grp Cap (vph) 82 296 273 1768 155 2027v/s Ratio Prot c0.01 0.06 c0.08 0.05 c0.31v/s Ratio Perm 0.25v/c Ratio 0.25 0.33 0.48 0.51 0.58 0.49Uniform Delay, d1 41.1 32.6 33.5 15.7 39.5 9.1Progression Factor 1.57 1.00 1.00 0.95 1.00 1.00Incremental Delay, d2 1.0 0.7 1.4 0.9 5.4 0.9Delay (s) 65.5 33.2 34.8 15.8 44.9 10.0Level of Service E C C B D AApproach Delay (s) 65.5 34.4 15.8 12.7Approach LOS E C B B
Intersection SummaryHCM 2000 Control Delay 17.7 HCM 2000 Level of Service BHCM 2000 Volume to Capacity ratio 0.51Actuated Cycle Length (s) 90.0 Sum of lost time (s) 18.0Intersection Capacity Utilization 82.7% ICU Level of Service EAnalysis Period (min) 15c Critical Lane Group
HCM Signalized Intersection Capacity Analysis Children's Hospital16: Telegraph Ave & 51St Street 2020 AM Plus Phase 1
Fehr & Peers Synchro 8 Report
Movement EBL EBT EBR WBL WBT WBR NBL NBT NBR SBL SBT SBRLane ConfigurationsVolume (vph) 262 530 80 120 560 270 111 380 70 180 590 50Ideal Flow (vphpl) 1900 1900 1900 1900 1900 1900 1900 1900 1900 1900 1900 1900Total Lost time (s) 4.0 4.0 4.0 3.5 4.0 4.5 4.0 3.5Lane Util. Factor 0.97 0.95 1.00 0.95 1.00 0.95 1.00 0.95Frpb, ped/bikes 1.00 0.99 1.00 0.98 1.00 0.99 1.00 0.99Flpb, ped/bikes 1.00 1.00 1.00 1.00 1.00 1.00 1.00 1.00Frt 1.00 0.98 1.00 0.95 1.00 0.98 1.00 0.99Flt Protected 0.95 1.00 0.95 1.00 0.95 1.00 0.95 1.00Satd. Flow (prot) 3400 3404 1787 3322 1719 3313 1752 3433Flt Permitted 0.95 1.00 0.95 1.00 0.95 1.00 0.95 1.00Satd. Flow (perm) 3400 3404 1787 3322 1719 3313 1752 3433Peak-hour factor, PHF 1.00 1.00 1.00 1.00 1.00 1.00 1.00 1.00 1.00 1.00 1.00 1.00Adj. Flow (vph) 262 530 80 120 560 270 111 380 70 180 590 50RTOR Reduction (vph) 0 13 0 0 64 0 0 16 0 0 6 0Lane Group Flow (vph) 262 597 0 120 766 0 111 434 0 180 634 0Confl. Peds. (#/hr) 41 41 39 49Confl. Bikes (#/hr) 12 10 36 36Heavy Vehicles (%) 3% 3% 3% 1% 1% 1% 5% 5% 5% 3% 3% 3%Turn Type Prot NA Prot NA Prot NA Prot NAProtected Phases 7 4 3 8 5 2 1 6Permitted PhasesActuated Green, G (s) 11.9 27.0 10.4 26.0 8.9 24.5 11.6 28.2Effective Green, g (s) 11.9 27.0 10.4 26.0 8.9 24.5 11.6 28.2Actuated g/C Ratio 0.13 0.30 0.12 0.29 0.10 0.27 0.13 0.31Clearance Time (s) 4.0 4.0 4.0 3.5 4.0 4.5 4.0 3.5Vehicle Extension (s) 3.0 3.0 3.0 3.0 3.0 3.0 3.0 3.0Lane Grp Cap (vph) 449 1021 206 959 169 901 225 1075v/s Ratio Prot c0.08 0.18 0.07 c0.23 0.06 0.13 c0.10 c0.18v/s Ratio Permv/c Ratio 0.58 0.58 0.58 0.80 0.66 0.48 0.80 0.59Uniform Delay, d1 36.7 26.7 37.7 29.6 39.1 27.4 38.1 26.0Progression Factor 1.24 0.93 1.00 1.00 1.00 1.00 1.29 0.74Incremental Delay, d2 1.7 2.2 4.2 6.9 8.9 1.8 16.7 2.2Delay (s) 47.1 26.9 41.9 36.5 47.9 29.3 65.8 21.3Level of Service D C D D D C E CApproach Delay (s) 33.0 37.2 33.0 31.1Approach LOS C D C C
Intersection SummaryHCM 2000 Control Delay 33.7 HCM 2000 Level of Service CHCM 2000 Volume to Capacity ratio 0.72Actuated Cycle Length (s) 90.0 Sum of lost time (s) 16.5Intersection Capacity Utilization 74.8% ICU Level of Service DAnalysis Period (min) 15c Critical Lane Group

HCM Signalized Intersection Capacity Analysis Children's Hospital17: SB SR-24 On-Ramp & MLK Way & NB SR-24 Off-Ramp 2020 AM Plus Phase 1
Fehr & Peers Synchro 8 Report
Movement EBL EBT EBR WBL WBT WBR NBL NBT NBR SBL SBT SBRLane ConfigurationsVolume (vph) 191 0 0 0 0 1555 0 0 0 0 1522 251Ideal Flow (vphpl) 1900 1900 1900 1900 1900 1900 1900 1900 1900 1900 1900 1900Total Lost time (s) 4.0 4.0 4.0 4.0Lane Util. Factor 0.97 1.00 0.95 0.88Frpb, ped/bikes 1.00 1.00 1.00 1.00Flpb, ped/bikes 1.00 1.00 1.00 1.00Frt 1.00 0.86 1.00 0.85Flt Protected 0.95 1.00 1.00 1.00Satd. Flow (prot) 3273 1627 3574 2814Flt Permitted 0.95 1.00 1.00 1.00Satd. Flow (perm) 3273 1627 3574 2814Peak-hour factor, PHF 1.00 1.00 1.00 1.00 1.00 1.00 1.00 1.00 1.00 1.00 1.00 1.00Adj. Flow (vph) 191 0 0 0 0 1555 0 0 0 0 1522 251RTOR Reduction (vph) 0 0 0 0 0 0 0 0 0 0 0 0Lane Group Flow (vph) 191 0 0 0 0 1555 0 0 0 0 1522 251Confl. Peds. (#/hr) 8Confl. Bikes (#/hr) 3Heavy Vehicles (%) 7% 7% 2% 2% 1% 1% 2% 2% 2% 2% 1% 1%Turn Type Prot Free NA customProtected Phases 2 6 FreePermitted Phases FreeActuated Green, G (s) 8.0 45.0 29.0 45.0Effective Green, g (s) 8.0 45.0 29.0 45.0Actuated g/C Ratio 0.18 1.00 0.64 1.00Clearance Time (s) 4.0 4.0Lane Grp Cap (vph) 581 1627 2303 2814v/s Ratio Prot 0.06 0.43 0.09v/s Ratio Perm c0.96v/c Ratio 0.33 0.96 0.66 0.09Uniform Delay, d1 16.2 0.0 5.0 0.0Progression Factor 1.00 1.00 1.76 1.00Incremental Delay, d2 1.5 14.0 1.2 0.1Delay (s) 17.7 14.0 10.0 0.1Level of Service B B A AApproach Delay (s) 17.7 14.0 0.0 8.6Approach LOS B B A A
Intersection SummaryHCM 2000 Control Delay 11.5 HCM 2000 Level of Service BHCM 2000 Volume to Capacity ratio 1.16Actuated Cycle Length (s) 45.0 Sum of lost time (s) 8.0Intersection Capacity Utilization 54.2% ICU Level of Service AAnalysis Period (min) 15c Critical Lane Group
HCM Unsignalized Intersection Capacity Analysis Children's Hospital18: West Street & 52nd Street 2020 AM Plus Phase 1
Fehr & Peers Synchro 8 Report
Movement EBL EBT EBR WBL WBT WBR NBL NBT NBR SBL SBT SBRLane ConfigurationsSign Control Stop Stop Stop StopVolume (vph) 0 170 20 70 100 0 30 0 80 10 50 10Peak Hour Factor 1.00 1.00 1.00 1.00 1.00 1.00 1.00 1.00 1.00 1.00 1.00 1.00Hourly flow rate (vph) 0 170 20 70 100 0 30 0 80 10 50 10
Direction, Lane # EB 1 WB 1 NB 1 NB 2 SB 1Volume Total (vph) 190 170 30 80 70Volume Left (vph) 0 70 30 0 10Volume Right (vph) 20 0 0 80 10Hadj (s) -0.05 0.12 0.50 -0.70 -0.02Departure Headway (s) 4.5 4.7 5.9 4.7 5.0Degree Utilization, x 0.24 0.22 0.05 0.11 0.10Capacity (veh/h) 763 727 567 703 661Control Delay (s) 8.9 9.0 8.1 7.1 8.5Approach Delay (s) 8.9 9.0 7.4 8.5Approach LOS A A A A
Intersection SummaryDelay 8.6Level of Service AIntersection Capacity Utilization 41.5% ICU Level of Service AAnalysis Period (min) 15

HCM Unsignalized Intersection Capacity Analysis Children's Hospital19: Genoa Street & 52nd Street 2020 AM Plus Phase 1
Fehr & Peers Synchro 8 Report
Movement EBL EBT EBR WBL WBT WBR NBL NBT NBR SBL SBT SBRLane ConfigurationsSign Control Stop Stop Stop StopVolume (vph) 10 160 10 10 100 30 10 10 10 20 10 10Peak Hour Factor 1.00 1.00 1.00 1.00 1.00 1.00 1.00 1.00 1.00 1.00 1.00 1.00Hourly flow rate (vph) 10 160 10 10 100 30 10 10 10 20 10 10
Direction, Lane # EB 1 WB 1 NB 1 SB 1Volume Total (vph) 180 140 30 40Volume Left (vph) 10 10 10 20Volume Right (vph) 10 30 10 10Hadj (s) -0.01 -0.11 -0.13 -0.05Departure Headway (s) 4.2 4.1 4.5 4.6Degree Utilization, x 0.21 0.16 0.04 0.05Capacity (veh/h) 836 848 737 722Control Delay (s) 8.3 7.9 7.7 7.8Approach Delay (s) 8.3 7.9 7.7 7.8Approach LOS A A A A
Intersection SummaryDelay 8.1Level of Service AIntersection Capacity Utilization 24.1% ICU Level of Service AAnalysis Period (min) 15
HCM Unsignalized Intersection Capacity Analysis Children's Hospital20: Genoa Street & 55th Street 2020 AM Plus Phase 1
Fehr & Peers Synchro 8 Report
Movement EBL EBT EBR WBL WBT WBR NBL NBT NBR SBL SBT SBRLane ConfigurationsVolume (veh/h) 10 370 10 10 360 20 10 20 20 40 20 10Sign Control Free Free Stop StopGrade 0% 0% 0% 0%Peak Hour Factor 1.00 1.00 1.00 1.00 1.00 1.00 1.00 1.00 1.00 1.00 1.00 1.00Hourly flow rate (vph) 10 370 10 10 360 20 10 20 20 40 20 10Pedestrians 11 3 13 15Lane Width (ft) 12.0 12.0 12.0 12.0Walking Speed (ft/s) 4.0 4.0 4.0 4.0Percent Blockage 1 0 1 1Right turn flare (veh)Median type None NoneMedian storage veh)Upstream signal (ft) 721pX, platoon unblockedvC, conflicting volume 395 393 829 823 391 833 818 396vC1, stage 1 conf volvC2, stage 2 conf volvCu, unblocked vol 395 393 829 823 391 833 818 396tC, single (s) 4.1 4.1 7.1 6.5 6.2 7.1 6.5 6.2tC, 2 stage (s)tF (s) 2.2 2.2 3.5 4.0 3.3 3.5 4.0 3.3p0 queue free % 99 99 96 93 97 84 93 98cM capacity (veh/h) 1154 1164 259 298 653 253 298 639
Direction, Lane # EB 1 WB 1 NB 1 SB 1Volume Total 390 390 50 70Volume Left 10 10 10 40Volume Right 10 20 20 10cSH 1154 1164 367 291Volume to Capacity 0.01 0.01 0.14 0.24Queue Length 95th (ft) 1 1 12 23Control Delay (s) 0.3 0.3 16.3 21.3Lane LOS A A C CApproach Delay (s) 0.3 0.3 16.3 21.3Approach LOS C C
Intersection SummaryAverage Delay 2.8Intersection Capacity Utilization 42.1% ICU Level of Service AAnalysis Period (min) 15

HCM Unsignalized Intersection Capacity Analysis Children's Hospital21: MLK Way & RIRO Main Garage 2020 AM Plus Phase 1
Fehr & Peers Synchro 8 Report
Movement WBL WBR NBT NBR SBL SBTLane ConfigurationsVolume (veh/h) 0 34 1642 201 0 1713Sign Control Stop Free FreeGrade 0% 0% 0%Peak Hour Factor 1.00 1.00 1.00 1.00 1.00 1.00Hourly flow rate (vph) 0 34 1642 201 0 1713PedestriansLane Width (ft)Walking Speed (ft/s)Percent BlockageRight turn flare (veh)Median type None NoneMedian storage veh)Upstream signal (ft) 154 137pX, platoon unblocked 0.85 0.76 0.76vC, conflicting volume 2314 648 1843vC1, stage 1 conf volvC2, stage 2 conf volvCu, unblocked vol 510 0 992tC, single (s) 6.8 6.9 4.1tC, 2 stage (s)tF (s) 3.5 3.3 2.2p0 queue free % 100 96 100cM capacity (veh/h) 417 821 525
Direction, Lane # WB 1 NB 1 NB 2 NB 3 SB 1 SB 2 SB 3Volume Total 34 657 657 529 571 571 571Volume Left 0 0 0 0 0 0 0Volume Right 34 0 0 201 0 0 0cSH 821 1700 1700 1700 1700 1700 1700Volume to Capacity 0.04 0.39 0.39 0.31 0.34 0.34 0.34Queue Length 95th (ft) 3 0 0 0 0 0 0Control Delay (s) 9.6 0.0 0.0 0.0 0.0 0.0 0.0Lane LOS AApproach Delay (s) 9.6 0.0 0.0Approach LOS A
Intersection SummaryAverage Delay 0.1Intersection Capacity Utilization 46.2% ICU Level of Service AAnalysis Period (min) 15
HCM Unsignalized Intersection Capacity Analysis Children's Hospital22: MLK Way & RIRO Main Plaza 2020 AM Plus Phase 1
Fehr & Peers Synchro 8 Report
Movement WBL WBR NBT NBR SBL SBTLane ConfigurationsVolume (veh/h) 0 1 1721 25 0 1823Sign Control Stop Free FreeGrade 0% 0% 0%Peak Hour Factor 1.00 1.00 1.00 1.00 1.00 1.00Hourly flow rate (vph) 0 1 1721 25 0 1823PedestriansLane Width (ft)Walking Speed (ft/s)Percent BlockageRight turn flare (veh)Median type None NoneMedian storage veh)Upstream signal (ft) 424 204pX, platoon unblocked 0.78vC, conflicting volume 2341 586 1746vC1, stage 1 conf volvC2, stage 2 conf volvCu, unblocked vol 1741 586 1746tC, single (s) 6.8 6.9 4.1tC, 2 stage (s)tF (s) 3.5 3.3 2.2p0 queue free % 100 100 100cM capacity (veh/h) 61 453 356
Direction, Lane # WB 1 NB 1 NB 2 NB 3 SB 1 SB 2 SB 3Volume Total 1 688 688 369 608 608 608Volume Left 0 0 0 0 0 0 0Volume Right 1 0 0 25 0 0 0cSH 453 1700 1700 1700 1700 1700 1700Volume to Capacity 0.00 0.40 0.40 0.22 0.36 0.36 0.36Queue Length 95th (ft) 0 0 0 0 0 0 0Control Delay (s) 13.0 0.0 0.0 0.0 0.0 0.0 0.0Lane LOS BApproach Delay (s) 13.0 0.0 0.0Approach LOS B
Intersection SummaryAverage Delay 0.0Intersection Capacity Utilization 43.8% ICU Level of Service AAnalysis Period (min) 15
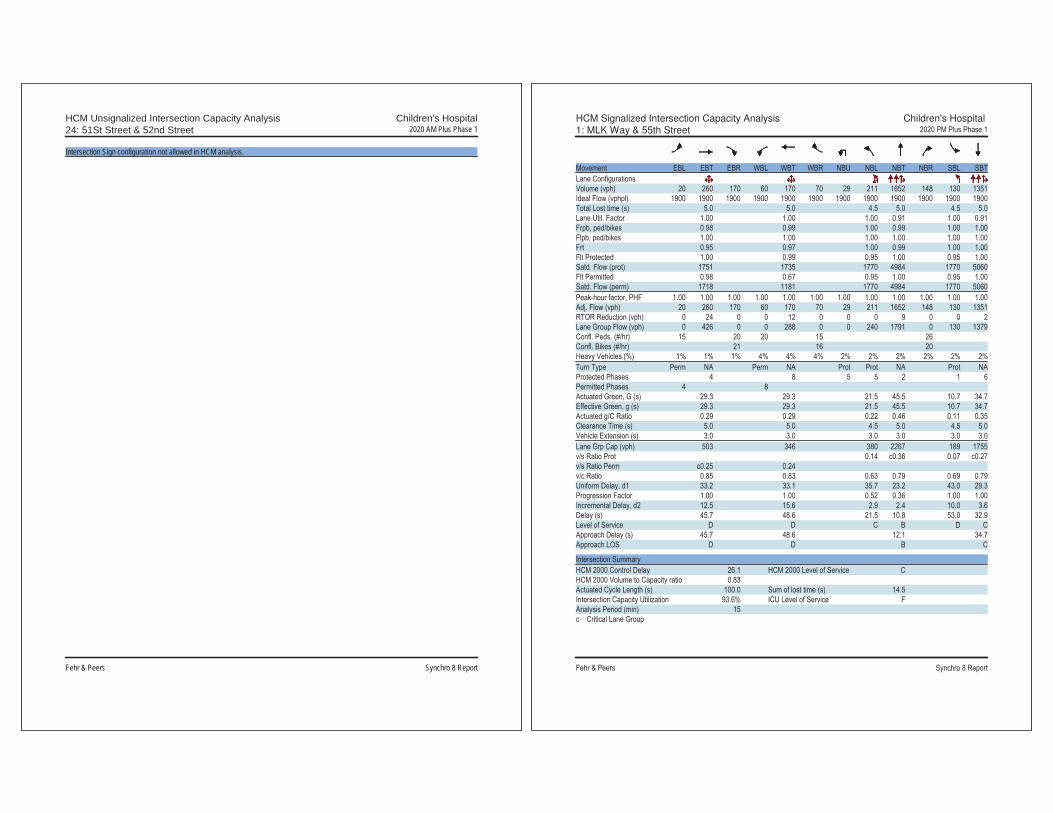
HCM Unsignalized Intersection Capacity Analysis Children's Hospital24: 51St Street & 52nd Street 2020 AM Plus Phase 1
Fehr & Peers Synchro 8 Report
Intersection Sign configuration not allowed in HCM analysis.
HCM Signalized Intersection Capacity Analysis Children's Hospital 1: MLK Way & 55th Street

HCM Signalized Intersection Capacity Analysis Children's Hospital 1: MLK Way & 55th Street
HCM Unsignalized Intersection Capacity Analysis Children's Hospital 2: Dover Street & 55th Street

HCM Signalized Intersection Capacity Analysis Children's Hospital 3: 55th Street & Shattuck Ave
HCM Signalized Intersection Capacity Analysis Children's Hospital 4: 55th Street & Telegraph Ave

HCM Unsignalized Intersection Capacity Analysis Children's Hospital 5: MLK Way & 54th Street
HCM Unsignalized Intersection Capacity Analysis Children's Hospital 5: MLK Way & 54th Street

HCM Unsignalized Intersection Capacity Analysis Children's Hospital 6: Dover Street & 54th Street
HCM Unsignalized Intersection Capacity Analysis Children's Hospital 7: Shattuck Ave & 54th Street

HCM Signalized Intersection Capacity Analysis Children's Hospital 8: MLK Way & 53rd Street
HCM Signalized Intersection Capacity Analysis Children's Hospital 8: MLK Way & 53rd Street

HCM Unsignalized Intersection Capacity Analysis Children's Hospital 9: Dover Street & 53rd Street
HCM Signalized Intersection Capacity Analysis Children's Hospital 10: MLK Way & 52nd Street

HCM Signalized Intersection Capacity Analysis Children's Hospital 10: MLK Way & 52nd Street
HCM Signalized Intersection Capacity Analysis Children's Hospital 11: 52nd Street & Garage

HCM Unsignalized Intersection Capacity Analysis Children's Hospital 12: 52nd Street & Dover Street
HCM Unsignalized Intersection Capacity Analysis Children's Hospital 13: SR-24 NB Off-Ramp & 52nd Street

HCM Signalized Intersection Capacity Analysis Children's Hospital 14: 52nd Street & Shattuck Ave
HCM Signalized Intersection Capacity Analysis Children's Hospital 14: 52nd Street & Shattuck Ave

HCM Signalized Intersection Capacity Analysis Children's Hospital 15: Telegraph Ave & 52nd Street/Claremont Ave
HCM Signalized Intersection Capacity Analysis Children's Hospital 16: Telegraph Ave & 51St Street

HCM Signalized Intersection Capacity Analysis Children's Hospital 17: SB SR-24 On-Ramp & MLK Way & NB SR-24 Off-Ramp
HCM Unsignalized Intersection Capacity Analysis Children's Hospital 18: West Street & 52nd Street

HCM Unsignalized Intersection Capacity Analysis Children's Hospital 19: Genoa Street & 52nd Street
HCM Unsignalized Intersection Capacity Analysis Children's Hospital 20: Genoa Street & 55th Street

HCM Unsignalized Intersection Capacity Analysis Children's Hospital 21: MLK Way & RIRO Main Garage
HCM Unsignalized Intersection Capacity Analysis Children's Hospital 22: MLK Way & RIRO Main Plaza

HCM Unsignalized Intersection Capacity Analysis Children's Hospital 24: 51St Street & 52nd Street
Appendix I LOS Calculation Worksheets – 2020 Plus Phase 2
Conditions

HCM Signalized Intersection Capacity Analysis Children's Hospital1: MLK Way & 55th Street 2020 AM Plus Phase 2
Fehr & Peers Synchro 8 Report
Movement EBL EBT EBR WBL WBT WBR NBU NBL NBT NBR SBL SBTLane ConfigurationsVolume (vph) 20 180 230 60 240 80 21 150 1386 70 90 1341Ideal Flow (vphpl) 1900 1900 1900 1900 1900 1900 1900 1900 1900 1900 1900 1900Total Lost time (s) 5.0 5.0 4.5 5.0 4.5 5.0Lane Util. Factor 1.00 1.00 1.00 0.91 1.00 0.91Frpb, ped/bikes 0.98 0.99 1.00 1.00 1.00 1.00Flpb, ped/bikes 1.00 1.00 1.00 1.00 1.00 1.00Frt 0.93 0.97 1.00 0.99 1.00 0.99Flt Protected 1.00 0.99 0.95 1.00 0.95 1.00Satd. Flow (prot) 1703 1747 1770 5029 1770 5047Flt Permitted 0.98 0.77 0.95 1.00 0.95 1.00Satd. Flow (perm) 1664 1360 1770 5029 1770 5047Peak-hour factor, PHF 1.00 1.00 1.00 1.00 1.00 1.00 1.00 1.00 1.00 1.00 1.00 1.00Adj. Flow (vph) 20 180 230 60 240 80 21 150 1386 70 90 1341RTOR Reduction (vph) 0 52 0 0 12 0 0 0 5 0 0 4Lane Group Flow (vph) 0 378 0 0 368 0 0 171 1451 0 90 1387Confl. Peds. (#/hr) 10 19 19 10 28Confl. Bikes (#/hr) 21 20 8Heavy Vehicles (%) 1% 1% 1% 4% 4% 4% 2% 2% 2% 2% 2% 2%Turn Type Perm NA Perm NA Prot Prot NA Prot NAProtected Phases 4 8 5 5 2 1 6Permitted Phases 4 8Actuated Green, G (s) 27.7 27.7 14.4 41.8 6.0 33.4Effective Green, g (s) 27.7 27.7 14.4 41.8 6.0 33.4Actuated g/C Ratio 0.31 0.31 0.16 0.46 0.07 0.37Clearance Time (s) 5.0 5.0 4.5 5.0 4.5 5.0Vehicle Extension (s) 3.0 3.0 3.0 3.0 3.0 3.0Lane Grp Cap (vph) 512 418 283 2335 118 1872v/s Ratio Prot 0.10 c0.29 0.05 c0.27v/s Ratio Perm 0.23 c0.27v/c Ratio 0.74 0.88 0.60 0.62 0.76 0.74Uniform Delay, d1 27.9 29.6 35.2 18.1 41.3 24.5Progression Factor 1.00 1.00 0.53 0.20 1.00 1.00Incremental Delay, d2 5.5 19.0 3.3 1.1 24.8 2.7Delay (s) 33.4 48.6 21.9 4.8 66.1 27.2Level of Service C D C A E CApproach Delay (s) 33.4 48.6 6.6 29.6Approach LOS C D A C
Intersection SummaryHCM 2000 Control Delay 22.3 HCM 2000 Level of Service CHCM 2000 Volume to Capacity ratio 0.79Actuated Cycle Length (s) 90.0 Sum of lost time (s) 14.5Intersection Capacity Utilization 90.3% ICU Level of Service EAnalysis Period (min) 15c Critical Lane Group
HCM Signalized Intersection Capacity Analysis Children's Hospital1: MLK Way & 55th Street 2020 AM Plus Phase 2
Fehr & Peers Synchro 8 Report
Movement SBRLane ConfigurationsVolume (vph) 50Ideal Flow (vphpl) 1900Total Lost time (s)Lane Util. FactorFrpb, ped/bikesFlpb, ped/bikesFrtFlt ProtectedSatd. Flow (prot)Flt PermittedSatd. Flow (perm)Peak-hour factor, PHF 1.00Adj. Flow (vph) 50RTOR Reduction (vph) 0Lane Group Flow (vph) 0Confl. Peds. (#/hr) 16Confl. Bikes (#/hr) 10Heavy Vehicles (%) 2%Turn TypeProtected PhasesPermitted PhasesActuated Green, G (s)Effective Green, g (s)Actuated g/C RatioClearance Time (s)Vehicle Extension (s)Lane Grp Cap (vph)v/s Ratio Protv/s Ratio Permv/c RatioUniform Delay, d1Progression FactorIncremental Delay, d2Delay (s)Level of ServiceApproach Delay (s)Approach LOS
Intersection Summary

HCM Unsignalized Intersection Capacity Analysis Children's Hospital2: Dover Street & 55th Street 2020 AM Plus Phase 2
Fehr & Peers Synchro 8 Report
Movement EBL EBT EBR WBL WBT WBR NBL NBT NBR SBL SBT SBRLane ConfigurationsVolume (veh/h) 30 300 10 33 320 10 10 10 22 10 10 30Sign Control Free Free Stop StopGrade 0% 0% 0% 0%Peak Hour Factor 1.00 1.00 1.00 1.00 1.00 1.00 1.00 1.00 1.00 1.00 1.00 1.00Hourly flow rate (vph) 30 300 10 33 320 10 10 10 22 10 10 30Pedestrians 12 26 20 8Lane Width (ft) 12.0 12.0 12.0 12.0Walking Speed (ft/s) 4.0 4.0 4.0 4.0Percent Blockage 1 2 2 1Right turn flare (veh)Median type None NoneMedian storage veh)Upstream signal (ft) 641 677pX, platoon unblocked 0.89 0.89 0.89 0.89 0.89 0.89vC, conflicting volume 338 330 823 789 351 817 789 345vC1, stage 1 conf volvC2, stage 2 conf volvCu, unblocked vol 192 330 738 700 351 731 700 200tC, single (s) 4.1 4.1 7.1 6.5 6.2 7.1 6.5 6.2tC, 2 stage (s)tF (s) 2.2 2.2 3.5 4.0 3.3 3.5 4.0 3.3p0 queue free % 98 97 96 97 97 96 97 96cM capacity (veh/h) 1203 1198 257 301 671 258 298 733
Direction, Lane # EB 1 WB 1 NB 1 SB 1Volume Total 340 363 42 50Volume Left 30 33 10 10Volume Right 10 10 22 30cSH 1203 1198 400 442Volume to Capacity 0.02 0.03 0.10 0.11Queue Length 95th (ft) 2 2 9 10Control Delay (s) 0.9 1.0 15.1 14.2Lane LOS A A C BApproach Delay (s) 0.9 1.0 15.1 14.2Approach LOS C B
Intersection SummaryAverage Delay 2.5Intersection Capacity Utilization 41.9% ICU Level of Service AAnalysis Period (min) 15
HCM Signalized Intersection Capacity Analysis Children's Hospital3: 55th Street & Shattuck Ave 2020 AM Plus Phase 2
Fehr & Peers Synchro 8 Report
Movement EBL EBT EBR WBL WBT WBR NBL NBT NBR SBL SBT SBRLane ConfigurationsVolume (vph) 60 232 60 32 273 50 40 460 31 30 570 40Ideal Flow (vphpl) 1900 1900 1900 1900 1900 1900 1900 1900 1900 1900 1900 1900Total Lost time (s) 3.0 3.0 5.0 5.0Lane Util. Factor 1.00 1.00 1.00 1.00Frpb, ped/bikes 0.99 0.99 1.00 1.00Flpb, ped/bikes 1.00 1.00 1.00 1.00Frt 0.98 0.98 0.99 0.99Flt Protected 0.99 1.00 1.00 1.00Satd. Flow (prot) 1727 1787 1835 1855Flt Permitted 0.85 0.95 0.93 0.96Satd. Flow (perm) 1488 1712 1709 1792Peak-hour factor, PHF 1.00 1.00 1.00 1.00 1.00 1.00 1.00 1.00 1.00 1.00 1.00 1.00Adj. Flow (vph) 60 232 60 32 273 50 40 460 31 30 570 40RTOR Reduction (vph) 0 9 0 0 8 0 0 3 0 0 3 0Lane Group Flow (vph) 0 343 0 0 347 0 0 528 0 0 637 0Confl. Peds. (#/hr) 8 17 17 8 10 23 23 10Confl. Bikes (#/hr) 29 13 17 32Heavy Vehicles (%) 5% 5% 5% 3% 3% 3% 2% 2% 2% 1% 1% 1%Turn Type Perm NA Perm NA Perm NA Perm NAProtected Phases 2 6 4 8Permitted Phases 2 6 4 4 8Actuated Green, G (s) 25.0 25.0 47.0 47.0Effective Green, g (s) 25.0 25.0 47.0 47.0Actuated g/C Ratio 0.31 0.31 0.59 0.59Clearance Time (s) 3.0 3.0 5.0 5.0Lane Grp Cap (vph) 465 535 1004 1052v/s Ratio Protv/s Ratio Perm c0.23 0.20 0.31 c0.36v/c Ratio 0.74 0.65 0.53 0.61Uniform Delay, d1 24.6 23.7 9.9 10.6Progression Factor 1.00 1.00 1.00 1.00Incremental Delay, d2 10.0 6.0 2.0 2.6Delay (s) 34.6 29.7 11.8 13.2Level of Service C C B BApproach Delay (s) 34.6 29.7 11.8 13.2Approach LOS C C B B
Intersection SummaryHCM 2000 Control Delay 19.9 HCM 2000 Level of Service BHCM 2000 Volume to Capacity ratio 0.65Actuated Cycle Length (s) 80.0 Sum of lost time (s) 8.0Intersection Capacity Utilization 80.3% ICU Level of Service DAnalysis Period (min) 15c Critical Lane Group

HCM Signalized Intersection Capacity Analysis Children's Hospital4: 55th Street & Telegraph Ave 2020 AM Plus Phase 2
Fehr & Peers Synchro 8 Report
Movement EBL EBT EBR WBL WBT WBR NBL NBT NBR SBL SBT SBRLane ConfigurationsVolume (vph) 163 20 90 40 10 10 70 850 50 40 1000 265Ideal Flow (vphpl) 1900 1900 1900 1900 1900 1900 1900 1900 1900 1900 1900 1900Total Lost time (s) 4.5 4.5 4.5 4.5 4.5 4.5Lane Util. Factor 1.00 1.00 1.00 0.95 1.00 0.95Frpb, ped/bikes 0.99 0.99 1.00 0.99 1.00 0.98Flpb, ped/bikes 1.00 0.99 1.00 1.00 0.99 1.00Frt 0.96 0.98 1.00 0.99 1.00 0.97Flt Protected 0.97 0.97 0.95 1.00 0.95 1.00Satd. Flow (prot) 1649 1709 1763 3491 1768 3409Flt Permitted 0.78 0.76 0.16 1.00 0.28 1.00Satd. Flow (perm) 1328 1339 299 3491 517 3409Peak-hour factor, PHF 1.00 1.00 1.00 1.00 1.00 1.00 1.00 1.00 1.00 1.00 1.00 1.00Adj. Flow (vph) 163 20 90 40 10 10 70 850 50 40 1000 265RTOR Reduction (vph) 0 30 0 0 7 0 0 5 0 0 27 0Lane Group Flow (vph) 0 243 0 0 53 0 70 895 0 40 1238 0Confl. Peds. (#/hr) 8 15 15 8 17 23 23 17Confl. Bikes (#/hr) 20 20 56 36Heavy Vehicles (%) 5% 5% 5% 4% 4% 4% 2% 2% 2% 1% 1% 1%Turn Type Perm NA Perm NA Perm NA Perm NAProtected Phases 4 8 2 6Permitted Phases 4 8 2 6Actuated Green, G (s) 18.2 18.2 42.8 42.8 42.8 42.8Effective Green, g (s) 18.2 18.2 42.8 42.8 42.8 42.8Actuated g/C Ratio 0.26 0.26 0.61 0.61 0.61 0.61Clearance Time (s) 4.5 4.5 4.5 4.5 4.5 4.5Vehicle Extension (s) 3.0 3.0 3.0 3.0 3.0 3.0Lane Grp Cap (vph) 345 348 182 2134 316 2084v/s Ratio Prot 0.26 c0.36v/s Ratio Perm c0.18 0.04 0.23 0.08v/c Ratio 0.71 0.15 0.38 0.42 0.13 0.59Uniform Delay, d1 23.5 20.0 6.9 7.1 5.7 8.3Progression Factor 1.00 1.00 1.00 1.00 1.00 1.00Incremental Delay, d2 6.4 0.2 6.0 0.6 0.8 1.3Delay (s) 29.9 20.2 13.0 7.7 6.6 9.6Level of Service C C B A A AApproach Delay (s) 29.9 20.2 8.1 9.5Approach LOS C C A A
Intersection SummaryHCM 2000 Control Delay 11.3 HCM 2000 Level of Service BHCM 2000 Volume to Capacity ratio 0.63Actuated Cycle Length (s) 70.0 Sum of lost time (s) 9.0Intersection Capacity Utilization 70.1% ICU Level of Service CAnalysis Period (min) 15c Critical Lane Group
HCM Unsignalized Intersection Capacity Analysis Children's Hospital5: MLK Way & 54th Street 2020 AM Plus Phase 2
Fehr & Peers Synchro 8 Report
Movement EBL EBT EBR WBL WBT WBR NBU NBL NBT NBR SBL SBTLane ConfigurationsVolume (veh/h) 10 10 50 10 10 10 10 20 1577 20 20 1602Sign Control Stop Stop Free FreeGrade 0% 0% 0% 0%Peak Hour Factor 1.00 1.00 1.00 1.00 1.00 1.00 1.00 1.00 1.00 1.00 1.00 1.00Hourly flow rate (vph) 10 10 50 10 10 10 0 20 1577 20 20 1602Pedestrians 10 8 11Lane Width (ft) 12.0 12.0 12.0Walking Speed (ft/s) 4.0 4.0 4.0Percent Blockage 1 1 1Right turn flare (veh)Median type None NoneMedian storage veh)Upstream signal (ft) 299 294pX, platoon unblocked 0.85 0.85 0.77 0.85 0.85 0.83 0.00 0.77 0.83vC, conflicting volume 2238 3302 560 2275 3297 544 0 1622 1605vC1, stage 1 conf volvC2, stage 2 conf volvCu, unblocked vol 506 1756 0 549 1750 0 0 747 1018tC, single (s) 7.5 6.5 6.9 7.5 6.5 6.9 0.0 4.1 4.1tC, 2 stage (s)tF (s) 3.5 4.0 3.3 *5.0 *5.0 *5.0 0.0 2.2 2.2p0 queue free % 97 85 94 95 84 98 0 97 96cM capacity (veh/h) 312 67 822 215 64 595 0 652 564
Direction, Lane # EB 1 WB 1 NB 1 NB 2 NB 3 SB 1 SB 2 SB 3Volume Total 70 30 414 788 414 420 801 410Volume Left 10 10 20 0 0 20 0 0Volume Right 50 10 0 0 20 0 0 10cSH 290 136 652 1700 1700 564 1700 1700Volume to Capacity 0.24 0.22 0.03 0.46 0.24 0.04 0.47 0.24Queue Length 95th (ft) 23 20 2 0 0 3 0 0Control Delay (s) 21.3 38.7 0.9 0.0 0.0 1.1 0.0 0.0Lane LOS C E A AApproach Delay (s) 21.3 38.7 0.2 0.3Approach LOS C E
Intersection SummaryAverage Delay 1.0Intersection Capacity Utilization 66.7% ICU Level of Service CAnalysis Period (min) 15
* User Entered Value

HCM Unsignalized Intersection Capacity Analysis Children's Hospital5: MLK Way & 54th Street 2020 AM Plus Phase 2
Fehr & Peers Synchro 8 Report
Movement SBRLane ConfigurationsVolume (veh/h) 10Sign ControlGradePeak Hour Factor 1.00Hourly flow rate (vph) 10PedestriansLane Width (ft)Walking Speed (ft/s)Percent BlockageRight turn flare (veh)Median typeMedian storage veh)Upstream signal (ft)pX, platoon unblockedvC, conflicting volumevC1, stage 1 conf volvC2, stage 2 conf volvCu, unblocked voltC, single (s)tC, 2 stage (s)tF (s)p0 queue free %cM capacity (veh/h)
Direction, Lane #
HCM Unsignalized Intersection Capacity Analysis Children's Hospital6: Dover Street & 54th Street 2020 AM Plus Phase 2
Fehr & Peers Synchro 8 Report
Movement EBL EBT EBR WBL WBT WBR NBL NBT NBR SBL SBT SBRLane ConfigurationsVolume (veh/h) 10 10 10 10 10 10 10 22 20 10 43 10Sign Control Stop Stop Free FreeGrade 0% 0% 0% 0%Peak Hour Factor 1.00 1.00 1.00 1.00 1.00 1.00 1.00 1.00 1.00 1.00 1.00 1.00Hourly flow rate (vph) 10 10 10 10 10 10 10 22 20 10 43 10Pedestrians 13 19 3 8Lane Width (ft) 12.0 12.0 12.0 12.0Walking Speed (ft/s) 4.0 4.0 4.0 4.0Percent Blockage 1 2 0 1Right turn flare (veh)Median type None NoneMedian storage veh)Upstream signal (ft)pX, platoon unblockedvC, conflicting volume 156 162 64 157 157 59 66 61vC1, stage 1 conf volvC2, stage 2 conf volvCu, unblocked vol 156 162 64 157 157 59 66 61tC, single (s) 7.1 6.5 6.2 7.1 6.5 6.2 4.1 4.1tC, 2 stage (s)tF (s) 3.5 4.0 3.3 3.5 4.0 3.3 2.2 2.2p0 queue free % 99 99 99 99 99 99 99 99cM capacity (veh/h) 761 705 993 759 710 990 1532 1531
Direction, Lane # EB 1 WB 1 NB 1 SB 1Volume Total 30 30 52 63Volume Left 10 10 10 10Volume Right 10 10 20 10cSH 802 803 1532 1531Volume to Capacity 0.04 0.04 0.01 0.01Queue Length 95th (ft) 3 3 0 0Control Delay (s) 9.7 9.7 1.5 1.2Lane LOS A A A AApproach Delay (s) 9.7 9.7 1.5 1.2Approach LOS A A
Intersection SummaryAverage Delay 4.2Intersection Capacity Utilization 21.2% ICU Level of Service AAnalysis Period (min) 15

HCM Unsignalized Intersection Capacity Analysis Children's Hospital7: Shattuck Ave & 54th Street 2020 AM Plus Phase 2
Fehr & Peers Synchro 8 Report
Movement EBL EBR NBL NBT SBT SBRLane ConfigurationsVolume (veh/h) 10 20 20 521 632 10Sign Control Stop Free FreeGrade 0% 0% 0%Peak Hour Factor 1.00 1.00 1.00 1.00 1.00 1.00Hourly flow rate (vph) 10 20 20 521 632 10Pedestrians 12 3 2Lane Width (ft) 12.0 12.0 12.0Walking Speed (ft/s) 4.0 4.0 4.0Percent Blockage 1 0 0Right turn flare (veh)Median type None NoneMedian storage veh)Upstream signal (ft) 550 282pX, platoon unblocked 0.79 0.79 0.79vC, conflicting volume 1212 652 654vC1, stage 1 conf volvC2, stage 2 conf volvCu, unblocked vol 1122 422 424tC, single (s) 6.4 6.2 4.1tC, 2 stage (s)tF (s) 3.5 3.3 2.2p0 queue free % 94 96 98cM capacity (veh/h) 175 494 884
Direction, Lane # EB 1 NB 1 SB 1Volume Total 30 541 642Volume Left 10 20 0Volume Right 20 0 10cSH 308 884 1700Volume to Capacity 0.10 0.02 0.38Queue Length 95th (ft) 8 2 0Control Delay (s) 18.0 0.6 0.0Lane LOS C AApproach Delay (s) 18.0 0.6 0.0Approach LOS C
Intersection SummaryAverage Delay 0.7Intersection Capacity Utilization 54.6% ICU Level of Service AAnalysis Period (min) 15
HCM Signalized Intersection Capacity Analysis Children's Hospital8: MLK Way & 53rd Street 2020 AM Plus Phase 2
Fehr & Peers Synchro 8 Report
Movement EBL EBT EBR WBL WBT WBR NBL NBT NBR SBL SBT SBRLane ConfigurationsVolume (vph) 10 10 40 20 10 20 30 1607 37 20 1662 10Ideal Flow (vphpl) 1900 1900 1900 1900 1900 1900 1900 1900 1900 1900 1900 1900Total Lost time (s) 5.0 5.0 4.0 3.5 4.0 3.5Lane Util. Factor 1.00 1.00 1.00 0.91 1.00 0.91Frpb, ped/bikes 0.98 0.99 1.00 1.00 1.00 1.00Flpb, ped/bikes 1.00 1.00 1.00 1.00 1.00 1.00Frt 0.91 0.95 1.00 1.00 1.00 1.00Flt Protected 0.99 0.98 0.95 1.00 0.95 1.00Satd. Flow (prot) 1653 1742 1770 5060 1787 5128Flt Permitted 0.96 0.88 0.95 1.00 0.95 1.00Satd. Flow (perm) 1595 1569 1770 5060 1787 5128Peak-hour factor, PHF 1.00 1.00 1.00 1.00 1.00 1.00 1.00 1.00 1.00 1.00 1.00 1.00Adj. Flow (vph) 10 10 40 20 10 20 30 1607 37 20 1662 10RTOR Reduction (vph) 0 33 0 0 16 0 0 1 0 0 0 0Lane Group Flow (vph) 0 27 0 0 34 0 30 1643 0 20 1672 0Confl. Peds. (#/hr) 10 17 17 10 17 26Confl. Bikes (#/hr) 7 17Heavy Vehicles (%) 2% 2% 2% 0% 0% 0% 2% 2% 2% 1% 1% 1%Turn Type Perm NA Perm NA Prot NA Prot NAProtected Phases 4 8 5 2 1 6Permitted Phases 4 8Actuated Green, G (s) 15.8 15.8 4.5 58.1 3.6 57.2Effective Green, g (s) 15.8 15.8 4.5 58.1 3.6 57.2Actuated g/C Ratio 0.18 0.18 0.05 0.65 0.04 0.64Clearance Time (s) 5.0 5.0 4.0 3.5 4.0 3.5Vehicle Extension (s) 3.0 3.0 3.0 3.0 3.0 3.0Lane Grp Cap (vph) 280 275 88 3266 71 3259v/s Ratio Prot 0.02 c0.32 0.01 c0.33v/s Ratio Perm 0.02 c0.02v/c Ratio 0.10 0.12 0.34 0.50 0.28 0.51Uniform Delay, d1 31.1 31.3 41.3 8.4 41.9 8.9Progression Factor 1.00 1.02 1.18 0.47 0.53 0.26Incremental Delay, d2 0.2 0.2 1.8 0.4 1.6 0.4Delay (s) 31.3 32.0 50.5 4.3 23.9 2.7Level of Service C C D A C AApproach Delay (s) 31.3 32.0 5.2 2.9Approach LOS C C A A
Intersection SummaryHCM 2000 Control Delay 4.9 HCM 2000 Level of Service AHCM 2000 Volume to Capacity ratio 0.45Actuated Cycle Length (s) 90.0 Sum of lost time (s) 12.5Intersection Capacity Utilization 57.1% ICU Level of Service BAnalysis Period (min) 15c Critical Lane Group

HCM Unsignalized Intersection Capacity Analysis Children's Hospital9: Dover Street & 53rd Street 2020 AM Plus Phase 2
Fehr & Peers Synchro 8 Report
Movement EBL EBT EBR WBL WBT WBR NBL NBT NBR SBL SBT SBRLane ConfigurationsVolume (veh/h) 20 10 37 10 10 10 20 32 20 10 33 20Sign Control Stop Stop Free FreeGrade 0% 0% 0% 0%Peak Hour Factor 1.00 1.00 1.00 1.00 1.00 1.00 1.00 1.00 1.00 1.00 1.00 1.00Hourly flow rate (vph) 20 10 37 10 10 10 20 32 20 10 33 20Pedestrians 29 28 3 3Lane Width (ft) 12.0 12.0 12.0 12.0Walking Speed (ft/s) 4.0 4.0 4.0 4.0Percent Blockage 2 2 0 0Right turn flare (veh)Median type None NoneMedian storage veh)Upstream signal (ft)pX, platoon unblockedvC, conflicting volume 192 212 75 218 212 73 82 80vC1, stage 1 conf volvC2, stage 2 conf volvCu, unblocked vol 192 212 75 218 212 73 82 80tC, single (s) 7.1 6.5 6.2 7.1 6.5 6.2 4.1 4.1tC, 2 stage (s)tF (s) 3.5 4.0 3.3 3.5 4.0 3.3 2.2 2.2p0 queue free % 97 98 96 98 98 99 99 99cM capacity (veh/h) 698 643 966 653 643 969 1491 1495
Direction, Lane # EB 1 WB 1 NB 1 SB 1Volume Total 67 30 72 63Volume Left 20 10 20 10Volume Right 37 10 20 20cSH 812 729 1491 1495Volume to Capacity 0.08 0.04 0.01 0.01Queue Length 95th (ft) 7 3 1 1Control Delay (s) 9.8 10.2 2.1 1.2Lane LOS A B A AApproach Delay (s) 9.8 10.2 2.1 1.2Approach LOS A B
Intersection SummaryAverage Delay 5.1Intersection Capacity Utilization 23.6% ICU Level of Service AAnalysis Period (min) 15
HCM Signalized Intersection Capacity Analysis Children's Hospital10: MLK Way & 52nd Street 2020 AM Plus Phase 2
Fehr & Peers Synchro 8 Report
Movement EBL EBT EBR WBL WBT WBR NBU NBL NBT NBR SBU SBLLane ConfigurationsVolume (vph) 48 95 110 99 92 263 60 80 1514 127 33 108Ideal Flow (vphpl) 1900 1900 1900 1900 1900 1900 1900 1900 1900 1900 1900 1900Total Lost time (s) 5.0 5.0 5.0 5.0 4.5 4.5 4.0Lane Util. Factor 1.00 1.00 1.00 1.00 1.00 0.91 1.00Frpb, ped/bikes 1.00 0.96 1.00 0.97 1.00 1.00 1.00Flpb, ped/bikes 0.99 1.00 0.98 1.00 1.00 1.00 1.00Frt 1.00 0.92 1.00 0.85 1.00 0.99 1.00Flt Protected 0.95 1.00 0.97 1.00 0.95 1.00 0.95Satd. Flow (prot) 1772 1662 1778 1537 1787 5058 1787Flt Permitted 0.56 1.00 0.63 1.00 0.95 1.00 0.95Satd. Flow (perm) 1041 1662 1141 1537 1787 5058 1787Peak-hour factor, PHF 1.00 1.00 1.00 1.00 1.00 1.00 1.00 1.00 1.00 1.00 1.00 1.00Adj. Flow (vph) 48 95 110 99 92 263 60 80 1514 127 33 108RTOR Reduction (vph) 0 53 0 0 0 178 0 0 9 0 0 0Lane Group Flow (vph) 48 152 0 0 191 85 0 140 1632 0 0 141Confl. Peds. (#/hr) 13 64 64 13 10Confl. Bikes (#/hr) 8 7 2Heavy Vehicles (%) 1% 1% 1% 2% 2% 2% 1% 1% 1% 1% 1% 1%Turn Type Perm NA Perm NA Perm Prot Prot NA Prot ProtProtected Phases 4 8 5 5 2 1 1Permitted Phases 4 8 8Actuated Green, G (s) 23.4 23.4 23.4 23.4 7.5 40.6 12.5Effective Green, g (s) 23.4 23.4 23.4 23.4 7.5 40.6 12.5Actuated g/C Ratio 0.26 0.26 0.26 0.26 0.08 0.45 0.14Clearance Time (s) 5.0 5.0 5.0 5.0 4.5 4.5 4.0Vehicle Extension (s) 2.0 2.0 2.0 2.0 2.0 2.0 2.0Lane Grp Cap (vph) 270 432 296 399 148 2281 248v/s Ratio Prot 0.09 c0.08 c0.32 0.08v/s Ratio Perm 0.05 c0.17 0.06v/c Ratio 0.18 0.35 0.65 0.21 0.95 0.72 0.57Uniform Delay, d1 25.8 27.1 29.6 26.1 41.0 20.0 36.2Progression Factor 1.00 1.00 1.00 1.00 1.00 1.07 0.78Incremental Delay, d2 0.1 0.2 3.6 0.1 33.1 0.8 1.6Delay (s) 26.0 27.3 33.2 26.2 74.0 22.2 29.9Level of Service C C C C E C CApproach Delay (s) 27.1 29.1 26.3Approach LOS C C C
Intersection SummaryHCM 2000 Control Delay 21.9 HCM 2000 Level of Service CHCM 2000 Volume to Capacity ratio 0.70Actuated Cycle Length (s) 90.0 Sum of lost time (s) 14.0Intersection Capacity Utilization 100.3% ICU Level of Service GAnalysis Period (min) 15c Critical Lane Group

HCM Signalized Intersection Capacity Analysis Children's Hospital10: MLK Way & 52nd Street 2020 AM Plus Phase 2
Fehr & Peers Synchro 8 Report
Movement SBT SBRLane ConfigurationsVolume (vph) 1571 0Ideal Flow (vphpl) 1900 1900Total Lost time (s) 4.5Lane Util. Factor 0.91Frpb, ped/bikes 1.00Flpb, ped/bikes 1.00Frt 1.00Flt Protected 1.00Satd. Flow (prot) 5136Flt Permitted 1.00Satd. Flow (perm) 5136Peak-hour factor, PHF 1.00 1.00Adj. Flow (vph) 1571 0RTOR Reduction (vph) 0 0Lane Group Flow (vph) 1571 0Confl. Peds. (#/hr) 13Confl. Bikes (#/hr) 13Heavy Vehicles (%) 1% 1%Turn Type NAProtected Phases 6Permitted PhasesActuated Green, G (s) 45.1Effective Green, g (s) 45.1Actuated g/C Ratio 0.50Clearance Time (s) 4.5Vehicle Extension (s) 2.0Lane Grp Cap (vph) 2573v/s Ratio Prot c0.31v/s Ratio Permv/c Ratio 0.61Uniform Delay, d1 16.1Progression Factor 0.77Incremental Delay, d2 1.0Delay (s) 13.4Level of Service BApproach Delay (s) 14.7Approach LOS B
Intersection Summary
HCM Signalized Intersection Capacity Analysis Children's Hospital11: 52nd Street & Garage 2020 AM Plus Phase 2
Fehr & Peers Synchro 8 Report
Movement EBL EBT EBR WBL WBT WBR NBL NBT NBR SBL SBT SBRLane ConfigurationsVolume (vph) 4 302 4 3 420 2 7 3 5 0 2 15Ideal Flow (vphpl) 1900 1900 1900 1900 1900 1900 1900 1900 1900 1900 1900 1900Total Lost time (s) 3.0 3.0 3.0 3.0Lane Util. Factor 1.00 1.00 1.00 1.00Frpb, ped/bikes 1.00 1.00 0.94 0.99Flpb, ped/bikes 1.00 1.00 1.00 1.00Frt 1.00 1.00 0.95 0.88Flt Protected 1.00 1.00 0.98 1.00Satd. Flow (prot) 1854 1897 1437 1655Flt Permitted 1.00 1.00 0.95 1.00Satd. Flow (perm) 1848 1894 1398 1655Peak-hour factor, PHF 1.00 1.00 1.00 1.00 1.00 1.00 1.00 1.00 1.00 1.00 1.00 1.00Adj. Flow (vph) 4 302 4 3 420 2 7 3 5 0 2 15RTOR Reduction (vph) 0 1 0 0 1 0 0 3 0 0 8 0Lane Group Flow (vph) 0 309 0 0 424 0 0 12 0 0 9 0Confl. Peds. (#/hr) 23 72 72 23 263 263Confl. Bikes (#/hr) 8 7 2Heavy Vehicles (%) 2% 2% 2% 0% 0% 0% 16% 16% 16% 0% 0% 0%Turn Type Perm NA Perm NA Perm NA NAProtected Phases 2 6 4 8Permitted Phases 2 6 4 8Actuated Green, G (s) 21.0 21.0 23.0 23.0Effective Green, g (s) 21.0 21.0 23.0 23.0Actuated g/C Ratio 0.42 0.42 0.46 0.46Clearance Time (s) 3.0 3.0 3.0 3.0Lane Grp Cap (vph) 776 795 643 761v/s Ratio Prot 0.01v/s Ratio Perm 0.17 c0.22 c0.01v/c Ratio 0.40 0.53 0.02 0.01Uniform Delay, d1 10.1 10.8 7.4 7.3Progression Factor 1.00 1.00 1.00 1.00Incremental Delay, d2 1.5 2.6 0.1 0.0Delay (s) 11.6 13.4 7.4 7.4Level of Service B B A AApproach Delay (s) 11.6 13.4 7.4 7.4Approach LOS B B A A
Intersection SummaryHCM 2000 Control Delay 12.4 HCM 2000 Level of Service BHCM 2000 Volume to Capacity ratio 0.26Actuated Cycle Length (s) 50.0 Sum of lost time (s) 6.0Intersection Capacity Utilization 49.8% ICU Level of Service AAnalysis Period (min) 15c Critical Lane Group
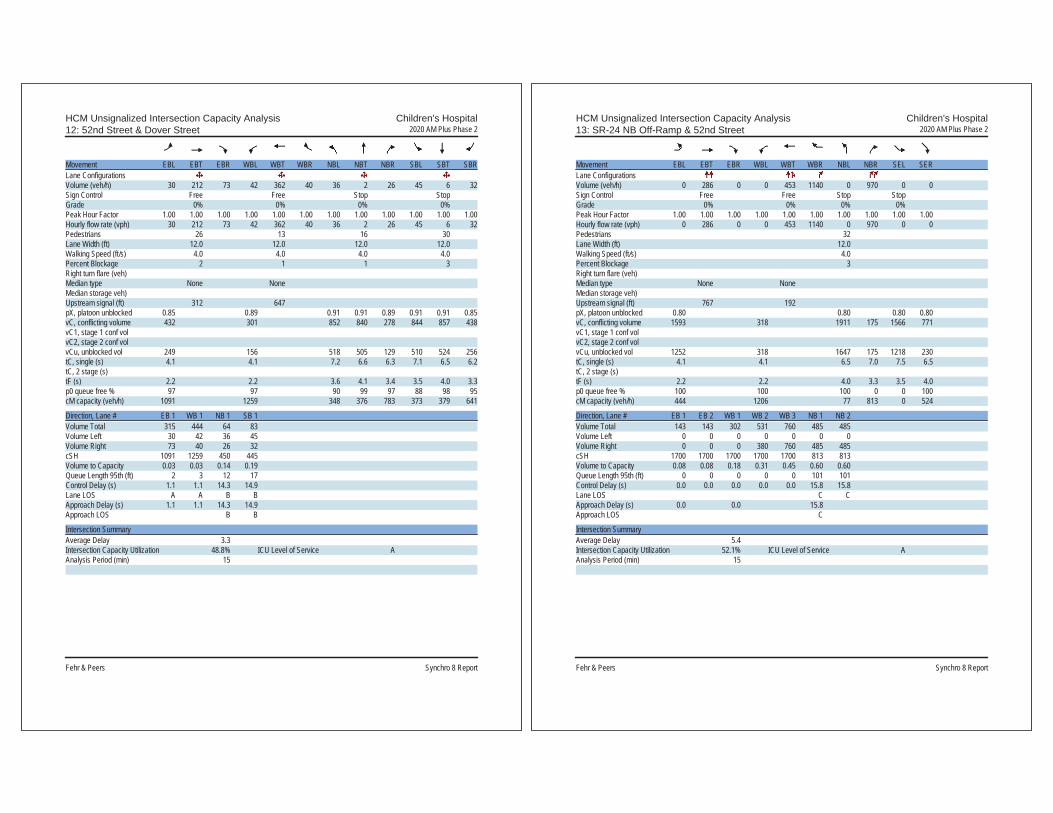
HCM Unsignalized Intersection Capacity Analysis Children's Hospital12: 52nd Street & Dover Street 2020 AM Plus Phase 2
Fehr & Peers Synchro 8 Report
Movement EBL EBT EBR WBL WBT WBR NBL NBT NBR SBL SBT SBRLane ConfigurationsVolume (veh/h) 30 212 73 42 362 40 36 2 26 45 6 32Sign Control Free Free Stop StopGrade 0% 0% 0% 0%Peak Hour Factor 1.00 1.00 1.00 1.00 1.00 1.00 1.00 1.00 1.00 1.00 1.00 1.00Hourly flow rate (vph) 30 212 73 42 362 40 36 2 26 45 6 32Pedestrians 26 13 16 30Lane Width (ft) 12.0 12.0 12.0 12.0Walking Speed (ft/s) 4.0 4.0 4.0 4.0Percent Blockage 2 1 1 3Right turn flare (veh)Median type None NoneMedian storage veh)Upstream signal (ft) 312 647pX, platoon unblocked 0.85 0.89 0.91 0.91 0.89 0.91 0.91 0.85vC, conflicting volume 432 301 852 840 278 844 857 438vC1, stage 1 conf volvC2, stage 2 conf volvCu, unblocked vol 249 156 518 505 129 510 524 256tC, single (s) 4.1 4.1 7.2 6.6 6.3 7.1 6.5 6.2tC, 2 stage (s)tF (s) 2.2 2.2 3.6 4.1 3.4 3.5 4.0 3.3p0 queue free % 97 97 90 99 97 88 98 95cM capacity (veh/h) 1091 1259 348 376 783 373 379 641
Direction, Lane # EB 1 WB 1 NB 1 SB 1Volume Total 315 444 64 83Volume Left 30 42 36 45Volume Right 73 40 26 32cSH 1091 1259 450 445Volume to Capacity 0.03 0.03 0.14 0.19Queue Length 95th (ft) 2 3 12 17Control Delay (s) 1.1 1.1 14.3 14.9Lane LOS A A B BApproach Delay (s) 1.1 1.1 14.3 14.9Approach LOS B B
Intersection SummaryAverage Delay 3.3Intersection Capacity Utilization 48.8% ICU Level of Service AAnalysis Period (min) 15
HCM Unsignalized Intersection Capacity Analysis Children's Hospital13: SR-24 NB Off-Ramp & 52nd Street 2020 AM Plus Phase 2
Fehr & Peers Synchro 8 Report
Movement EBL EBT EBR WBL WBT WBR NBL NBR SEL SERLane ConfigurationsVolume (veh/h) 0 286 0 0 453 1140 0 970 0 0Sign Control Free Free Stop StopGrade 0% 0% 0% 0%Peak Hour Factor 1.00 1.00 1.00 1.00 1.00 1.00 1.00 1.00 1.00 1.00Hourly flow rate (vph) 0 286 0 0 453 1140 0 970 0 0Pedestrians 32Lane Width (ft) 12.0Walking Speed (ft/s) 4.0Percent Blockage 3Right turn flare (veh)Median type None NoneMedian storage veh)Upstream signal (ft) 767 192pX, platoon unblocked 0.80 0.80 0.80 0.80vC, conflicting volume 1593 318 1911 175 1566 771vC1, stage 1 conf volvC2, stage 2 conf volvCu, unblocked vol 1252 318 1647 175 1218 230tC, single (s) 4.1 4.1 6.5 7.0 7.5 6.5tC, 2 stage (s)tF (s) 2.2 2.2 4.0 3.3 3.5 4.0p0 queue free % 100 100 100 0 0 100cM capacity (veh/h) 444 1206 77 813 0 524
Direction, Lane # EB 1 EB 2 WB 1 WB 2 WB 3 NB 1 NB 2Volume Total 143 143 302 531 760 485 485Volume Left 0 0 0 0 0 0 0Volume Right 0 0 0 380 760 485 485cSH 1700 1700 1700 1700 1700 813 813Volume to Capacity 0.08 0.08 0.18 0.31 0.45 0.60 0.60Queue Length 95th (ft) 0 0 0 0 0 101 101Control Delay (s) 0.0 0.0 0.0 0.0 0.0 15.8 15.8Lane LOS C CApproach Delay (s) 0.0 0.0 15.8Approach LOS C
Intersection SummaryAverage Delay 5.4Intersection Capacity Utilization 52.1% ICU Level of Service AAnalysis Period (min) 15

HCM Signalized Intersection Capacity Analysis Children's Hospital14: 52nd Street & Shattuck Ave 2020 AM Plus Phase 2
Fehr & Peers Synchro 8 Report
Movement EBU EBL EBT EBR WBL WBT WBR NBL NBT NBR SBL SBTLane ConfigurationsVolume (vph) 50 291 755 160 40 981 110 170 130 40 110 160Ideal Flow (vphpl) 1900 1900 1900 1900 1900 1900 1900 1900 1900 1900 1900 1900Total Lost time (s) 4.0 4.5 4.0 4.5 4.0 5.5 5.5Lane Util. Factor 1.00 0.91 1.00 0.91 1.00 1.00 1.00Frpb, ped/bikes 1.00 0.99 1.00 1.00 1.00 0.99 1.00Flpb, ped/bikes 1.00 1.00 1.00 1.00 1.00 1.00 1.00Frt 1.00 0.97 1.00 0.98 1.00 0.96 1.00Flt Protected 0.95 1.00 0.95 1.00 0.95 1.00 0.98Satd. Flow (prot) 1787 4934 1805 5087 1752 1766 1733Flt Permitted 0.95 1.00 0.95 1.00 0.39 1.00 0.79Satd. Flow (perm) 1787 4934 1805 5087 726 1766 1400Peak-hour factor, PHF 1.00 1.00 1.00 1.00 1.00 1.00 1.00 1.00 1.00 1.00 1.00 1.00Adj. Flow (vph) 50 291 755 160 40 981 110 170 130 40 110 160RTOR Reduction (vph) 0 0 31 0 0 15 0 0 13 0 0 0Lane Group Flow (vph) 0 341 884 0 40 1076 0 170 157 0 0 270Confl. Peds. (#/hr) 16 7 13 13Confl. Bikes (#/hr) 16 2 13Heavy Vehicles (%) 1% 1% 1% 1% 0% 0% 0% 3% 3% 3% 7% 7%Turn Type Prot Prot NA Prot NA pm+pt NA Perm NAProtected Phases 7 7 4 3 8 5 2 6Permitted Phases 2 6Actuated Green, G (s) 21.5 35.0 5.1 18.6 35.9 35.9 25.4Effective Green, g (s) 21.5 35.0 5.1 18.6 35.9 35.9 25.4Actuated g/C Ratio 0.24 0.39 0.06 0.21 0.40 0.40 0.28Clearance Time (s) 4.0 4.5 4.0 4.5 4.0 5.5 5.5Vehicle Extension (s) 3.0 3.0 3.0 3.0 3.0 3.0 3.0Lane Grp Cap (vph) 426 1918 102 1051 363 704 395v/s Ratio Prot c0.19 0.18 0.02 c0.21 c0.03 0.09v/s Ratio Perm 0.15 c0.19v/c Ratio 0.80 0.46 0.39 1.02 0.47 0.22 0.68Uniform Delay, d1 32.2 20.5 41.0 35.7 18.7 17.9 28.7Progression Factor 1.00 1.00 1.14 0.86 1.00 1.00 1.00Incremental Delay, d2 14.6 0.8 1.9 30.6 1.0 0.7 9.2Delay (s) 46.8 21.3 48.5 61.1 19.6 18.6 38.0Level of Service D C D E B B DApproach Delay (s) 28.2 60.7 19.1 31.4Approach LOS C E B C
Intersection SummaryHCM 2000 Control Delay 38.8 HCM 2000 Level of Service DHCM 2000 Volume to Capacity ratio 0.79Actuated Cycle Length (s) 90.0 Sum of lost time (s) 18.0Intersection Capacity Utilization 105.4% ICU Level of Service GAnalysis Period (min) 15c Critical Lane Group
HCM Signalized Intersection Capacity Analysis Children's Hospital14: 52nd Street & Shattuck Ave 2020 AM Plus Phase 2
Fehr & Peers Synchro 8 Report
Movement SBRLane ConfigurationsVolume (vph) 392Ideal Flow (vphpl) 1900Total Lost time (s) 5.5Lane Util. Factor 1.00Frpb, ped/bikes 0.93Flpb, ped/bikes 1.00Frt 0.85Flt Protected 1.00Satd. Flow (prot) 1398Flt Permitted 1.00Satd. Flow (perm) 1398Peak-hour factor, PHF 1.00Adj. Flow (vph) 392RTOR Reduction (vph) 281Lane Group Flow (vph) 111Confl. Peds. (#/hr) 21Confl. Bikes (#/hr) 54Heavy Vehicles (%) 7%Turn Type PermProtected PhasesPermitted Phases 6Actuated Green, G (s) 25.4Effective Green, g (s) 25.4Actuated g/C Ratio 0.28Clearance Time (s) 5.5Vehicle Extension (s) 3.0Lane Grp Cap (vph) 394v/s Ratio Protv/s Ratio Perm 0.08v/c Ratio 0.28Uniform Delay, d1 25.2Progression Factor 1.00Incremental Delay, d2 1.8Delay (s) 27.0Level of Service CApproach Delay (s)Approach LOS
Intersection Summary

HCM Signalized Intersection Capacity Analysis Children's Hospital15: Telegraph Ave & 52nd Street/Claremont Ave 2020 AM Plus Phase 2
Fehr & Peers Synchro 8 Report
Movement EBL EBT EBR WBL WBT WBR NBL NBT NBR SBL SBT SBRLane ConfigurationsVolume (vph) 10 10 10 110 60 180 10 780 130 90 700 360Ideal Flow (vphpl) 1900 1900 1900 1900 1900 1900 1900 1900 1900 1900 1900 1900Lane Width 12 12 12 12 12 12 12 16 12 12 12 12Total Lost time (s) 4.5 4.5 4.5 4.5 4.5 4.5Lane Util. Factor 1.00 0.95 0.95 0.95 1.00 0.95Frpb, ped/bikes 0.99 1.00 0.98 0.99 1.00 0.96Flpb, ped/bikes 1.00 1.00 1.00 1.00 1.00 1.00Frt 0.95 1.00 0.89 0.98 1.00 0.95Flt Protected 0.98 0.95 1.00 1.00 0.95 1.00Satd. Flow (prot) 1641 1698 1565 3849 1770 3232Flt Permitted 0.98 0.95 1.00 0.94 0.95 1.00Satd. Flow (perm) 1641 1698 1565 3625 1770 3232Peak-hour factor, PHF 1.00 1.00 1.00 1.00 1.00 1.00 1.00 1.00 1.00 1.00 1.00 1.00Adj. Flow (vph) 10 10 10 110 60 180 10 780 130 90 700 360RTOR Reduction (vph) 0 10 0 0 119 0 0 11 0 0 51 0Lane Group Flow (vph) 0 21 0 99 132 0 0 909 0 90 1009 0Confl. Peds. (#/hr) 6 6 29 24 29Confl. Bikes (#/hr) 2 3 43 36Heavy Vehicles (%) 8% 8% 8% 1% 1% 1% 3% 3% 3% 2% 2% 2%Turn Type Split NA Split NA Perm NA Prot NAProtected Phases 4 4 8 8 2 1 6Permitted Phases 2Actuated Green, G (s) 4.5 15.7 15.7 43.9 7.9 56.3Effective Green, g (s) 4.5 15.7 15.7 43.9 7.9 56.3Actuated g/C Ratio 0.05 0.17 0.17 0.49 0.09 0.63Clearance Time (s) 4.5 4.5 4.5 4.5 4.5 4.5Vehicle Extension (s) 3.0 3.0 3.0 3.0 3.0 3.0Lane Grp Cap (vph) 82 296 273 1768 155 2021v/s Ratio Prot c0.01 0.06 c0.08 0.05 c0.31v/s Ratio Perm 0.25v/c Ratio 0.25 0.33 0.48 0.51 0.58 0.50Uniform Delay, d1 41.1 32.6 33.5 15.8 39.5 9.2Progression Factor 1.56 1.00 1.00 0.97 1.00 1.00Incremental Delay, d2 1.0 0.7 1.4 0.9 5.4 0.9Delay (s) 65.3 33.2 34.8 16.1 44.9 10.1Level of Service E C C B D BApproach Delay (s) 65.3 34.4 16.1 12.8Approach LOS E C B B
Intersection SummaryHCM 2000 Control Delay 17.8 HCM 2000 Level of Service BHCM 2000 Volume to Capacity ratio 0.51Actuated Cycle Length (s) 90.0 Sum of lost time (s) 18.0Intersection Capacity Utilization 83.5% ICU Level of Service EAnalysis Period (min) 15c Critical Lane Group
HCM Signalized Intersection Capacity Analysis Children's Hospital16: Telegraph Ave & 51St Street 2020 AM Plus Phase 2
Fehr & Peers Synchro 8 Report
Movement EBL EBT EBR WBL WBT WBR NBL NBT NBR SBL SBT SBRLane ConfigurationsVolume (vph) 270 532 83 120 564 270 117 380 70 180 590 50Ideal Flow (vphpl) 1900 1900 1900 1900 1900 1900 1900 1900 1900 1900 1900 1900Total Lost time (s) 4.0 4.0 4.0 3.5 4.0 4.5 4.0 3.5Lane Util. Factor 0.97 0.95 1.00 0.95 1.00 0.95 1.00 0.95Frpb, ped/bikes 1.00 0.99 1.00 0.98 1.00 0.99 1.00 0.99Flpb, ped/bikes 1.00 1.00 1.00 1.00 1.00 1.00 1.00 1.00Frt 1.00 0.98 1.00 0.95 1.00 0.98 1.00 0.99Flt Protected 0.95 1.00 0.95 1.00 0.95 1.00 0.95 1.00Satd. Flow (prot) 3400 3401 1787 3323 1719 3313 1752 3433Flt Permitted 0.95 1.00 0.95 1.00 0.95 1.00 0.95 1.00Satd. Flow (perm) 3400 3401 1787 3323 1719 3313 1752 3433Peak-hour factor, PHF 1.00 1.00 1.00 1.00 1.00 1.00 1.00 1.00 1.00 1.00 1.00 1.00Adj. Flow (vph) 270 532 83 120 564 270 117 380 70 180 590 50RTOR Reduction (vph) 0 14 0 0 63 0 0 16 0 0 6 0Lane Group Flow (vph) 270 601 0 120 771 0 117 434 0 180 634 0Confl. Peds. (#/hr) 41 41 39 49Confl. Bikes (#/hr) 12 10 36 36Heavy Vehicles (%) 3% 3% 3% 1% 1% 1% 5% 5% 5% 3% 3% 3%Turn Type Prot NA Prot NA Prot NA Prot NAProtected Phases 7 4 3 8 5 2 1 6Permitted PhasesActuated Green, G (s) 12.0 27.0 10.4 25.9 9.0 24.5 11.6 28.1Effective Green, g (s) 12.0 27.0 10.4 25.9 9.0 24.5 11.6 28.1Actuated g/C Ratio 0.13 0.30 0.12 0.29 0.10 0.27 0.13 0.31Clearance Time (s) 4.0 4.0 4.0 3.5 4.0 4.5 4.0 3.5Vehicle Extension (s) 3.0 3.0 3.0 3.0 3.0 3.0 3.0 3.0Lane Grp Cap (vph) 453 1020 206 956 171 901 225 1071v/s Ratio Prot c0.08 0.18 0.07 c0.23 0.07 0.13 c0.10 c0.18v/s Ratio Permv/c Ratio 0.60 0.59 0.58 0.81 0.68 0.48 0.80 0.59Uniform Delay, d1 36.7 26.8 37.7 29.7 39.1 27.4 38.1 26.1Progression Factor 1.24 0.93 1.00 1.00 1.00 1.00 1.29 0.74Incremental Delay, d2 1.9 2.2 4.2 7.2 10.8 1.8 16.6 2.2Delay (s) 47.5 27.2 41.9 36.9 49.9 29.3 65.5 21.4Level of Service D C D D D C E CApproach Delay (s) 33.4 37.6 33.5 31.1Approach LOS C D C C
Intersection SummaryHCM 2000 Control Delay 34.1 HCM 2000 Level of Service CHCM 2000 Volume to Capacity ratio 0.72Actuated Cycle Length (s) 90.0 Sum of lost time (s) 16.5Intersection Capacity Utilization 75.1% ICU Level of Service DAnalysis Period (min) 15c Critical Lane Group

HCM Signalized Intersection Capacity Analysis Children's Hospital17: SB SR-24 On-Ramp & MLK Way & NB SR-24 Off-Ramp 2020 AM Plus Phase 2
Fehr & Peers Synchro 8 Report
Movement EBL EBT EBR WBL WBT WBR NBL NBT NBR SBL SBT SBRLane ConfigurationsVolume (vph) 193 0 0 0 0 1584 0 0 0 0 1538 252Ideal Flow (vphpl) 1900 1900 1900 1900 1900 1900 1900 1900 1900 1900 1900 1900Total Lost time (s) 4.0 4.0 4.0 4.0Lane Util. Factor 0.97 1.00 0.95 0.88Frpb, ped/bikes 1.00 1.00 1.00 1.00Flpb, ped/bikes 1.00 1.00 1.00 1.00Frt 1.00 0.86 1.00 0.85Flt Protected 0.95 1.00 1.00 1.00Satd. Flow (prot) 3273 1627 3574 2814Flt Permitted 0.95 1.00 1.00 1.00Satd. Flow (perm) 3273 1627 3574 2814Peak-hour factor, PHF 1.00 1.00 1.00 1.00 1.00 1.00 1.00 1.00 1.00 1.00 1.00 1.00Adj. Flow (vph) 193 0 0 0 0 1584 0 0 0 0 1538 252RTOR Reduction (vph) 0 0 0 0 0 0 0 0 0 0 0 0Lane Group Flow (vph) 193 0 0 0 0 1584 0 0 0 0 1538 252Confl. Peds. (#/hr) 8Confl. Bikes (#/hr) 3Heavy Vehicles (%) 7% 7% 2% 2% 1% 1% 2% 2% 2% 2% 1% 1%Turn Type Prot Free NA customProtected Phases 2 6 FreePermitted Phases FreeActuated Green, G (s) 8.0 45.0 29.0 45.0Effective Green, g (s) 8.0 45.0 29.0 45.0Actuated g/C Ratio 0.18 1.00 0.64 1.00Clearance Time (s) 4.0 4.0Lane Grp Cap (vph) 581 1627 2303 2814v/s Ratio Prot 0.06 0.43 0.09v/s Ratio Perm c0.97v/c Ratio 0.33 0.97 0.67 0.09Uniform Delay, d1 16.2 0.0 5.0 0.0Progression Factor 1.00 1.00 1.75 1.00Incremental Delay, d2 1.5 16.9 1.3 0.1Delay (s) 17.7 16.9 10.0 0.1Level of Service B B A AApproach Delay (s) 17.7 16.9 0.0 8.6Approach LOS B B A A
Intersection SummaryHCM 2000 Control Delay 12.8 HCM 2000 Level of Service BHCM 2000 Volume to Capacity ratio 1.18Actuated Cycle Length (s) 45.0 Sum of lost time (s) 8.0Intersection Capacity Utilization 54.7% ICU Level of Service AAnalysis Period (min) 15c Critical Lane Group
HCM Unsignalized Intersection Capacity Analysis Children's Hospital18: West Street & 52nd Street 2020 AM Plus Phase 2
Fehr & Peers Synchro 8 Report
Movement EBL EBT EBR WBL WBT WBR NBL NBT NBR SBL SBT SBRLane ConfigurationsSign Control Stop Stop Stop StopVolume (vph) 0 173 20 70 102 0 30 0 80 10 50 10Peak Hour Factor 1.00 1.00 1.00 1.00 1.00 1.00 1.00 1.00 1.00 1.00 1.00 1.00Hourly flow rate (vph) 0 173 20 70 102 0 30 0 80 10 50 10
Direction, Lane # EB 1 WB 1 NB 1 NB 2 SB 1Volume Total (vph) 193 172 30 80 70Volume Left (vph) 0 70 30 0 10Volume Right (vph) 20 0 0 80 10Hadj (s) -0.05 0.12 0.50 -0.70 -0.02Departure Headway (s) 4.5 4.7 6.0 4.7 5.0Degree Utilization, x 0.24 0.22 0.05 0.11 0.10Capacity (veh/h) 763 727 565 700 658Control Delay (s) 9.0 9.1 8.1 7.1 8.5Approach Delay (s) 9.0 9.1 7.4 8.5Approach LOS A A A A
Intersection SummaryDelay 8.6Level of Service AIntersection Capacity Utilization 41.6% ICU Level of Service AAnalysis Period (min) 15

HCM Unsignalized Intersection Capacity Analysis Children's Hospital19: Genoa Street & 52nd Street 2020 AM Plus Phase 2
Fehr & Peers Synchro 8 Report
Movement EBL EBT EBR WBL WBT WBR NBL NBT NBR SBL SBT SBRLane ConfigurationsSign Control Stop Stop Stop StopVolume (vph) 10 163 10 10 102 30 10 10 10 20 10 10Peak Hour Factor 1.00 1.00 1.00 1.00 1.00 1.00 1.00 1.00 1.00 1.00 1.00 1.00Hourly flow rate (vph) 10 163 10 10 102 30 10 10 10 20 10 10
Direction, Lane # EB 1 WB 1 NB 1 SB 1Volume Total (vph) 183 142 30 40Volume Left (vph) 10 10 10 20Volume Right (vph) 10 30 10 10Hadj (s) 0.00 -0.11 -0.13 -0.05Departure Headway (s) 4.2 4.1 4.5 4.6Degree Utilization, x 0.21 0.16 0.04 0.05Capacity (veh/h) 835 847 734 720Control Delay (s) 8.3 7.9 7.7 7.8Approach Delay (s) 8.3 7.9 7.7 7.8Approach LOS A A A A
Intersection SummaryDelay 8.1Level of Service AIntersection Capacity Utilization 24.2% ICU Level of Service AAnalysis Period (min) 15
HCM Unsignalized Intersection Capacity Analysis Children's Hospital20: Genoa Street & 55th Street 2020 AM Plus Phase 2
Fehr & Peers Synchro 8 Report
Movement EBL EBT EBR WBL WBT WBR NBL NBT NBR SBL SBT SBRLane ConfigurationsVolume (veh/h) 10 370 10 10 360 20 10 20 20 40 20 10Sign Control Free Free Stop StopGrade 0% 0% 0% 0%Peak Hour Factor 1.00 1.00 1.00 1.00 1.00 1.00 1.00 1.00 1.00 1.00 1.00 1.00Hourly flow rate (vph) 10 370 10 10 360 20 10 20 20 40 20 10Pedestrians 11 3 13 15Lane Width (ft) 12.0 12.0 12.0 12.0Walking Speed (ft/s) 4.0 4.0 4.0 4.0Percent Blockage 1 0 1 1Right turn flare (veh)Median type None NoneMedian storage veh)Upstream signal (ft) 721pX, platoon unblockedvC, conflicting volume 395 393 829 823 391 833 818 396vC1, stage 1 conf volvC2, stage 2 conf volvCu, unblocked vol 395 393 829 823 391 833 818 396tC, single (s) 4.1 4.1 7.1 6.5 6.2 7.1 6.5 6.2tC, 2 stage (s)tF (s) 2.2 2.2 3.5 4.0 3.3 3.5 4.0 3.3p0 queue free % 99 99 96 93 97 84 93 98cM capacity (veh/h) 1154 1164 259 298 653 253 298 639
Direction, Lane # EB 1 WB 1 NB 1 SB 1Volume Total 390 390 50 70Volume Left 10 10 10 40Volume Right 10 20 20 10cSH 1154 1164 367 291Volume to Capacity 0.01 0.01 0.14 0.24Queue Length 95th (ft) 1 1 12 23Control Delay (s) 0.3 0.3 16.3 21.3Lane LOS A A C CApproach Delay (s) 0.3 0.3 16.3 21.3Approach LOS C C
Intersection SummaryAverage Delay 2.8Intersection Capacity Utilization 42.1% ICU Level of Service AAnalysis Period (min) 15

HCM Unsignalized Intersection Capacity Analysis Children's Hospital21: MLK Way & RIRO Main Garage 2020 AM Plus Phase 2
Fehr & Peers Synchro 8 Report
Movement WBL WBR NBT NBR SBL SBTLane ConfigurationsVolume (veh/h) 0 34 1647 201 0 1722Sign Control Stop Free FreeGrade 0% 0% 0%Peak Hour Factor 1.00 1.00 1.00 1.00 1.00 1.00Hourly flow rate (vph) 0 34 1647 201 0 1722PedestriansLane Width (ft)Walking Speed (ft/s)Percent BlockageRight turn flare (veh)Median type None NoneMedian storage veh)Upstream signal (ft) 154 137pX, platoon unblocked 0.83 0.74 0.74vC, conflicting volume 2322 650 1848vC1, stage 1 conf volvC2, stage 2 conf volvCu, unblocked vol 431 0 920tC, single (s) 6.8 6.9 4.1tC, 2 stage (s)tF (s) 3.5 3.3 2.2p0 queue free % 100 96 100cM capacity (veh/h) 458 803 547
Direction, Lane # WB 1 NB 1 NB 2 NB 3 SB 1 SB 2 SB 3Volume Total 34 659 659 530 574 574 574Volume Left 0 0 0 0 0 0 0Volume Right 34 0 0 201 0 0 0cSH 803 1700 1700 1700 1700 1700 1700Volume to Capacity 0.04 0.39 0.39 0.31 0.34 0.34 0.34Queue Length 95th (ft) 3 0 0 0 0 0 0Control Delay (s) 9.7 0.0 0.0 0.0 0.0 0.0 0.0Lane LOS AApproach Delay (s) 9.7 0.0 0.0Approach LOS A
Intersection SummaryAverage Delay 0.1Intersection Capacity Utilization 46.3% ICU Level of Service AAnalysis Period (min) 15
HCM Unsignalized Intersection Capacity Analysis Children's Hospital22: MLK Way & RIRO Main Plaza 2020 AM Plus Phase 2
Fehr & Peers Synchro 8 Report
Movement WBL WBR NBT NBR SBL SBTLane ConfigurationsVolume (veh/h) 0 0 1777 0 0 1840Sign Control Stop Free FreeGrade 0% 0% 0%Peak Hour Factor 1.00 1.00 1.00 1.00 1.00 1.00Hourly flow rate (vph) 0 0 1777 0 0 1840PedestriansLane Width (ft)Walking Speed (ft/s)Percent BlockageRight turn flare (veh)Median type None NoneMedian storage veh)Upstream signal (ft) 424 204pX, platoon unblocked 0.78vC, conflicting volume 2390 592 1777vC1, stage 1 conf volvC2, stage 2 conf volvCu, unblocked vol 1793 592 1777tC, single (s) 6.8 6.9 4.1tC, 2 stage (s)tF (s) 3.5 3.3 2.2p0 queue free % 100 100 100cM capacity (veh/h) 56 449 346
Direction, Lane # WB 1 NB 1 NB 2 NB 3 SB 1 SB 2 SB 3Volume Total 0 711 711 355 613 613 613Volume Left 0 0 0 0 0 0 0Volume Right 0 0 0 0 0 0 0cSH 1700 1700 1700 1700 1700 1700 1700Volume to Capacity 0.00 0.42 0.42 0.21 0.36 0.36 0.36Queue Length 95th (ft) 0 0 0 0 0 0 0Control Delay (s) 0.0 0.0 0.0 0.0 0.0 0.0 0.0Lane LOS AApproach Delay (s) 0.0 0.0 0.0Approach LOS A
Intersection SummaryAverage Delay 0.0Intersection Capacity Utilization 38.9% ICU Level of Service AAnalysis Period (min) 15

HCM Unsignalized Intersection Capacity Analysis Children's Hospital24: 51St Street & 52nd Street 2020 AM Plus Phase 2
Fehr & Peers Synchro 8 Report
Intersection Sign configuration not allowed in HCM analysis.
HCM Signalized Intersection Capacity Analysis Children's Hospital 1: MLK Way & 55th Street

HCM Signalized Intersection Capacity Analysis Children's Hospital 1: MLK Way & 55th Street
HCM Unsignalized Intersection Capacity Analysis Children's Hospital 2: Dover Street & 55th Street

HCM Signalized Intersection Capacity Analysis Children's Hospital 3: 55th Street & Shattuck Ave
HCM Signalized Intersection Capacity Analysis Children's Hospital 4: 55th Street & Telegraph Ave

HCM Unsignalized Intersection Capacity Analysis Children's Hospital 5: MLK Way & 54th Street
HCM Unsignalized Intersection Capacity Analysis Children's Hospital 5: MLK Way & 54th Street

HCM Unsignalized Intersection Capacity Analysis Children's Hospital 6: Dover Street & 54th Street
HCM Unsignalized Intersection Capacity Analysis Children's Hospital 7: Shattuck Ave & 54th Street

HCM Signalized Intersection Capacity Analysis Children's Hospital 8: MLK Way & 53rd Street
HCM Signalized Intersection Capacity Analysis Children's Hospital 8: MLK Way & 53rd Street

HCM Unsignalized Intersection Capacity Analysis Children's Hospital 9: Dover Street & 53rd Street
HCM Signalized Intersection Capacity Analysis Children's Hospital 10: MLK Way & 52nd Street

HCM Signalized Intersection Capacity Analysis Children's Hospital 10: MLK Way & 52nd Street
HCM Signalized Intersection Capacity Analysis Children's Hospital 11: 52nd Street & Garage

HCM Unsignalized Intersection Capacity Analysis Children's Hospital 12: 52nd Street & Dover Street
HCM Unsignalized Intersection Capacity Analysis Children's Hospital 13: SR-24 NB Off-Ramp & 52nd Street
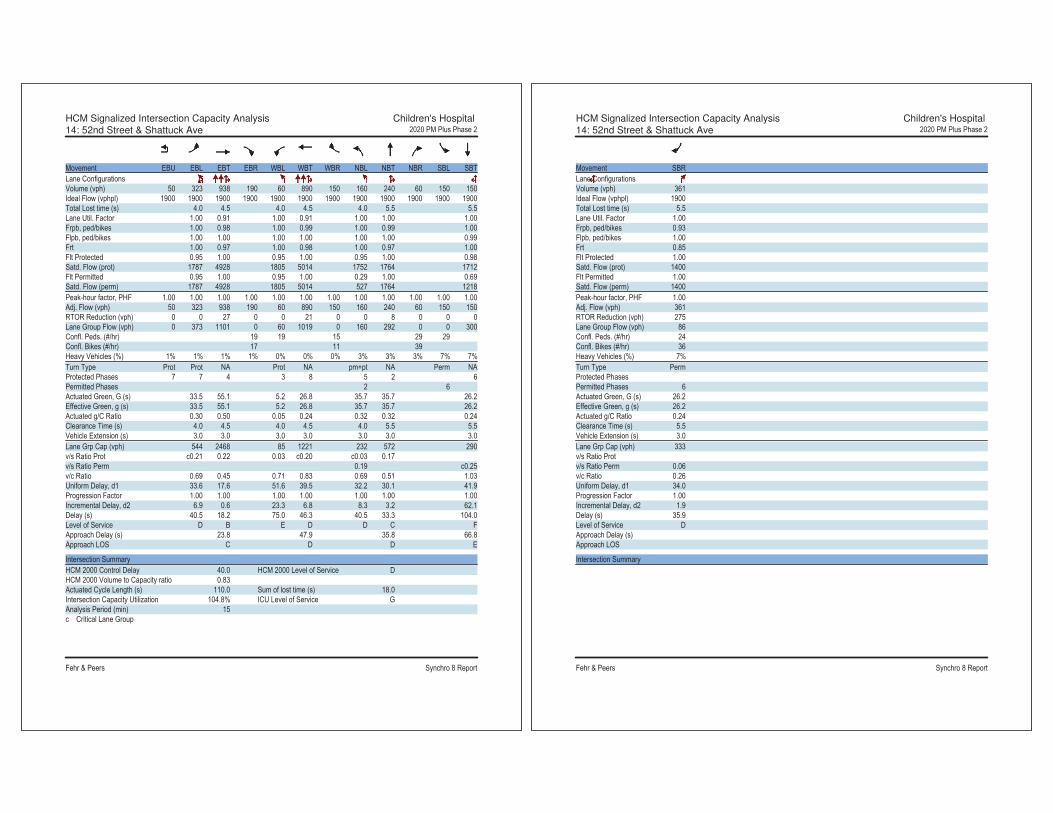
HCM Signalized Intersection Capacity Analysis Children's Hospital 14: 52nd Street & Shattuck Ave
HCM Signalized Intersection Capacity Analysis Children's Hospital 14: 52nd Street & Shattuck Ave

HCM Signalized Intersection Capacity Analysis Children's Hospital 15: Telegraph Ave & 52nd Street/Claremont Ave
HCM Signalized Intersection Capacity Analysis Children's Hospital 16: Telegraph Ave & 51St Street

HCM Signalized Intersection Capacity Analysis Children's Hospital 17: SB SR-24 On-Ramp & MLK Way & NB SR-24 Off-Ramp
HCM Unsignalized Intersection Capacity Analysis Children's Hospital 18: West Street & 52nd Street

HCM Unsignalized Intersection Capacity Analysis Children's Hospital 19: Genoa Street & 52nd Street
HCM Unsignalized Intersection Capacity Analysis Children's Hospital 20: Genoa Street & 55th Street

HCM Unsignalized Intersection Capacity Analysis Children's Hospital 21: MLK Way & RIRO Main Garage
HCM Unsignalized Intersection Capacity Analysis Children's Hospital 22: MLK Way & RIRO Main Plaza
HCM Unsignalized Intersection Capacity Analysis Children's Hospital 24: 51St Street & 52nd Street
Appendix J LOS Calculation Worksheets – 2035 Plus Phase 1
Conditions

HCM Signalized Intersection Capacity Analysis Children's Hospital1: MLK Way & 55th Street
HCM Signalized Intersection Capacity Analysis Children's Hospital1: MLK Way & 55th Street

HCM Unsignalized Intersection Capacity Analysis Children's Hospital2: Dover Street & 55th Street
HCM Signalized Intersection Capacity Analysis Children's Hospital3: 55th Street & Shattuck Ave

HCM Signalized Intersection Capacity Analysis Children's Hospital4: 55th Street & Telegraph Ave
HCM Unsignalized Intersection Capacity Analysis Children's Hospital5: MLK Way & 54th Street

HCM Unsignalized Intersection Capacity Analysis Children's Hospital5: MLK Way & 54th Street
HCM Unsignalized Intersection Capacity Analysis Children's Hospital6: Dover Street & 54th Street

HCM Unsignalized Intersection Capacity Analysis Children's Hospital7: Shattuck Ave & 54th Street
HCM Signalized Intersection Capacity Analysis Children's Hospital8: MLK Way & 53rd Street

HCM Unsignalized Intersection Capacity Analysis Children's Hospital9: Dover Street & 53rd Street
HCM Signalized Intersection Capacity Analysis Children's Hospital10: MLK Way & 52nd Street

HCM Signalized Intersection Capacity Analysis Children's Hospital10: MLK Way & 52nd Street
HCM Signalized Intersection Capacity Analysis Children's Hospital11: 52nd Street & Garage

HCM Unsignalized Intersection Capacity Analysis Children's Hospital12: 52nd Street & Dover Street
HCM Unsignalized Intersection Capacity Analysis Children's Hospital13: SR-24 NB Off-Ramp & 52nd Street

HCM Signalized Intersection Capacity Analysis Children's Hospital14: 52nd Street & Shattuck Ave
HCM Signalized Intersection Capacity Analysis Children's Hospital14: 52nd Street & Shattuck Ave

HCM Signalized Intersection Capacity Analysis Children's Hospital15: Telegraph Ave & 52nd Street/Claremont Ave
HCM Signalized Intersection Capacity Analysis Children's Hospital16: Telegraph Ave & 51St Street

HCM Signalized Intersection Capacity Analysis Children's Hospital17: SB SR-24 On-Ramp & MLK Way & NB SR-24 Off-Ramp
HCM Unsignalized Intersection Capacity Analysis Children's Hospital18: West Street & 52nd Street

HCM Unsignalized Intersection Capacity Analysis Children's Hospital19: Genoa Street & 52nd Street
HCM Unsignalized Intersection Capacity Analysis Children's Hospital20: Genoa Street & 55th Street
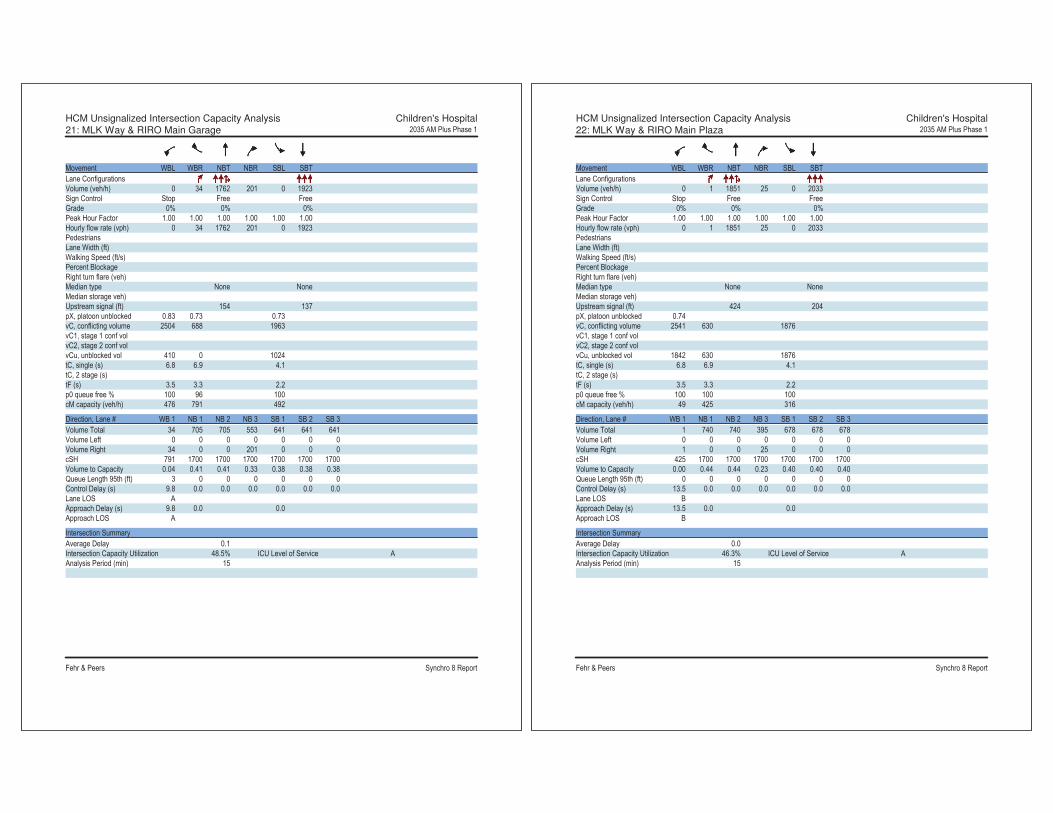
HCM Unsignalized Intersection Capacity Analysis Children's Hospital21: MLK Way & RIRO Main Garage
HCM Unsignalized Intersection Capacity Analysis Children's Hospital22: MLK Way & RIRO Main Plaza

HCM Unsignalized Intersection Capacity Analysis Children's Hospital24: 51St Street & 52nd Street
HCM Signalized Intersection Capacity Analysis Children's Hospital 1: MLK Way & 55th Street 2035 PM Plus Phase 1
Fehr & Peers Synchro 8 Report
Movement EBL EBT EBR WBL WBT WBR NBU NBL NBT NBR SBL SBTLane ConfigurationsVolume (vph) 20 270 180 60 240 110 29 211 1772 158 200 1471Ideal Flow (vphpl) 1900 1900 1900 1900 1900 1900 1900 1900 1900 1900 1900 1900Total Lost time (s) 5.0 5.0 4.5 5.0 4.5 5.0Lane Util. Factor 1.00 1.00 1.00 0.91 1.00 0.91Frpb, ped/bikes 0.98 0.99 1.00 0.99 1.00 1.00Flpb, ped/bikes 1.00 1.00 1.00 1.00 1.00 1.00Frt 0.95 0.96 1.00 0.99 1.00 1.00Flt Protected 1.00 0.99 0.95 1.00 0.95 1.00Satd. Flow (prot) 1747 1728 1770 4979 1770 5054Flt Permitted 0.97 0.75 0.95 1.00 0.95 1.00Satd. Flow (perm) 1707 1310 1770 4979 1770 5054Peak-hour factor, PHF 1.00 1.00 1.00 1.00 1.00 1.00 1.00 1.00 1.00 1.00 1.00 1.00Adj. Flow (vph) 20 270 180 60 240 110 29 211 1772 158 200 1471RTOR Reduction (vph) 0 23 0 0 14 0 0 0 10 0 0 3Lane Group Flow (vph) 0 447 0 0 396 0 0 240 1920 0 200 1508Confl. Peds. (#/hr) 17 23 23 17 30Confl. Bikes (#/hr) 24 18 23Heavy Vehicles (%) 1% 1% 1% 4% 4% 4% 2% 2% 2% 2% 2% 2%Turn Type Perm NA Perm NA Prot Prot NA Prot NAProtected Phases 4 8 5 5 2 1 6Permitted Phases 4 8Actuated Green, G (s) 31.7 31.7 21.5 42.3 11.5 32.3Effective Green, g (s) 31.7 31.7 21.5 42.3 11.5 32.3Actuated g/C Ratio 0.32 0.32 0.22 0.42 0.12 0.32Clearance Time (s) 5.0 5.0 4.5 5.0 4.5 5.0Vehicle Extension (s) 3.0 3.0 3.0 3.0 3.0 3.0Lane Grp Cap (vph) 541 415 380 2106 203 1632v/s Ratio Prot 0.14 c0.39 0.11 c0.30v/s Ratio Perm 0.26 c0.30v/c Ratio 0.83 0.96 0.63 0.91 0.99 0.92Uniform Delay, d1 31.6 33.5 35.7 27.1 44.2 32.7Progression Factor 1.00 1.00 0.53 0.38 1.00 1.00Incremental Delay, d2 10.0 32.5 2.7 6.0 58.5 10.3Delay (s) 41.6 66.0 21.4 16.3 102.6 43.0Level of Service D E C B F DApproach Delay (s) 41.6 66.0 16.9 50.0Approach LOS D E B D
Intersection SummaryHCM 2000 Control Delay 35.4 HCM 2000 Level of Service DHCM 2000 Volume to Capacity ratio 0.95Actuated Cycle Length (s) 100.0 Sum of lost time (s) 14.5Intersection Capacity Utilization 106.0% ICU Level of Service GAnalysis Period (min) 15c Critical Lane Group

HCM Signalized Intersection Capacity Analysis Children's Hospital 1: MLK Way & 55th Street 2035 PM Plus Phase 1
Fehr & Peers Synchro 8 Report
Movement SBRLane ConfigurationsVolume (vph) 40Ideal Flow (vphpl) 1900Total Lost time (s)Lane Util. FactorFrpb, ped/bikesFlpb, ped/bikesFrtFlt ProtectedSatd. Flow (prot)Flt PermittedSatd. Flow (perm)Peak-hour factor, PHF 1.00Adj. Flow (vph) 40RTOR Reduction (vph) 0Lane Group Flow (vph) 0Confl. Peds. (#/hr) 18Confl. Bikes (#/hr) 23Heavy Vehicles (%) 2%Turn TypeProtected PhasesPermitted PhasesActuated Green, G (s)Effective Green, g (s)Actuated g/C RatioClearance Time (s)Vehicle Extension (s)Lane Grp Cap (vph)v/s Ratio Protv/s Ratio Permv/c RatioUniform Delay, d1Progression FactorIncremental Delay, d2Delay (s)Level of ServiceApproach Delay (s)Approach LOS
Intersection Summary
HCM Unsignalized Intersection Capacity Analysis Children's Hospital 2: Dover Street & 55th Street 2035 PM Plus Phase 1
Fehr & Peers Synchro 8 Report
Movement EBL EBT EBR WBL WBT WBR NBL NBT NBR SBL SBT SBRLane ConfigurationsVolume (veh/h) 30 578 20 10 330 20 20 20 30 20 20 40Sign Control Free Free Stop StopGrade 0% 0% 0% 0%Peak Hour Factor 1.00 1.00 1.00 1.00 1.00 1.00 1.00 1.00 1.00 1.00 1.00 1.00Hourly flow rate (vph) 30 578 20 10 330 20 20 20 30 20 20 40Pedestrians 6 20 11 26Lane Width (ft) 12.0 12.0 12.0 12.0Walking Speed (ft/s) 4.0 4.0 4.0 4.0Percent Blockage 1 2 1 2Right turn flare (veh)Median type None NoneMedian storage veh)Upstream signal (ft) 641 677pX, platoon unblocked 0.96 0.96 0.96 0.96 0.96 0.96vC, conflicting volume 376 609 1075 1055 619 1094 1055 372vC1, stage 1 conf volvC2, stage 2 conf volvCu, unblocked vol 328 609 1057 1036 619 1077 1036 324tC, single (s) 4.1 4.1 7.1 6.5 6.2 7.1 6.5 6.2tC, 2 stage (s)tF (s) 2.2 2.2 3.5 4.0 3.3 3.5 4.0 3.3p0 queue free % 97 99 88 90 94 87 90 94cM capacity (veh/h) 1140 951 160 209 480 149 207 667
Direction, Lane # EB 1 WB 1 NB 1 SB 1Volume Total 628 360 70 80Volume Left 30 10 20 20Volume Right 20 20 30 40cSH 1140 951 247 275Volume to Capacity 0.03 0.01 0.28 0.29Queue Length 95th (ft) 2 1 28 29Control Delay (s) 0.7 0.4 25.2 23.4Lane LOS A A D CApproach Delay (s) 0.7 0.4 25.2 23.4Approach LOS D C
Intersection SummaryAverage Delay 3.7Intersection Capacity Utilization 61.8% ICU Level of Service BAnalysis Period (min) 15

HCM Signalized Intersection Capacity Analysis Children's Hospital 3: 55th Street & Shattuck Ave 2035 PM Plus Phase 1
Fehr & Peers Synchro 8 Report
Movement EBL EBT EBR WBL WBT WBR NBL NBT NBR SBL SBT SBRLane ConfigurationsVolume (vph) 110 438 70 30 210 50 80 630 50 30 580 60Ideal Flow (vphpl) 1900 1900 1900 1900 1900 1900 1900 1900 1900 1900 1900 1900Total Lost time (s) 3.0 3.0 5.0 5.0Lane Util. Factor 1.00 1.00 1.00 1.00Frpb, ped/bikes 0.99 0.99 1.00 0.99Flpb, ped/bikes 1.00 1.00 1.00 1.00Frt 0.98 0.98 0.99 0.99Flt Protected 0.99 0.99 0.99 1.00Satd. Flow (prot) 1749 1773 1827 1843Flt Permitted 0.86 0.91 0.88 0.95Satd. Flow (perm) 1515 1621 1613 1757Peak-hour factor, PHF 1.00 1.00 1.00 1.00 1.00 1.00 1.00 1.00 1.00 1.00 1.00 1.00Adj. Flow (vph) 110 438 70 30 210 50 80 630 50 30 580 60RTOR Reduction (vph) 0 6 0 0 10 0 0 3 0 0 5 0Lane Group Flow (vph) 0 612 0 0 280 0 0 757 0 0 665 0Confl. Peds. (#/hr) 17 17 17 17 29 11 11 29Confl. Bikes (#/hr) 23 15 47 33Heavy Vehicles (%) 5% 5% 5% 3% 3% 3% 2% 2% 2% 1% 1% 1%Turn Type Perm NA Perm NA Perm NA Perm NAProtected Phases 2 6 4 8Permitted Phases 2 6 4 4 8Actuated Green, G (s) 29.0 29.0 43.0 43.0Effective Green, g (s) 29.0 29.0 43.0 43.0Actuated g/C Ratio 0.36 0.36 0.54 0.54Clearance Time (s) 3.0 3.0 5.0 5.0Lane Grp Cap (vph) 549 587 866 944v/s Ratio Protv/s Ratio Perm c0.40 0.17 c0.47 0.38v/c Ratio 1.12 0.48 0.87 0.70Uniform Delay, d1 25.5 19.7 16.1 13.8Progression Factor 1.00 1.00 1.00 1.00Incremental Delay, d2 74.1 2.8 11.9 4.4Delay (s) 99.6 22.4 28.0 18.2Level of Service F C C BApproach Delay (s) 99.6 22.4 28.0 18.2Approach LOS F C C B
Intersection SummaryHCM 2000 Control Delay 43.4 HCM 2000 Level of Service DHCM 2000 Volume to Capacity ratio 0.97Actuated Cycle Length (s) 80.0 Sum of lost time (s) 8.0Intersection Capacity Utilization 128.3% ICU Level of Service HAnalysis Period (min) 15c Critical Lane Group
HCM Signalized Intersection Capacity Analysis Children's Hospital 4: 55th Street & Telegraph Ave 2035 PM Plus Phase 1
Fehr & Peers Synchro 8 Report
Movement EBL EBT EBR WBL WBT WBR NBL NBT NBR SBL SBT SBRLane ConfigurationsVolume (vph) 307 30 171 50 20 20 130 1197 70 20 1131 120Ideal Flow (vphpl) 1900 1900 1900 1900 1900 1900 1900 1900 1900 1900 1900 1900Total Lost time (s) 4.5 4.5 4.5 4.5 4.5 4.5Lane Util. Factor 1.00 1.00 1.00 0.95 1.00 0.95Frpb, ped/bikes 0.98 0.99 1.00 0.99 1.00 0.98Flpb, ped/bikes 0.99 0.99 1.00 1.00 1.00 1.00Frt 0.95 0.97 1.00 0.99 1.00 0.99Flt Protected 0.97 0.97 0.95 1.00 0.95 1.00Satd. Flow (prot) 1624 1695 1770 3488 1787 3470Flt Permitted 0.78 0.72 0.12 1.00 0.12 1.00Satd. Flow (perm) 1303 1249 229 3488 223 3470Peak-hour factor, PHF 1.00 1.00 1.00 1.00 1.00 1.00 1.00 1.00 1.00 1.00 1.00 1.00Adj. Flow (vph) 307 30 171 50 20 20 130 1197 70 20 1131 120RTOR Reduction (vph) 0 21 0 0 12 0 0 4 0 0 9 0Lane Group Flow (vph) 0 487 0 0 78 0 130 1263 0 20 1242 0Confl. Peds. (#/hr) 17 39 39 17 38 26 26 38Confl. Bikes (#/hr) 12 14 44 68Heavy Vehicles (%) 5% 5% 5% 4% 4% 4% 2% 2% 2% 1% 1% 1%Turn Type Perm NA Perm NA Perm NA Perm NAProtected Phases 4 8 2 6Permitted Phases 4 8 2 6Actuated Green, G (s) 34.8 34.8 46.2 46.2 46.2 46.2Effective Green, g (s) 34.8 34.8 46.2 46.2 46.2 46.2Actuated g/C Ratio 0.39 0.39 0.51 0.51 0.51 0.51Clearance Time (s) 4.5 4.5 4.5 4.5 4.5 4.5Vehicle Extension (s) 3.0 3.0 3.0 3.0 3.0 3.0Lane Grp Cap (vph) 503 482 117 1790 114 1781v/s Ratio Prot 0.36 0.36v/s Ratio Perm c0.37 0.06 c0.57 0.09v/c Ratio 0.97 0.16 1.11 0.71 0.18 0.70Uniform Delay, d1 27.1 18.1 21.9 16.7 11.7 16.6Progression Factor 1.00 1.00 1.00 1.00 1.00 1.00Incremental Delay, d2 31.8 0.2 116.2 2.4 3.3 2.3Delay (s) 58.8 18.2 138.1 19.1 15.0 18.9Level of Service E B F B B BApproach Delay (s) 58.8 18.2 30.1 18.8Approach LOS E B C B
Intersection SummaryHCM 2000 Control Delay 29.9 HCM 2000 Level of Service CHCM 2000 Volume to Capacity ratio 1.05Actuated Cycle Length (s) 90.0 Sum of lost time (s) 9.0Intersection Capacity Utilization 90.7% ICU Level of Service EAnalysis Period (min) 15c Critical Lane Group

HCM Unsignalized Intersection Capacity Analysis Children's Hospital 5: MLK Way & 54th Street 2035 PM Plus Phase 1
Fehr & Peers Synchro 8 Report
Movement EBL EBT EBR WBL WBT WBR NBU NBL NBT NBR SBU SBLLane ConfigurationsVolume (veh/h) 10 10 50 20 10 10 13 40 2119 20 10 20Sign Control Stop Stop FreeGrade 0% 0% 0%Peak Hour Factor 1.00 1.00 1.00 1.00 1.00 1.00 1.00 1.00 1.00 1.00 1.00 1.00Hourly flow rate (vph) 10 10 50 20 10 10 0 40 2119 20 0 20Pedestrians 8 29 17Lane Width (ft) 12.0 12.0 12.0Walking Speed (ft/s) 4.0 4.0 4.0Percent Blockage 1 2 1Right turn flare (veh)Median type NoneMedian storage veh)Upstream signal (ft) 299pX, platoon unblocked 0.86 0.86 0.71 0.86 0.86 0.71 0.00 0.71 0.00 0.71vC, conflicting volume 2529 3976 592 2907 3976 745 0 1698 0 2168vC1, stage 1 conf volvC2, stage 2 conf volvCu, unblocked vol 0 1642 0 394 1642 0 0 581 0 1235tC, single (s) 7.5 6.5 6.9 7.5 6.5 6.9 0.0 4.1 0.0 4.1tC, 2 stage (s)tF (s) *8.0 *8.0 *8.0 *8.0 *8.0 *8.0 0.0 2.2 0.0 2.2p0 queue free % 97 85 84 88 85 97 0 94 0 95cM capacity (veh/h) 294 65 315 164 65 314 0 703 0 394
Direction, Lane # EB 1 WB 1 NB 1 NB 2 NB 3 SB 1 SB 2 SB 3Volume Total 70 40 570 1060 550 438 835 438Volume Left 10 20 40 0 0 20 0 0Volume Right 50 10 0 0 20 0 0 20cSH 201 129 703 1700 1700 394 1700 1700Volume to Capacity 0.35 0.31 0.06 0.62 0.32 0.05 0.49 0.26Queue Length 95th (ft) 37 30 5 0 0 4 0 0Control Delay (s) 32.1 44.8 1.5 0.0 0.0 1.6 0.0 0.0Lane LOS D E A AApproach Delay (s) 32.1 44.8 0.4 0.4Approach LOS D E
Intersection SummaryAverage Delay 1.4Intersection Capacity Utilization 94.7% ICU Level of Service FAnalysis Period (min) 15
* User Entered Value
HCM Unsignalized Intersection Capacity Analysis Children's Hospital 5: MLK Way & 54th Street 2035 PM Plus Phase 1
Fehr & Peers Synchro 8 Report
Movement SBT SBRLane ConfigurationsVolume (veh/h) 1670 20Sign Control FreeGrade 0%Peak Hour Factor 1.00 1.00Hourly flow rate (vph) 1670 20PedestriansLane Width (ft)Walking Speed (ft/s)Percent BlockageRight turn flare (veh)Median type NoneMedian storage veh)Upstream signal (ft) 294pX, platoon unblockedvC, conflicting volumevC1, stage 1 conf volvC2, stage 2 conf volvCu, unblocked voltC, single (s)tC, 2 stage (s)tF (s)p0 queue free %cM capacity (veh/h)
Direction, Lane #

HCM Unsignalized Intersection Capacity Analysis Children's Hospital 6: Dover Street & 54th Street 2035 PM Plus Phase 1
Fehr & Peers Synchro 8 Report
Movement EBL EBT EBR WBL WBT WBR NBL NBT NBR SBL SBT SBRLane ConfigurationsVolume (veh/h) 10 20 10 10 10 20 10 50 10 10 30 10Sign Control Stop Stop Free FreeGrade 0% 0% 0% 0%Peak Hour Factor 1.00 1.00 1.00 1.00 1.00 1.00 1.00 1.00 1.00 1.00 1.00 1.00Hourly flow rate (vph) 10 20 10 10 10 20 10 50 10 10 30 10Pedestrians 18 12 9 5Lane Width (ft) 12.0 12.0 12.0 12.0Walking Speed (ft/s) 4.0 4.0 4.0 4.0Percent Blockage 1 1 1 0Right turn flare (veh)Median type None NoneMedian storage veh)Upstream signal (ft)pX, platoon unblockedvC, conflicting volume 178 165 62 171 165 72 58 72vC1, stage 1 conf volvC2, stage 2 conf volvCu, unblocked vol 178 165 62 171 165 72 58 72tC, single (s) 7.1 6.5 6.2 7.1 6.5 6.2 4.1 4.1tC, 2 stage (s)tF (s) 3.5 4.0 3.3 3.5 4.0 3.3 2.2 2.2p0 queue free % 99 97 99 99 99 98 99 99cM capacity (veh/h) 728 704 986 737 704 982 1536 1526
Direction, Lane # EB 1 WB 1 NB 1 SB 1Volume Total 40 40 70 50Volume Left 10 10 10 10Volume Right 10 20 10 10cSH 765 831 1536 1526Volume to Capacity 0.05 0.05 0.01 0.01Queue Length 95th (ft) 4 4 0 0Control Delay (s) 10.0 9.6 1.1 1.5Lane LOS A A A AApproach Delay (s) 10.0 9.6 1.1 1.5Approach LOS A A
Intersection SummaryAverage Delay 4.7Intersection Capacity Utilization 21.1% ICU Level of Service AAnalysis Period (min) 15
HCM Unsignalized Intersection Capacity Analysis Children's Hospital 7: Shattuck Ave & 54th Street 2035 PM Plus Phase 1
Fehr & Peers Synchro 8 Report
Movement EBL EBR NBL NBT SBT SBRLane ConfigurationsVolume (veh/h) 10 20 20 770 700 10Sign Control Stop Free FreeGrade 0% 0% 0%Peak Hour Factor 1.00 1.00 1.00 1.00 1.00 1.00Hourly flow rate (vph) 10 20 20 770 700 10Pedestrians 38 2Lane Width (ft) 12.0 12.0Walking Speed (ft/s) 4.0 4.0Percent Blockage 3 0Right turn flare (veh)Median type None NoneMedian storage veh)Upstream signal (ft) 550 282pX, platoon unblocked 0.81 0.74 0.74vC, conflicting volume 1555 743 748vC1, stage 1 conf volvC2, stage 2 conf volvCu, unblocked vol 1168 476 482tC, single (s) 6.4 6.2 4.1tC, 2 stage (s)tF (s) 3.5 3.3 2.2p0 queue free % 94 95 97cM capacity (veh/h) 165 425 773
Direction, Lane # EB 1 NB 1 SB 1Volume Total 30 790 710Volume Left 10 20 0Volume Right 20 0 10cSH 278 773 1700Volume to Capacity 0.11 0.03 0.42Queue Length 95th (ft) 9 2 0Control Delay (s) 19.5 0.7 0.0Lane LOS C AApproach Delay (s) 19.5 0.7 0.0Approach LOS C
Intersection SummaryAverage Delay 0.7Intersection Capacity Utilization 66.6% ICU Level of Service CAnalysis Period (min) 15
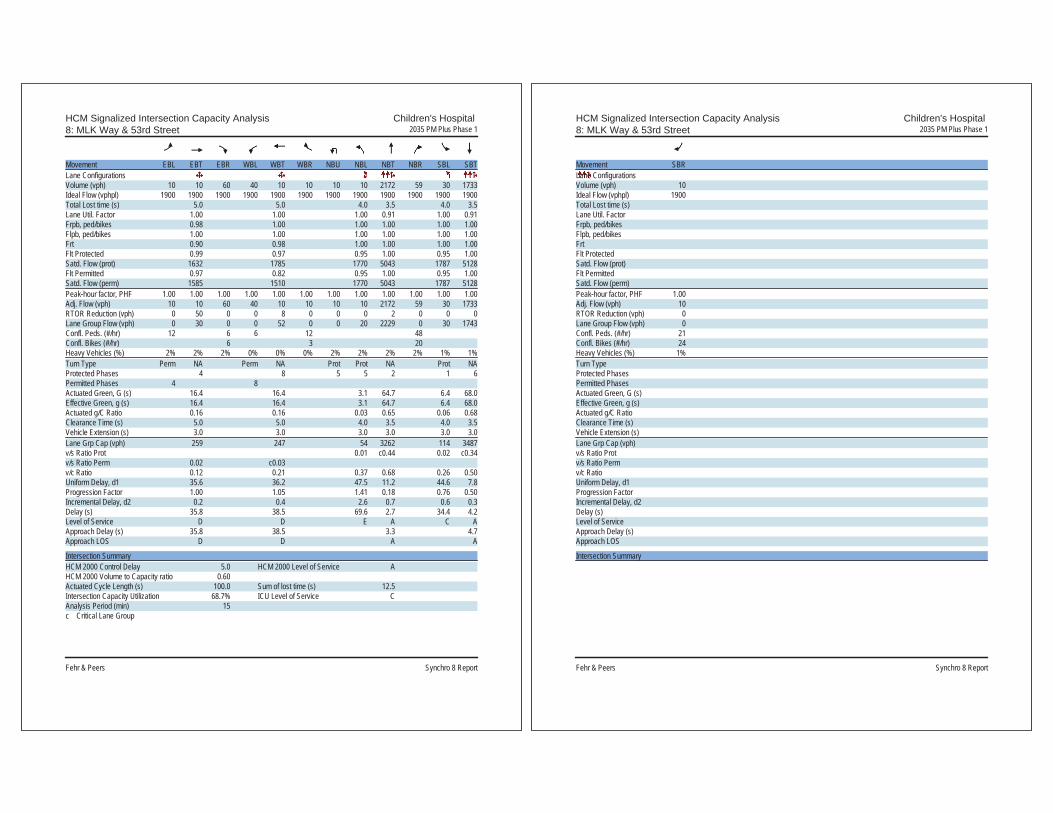
HCM Signalized Intersection Capacity Analysis Children's Hospital 8: MLK Way & 53rd Street 2035 PM Plus Phase 1
Fehr & Peers Synchro 8 Report
Movement EBL EBT EBR WBL WBT WBR NBU NBL NBT NBR SBL SBTLane ConfigurationsVolume (vph) 10 10 60 40 10 10 10 10 2172 59 30 1733Ideal Flow (vphpl) 1900 1900 1900 1900 1900 1900 1900 1900 1900 1900 1900 1900Total Lost time (s) 5.0 5.0 4.0 3.5 4.0 3.5Lane Util. Factor 1.00 1.00 1.00 0.91 1.00 0.91Frpb, ped/bikes 0.98 1.00 1.00 1.00 1.00 1.00Flpb, ped/bikes 1.00 1.00 1.00 1.00 1.00 1.00Frt 0.90 0.98 1.00 1.00 1.00 1.00Flt Protected 0.99 0.97 0.95 1.00 0.95 1.00Satd. Flow (prot) 1632 1785 1770 5043 1787 5128Flt Permitted 0.97 0.82 0.95 1.00 0.95 1.00Satd. Flow (perm) 1585 1510 1770 5043 1787 5128Peak-hour factor, PHF 1.00 1.00 1.00 1.00 1.00 1.00 1.00 1.00 1.00 1.00 1.00 1.00Adj. Flow (vph) 10 10 60 40 10 10 10 10 2172 59 30 1733RTOR Reduction (vph) 0 50 0 0 8 0 0 0 2 0 0 0Lane Group Flow (vph) 0 30 0 0 52 0 0 20 2229 0 30 1743Confl. Peds. (#/hr) 12 6 6 12 48Confl. Bikes (#/hr) 6 3 20Heavy Vehicles (%) 2% 2% 2% 0% 0% 0% 2% 2% 2% 2% 1% 1%Turn Type Perm NA Perm NA Prot Prot NA Prot NAProtected Phases 4 8 5 5 2 1 6Permitted Phases 4 8Actuated Green, G (s) 16.4 16.4 3.1 64.7 6.4 68.0Effective Green, g (s) 16.4 16.4 3.1 64.7 6.4 68.0Actuated g/C Ratio 0.16 0.16 0.03 0.65 0.06 0.68Clearance Time (s) 5.0 5.0 4.0 3.5 4.0 3.5Vehicle Extension (s) 3.0 3.0 3.0 3.0 3.0 3.0Lane Grp Cap (vph) 259 247 54 3262 114 3487v/s Ratio Prot 0.01 c0.44 0.02 c0.34v/s Ratio Perm 0.02 c0.03v/c Ratio 0.12 0.21 0.37 0.68 0.26 0.50Uniform Delay, d1 35.6 36.2 47.5 11.2 44.6 7.8Progression Factor 1.00 1.05 1.41 0.18 0.76 0.50Incremental Delay, d2 0.2 0.4 2.6 0.7 0.6 0.3Delay (s) 35.8 38.5 69.6 2.7 34.4 4.2Level of Service D D E A C AApproach Delay (s) 35.8 38.5 3.3 4.7Approach LOS D D A A
Intersection SummaryHCM 2000 Control Delay 5.0 HCM 2000 Level of Service AHCM 2000 Volume to Capacity ratio 0.60Actuated Cycle Length (s) 100.0 Sum of lost time (s) 12.5Intersection Capacity Utilization 68.7% ICU Level of Service CAnalysis Period (min) 15c Critical Lane Group
HCM Signalized Intersection Capacity Analysis Children's Hospital 8: MLK Way & 53rd Street 2035 PM Plus Phase 1
Fehr & Peers Synchro 8 Report
Movement SBRLane ConfigurationsVolume (vph) 10Ideal Flow (vphpl) 1900Total Lost time (s)Lane Util. FactorFrpb, ped/bikesFlpb, ped/bikesFrtFlt ProtectedSatd. Flow (prot)Flt PermittedSatd. Flow (perm)Peak-hour factor, PHF 1.00Adj. Flow (vph) 10RTOR Reduction (vph) 0Lane Group Flow (vph) 0Confl. Peds. (#/hr) 21Confl. Bikes (#/hr) 24Heavy Vehicles (%) 1%Turn TypeProtected PhasesPermitted PhasesActuated Green, G (s)Effective Green, g (s)Actuated g/C RatioClearance Time (s)Vehicle Extension (s)Lane Grp Cap (vph)v/s Ratio Protv/s Ratio Permv/c RatioUniform Delay, d1Progression FactorIncremental Delay, d2Delay (s)Level of ServiceApproach Delay (s)Approach LOS
Intersection Summary

HCM Unsignalized Intersection Capacity Analysis Children's Hospital 9: Dover Street & 53rd Street 2035 PM Plus Phase 1
Fehr & Peers Synchro 8 Report
Movement EBL EBT EBR WBL WBT WBR NBL NBT NBR SBL SBT SBRLane ConfigurationsVolume (veh/h) 20 10 59 10 10 10 10 50 10 10 30 10Sign Control Stop Stop Free FreeGrade 0% 0% 0% 0%Peak Hour Factor 1.00 1.00 1.00 1.00 1.00 1.00 1.00 1.00 1.00 1.00 1.00 1.00Hourly flow rate (vph) 20 10 59 10 10 10 10 50 10 10 30 10Pedestrians 38 15 6 6Lane Width (ft) 12.0 12.0 12.0 12.0Walking Speed (ft/s) 4.0 4.0 4.0 4.0Percent Blockage 3 1 1 1Right turn flare (veh)Median type None NoneMedian storage veh)Upstream signal (ft)pX, platoon unblockedvC, conflicting volume 189 188 79 215 188 76 78 75vC1, stage 1 conf volvC2, stage 2 conf volvCu, unblocked vol 189 188 79 215 188 76 78 75tC, single (s) 7.1 6.5 6.2 7.1 6.5 6.2 4.1 4.1tC, 2 stage (s)tF (s) 3.5 4.0 3.3 3.5 4.0 3.3 2.2 2.2p0 queue free % 97 99 94 98 99 99 99 99cM capacity (veh/h) 700 670 951 650 670 974 1485 1518
Direction, Lane # EB 1 WB 1 NB 1 SB 1Volume Total 89 30 70 50Volume Left 20 10 10 10Volume Right 59 10 10 10cSH 843 739 1485 1518Volume to Capacity 0.11 0.04 0.01 0.01Queue Length 95th (ft) 9 3 1 0Control Delay (s) 9.8 10.1 1.1 1.5Lane LOS A B A AApproach Delay (s) 9.8 10.1 1.1 1.5Approach LOS A B
Intersection SummaryAverage Delay 5.5Intersection Capacity Utilization 25.4% ICU Level of Service AAnalysis Period (min) 15
HCM Signalized Intersection Capacity Analysis Children's Hospital 10: MLK Way & 52nd Street 2035 PM Plus Phase 1
Fehr & Peers Synchro 8 Report
Movement EBL EBT EBR WBL WBT WBR NBU NBL NBT NBR SBU SBLLane ConfigurationsVolume (vph) 81 139 110 136 99 226 60 120 1853 89 3 158Ideal Flow (vphpl) 1900 1900 1900 1900 1900 1900 1900 1900 1900 1900 1900 1900Total Lost time (s) 5.0 5.0 5.0 5.0 4.5 4.5 4.0Lane Util. Factor 1.00 1.00 1.00 1.00 1.00 0.91 1.00Frpb, ped/bikes 1.00 0.95 1.00 0.96 1.00 1.00 1.00Flpb, ped/bikes 0.98 1.00 0.97 1.00 1.00 1.00 1.00Frt 1.00 0.93 1.00 0.85 1.00 0.99 1.00Flt Protected 0.95 1.00 0.97 1.00 0.95 1.00 0.95Satd. Flow (prot) 1760 1672 1752 1521 1787 5089 1787Flt Permitted 0.48 1.00 0.52 1.00 0.95 1.00 0.95Satd. Flow (perm) 884 1672 930 1521 1787 5089 1787Peak-hour factor, PHF 1.00 1.00 1.00 1.00 1.00 1.00 1.00 1.00 1.00 1.00 1.00 1.00Adj. Flow (vph) 81 139 110 136 99 226 60 120 1853 89 3 158RTOR Reduction (vph) 0 30 0 0 0 165 0 0 5 0 0 0Lane Group Flow (vph) 81 219 0 0 235 61 0 180 1937 0 0 161Confl. Peds. (#/hr) 24 92 92 24 15Confl. Bikes (#/hr) 14 6 23Heavy Vehicles (%) 1% 1% 1% 2% 2% 2% 1% 1% 1% 1% 1% 1%Turn Type Perm NA Perm NA Perm Prot Prot NA Prot ProtProtected Phases 4 8 5 5 2 1 1Permitted Phases 4 8 8Actuated Green, G (s) 27.0 27.0 27.0 27.0 13.6 42.0 17.5Effective Green, g (s) 27.0 27.0 27.0 27.0 13.6 42.0 17.5Actuated g/C Ratio 0.27 0.27 0.27 0.27 0.14 0.42 0.18Clearance Time (s) 5.0 5.0 5.0 5.0 4.5 4.5 4.0Vehicle Extension (s) 2.0 2.0 2.0 2.0 2.0 2.0 2.0Lane Grp Cap (vph) 238 451 251 410 243 2137 312v/s Ratio Prot 0.13 0.10 c0.38 0.09v/s Ratio Perm 0.09 c0.25 0.04v/c Ratio 0.34 0.49 0.94 0.15 0.74 0.91 0.52Uniform Delay, d1 29.3 30.7 35.7 27.8 41.5 27.2 37.4Progression Factor 1.00 1.00 0.93 2.03 0.97 1.06 0.51Incremental Delay, d2 0.3 0.3 38.0 0.1 3.0 2.1 0.5Delay (s) 29.7 31.0 71.0 56.4 43.1 31.0 19.6Level of Service C C E E D C BApproach Delay (s) 30.6 63.9 32.0Approach LOS C E C
Intersection SummaryHCM 2000 Control Delay 26.0 HCM 2000 Level of Service CHCM 2000 Volume to Capacity ratio 0.90Actuated Cycle Length (s) 100.0 Sum of lost time (s) 14.0Intersection Capacity Utilization 109.1% ICU Level of Service HAnalysis Period (min) 15c Critical Lane Group

HCM Signalized Intersection Capacity Analysis Children's Hospital 10: MLK Way & 52nd Street 2035 PM Plus Phase 1
Fehr & Peers Synchro 8 Report
Movement SBT SBRLane ConfigurationsVolume (vph) 1672 0Ideal Flow (vphpl) 1900 1900Total Lost time (s) 4.5Lane Util. Factor 0.91Frpb, ped/bikes 1.00Flpb, ped/bikes 1.00Frt 1.00Flt Protected 1.00Satd. Flow (prot) 5136Flt Permitted 1.00Satd. Flow (perm) 5136Peak-hour factor, PHF 1.00 1.00Adj. Flow (vph) 1672 0RTOR Reduction (vph) 0 0Lane Group Flow (vph) 1672 0Confl. Peds. (#/hr) 20Confl. Bikes (#/hr) 26Heavy Vehicles (%) 1% 1%Turn Type NAProtected Phases 6Permitted PhasesActuated Green, G (s) 45.4Effective Green, g (s) 45.4Actuated g/C Ratio 0.45Clearance Time (s) 4.5Vehicle Extension (s) 2.0Lane Grp Cap (vph) 2331v/s Ratio Prot c0.33v/s Ratio Permv/c Ratio 0.72Uniform Delay, d1 22.1Progression Factor 0.26Incremental Delay, d2 1.8Delay (s) 7.6Level of Service AApproach Delay (s) 8.6Approach LOS A
Intersection Summary
HCM Signalized Intersection Capacity Analysis Children's Hospital 11: 52nd Street & Garage 2035 PM Plus Phase 1
Fehr & Peers Synchro 8 Report
Movement EBL EBT EBR WBL WBT WBR NBL NBT NBR SBL SBT SBRLane ConfigurationsVolume (vph) 3 370 5 11 365 2 25 3 13 0 4 59Ideal Flow (vphpl) 1900 1900 1900 1900 1900 1900 1900 1900 1900 1900 1900 1900Total Lost time (s) 3.0 3.0 3.0 3.0Lane Util. Factor 0.95 0.95 1.00 1.00Frpb, ped/bikes 1.00 1.00 0.93 0.99Flpb, ped/bikes 1.00 1.00 1.00 1.00Frt 1.00 1.00 0.96 0.87Flt Protected 1.00 1.00 0.97 1.00Satd. Flow (prot) 3522 3590 1419 1640Flt Permitted 0.95 0.94 0.89 1.00Satd. Flow (perm) 3364 3391 1304 1640Peak-hour factor, PHF 1.00 1.00 1.00 1.00 1.00 1.00 1.00 1.00 1.00 1.00 1.00 1.00Adj. Flow (vph) 3 370 5 11 365 2 25 3 13 0 4 59RTOR Reduction (vph) 0 2 0 0 1 0 0 7 0 0 32 0Lane Group Flow (vph) 0 376 0 0 377 0 0 34 0 0 31 0Confl. Peds. (#/hr) 89 89 38 312 312Confl. Bikes (#/hr) 15 9 2Heavy Vehicles (%) 2% 2% 2% 0% 0% 0% 16% 16% 16% 0% 0% 0%Turn Type Prot NA Perm NA Perm NA NAProtected Phases 5 2 6 4 8Permitted Phases 6 4 8Actuated Green, G (s) 21.0 14.0 23.0 23.0Effective Green, g (s) 21.0 14.0 23.0 23.0Actuated g/C Ratio 0.42 0.28 0.46 0.46Clearance Time (s) 3.0 3.0 3.0 3.0Lane Grp Cap (vph) 1425 949 599 754v/s Ratio Prot c0.02 0.02v/s Ratio Perm 0.09 c0.11 c0.03v/c Ratio 0.26 0.40 0.06 0.04Uniform Delay, d1 9.5 14.6 7.5 7.4Progression Factor 1.61 1.00 1.00 1.00Incremental Delay, d2 0.4 1.2 0.2 0.1Delay (s) 15.6 15.8 7.7 7.5Level of Service B B A AApproach Delay (s) 15.6 15.8 7.7 7.5Approach LOS B B A A
Intersection SummaryHCM 2000 Control Delay 14.7 HCM 2000 Level of Service BHCM 2000 Volume to Capacity ratio 0.20Actuated Cycle Length (s) 50.0 Sum of lost time (s) 9.0Intersection Capacity Utilization 44.0% ICU Level of Service AAnalysis Period (min) 15c Critical Lane Group
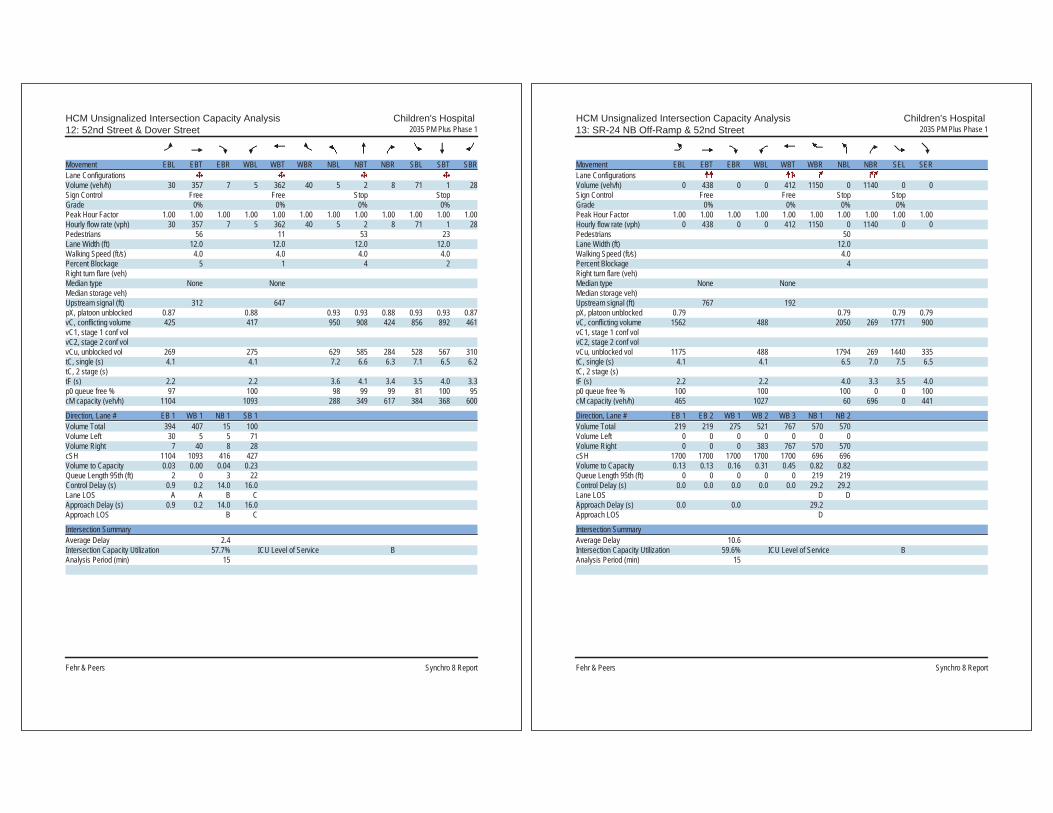
HCM Unsignalized Intersection Capacity Analysis Children's Hospital 12: 52nd Street & Dover Street 2035 PM Plus Phase 1
Fehr & Peers Synchro 8 Report
Movement EBL EBT EBR WBL WBT WBR NBL NBT NBR SBL SBT SBRLane ConfigurationsVolume (veh/h) 30 357 7 5 362 40 5 2 8 71 1 28Sign Control Free Free Stop StopGrade 0% 0% 0% 0%Peak Hour Factor 1.00 1.00 1.00 1.00 1.00 1.00 1.00 1.00 1.00 1.00 1.00 1.00Hourly flow rate (vph) 30 357 7 5 362 40 5 2 8 71 1 28Pedestrians 56 11 53 23Lane Width (ft) 12.0 12.0 12.0 12.0Walking Speed (ft/s) 4.0 4.0 4.0 4.0Percent Blockage 5 1 4 2Right turn flare (veh)Median type None NoneMedian storage veh)Upstream signal (ft) 312 647pX, platoon unblocked 0.87 0.88 0.93 0.93 0.88 0.93 0.93 0.87vC, conflicting volume 425 417 950 908 424 856 892 461vC1, stage 1 conf volvC2, stage 2 conf volvCu, unblocked vol 269 275 629 585 284 528 567 310tC, single (s) 4.1 4.1 7.2 6.6 6.3 7.1 6.5 6.2tC, 2 stage (s)tF (s) 2.2 2.2 3.6 4.1 3.4 3.5 4.0 3.3p0 queue free % 97 100 98 99 99 81 100 95cM capacity (veh/h) 1104 1093 288 349 617 384 368 600
Direction, Lane # EB 1 WB 1 NB 1 SB 1Volume Total 394 407 15 100Volume Left 30 5 5 71Volume Right 7 40 8 28cSH 1104 1093 416 427Volume to Capacity 0.03 0.00 0.04 0.23Queue Length 95th (ft) 2 0 3 22Control Delay (s) 0.9 0.2 14.0 16.0Lane LOS A A B CApproach Delay (s) 0.9 0.2 14.0 16.0Approach LOS B C
Intersection SummaryAverage Delay 2.4Intersection Capacity Utilization 57.7% ICU Level of Service BAnalysis Period (min) 15
HCM Unsignalized Intersection Capacity Analysis Children's Hospital 13: SR-24 NB Off-Ramp & 52nd Street 2035 PM Plus Phase 1
Fehr & Peers Synchro 8 Report
Movement EBL EBT EBR WBL WBT WBR NBL NBR SEL SERLane ConfigurationsVolume (veh/h) 0 438 0 0 412 1150 0 1140 0 0Sign Control Free Free Stop StopGrade 0% 0% 0% 0%Peak Hour Factor 1.00 1.00 1.00 1.00 1.00 1.00 1.00 1.00 1.00 1.00Hourly flow rate (vph) 0 438 0 0 412 1150 0 1140 0 0Pedestrians 50Lane Width (ft) 12.0Walking Speed (ft/s) 4.0Percent Blockage 4Right turn flare (veh)Median type None NoneMedian storage veh)Upstream signal (ft) 767 192pX, platoon unblocked 0.79 0.79 0.79 0.79vC, conflicting volume 1562 488 2050 269 1771 900vC1, stage 1 conf volvC2, stage 2 conf volvCu, unblocked vol 1175 488 1794 269 1440 335tC, single (s) 4.1 4.1 6.5 7.0 7.5 6.5tC, 2 stage (s)tF (s) 2.2 2.2 4.0 3.3 3.5 4.0p0 queue free % 100 100 100 0 0 100cM capacity (veh/h) 465 1027 60 696 0 441
Direction, Lane # EB 1 EB 2 WB 1 WB 2 WB 3 NB 1 NB 2Volume Total 219 219 275 521 767 570 570Volume Left 0 0 0 0 0 0 0Volume Right 0 0 0 383 767 570 570cSH 1700 1700 1700 1700 1700 696 696Volume to Capacity 0.13 0.13 0.16 0.31 0.45 0.82 0.82Queue Length 95th (ft) 0 0 0 0 0 219 219Control Delay (s) 0.0 0.0 0.0 0.0 0.0 29.2 29.2Lane LOS D DApproach Delay (s) 0.0 0.0 29.2Approach LOS D
Intersection SummaryAverage Delay 10.6Intersection Capacity Utilization 59.6% ICU Level of Service BAnalysis Period (min) 15
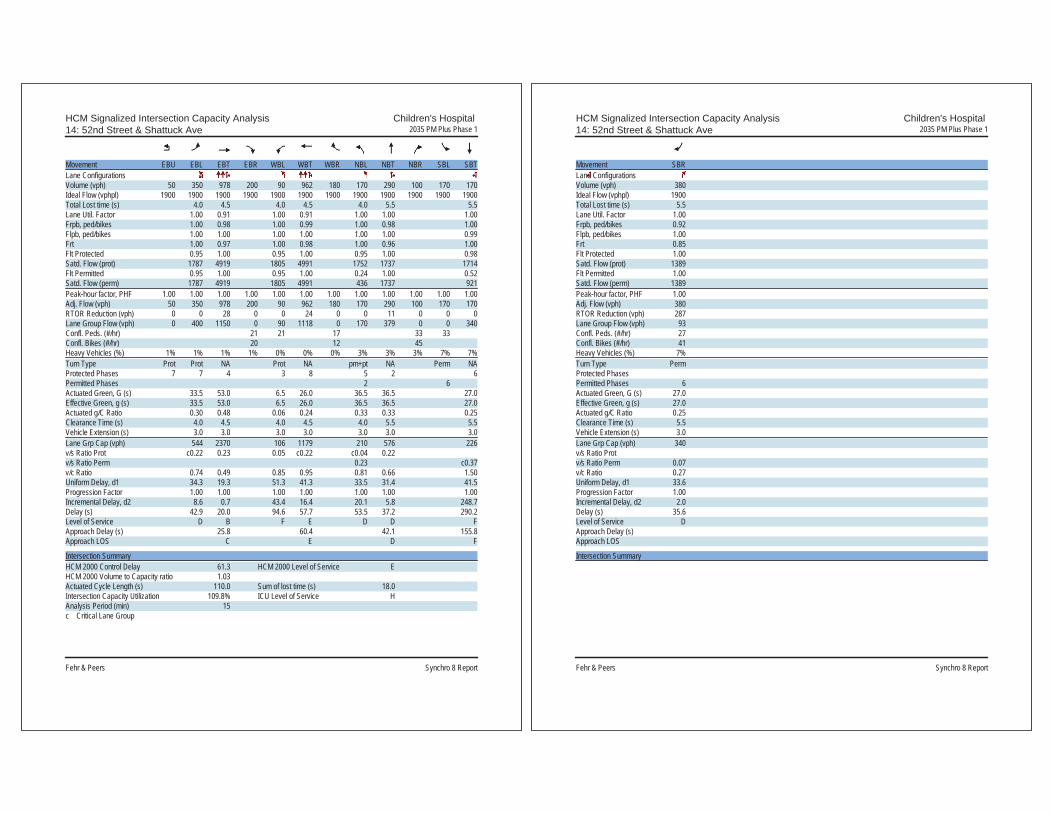
HCM Signalized Intersection Capacity Analysis Children's Hospital 14: 52nd Street & Shattuck Ave 2035 PM Plus Phase 1
Fehr & Peers Synchro 8 Report
Movement EBU EBL EBT EBR WBL WBT WBR NBL NBT NBR SBL SBTLane ConfigurationsVolume (vph) 50 350 978 200 90 962 180 170 290 100 170 170Ideal Flow (vphpl) 1900 1900 1900 1900 1900 1900 1900 1900 1900 1900 1900 1900Total Lost time (s) 4.0 4.5 4.0 4.5 4.0 5.5 5.5Lane Util. Factor 1.00 0.91 1.00 0.91 1.00 1.00 1.00Frpb, ped/bikes 1.00 0.98 1.00 0.99 1.00 0.98 1.00Flpb, ped/bikes 1.00 1.00 1.00 1.00 1.00 1.00 0.99Frt 1.00 0.97 1.00 0.98 1.00 0.96 1.00Flt Protected 0.95 1.00 0.95 1.00 0.95 1.00 0.98Satd. Flow (prot) 1787 4919 1805 4991 1752 1737 1714Flt Permitted 0.95 1.00 0.95 1.00 0.24 1.00 0.52Satd. Flow (perm) 1787 4919 1805 4991 436 1737 921Peak-hour factor, PHF 1.00 1.00 1.00 1.00 1.00 1.00 1.00 1.00 1.00 1.00 1.00 1.00Adj. Flow (vph) 50 350 978 200 90 962 180 170 290 100 170 170RTOR Reduction (vph) 0 0 28 0 0 24 0 0 11 0 0 0Lane Group Flow (vph) 0 400 1150 0 90 1118 0 170 379 0 0 340Confl. Peds. (#/hr) 21 21 17 33 33Confl. Bikes (#/hr) 20 12 45Heavy Vehicles (%) 1% 1% 1% 1% 0% 0% 0% 3% 3% 3% 7% 7%Turn Type Prot Prot NA Prot NA pm+pt NA Perm NAProtected Phases 7 7 4 3 8 5 2 6Permitted Phases 2 6Actuated Green, G (s) 33.5 53.0 6.5 26.0 36.5 36.5 27.0Effective Green, g (s) 33.5 53.0 6.5 26.0 36.5 36.5 27.0Actuated g/C Ratio 0.30 0.48 0.06 0.24 0.33 0.33 0.25Clearance Time (s) 4.0 4.5 4.0 4.5 4.0 5.5 5.5Vehicle Extension (s) 3.0 3.0 3.0 3.0 3.0 3.0 3.0Lane Grp Cap (vph) 544 2370 106 1179 210 576 226v/s Ratio Prot c0.22 0.23 0.05 c0.22 c0.04 0.22v/s Ratio Perm 0.23 c0.37v/c Ratio 0.74 0.49 0.85 0.95 0.81 0.66 1.50Uniform Delay, d1 34.3 19.3 51.3 41.3 33.5 31.4 41.5Progression Factor 1.00 1.00 1.00 1.00 1.00 1.00 1.00Incremental Delay, d2 8.6 0.7 43.4 16.4 20.1 5.8 248.7Delay (s) 42.9 20.0 94.6 57.7 53.5 37.2 290.2Level of Service D B F E D D FApproach Delay (s) 25.8 60.4 42.1 155.8Approach LOS C E D F
Intersection SummaryHCM 2000 Control Delay 61.3 HCM 2000 Level of Service EHCM 2000 Volume to Capacity ratio 1.03Actuated Cycle Length (s) 110.0 Sum of lost time (s) 18.0Intersection Capacity Utilization 109.8% ICU Level of Service HAnalysis Period (min) 15c Critical Lane Group
HCM Signalized Intersection Capacity Analysis Children's Hospital 14: 52nd Street & Shattuck Ave 2035 PM Plus Phase 1
Fehr & Peers Synchro 8 Report
Movement SBRLane ConfigurationsVolume (vph) 380Ideal Flow (vphpl) 1900Total Lost time (s) 5.5Lane Util. Factor 1.00Frpb, ped/bikes 0.92Flpb, ped/bikes 1.00Frt 0.85Flt Protected 1.00Satd. Flow (prot) 1389Flt Permitted 1.00Satd. Flow (perm) 1389Peak-hour factor, PHF 1.00Adj. Flow (vph) 380RTOR Reduction (vph) 287Lane Group Flow (vph) 93Confl. Peds. (#/hr) 27Confl. Bikes (#/hr) 41Heavy Vehicles (%) 7%Turn Type PermProtected PhasesPermitted Phases 6Actuated Green, G (s) 27.0Effective Green, g (s) 27.0Actuated g/C Ratio 0.25Clearance Time (s) 5.5Vehicle Extension (s) 3.0Lane Grp Cap (vph) 340v/s Ratio Protv/s Ratio Perm 0.07v/c Ratio 0.27Uniform Delay, d1 33.6Progression Factor 1.00Incremental Delay, d2 2.0Delay (s) 35.6Level of Service DApproach Delay (s)Approach LOS
Intersection Summary

HCM Signalized Intersection Capacity Analysis Children's Hospital 15: Telegraph Ave & 52nd Street/Claremont Ave 2035 PM Plus Phase 1
Fehr & Peers Synchro 8 Report
Movement EBL EBT EBR WBL WBT WBR NBL NBT NBR SBL SBT SBRLane ConfigurationsVolume (vph) 20 20 20 210 90 200 30 1177 340 200 831 321Ideal Flow (vphpl) 1900 1900 1900 1900 1900 1900 1900 1900 1900 1900 1900 1900Lane Width 12 12 12 12 12 12 12 16 12 12 12 12Total Lost time (s) 4.5 4.5 4.5 4.5 4.5 4.5Lane Util. Factor 1.00 0.95 0.95 0.95 1.00 0.95Frpb, ped/bikes 0.99 1.00 0.94 0.98 1.00 0.91Flpb, ped/bikes 1.00 1.00 1.00 1.00 1.00 1.00Frt 0.95 1.00 0.90 0.97 1.00 0.96Flt Protected 0.98 0.95 1.00 1.00 0.95 1.00Satd. Flow (prot) 1642 1698 1508 3757 1770 3073Flt Permitted 0.98 0.95 1.00 0.90 0.95 1.00Satd. Flow (perm) 1642 1698 1508 3402 1770 3073Peak-hour factor, PHF 1.00 1.00 1.00 1.00 1.00 1.00 1.00 1.00 1.00 1.00 1.00 1.00Adj. Flow (vph) 20 20 20 210 90 200 30 1177 340 200 831 321RTOR Reduction (vph) 0 19 0 0 68 0 0 23 0 0 36 0Lane Group Flow (vph) 0 41 0 189 243 0 0 1524 0 200 1116 0Confl. Peds. (#/hr) 51 51 105 33 105Confl. Bikes (#/hr) 2 15 53 72Heavy Vehicles (%) 8% 8% 8% 1% 1% 1% 3% 3% 3% 2% 2% 2%Turn Type Split NA Split NA Perm NA Prot NAProtected Phases 4 4 8 8 2 1 6Permitted Phases 2Actuated Green, G (s) 6.2 19.6 19.6 43.0 13.2 60.7Effective Green, g (s) 6.2 19.6 19.6 43.0 13.2 60.7Actuated g/C Ratio 0.06 0.20 0.20 0.43 0.13 0.61Clearance Time (s) 4.5 4.5 4.5 4.5 4.5 4.5Vehicle Extension (s) 3.0 3.0 3.0 3.0 3.0 3.0Lane Grp Cap (vph) 101 332 295 1462 233 1865v/s Ratio Prot c0.03 0.11 c0.16 c0.11 0.36v/s Ratio Perm c0.45v/c Ratio 0.41 0.57 0.83 1.04 0.86 0.60Uniform Delay, d1 45.1 36.4 38.6 28.5 42.5 12.1Progression Factor 1.81 1.00 1.00 0.50 1.00 1.00Incremental Delay, d2 0.8 2.2 16.9 26.5 25.4 1.4Delay (s) 82.5 38.6 55.5 40.7 67.9 13.6Level of Service F D E D E BApproach Delay (s) 82.5 49.1 40.7 21.6Approach LOS F D D C
Intersection SummaryHCM 2000 Control Delay 35.2 HCM 2000 Level of Service DHCM 2000 Volume to Capacity ratio 0.91Actuated Cycle Length (s) 100.0 Sum of lost time (s) 18.0Intersection Capacity Utilization 113.3% ICU Level of Service HAnalysis Period (min) 15c Critical Lane Group
HCM Signalized Intersection Capacity Analysis Children's Hospital 16: Telegraph Ave & 51St Street 2035 PM Plus Phase 1
Fehr & Peers Synchro 8 Report
Movement EBL EBT EBR WBL WBT WBR NBL NBT NBR SBL SBT SBRLane ConfigurationsVolume (vph) 327 750 111 80 580 240 121 980 190 310 681 70Ideal Flow (vphpl) 1900 1900 1900 1900 1900 1900 1900 1900 1900 1900 1900 1900Total Lost time (s) 4.0 4.0 4.0 3.5 4.0 4.5 4.0 3.5Lane Util. Factor 0.97 0.95 1.00 0.95 1.00 0.95 1.00 0.95Frpb, ped/bikes 1.00 0.98 1.00 0.97 1.00 0.97 1.00 0.97Flpb, ped/bikes 1.00 1.00 1.00 1.00 1.00 1.00 1.00 1.00Frt 1.00 0.98 1.00 0.96 1.00 0.98 1.00 0.99Flt Protected 0.95 1.00 0.95 1.00 0.95 1.00 0.95 1.00Satd. Flow (prot) 3400 3380 1787 3307 1719 3270 1752 3362Flt Permitted 0.95 1.00 0.95 1.00 0.95 1.00 0.95 1.00Satd. Flow (perm) 3400 3380 1787 3307 1719 3270 1752 3362Peak-hour factor, PHF 1.00 1.00 1.00 1.00 1.00 1.00 1.00 1.00 1.00 1.00 1.00 1.00Adj. Flow (vph) 327 750 111 80 580 240 121 980 190 310 681 70RTOR Reduction (vph) 0 11 0 0 44 0 0 15 0 0 8 0Lane Group Flow (vph) 327 850 0 80 776 0 121 1155 0 310 743 0Confl. Peds. (#/hr) 78 57 86 138Confl. Bikes (#/hr) 12 23 51 81Heavy Vehicles (%) 3% 3% 3% 1% 1% 1% 5% 5% 5% 3% 3% 3%Turn Type Prot NA Prot NA Prot NA Prot NAProtected Phases 7 4 3 8 5 2 1 6Permitted PhasesActuated Green, G (s) 14.4 29.0 8.3 23.4 8.5 33.2 13.0 38.7Effective Green, g (s) 14.4 29.0 8.3 23.4 8.5 33.2 13.0 38.7Actuated g/C Ratio 0.14 0.29 0.08 0.23 0.08 0.33 0.13 0.39Clearance Time (s) 4.0 4.0 4.0 3.5 4.0 4.5 4.0 3.5Vehicle Extension (s) 3.0 3.0 3.0 3.0 3.0 3.0 3.0 3.0Lane Grp Cap (vph) 489 980 148 773 146 1085 227 1301v/s Ratio Prot c0.10 c0.25 0.04 c0.23 0.07 c0.35 c0.18 0.22v/s Ratio Permv/c Ratio 0.67 0.87 0.54 1.00 0.83 1.06 1.37 0.57Uniform Delay, d1 40.5 33.7 44.0 38.3 45.0 33.4 43.5 24.1Progression Factor 1.00 1.00 1.00 1.00 1.00 1.00 1.14 0.71Incremental Delay, d2 3.5 10.2 4.0 33.2 30.5 46.1 186.0 1.5Delay (s) 44.0 43.9 48.0 71.5 75.5 79.5 235.5 18.7Level of Service D D D E E E F BApproach Delay (s) 43.9 69.4 79.1 82.1Approach LOS D E E F
Intersection SummaryHCM 2000 Control Delay 68.4 HCM 2000 Level of Service EHCM 2000 Volume to Capacity ratio 1.03Actuated Cycle Length (s) 100.0 Sum of lost time (s) 16.5Intersection Capacity Utilization 99.3% ICU Level of Service FAnalysis Period (min) 15c Critical Lane Group

HCM Signalized Intersection Capacity Analysis Children's Hospital 17: SB SR-24 On-Ramp & MLK Way & NB SR-24 Off-Ramp 2035 PM Plus Phase 1
Fehr & Peers Synchro 8 Report
Movement EBL EBT EBR WBL WBT WBR NBL NBT NBR SBL SBT SBRLane ConfigurationsVolume (vph) 340 0 0 0 0 1782 0 0 0 0 1758 250Ideal Flow (vphpl) 1900 1900 1900 1900 1900 1900 1900 1900 1900 1900 1900 1900Total Lost time (s) 4.0 4.0 4.0 4.0Lane Util. Factor 0.97 1.00 0.95 0.88Frpb, ped/bikes 1.00 1.00 1.00 1.00Flpb, ped/bikes 1.00 1.00 1.00 1.00Frt 1.00 0.86 1.00 0.85Flt Protected 0.95 1.00 1.00 1.00Satd. Flow (prot) 3273 1627 3574 2814Flt Permitted 0.95 1.00 1.00 1.00Satd. Flow (perm) 3273 1627 3574 2814Peak-hour factor, PHF 1.00 1.00 1.00 1.00 1.00 1.00 1.00 1.00 1.00 1.00 1.00 1.00Adj. Flow (vph) 340 0 0 0 0 1782 0 0 0 0 1758 250RTOR Reduction (vph) 0 0 0 0 0 0 0 0 0 0 0 0Lane Group Flow (vph) 340 0 0 0 0 1782 0 0 0 0 1758 250Confl. Peds. (#/hr) 3Confl. Bikes (#/hr) 14Heavy Vehicles (%) 7% 7% 2% 2% 1% 1% 2% 2% 2% 2% 1% 1%Turn Type Prot Free NA customProtected Phases 2 6 FreePermitted Phases FreeActuated Green, G (s) 13.0 50.0 29.0 50.0Effective Green, g (s) 13.0 50.0 29.0 50.0Actuated g/C Ratio 0.26 1.00 0.58 1.00Clearance Time (s) 4.0 4.0Lane Grp Cap (vph) 850 1627 2072 2814v/s Ratio Prot 0.10 0.49 0.09v/s Ratio Perm c1.10v/c Ratio 0.40 1.10 0.85 0.09Uniform Delay, d1 15.3 25.0 8.7 0.0Progression Factor 1.00 1.00 2.69 1.00Incremental Delay, d2 1.4 53.1 3.3 0.0Delay (s) 16.7 78.1 26.7 0.0Level of Service B E C AApproach Delay (s) 16.7 78.1 0.0 23.4Approach LOS B E A C
Intersection SummaryHCM 2000 Control Delay 46.4 HCM 2000 Level of Service DHCM 2000 Volume to Capacity ratio 1.30Actuated Cycle Length (s) 50.0 Sum of lost time (s) 8.0Intersection Capacity Utilization 65.0% ICU Level of Service CAnalysis Period (min) 15c Critical Lane Group
HCM Unsignalized Intersection Capacity Analysis Children's Hospital 18: West Street & 52nd Street 2035 PM Plus Phase 1
Fehr & Peers Synchro 8 Report
Movement EBL EBT EBR WBL WBT WBR NBL NBT NBR SBL SBT SBRLane ConfigurationsSign Control Stop Stop Stop StopVolume (vph) 0 160 10 100 139 0 60 0 150 10 70 10Peak Hour Factor 1.00 1.00 1.00 1.00 1.00 1.00 1.00 1.00 1.00 1.00 1.00 1.00Hourly flow rate (vph) 0 160 10 100 139 0 60 0 150 10 70 10
Direction, Lane # EB 1 WB 1 NB 1 NB 2 SB 1Volume Total (vph) 170 239 60 150 90Volume Left (vph) 0 100 60 0 10Volume Right (vph) 10 0 0 150 10Hadj (s) -0.02 0.12 0.50 -0.70 -0.01Departure Headway (s) 5.0 5.0 6.2 5.0 5.4Degree Utilization, x 0.24 0.33 0.10 0.21 0.13Capacity (veh/h) 668 675 547 671 606Control Delay (s) 9.5 10.5 8.7 8.0 9.2Approach Delay (s) 9.5 10.5 8.2 9.2Approach LOS A B A A
Intersection SummaryDelay 9.4Level of Service AIntersection Capacity Utilization 46.0% ICU Level of Service AAnalysis Period (min) 15

HCM Unsignalized Intersection Capacity Analysis Children's Hospital 19: Genoa Street & 52nd Street 2035 PM Plus Phase 1
Fehr & Peers Synchro 8 Report
Movement EBL EBT EBR WBL WBT WBR NBL NBT NBR SBL SBT SBRLane ConfigurationsSign Control Stop Stop Stop StopVolume (vph) 10 150 10 20 129 50 10 10 10 20 10 10Peak Hour Factor 1.00 1.00 1.00 1.00 1.00 1.00 1.00 1.00 1.00 1.00 1.00 1.00Hourly flow rate (vph) 10 150 10 20 129 50 10 10 10 20 10 10
Direction, Lane # EB 1 WB 1 NB 1 SB 1Volume Total (vph) 170 199 30 40Volume Left (vph) 10 20 10 20Volume Right (vph) 10 50 10 10Hadj (s) -0.01 -0.13 -0.13 -0.05Departure Headway (s) 4.3 4.1 4.6 4.7Degree Utilization, x 0.20 0.23 0.04 0.05Capacity (veh/h) 822 854 714 701Control Delay (s) 8.3 8.3 7.8 7.9Approach Delay (s) 8.3 8.3 7.8 7.9Approach LOS A A A A
Intersection SummaryDelay 8.3Level of Service AIntersection Capacity Utilization 28.5% ICU Level of Service AAnalysis Period (min) 15
HCM Unsignalized Intersection Capacity Analysis Children's Hospital 20: Genoa Street & 55th Street 2035 PM Plus Phase 1
Fehr & Peers Synchro 8 Report
Movement EBL EBT EBR WBL WBT WBR NBL NBT NBR SBL SBT SBRLane ConfigurationsVolume (veh/h) 20 390 10 20 451 40 10 20 40 40 10 20Sign Control Free Free Stop StopGrade 0% 0% 0% 0%Peak Hour Factor 1.00 1.00 1.00 1.00 1.00 1.00 1.00 1.00 1.00 1.00 1.00 1.00Hourly flow rate (vph) 20 390 10 20 451 40 10 20 40 40 10 20Pedestrians 8 11 5Lane Width (ft) 12.0 12.0 12.0Walking Speed (ft/s) 4.0 4.0 4.0Percent Blockage 1 1 0Right turn flare (veh)Median type None NoneMedian storage veh)Upstream signal (ft) 721pX, platoon unblockedvC, conflicting volume 496 411 990 982 406 1001 967 484vC1, stage 1 conf volvC2, stage 2 conf volvCu, unblocked vol 496 411 990 982 406 1001 967 484tC, single (s) 4.1 4.1 7.1 6.5 6.2 7.1 6.5 6.2tC, 2 stage (s)tF (s) 2.2 2.2 3.5 4.0 3.3 3.5 4.0 3.3p0 queue free % 98 98 95 92 94 79 96 97cM capacity (veh/h) 1069 1148 201 239 643 187 242 577
Direction, Lane # EB 1 WB 1 NB 1 SB 1Volume Total 420 511 70 70Volume Left 20 20 10 40Volume Right 10 40 40 20cSH 1069 1148 358 241Volume to Capacity 0.02 0.02 0.20 0.29Queue Length 95th (ft) 1 1 18 29Control Delay (s) 0.6 0.5 17.5 25.9Lane LOS A A C DApproach Delay (s) 0.6 0.5 17.5 25.9Approach LOS C D
Intersection SummaryAverage Delay 3.3Intersection Capacity Utilization 51.2% ICU Level of Service AAnalysis Period (min) 15

HCM Unsignalized Intersection Capacity Analysis Children's Hospital 21: MLK Way & RIRO Main Garage 2035 PM Plus Phase 1
Fehr & Peers Synchro 8 Report
Movement WBL WBR NBT NBR SBL SBTLane ConfigurationsVolume (veh/h) 0 123 2129 34 0 1843Sign Control Stop Free FreeGrade 0% 0% 0%Peak Hour Factor 1.00 1.00 1.00 1.00 1.00 1.00Hourly flow rate (vph) 0 123 2129 34 0 1843PedestriansLane Width (ft)Walking Speed (ft/s)Percent BlockageRight turn flare (veh)Median type None NoneMedian storage veh)Upstream signal (ft) 154 137pX, platoon unblocked 0.72 0.64 0.64vC, conflicting volume 2760 727 2163vC1, stage 1 conf volvC2, stage 2 conf volvCu, unblocked vol 556 0 860tC, single (s) 6.8 6.9 4.1tC, 2 stage (s)tF (s) 3.5 3.3 2.2p0 queue free % 100 82 100cM capacity (veh/h) 334 696 499
Direction, Lane # WB 1 NB 1 NB 2 NB 3 SB 1 SB 2 SB 3Volume Total 123 852 852 460 614 614 614Volume Left 0 0 0 0 0 0 0Volume Right 123 0 0 34 0 0 0cSH 696 1700 1700 1700 1700 1700 1700Volume to Capacity 0.18 0.50 0.50 0.27 0.36 0.36 0.36Queue Length 95th (ft) 16 0 0 0 0 0 0Control Delay (s) 11.3 0.0 0.0 0.0 0.0 0.0 0.0Lane LOS BApproach Delay (s) 11.3 0.0 0.0Approach LOS B
Intersection SummaryAverage Delay 0.3Intersection Capacity Utilization 56.2% ICU Level of Service BAnalysis Period (min) 15
HCM Unsignalized Intersection Capacity Analysis Children's Hospital 22: MLK Way & RIRO Main Plaza 2035 PM Plus Phase 1
Fehr & Peers Synchro 8 Report
Movement WBL WBR NBT NBR SBL SBTLane ConfigurationsVolume (veh/h) 0 0 2102 20 0 1978Sign Control Stop Free FreeGrade 0% 0% 0%Peak Hour Factor 1.00 1.00 1.00 1.00 1.00 1.00Hourly flow rate (vph) 0 0 2102 20 0 1978PedestriansLane Width (ft)Walking Speed (ft/s)Percent BlockageRight turn flare (veh)Median type None NoneMedian storage veh)Upstream signal (ft) 424 204pX, platoon unblocked 0.74vC, conflicting volume 2771 711 2122vC1, stage 1 conf volvC2, stage 2 conf volvCu, unblocked vol 2148 711 2122tC, single (s) 6.8 6.9 4.1tC, 2 stage (s)tF (s) 3.5 3.3 2.2p0 queue free % 100 100 100cM capacity (veh/h) 30 376 253
Direction, Lane # WB 1 NB 1 NB 2 NB 3 SB 1 SB 2 SB 3Volume Total 0 841 841 440 659 659 659Volume Left 0 0 0 0 0 0 0Volume Right 0 0 0 20 0 0 0cSH 1700 1700 1700 1700 1700 1700 1700Volume to Capacity 0.00 0.49 0.49 0.26 0.39 0.39 0.39Queue Length 95th (ft) 0 0 0 0 0 0 0Control Delay (s) 0.0 0.0 0.0 0.0 0.0 0.0 0.0Lane LOS AApproach Delay (s) 0.0 0.0 0.0Approach LOS A
Intersection SummaryAverage Delay 0.0Intersection Capacity Utilization 44.4% ICU Level of Service AAnalysis Period (min) 15

HCM Unsignalized Intersection Capacity Analysis Children's Hospital 24: 51St Street & 52nd Street 2035 PM Plus Phase 1
Fehr & Peers Synchro 8 Report
Intersection Sign configuration not allowed in HCM analysis.
Appendix K LOS Calculation Worksheets – 2035 Plus Phase 2
Conditions

HCM Signalized Intersection Capacity Analysis Children's Hospital1: MLK Way & 55th Street
HCM Signalized Intersection Capacity Analysis Children's Hospital1: MLK Way & 55th Street

HCM Unsignalized Intersection Capacity Analysis Children's Hospital2: Dover Street & 55th Street
HCM Signalized Intersection Capacity Analysis Children's Hospital3: 55th Street & Shattuck Ave

HCM Signalized Intersection Capacity Analysis Children's Hospital4: 55th Street & Telegraph Ave
HCM Unsignalized Intersection Capacity Analysis Children's Hospital5: MLK Way & 54th Street

HCM Unsignalized Intersection Capacity Analysis Children's Hospital5: MLK Way & 54th Street
HCM Unsignalized Intersection Capacity Analysis Children's Hospital6: Dover Street & 54th Street

HCM Unsignalized Intersection Capacity Analysis Children's Hospital7: Shattuck Ave & 54th Street
HCM Signalized Intersection Capacity Analysis Children's Hospital8: MLK Way & 53rd Street
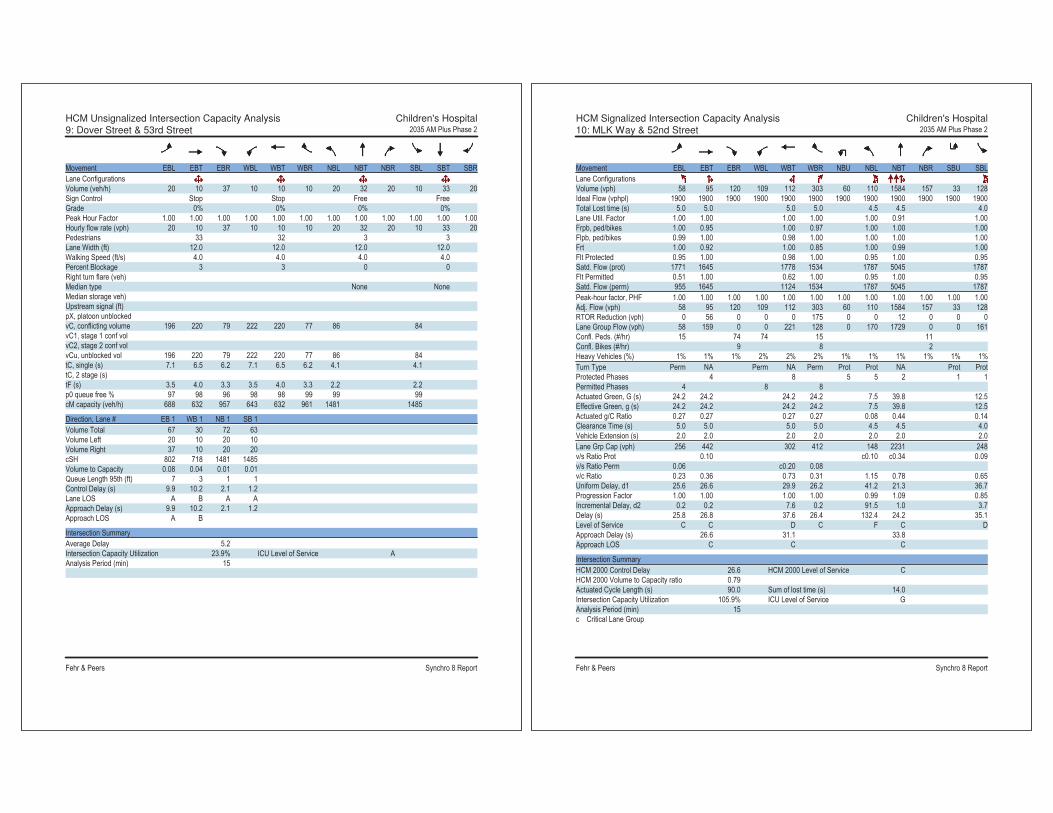
HCM Unsignalized Intersection Capacity Analysis Children's Hospital9: Dover Street & 53rd Street
HCM Signalized Intersection Capacity Analysis Children's Hospital10: MLK Way & 52nd Street

HCM Signalized Intersection Capacity Analysis Children's Hospital10: MLK Way & 52nd Street
HCM Signalized Intersection Capacity Analysis Children's Hospital11: 52nd Street & Garage

HCM Unsignalized Intersection Capacity Analysis Children's Hospital12: 52nd Street & Dover Street
HCM Unsignalized Intersection Capacity Analysis Children's Hospital13: SR-24 NB Off-Ramp & 52nd Street

HCM Signalized Intersection Capacity Analysis Children's Hospital14: 52nd Street & Shattuck Ave
HCM Signalized Intersection Capacity Analysis Children's Hospital14: 52nd Street & Shattuck Ave
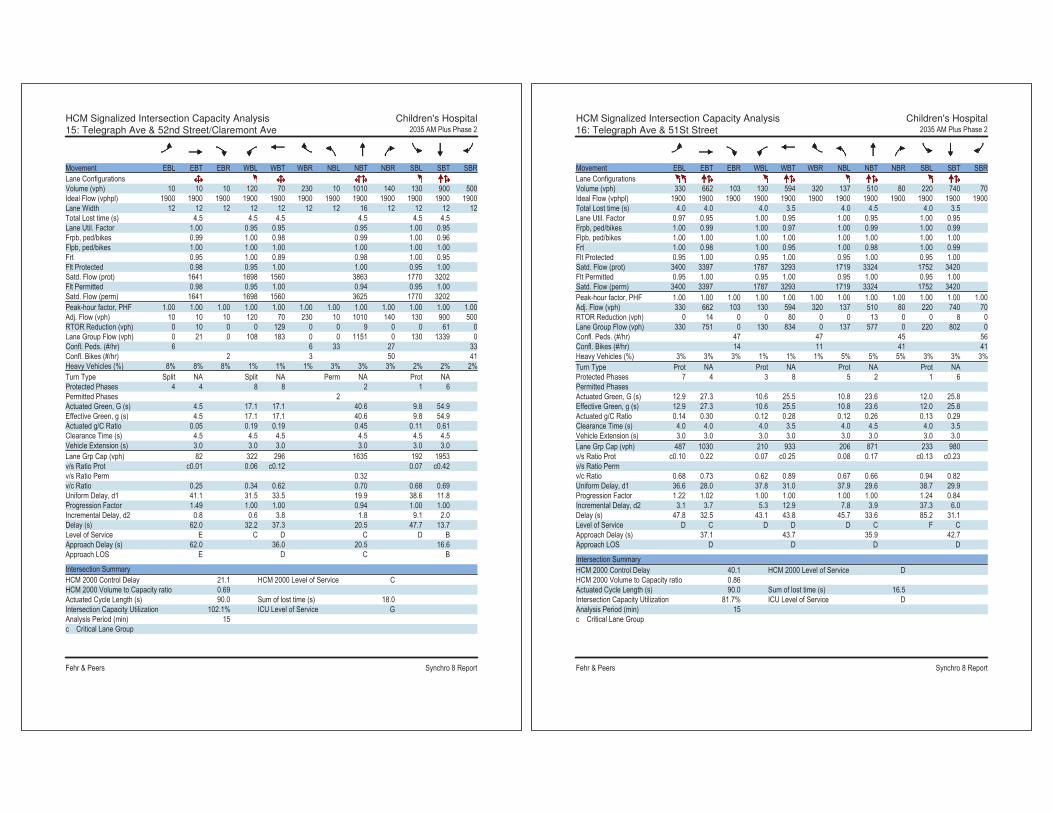
HCM Signalized Intersection Capacity Analysis Children's Hospital15: Telegraph Ave & 52nd Street/Claremont Ave
HCM Signalized Intersection Capacity Analysis Children's Hospital16: Telegraph Ave & 51St Street

HCM Signalized Intersection Capacity Analysis Children's Hospital17: SB SR-24 On-Ramp & MLK Way & NB SR-24 Off-Ramp
HCM Unsignalized Intersection Capacity Analysis Children's Hospital18: West Street & 52nd Street

HCM Unsignalized Intersection Capacity Analysis Children's Hospital19: Genoa Street & 52nd Street
HCM Unsignalized Intersection Capacity Analysis Children's Hospital20: Genoa Street & 55th Street

HCM Unsignalized Intersection Capacity Analysis Children's Hospital21: MLK Way & RIRO Main Garage
HCM Unsignalized Intersection Capacity Analysis Children's Hospital22: MLK Way & RIRO Main Plaza

HCM Unsignalized Intersection Capacity Analysis Children's Hospital24: 51St Street & 52nd Street
HCM Signalized Intersection Capacity Analysis Children's Hospital 1: MLK Way & 55th Street 2035 PM Plus Phase 2
Fehr & Peers Synchro 8 Report
Movement EBL EBT EBR WBL WBT WBR NBU NBL NBT NBR SBL SBTLane ConfigurationsVolume (vph) 20 270 180 60 240 110 29 211 1783 158 200 1474Ideal Flow (vphpl) 1900 1900 1900 1900 1900 1900 1900 1900 1900 1900 1900 1900Total Lost time (s) 5.0 5.0 4.5 5.0 4.5 5.0Lane Util. Factor 1.00 1.00 1.00 0.91 1.00 0.91Frpb, ped/bikes 0.98 0.99 1.00 0.99 1.00 1.00Flpb, ped/bikes 1.00 1.00 1.00 1.00 1.00 1.00Frt 0.95 0.96 1.00 0.99 1.00 1.00Flt Protected 1.00 0.99 0.95 1.00 0.95 1.00Satd. Flow (prot) 1747 1728 1770 4980 1770 5054Flt Permitted 0.97 0.75 0.95 1.00 0.95 1.00Satd. Flow (perm) 1707 1310 1770 4980 1770 5054Peak-hour factor, PHF 1.00 1.00 1.00 1.00 1.00 1.00 1.00 1.00 1.00 1.00 1.00 1.00Adj. Flow (vph) 20 270 180 60 240 110 29 211 1783 158 200 1474RTOR Reduction (vph) 0 23 0 0 14 0 0 0 10 0 0 3Lane Group Flow (vph) 0 447 0 0 396 0 0 240 1931 0 200 1511Confl. Peds. (#/hr) 17 23 23 17 30Confl. Bikes (#/hr) 24 18 23Heavy Vehicles (%) 1% 1% 1% 4% 4% 4% 2% 2% 2% 2% 2% 2%Turn Type Perm NA Perm NA Prot Prot NA Prot NAProtected Phases 4 8 5 5 2 1 6Permitted Phases 4 8Actuated Green, G (s) 31.7 31.7 21.5 42.3 11.5 32.3Effective Green, g (s) 31.7 31.7 21.5 42.3 11.5 32.3Actuated g/C Ratio 0.32 0.32 0.22 0.42 0.12 0.32Clearance Time (s) 5.0 5.0 4.5 5.0 4.5 5.0Vehicle Extension (s) 3.0 3.0 3.0 3.0 3.0 3.0Lane Grp Cap (vph) 541 415 380 2106 203 1632v/s Ratio Prot 0.14 c0.39 0.11 c0.30v/s Ratio Perm 0.26 c0.30v/c Ratio 0.83 0.96 0.63 0.92 0.99 0.93Uniform Delay, d1 31.6 33.5 35.7 27.2 44.2 32.7Progression Factor 1.00 1.00 0.52 0.40 1.00 1.00Incremental Delay, d2 10.0 32.5 2.7 6.3 58.5 10.5Delay (s) 41.6 66.0 21.1 17.3 102.6 43.2Level of Service D E C B F DApproach Delay (s) 41.6 66.0 17.7 50.1Approach LOS D E B D
Intersection SummaryHCM 2000 Control Delay 35.8 HCM 2000 Level of Service DHCM 2000 Volume to Capacity ratio 0.96Actuated Cycle Length (s) 100.0 Sum of lost time (s) 14.5Intersection Capacity Utilization 106.2% ICU Level of Service GAnalysis Period (min) 15c Critical Lane Group

HCM Signalized Intersection Capacity Analysis Children's Hospital 1: MLK Way & 55th Street 2035 PM Plus Phase 2
Fehr & Peers Synchro 8 Report
Movement SBRLane ConfigurationsVolume (vph) 40Ideal Flow (vphpl) 1900Total Lost time (s)Lane Util. FactorFrpb, ped/bikesFlpb, ped/bikesFrtFlt ProtectedSatd. Flow (prot)Flt PermittedSatd. Flow (perm)Peak-hour factor, PHF 1.00Adj. Flow (vph) 40RTOR Reduction (vph) 0Lane Group Flow (vph) 0Confl. Peds. (#/hr) 18Confl. Bikes (#/hr) 23Heavy Vehicles (%) 2%Turn TypeProtected PhasesPermitted PhasesActuated Green, G (s)Effective Green, g (s)Actuated g/C RatioClearance Time (s)Vehicle Extension (s)Lane Grp Cap (vph)v/s Ratio Protv/s Ratio Permv/c RatioUniform Delay, d1Progression FactorIncremental Delay, d2Delay (s)Level of ServiceApproach Delay (s)Approach LOS
Intersection Summary
HCM Unsignalized Intersection Capacity Analysis Children's Hospital 2: Dover Street & 55th Street 2035 PM Plus Phase 2
Fehr & Peers Synchro 8 Report
Movement EBL EBT EBR WBL WBT WBR NBL NBT NBR SBL SBT SBRLane ConfigurationsVolume (veh/h) 30 578 20 11 330 20 20 20 33 20 20 40Sign Control Free Free Stop StopGrade 0% 0% 0% 0%Peak Hour Factor 1.00 1.00 1.00 1.00 1.00 1.00 1.00 1.00 1.00 1.00 1.00 1.00Hourly flow rate (vph) 30 578 20 11 330 20 20 20 33 20 20 40Pedestrians 6 20 11 26Lane Width (ft) 12.0 12.0 12.0 12.0Walking Speed (ft/s) 4.0 4.0 4.0 4.0Percent Blockage 1 2 1 2Right turn flare (veh)Median type None NoneMedian storage veh)Upstream signal (ft) 641 677pX, platoon unblocked 0.96 0.96 0.96 0.96 0.96 0.96vC, conflicting volume 376 609 1077 1057 619 1099 1057 372vC1, stage 1 conf volvC2, stage 2 conf volvCu, unblocked vol 327 609 1059 1038 619 1082 1038 323tC, single (s) 4.1 4.1 7.1 6.5 6.2 7.1 6.5 6.2tC, 2 stage (s)tF (s) 2.2 2.2 3.5 4.0 3.3 3.5 4.0 3.3p0 queue free % 97 99 87 90 93 86 90 94cM capacity (veh/h) 1140 951 159 208 480 147 206 668
Direction, Lane # EB 1 WB 1 NB 1 SB 1Volume Total 628 361 73 80Volume Left 30 11 20 20Volume Right 20 20 33 40cSH 1140 951 251 273Volume to Capacity 0.03 0.01 0.29 0.29Queue Length 95th (ft) 2 1 29 30Control Delay (s) 0.7 0.4 25.1 23.6Lane LOS A A D CApproach Delay (s) 0.7 0.4 25.1 23.6Approach LOS D C
Intersection SummaryAverage Delay 3.8Intersection Capacity Utilization 61.4% ICU Level of Service BAnalysis Period (min) 15

HCM Signalized Intersection Capacity Analysis Children's Hospital 3: 55th Street & Shattuck Ave 2035 PM Plus Phase 2
Fehr & Peers Synchro 8 Report
Movement EBL EBT EBR WBL WBT WBR NBL NBT NBR SBL SBT SBRLane ConfigurationsVolume (vph) 110 441 70 31 211 50 80 630 53 30 580 60Ideal Flow (vphpl) 1900 1900 1900 1900 1900 1900 1900 1900 1900 1900 1900 1900Total Lost time (s) 3.0 3.0 5.0 5.0Lane Util. Factor 1.00 1.00 1.00 1.00Frpb, ped/bikes 0.99 0.99 1.00 0.99Flpb, ped/bikes 1.00 1.00 1.00 1.00Frt 0.98 0.98 0.99 0.99Flt Protected 0.99 0.99 0.99 1.00Satd. Flow (prot) 1749 1773 1826 1843Flt Permitted 0.86 0.90 0.88 0.95Satd. Flow (perm) 1515 1612 1612 1756Peak-hour factor, PHF 1.00 1.00 1.00 1.00 1.00 1.00 1.00 1.00 1.00 1.00 1.00 1.00Adj. Flow (vph) 110 441 70 31 211 50 80 630 53 30 580 60RTOR Reduction (vph) 0 6 0 0 10 0 0 3 0 0 5 0Lane Group Flow (vph) 0 615 0 0 282 0 0 760 0 0 665 0Confl. Peds. (#/hr) 17 17 17 17 29 11 11 29Confl. Bikes (#/hr) 23 15 47 33Heavy Vehicles (%) 5% 5% 5% 3% 3% 3% 2% 2% 2% 1% 1% 1%Turn Type Perm NA Perm NA Perm NA Perm NAProtected Phases 2 6 4 8Permitted Phases 2 6 4 4 8Actuated Green, G (s) 29.0 29.0 43.0 43.0Effective Green, g (s) 29.0 29.0 43.0 43.0Actuated g/C Ratio 0.36 0.36 0.54 0.54Clearance Time (s) 3.0 3.0 5.0 5.0Lane Grp Cap (vph) 549 584 866 943v/s Ratio Protv/s Ratio Perm c0.41 0.18 c0.47 0.38v/c Ratio 1.12 0.48 0.88 0.71Uniform Delay, d1 25.5 19.7 16.2 13.8Progression Factor 1.00 1.00 1.00 1.00Incremental Delay, d2 76.1 2.9 12.2 4.4Delay (s) 101.6 22.6 28.4 18.2Level of Service F C C BApproach Delay (s) 101.6 22.6 28.4 18.2Approach LOS F C C B
Intersection SummaryHCM 2000 Control Delay 44.1 HCM 2000 Level of Service DHCM 2000 Volume to Capacity ratio 0.97Actuated Cycle Length (s) 80.0 Sum of lost time (s) 8.0Intersection Capacity Utilization 128.2% ICU Level of Service HAnalysis Period (min) 15c Critical Lane Group
HCM Signalized Intersection Capacity Analysis Children's Hospital 4: 55th Street & Telegraph Ave 2035 PM Plus Phase 2
Fehr & Peers Synchro 8 Report
Movement EBL EBT EBR WBL WBT WBR NBL NBT NBR SBL SBT SBRLane ConfigurationsVolume (vph) 313 30 171 50 20 20 130 1216 70 20 1136 122Ideal Flow (vphpl) 1900 1900 1900 1900 1900 1900 1900 1900 1900 1900 1900 1900Total Lost time (s) 4.5 4.5 4.5 4.5 4.5 4.5Lane Util. Factor 1.00 1.00 1.00 0.95 1.00 0.95Frpb, ped/bikes 0.98 0.99 1.00 0.99 1.00 0.98Flpb, ped/bikes 0.99 0.99 1.00 1.00 1.00 1.00Frt 0.96 0.97 1.00 0.99 1.00 0.99Flt Protected 0.97 0.97 0.95 1.00 0.95 1.00Satd. Flow (prot) 1625 1695 1770 3489 1787 3468Flt Permitted 0.78 0.72 0.12 1.00 0.11 1.00Satd. Flow (perm) 1302 1247 222 3489 210 3468Peak-hour factor, PHF 1.00 1.00 1.00 1.00 1.00 1.00 1.00 1.00 1.00 1.00 1.00 1.00Adj. Flow (vph) 313 30 171 50 20 20 130 1216 70 20 1136 122RTOR Reduction (vph) 0 20 0 0 12 0 0 4 0 0 9 0Lane Group Flow (vph) 0 494 0 0 78 0 130 1282 0 20 1249 0Confl. Peds. (#/hr) 17 39 39 17 38 26 26 38Confl. Bikes (#/hr) 12 14 44 68Heavy Vehicles (%) 5% 5% 5% 4% 4% 4% 2% 2% 2% 1% 1% 1%Turn Type Perm NA Perm NA Perm NA Perm NAProtected Phases 4 8 2 6Permitted Phases 4 8 2 6Actuated Green, G (s) 35.1 35.1 45.9 45.9 45.9 45.9Effective Green, g (s) 35.1 35.1 45.9 45.9 45.9 45.9Actuated g/C Ratio 0.39 0.39 0.51 0.51 0.51 0.51Clearance Time (s) 4.5 4.5 4.5 4.5 4.5 4.5Vehicle Extension (s) 3.0 3.0 3.0 3.0 3.0 3.0Lane Grp Cap (vph) 507 486 113 1779 107 1768v/s Ratio Prot 0.37 0.36v/s Ratio Perm c0.38 0.06 c0.58 0.10v/c Ratio 0.97 0.16 1.15 0.72 0.19 0.71Uniform Delay, d1 27.0 17.9 22.1 17.1 11.9 16.9Progression Factor 1.00 1.00 1.00 1.00 1.00 1.00Incremental Delay, d2 33.1 0.2 130.8 2.6 3.8 2.4Delay (s) 60.1 18.0 152.8 19.6 15.8 19.3Level of Service E B F B B BApproach Delay (s) 60.1 18.0 31.9 19.2Approach LOS E B C B
Intersection SummaryHCM 2000 Control Delay 31.0 HCM 2000 Level of Service CHCM 2000 Volume to Capacity ratio 1.07Actuated Cycle Length (s) 90.0 Sum of lost time (s) 9.0Intersection Capacity Utilization 91.2% ICU Level of Service FAnalysis Period (min) 15c Critical Lane Group

HCM Unsignalized Intersection Capacity Analysis Children's Hospital 5: MLK Way & 54th Street 2035 PM Plus Phase 2
Fehr & Peers Synchro 8 Report
Movement EBL EBT EBR WBL WBT WBR NBU NBL NBT NBR SBU SBLLane ConfigurationsVolume (veh/h) 10 10 50 20 10 10 13 40 2130 20 10 20Sign Control Stop Stop FreeGrade 0% 0% 0%Peak Hour Factor 1.00 1.00 1.00 1.00 1.00 1.00 1.00 1.00 1.00 1.00 1.00 1.00Hourly flow rate (vph) 10 10 50 20 10 10 0 40 2130 20 0 20Pedestrians 8 29 17Lane Width (ft) 12.0 12.0 12.0Walking Speed (ft/s) 4.0 4.0 4.0Percent Blockage 1 2 1Right turn flare (veh)Median type NoneMedian storage veh)Upstream signal (ft) 299pX, platoon unblocked 0.85 0.85 0.71 0.85 0.85 0.71 0.00 0.71 0.00 0.71vC, conflicting volume 2536 3990 593 2919 3990 749 0 1701 0 2179vC1, stage 1 conf volvC2, stage 2 conf volvCu, unblocked vol 0 1644 0 391 1644 0 0 580 0 1238tC, single (s) 7.5 6.5 6.9 7.5 6.5 6.9 0.0 4.1 0.0 4.1tC, 2 stage (s)tF (s) *8.0 *8.0 *8.0 *8.0 *8.0 *8.0 0.0 2.2 0.0 2.2p0 queue free % 97 84 84 88 84 97 0 94 0 95cM capacity (veh/h) 293 64 315 164 64 312 0 702 0 392
Direction, Lane # EB 1 WB 1 NB 1 NB 2 NB 3 SB 1 SB 2 SB 3Volume Total 70 40 572 1065 552 438 836 438Volume Left 10 20 40 0 0 20 0 0Volume Right 50 10 0 0 20 0 0 20cSH 201 129 702 1700 1700 392 1700 1700Volume to Capacity 0.35 0.31 0.06 0.63 0.33 0.05 0.49 0.26Queue Length 95th (ft) 37 30 5 0 0 4 0 0Control Delay (s) 32.2 44.9 1.5 0.0 0.0 1.6 0.0 0.0Lane LOS D E A AApproach Delay (s) 32.2 44.9 0.4 0.4Approach LOS D E
Intersection SummaryAverage Delay 1.4Intersection Capacity Utilization 94.9% ICU Level of Service FAnalysis Period (min) 15
* User Entered Value
HCM Unsignalized Intersection Capacity Analysis Children's Hospital 5: MLK Way & 54th Street 2035 PM Plus Phase 2
Fehr & Peers Synchro 8 Report
Movement SBT SBRLane ConfigurationsVolume (veh/h) 1673 20Sign Control FreeGrade 0%Peak Hour Factor 1.00 1.00Hourly flow rate (vph) 1673 20PedestriansLane Width (ft)Walking Speed (ft/s)Percent BlockageRight turn flare (veh)Median type NoneMedian storage veh)Upstream signal (ft) 294pX, platoon unblockedvC, conflicting volumevC1, stage 1 conf volvC2, stage 2 conf volvCu, unblocked voltC, single (s)tC, 2 stage (s)tF (s)p0 queue free %cM capacity (veh/h)
Direction, Lane #

HCM Unsignalized Intersection Capacity Analysis Children's Hospital 6: Dover Street & 54th Street 2035 PM Plus Phase 2
Fehr & Peers Synchro 8 Report
Movement EBL EBT EBR WBL WBT WBR NBL NBT NBR SBL SBT SBRLane ConfigurationsVolume (veh/h) 10 20 10 10 10 20 10 53 10 10 31 10Sign Control Stop Stop Free FreeGrade 0% 0% 0% 0%Peak Hour Factor 1.00 1.00 1.00 1.00 1.00 1.00 1.00 1.00 1.00 1.00 1.00 1.00Hourly flow rate (vph) 10 20 10 10 10 20 10 53 10 10 31 10Pedestrians 18 12 9 5Lane Width (ft) 12.0 12.0 12.0 12.0Walking Speed (ft/s) 4.0 4.0 4.0 4.0Percent Blockage 1 1 1 0Right turn flare (veh)Median type None NoneMedian storage veh)Upstream signal (ft)pX, platoon unblockedvC, conflicting volume 182 169 63 175 169 75 59 75vC1, stage 1 conf volvC2, stage 2 conf volvCu, unblocked vol 182 169 63 175 169 75 59 75tC, single (s) 7.1 6.5 6.2 7.1 6.5 6.2 4.1 4.1tC, 2 stage (s)tF (s) 3.5 4.0 3.3 3.5 4.0 3.3 2.2 2.2p0 queue free % 99 97 99 99 99 98 99 99cM capacity (veh/h) 724 700 985 732 700 978 1534 1522
Direction, Lane # EB 1 WB 1 NB 1 SB 1Volume Total 40 40 73 51Volume Left 10 10 10 10Volume Right 10 20 10 10cSH 761 827 1534 1522Volume to Capacity 0.05 0.05 0.01 0.01Queue Length 95th (ft) 4 4 0 0Control Delay (s) 10.0 9.6 1.1 1.5Lane LOS A A A AApproach Delay (s) 10.0 9.6 1.1 1.5Approach LOS A A
Intersection SummaryAverage Delay 4.6Intersection Capacity Utilization 21.1% ICU Level of Service AAnalysis Period (min) 15
HCM Unsignalized Intersection Capacity Analysis Children's Hospital 7: Shattuck Ave & 54th Street 2035 PM Plus Phase 2
Fehr & Peers Synchro 8 Report
Movement EBL EBR NBL NBT SBT SBRLane ConfigurationsVolume (veh/h) 10 20 20 773 701 10Sign Control Stop Free FreeGrade 0% 0% 0%Peak Hour Factor 1.00 1.00 1.00 1.00 1.00 1.00Hourly flow rate (vph) 10 20 20 773 701 10Pedestrians 38 2Lane Width (ft) 12.0 12.0Walking Speed (ft/s) 4.0 4.0Percent Blockage 3 0Right turn flare (veh)Median type None NoneMedian storage veh)Upstream signal (ft) 550 282pX, platoon unblocked 0.81 0.74 0.74vC, conflicting volume 1559 744 749vC1, stage 1 conf volvC2, stage 2 conf volvCu, unblocked vol 1173 477 484tC, single (s) 6.4 6.2 4.1tC, 2 stage (s)tF (s) 3.5 3.3 2.2p0 queue free % 94 95 97cM capacity (veh/h) 164 424 772
Direction, Lane # EB 1 NB 1 SB 1Volume Total 30 793 711Volume Left 10 20 0Volume Right 20 0 10cSH 277 772 1700Volume to Capacity 0.11 0.03 0.42Queue Length 95th (ft) 9 2 0Control Delay (s) 19.6 0.7 0.0Lane LOS C AApproach Delay (s) 19.6 0.7 0.0Approach LOS C
Intersection SummaryAverage Delay 0.7Intersection Capacity Utilization 66.8% ICU Level of Service CAnalysis Period (min) 15

HCM Signalized Intersection Capacity Analysis Children's Hospital 8: MLK Way & 53rd Street 2035 PM Plus Phase 2
Fehr & Peers Synchro 8 Report
Movement EBL EBT EBR WBL WBT WBR NBU NBL NBT NBR SBL SBTLane ConfigurationsVolume (vph) 10 10 60 40 10 10 10 10 2183 59 30 1736Ideal Flow (vphpl) 1900 1900 1900 1900 1900 1900 1900 1900 1900 1900 1900 1900Total Lost time (s) 5.0 5.0 4.0 3.5 4.0 3.5Lane Util. Factor 1.00 1.00 1.00 0.91 1.00 0.91Frpb, ped/bikes 0.98 1.00 1.00 1.00 1.00 1.00Flpb, ped/bikes 1.00 1.00 1.00 1.00 1.00 1.00Frt 0.90 0.98 1.00 1.00 1.00 1.00Flt Protected 0.99 0.97 0.95 1.00 0.95 1.00Satd. Flow (prot) 1632 1785 1770 5043 1787 5129Flt Permitted 0.97 0.82 0.95 1.00 0.95 1.00Satd. Flow (perm) 1585 1510 1770 5043 1787 5129Peak-hour factor, PHF 1.00 1.00 1.00 1.00 1.00 1.00 1.00 1.00 1.00 1.00 1.00 1.00Adj. Flow (vph) 10 10 60 40 10 10 10 10 2183 59 30 1736RTOR Reduction (vph) 0 50 0 0 8 0 0 0 2 0 0 0Lane Group Flow (vph) 0 30 0 0 52 0 0 20 2240 0 30 1746Confl. Peds. (#/hr) 12 6 6 12 48Confl. Bikes (#/hr) 6 3 20Heavy Vehicles (%) 2% 2% 2% 0% 0% 0% 2% 2% 2% 2% 1% 1%Turn Type Perm NA Perm NA Prot Prot NA Prot NAProtected Phases 4 8 5 5 2 1 6Permitted Phases 4 8Actuated Green, G (s) 16.4 16.4 3.1 64.7 6.4 68.0Effective Green, g (s) 16.4 16.4 3.1 64.7 6.4 68.0Actuated g/C Ratio 0.16 0.16 0.03 0.65 0.06 0.68Clearance Time (s) 5.0 5.0 4.0 3.5 4.0 3.5Vehicle Extension (s) 3.0 3.0 3.0 3.0 3.0 3.0Lane Grp Cap (vph) 259 247 54 3262 114 3487v/s Ratio Prot 0.01 c0.44 0.02 c0.34v/s Ratio Perm 0.02 c0.03v/c Ratio 0.12 0.21 0.37 0.69 0.26 0.50Uniform Delay, d1 35.6 36.2 47.5 11.2 44.6 7.8Progression Factor 1.00 1.04 1.41 0.18 0.75 0.50Incremental Delay, d2 0.2 0.4 2.1 0.6 0.6 0.3Delay (s) 35.8 38.1 69.3 2.6 34.2 4.2Level of Service D D E A C AApproach Delay (s) 35.8 38.1 3.2 4.7Approach LOS D D A A
Intersection SummaryHCM 2000 Control Delay 4.9 HCM 2000 Level of Service AHCM 2000 Volume to Capacity ratio 0.60Actuated Cycle Length (s) 100.0 Sum of lost time (s) 12.5Intersection Capacity Utilization 68.9% ICU Level of Service CAnalysis Period (min) 15c Critical Lane Group
HCM Signalized Intersection Capacity Analysis Children's Hospital 8: MLK Way & 53rd Street 2035 PM Plus Phase 2
Fehr & Peers Synchro 8 Report
Movement SBRLane ConfigurationsVolume (vph) 10Ideal Flow (vphpl) 1900Total Lost time (s)Lane Util. FactorFrpb, ped/bikesFlpb, ped/bikesFrtFlt ProtectedSatd. Flow (prot)Flt PermittedSatd. Flow (perm)Peak-hour factor, PHF 1.00Adj. Flow (vph) 10RTOR Reduction (vph) 0Lane Group Flow (vph) 0Confl. Peds. (#/hr) 21Confl. Bikes (#/hr) 24Heavy Vehicles (%) 1%Turn TypeProtected PhasesPermitted PhasesActuated Green, G (s)Effective Green, g (s)Actuated g/C RatioClearance Time (s)Vehicle Extension (s)Lane Grp Cap (vph)v/s Ratio Protv/s Ratio Permv/c RatioUniform Delay, d1Progression FactorIncremental Delay, d2Delay (s)Level of ServiceApproach Delay (s)Approach LOS
Intersection Summary

HCM Unsignalized Intersection Capacity Analysis Children's Hospital 9: Dover Street & 53rd Street 2035 PM Plus Phase 2
Fehr & Peers Synchro 8 Report
Movement EBL EBT EBR WBL WBT WBR NBL NBT NBR SBL SBT SBRLane ConfigurationsVolume (veh/h) 20 10 59 10 10 10 10 53 10 10 31 10Sign Control Stop Stop Free FreeGrade 0% 0% 0% 0%Peak Hour Factor 1.00 1.00 1.00 1.00 1.00 1.00 1.00 1.00 1.00 1.00 1.00 1.00Hourly flow rate (vph) 20 10 59 10 10 10 10 53 10 10 31 10Pedestrians 38 15 6 6Lane Width (ft) 12.0 12.0 12.0 12.0Walking Speed (ft/s) 4.0 4.0 4.0 4.0Percent Blockage 3 1 1 1Right turn flare (veh)Median type None NoneMedian storage veh)Upstream signal (ft)pX, platoon unblockedvC, conflicting volume 193 192 80 219 192 79 79 78vC1, stage 1 conf volvC2, stage 2 conf volvCu, unblocked vol 193 192 80 219 192 79 79 78tC, single (s) 7.1 6.5 6.2 7.1 6.5 6.2 4.1 4.1tC, 2 stage (s)tF (s) 3.5 4.0 3.3 3.5 4.0 3.3 2.2 2.2p0 queue free % 97 99 94 98 99 99 99 99cM capacity (veh/h) 695 667 950 646 667 970 1483 1514
Direction, Lane # EB 1 WB 1 NB 1 SB 1Volume Total 89 30 73 51Volume Left 20 10 10 10Volume Right 59 10 10 10cSH 841 736 1483 1514Volume to Capacity 0.11 0.04 0.01 0.01Queue Length 95th (ft) 9 3 1 0Control Delay (s) 9.8 10.1 1.1 1.5Lane LOS A B A AApproach Delay (s) 9.8 10.1 1.1 1.5Approach LOS A B
Intersection SummaryAverage Delay 5.5Intersection Capacity Utilization 25.4% ICU Level of Service AAnalysis Period (min) 15
HCM Signalized Intersection Capacity Analysis Children's Hospital 10: MLK Way & 52nd Street 2035 PM Plus Phase 2
Fehr & Peers Synchro 8 Report
Movement EBL EBT EBR WBL WBT WBR NBU NBL NBT NBR SBU SBLLane ConfigurationsVolume (vph) 81 140 110 173 103 237 60 120 1853 120 3 161Ideal Flow (vphpl) 1900 1900 1900 1900 1900 1900 1900 1900 1900 1900 1900 1900Total Lost time (s) 5.0 5.0 5.0 5.0 4.5 4.5 4.0Lane Util. Factor 1.00 1.00 1.00 1.00 1.00 0.91 1.00Frpb, ped/bikes 1.00 0.95 1.00 0.96 1.00 1.00 1.00Flpb, ped/bikes 0.99 1.00 0.96 1.00 1.00 1.00 1.00Frt 1.00 0.93 1.00 0.85 1.00 0.99 1.00Flt Protected 0.95 1.00 0.97 1.00 0.95 1.00 0.95Satd. Flow (prot) 1762 1673 1742 1522 1787 5064 1787Flt Permitted 0.44 1.00 0.53 1.00 0.95 1.00 0.95Satd. Flow (perm) 813 1673 949 1522 1787 5064 1787Peak-hour factor, PHF 1.00 1.00 1.00 1.00 1.00 1.00 1.00 1.00 1.00 1.00 1.00 1.00Adj. Flow (vph) 81 140 110 173 103 237 60 120 1853 120 3 161RTOR Reduction (vph) 0 29 0 0 0 166 0 0 7 0 0 0Lane Group Flow (vph) 81 221 0 0 276 71 0 180 1966 0 0 164Confl. Peds. (#/hr) 24 92 92 24 15Confl. Bikes (#/hr) 14 6 23Heavy Vehicles (%) 1% 1% 1% 2% 2% 2% 1% 1% 1% 1% 1% 1%Turn Type Perm NA Perm NA Perm Prot Prot NA Prot ProtProtected Phases 4 8 5 5 2 1 1Permitted Phases 4 8 8Actuated Green, G (s) 29.9 29.9 29.9 29.9 13.6 39.1 17.5Effective Green, g (s) 29.9 29.9 29.9 29.9 13.6 39.1 17.5Actuated g/C Ratio 0.30 0.30 0.30 0.30 0.14 0.39 0.18Clearance Time (s) 5.0 5.0 5.0 5.0 4.5 4.5 4.0Vehicle Extension (s) 2.0 2.0 2.0 2.0 2.0 2.0 2.0Lane Grp Cap (vph) 243 500 283 455 243 1980 312v/s Ratio Prot 0.13 0.10 c0.39 0.09v/s Ratio Perm 0.10 c0.29 0.05v/c Ratio 0.33 0.44 0.98 0.16 0.74 0.99 0.53Uniform Delay, d1 27.3 28.3 34.7 25.8 41.5 30.3 37.5Progression Factor 1.00 1.00 0.74 1.91 0.96 1.06 0.51Incremental Delay, d2 0.3 0.2 43.4 0.1 2.8 8.9 0.7Delay (s) 27.6 28.5 69.1 49.3 42.6 41.0 19.8Level of Service C C E D D D BApproach Delay (s) 28.3 59.9 41.2Approach LOS C E D
Intersection SummaryHCM 2000 Control Delay 30.8 HCM 2000 Level of Service CHCM 2000 Volume to Capacity ratio 0.96Actuated Cycle Length (s) 100.0 Sum of lost time (s) 14.0Intersection Capacity Utilization 110.3% ICU Level of Service HAnalysis Period (min) 15c Critical Lane Group

HCM Signalized Intersection Capacity Analysis Children's Hospital 10: MLK Way & 52nd Street 2035 PM Plus Phase 2
Fehr & Peers Synchro 8 Report
Movement SBT SBRLane ConfigurationsVolume (vph) 1672 0Ideal Flow (vphpl) 1900 1900Total Lost time (s) 4.5Lane Util. Factor 0.91Frpb, ped/bikes 1.00Flpb, ped/bikes 1.00Frt 1.00Flt Protected 1.00Satd. Flow (prot) 5136Flt Permitted 1.00Satd. Flow (perm) 5136Peak-hour factor, PHF 1.00 1.00Adj. Flow (vph) 1672 0RTOR Reduction (vph) 0 0Lane Group Flow (vph) 1672 0Confl. Peds. (#/hr) 20Confl. Bikes (#/hr) 26Heavy Vehicles (%) 1% 1%Turn Type NAProtected Phases 6Permitted PhasesActuated Green, G (s) 42.5Effective Green, g (s) 42.5Actuated g/C Ratio 0.42Clearance Time (s) 4.5Vehicle Extension (s) 2.0Lane Grp Cap (vph) 2182v/s Ratio Prot c0.33v/s Ratio Permv/c Ratio 0.77Uniform Delay, d1 24.5Progression Factor 0.32Incremental Delay, d2 2.4Delay (s) 10.2Level of Service BApproach Delay (s) 11.0Approach LOS B
Intersection Summary
HCM Signalized Intersection Capacity Analysis Children's Hospital 11: 52nd Street & Garage 2035 PM Plus Phase 2
Fehr & Peers Synchro 8 Report
Movement EBL EBT EBR WBL WBT WBR NBL NBT NBR SBL SBT SBRLane ConfigurationsVolume (vph) 3 408 2 5 430 2 12 1 7 0 4 59Ideal Flow (vphpl) 1900 1900 1900 1900 1900 1900 1900 1900 1900 1900 1900 1900Total Lost time (s) 3.0 3.0 3.0 3.0Lane Util. Factor 1.00 1.00 1.00 1.00Frpb, ped/bikes 1.00 1.00 0.93 0.99Flpb, ped/bikes 1.00 1.00 1.00 1.00Frt 1.00 1.00 0.95 0.87Flt Protected 1.00 1.00 0.97 1.00Satd. Flow (prot) 1859 1896 1403 1640Flt Permitted 1.00 1.00 0.92 1.00Satd. Flow (perm) 1856 1890 1326 1640Peak-hour factor, PHF 1.00 1.00 1.00 1.00 1.00 1.00 1.00 1.00 1.00 1.00 1.00 1.00Adj. Flow (vph) 3 408 2 5 430 2 12 1 7 0 4 59RTOR Reduction (vph) 0 1 0 0 1 0 0 4 0 0 32 0Lane Group Flow (vph) 0 412 0 0 436 0 0 16 0 0 31 0Confl. Peds. (#/hr) 89 89 38 312 312Confl. Bikes (#/hr) 15 9 2Heavy Vehicles (%) 2% 2% 2% 0% 0% 0% 16% 16% 16% 0% 0% 0%Turn Type Perm NA Perm NA Perm NA NAProtected Phases 2 6 4 8Permitted Phases 2 6 4 8Actuated Green, G (s) 21.0 21.0 23.0 23.0Effective Green, g (s) 21.0 21.0 23.0 23.0Actuated g/C Ratio 0.42 0.42 0.46 0.46Clearance Time (s) 3.0 3.0 3.0 3.0Lane Grp Cap (vph) 779 793 609 754v/s Ratio Prot c0.02v/s Ratio Perm 0.22 c0.23 0.01v/c Ratio 0.53 0.55 0.03 0.04Uniform Delay, d1 10.8 10.9 7.4 7.4Progression Factor 1.48 1.00 1.00 1.00Incremental Delay, d2 2.0 2.7 0.1 0.1Delay (s) 18.0 13.7 7.5 7.5Level of Service B B A AApproach Delay (s) 18.0 13.7 7.5 7.5Approach LOS B B A A
Intersection SummaryHCM 2000 Control Delay 15.0 HCM 2000 Level of Service BHCM 2000 Volume to Capacity ratio 0.28Actuated Cycle Length (s) 50.0 Sum of lost time (s) 6.0Intersection Capacity Utilization 51.9% ICU Level of Service AAnalysis Period (min) 15c Critical Lane Group

HCM Unsignalized Intersection Capacity Analysis Children's Hospital 12: 52nd Street & Dover Street 2035 PM Plus Phase 2
Fehr & Peers Synchro 8 Report
Movement EBL EBT EBR WBL WBT WBR NBL NBT NBR SBL SBT SBRLane ConfigurationsVolume (veh/h) 30 351 45 20 356 40 70 5 47 71 2 28Sign Control Free Free Stop StopGrade 0% 0% 0% 0%Peak Hour Factor 1.00 1.00 1.00 1.00 1.00 1.00 1.00 1.00 1.00 1.00 1.00 1.00Hourly flow rate (vph) 30 351 45 20 356 40 70 5 47 71 2 28Pedestrians 56 11 53 23Lane Width (ft) 12.0 12.0 12.0 12.0Walking Speed (ft/s) 4.0 4.0 4.0 4.0Percent Blockage 5 1 4 2Right turn flare (veh)Median type None NoneMedian storage veh)Upstream signal (ft) 312 647pX, platoon unblocked 0.86 0.83 0.90 0.90 0.83 0.90 0.90 0.86vC, conflicting volume 419 449 988 946 438 933 948 455vC1, stage 1 conf volvC2, stage 2 conf volvCu, unblocked vol 247 237 588 542 223 528 544 289tC, single (s) 4.1 4.1 7.2 6.6 6.3 7.1 6.5 6.2tC, 2 stage (s)tF (s) 2.2 2.2 3.6 4.1 3.4 3.5 4.0 3.3p0 queue free % 97 98 76 99 93 79 99 95cM capacity (veh/h) 1111 1063 293 352 628 342 362 609
Direction, Lane # EB 1 WB 1 NB 1 SB 1Volume Total 426 416 122 101Volume Left 30 20 70 71Volume Right 45 40 47 28cSH 1111 1063 372 390Volume to Capacity 0.03 0.02 0.33 0.26Queue Length 95th (ft) 2 1 35 25Control Delay (s) 0.9 0.6 19.3 17.4Lane LOS A A C CApproach Delay (s) 0.9 0.6 19.3 17.4Approach LOS C C
Intersection SummaryAverage Delay 4.4Intersection Capacity Utilization 51.6% ICU Level of Service AAnalysis Period (min) 15
HCM Unsignalized Intersection Capacity Analysis Children's Hospital 13: SR-24 NB Off-Ramp & 52nd Street 2035 PM Plus Phase 2
Fehr & Peers Synchro 8 Report
Movement EBL EBT EBR WBL WBT WBR NBL NBR SEL SERLane ConfigurationsVolume (veh/h) 0 471 0 0 421 1150 0 1140 0 0Sign Control Free Free Stop StopGrade 0% 0% 0% 0%Peak Hour Factor 1.00 1.00 1.00 1.00 1.00 1.00 1.00 1.00 1.00 1.00Hourly flow rate (vph) 0 471 0 0 421 1150 0 1140 0 0Pedestrians 50Lane Width (ft) 12.0Walking Speed (ft/s) 4.0Percent Blockage 4Right turn flare (veh)Median type None NoneMedian storage veh)Upstream signal (ft) 767 192pX, platoon unblocked 0.79 0.79 0.79 0.79vC, conflicting volume 1571 521 2092 286 1796 942vC1, stage 1 conf volvC2, stage 2 conf volvCu, unblocked vol 1182 521 1845 286 1469 381tC, single (s) 4.1 4.1 6.5 7.0 7.5 6.5tC, 2 stage (s)tF (s) 2.2 2.2 4.0 3.3 3.5 4.0p0 queue free % 100 100 100 0 0 100cM capacity (veh/h) 461 998 56 679 0 414
Direction, Lane # EB 1 EB 2 WB 1 WB 2 WB 3 NB 1 NB 2Volume Total 236 236 281 524 767 570 570Volume Left 0 0 0 0 0 0 0Volume Right 0 0 0 383 767 570 570cSH 1700 1700 1700 1700 1700 679 679Volume to Capacity 0.14 0.14 0.17 0.31 0.45 0.84 0.84Queue Length 95th (ft) 0 0 0 0 0 233 233Control Delay (s) 0.0 0.0 0.0 0.0 0.0 31.7 31.7Lane LOS D DApproach Delay (s) 0.0 0.0 31.7Approach LOS D
Intersection SummaryAverage Delay 11.4Intersection Capacity Utilization 59.8% ICU Level of Service BAnalysis Period (min) 15

HCM Signalized Intersection Capacity Analysis Children's Hospital 14: 52nd Street & Shattuck Ave 2035 PM Plus Phase 2
Fehr & Peers Synchro 8 Report
Movement EBU EBL EBT EBR WBL WBT WBR NBL NBT NBR SBL SBTLane ConfigurationsVolume (vph) 50 353 1008 200 90 970 180 170 290 100 170 170Ideal Flow (vphpl) 1900 1900 1900 1900 1900 1900 1900 1900 1900 1900 1900 1900Total Lost time (s) 4.0 4.5 4.0 4.5 4.0 5.5 5.5Lane Util. Factor 1.00 0.91 1.00 0.91 1.00 1.00 1.00Frpb, ped/bikes 1.00 0.98 1.00 0.99 1.00 0.98 1.00Flpb, ped/bikes 1.00 1.00 1.00 1.00 1.00 1.00 0.99Frt 1.00 0.98 1.00 0.98 1.00 0.96 1.00Flt Protected 0.95 1.00 0.95 1.00 0.95 1.00 0.98Satd. Flow (prot) 1787 4924 1805 4993 1752 1737 1714Flt Permitted 0.95 1.00 0.95 1.00 0.24 1.00 0.52Satd. Flow (perm) 1787 4924 1805 4993 436 1737 921Peak-hour factor, PHF 1.00 1.00 1.00 1.00 1.00 1.00 1.00 1.00 1.00 1.00 1.00 1.00Adj. Flow (vph) 50 353 1008 200 90 970 180 170 290 100 170 170RTOR Reduction (vph) 0 0 27 0 0 24 0 0 11 0 0 0Lane Group Flow (vph) 0 403 1181 0 90 1126 0 170 379 0 0 340Confl. Peds. (#/hr) 21 21 17 33 33Confl. Bikes (#/hr) 20 12 45Heavy Vehicles (%) 1% 1% 1% 1% 0% 0% 0% 3% 3% 3% 7% 7%Turn Type Prot Prot NA Prot NA pm+pt NA Perm NAProtected Phases 7 7 4 3 8 5 2 6Permitted Phases 2 6Actuated Green, G (s) 33.5 53.0 6.5 26.0 36.5 36.5 27.0Effective Green, g (s) 33.5 53.0 6.5 26.0 36.5 36.5 27.0Actuated g/C Ratio 0.30 0.48 0.06 0.24 0.33 0.33 0.25Clearance Time (s) 4.0 4.5 4.0 4.5 4.0 5.5 5.5Vehicle Extension (s) 3.0 3.0 3.0 3.0 3.0 3.0 3.0Lane Grp Cap (vph) 544 2372 106 1180 210 576 226v/s Ratio Prot c0.23 0.24 0.05 c0.23 c0.04 0.22v/s Ratio Perm 0.23 c0.37v/c Ratio 0.74 0.50 0.85 0.95 0.81 0.66 1.50Uniform Delay, d1 34.4 19.4 51.3 41.4 33.5 31.4 41.5Progression Factor 1.00 1.00 1.00 1.00 1.00 1.00 1.00Incremental Delay, d2 8.8 0.8 43.4 17.2 20.1 5.8 248.7Delay (s) 43.1 20.2 94.6 58.6 53.5 37.2 290.2Level of Service D C F E D D FApproach Delay (s) 25.9 61.3 42.1 155.6Approach LOS C E D F
Intersection SummaryHCM 2000 Control Delay 61.4 HCM 2000 Level of Service EHCM 2000 Volume to Capacity ratio 1.03Actuated Cycle Length (s) 110.0 Sum of lost time (s) 18.0Intersection Capacity Utilization 110.2% ICU Level of Service HAnalysis Period (min) 15c Critical Lane Group
HCM Signalized Intersection Capacity Analysis Children's Hospital 14: 52nd Street & Shattuck Ave 2035 PM Plus Phase 2
Fehr & Peers Synchro 8 Report
Movement SBRLane ConfigurationsVolume (vph) 381Ideal Flow (vphpl) 1900Total Lost time (s) 5.5Lane Util. Factor 1.00Frpb, ped/bikes 0.92Flpb, ped/bikes 1.00Frt 0.85Flt Protected 1.00Satd. Flow (prot) 1389Flt Permitted 1.00Satd. Flow (perm) 1389Peak-hour factor, PHF 1.00Adj. Flow (vph) 381RTOR Reduction (vph) 287Lane Group Flow (vph) 94Confl. Peds. (#/hr) 27Confl. Bikes (#/hr) 41Heavy Vehicles (%) 7%Turn Type PermProtected PhasesPermitted Phases 6Actuated Green, G (s) 27.0Effective Green, g (s) 27.0Actuated g/C Ratio 0.25Clearance Time (s) 5.5Vehicle Extension (s) 3.0Lane Grp Cap (vph) 340v/s Ratio Protv/s Ratio Perm 0.07v/c Ratio 0.28Uniform Delay, d1 33.6Progression Factor 1.00Incremental Delay, d2 2.0Delay (s) 35.6Level of Service DApproach Delay (s)Approach LOS
Intersection Summary

HCM Signalized Intersection Capacity Analysis Children's Hospital 15: Telegraph Ave & 52nd Street/Claremont Ave 2035 PM Plus Phase 2
Fehr & Peers Synchro 8 Report
Movement EBL EBT EBR WBL WBT WBR NBL NBT NBR SBL SBT SBRLane ConfigurationsVolume (vph) 20 20 20 210 90 200 30 1196 340 200 831 326Ideal Flow (vphpl) 1900 1900 1900 1900 1900 1900 1900 1900 1900 1900 1900 1900Lane Width 12 12 12 12 12 12 12 16 12 12 12 12Total Lost time (s) 4.5 4.5 4.5 4.5 4.5 4.5Lane Util. Factor 1.00 0.95 0.95 0.95 1.00 0.95Frpb, ped/bikes 0.99 1.00 0.94 0.98 1.00 0.91Flpb, ped/bikes 1.00 1.00 1.00 1.00 1.00 1.00Frt 0.95 1.00 0.90 0.97 1.00 0.96Flt Protected 0.98 0.95 1.00 1.00 0.95 1.00Satd. Flow (prot) 1642 1698 1508 3759 1770 3068Flt Permitted 0.98 0.95 1.00 0.90 0.95 1.00Satd. Flow (perm) 1642 1698 1508 3405 1770 3068Peak-hour factor, PHF 1.00 1.00 1.00 1.00 1.00 1.00 1.00 1.00 1.00 1.00 1.00 1.00Adj. Flow (vph) 20 20 20 210 90 200 30 1196 340 200 831 326RTOR Reduction (vph) 0 19 0 0 68 0 0 23 0 0 37 0Lane Group Flow (vph) 0 41 0 189 243 0 0 1543 0 200 1120 0Confl. Peds. (#/hr) 51 51 105 33 105Confl. Bikes (#/hr) 2 15 53 72Heavy Vehicles (%) 8% 8% 8% 1% 1% 1% 3% 3% 3% 2% 2% 2%Turn Type Split NA Split NA Perm NA Prot NAProtected Phases 4 4 8 8 2 1 6Permitted Phases 2Actuated Green, G (s) 6.2 19.6 19.6 43.0 13.2 60.7Effective Green, g (s) 6.2 19.6 19.6 43.0 13.2 60.7Actuated g/C Ratio 0.06 0.20 0.20 0.43 0.13 0.61Clearance Time (s) 4.5 4.5 4.5 4.5 4.5 4.5Vehicle Extension (s) 3.0 3.0 3.0 3.0 3.0 3.0Lane Grp Cap (vph) 101 332 295 1464 233 1862v/s Ratio Prot c0.03 0.11 c0.16 c0.11 0.37v/s Ratio Perm c0.45v/c Ratio 0.41 0.57 0.83 1.05 0.86 0.60Uniform Delay, d1 45.1 36.4 38.6 28.5 42.5 12.2Progression Factor 1.80 1.00 1.00 0.50 1.00 1.00Incremental Delay, d2 0.8 2.2 16.9 30.6 25.4 1.4Delay (s) 82.0 38.6 55.5 44.7 67.9 13.6Level of Service F D E D E BApproach Delay (s) 82.0 49.1 44.7 21.6Approach LOS F D D C
Intersection SummaryHCM 2000 Control Delay 37.0 HCM 2000 Level of Service DHCM 2000 Volume to Capacity ratio 0.92Actuated Cycle Length (s) 100.0 Sum of lost time (s) 18.0Intersection Capacity Utilization 114.0% ICU Level of Service HAnalysis Period (min) 15c Critical Lane Group
HCM Signalized Intersection Capacity Analysis Children's Hospital 16: Telegraph Ave & 51St Street 2035 PM Plus Phase 2
Fehr & Peers Synchro 8 Report
Movement EBL EBT EBR WBL WBT WBR NBL NBT NBR SBL SBT SBRLane ConfigurationsVolume (vph) 346 754 118 80 581 240 123 980 190 310 681 70Ideal Flow (vphpl) 1900 1900 1900 1900 1900 1900 1900 1900 1900 1900 1900 1900Total Lost time (s) 4.0 4.0 4.0 3.5 4.0 4.5 4.0 3.5Lane Util. Factor 0.97 0.95 1.00 0.95 1.00 0.95 1.00 0.95Frpb, ped/bikes 1.00 0.98 1.00 0.97 1.00 0.97 1.00 0.97Flpb, ped/bikes 1.00 1.00 1.00 1.00 1.00 1.00 1.00 1.00Frt 1.00 0.98 1.00 0.96 1.00 0.98 1.00 0.99Flt Protected 0.95 1.00 0.95 1.00 0.95 1.00 0.95 1.00Satd. Flow (prot) 3400 3374 1787 3307 1719 3270 1752 3362Flt Permitted 0.95 1.00 0.95 1.00 0.95 1.00 0.95 1.00Satd. Flow (perm) 3400 3374 1787 3307 1719 3270 1752 3362Peak-hour factor, PHF 1.00 1.00 1.00 1.00 1.00 1.00 1.00 1.00 1.00 1.00 1.00 1.00Adj. Flow (vph) 346 754 118 80 581 240 123 980 190 310 681 70RTOR Reduction (vph) 0 12 0 0 44 0 0 15 0 0 8 0Lane Group Flow (vph) 346 860 0 80 777 0 123 1155 0 310 743 0Confl. Peds. (#/hr) 78 57 86 138Confl. Bikes (#/hr) 12 23 51 81Heavy Vehicles (%) 3% 3% 3% 1% 1% 1% 5% 5% 5% 3% 3% 3%Turn Type Prot NA Prot NA Prot NA Prot NAProtected Phases 7 4 3 8 5 2 1 6Permitted PhasesActuated Green, G (s) 14.9 29.4 8.3 23.3 8.1 32.8 13.0 38.7Effective Green, g (s) 14.9 29.4 8.3 23.3 8.1 32.8 13.0 38.7Actuated g/C Ratio 0.15 0.29 0.08 0.23 0.08 0.33 0.13 0.39Clearance Time (s) 4.0 4.0 4.0 3.5 4.0 4.5 4.0 3.5Vehicle Extension (s) 3.0 3.0 3.0 3.0 3.0 3.0 3.0 3.0Lane Grp Cap (vph) 506 991 148 770 139 1072 227 1301v/s Ratio Prot c0.10 c0.25 0.04 c0.23 0.07 c0.35 c0.18 0.22v/s Ratio Permv/c Ratio 0.68 0.87 0.54 1.01 0.88 1.08 1.37 0.57Uniform Delay, d1 40.3 33.5 44.0 38.4 45.5 33.6 43.5 24.1Progression Factor 1.00 1.00 1.00 1.00 1.00 1.00 1.14 0.72Incremental Delay, d2 3.8 10.2 4.0 34.5 43.7 50.7 186.0 1.5Delay (s) 44.1 43.6 48.0 72.9 89.1 84.3 235.6 18.8Level of Service D D D E F F F BApproach Delay (s) 43.8 70.7 84.8 82.1Approach LOS D E F F
Intersection SummaryHCM 2000 Control Delay 70.1 HCM 2000 Level of Service EHCM 2000 Volume to Capacity ratio 1.04Actuated Cycle Length (s) 100.0 Sum of lost time (s) 16.5Intersection Capacity Utilization 99.8% ICU Level of Service FAnalysis Period (min) 15c Critical Lane Group

HCM Signalized Intersection Capacity Analysis Children's Hospital 17: SB SR-24 On-Ramp & MLK Way & NB SR-24 Off-Ramp 2035 PM Plus Phase 2
Fehr & Peers Synchro 8 Report
Movement EBL EBT EBR WBL WBT WBR NBL NBT NBR SBL SBT SBRLane ConfigurationsVolume (vph) 341 0 0 0 0 1792 0 0 0 0 1792 253Ideal Flow (vphpl) 1900 1900 1900 1900 1900 1900 1900 1900 1900 1900 1900 1900Total Lost time (s) 4.0 4.0 4.0 4.0Lane Util. Factor 0.97 1.00 0.95 0.88Frpb, ped/bikes 1.00 1.00 1.00 1.00Flpb, ped/bikes 1.00 1.00 1.00 1.00Frt 1.00 0.86 1.00 0.85Flt Protected 0.95 1.00 1.00 1.00Satd. Flow (prot) 3273 1627 3574 2814Flt Permitted 0.95 1.00 1.00 1.00Satd. Flow (perm) 3273 1627 3574 2814Peak-hour factor, PHF 1.00 1.00 1.00 1.00 1.00 1.00 1.00 1.00 1.00 1.00 1.00 1.00Adj. Flow (vph) 341 0 0 0 0 1792 0 0 0 0 1792 253RTOR Reduction (vph) 0 0 0 0 0 0 0 0 0 0 0 0Lane Group Flow (vph) 341 0 0 0 0 1792 0 0 0 0 1792 253Confl. Peds. (#/hr) 3Confl. Bikes (#/hr) 14Heavy Vehicles (%) 7% 7% 2% 2% 1% 1% 2% 2% 2% 2% 1% 1%Turn Type Prot Free NA customProtected Phases 2 6 FreePermitted Phases FreeActuated Green, G (s) 13.0 50.0 29.0 50.0Effective Green, g (s) 13.0 50.0 29.0 50.0Actuated g/C Ratio 0.26 1.00 0.58 1.00Clearance Time (s) 4.0 4.0Lane Grp Cap (vph) 850 1627 2072 2814v/s Ratio Prot 0.10 0.50 0.09v/s Ratio Perm c1.10v/c Ratio 0.40 1.10 0.86 0.09Uniform Delay, d1 15.3 25.0 8.8 0.0Progression Factor 1.00 1.00 2.87 1.00Incremental Delay, d2 1.4 55.5 3.4 0.0Delay (s) 16.7 80.5 28.8 0.0Level of Service B F C AApproach Delay (s) 16.7 80.5 0.0 25.3Approach LOS B F A C
Intersection SummaryHCM 2000 Control Delay 48.3 HCM 2000 Level of Service DHCM 2000 Volume to Capacity ratio 1.31Actuated Cycle Length (s) 50.0 Sum of lost time (s) 8.0Intersection Capacity Utilization 65.9% ICU Level of Service CAnalysis Period (min) 15c Critical Lane Group
HCM Unsignalized Intersection Capacity Analysis Children's Hospital 18: West Street & 52nd Street 2035 PM Plus Phase 2
Fehr & Peers Synchro 8 Report
Movement EBL EBT EBR WBL WBT WBR NBL NBT NBR SBL SBT SBRLane ConfigurationsSign Control Stop Stop Stop StopVolume (vph) 0 161 10 100 143 0 60 0 150 10 70 10Peak Hour Factor 1.00 1.00 1.00 1.00 1.00 1.00 1.00 1.00 1.00 1.00 1.00 1.00Hourly flow rate (vph) 0 161 10 100 143 0 60 0 150 10 70 10
Direction, Lane # EB 1 WB 1 NB 1 NB 2 SB 1Volume Total (vph) 171 243 60 150 90Volume Left (vph) 0 100 60 0 10Volume Right (vph) 10 0 0 150 10Hadj (s) -0.02 0.12 0.50 -0.70 -0.01Departure Headway (s) 5.0 5.0 6.2 5.0 5.4Degree Utilization, x 0.24 0.34 0.10 0.21 0.13Capacity (veh/h) 666 675 545 668 604Control Delay (s) 9.5 10.6 8.7 8.1 9.2Approach Delay (s) 9.5 10.6 8.3 9.2Approach LOS A B A A
Intersection SummaryDelay 9.5Level of Service AIntersection Capacity Utilization 46.2% ICU Level of Service AAnalysis Period (min) 15

HCM Unsignalized Intersection Capacity Analysis Children's Hospital 19: Genoa Street & 52nd Street 2035 PM Plus Phase 2
Fehr & Peers Synchro 8 Report
Movement EBL EBT EBR WBL WBT WBR NBL NBT NBR SBL SBT SBRLane ConfigurationsSign Control Stop Stop Stop StopVolume (vph) 10 151 10 20 133 50 10 10 10 20 10 10Peak Hour Factor 1.00 1.00 1.00 1.00 1.00 1.00 1.00 1.00 1.00 1.00 1.00 1.00Hourly flow rate (vph) 10 151 10 20 133 50 10 10 10 20 10 10
Direction, Lane # EB 1 WB 1 NB 1 SB 1Volume Total (vph) 171 203 30 40Volume Left (vph) 10 20 10 20Volume Right (vph) 10 50 10 10Hadj (s) -0.01 -0.13 -0.13 -0.05Departure Headway (s) 4.3 4.1 4.6 4.7Degree Utilization, x 0.20 0.23 0.04 0.05Capacity (veh/h) 821 853 712 699Control Delay (s) 8.4 8.4 7.8 8.0Approach Delay (s) 8.4 8.4 7.8 8.0Approach LOS A A A A
Intersection SummaryDelay 8.3Level of Service AIntersection Capacity Utilization 28.7% ICU Level of Service AAnalysis Period (min) 15
HCM Unsignalized Intersection Capacity Analysis Children's Hospital 20: Genoa Street & 55th Street 2035 PM Plus Phase 2
Fehr & Peers Synchro 8 Report
Movement EBL EBT EBR WBL WBT WBR NBL NBT NBR SBL SBT SBRLane ConfigurationsVolume (veh/h) 20 390 10 20 451 40 10 20 40 40 10 20Sign Control Free Free Stop StopGrade 0% 0% 0% 0%Peak Hour Factor 1.00 1.00 1.00 1.00 1.00 1.00 1.00 1.00 1.00 1.00 1.00 1.00Hourly flow rate (vph) 20 390 10 20 451 40 10 20 40 40 10 20Pedestrians 8 11 5Lane Width (ft) 12.0 12.0 12.0Walking Speed (ft/s) 4.0 4.0 4.0Percent Blockage 1 1 0Right turn flare (veh)Median type None NoneMedian storage veh)Upstream signal (ft) 721pX, platoon unblockedvC, conflicting volume 496 411 990 982 406 1001 967 484vC1, stage 1 conf volvC2, stage 2 conf volvCu, unblocked vol 496 411 990 982 406 1001 967 484tC, single (s) 4.1 4.1 7.1 6.5 6.2 7.1 6.5 6.2tC, 2 stage (s)tF (s) 2.2 2.2 3.5 4.0 3.3 3.5 4.0 3.3p0 queue free % 98 98 95 92 94 79 96 97cM capacity (veh/h) 1069 1148 201 239 643 187 242 577
Direction, Lane # EB 1 WB 1 NB 1 SB 1Volume Total 420 511 70 70Volume Left 20 20 10 40Volume Right 10 40 40 20cSH 1069 1148 358 241Volume to Capacity 0.02 0.02 0.20 0.29Queue Length 95th (ft) 1 1 18 29Control Delay (s) 0.6 0.5 17.5 25.9Lane LOS A A C DApproach Delay (s) 0.6 0.5 17.5 25.9Approach LOS C D
Intersection SummaryAverage Delay 3.3Intersection Capacity Utilization 51.2% ICU Level of Service AAnalysis Period (min) 15

HCM Unsignalized Intersection Capacity Analysis Children's Hospital 21: MLK Way & RIRO Main Garage 2035 PM Plus Phase 2
Fehr & Peers Synchro 8 Report
Movement WBL WBR NBT NBR SBL SBTLane ConfigurationsVolume (veh/h) 0 123 2140 34 0 1846Sign Control Stop Free FreeGrade 0% 0% 0%Peak Hour Factor 1.00 1.00 1.00 1.00 1.00 1.00Hourly flow rate (vph) 0 123 2140 34 0 1846PedestriansLane Width (ft)Walking Speed (ft/s)Percent BlockageRight turn flare (veh)Median type None NoneMedian storage veh)Upstream signal (ft) 154 137pX, platoon unblocked 0.70 0.62 0.62vC, conflicting volume 2772 730 2174vC1, stage 1 conf volvC2, stage 2 conf volvCu, unblocked vol 433 0 734tC, single (s) 6.8 6.9 4.1tC, 2 stage (s)tF (s) 3.5 3.3 2.2p0 queue free % 100 82 100cM capacity (veh/h) 386 670 535
Direction, Lane # WB 1 NB 1 NB 2 NB 3 SB 1 SB 2 SB 3Volume Total 123 856 856 462 615 615 615Volume Left 0 0 0 0 0 0 0Volume Right 123 0 0 34 0 0 0cSH 670 1700 1700 1700 1700 1700 1700Volume to Capacity 0.18 0.50 0.50 0.27 0.36 0.36 0.36Queue Length 95th (ft) 17 0 0 0 0 0 0Control Delay (s) 11.6 0.0 0.0 0.0 0.0 0.0 0.0Lane LOS BApproach Delay (s) 11.6 0.0 0.0Approach LOS B
Intersection SummaryAverage Delay 0.3Intersection Capacity Utilization 56.4% ICU Level of Service BAnalysis Period (min) 15
HCM Unsignalized Intersection Capacity Analysis Children's Hospital 22: MLK Way & RIRO Main Plaza 2035 PM Plus Phase 2
Fehr & Peers Synchro 8 Report
Movement WBL WBR NBT NBR SBL SBTLane ConfigurationsVolume (veh/h) 0 0 2133 0 0 2015Sign Control Stop Free FreeGrade 0% 0% 0%Peak Hour Factor 1.00 1.00 1.00 1.00 1.00 1.00Hourly flow rate (vph) 0 0 2133 0 0 2015PedestriansLane Width (ft)Walking Speed (ft/s)Percent BlockageRight turn flare (veh)Median type None NoneMedian storage veh)Upstream signal (ft) 424 204pX, platoon unblocked 0.72vC, conflicting volume 2805 711 2133vC1, stage 1 conf volvC2, stage 2 conf volvCu, unblocked vol 2149 711 2133tC, single (s) 6.8 6.9 4.1tC, 2 stage (s)tF (s) 3.5 3.3 2.2p0 queue free % 100 100 100cM capacity (veh/h) 30 375 251
Direction, Lane # WB 1 NB 1 NB 2 NB 3 SB 1 SB 2 SB 3Volume Total 0 853 853 427 672 672 672Volume Left 0 0 0 0 0 0 0Volume Right 0 0 0 0 0 0 0cSH 1700 1700 1700 1700 1700 1700 1700Volume to Capacity 0.00 0.50 0.50 0.25 0.40 0.40 0.40Queue Length 95th (ft) 0 0 0 0 0 0 0Control Delay (s) 0.0 0.0 0.0 0.0 0.0 0.0 0.0Lane LOS AApproach Delay (s) 0.0 0.0 0.0Approach LOS A
Intersection SummaryAverage Delay 0.0Intersection Capacity Utilization 44.5% ICU Level of Service AAnalysis Period (min) 15

HCM Unsignalized Intersection Capacity Analysis Children's Hospital 24: 51St Street & 52nd Street 2035 PM Plus Phase 2
Fehr & Peers Synchro 8 Report
Intersection Sign configuration not allowed in HCM analysis.
Appendix L CMP Analysis Calculations

Link Location # Lanes
No Project Volume
With Project Volume
V/C Ratio -No
Project
V/C Ratio -With
Project
No Project
LOS
With Project
LOS
Change from LOS E or better to
LOS F
LOS F and Change in V/C >3%
Freeway SegmentsSR 24 EastboundBetween I-580 MLK Jr. Way 4 6,063 6,065 0.76 0.76 D D No -
Between MLK Jr. Way Claremont Avenue 4 7,528 7,528 0.94 0.94 E E No -
Between Claremont Avenue Broadway 4 7,554 7,556 0.94 0.94 E E No -
Between Broadway SR 13 Ramps 5 8,059 8,061 0.81 0.81 D D No -
Between SR 13 Ramps Caldecott Tunnel 4 9,368 9,370 1.17 1.17 F F - No
SR 24 WestboundBetween Caldecott Tunnel SR 13 Ramps 4 6,427 6,428 0.80 0.80 D D No -
Between SR 13 Ramps Broadway 5 4,730 4,731 0.47 0.47 B B No -
Between Broadway Telegraph Avenue 4 4,280 4,281 0.53 0.54 B B No -
Between Telegraph Avenue I-580 4 4,711 4,719 0.59 0.59 C C No -
I-980 EastboundBetween I-880 12th Street 2 3,429 3,430 0.86 0.86 D D No -
Between 12th Street 27th Street 3 4,325 4,326 0.72 0.72 C C No -
Between 27th Street I-580 5 6,073 6,074 0.61 0.61 C C No -
I-980 WestboundBetween I-580 27th Street 5 4,354 4,355 0.44 0.44 B B No -
Between 27th Street 12th Street 3 3,441 3,442 0.57 0.57 B B No -
Between 12th Street I-880 3 3,788 3,789 0.63 0.63 C C No -
I-580 EastboundBetween I-80/I-580 MacArthur Blvd 4 9,112 9,113 1.14 1.14 F F - No
Between MacArthur Blvd I-980/SR 24 5 8,549 8,550 0.85 0.85 D D No -
Between I-980/SR 24 Oakland Avenue 5 8,648 8,649 0.86 0.86 D D No -
Between Oakland Avenue Grand Avenue 4 9,358 9,359 1.17 1.17 F F - No
Between Grand Avenue Lakeshore Avenue 4 8,497 8,498 1.06 1.06 F F - No
Between Lakeshore Avenue Park Blvd 5 10,059 10,060 1.01 1.01 F F - No
I-580 WestboundBetween Park Blvd Lakeshore Avenue 4 9,302 9,304 1.16 1.16 F F - No
Between Lakeshore Avenue Grand Avenue 4 7,654 7,656 0.96 0.96 E E No -
Between Grand Avenue Oakland Avenue 4 8,502 8,504 1.06 1.06 F F - No
Between Oakland Avenue I-980/SR 24 5 7,744 7,746 0.77 0.77 D D No -Between I-980/SR 24 I-580/I-880 3 4,323 4,325 0.72 0.72 C C No -
ArterialsMartin Luther King Jr. Way NorthboundBetween San Pablo Ave Grand Avenue 2 108 108 0.07 0.07 A A No -
Between Grand Avenue 27th Street 2 7 7 0.00 0.00 A A No -
Between 27th Street MacArthur Blvd 2 61 61 0.04 0.04 A A No -
Between MacArthur Blvd 40th Street 2 2 2 0.00 0.00 A A No -
Between 40th Street SR 24 Ramps 2 19 19 0.01 0.01 A A No -
Betweem SR 24 Ramps 52nd Street 2 1,763 1,765 1.10 1.10 F F - No
Between 52nd Street 55th Street 2 1,928 1,975 1.21 1.23 F F - No
Between 55th Street Adeline Street 2 1,818 1,820 1.14 1.14 F F - No
Between Adeline Street Ashby Avenue 2 1,372 1,374 0.86 0.86 D D No -
Children's HospitalMTS Roadway System Analysis Summary - 2020 PM (Phase 1)
Segment Limits
5/20/2014 Page 1 of 12
Link Location # Lanes
No Project Volume
With Project Volume
V/C Ratio -No
Project
V/C Ratio -With
Project
No Project
LOS
With Project
LOS
Change from LOS E or better to
LOS F
LOS F and Change in V/C >3%
Children's HospitalMTS Roadway System Analysis Summary - 2020 PM (Phase 1)
Segment Limits
Martin Luther King Jr. Way SouthboundBetween Ashby Avenue Adeline Street 2 1,256 1,257 0.79 0.79 D D No -
Between Adeline Street 55th Street 2 1,817 1,818 1.14 1.14 F F - No
Between 55th Street 52nd Street 2 1,918 1,931 1.20 1.21 F F - No
Between 52nd Street SR 24 Ramps 2 1,836 1,844 1.15 1.15 F F - No
Between SR 24 Ramps 40th Street 2 2 3 0.00 0.00 A A No -
Between 40th Street MacArthur Blvd 2 1 2 0.00 0.00 A A No -
Between MacArthur Blvd 27th Street 2 40 41 0.03 0.03 A A No -
Between 27th Street Grand Avenue 2 0 1 0.00 0.00 A A No -
Between Grand Avenue San Pablo Ave 2 58 59 0.04 0.04 A A No -
Shattuck Avenue NorthboundBetween 52nd Street 55th Street 1 705 706 0.88 0.88 D D No -
Between 55th Street Alcatraz Avenue 1 1,016 1,017 1.27 1.27 F F - No
Between Alcatraz Avenue Ashby Avenue 1 1,000 1,001 1.25 1.25 F F - No
Shattuck Avenue SouthboundBetween Ashby Avenue Alcatraz Avenue 1 731 731 0.91 0.91 E E No -
Between Alcatraz Avenue 55th Street 1 990 990 1.24 1.24 F F - No
Between 55th Street 52nd Street 1 939 939 1.17 1.17 F F - No
Telegraph Avenue NorthboundBetween 51st Street Claremont Avenue 3 1,773 1,775 0.74 0.74 C C No -
Between Claremont Avenue SR 24 Ramps 2 2,109 2,113 1.32 1.32 F F - No
Between SR 24 Ramps Alcatraz Avenue 2 2,093 2,094 1.31 1.31 F F - No
Between Alcatraz Avenue Ashby Avenue 2 1,654 1,655 1.03 1.03 F F - No
Telegraph Avenue SouthboundBetween Ashby Avenue Alcatraz Avenue 2 1,830 1,831 1.14 1.14 F F - No
Between Alcatraz Avenue SR 24 Ramps 2 1,852 1,853 1.16 1.16 F F - No
Between SR 24 Ramps Claremont Avenue 2 1,408 1,410 0.88 0.88 D D No -
Between Claremont Avenue 51st Street 3 1,008 1,008 0.42 0.42 B B No -
Stanford Avenue EastboundBetween San Pablo Ave Market Street 2 1,140 1,141 0.71 0.71 C C No -
Between Market Street Adeline Street 2 680 681 0.43 0.43 B B No -
Stanford Avenue WestboundBetween Adeline Street Market Street 2 541 542 0.34 0.34 A A No -
Between Market Street San Pablo Ave 2 603 604 0.38 0.38 B B No -
Adeline Street NorthboundBetween Stanford Street MLK Jr. Way 3 1,392 1,395 0.58 0.58 B B No -
Between MLK Jr. Way Alcatraz Avenue 3 3,020 3,023 1.26 1.26 F F - No
Between Alcatraz Avenue MLK Jr. Way 3 2,875 2,878 1.20 1.20 F F - No
Between MLK Jr. Way Ashby Avenue 3 1,565 1,568 0.65 0.65 C C No -
Between Ashby Avenue Shattuck Avenue 3 1,388 1,391 0.58 0.58 B B No -
Adeline Street SouthboundBetween Shattuck Avenue Ashby Avenue 3 1,565 1,566 0.65 0.65 C C No -
Between Ashby Avenue MLK Jr. Way 3 1,388 1,389 0.58 0.58 B B No -
Between MLK Jr. Way Alcatraz Avenue 3 2,589 2,590 1.08 1.08 F F - No
Between Alcatraz Avenue MLK Jr. Way 3 2,845 2,846 1.19 1.19 F F - No
Between MLK Jr. Way Stanford Street 3 1,215 1,216 0.51 0.51 B B No -
5/20/2014 Page 2 of 12

Link Location # Lanes
No Project Volume
With Project Volume
V/C Ratio -No
Project
V/C Ratio -With
Project
No Project
LOS
With Project
LOS
Change from LOS E or better to
LOS F
LOS F and Change in V/C >3%
Children's HospitalMTS Roadway System Analysis Summary - 2020 PM (Phase 1)
Segment Limits
Claremont Avenue NorthboundBetween Telegraph Avenue SR 24 Ramps 2 517 517 0.32 0.32 A A No -
Between SR 24 Ramps College Avenue 2 1,723 1,723 1.08 1.08 F F - No
Claremont Avenue SouthboundBetween College Avenue SR 24 Ramps 2 1,769 1,769 1.11 1.11 F F - No
Between SR 24 Ramps Telegraph Avenue 2 307 307 0.19 0.19 A A No -
51st Street EastboundBetween Shattuck Avenue Telegraph Avenue 2 676 680 0.42 0.42 B B No -
Between Telegraph Avenue Broadway 2 923 924 0.58 0.58 B B No -
Between Broadway Piedmont Avenue 2 1,047 1,048 0.65 0.65 C C No -
51st Street WestboundBetween Piedmont Avenue Broadway 2 879 879 0.55 0.55 B B No -
Between Broadway Telegraph Avenue 2 942 942 0.59 0.59 C C No -
Between Telegraph Avenue Shattuck Avenue 2 557 559 0.35 0.35 B B No -
52nd Street EastboundBetween MLK Jr. Way SR 24 Ramps 1 203 209 0.25 0.26 A A No -
Between SR 24 Ramps Shattuck Avenue 3 1,565 1,570 0.65 0.65 C C No -
Between Shattuck Avenue Telegraph Avenue 1 655 655 0.82 0.82 D D No -
52nd Street WestboundBetween Telegraph Avenue Shattuck Avenue 1 634 636 0.79 0.80 D D No -
Between Shattuck Avenue SR 24 Ramps 2 1,550 1,552 0.97 0.97 E E No -
Between SR 24 Ramps MLK Jr. Way 1 265 276 0.33 0.34 A A No -Fehr & Peers, 2014.
5/20/2014 Page 3 of 12
Link Location # Lanes
No Project Volume
With Project Volume
V/C Ratio -No
Project
V/C Ratio -With
Project
No Project
LOS
With Project
LOS
Change from LOS E or better to
LOS F
LOS F and Change in V/C >3%
Freeway SegmentsSR 24 EastboundBetween I-580 MLK Jr. Way 4 6,063 6,075 0.76 0.76 D D No -
Between MLK Jr. Way Claremont Avenue 4 7,528 7,528 0.94 0.94 E E No -
Between Claremont Avenue Broadway 4 7,554 7,570 0.94 0.95 E E No -
Between Broadway SR 13 Ramps 5 8,059 8,075 0.81 0.81 D D No -
Between SR 13 Ramps Caldecott Tunnel 4 9,368 9,384 1.17 1.17 F F - No
SR 24 WestboundBetween Caldecott Tunnel SR 13 Ramps 4 6,427 6,432 0.80 0.80 D D No -
Between SR 13 Ramps Broadway 5 4,730 4,735 0.47 0.47 B B No -
Between Broadway Telegraph Avenue 4 4,280 4,285 0.53 0.54 B B No -
Between Telegraph Avenue I-580 4 4,711 4,753 0.59 0.59 C C No -
I-980 EastboundBetween I-880 12th Street 2 3,429 3,433 0.86 0.86 D D No -
Between 12th Street 27th Street 3 4,325 4,329 0.72 0.72 C C No -
Between 27th Street I-580 5 6,073 6,077 0.61 0.61 C C No -
I-980 WestboundBetween I-580 27th Street 5 4,354 4,367 0.44 0.44 B B No -
Between 27th Street 12th Street 3 3,441 3,454 0.57 0.58 B B No -
Between 12th Street I-880 3 3,788 3,801 0.63 0.63 C C No -
I-580 EastboundBetween I-80/I-580 MacArthur Blvd 4 9,112 9,120 1.14 1.14 F F - No
Between MacArthur Blvd I-980/SR 24 5 8,549 8,557 0.85 0.86 D D No -
Between I-980/SR 24 Oakland Avenue 5 8,648 8,656 0.86 0.87 D D No -
Between Oakland Avenue Grand Avenue 4 9,358 9,366 1.17 1.17 F F - No
Between Grand Avenue Lakeshore Avenue 4 8,497 8,505 1.06 1.06 F F - No
Between Lakeshore Avenue Park Blvd 5 10,059 10,067 1.01 1.01 F F - No
I-580 WestboundBetween Park Blvd Lakeshore Avenue 4 9,302 9,327 1.16 1.17 F F - No
Between Lakeshore Avenue Grand Avenue 4 7,654 7,679 0.96 0.96 E E No -
Between Grand Avenue Oakland Avenue 4 8,502 8,527 1.06 1.07 F F - No
Between Oakland Avenue I-980/SR 24 5 7,744 7,769 0.77 0.78 D D No -Between I-980/SR 24 I-580/I-880 3 4,323 4,348 0.72 0.72 C C No -
ArterialsMartin Luther King Jr. Way NorthboundBetween San Pablo Ave Grand Avenue 2 108 109 0.07 0.07 A A No -
Between Grand Avenue 27th Street 2 7 8 0.00 0.01 A A No -
Between 27th Street MacArthur Blvd 2 61 62 0.04 0.04 A A No -
Between MacArthur Blvd 40th Street 2 2 3 0.00 0.00 A A No -
Between 40th Street SR 24 Ramps 2 19 20 0.01 0.01 A A No -
Betweem SR 24 Ramps 52nd Street 2 1,763 1,796 1.10 1.12 F F - No
Between 52nd Street 55th Street 2 1,928 1,986 1.21 1.24 F F - No
Between 55th Street Adeline Street 2 1,818 1,831 1.14 1.14 F F - No
Between Adeline Street Ashby Avenue 2 1,372 1,385 0.86 0.87 D D No -
Children's HospitalMTS Roadway System Analysis Summary - 2020 PM (Phase 2)
Segment Limits
5/20/2014 Page 4 of 12
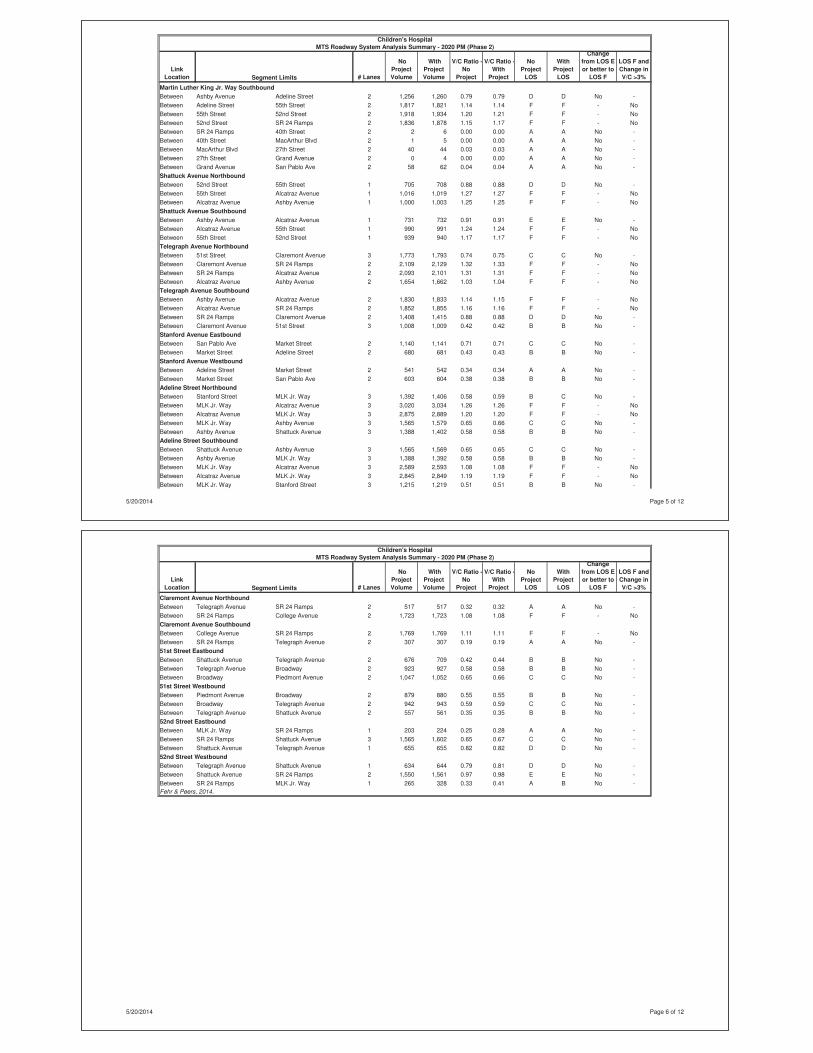
Link Location # Lanes
No Project Volume
With Project Volume
V/C Ratio -No
Project
V/C Ratio -With
Project
No Project
LOS
With Project
LOS
Change from LOS E or better to
LOS F
LOS F and Change in V/C >3%
Children's HospitalMTS Roadway System Analysis Summary - 2020 PM (Phase 2)
Segment Limits
Martin Luther King Jr. Way SouthboundBetween Ashby Avenue Adeline Street 2 1,256 1,260 0.79 0.79 D D No -
Between Adeline Street 55th Street 2 1,817 1,821 1.14 1.14 F F - No
Between 55th Street 52nd Street 2 1,918 1,934 1.20 1.21 F F - No
Between 52nd Street SR 24 Ramps 2 1,836 1,878 1.15 1.17 F F - No
Between SR 24 Ramps 40th Street 2 2 6 0.00 0.00 A A No -
Between 40th Street MacArthur Blvd 2 1 5 0.00 0.00 A A No -
Between MacArthur Blvd 27th Street 2 40 44 0.03 0.03 A A No -
Between 27th Street Grand Avenue 2 0 4 0.00 0.00 A A No -
Between Grand Avenue San Pablo Ave 2 58 62 0.04 0.04 A A No -
Shattuck Avenue NorthboundBetween 52nd Street 55th Street 1 705 708 0.88 0.88 D D No -
Between 55th Street Alcatraz Avenue 1 1,016 1,019 1.27 1.27 F F - No
Between Alcatraz Avenue Ashby Avenue 1 1,000 1,003 1.25 1.25 F F - No
Shattuck Avenue SouthboundBetween Ashby Avenue Alcatraz Avenue 1 731 732 0.91 0.91 E E No -
Between Alcatraz Avenue 55th Street 1 990 991 1.24 1.24 F F - No
Between 55th Street 52nd Street 1 939 940 1.17 1.17 F F - No
Telegraph Avenue NorthboundBetween 51st Street Claremont Avenue 3 1,773 1,793 0.74 0.75 C C No -
Between Claremont Avenue SR 24 Ramps 2 2,109 2,129 1.32 1.33 F F - No
Between SR 24 Ramps Alcatraz Avenue 2 2,093 2,101 1.31 1.31 F F - No
Between Alcatraz Avenue Ashby Avenue 2 1,654 1,662 1.03 1.04 F F - No
Telegraph Avenue SouthboundBetween Ashby Avenue Alcatraz Avenue 2 1,830 1,833 1.14 1.15 F F - No
Between Alcatraz Avenue SR 24 Ramps 2 1,852 1,855 1.16 1.16 F F - No
Between SR 24 Ramps Claremont Avenue 2 1,408 1,415 0.88 0.88 D D No -
Between Claremont Avenue 51st Street 3 1,008 1,009 0.42 0.42 B B No -
Stanford Avenue EastboundBetween San Pablo Ave Market Street 2 1,140 1,141 0.71 0.71 C C No -
Between Market Street Adeline Street 2 680 681 0.43 0.43 B B No -
Stanford Avenue WestboundBetween Adeline Street Market Street 2 541 542 0.34 0.34 A A No -
Between Market Street San Pablo Ave 2 603 604 0.38 0.38 B B No -
Adeline Street NorthboundBetween Stanford Street MLK Jr. Way 3 1,392 1,406 0.58 0.59 B C No -
Between MLK Jr. Way Alcatraz Avenue 3 3,020 3,034 1.26 1.26 F F - No
Between Alcatraz Avenue MLK Jr. Way 3 2,875 2,889 1.20 1.20 F F - No
Between MLK Jr. Way Ashby Avenue 3 1,565 1,579 0.65 0.66 C C No -
Between Ashby Avenue Shattuck Avenue 3 1,388 1,402 0.58 0.58 B B No -
Adeline Street SouthboundBetween Shattuck Avenue Ashby Avenue 3 1,565 1,569 0.65 0.65 C C No -
Between Ashby Avenue MLK Jr. Way 3 1,388 1,392 0.58 0.58 B B No -
Between MLK Jr. Way Alcatraz Avenue 3 2,589 2,593 1.08 1.08 F F - No
Between Alcatraz Avenue MLK Jr. Way 3 2,845 2,849 1.19 1.19 F F - No
Between MLK Jr. Way Stanford Street 3 1,215 1,219 0.51 0.51 B B No -
5/20/2014 Page 5 of 12
Link Location # Lanes
No Project Volume
With Project Volume
V/C Ratio -No
Project
V/C Ratio -With
Project
No Project
LOS
With Project
LOS
Change from LOS E or better to
LOS F
LOS F and Change in V/C >3%
Children's HospitalMTS Roadway System Analysis Summary - 2020 PM (Phase 2)
Segment Limits
Claremont Avenue NorthboundBetween Telegraph Avenue SR 24 Ramps 2 517 517 0.32 0.32 A A No -
Between SR 24 Ramps College Avenue 2 1,723 1,723 1.08 1.08 F F - No
Claremont Avenue SouthboundBetween College Avenue SR 24 Ramps 2 1,769 1,769 1.11 1.11 F F - No
Between SR 24 Ramps Telegraph Avenue 2 307 307 0.19 0.19 A A No -
51st Street EastboundBetween Shattuck Avenue Telegraph Avenue 2 676 709 0.42 0.44 B B No -
Between Telegraph Avenue Broadway 2 923 927 0.58 0.58 B B No -
Between Broadway Piedmont Avenue 2 1,047 1,052 0.65 0.66 C C No -
51st Street WestboundBetween Piedmont Avenue Broadway 2 879 880 0.55 0.55 B B No -
Between Broadway Telegraph Avenue 2 942 943 0.59 0.59 C C No -
Between Telegraph Avenue Shattuck Avenue 2 557 561 0.35 0.35 B B No -
52nd Street EastboundBetween MLK Jr. Way SR 24 Ramps 1 203 224 0.25 0.28 A A No -
Between SR 24 Ramps Shattuck Avenue 3 1,565 1,602 0.65 0.67 C C No -
Between Shattuck Avenue Telegraph Avenue 1 655 655 0.82 0.82 D D No -
52nd Street WestboundBetween Telegraph Avenue Shattuck Avenue 1 634 644 0.79 0.81 D D No -
Between Shattuck Avenue SR 24 Ramps 2 1,550 1,561 0.97 0.98 E E No -
Between SR 24 Ramps MLK Jr. Way 1 265 328 0.33 0.41 A B No -Fehr & Peers, 2014.
5/20/2014 Page 6 of 12

Link Location # Lanes
No Project Volume
With Project Volume
V/C Ratio -No
Project
V/C Ratio -With
Project
No Project
LOS
With Project
LOS
Change from LOS E or better to
LOS F
LOS F and Change in V/C >3%
Freeway SegmentsSR 24 EastboundBetween I-580 MLK Jr. Way 4 6,471 6,473 0.81 0.81 D D No -
Between MLK Jr. Way Claremont Avenue 4 7,817 7,817 0.98 0.98 E E No -
Between Claremont Avenue Broadway 4 7,840 7,842 0.98 0.98 E E No -
Between Broadway SR 13 Ramps 5 8,241 8,243 0.82 0.82 D D No -
Between SR 13 Ramps Caldecott Tunnel 4 9,244 9,246 1.16 1.16 F F - No
SR 24 WestboundBetween Caldecott Tunnel SR 13 Ramps 4 7,235 7,236 0.90 0.90 D D No -
Between SR 13 Ramps Broadway 5 6,307 6,308 0.63 0.63 C C No -
Between Broadway Telegraph Avenue 4 5,355 5,356 0.67 0.67 C C No -
Between Telegraph Avenue I-580 4 5,824 5,832 0.73 0.73 C C No -
I-980 EastboundBetween I-880 12th Street 2 3,247 3,248 0.81 0.81 D D No -
Between 12th Street 27th Street 3 4,174 4,175 0.70 0.70 C C No -
Between 27th Street I-580 5 6,097 6,098 0.61 0.61 C C No -
I-980 WestboundBetween I-580 27th Street 5 4,969 4,970 0.50 0.50 B B No -
Between 27th Street 12th Street 3 3,689 3,690 0.61 0.62 C C No -
Between 12th Street I-880 3 4,289 4,290 0.71 0.71 C C No -
I-580 EastboundBetween I-80/I-580 MacArthur Blvd 4 9,619 9,620 1.20 1.20 F F - No
Between MacArthur Blvd I-980/SR 24 5 8,817 8,818 0.88 0.88 D D No -
Between I-980/SR 24 Oakland Avenue 5 8,638 8,639 0.86 0.86 D D No -
Between Oakland Avenue Grand Avenue 4 9,542 9,543 1.19 1.19 F F - No
Between Grand Avenue Lakeshore Avenue 4 8,775 8,776 1.10 1.10 F F - No
Between Lakeshore Avenue Park Blvd 5 10,333 10,334 1.03 1.03 F F - No
I-580 WestboundBetween Park Blvd Lakeshore Avenue 4 10,057 10,059 1.26 1.26 F F - No
Between Lakeshore Avenue Grand Avenue 4 8,369 8,371 1.05 1.05 F F - No
Between Grand Avenue Oakland Avenue 4 8,761 8,763 1.10 1.10 F F - No
Between Oakland Avenue I-980/SR 24 5 8,085 8,087 0.81 0.81 D D No -Between I-980/SR 24 I-580/I-880 3 4,554 4,556 0.76 0.76 D D No -
ArterialsMartin Luther King Jr. Way NorthboundBetween San Pablo Ave Grand Avenue 2 200 200 0.12 0.12 A A No -
Between Grand Avenue 27th Street 2 15 15 0.01 0.01 A A No -
Between 27th Street MacArthur Blvd 2 105 105 0.07 0.07 A A No -
Between MacArthur Blvd 40th Street 2 10 10 0.01 0.01 A A No -
Between 40th Street SR 24 Ramps 2 68 68 0.04 0.04 A A No -
Betweem SR 24 Ramps 52nd Street 2 1,743 1,745 1.09 1.09 F F - No
Between 52nd Street 55th Street 2 1,992 2,039 1.25 1.27 F F - No
Between 55th Street Adeline Street 2 2,046 2,048 1.28 1.28 F F - No
Between Adeline Street Ashby Avenue 2 1,737 1,739 1.09 1.09 F F - No
Children's HospitalMTS Roadway System Analysis Summary - 2035 PM (Phase 1)
Segment Limits
5/20/2014 Page 7 of 12
Link Location # Lanes
No Project Volume
With Project Volume
V/C Ratio -No
Project
V/C Ratio -With
Project
No Project
LOS
With Project
LOS
Change from LOS E or better to
LOS F
LOS F and Change in V/C >3%
Children's HospitalMTS Roadway System Analysis Summary - 2035 PM (Phase 1)
Segment Limits
Martin Luther King Jr. Way SouthboundBetween Ashby Avenue Adeline Street 2 1,374 1,375 0.86 0.86 D D No -
Between Adeline Street 55th Street 2 2,010 2,011 1.26 1.26 F F - No
Between 55th Street 52nd Street 2 1,955 1,968 1.22 1.23 F F - No
Between 52nd Street SR 24 Ramps 2 1,822 1,830 1.14 1.14 F F - No
Between SR 24 Ramps 40th Street 2 8 9 0.01 0.01 A A No -
Between 40th Street MacArthur Blvd 2 4 5 0.00 0.00 A A No -
Between MacArthur Blvd 27th Street 2 62 63 0.04 0.04 A A No -
Between 27th Street Grand Avenue 2 2 3 0.00 0.00 A A No -
Between Grand Avenue San Pablo Ave 2 120 121 0.07 0.08 A A No -
Shattuck Avenue NorthboundBetween 52nd Street 55th Street 1 701 702 0.88 0.88 D D No -
Between 55th Street Alcatraz Avenue 1 1,036 1,037 1.30 1.30 F F - No
Between Alcatraz Avenue Ashby Avenue 1 1,012 1,013 1.27 1.27 F F - No
Shattuck Avenue SouthboundBetween Ashby Avenue Alcatraz Avenue 1 717 717 0.90 0.90 D D No -
Between Alcatraz Avenue 55th Street 1 1,001 1,001 1.25 1.25 F F - No
Between 55th Street 52nd Street 1 979 979 1.22 1.22 F F - No
Telegraph Avenue NorthboundBetween 51st Street Claremont Avenue 3 1,952 1,954 0.81 0.81 D D No -
Between Claremont Avenue SR 24 Ramps 2 2,086 2,090 1.30 1.31 F F - No
Between SR 24 Ramps Alcatraz Avenue 2 2,129 2,130 1.33 1.33 F F - No
Between Alcatraz Avenue Ashby Avenue 2 1,875 1,876 1.17 1.17 F F - No
Telegraph Avenue SouthboundBetween Ashby Avenue Alcatraz Avenue 2 1,974 1,975 1.23 1.23 F F - No
Between Alcatraz Avenue SR 24 Ramps 2 1,952 1,953 1.22 1.22 F F - No
Between SR 24 Ramps Claremont Avenue 2 1,418 1,420 0.89 0.89 D D No -
Between Claremont Avenue 51st Street 3 1,250 1,250 0.52 0.52 B B No -
Stanford Avenue EastboundBetween San Pablo Ave Market Street 2 1,169 1,170 0.73 0.73 C C No -
Between Market Street Adeline Street 2 696 697 0.43 0.44 B B No -
Stanford Avenue WestboundBetween Adeline Street Market Street 2 601 602 0.38 0.38 B B No -
Between Market Street San Pablo Ave 2 889 890 0.56 0.56 B B No -
Adeline Street NorthboundBetween Stanford Street MLK Jr. Way 3 1,475 1,478 0.61 0.62 C C No -
Between MLK Jr. Way Alcatraz Avenue 3 3,116 3,119 1.30 1.30 F F - No
Between Alcatraz Avenue MLK Jr. Way 3 2,957 2,960 1.23 1.23 F F - No
Between MLK Jr. Way Ashby Avenue 3 1,294 1,297 0.54 0.54 B B No -
Between Ashby Avenue Shattuck Avenue 3 1,526 1,529 0.64 0.64 C C No -
Adeline Street SouthboundBetween Shattuck Avenue Ashby Avenue 3 1,294 1,295 0.54 0.54 B B No -
Between Ashby Avenue MLK Jr. Way 3 1,526 1,527 0.64 0.64 C C No -
Between MLK Jr. Way Alcatraz Avenue 3 2,830 2,831 1.18 1.18 F F - No
Between Alcatraz Avenue MLK Jr. Way 3 2,990 2,991 1.25 1.25 F F - No
Between MLK Jr. Way Stanford Street 3 1,379 1,380 0.57 0.57 B B No -
5/20/2014 Page 8 of 12

Link Location # Lanes
No Project Volume
With Project Volume
V/C Ratio -No
Project
V/C Ratio -With
Project
No Project
LOS
With Project
LOS
Change from LOS E or better to
LOS F
LOS F and Change in V/C >3%
Children's HospitalMTS Roadway System Analysis Summary - 2035 PM (Phase 1)
Segment Limits
Claremont Avenue NorthboundBetween Telegraph Avenue SR 24 Ramps 2 577 577 0.36 0.36 B B No -
Between SR 24 Ramps College Avenue 2 1,935 1,935 1.21 1.21 F F - No
Claremont Avenue SouthboundBetween College Avenue SR 24 Ramps 2 1,965 1,965 1.23 1.23 F F - No
Between SR 24 Ramps Telegraph Avenue 2 383 383 0.24 0.24 A A No -
51st Street EastboundBetween Shattuck Avenue Telegraph Avenue 2 772 776 0.48 0.49 B B No -
Between Telegraph Avenue Broadway 2 1,041 1,042 0.65 0.65 C C No -
Between Broadway Piedmont Avenue 2 1,326 1,327 0.83 0.83 D D No -
51st Street WestboundBetween Piedmont Avenue Broadway 2 1,144 1,144 0.71 0.71 C C No -
Between Broadway Telegraph Avenue 2 1,027 1,027 0.64 0.64 C C No -
Between Telegraph Avenue Shattuck Avenue 2 621 623 0.39 0.39 B B No -
52nd Street EastboundBetween MLK Jr. Way SR 24 Ramps 1 239 245 0.30 0.31 A A No -
Between SR 24 Ramps Shattuck Avenue 3 1,664 1,669 0.69 0.70 C C No -
Between Shattuck Avenue Telegraph Avenue 1 647 647 0.81 0.81 D D No -
52nd Street WestboundBetween Telegraph Avenue Shattuck Avenue 1 643 645 0.80 0.81 D D No -
Between Shattuck Avenue SR 24 Ramps 2 1,635 1,637 1.02 1.02 F F - No
Between SR 24 Ramps MLK Jr. Way 1 343 354 0.43 0.44 B B No -Fehr & Peers, 2014.
5/20/2014 Page 9 of 12
Link Location # Lanes
No Project Volume
With Project Volume
V/C Ratio -No
Project
V/C Ratio -With
Project
No Project
LOS
With Project
LOS
Change from LOS E or better to
LOS F
LOS F and Change in V/C >3%
Freeway SegmentsSR 24 EastboundBetween I-580 MLK Jr. Way 4 6,471 6,483 0.81 0.81 D D No -
Between MLK Jr. Way Claremont Avenue 4 7,817 7,817 0.98 0.98 E E No -
Between Claremont Avenue Broadway 4 7,840 7,856 0.98 0.98 E E No -
Between Broadway SR 13 Ramps 5 8,241 8,257 0.82 0.83 D D No -
Between SR 13 Ramps Caldecott Tunnel 4 9,244 9,260 1.16 1.16 F F - No
SR 24 WestboundBetween Caldecott Tunnel SR 13 Ramps 4 7,235 7,240 0.90 0.90 D D No -
Between SR 13 Ramps Broadway 5 6,307 6,312 0.63 0.63 C C No -
Between Broadway Telegraph Avenue 4 5,355 5,360 0.67 0.67 C C No -
Between Telegraph Avenue I-580 4 5,824 5,866 0.73 0.73 C C No -
I-980 EastboundBetween I-880 12th Street 2 3,247 3,251 0.81 0.81 D D No -
Between 12th Street 27th Street 3 4,174 4,178 0.70 0.70 C C No -
Between 27th Street I-580 5 6,097 6,101 0.61 0.61 C C No -
I-980 WestboundBetween I-580 27th Street 5 4,969 4,982 0.50 0.50 B B No -
Between 27th Street 12th Street 3 3,689 3,702 0.61 0.62 C C No -
Between 12th Street I-880 3 4,289 4,302 0.71 0.72 C C No -
I-580 EastboundBetween I-80/I-580 MacArthur Blvd 4 9,619 9,627 1.20 1.20 F F - No
Between MacArthur Blvd I-980/SR 24 5 8,817 8,825 0.88 0.88 D D No -
Between I-980/SR 24 Oakland Avenue 5 8,638 8,646 0.86 0.86 D D No -
Between Oakland Avenue Grand Avenue 4 9,542 9,550 1.19 1.19 F F - No
Between Grand Avenue Lakeshore Avenue 4 8,775 8,783 1.10 1.10 F F - No
Between Lakeshore Avenue Park Blvd 5 10,333 10,341 1.03 1.03 F F - No
I-580 WestboundBetween Park Blvd Lakeshore Avenue 4 10,057 10,082 1.26 1.26 F F - No
Between Lakeshore Avenue Grand Avenue 4 8,369 8,394 1.05 1.05 F F - No
Between Grand Avenue Oakland Avenue 4 8,761 8,786 1.10 1.10 F F - No
Between Oakland Avenue I-980/SR 24 5 8,085 8,110 0.81 0.81 D D No -Between I-980/SR 24 I-580/I-880 3 4,554 4,579 0.76 0.76 D D No -
ArterialsMartin Luther King Jr. Way NorthboundBetween San Pablo Ave Grand Avenue 2 200 201 0.12 0.13 A A No -
Between Grand Avenue 27th Street 2 15 16 0.01 0.01 A A No -
Between 27th Street MacArthur Blvd 2 105 106 0.07 0.07 A A No -
Between MacArthur Blvd 40th Street 2 10 11 0.01 0.01 A A No -
Between 40th Street SR 24 Ramps 2 68 69 0.04 0.04 A A No -
Betweem SR 24 Ramps 52nd Street 2 1,743 1,776 1.09 1.11 F F - No
Between 52nd Street 55th Street 2 1,992 2,050 1.25 1.28 F F - No
Between 55th Street Adeline Street 2 2,046 2,059 1.28 1.29 F F - No
Between Adeline Street Ashby Avenue 2 1,737 1,750 1.09 1.09 F F - No
Children's HospitalMTS Roadway System Analysis Summary - 2035 PM (Phase 2)
Segment Limits
5/20/2014 Page 10 of 12

Link Location # Lanes
No Project Volume
With Project Volume
V/C Ratio -No
Project
V/C Ratio -With
Project
No Project
LOS
With Project
LOS
Change from LOS E or better to
LOS F
LOS F and Change in V/C >3%
Children's HospitalMTS Roadway System Analysis Summary - 2035 PM (Phase 2)
Segment Limits
Martin Luther King Jr. Way SouthboundBetween Ashby Avenue Adeline Street 2 1,374 1,378 0.86 0.86 D D No -
Between Adeline Street 55th Street 2 2,010 2,014 1.26 1.26 F F - No
Between 55th Street 52nd Street 2 1,955 1,971 1.22 1.23 F F - No
Between 52nd Street SR 24 Ramps 2 1,822 1,864 1.14 1.16 F F - No
Between SR 24 Ramps 40th Street 2 8 12 0.01 0.01 A A No -
Between 40th Street MacArthur Blvd 2 4 8 0.00 0.00 A A No -
Between MacArthur Blvd 27th Street 2 62 66 0.04 0.04 A A No -
Between 27th Street Grand Avenue 2 2 6 0.00 0.00 A A No -
Between Grand Avenue San Pablo Ave 2 120 124 0.07 0.08 A A No -
Shattuck Avenue NorthboundBetween 52nd Street 55th Street 1 701 704 0.88 0.88 D D No -
Between 55th Street Alcatraz Avenue 1 1,036 1,039 1.30 1.30 F F - No
Between Alcatraz Avenue Ashby Avenue 1 1,012 1,015 1.27 1.27 F F - No
Shattuck Avenue SouthboundBetween Ashby Avenue Alcatraz Avenue 1 717 718 0.90 0.90 D D No -
Between Alcatraz Avenue 55th Street 1 1,001 1,002 1.25 1.25 F F - No
Between 55th Street 52nd Street 1 979 980 1.22 1.22 F F - No
Telegraph Avenue NorthboundBetween 51st Street Claremont Avenue 3 1,952 1,972 0.81 0.82 D D No -
Between Claremont Avenue SR 24 Ramps 2 2,086 2,106 1.30 1.32 F F - No
Between SR 24 Ramps Alcatraz Avenue 2 2,129 2,137 1.33 1.34 F F - No
Between Alcatraz Avenue Ashby Avenue 2 1,875 1,883 1.17 1.18 F F - No
Telegraph Avenue SouthboundBetween Ashby Avenue Alcatraz Avenue 2 1,974 1,977 1.23 1.24 F F - No
Between Alcatraz Avenue SR 24 Ramps 2 1,952 1,955 1.22 1.22 F F - No
Between SR 24 Ramps Claremont Avenue 2 1,418 1,425 0.89 0.89 D D No -
Between Claremont Avenue 51st Street 3 1,250 1,251 0.52 0.52 B B No -
Stanford Avenue EastboundBetween San Pablo Ave Market Street 2 1,169 1,170 0.73 0.73 C C No -
Between Market Street Adeline Street 2 696 697 0.43 0.44 B B No -
Stanford Avenue WestboundBetween Adeline Street Market Street 2 601 602 0.38 0.38 B B No -
Between Market Street San Pablo Ave 2 889 890 0.56 0.56 B B No -
Adeline Street NorthboundBetween Stanford Street MLK Jr. Way 3 1,475 1,489 0.61 0.62 C C No -
Between MLK Jr. Way Alcatraz Avenue 3 3,116 3,130 1.30 1.30 F F - No
Between Alcatraz Avenue MLK Jr. Way 3 2,957 2,971 1.23 1.24 F F - No
Between MLK Jr. Way Ashby Avenue 3 1,294 1,308 0.54 0.54 B B No -
Between Ashby Avenue Shattuck Avenue 3 1,526 1,540 0.64 0.64 C C No -
Adeline Street SouthboundBetween Shattuck Avenue Ashby Avenue 3 1,294 1,298 0.54 0.54 B B No -
Between Ashby Avenue MLK Jr. Way 3 1,526 1,530 0.64 0.64 C C No -
Between MLK Jr. Way Alcatraz Avenue 3 2,830 2,834 1.18 1.18 F F - No
Between Alcatraz Avenue MLK Jr. Way 3 2,990 2,994 1.25 1.25 F F - No
Between MLK Jr. Way Stanford Street 3 1,379 1,383 0.57 0.58 B B No -
5/20/2014 Page 11 of 12
Link Location # Lanes
No Project Volume
With Project Volume
V/C Ratio -No
Project
V/C Ratio -With
Project
No Project
LOS
With Project
LOS
Change from LOS E or better to
LOS F
LOS F and Change in V/C >3%
Children's HospitalMTS Roadway System Analysis Summary - 2035 PM (Phase 2)
Segment Limits
Claremont Avenue NorthboundBetween Telegraph Avenue SR 24 Ramps 2 577 577 0.36 0.36 B B No -
Between SR 24 Ramps College Avenue 2 1,935 1,935 1.21 1.21 F F - No
Claremont Avenue SouthboundBetween College Avenue SR 24 Ramps 2 1,965 1,965 1.23 1.23 F F - No
Between SR 24 Ramps Telegraph Avenue 2 383 383 0.24 0.24 A A No -
51st Street EastboundBetween Shattuck Avenue Telegraph Avenue 2 772 805 0.48 0.50 B B No -
Between Telegraph Avenue Broadway 2 1,041 1,045 0.65 0.65 C C No -
Between Broadway Piedmont Avenue 2 1,326 1,331 0.83 0.83 D D No -
51st Street WestboundBetween Piedmont Avenue Broadway 2 1,144 1,145 0.71 0.72 C C No -
Between Broadway Telegraph Avenue 2 1,027 1,028 0.64 0.64 C C No -
Between Telegraph Avenue Shattuck Avenue 2 621 625 0.39 0.39 B B No -
52nd Street EastboundBetween MLK Jr. Way SR 24 Ramps 1 239 260 0.30 0.33 A A No -
Between SR 24 Ramps Shattuck Avenue 3 1,664 1,701 0.69 0.71 C C No -
Between Shattuck Avenue Telegraph Avenue 1 647 647 0.81 0.81 D D No -
52nd Street WestboundBetween Telegraph Avenue Shattuck Avenue 1 643 653 0.80 0.82 D D No -
Between Shattuck Avenue SR 24 Ramps 2 1,635 1,646 1.02 1.03 F F - No
Between SR 24 Ramps MLK Jr. Way 1 343 406 0.43 0.51 B B No -Fehr & Peers, 2014.
5/20/2014 Page 12 of 12

Appendix M Queuing Analysis Summary
Queues Children's Hospital1: MLK Way & 55th Street Existing AM
Fehr & Peers Synchro 8 Report
Lane Group EBT WBT NBL NBT SBL SBTLane Group Flow (vph) 402 328 140 1389 52 1266v/c Ratio 0.74 0.82 0.53 0.53 0.38 0.62Control Delay 30.9 43.8 25.5 2.7 47.6 24.9Queue Delay 0.0 0.0 0.0 0.0 0.0 0.0Total Delay 30.9 43.8 25.5 2.7 47.6 24.9Queue Length 50th (ft) 173 172 83 25 28 196Queue Length 95th (ft) 234 231 112 4 65 300Internal Link Dist (ft) 641 561 214 352Turn Bay Length (ft) 120 120Base Capacity (vph) 703 539 265 2635 147 2035Starvation Cap Reductn 0 0 0 0 0 0Spillback Cap Reductn 0 0 0 0 0 0Storage Cap Reductn 0 0 0 0 0 0Reduced v/c Ratio 0.57 0.61 0.53 0.53 0.35 0.62
Intersection Summary

Queues Children's Hospital3: 55th Street & Shattuck Ave Existing AM
Fehr & Peers Synchro 8 Report
Lane Group EBT WBT NBT SBTLane Group Flow (vph) 277 306 482 597v/c Ratio 0.56 0.56 0.47 0.56Control Delay 27.0 27.0 11.1 12.6Queue Delay 0.0 0.0 0.0 0.0Total Delay 27.0 27.0 11.1 12.6Queue Length 50th (ft) 109 123 123 165Queue Length 95th (ft) 186 202 192 255Internal Link Dist (ft) 597 600 202 432Turn Bay Length (ft)Base Capacity (vph) 499 549 1035 1067Starvation Cap Reductn 0 0 0 0Spillback Cap Reductn 0 0 0 0Storage Cap Reductn 0 0 0 0Reduced v/c Ratio 0.56 0.56 0.47 0.56
Intersection Summary
Queues Children's Hospital4: 55th Street & Telegraph Ave Existing AM
Fehr & Peers Synchro 8 Report
Lane Group EBT WBT NBL NBT SBL SBTLane Group Flow (vph) 227 51 58 755 27 1042v/c Ratio 0.66 0.15 0.21 0.34 0.07 0.47Control Delay 28.0 16.8 10.0 7.3 7.6 7.9Queue Delay 0.0 0.0 0.0 0.0 0.0 0.0Total Delay 28.0 16.8 10.0 7.3 7.6 7.9Queue Length 50th (ft) 73 15 9 62 4 90Queue Length 95th (ft) 124 35 35 125 16 180Internal Link Dist (ft) 600 153 628 434Turn Bay Length (ft) 110 65Base Capacity (vph) 514 517 278 2239 409 2204Starvation Cap Reductn 0 0 0 0 0 0Spillback Cap Reductn 0 0 0 0 0 0Storage Cap Reductn 0 0 0 0 0 0Reduced v/c Ratio 0.44 0.10 0.21 0.34 0.07 0.47
Intersection Summary

Queues Children's Hospital8: MLK Way & 53rd Street Existing AM
Fehr & Peers Synchro 8 Report
Lane Group EBT WBT NBL NBT SBL SBTLane Group Flow (vph) 42 29 21 1557 11 1551v/c Ratio 0.13 0.10 0.16 0.41 0.09 0.41Control Delay 9.9 16.2 47.8 4.6 20.7 2.8Queue Delay 0.0 0.0 0.0 0.2 0.0 0.0Total Delay 9.9 16.2 47.8 4.8 20.7 2.8Queue Length 50th (ft) 4 10 13 8 6 3Queue Length 95th (ft) 24 m19 m16 286 m8 79Internal Link Dist (ft) 491 487 57 219Turn Bay Length (ft) 120 120Base Capacity (vph) 607 584 157 3822 188 3752Starvation Cap Reductn 0 0 0 1203 0 0Spillback Cap Reductn 0 0 0 0 0 0Storage Cap Reductn 0 0 0 0 0 0Reduced v/c Ratio 0.07 0.05 0.13 0.59 0.06 0.41
Intersection Summarym Volume for 95th percentile queue is metered by upstream signal.
Queues Children's Hospital10: MLK Way & 52nd Street Existing AM
Fehr & Peers Synchro 8 Report
Lane Group EBL EBT WBT WBR NBL NBT SBL SBTLane Group Flow (vph) 30 185 143 148 106 1522 107 1476v/c Ratio 0.10 0.40 0.41 0.30 0.74 0.60 0.48 0.56Control Delay 22.1 16.9 29.3 5.4 57.4 21.3 34.9 13.5Queue Delay 0.0 0.0 16.2 2.3 0.0 0.1 0.0 0.1Total Delay 22.1 16.9 45.5 7.7 57.4 21.3 34.9 13.7Queue Length 50th (ft) 11 45 59 0 60 286 46 105Queue Length 95th (ft) 31 95 106 39 m69 m323 77 173Internal Link Dist (ft) 152 97 124 74Turn Bay Length (ft) 120 120Base Capacity (vph) 411 624 486 629 148 2546 248 2659Starvation Cap Reductn 0 0 321 364 0 0 0 326Spillback Cap Reductn 0 0 0 4 0 148 0 0Storage Cap Reductn 0 0 0 0 0 0 0 0Reduced v/c Ratio 0.07 0.30 0.87 0.56 0.72 0.63 0.43 0.63
Intersection Summarym Volume for 95th percentile queue is metered by upstream signal.

Queues Children's Hospital11: 52nd Street & Garage Existing AM
Fehr & Peers Synchro 8 Report
Lane Group EBT WBT NBT SBTLane Group Flow (vph) 322 353 32 28v/c Ratio 0.56 0.36 0.05 0.04Control Delay 13.4 12.3 6.3 5.8Queue Delay 2.3 0.0 0.0 0.0Total Delay 15.7 12.3 6.3 5.8Queue Length 50th (ft) 29 32 3 2Queue Length 95th (ft) 50 61 14 12Internal Link Dist (ft) 97 24 15 55Turn Bay Length (ft)Base Capacity (vph) 573 970 649 725Starvation Cap Reductn 140 0 0 0Spillback Cap Reductn 0 0 0 0Storage Cap Reductn 0 0 0 0Reduced v/c Ratio 0.74 0.36 0.05 0.04
Intersection Summary
Queues Children's Hospital14: 52nd Street & Shattuck Ave Existing AM
Fehr & Peers Synchro 8 Report
Lane Group EBL EBT WBL WBT NBL NBT SBT SBRLane Group Flow (vph) 325 839 24 948 154 153 232 376v/c Ratio 0.76 0.40 0.18 0.97 0.37 0.20 0.55 0.54Control Delay 45.3 18.7 49.7 51.2 18.7 15.7 32.2 6.0Queue Delay 0.0 0.0 0.0 0.0 0.0 0.0 0.0 0.0Total Delay 45.3 18.7 49.7 51.2 18.7 15.7 32.2 6.0Queue Length 50th (ft) 173 99 14 200 53 48 110 0Queue Length 95th (ft) #297 168 m27 #275 93 88 185 65Internal Link Dist (ft) 112 107 500 112Turn Bay Length (ft) 145 100Base Capacity (vph) 426 2102 250 976 418 752 423 690Starvation Cap Reductn 0 0 0 0 0 0 0 0Spillback Cap Reductn 0 0 0 0 0 0 0 0Storage Cap Reductn 0 0 0 0 0 0 0 0Reduced v/c Ratio 0.76 0.40 0.10 0.97 0.37 0.20 0.55 0.54
Intersection Summary# 95th percentile volume exceeds capacity, queue may be longer. Queue shown is maximum after two cycles.m Volume for 95th percentile queue is metered by upstream signal.

Queues Children's Hospital15: Telegraph Ave & 52nd Street/Claremont Ave Existing AM
Fehr & Peers Synchro 8 Report
Lane Group EBT WBL WBT NBT SBL SBTLane Group Flow (vph) 12 85 215 782 64 867v/c Ratio 0.06 0.29 0.55 0.35 0.39 0.37Control Delay 0.3 32.6 17.0 12.4 44.8 6.4Queue Delay 0.0 0.0 0.0 0.2 0.0 0.0Total Delay 0.3 32.6 17.0 12.6 44.8 6.5Queue Length 50th (ft) 0 41 34 100 35 87Queue Length 95th (ft) m0 83 102 154 73 171Internal Link Dist (ft) 229 175 169 628Turn Bay Length (ft) 80Base Capacity (vph) 265 499 563 2263 206 2343Starvation Cap Reductn 0 0 0 669 0 0Spillback Cap Reductn 0 0 3 0 0 77Storage Cap Reductn 0 0 0 0 0 0Reduced v/c Ratio 0.05 0.17 0.38 0.49 0.31 0.38
Intersection Summarym Volume for 95th percentile queue is metered by upstream signal.
Queues Children's Hospital16: Telegraph Ave & 51St Street Existing AM
Fehr & Peers Synchro 8 Report
Lane Group EBL EBT WBL WBT NBL NBT SBL SBTLane Group Flow (vph) 228 556 101 768 90 378 147 549v/c Ratio 0.54 0.50 0.51 0.75 0.49 0.39 0.69 0.48Control Delay 51.8 21.1 46.7 31.0 46.5 26.7 54.7 23.4Queue Delay 0.0 0.0 0.0 0.0 0.0 0.1 0.0 0.7Total Delay 51.8 21.1 46.7 31.0 46.5 26.8 54.7 24.0Queue Length 50th (ft) 71 66 55 184 49 87 58 140Queue Length 95th (ft) 106 135 103 257 94 132 #144 197Internal Link Dist (ft) 265 250 396 169Turn Bay Length (ft) 145 150 100Base Capacity (vph) 528 1114 238 1030 229 962 233 1154Starvation Cap Reductn 0 0 0 0 0 0 0 290Spillback Cap Reductn 0 0 0 0 0 81 0 0Storage Cap Reductn 0 0 0 0 0 0 0 0Reduced v/c Ratio 0.43 0.50 0.42 0.75 0.39 0.43 0.63 0.64
Intersection Summary# 95th percentile volume exceeds capacity, queue may be longer. Queue shown is maximum after two cycles.
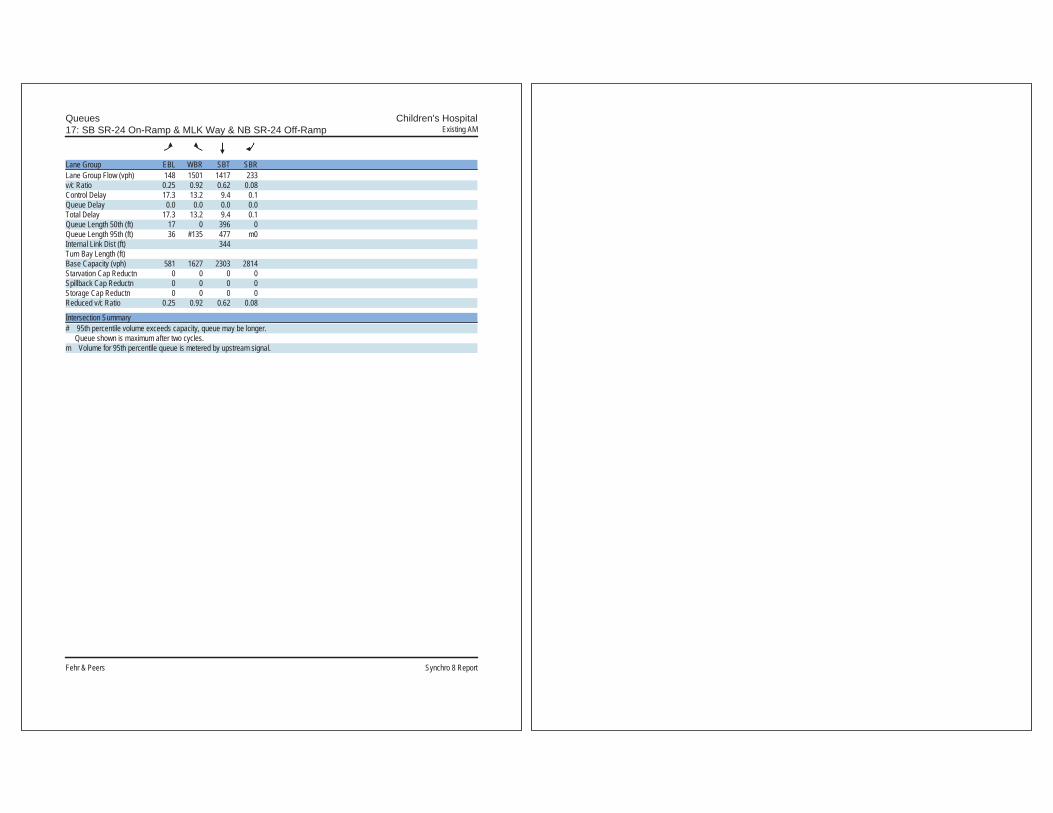
Queues Children's Hospital17: SB SR-24 On-Ramp & MLK Way & NB SR-24 Off-Ramp Existing AM
Fehr & Peers Synchro 8 Report
Lane Group EBL WBR SBT SBRLane Group Flow (vph) 148 1501 1417 233v/c Ratio 0.25 0.92 0.62 0.08Control Delay 17.3 13.2 9.4 0.1Queue Delay 0.0 0.0 0.0 0.0Total Delay 17.3 13.2 9.4 0.1Queue Length 50th (ft) 17 0 396 0Queue Length 95th (ft) 36 #135 477 m0Internal Link Dist (ft) 344Turn Bay Length (ft)Base Capacity (vph) 581 1627 2303 2814Starvation Cap Reductn 0 0 0 0Spillback Cap Reductn 0 0 0 0Storage Cap Reductn 0 0 0 0Reduced v/c Ratio 0.25 0.92 0.62 0.08
Intersection Summary# 95th percentile volume exceeds capacity, queue may be longer. Queue shown is maximum after two cycles.m Volume for 95th percentile queue is metered by upstream signal.
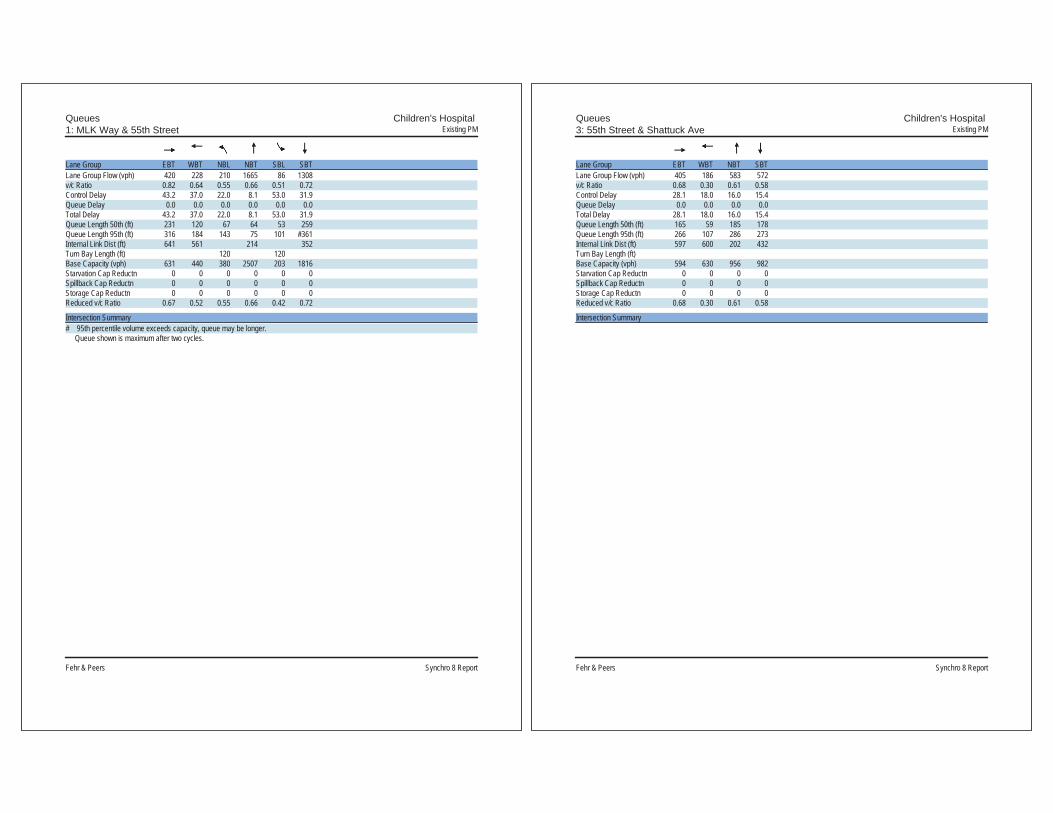
Queues Children's Hospital 1: MLK Way & 55th Street Existing PM
Fehr & Peers Synchro 8 Report
Lane Group EBT WBT NBL NBT SBL SBTLane Group Flow (vph) 420 228 210 1665 86 1308v/c Ratio 0.82 0.64 0.55 0.66 0.51 0.72Control Delay 43.2 37.0 22.0 8.1 53.0 31.9Queue Delay 0.0 0.0 0.0 0.0 0.0 0.0Total Delay 43.2 37.0 22.0 8.1 53.0 31.9Queue Length 50th (ft) 231 120 67 64 53 259Queue Length 95th (ft) 316 184 143 75 101 #361Internal Link Dist (ft) 641 561 214 352Turn Bay Length (ft) 120 120Base Capacity (vph) 631 440 380 2507 203 1816Starvation Cap Reductn 0 0 0 0 0 0Spillback Cap Reductn 0 0 0 0 0 0Storage Cap Reductn 0 0 0 0 0 0Reduced v/c Ratio 0.67 0.52 0.55 0.66 0.42 0.72
Intersection Summary# 95th percentile volume exceeds capacity, queue may be longer. Queue shown is maximum after two cycles.
Queues Children's Hospital 3: 55th Street & Shattuck Ave Existing PM
Fehr & Peers Synchro 8 Report
Lane Group EBT WBT NBT SBTLane Group Flow (vph) 405 186 583 572v/c Ratio 0.68 0.30 0.61 0.58Control Delay 28.1 18.0 16.0 15.4Queue Delay 0.0 0.0 0.0 0.0Total Delay 28.1 18.0 16.0 15.4Queue Length 50th (ft) 165 59 185 178Queue Length 95th (ft) 266 107 286 273Internal Link Dist (ft) 597 600 202 432Turn Bay Length (ft)Base Capacity (vph) 594 630 956 982Starvation Cap Reductn 0 0 0 0Spillback Cap Reductn 0 0 0 0Storage Cap Reductn 0 0 0 0Reduced v/c Ratio 0.68 0.30 0.61 0.58
Intersection Summary
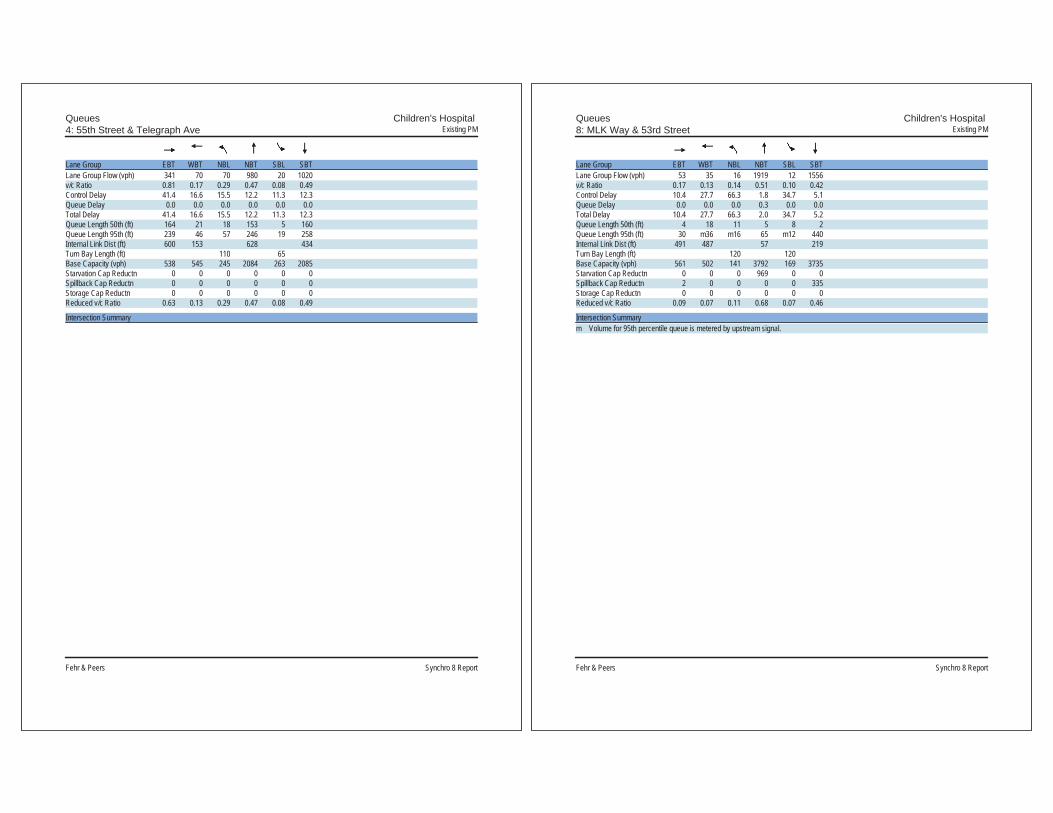
Queues Children's Hospital 4: 55th Street & Telegraph Ave Existing PM
Fehr & Peers Synchro 8 Report
Lane Group EBT WBT NBL NBT SBL SBTLane Group Flow (vph) 341 70 70 980 20 1020v/c Ratio 0.81 0.17 0.29 0.47 0.08 0.49Control Delay 41.4 16.6 15.5 12.2 11.3 12.3Queue Delay 0.0 0.0 0.0 0.0 0.0 0.0Total Delay 41.4 16.6 15.5 12.2 11.3 12.3Queue Length 50th (ft) 164 21 18 153 5 160Queue Length 95th (ft) 239 46 57 246 19 258Internal Link Dist (ft) 600 153 628 434Turn Bay Length (ft) 110 65Base Capacity (vph) 538 545 245 2084 263 2085Starvation Cap Reductn 0 0 0 0 0 0Spillback Cap Reductn 0 0 0 0 0 0Storage Cap Reductn 0 0 0 0 0 0Reduced v/c Ratio 0.63 0.13 0.29 0.47 0.08 0.49
Intersection Summary
Queues Children's Hospital 8: MLK Way & 53rd Street Existing PM
Fehr & Peers Synchro 8 Report
Lane Group EBT WBT NBL NBT SBL SBTLane Group Flow (vph) 53 35 16 1919 12 1556v/c Ratio 0.17 0.13 0.14 0.51 0.10 0.42Control Delay 10.4 27.7 66.3 1.8 34.7 5.1Queue Delay 0.0 0.0 0.0 0.3 0.0 0.0Total Delay 10.4 27.7 66.3 2.0 34.7 5.2Queue Length 50th (ft) 4 18 11 5 8 2Queue Length 95th (ft) 30 m36 m16 65 m12 440Internal Link Dist (ft) 491 487 57 219Turn Bay Length (ft) 120 120Base Capacity (vph) 561 502 141 3792 169 3735Starvation Cap Reductn 0 0 0 969 0 0Spillback Cap Reductn 2 0 0 0 0 335Storage Cap Reductn 0 0 0 0 0 0Reduced v/c Ratio 0.09 0.07 0.11 0.68 0.07 0.46
Intersection Summarym Volume for 95th percentile queue is metered by upstream signal.
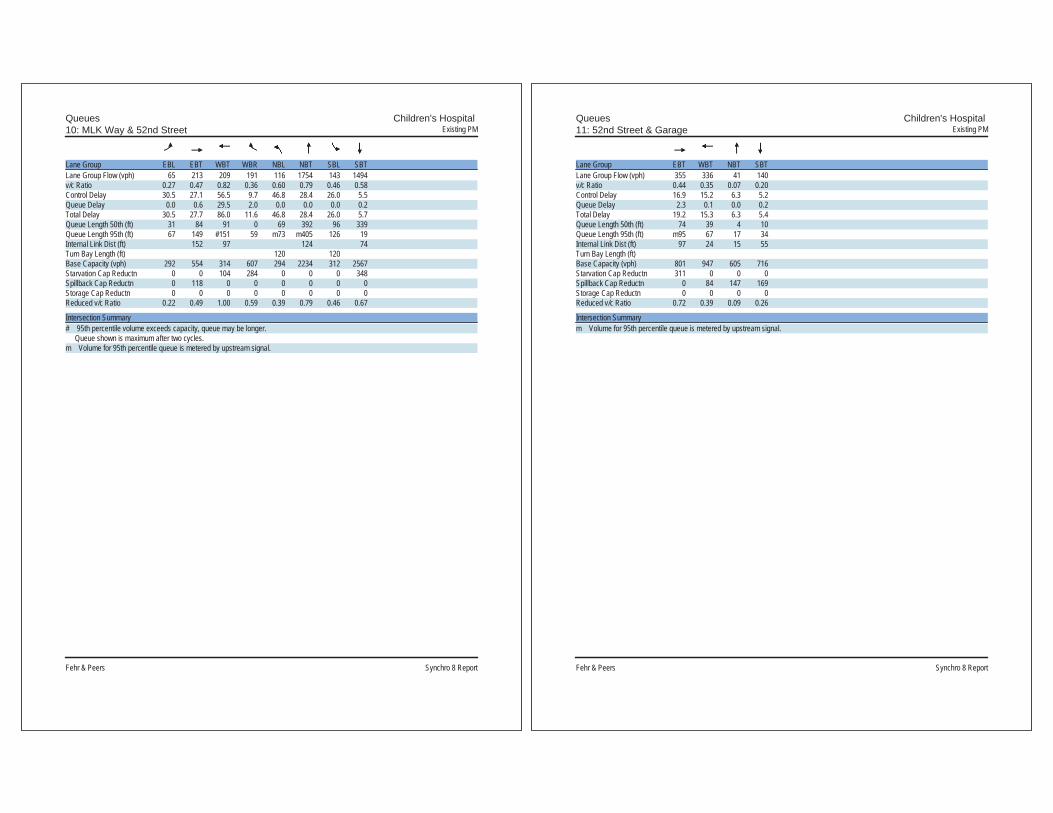
Queues Children's Hospital 10: MLK Way & 52nd Street Existing PM
Fehr & Peers Synchro 8 Report
Lane Group EBL EBT WBT WBR NBL NBT SBL SBTLane Group Flow (vph) 65 213 209 191 116 1754 143 1494v/c Ratio 0.27 0.47 0.82 0.36 0.60 0.79 0.46 0.58Control Delay 30.5 27.1 56.5 9.7 46.8 28.4 26.0 5.5Queue Delay 0.0 0.6 29.5 2.0 0.0 0.0 0.0 0.2Total Delay 30.5 27.7 86.0 11.6 46.8 28.4 26.0 5.7Queue Length 50th (ft) 31 84 91 0 69 392 96 339Queue Length 95th (ft) 67 149 #151 59 m73 m405 126 19Internal Link Dist (ft) 152 97 124 74Turn Bay Length (ft) 120 120Base Capacity (vph) 292 554 314 607 294 2234 312 2567Starvation Cap Reductn 0 0 104 284 0 0 0 348Spillback Cap Reductn 0 118 0 0 0 0 0 0Storage Cap Reductn 0 0 0 0 0 0 0 0Reduced v/c Ratio 0.22 0.49 1.00 0.59 0.39 0.79 0.46 0.67
Intersection Summary# 95th percentile volume exceeds capacity, queue may be longer. Queue shown is maximum after two cycles.m Volume for 95th percentile queue is metered by upstream signal.
Queues Children's Hospital 11: 52nd Street & Garage Existing PM
Fehr & Peers Synchro 8 Report
Lane Group EBT WBT NBT SBTLane Group Flow (vph) 355 336 41 140v/c Ratio 0.44 0.35 0.07 0.20Control Delay 16.9 15.2 6.3 5.2Queue Delay 2.3 0.1 0.0 0.2Total Delay 19.2 15.3 6.3 5.4Queue Length 50th (ft) 74 39 4 10Queue Length 95th (ft) m95 67 17 34Internal Link Dist (ft) 97 24 15 55Turn Bay Length (ft)Base Capacity (vph) 801 947 605 716Starvation Cap Reductn 311 0 0 0Spillback Cap Reductn 0 84 147 169Storage Cap Reductn 0 0 0 0Reduced v/c Ratio 0.72 0.39 0.09 0.26
Intersection Summarym Volume for 95th percentile queue is metered by upstream signal.
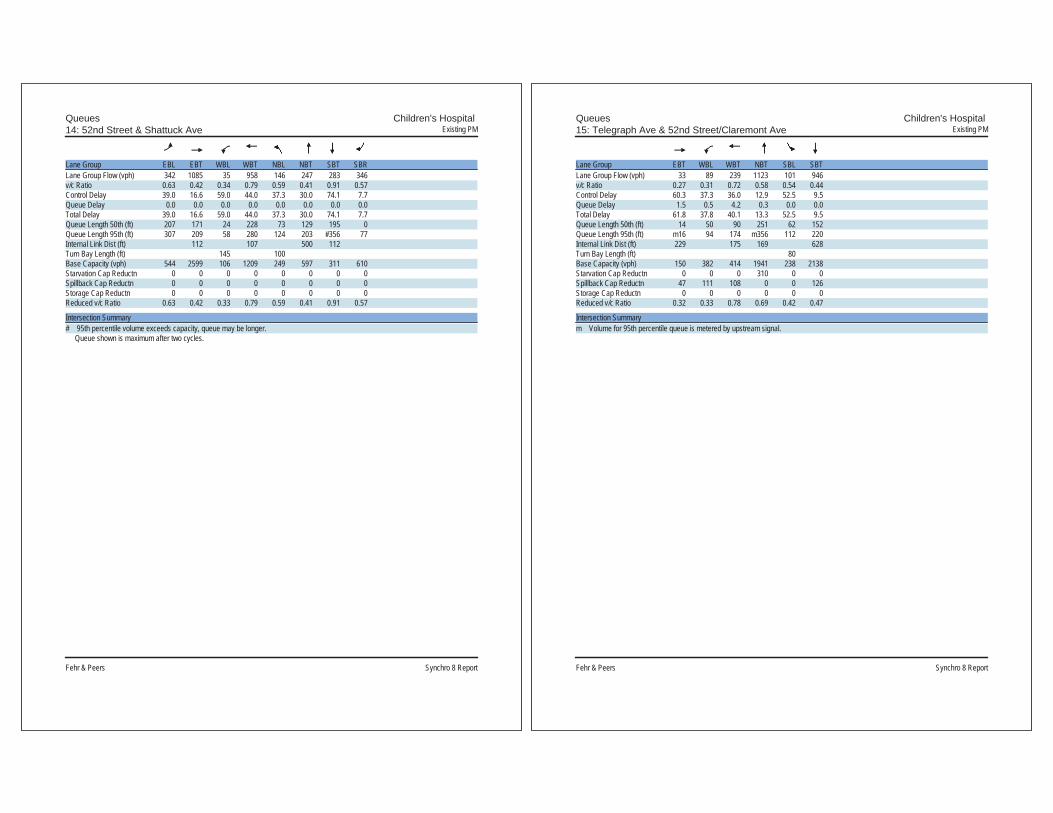
Queues Children's Hospital 14: 52nd Street & Shattuck Ave Existing PM
Fehr & Peers Synchro 8 Report
Lane Group EBL EBT WBL WBT NBL NBT SBT SBRLane Group Flow (vph) 342 1085 35 958 146 247 283 346v/c Ratio 0.63 0.42 0.34 0.79 0.59 0.41 0.91 0.57Control Delay 39.0 16.6 59.0 44.0 37.3 30.0 74.1 7.7Queue Delay 0.0 0.0 0.0 0.0 0.0 0.0 0.0 0.0Total Delay 39.0 16.6 59.0 44.0 37.3 30.0 74.1 7.7Queue Length 50th (ft) 207 171 24 228 73 129 195 0Queue Length 95th (ft) 307 209 58 280 124 203 #356 77Internal Link Dist (ft) 112 107 500 112Turn Bay Length (ft) 145 100Base Capacity (vph) 544 2599 106 1209 249 597 311 610Starvation Cap Reductn 0 0 0 0 0 0 0 0Spillback Cap Reductn 0 0 0 0 0 0 0 0Storage Cap Reductn 0 0 0 0 0 0 0 0Reduced v/c Ratio 0.63 0.42 0.33 0.79 0.59 0.41 0.91 0.57
Intersection Summary# 95th percentile volume exceeds capacity, queue may be longer. Queue shown is maximum after two cycles.
Queues Children's Hospital 15: Telegraph Ave & 52nd Street/Claremont Ave Existing PM
Fehr & Peers Synchro 8 Report
Lane Group EBT WBL WBT NBT SBL SBTLane Group Flow (vph) 33 89 239 1123 101 946v/c Ratio 0.27 0.31 0.72 0.58 0.54 0.44Control Delay 60.3 37.3 36.0 12.9 52.5 9.5Queue Delay 1.5 0.5 4.2 0.3 0.0 0.0Total Delay 61.8 37.8 40.1 13.3 52.5 9.5Queue Length 50th (ft) 14 50 90 251 62 152Queue Length 95th (ft) m16 94 174 m356 112 220Internal Link Dist (ft) 229 175 169 628Turn Bay Length (ft) 80Base Capacity (vph) 150 382 414 1941 238 2138Starvation Cap Reductn 0 0 0 310 0 0Spillback Cap Reductn 47 111 108 0 0 126Storage Cap Reductn 0 0 0 0 0 0Reduced v/c Ratio 0.32 0.33 0.78 0.69 0.42 0.47
Intersection Summarym Volume for 95th percentile queue is metered by upstream signal.

Queues Children's Hospital 16: Telegraph Ave & 51St Street Existing PM
Fehr & Peers Synchro 8 Report
Lane Group EBL EBT WBL WBT NBL NBT SBL SBTLane Group Flow (vph) 348 691 56 706 78 671 262 519v/c Ratio 0.69 0.66 0.37 0.88 0.64 0.60 1.15 0.36Control Delay 47.6 34.1 49.3 47.4 70.1 29.8 151.4 15.2Queue Delay 0.0 0.0 0.0 0.2 0.0 8.5 0.7 0.5Total Delay 47.6 34.1 49.3 47.6 70.1 38.2 152.0 15.7Queue Length 50th (ft) 109 201 34 207 49 181 ~205 72Queue Length 95th (ft) 153 272 72 #310 #130 247 #365 92Internal Link Dist (ft) 265 250 396 169Turn Bay Length (ft) 145 150 100Base Capacity (vph) 578 1040 214 802 122 1125 227 1456Starvation Cap Reductn 0 0 0 0 0 0 10 505Spillback Cap Reductn 0 0 0 4 0 413 0 0Storage Cap Reductn 0 0 0 0 0 0 0 0Reduced v/c Ratio 0.60 0.66 0.26 0.88 0.64 0.94 1.21 0.55
Intersection Summary~ Volume exceeds capacity, queue is theoretically infinite. Queue shown is maximum after two cycles.# 95th percentile volume exceeds capacity, queue may be longer. Queue shown is maximum after two cycles.
Queues Children's Hospital 17: SB SR-24 On-Ramp & MLK Way & NB SR-24 Off-Ramp Existing PM
Fehr & Peers Synchro 8 Report
Lane Group EBL WBR SBT SBRLane Group Flow (vph) 268 1614 1547 235v/c Ratio 0.32 0.99 0.75 0.08Control Delay 16.2 24.9 23.2 0.0Queue Delay 0.0 0.0 0.0 0.0Total Delay 16.2 24.9 23.2 0.0Queue Length 50th (ft) 32 0 495 0Queue Length 95th (ft) 57 #212 576 0Internal Link Dist (ft) 344Turn Bay Length (ft)Base Capacity (vph) 850 1627 2072 2814Starvation Cap Reductn 0 0 0 0Spillback Cap Reductn 0 0 0 0Storage Cap Reductn 0 0 0 0Reduced v/c Ratio 0.32 0.99 0.75 0.08
Intersection Summary# 95th percentile volume exceeds capacity, queue may be longer. Queue shown is maximum after two cycles.

Queues Children's Hospital1: MLK Way & 55th Street 2020 AM No Project
Fehr & Peers Synchro 8 Report
Lane Group EBT WBT NBL NBT SBL SBTLane Group Flow (vph) 430 380 170 1440 90 1380v/c Ratio 0.76 0.88 0.64 0.60 0.63 0.72Control Delay 31.4 49.5 30.5 5.0 60.8 28.0Queue Delay 0.0 0.0 0.0 0.0 0.0 0.0Total Delay 31.4 49.5 30.5 5.0 60.8 28.0Queue Length 50th (ft) 184 197 101 36 50 237Queue Length 95th (ft) 260 281 #145 11 #115 #363Internal Link Dist (ft) 641 561 214 352Turn Bay Length (ft) 120 120Base Capacity (vph) 694 539 265 2391 147 1925Starvation Cap Reductn 0 0 0 0 0 0Spillback Cap Reductn 0 0 0 0 0 0Storage Cap Reductn 0 0 0 0 0 0Reduced v/c Ratio 0.62 0.71 0.64 0.60 0.61 0.72
Intersection Summary# 95th percentile volume exceeds capacity, queue may be longer. Queue shown is maximum after two cycles.

Queues Children's Hospital3: 55th Street & Shattuck Ave 2020 AM No Project
Fehr & Peers Synchro 8 Report
Lane Group EBT WBT NBT SBTLane Group Flow (vph) 340 350 530 640v/c Ratio 0.72 0.64 0.53 0.61Control Delay 33.6 29.3 12.1 13.5Queue Delay 0.0 0.0 0.0 0.0Total Delay 33.6 29.3 12.1 13.5Queue Length 50th (ft) 143 144 142 184Queue Length 95th (ft) #262 234 223 285Internal Link Dist (ft) 597 600 202 432Turn Bay Length (ft)Base Capacity (vph) 473 545 1007 1056Starvation Cap Reductn 0 0 0 0Spillback Cap Reductn 0 0 0 0Storage Cap Reductn 0 0 0 0Reduced v/c Ratio 0.72 0.64 0.53 0.61
Intersection Summary# 95th percentile volume exceeds capacity, queue may be longer. Queue shown is maximum after two cycles.
Queues Children's Hospital4: 55th Street & Telegraph Ave 2020 AM No Project
Fehr & Peers Synchro 8 Report
Lane Group EBT WBT NBL NBT SBL SBTLane Group Flow (vph) 260 60 70 900 40 1240v/c Ratio 0.71 0.18 0.36 0.41 0.12 0.58Control Delay 29.9 16.6 15.8 8.5 8.9 9.9Queue Delay 0.0 0.0 0.0 0.0 0.0 0.0Total Delay 29.9 16.6 15.8 8.5 8.9 9.9Queue Length 50th (ft) 86 17 13 87 6 132Queue Length 95th (ft) 140 38 56 165 25 251Internal Link Dist (ft) 600 153 628 434Turn Bay Length (ft) 110 65Base Capacity (vph) 514 493 197 2175 324 2145Starvation Cap Reductn 0 0 0 0 0 0Spillback Cap Reductn 0 0 0 0 0 0Storage Cap Reductn 0 0 0 0 0 0Reduced v/c Ratio 0.51 0.12 0.36 0.41 0.12 0.58
Intersection Summary

Queues Children's Hospital8: MLK Way & 53rd Street 2020 AM No Project
Fehr & Peers Synchro 8 Report
Lane Group EBT WBT NBL NBT SBL SBTLane Group Flow (vph) 60 50 30 1620 20 1660v/c Ratio 0.18 0.16 0.22 0.46 0.14 0.48Control Delay 11.8 17.3 48.7 5.5 21.6 3.6Queue Delay 0.0 0.0 0.0 0.4 0.0 0.0Total Delay 11.8 17.3 48.7 5.9 21.6 3.6Queue Length 50th (ft) 11 17 18 11 11 21Queue Length 95th (ft) 33 m26 m20 360 m13 88Internal Link Dist (ft) 491 487 57 219Turn Bay Length (ft) 120 120Base Capacity (vph) 610 587 157 3501 188 3445Starvation Cap Reductn 0 0 0 1182 0 0Spillback Cap Reductn 0 0 0 0 0 0Storage Cap Reductn 0 0 0 0 0 0Reduced v/c Ratio 0.10 0.09 0.19 0.70 0.11 0.48
Intersection Summarym Volume for 95th percentile queue is metered by upstream signal.
Queues Children's Hospital10: MLK Way & 52nd Street 2020 AM No Project
Fehr & Peers Synchro 8 Report
Lane Group EBL EBT WBT WBR NBL NBT SBL SBTLane Group Flow (vph) 40 210 170 170 140 1580 130 1570v/c Ratio 0.14 0.44 0.55 0.33 0.95 0.68 0.52 0.60Control Delay 22.9 19.7 33.9 5.3 81.3 23.6 35.6 14.7Queue Delay 0.0 0.0 35.4 2.5 0.0 0.2 0.0 0.1Total Delay 22.9 19.7 69.4 7.8 81.3 23.8 35.6 14.8Queue Length 50th (ft) 15 58 73 0 81 303 45 113Queue Length 95th (ft) 38 115 131 41 m#100 m329 99 199Internal Link Dist (ft) 152 97 124 74Turn Bay Length (ft) 120 120Base Capacity (vph) 380 618 419 641 148 2323 248 2608Starvation Cap Reductn 0 0 248 356 0 0 0 198Spillback Cap Reductn 0 0 0 5 0 160 0 0Storage Cap Reductn 0 0 0 0 0 0 0 0Reduced v/c Ratio 0.11 0.34 0.99 0.60 0.95 0.73 0.52 0.65
Intersection Summary# 95th percentile volume exceeds capacity, queue may be longer. Queue shown is maximum after two cycles.m Volume for 95th percentile queue is metered by upstream signal.

Queues Children's Hospital11: 52nd Street & Garage 2020 AM No Project
Fehr & Peers Synchro 8 Report
Lane Group EBT WBT NBT SBTLane Group Flow (vph) 350 388 32 28v/c Ratio 0.62 0.40 0.05 0.04Control Delay 14.8 13.5 6.3 5.8Queue Delay 3.0 0.0 0.0 0.0Total Delay 17.8 13.5 6.3 5.8Queue Length 50th (ft) 32 38 3 2Queue Length 95th (ft) 54 69 14 12Internal Link Dist (ft) 97 24 15 55Turn Bay Length (ft)Base Capacity (vph) 563 963 641 711Starvation Cap Reductn 123 0 0 0Spillback Cap Reductn 0 0 0 0Storage Cap Reductn 0 0 0 0Reduced v/c Ratio 0.80 0.40 0.05 0.04
Intersection Summary
Queues Children's Hospital14: 52nd Street & Shattuck Ave 2020 AM No Project
Fehr & Peers Synchro 8 Report
Lane Group EBL EBT WBL WBT NBL NBT SBT SBRLane Group Flow (vph) 340 910 40 1060 170 170 270 390v/c Ratio 0.80 0.47 0.27 1.09 0.44 0.23 0.64 0.56Control Delay 47.9 21.4 46.8 82.7 20.1 15.7 35.6 6.2Queue Delay 0.0 0.0 0.0 0.0 0.0 0.0 0.0 0.0Total Delay 47.9 21.4 46.8 82.7 20.1 15.7 35.6 6.2Queue Length 50th (ft) 182 140 23 ~252 59 53 132 0Queue Length 95th (ft) #317 189 m39 #325 102 96 219 67Internal Link Dist (ft) 112 107 500 112Turn Bay Length (ft) 145 100Base Capacity (vph) 426 1947 250 976 388 748 420 693Starvation Cap Reductn 0 0 0 0 0 0 0 0Spillback Cap Reductn 0 0 0 0 0 0 0 0Storage Cap Reductn 0 0 0 0 0 0 0 0Reduced v/c Ratio 0.80 0.47 0.16 1.09 0.44 0.23 0.64 0.56
Intersection Summary~ Volume exceeds capacity, queue is theoretically infinite. Queue shown is maximum after two cycles.# 95th percentile volume exceeds capacity, queue may be longer. Queue shown is maximum after two cycles.m Volume for 95th percentile queue is metered by upstream signal.

Queues Children's Hospital15: Telegraph Ave & 52nd Street/Claremont Ave 2020 AM No Project
Fehr & Peers Synchro 8 Report
Lane Group EBT WBL WBT NBT SBL SBTLane Group Flow (vph) 30 99 251 920 90 1040v/c Ratio 0.23 0.34 0.64 0.49 0.51 0.49Control Delay 48.1 33.5 21.7 18.2 48.1 10.3Queue Delay 0.0 0.1 0.2 0.2 0.0 0.1Total Delay 48.1 33.6 21.9 18.4 48.1 10.4Queue Length 50th (ft) 11 48 52 150 49 169Queue Length 95th (ft) m17 94 130 310 96 240Internal Link Dist (ft) 229 175 169 628Turn Bay Length (ft) 80Base Capacity (vph) 164 499 562 1888 206 2133Starvation Cap Reductn 0 0 0 323 0 0Spillback Cap Reductn 0 54 50 0 0 137Storage Cap Reductn 0 0 0 0 0 0Reduced v/c Ratio 0.18 0.22 0.49 0.59 0.44 0.52
Intersection Summarym Volume for 95th percentile queue is metered by upstream signal.
Queues Children's Hospital16: Telegraph Ave & 51St Street 2020 AM No Project
Fehr & Peers Synchro 8 Report
Lane Group EBL EBT WBL WBT NBL NBT SBL SBTLane Group Flow (vph) 270 610 120 830 110 450 180 640v/c Ratio 0.59 0.59 0.59 0.82 0.57 0.49 0.80 0.57Control Delay 50.3 26.6 49.2 34.4 49.0 28.8 73.3 21.9Queue Delay 0.0 0.0 0.0 0.6 0.0 1.3 0.0 0.9Total Delay 50.3 26.6 49.2 35.0 49.0 30.1 73.3 22.8Queue Length 50th (ft) 83 95 65 204 60 109 104 138Queue Length 95th (ft) 121 168 120 #288 111 159 #211 174Internal Link Dist (ft) 265 250 396 169Turn Bay Length (ft) 145 150 100Base Capacity (vph) 528 1033 238 1016 229 920 233 1114Starvation Cap Reductn 0 0 0 0 0 0 0 226Spillback Cap Reductn 0 0 0 35 0 274 0 0Storage Cap Reductn 0 0 0 0 0 0 0 0Reduced v/c Ratio 0.51 0.59 0.50 0.85 0.48 0.70 0.77 0.72
Intersection Summary# 95th percentile volume exceeds capacity, queue may be longer. Queue shown is maximum after two cycles.

Queues Children's Hospital17: SB SR-24 On-Ramp & MLK Way & NB SR-24 Off-Ramp 2020 AM No Project
Fehr & Peers Synchro 8 Report
Lane Group EBL WBR SBT SBRLane Group Flow (vph) 190 1550 1520 250v/c Ratio 0.33 0.95 0.66 0.09Control Delay 18.0 17.3 10.1 0.1Queue Delay 0.0 0.0 0.0 0.0Total Delay 18.0 17.3 10.1 0.1Queue Length 50th (ft) 22 0 157 0Queue Length 95th (ft) 43 #165 m501 m0Internal Link Dist (ft) 344Turn Bay Length (ft)Base Capacity (vph) 581 1627 2303 2814Starvation Cap Reductn 0 0 0 0Spillback Cap Reductn 0 0 0 0Storage Cap Reductn 0 0 0 0Reduced v/c Ratio 0.33 0.95 0.66 0.09
Intersection Summary# 95th percentile volume exceeds capacity, queue may be longer. Queue shown is maximum after two cycles.m Volume for 95th percentile queue is metered by upstream signal.
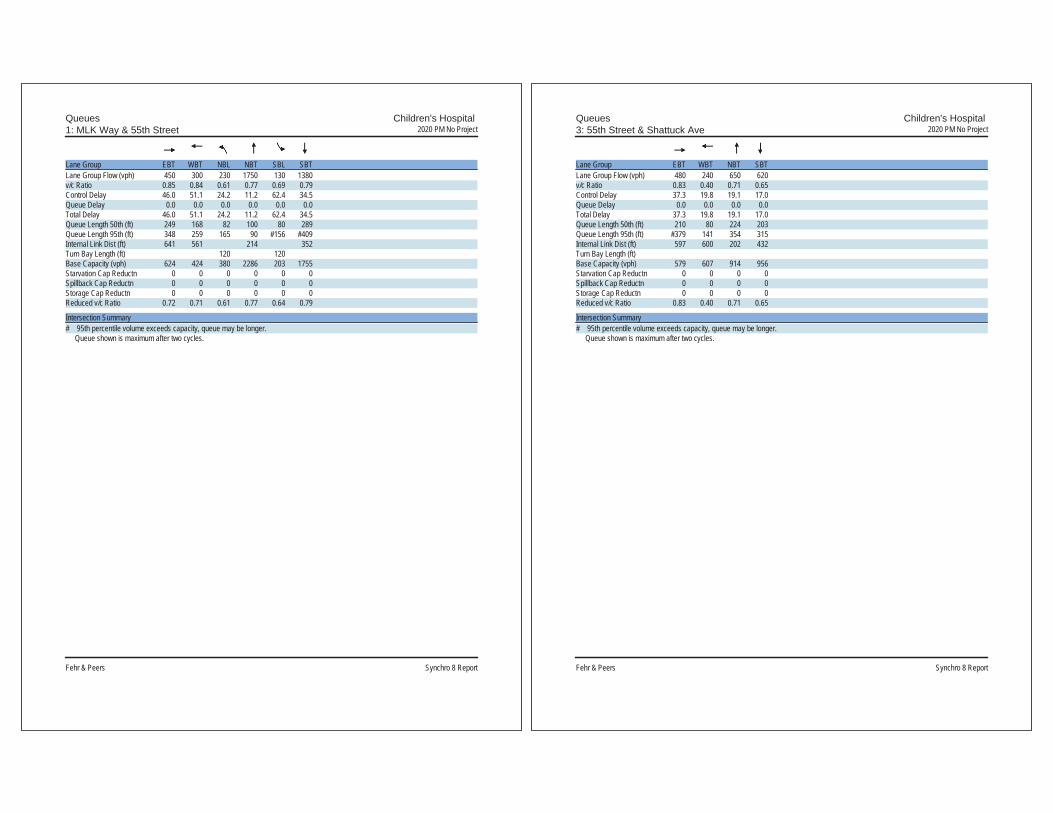
Queues Children's Hospital 1: MLK Way & 55th Street 2020 PM No Project
Fehr & Peers Synchro 8 Report
Lane Group EBT WBT NBL NBT SBL SBTLane Group Flow (vph) 450 300 230 1750 130 1380v/c Ratio 0.85 0.84 0.61 0.77 0.69 0.79Control Delay 46.0 51.1 24.2 11.2 62.4 34.5Queue Delay 0.0 0.0 0.0 0.0 0.0 0.0Total Delay 46.0 51.1 24.2 11.2 62.4 34.5Queue Length 50th (ft) 249 168 82 100 80 289Queue Length 95th (ft) 348 259 165 90 #156 #409Internal Link Dist (ft) 641 561 214 352Turn Bay Length (ft) 120 120Base Capacity (vph) 624 424 380 2286 203 1755Starvation Cap Reductn 0 0 0 0 0 0Spillback Cap Reductn 0 0 0 0 0 0Storage Cap Reductn 0 0 0 0 0 0Reduced v/c Ratio 0.72 0.71 0.61 0.77 0.64 0.79
Intersection Summary# 95th percentile volume exceeds capacity, queue may be longer. Queue shown is maximum after two cycles.
Queues Children's Hospital 3: 55th Street & Shattuck Ave 2020 PM No Project
Fehr & Peers Synchro 8 Report
Lane Group EBT WBT NBT SBTLane Group Flow (vph) 480 240 650 620v/c Ratio 0.83 0.40 0.71 0.65Control Delay 37.3 19.8 19.1 17.0Queue Delay 0.0 0.0 0.0 0.0Total Delay 37.3 19.8 19.1 17.0Queue Length 50th (ft) 210 80 224 203Queue Length 95th (ft) #379 141 354 315Internal Link Dist (ft) 597 600 202 432Turn Bay Length (ft)Base Capacity (vph) 579 607 914 956Starvation Cap Reductn 0 0 0 0Spillback Cap Reductn 0 0 0 0Storage Cap Reductn 0 0 0 0Reduced v/c Ratio 0.83 0.40 0.71 0.65
Intersection Summary# 95th percentile volume exceeds capacity, queue may be longer. Queue shown is maximum after two cycles.

Queues Children's Hospital 4: 55th Street & Telegraph Ave 2020 PM No Project
Fehr & Peers Synchro 8 Report
Lane Group EBT WBT NBL NBT SBL SBTLane Group Flow (vph) 390 90 90 1100 20 1100v/c Ratio 0.86 0.21 0.45 0.55 0.10 0.55Control Delay 44.9 16.6 23.2 14.4 12.8 14.3Queue Delay 0.0 0.0 0.0 0.0 0.0 0.0Total Delay 44.9 16.6 23.2 14.4 12.8 14.3Queue Length 50th (ft) 187 28 29 197 5 196Queue Length 95th (ft) #287 58 89 289 19 287Internal Link Dist (ft) 600 153 628 434Turn Bay Length (ft) 110 65Base Capacity (vph) 535 521 199 1990 201 1988Starvation Cap Reductn 0 0 0 0 0 0Spillback Cap Reductn 0 0 0 0 0 0Storage Cap Reductn 0 0 0 0 0 0Reduced v/c Ratio 0.73 0.17 0.45 0.55 0.10 0.55
Intersection Summary# 95th percentile volume exceeds capacity, queue may be longer. Queue shown is maximum after two cycles.
Queues Children's Hospital 8: MLK Way & 53rd Street 2020 PM No Project
Fehr & Peers Synchro 8 Report
Lane Group EBT WBT NBL NBT SBL SBTLane Group Flow (vph) 80 50 20 2010 20 1620v/c Ratio 0.25 0.19 0.17 0.55 0.16 0.44Control Delay 12.0 27.7 65.8 2.4 35.2 5.4Queue Delay 0.0 0.0 0.0 0.4 0.0 0.0Total Delay 12.0 27.7 65.8 2.8 35.2 5.4Queue Length 50th (ft) 12 25 13 6 14 4Queue Length 95th (ft) 41 m46 m19 69 m19 452Internal Link Dist (ft) 491 487 57 219Turn Bay Length (ft) 120 120Base Capacity (vph) 565 498 141 3640 169 3714Starvation Cap Reductn 0 0 0 927 0 0Spillback Cap Reductn 3 0 0 0 0 348Storage Cap Reductn 0 0 0 0 0 0Reduced v/c Ratio 0.14 0.10 0.14 0.74 0.12 0.48
Intersection Summarym Volume for 95th percentile queue is metered by upstream signal.

Queues Children's Hospital 10: MLK Way & 52nd Street 2020 PM No Project
Fehr & Peers Synchro 8 Report
Lane Group EBL EBT WBT WBR NBL NBT SBL SBTLane Group Flow (vph) 70 230 230 200 140 1830 150 1560v/c Ratio 0.30 0.49 0.89 0.37 0.65 0.84 0.48 0.64Control Delay 31.2 28.1 66.8 9.1 45.8 30.2 26.0 7.0Queue Delay 0.0 0.8 59.6 1.9 0.0 0.0 0.0 0.3Total Delay 31.2 28.8 126.5 11.0 45.8 30.2 26.0 7.2Queue Length 50th (ft) 33 95 101 0 84 417 101 363Queue Length 95th (ft) 72 164 #250 64 m87 m415 127 25Internal Link Dist (ft) 152 97 124 74Turn Bay Length (ft) 120 120Base Capacity (vph) 274 550 305 611 294 2183 312 2453Starvation Cap Reductn 0 0 97 277 0 0 0 301Spillback Cap Reductn 0 122 0 0 0 0 0 0Storage Cap Reductn 0 0 0 0 0 0 0 0Reduced v/c Ratio 0.26 0.54 1.11 0.60 0.48 0.84 0.48 0.72
Intersection Summary# 95th percentile volume exceeds capacity, queue may be longer. Queue shown is maximum after two cycles.m Volume for 95th percentile queue is metered by upstream signal.
Queues Children's Hospital 11: 52nd Street & Garage 2020 PM No Project
Fehr & Peers Synchro 8 Report
Lane Group EBT WBT NBT SBTLane Group Flow (vph) 372 348 41 140v/c Ratio 0.46 0.37 0.07 0.20Control Delay 16.8 15.4 6.3 5.3Queue Delay 2.5 0.2 0.0 0.2Total Delay 19.3 15.6 6.3 5.4Queue Length 50th (ft) 75 41 4 10Queue Length 95th (ft) m94 70 17 34Internal Link Dist (ft) 97 24 15 55Turn Bay Length (ft)Base Capacity (vph) 802 946 597 703Starvation Cap Reductn 304 0 0 0Spillback Cap Reductn 0 144 147 169Storage Cap Reductn 0 0 0 0Reduced v/c Ratio 0.75 0.43 0.09 0.26
Intersection Summarym Volume for 95th percentile queue is metered by upstream signal.

Queues Children's Hospital 14: 52nd Street & Shattuck Ave 2020 PM No Project
Fehr & Peers Synchro 8 Report
Lane Group EBL EBT WBL WBT NBL NBT SBT SBRLane Group Flow (vph) 370 1140 60 1030 160 300 300 360v/c Ratio 0.68 0.46 0.58 0.85 0.66 0.51 1.01 0.59Control Delay 41.0 18.0 72.6 47.2 41.8 31.9 96.4 7.9Queue Delay 0.0 0.0 0.0 0.0 0.0 0.0 0.0 0.0Total Delay 41.0 18.0 72.6 47.2 41.8 31.9 96.4 7.9Queue Length 50th (ft) 229 182 42 249 81 162 ~214 0Queue Length 95th (ft) 336 221 #98 305 #141 248 #394 80Internal Link Dist (ft) 112 107 500 112Turn Bay Length (ft) 145 100Base Capacity (vph) 544 2495 106 1205 243 593 298 615Starvation Cap Reductn 0 0 0 0 0 0 0 0Spillback Cap Reductn 0 0 0 0 0 0 0 0Storage Cap Reductn 0 0 0 0 0 0 0 0Reduced v/c Ratio 0.68 0.46 0.57 0.85 0.66 0.51 1.01 0.59
Intersection Summary~ Volume exceeds capacity, queue is theoretically infinite. Queue shown is maximum after two cycles.# 95th percentile volume exceeds capacity, queue may be longer. Queue shown is maximum after two cycles.
Queues Children's Hospital 15: Telegraph Ave & 52nd Street/Claremont Ave 2020 PM No Project
Fehr & Peers Synchro 8 Report
Lane Group EBT WBL WBT NBT SBL SBTLane Group Flow (vph) 60 126 274 1290 140 1020v/c Ratio 0.43 0.41 0.79 0.78 0.67 0.51Control Delay 62.7 39.1 42.6 17.9 57.8 11.6Queue Delay 3.6 1.0 10.0 3.0 0.0 0.1Total Delay 66.3 40.1 52.6 20.9 57.8 11.6Queue Length 50th (ft) 23 72 115 321 85 178Queue Length 95th (ft) m27 127 209 m#528 148 250Internal Link Dist (ft) 229 175 169 628Turn Bay Length (ft) 80Base Capacity (vph) 158 382 409 1660 238 1987Starvation Cap Reductn 0 0 0 262 0 0Spillback Cap Reductn 48 108 105 0 0 135Storage Cap Reductn 0 0 0 0 0 0Reduced v/c Ratio 0.55 0.46 0.90 0.92 0.59 0.55
Intersection Summary# 95th percentile volume exceeds capacity, queue may be longer. Queue shown is maximum after two cycles.m Volume for 95th percentile queue is metered by upstream signal.

Queues Children's Hospital 16: Telegraph Ave & 51St Street 2020 PM No Project
Fehr & Peers Synchro 8 Report
Lane Group EBL EBT WBL WBT NBL NBT SBL SBTLane Group Flow (vph) 360 760 70 760 100 810 280 600v/c Ratio 0.70 0.74 0.43 0.95 0.75 0.73 1.23 0.45Control Delay 48.1 37.0 50.5 58.2 80.4 33.4 178.3 16.2Queue Delay 0.0 0.0 0.0 0.8 0.0 52.0 0.6 1.2Total Delay 48.1 37.0 50.5 59.0 80.4 85.4 178.9 17.4Queue Length 50th (ft) 112 230 43 232 64 233 ~228 87Queue Length 95th (ft) 158 #310 85 #354 #170 312 #395 111Internal Link Dist (ft) 265 250 396 169Turn Bay Length (ft) 145 150 100Base Capacity (vph) 578 1022 214 796 133 1115 227 1342Starvation Cap Reductn 0 0 0 0 0 0 9 492Spillback Cap Reductn 0 0 0 5 0 509 0 0Storage Cap Reductn 0 0 0 0 0 0 0 0Reduced v/c Ratio 0.62 0.74 0.33 0.96 0.75 1.34 1.28 0.71
Intersection Summary~ Volume exceeds capacity, queue is theoretically infinite. Queue shown is maximum after two cycles.# 95th percentile volume exceeds capacity, queue may be longer. Queue shown is maximum after two cycles.
Queues Children's Hospital 17: SB SR-24 On-Ramp & MLK Way & NB SR-24 Off-Ramp 2020 PM No Project
Fehr & Peers Synchro 8 Report
Lane Group EBL WBR SBT SBRLane Group Flow (vph) 300 1670 1620 240v/c Ratio 0.35 1.03 0.78 0.09Control Delay 16.5 34.6 24.4 0.0Queue Delay 0.0 0.0 0.0 0.0Total Delay 16.5 34.6 24.4 0.0Queue Length 50th (ft) 36 ~28 532 0Queue Length 95th (ft) 63 #249 604 m0Internal Link Dist (ft) 344Turn Bay Length (ft)Base Capacity (vph) 850 1627 2072 2814Starvation Cap Reductn 0 0 0 0Spillback Cap Reductn 0 0 0 0Storage Cap Reductn 0 0 0 0Reduced v/c Ratio 0.35 1.03 0.78 0.09
Intersection Summary~ Volume exceeds capacity, queue is theoretically infinite. Queue shown is maximum after two cycles.# 95th percentile volume exceeds capacity, queue may be longer. Queue shown is maximum after two cycles.m Volume for 95th percentile queue is metered by upstream signal.

Queues Children's Hospital1: MLK Way & 55th Street Existing AM Plus Phase 1
Fehr & Peers Synchro 8 Report
Lane Group EBT WBT NBL NBT SBL SBTLane Group Flow (vph) 402 328 141 1400 52 1268v/c Ratio 0.74 0.82 0.53 0.53 0.38 0.62Control Delay 30.9 43.8 25.8 3.1 47.6 24.9Queue Delay 0.0 0.0 0.0 0.0 0.0 0.0Total Delay 30.9 43.8 25.8 3.1 47.6 24.9Queue Length 50th (ft) 173 172 82 33 28 196Queue Length 95th (ft) 234 231 112 5 65 300Internal Link Dist (ft) 641 561 214 352Turn Bay Length (ft) 120 120Base Capacity (vph) 703 539 265 2631 147 2035Starvation Cap Reductn 0 0 0 0 0 0Spillback Cap Reductn 0 0 0 0 0 0Storage Cap Reductn 0 0 0 0 0 0Reduced v/c Ratio 0.57 0.61 0.53 0.53 0.35 0.62
Intersection Summary
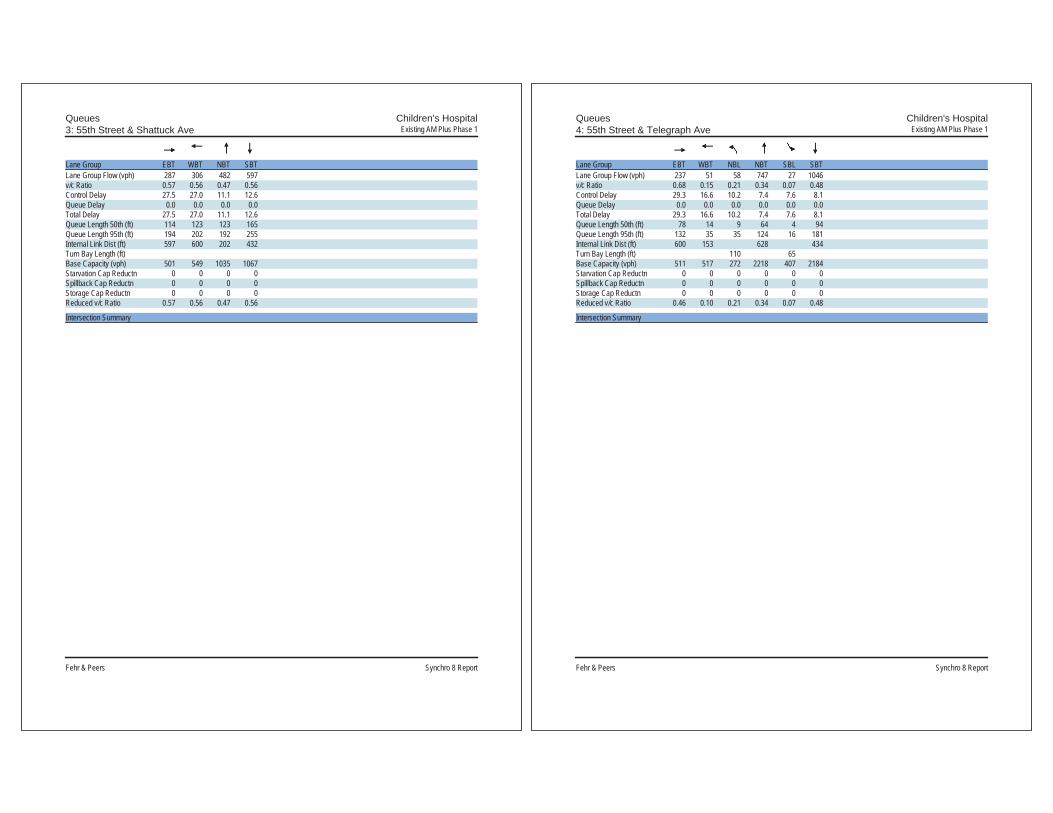
Queues Children's Hospital3: 55th Street & Shattuck Ave Existing AM Plus Phase 1
Fehr & Peers Synchro 8 Report
Lane Group EBT WBT NBT SBTLane Group Flow (vph) 287 306 482 597v/c Ratio 0.57 0.56 0.47 0.56Control Delay 27.5 27.0 11.1 12.6Queue Delay 0.0 0.0 0.0 0.0Total Delay 27.5 27.0 11.1 12.6Queue Length 50th (ft) 114 123 123 165Queue Length 95th (ft) 194 202 192 255Internal Link Dist (ft) 597 600 202 432Turn Bay Length (ft)Base Capacity (vph) 501 549 1035 1067Starvation Cap Reductn 0 0 0 0Spillback Cap Reductn 0 0 0 0Storage Cap Reductn 0 0 0 0Reduced v/c Ratio 0.57 0.56 0.47 0.56
Intersection Summary
Queues Children's Hospital4: 55th Street & Telegraph Ave Existing AM Plus Phase 1
Fehr & Peers Synchro 8 Report
Lane Group EBT WBT NBL NBT SBL SBTLane Group Flow (vph) 237 51 58 747 27 1046v/c Ratio 0.68 0.15 0.21 0.34 0.07 0.48Control Delay 29.3 16.6 10.2 7.4 7.6 8.1Queue Delay 0.0 0.0 0.0 0.0 0.0 0.0Total Delay 29.3 16.6 10.2 7.4 7.6 8.1Queue Length 50th (ft) 78 14 9 64 4 94Queue Length 95th (ft) 132 35 35 124 16 181Internal Link Dist (ft) 600 153 628 434Turn Bay Length (ft) 110 65Base Capacity (vph) 511 517 272 2218 407 2184Starvation Cap Reductn 0 0 0 0 0 0Spillback Cap Reductn 0 0 0 0 0 0Storage Cap Reductn 0 0 0 0 0 0Reduced v/c Ratio 0.46 0.10 0.21 0.34 0.07 0.48
Intersection Summary

Queues Children's Hospital8: MLK Way & 53rd Street Existing AM Plus Phase 1
Fehr & Peers Synchro 8 Report
Lane Group EBT WBT NBL NBT SBL SBTLane Group Flow (vph) 42 29 21 1576 11 1554v/c Ratio 0.13 0.10 0.16 0.41 0.09 0.41Control Delay 9.9 16.2 47.8 5.1 20.6 2.8Queue Delay 0.0 0.0 0.0 0.2 0.0 0.0Total Delay 9.9 16.2 47.8 5.3 20.6 2.8Queue Length 50th (ft) 4 10 13 10 6 3Queue Length 95th (ft) 24 m18 m17 323 m8 79Internal Link Dist (ft) 491 487 57 219Turn Bay Length (ft) 120 120Base Capacity (vph) 607 584 157 3817 188 3752Starvation Cap Reductn 0 0 0 1193 0 0Spillback Cap Reductn 0 0 0 0 0 0Storage Cap Reductn 0 0 0 0 0 0Reduced v/c Ratio 0.07 0.05 0.13 0.60 0.06 0.41
Intersection Summarym Volume for 95th percentile queue is metered by upstream signal.
Queues Children's Hospital10: MLK Way & 52nd Street Existing AM Plus Phase 1
Fehr & Peers Synchro 8 Report
Lane Group EBL EBT WBT WBR NBL NBT SBL SBTLane Group Flow (vph) 38 177 145 235 106 1528 109 1477v/c Ratio 0.13 0.38 0.41 0.42 0.74 0.60 0.49 0.56Control Delay 22.8 15.4 29.3 5.4 57.2 21.4 35.2 13.6Queue Delay 0.0 0.0 16.2 2.8 0.0 0.1 0.0 0.1Total Delay 22.8 15.4 45.5 8.2 57.2 21.5 35.2 13.7Queue Length 50th (ft) 14 38 59 0 60 290 47 105Queue Length 95th (ft) 37 87 108 48 m69 m324 79 174Internal Link Dist (ft) 152 97 124 74Turn Bay Length (ft) 120 120Base Capacity (vph) 409 625 490 686 148 2561 248 2657Starvation Cap Reductn 0 0 323 339 0 0 0 325Spillback Cap Reductn 0 0 0 7 0 164 0 0Storage Cap Reductn 0 0 0 0 0 0 0 0Reduced v/c Ratio 0.09 0.28 0.87 0.68 0.72 0.64 0.44 0.63
Intersection Summarym Volume for 95th percentile queue is metered by upstream signal.

Queues Children's Hospital11: 52nd Street & Garage Existing AM Plus Phase 1
Fehr & Peers Synchro 8 Report
Lane Group EBT WBT NBT SBTLane Group Flow (vph) 214 360 32 17v/c Ratio 0.26 0.38 0.05 0.02Control Delay 9.6 15.8 6.3 4.6Queue Delay 1.0 0.0 0.0 0.0Total Delay 10.5 15.8 6.3 4.6Queue Length 50th (ft) 18 44 3 0Queue Length 95th (ft) 34 73 14 8Internal Link Dist (ft) 97 24 15 55Turn Bay Length (ft)Base Capacity (vph) 808 959 651 769Starvation Cap Reductn 377 0 0 0Spillback Cap Reductn 0 0 0 0Storage Cap Reductn 0 0 0 0Reduced v/c Ratio 0.50 0.38 0.05 0.02
Intersection Summary
Queues Children's Hospital14: 52nd Street & Shattuck Ave Existing AM Plus Phase 1
Fehr & Peers Synchro 8 Report
Lane Group EBL EBT WBL WBT NBL NBT SBT SBRLane Group Flow (vph) 325 831 24 953 154 153 232 376v/c Ratio 0.76 0.40 0.18 0.98 0.37 0.20 0.55 0.54Control Delay 45.3 18.7 49.4 52.5 18.7 15.7 32.2 6.0Queue Delay 0.0 0.0 0.0 0.0 0.0 0.0 0.0 0.0Total Delay 45.3 18.7 49.4 52.5 18.7 15.7 32.2 6.0Queue Length 50th (ft) 173 97 14 202 53 48 110 0Queue Length 95th (ft) #297 165 m27 #278 93 88 185 65Internal Link Dist (ft) 112 107 500 112Turn Bay Length (ft) 145 100Base Capacity (vph) 426 2100 250 976 418 752 423 690Starvation Cap Reductn 0 0 0 0 0 0 0 0Spillback Cap Reductn 0 0 0 0 0 0 0 0Storage Cap Reductn 0 0 0 0 0 0 0 0Reduced v/c Ratio 0.76 0.40 0.10 0.98 0.37 0.20 0.55 0.54
Intersection Summary# 95th percentile volume exceeds capacity, queue may be longer. Queue shown is maximum after two cycles.m Volume for 95th percentile queue is metered by upstream signal.
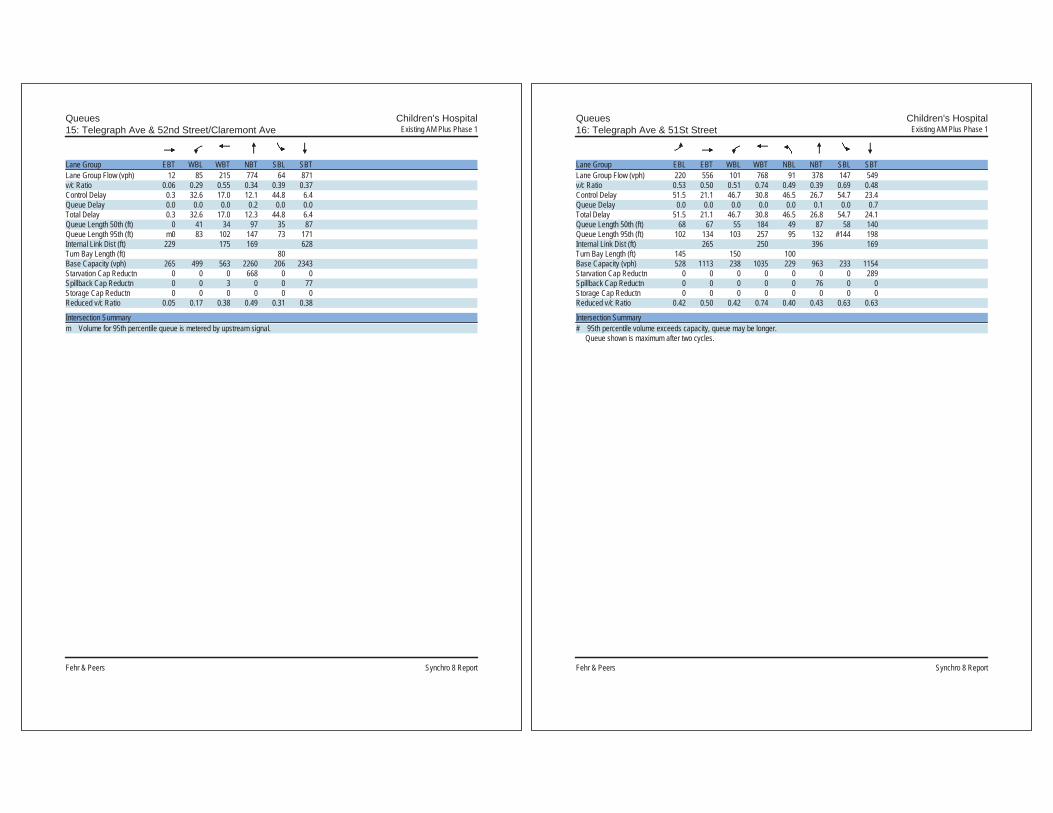
Queues Children's Hospital15: Telegraph Ave & 52nd Street/Claremont Ave Existing AM Plus Phase 1
Fehr & Peers Synchro 8 Report
Lane Group EBT WBL WBT NBT SBL SBTLane Group Flow (vph) 12 85 215 774 64 871v/c Ratio 0.06 0.29 0.55 0.34 0.39 0.37Control Delay 0.3 32.6 17.0 12.1 44.8 6.4Queue Delay 0.0 0.0 0.0 0.2 0.0 0.0Total Delay 0.3 32.6 17.0 12.3 44.8 6.4Queue Length 50th (ft) 0 41 34 97 35 87Queue Length 95th (ft) m0 83 102 147 73 171Internal Link Dist (ft) 229 175 169 628Turn Bay Length (ft) 80Base Capacity (vph) 265 499 563 2260 206 2343Starvation Cap Reductn 0 0 0 668 0 0Spillback Cap Reductn 0 0 3 0 0 77Storage Cap Reductn 0 0 0 0 0 0Reduced v/c Ratio 0.05 0.17 0.38 0.49 0.31 0.38
Intersection Summarym Volume for 95th percentile queue is metered by upstream signal.
Queues Children's Hospital16: Telegraph Ave & 51St Street Existing AM Plus Phase 1
Fehr & Peers Synchro 8 Report
Lane Group EBL EBT WBL WBT NBL NBT SBL SBTLane Group Flow (vph) 220 556 101 768 91 378 147 549v/c Ratio 0.53 0.50 0.51 0.74 0.49 0.39 0.69 0.48Control Delay 51.5 21.1 46.7 30.8 46.5 26.7 54.7 23.4Queue Delay 0.0 0.0 0.0 0.0 0.0 0.1 0.0 0.7Total Delay 51.5 21.1 46.7 30.8 46.5 26.8 54.7 24.1Queue Length 50th (ft) 68 67 55 184 49 87 58 140Queue Length 95th (ft) 102 134 103 257 95 132 #144 198Internal Link Dist (ft) 265 250 396 169Turn Bay Length (ft) 145 150 100Base Capacity (vph) 528 1113 238 1035 229 963 233 1154Starvation Cap Reductn 0 0 0 0 0 0 0 289Spillback Cap Reductn 0 0 0 0 0 76 0 0Storage Cap Reductn 0 0 0 0 0 0 0 0Reduced v/c Ratio 0.42 0.50 0.42 0.74 0.40 0.43 0.63 0.63
Intersection Summary# 95th percentile volume exceeds capacity, queue may be longer. Queue shown is maximum after two cycles.

Queues Children's Hospital17: SB SR-24 On-Ramp & MLK Way & NB SR-24 Off-Ramp Existing AM Plus Phase 1
Fehr & Peers Synchro 8 Report
Lane Group EBL WBR SBT SBRLane Group Flow (vph) 149 1506 1419 234v/c Ratio 0.26 0.93 0.62 0.08Control Delay 17.3 13.6 9.4 0.1Queue Delay 0.0 0.0 0.0 0.0Total Delay 17.3 13.6 9.4 0.1Queue Length 50th (ft) 17 0 398 0Queue Length 95th (ft) 36 #138 478 m0Internal Link Dist (ft) 344Turn Bay Length (ft)Base Capacity (vph) 581 1627 2303 2814Starvation Cap Reductn 0 0 0 0Spillback Cap Reductn 0 0 0 0Storage Cap Reductn 0 0 0 0Reduced v/c Ratio 0.26 0.93 0.62 0.08
Intersection Summary# 95th percentile volume exceeds capacity, queue may be longer. Queue shown is maximum after two cycles.m Volume for 95th percentile queue is metered by upstream signal.
Queues Children's Hospital 1: MLK Way & 55th Street Existing PM Plus Phase 1
Fehr & Peers Synchro 8 Report
Lane Group EBT WBT NBL NBT SBL SBTLane Group Flow (vph) 420 228 220 1715 86 1309v/c Ratio 0.82 0.64 0.58 0.69 0.51 0.72Control Delay 43.2 37.0 23.6 9.1 53.0 31.9Queue Delay 0.0 0.0 0.0 0.0 0.0 0.0Total Delay 43.2 37.0 23.6 9.1 53.0 31.9Queue Length 50th (ft) 231 120 76 75 53 260Queue Length 95th (ft) 316 184 155 82 101 #361Internal Link Dist (ft) 641 561 214 352Turn Bay Length (ft) 120 120Base Capacity (vph) 631 440 380 2495 203 1816Starvation Cap Reductn 0 0 0 0 0 0Spillback Cap Reductn 0 0 0 0 0 0Storage Cap Reductn 0 0 0 0 0 0Reduced v/c Ratio 0.67 0.52 0.58 0.69 0.42 0.72
Intersection Summary# 95th percentile volume exceeds capacity, queue may be longer. Queue shown is maximum after two cycles.

Queues Children's Hospital 3: 55th Street & Shattuck Ave Existing PM Plus Phase 1
Fehr & Peers Synchro 8 Report
Lane Group EBT WBT NBT SBTLane Group Flow (vph) 453 186 583 572v/c Ratio 0.76 0.30 0.61 0.58Control Delay 31.8 18.1 16.0 15.4Queue Delay 0.0 0.0 0.0 0.0Total Delay 31.8 18.1 16.0 15.4Queue Length 50th (ft) 192 59 185 178Queue Length 95th (ft) #335 107 286 273Internal Link Dist (ft) 597 600 202 432Turn Bay Length (ft)Base Capacity (vph) 600 628 956 982Starvation Cap Reductn 0 0 0 0Spillback Cap Reductn 0 0 0 0Storage Cap Reductn 0 0 0 0Reduced v/c Ratio 0.76 0.30 0.61 0.58
Intersection Summary# 95th percentile volume exceeds capacity, queue may be longer. Queue shown is maximum after two cycles.
Queues Children's Hospital 4: 55th Street & Telegraph Ave Existing PM Plus Phase 1
Fehr & Peers Synchro 8 Report
Lane Group EBT WBT NBL NBT SBL SBTLane Group Flow (vph) 389 70 70 937 20 1021v/c Ratio 0.85 0.15 0.32 0.48 0.08 0.52Control Delay 44.0 15.3 17.9 13.6 12.2 14.1Queue Delay 0.0 0.0 0.0 0.0 0.0 0.0Total Delay 44.0 15.3 17.9 13.6 12.2 14.1Queue Length 50th (ft) 187 19 21 162 5 182Queue Length 95th (ft) #298 46 59 232 18 258Internal Link Dist (ft) 600 153 628 434Turn Bay Length (ft) 110 65Base Capacity (vph) 529 540 221 1966 255 1968Starvation Cap Reductn 0 0 0 0 0 0Spillback Cap Reductn 0 0 0 0 0 0Storage Cap Reductn 0 0 0 0 0 0Reduced v/c Ratio 0.74 0.13 0.32 0.48 0.08 0.52
Intersection Summary# 95th percentile volume exceeds capacity, queue may be longer. Queue shown is maximum after two cycles.

Queues Children's Hospital 8: MLK Way & 53rd Street Existing PM Plus Phase 1
Fehr & Peers Synchro 8 Report
Lane Group EBT WBT NBL NBT SBL SBTLane Group Flow (vph) 53 35 16 2010 12 1569v/c Ratio 0.17 0.13 0.14 0.53 0.10 0.42Control Delay 10.4 27.7 64.9 2.6 34.8 5.1Queue Delay 0.0 0.0 0.0 0.3 0.0 0.0Total Delay 10.4 27.7 64.9 2.9 34.8 5.1Queue Length 50th (ft) 4 18 11 8 8 3Queue Length 95th (ft) 30 m36 m17 84 m12 438Internal Link Dist (ft) 491 487 57 219Turn Bay Length (ft) 120 120Base Capacity (vph) 561 502 141 3775 169 3735Starvation Cap Reductn 0 0 0 906 0 0Spillback Cap Reductn 2 0 0 0 0 336Storage Cap Reductn 0 0 0 0 0 0Reduced v/c Ratio 0.09 0.07 0.11 0.70 0.07 0.46
Intersection Summarym Volume for 95th percentile queue is metered by upstream signal.
Queues Children's Hospital 10: MLK Way & 52nd Street Existing PM Plus Phase 1
Fehr & Peers Synchro 8 Report
Lane Group EBL EBT WBT WBR NBL NBT SBL SBTLane Group Flow (vph) 66 212 204 207 116 1756 144 1506v/c Ratio 0.28 0.47 0.80 0.38 0.60 0.78 0.46 0.58Control Delay 30.6 27.2 54.6 10.5 46.7 28.3 26.1 5.5Queue Delay 0.0 0.5 24.6 2.3 0.0 0.1 0.0 0.2Total Delay 30.6 27.7 79.2 12.8 46.7 28.4 26.1 5.8Queue Length 50th (ft) 31 83 84 1 69 393 96 339Queue Length 95th (ft) 66 148 144 69 m73 m405 127 21Internal Link Dist (ft) 152 97 124 74Turn Bay Length (ft) 120 120Base Capacity (vph) 296 554 315 618 294 2244 312 2575Starvation Cap Reductn 0 0 105 288 0 0 0 342Spillback Cap Reductn 0 114 0 1 0 25 0 0Storage Cap Reductn 0 0 0 0 0 0 0 0Reduced v/c Ratio 0.22 0.48 0.97 0.63 0.39 0.79 0.46 0.67
Intersection Summarym Volume for 95th percentile queue is metered by upstream signal.
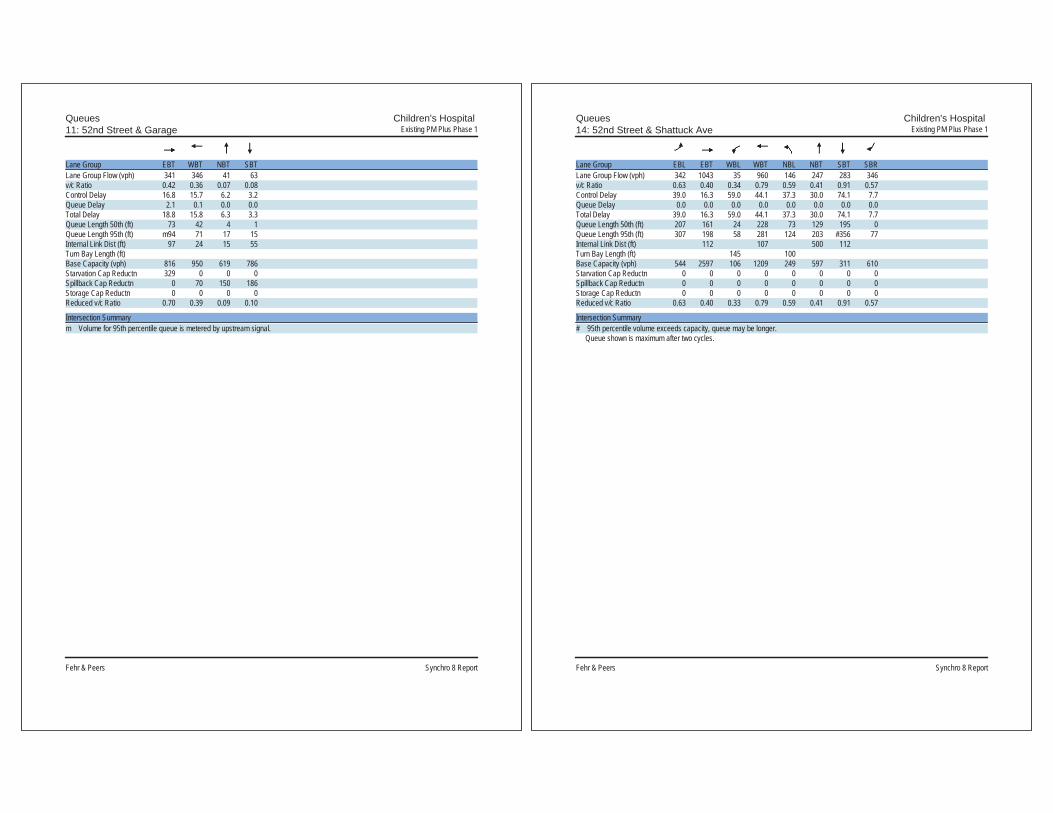
Queues Children's Hospital 11: 52nd Street & Garage Existing PM Plus Phase 1
Fehr & Peers Synchro 8 Report
Lane Group EBT WBT NBT SBTLane Group Flow (vph) 341 346 41 63v/c Ratio 0.42 0.36 0.07 0.08Control Delay 16.8 15.7 6.2 3.2Queue Delay 2.1 0.1 0.0 0.0Total Delay 18.8 15.8 6.3 3.3Queue Length 50th (ft) 73 42 4 1Queue Length 95th (ft) m94 71 17 15Internal Link Dist (ft) 97 24 15 55Turn Bay Length (ft)Base Capacity (vph) 816 950 619 786Starvation Cap Reductn 329 0 0 0Spillback Cap Reductn 0 70 150 186Storage Cap Reductn 0 0 0 0Reduced v/c Ratio 0.70 0.39 0.09 0.10
Intersection Summarym Volume for 95th percentile queue is metered by upstream signal.
Queues Children's Hospital 14: 52nd Street & Shattuck Ave Existing PM Plus Phase 1
Fehr & Peers Synchro 8 Report
Lane Group EBL EBT WBL WBT NBL NBT SBT SBRLane Group Flow (vph) 342 1043 35 960 146 247 283 346v/c Ratio 0.63 0.40 0.34 0.79 0.59 0.41 0.91 0.57Control Delay 39.0 16.3 59.0 44.1 37.3 30.0 74.1 7.7Queue Delay 0.0 0.0 0.0 0.0 0.0 0.0 0.0 0.0Total Delay 39.0 16.3 59.0 44.1 37.3 30.0 74.1 7.7Queue Length 50th (ft) 207 161 24 228 73 129 195 0Queue Length 95th (ft) 307 198 58 281 124 203 #356 77Internal Link Dist (ft) 112 107 500 112Turn Bay Length (ft) 145 100Base Capacity (vph) 544 2597 106 1209 249 597 311 610Starvation Cap Reductn 0 0 0 0 0 0 0 0Spillback Cap Reductn 0 0 0 0 0 0 0 0Storage Cap Reductn 0 0 0 0 0 0 0 0Reduced v/c Ratio 0.63 0.40 0.33 0.79 0.59 0.41 0.91 0.57
Intersection Summary# 95th percentile volume exceeds capacity, queue may be longer. Queue shown is maximum after two cycles.

Queues Children's Hospital 15: Telegraph Ave & 52nd Street/Claremont Ave Existing PM Plus Phase 1
Fehr & Peers Synchro 8 Report
Lane Group EBT WBL WBT NBT SBL SBTLane Group Flow (vph) 33 89 239 1080 101 948v/c Ratio 0.27 0.31 0.72 0.56 0.54 0.44Control Delay 60.8 37.3 36.0 12.4 52.5 9.5Queue Delay 1.5 0.5 3.8 0.3 0.0 0.0Total Delay 62.3 37.8 39.8 12.7 52.5 9.6Queue Length 50th (ft) 14 50 90 247 62 152Queue Length 95th (ft) m16 94 174 m337 112 221Internal Link Dist (ft) 229 175 169 628Turn Bay Length (ft) 80Base Capacity (vph) 150 382 414 1938 238 2138Starvation Cap Reductn 0 0 0 310 0 0Spillback Cap Reductn 47 106 104 0 0 128Storage Cap Reductn 0 0 0 0 0 0Reduced v/c Ratio 0.32 0.32 0.77 0.66 0.42 0.47
Intersection Summarym Volume for 95th percentile queue is metered by upstream signal.
Queues Children's Hospital 16: Telegraph Ave & 51St Street Existing PM Plus Phase 1
Fehr & Peers Synchro 8 Report
Lane Group EBL EBT WBL WBT NBL NBT SBL SBTLane Group Flow (vph) 305 692 56 706 79 671 262 520v/c Ratio 0.64 0.69 0.37 0.88 0.60 0.58 1.15 0.37Control Delay 46.9 35.3 49.3 47.4 65.3 28.9 151.0 16.0Queue Delay 0.0 0.0 0.0 0.2 0.0 5.3 0.7 0.6Total Delay 46.9 35.3 49.3 47.6 65.3 34.2 151.7 16.6Queue Length 50th (ft) 95 205 34 207 49 177 ~205 72Queue Length 95th (ft) 135 273 72 #310 #131 247 #366 92Internal Link Dist (ft) 265 250 396 169Turn Bay Length (ft) 145 150 100Base Capacity (vph) 578 1009 214 802 132 1156 227 1395Starvation Cap Reductn 0 0 0 0 0 0 10 505Spillback Cap Reductn 0 0 0 4 0 413 0 0Storage Cap Reductn 0 0 0 0 0 0 0 0Reduced v/c Ratio 0.53 0.69 0.26 0.88 0.60 0.90 1.21 0.58
Intersection Summary~ Volume exceeds capacity, queue is theoretically infinite. Queue shown is maximum after two cycles.# 95th percentile volume exceeds capacity, queue may be longer. Queue shown is maximum after two cycles.
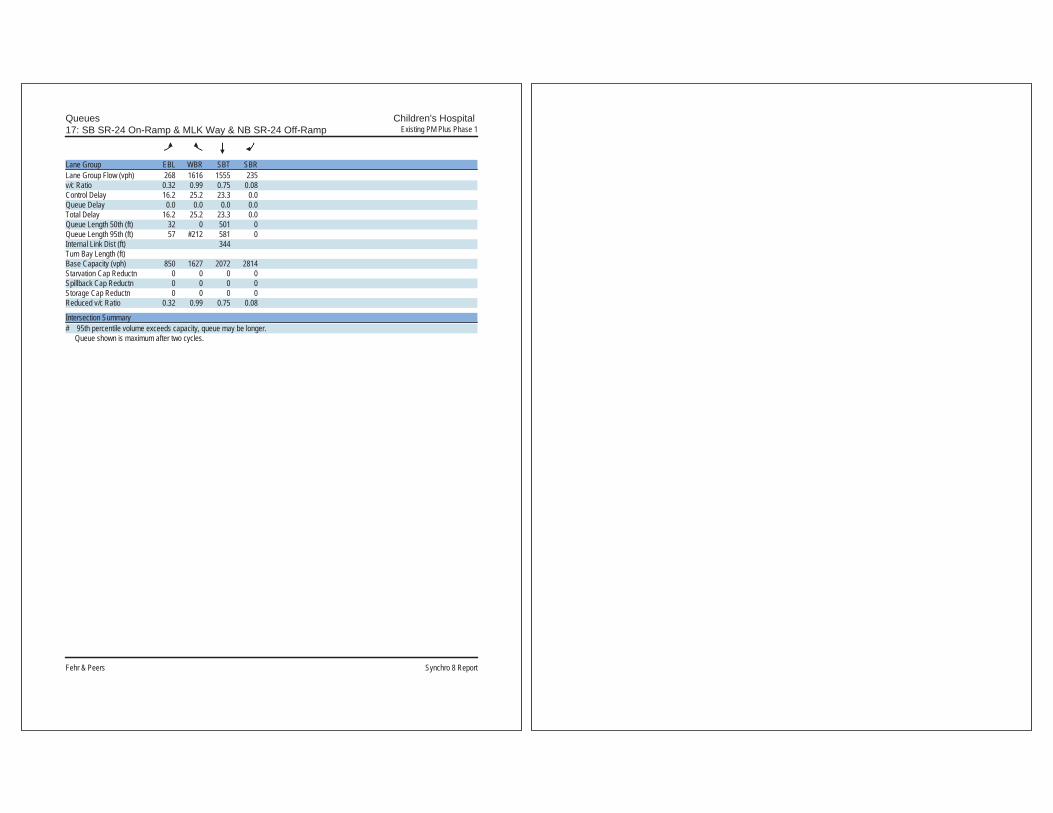
Queues Children's Hospital 17: SB SR-24 On-Ramp & MLK Way & NB SR-24 Off-Ramp Existing PM Plus Phase 1
Fehr & Peers Synchro 8 Report
Lane Group EBL WBR SBT SBRLane Group Flow (vph) 268 1616 1555 235v/c Ratio 0.32 0.99 0.75 0.08Control Delay 16.2 25.2 23.3 0.0Queue Delay 0.0 0.0 0.0 0.0Total Delay 16.2 25.2 23.3 0.0Queue Length 50th (ft) 32 0 501 0Queue Length 95th (ft) 57 #212 581 0Internal Link Dist (ft) 344Turn Bay Length (ft)Base Capacity (vph) 850 1627 2072 2814Starvation Cap Reductn 0 0 0 0Spillback Cap Reductn 0 0 0 0Storage Cap Reductn 0 0 0 0Reduced v/c Ratio 0.32 0.99 0.75 0.08
Intersection Summary# 95th percentile volume exceeds capacity, queue may be longer. Queue shown is maximum after two cycles.
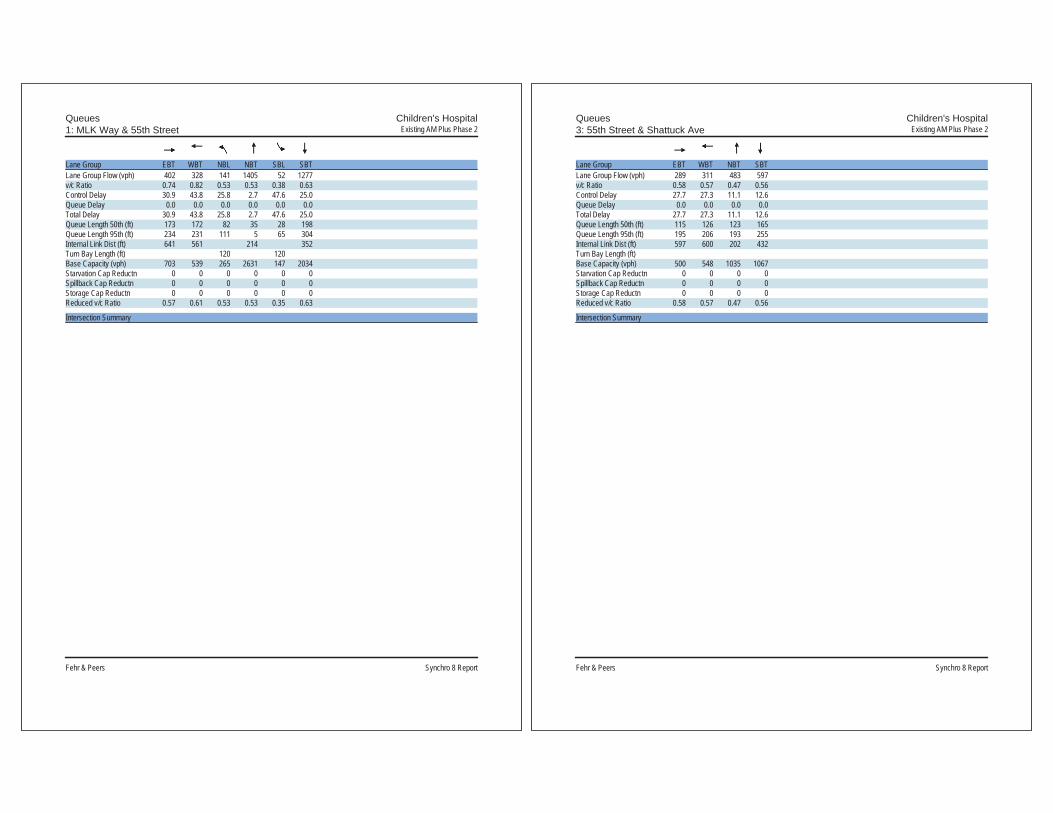
Queues Children's Hospital1: MLK Way & 55th Street Existing AM Plus Phase 2
Fehr & Peers Synchro 8 Report
Lane Group EBT WBT NBL NBT SBL SBTLane Group Flow (vph) 402 328 141 1405 52 1277v/c Ratio 0.74 0.82 0.53 0.53 0.38 0.63Control Delay 30.9 43.8 25.8 2.7 47.6 25.0Queue Delay 0.0 0.0 0.0 0.0 0.0 0.0Total Delay 30.9 43.8 25.8 2.7 47.6 25.0Queue Length 50th (ft) 173 172 82 35 28 198Queue Length 95th (ft) 234 231 111 5 65 304Internal Link Dist (ft) 641 561 214 352Turn Bay Length (ft) 120 120Base Capacity (vph) 703 539 265 2631 147 2034Starvation Cap Reductn 0 0 0 0 0 0Spillback Cap Reductn 0 0 0 0 0 0Storage Cap Reductn 0 0 0 0 0 0Reduced v/c Ratio 0.57 0.61 0.53 0.53 0.35 0.63
Intersection Summary
Queues Children's Hospital3: 55th Street & Shattuck Ave Existing AM Plus Phase 2
Fehr & Peers Synchro 8 Report
Lane Group EBT WBT NBT SBTLane Group Flow (vph) 289 311 483 597v/c Ratio 0.58 0.57 0.47 0.56Control Delay 27.7 27.3 11.1 12.6Queue Delay 0.0 0.0 0.0 0.0Total Delay 27.7 27.3 11.1 12.6Queue Length 50th (ft) 115 126 123 165Queue Length 95th (ft) 195 206 193 255Internal Link Dist (ft) 597 600 202 432Turn Bay Length (ft)Base Capacity (vph) 500 548 1035 1067Starvation Cap Reductn 0 0 0 0Spillback Cap Reductn 0 0 0 0Storage Cap Reductn 0 0 0 0Reduced v/c Ratio 0.58 0.57 0.47 0.56
Intersection Summary

Queues Children's Hospital4: 55th Street & Telegraph Ave Existing AM Plus Phase 2
Fehr & Peers Synchro 8 Report
Lane Group EBT WBT NBL NBT SBL SBTLane Group Flow (vph) 240 51 58 755 27 1067v/c Ratio 0.69 0.15 0.22 0.34 0.07 0.49Control Delay 29.5 16.5 10.5 7.5 7.7 8.3Queue Delay 0.0 0.0 0.0 0.0 0.0 0.0Total Delay 29.5 16.5 10.5 7.5 7.7 8.3Queue Length 50th (ft) 80 14 9 66 4 98Queue Length 95th (ft) 133 35 36 127 16 189Internal Link Dist (ft) 600 153 628 434Turn Bay Length (ft) 110 65Base Capacity (vph) 510 517 262 2210 401 2175Starvation Cap Reductn 0 0 0 0 0 0Spillback Cap Reductn 0 0 0 0 0 0Storage Cap Reductn 0 0 0 0 0 0Reduced v/c Ratio 0.47 0.10 0.22 0.34 0.07 0.49
Intersection Summary
Queues Children's Hospital8: MLK Way & 53rd Street Existing AM Plus Phase 2
Fehr & Peers Synchro 8 Report
Lane Group EBT WBT NBL NBT SBL SBTLane Group Flow (vph) 42 29 21 1581 11 1563v/c Ratio 0.13 0.10 0.16 0.41 0.09 0.42Control Delay 9.9 16.2 47.9 5.0 20.7 2.8Queue Delay 0.0 0.0 0.0 0.2 0.0 0.0Total Delay 9.9 16.2 47.9 5.3 20.7 2.8Queue Length 50th (ft) 4 10 13 10 6 3Queue Length 95th (ft) 24 m19 m15 305 m9 79Internal Link Dist (ft) 491 487 57 219Turn Bay Length (ft) 120 120Base Capacity (vph) 607 584 157 3817 188 3752Starvation Cap Reductn 0 0 0 1238 0 0Spillback Cap Reductn 0 0 0 0 0 0Storage Cap Reductn 0 0 0 0 0 0Reduced v/c Ratio 0.07 0.05 0.13 0.61 0.06 0.42
Intersection Summarym Volume for 95th percentile queue is metered by upstream signal.

Queues Children's Hospital10: MLK Way & 52nd Street Existing AM Plus Phase 2
Fehr & Peers Synchro 8 Report
Lane Group EBL EBT WBT WBR NBL NBT SBL SBTLane Group Flow (vph) 38 180 164 241 106 1583 118 1477v/c Ratio 0.13 0.38 0.50 0.42 0.74 0.68 0.48 0.56Control Delay 22.8 15.8 32.0 5.4 56.4 23.3 33.9 13.7Queue Delay 0.0 0.0 30.6 2.8 0.0 0.2 0.0 0.2Total Delay 22.8 15.8 62.6 8.2 56.4 23.5 33.9 13.9Queue Length 50th (ft) 14 41 69 0 60 303 51 104Queue Length 95th (ft) 37 91 124 49 m68 m332 86 175Internal Link Dist (ft) 152 97 124 74Turn Bay Length (ft) 120 120Base Capacity (vph) 388 625 446 690 148 2337 248 2632Starvation Cap Reductn 0 0 277 337 0 0 0 326Spillback Cap Reductn 0 0 0 7 0 161 0 0Storage Cap Reductn 0 0 0 0 0 0 0 0Reduced v/c Ratio 0.10 0.29 0.97 0.68 0.72 0.73 0.48 0.64
Intersection Summarym Volume for 95th percentile queue is metered by upstream signal.
Queues Children's Hospital11: 52nd Street & Garage Existing AM Plus Phase 2
Fehr & Peers Synchro 8 Report
Lane Group EBT WBT NBT SBTLane Group Flow (vph) 282 390 15 17v/c Ratio 0.36 0.49 0.02 0.02Control Delay 11.6 13.2 6.5 4.6Queue Delay 10.1 0.0 0.0 0.0Total Delay 21.6 13.2 6.5 4.6Queue Length 50th (ft) 53 79 2 0Queue Length 95th (ft) 98 140 9 8Internal Link Dist (ft) 97 24 15 55Turn Bay Length (ft)Base Capacity (vph) 777 795 654 769Starvation Cap Reductn 457 0 0 0Spillback Cap Reductn 0 0 0 0Storage Cap Reductn 0 0 0 0Reduced v/c Ratio 0.88 0.49 0.02 0.02
Intersection Summary

Queues Children's Hospital14: 52nd Street & Shattuck Ave Existing AM Plus Phase 2
Fehr & Peers Synchro 8 Report
Lane Group EBL EBT WBL WBT NBL NBT SBT SBRLane Group Flow (vph) 326 844 24 979 154 153 232 378v/c Ratio 0.77 0.40 0.18 1.00 0.37 0.20 0.55 0.55Control Delay 45.4 18.8 49.3 59.0 18.7 15.7 32.2 6.1Queue Delay 0.0 0.0 0.0 0.0 0.0 0.0 0.0 0.0Total Delay 45.4 18.8 49.3 59.0 18.7 15.7 32.2 6.1Queue Length 50th (ft) 173 100 15 ~210 53 48 110 0Queue Length 95th (ft) #298 168 m27 #290 93 88 185 65Internal Link Dist (ft) 112 107 500 112Turn Bay Length (ft) 145 100Base Capacity (vph) 426 2102 250 976 418 752 423 691Starvation Cap Reductn 0 0 0 0 0 0 0 0Spillback Cap Reductn 0 0 0 0 0 0 0 0Storage Cap Reductn 0 0 0 0 0 0 0 0Reduced v/c Ratio 0.77 0.40 0.10 1.00 0.37 0.20 0.55 0.55
Intersection Summary~ Volume exceeds capacity, queue is theoretically infinite. Queue shown is maximum after two cycles.# 95th percentile volume exceeds capacity, queue may be longer. Queue shown is maximum after two cycles.m Volume for 95th percentile queue is metered by upstream signal.
Queues Children's Hospital15: Telegraph Ave & 52nd Street/Claremont Ave Existing AM Plus Phase 2
Fehr & Peers Synchro 8 Report
Lane Group EBT WBL WBT NBT SBL SBTLane Group Flow (vph) 12 85 215 782 64 887v/c Ratio 0.06 0.29 0.55 0.35 0.39 0.38Control Delay 0.3 32.6 17.0 12.4 44.8 6.4Queue Delay 0.0 0.0 0.0 0.2 0.0 0.0Total Delay 0.3 32.6 17.0 12.6 44.8 6.4Queue Length 50th (ft) 0 41 34 100 35 88Queue Length 95th (ft) m0 83 102 154 73 173Internal Link Dist (ft) 229 175 169 628Turn Bay Length (ft) 80Base Capacity (vph) 265 499 563 2263 206 2339Starvation Cap Reductn 0 0 0 669 0 0Spillback Cap Reductn 0 0 3 0 0 76Storage Cap Reductn 0 0 0 0 0 0Reduced v/c Ratio 0.05 0.17 0.38 0.49 0.31 0.39
Intersection Summarym Volume for 95th percentile queue is metered by upstream signal.

Queues Children's Hospital16: Telegraph Ave & 51St Street Existing AM Plus Phase 2
Fehr & Peers Synchro 8 Report
Lane Group EBL EBT WBL WBT NBL NBT SBL SBTLane Group Flow (vph) 228 561 101 772 97 378 147 549v/c Ratio 0.54 0.50 0.51 0.75 0.52 0.39 0.69 0.48Control Delay 51.8 21.2 46.7 31.2 47.1 26.7 54.6 23.6Queue Delay 0.0 0.0 0.0 0.0 0.0 0.1 0.0 0.7Total Delay 51.8 21.2 46.7 31.2 47.1 26.8 54.6 24.3Queue Length 50th (ft) 71 66 55 186 53 87 58 141Queue Length 95th (ft) 106 136 103 259 100 132 #145 193Internal Link Dist (ft) 265 250 396 169Turn Bay Length (ft) 145 150 100Base Capacity (vph) 528 1113 238 1030 229 962 233 1146Starvation Cap Reductn 0 0 0 0 0 0 0 285Spillback Cap Reductn 0 0 0 0 0 81 0 0Storage Cap Reductn 0 0 0 0 0 0 0 0Reduced v/c Ratio 0.43 0.50 0.42 0.75 0.42 0.43 0.63 0.64
Intersection Summary# 95th percentile volume exceeds capacity, queue may be longer. Queue shown is maximum after two cycles.
Queues Children's Hospital17: SB SR-24 On-Ramp & MLK Way & NB SR-24 Off-Ramp Existing AM Plus Phase 2
Fehr & Peers Synchro 8 Report
Lane Group EBL WBR SBT SBRLane Group Flow (vph) 151 1535 1435 235v/c Ratio 0.26 0.94 0.62 0.08Control Delay 17.3 15.9 9.5 0.1Queue Delay 0.0 0.0 0.0 0.0Total Delay 17.3 15.9 9.5 0.1Queue Length 50th (ft) 17 0 398 0Queue Length 95th (ft) 36 #156 477 m0Internal Link Dist (ft) 344Turn Bay Length (ft)Base Capacity (vph) 581 1627 2303 2814Starvation Cap Reductn 0 0 0 0Spillback Cap Reductn 0 0 0 0Storage Cap Reductn 0 0 0 0Reduced v/c Ratio 0.26 0.94 0.62 0.08
Intersection Summary# 95th percentile volume exceeds capacity, queue may be longer. Queue shown is maximum after two cycles.m Volume for 95th percentile queue is metered by upstream signal.

Queues Children's Hospital 1: MLK Way & 55th Street Existing PM Plus Phase 2
Children's Hospital 8:00 am 11/12/2013 Existing PM Plus Phase 2 Synchro 8 Report
Lane Group EBT WBT NBL NBT SBL SBTLane Group Flow (vph) 420 228 220 1726 86 1312v/c Ratio 0.82 0.64 0.58 0.69 0.51 0.72Control Delay 43.2 37.0 23.1 9.6 53.0 32.0Queue Delay 0.0 0.0 0.0 0.0 0.0 0.0Total Delay 43.2 37.0 23.1 9.6 53.0 32.0Queue Length 50th (ft) 231 120 73 90 53 260Queue Length 95th (ft) 316 184 155 83 101 #374Internal Link Dist (ft) 641 561 214 352Turn Bay Length (ft) 120 120Base Capacity (vph) 631 440 380 2496 203 1816Starvation Cap Reductn 0 0 0 0 0 0Spillback Cap Reductn 0 0 0 0 0 0Storage Cap Reductn 0 0 0 0 0 0Reduced v/c Ratio 0.67 0.52 0.58 0.69 0.42 0.72
Intersection Summary# 95th percentile volume exceeds capacity, queue may be longer. Queue shown is maximum after two cycles.

Queues Children's Hospital 3: 55th Street & Shattuck Ave Existing PM Plus Phase 2
Children's Hospital 8:00 am 11/12/2013 Existing PM Plus Phase 2 Synchro 8 Report
Lane Group EBT WBT NBT SBTLane Group Flow (vph) 456 188 586 572v/c Ratio 0.76 0.30 0.61 0.58Control Delay 32.1 18.1 16.1 15.4Queue Delay 0.0 0.0 0.0 0.0Total Delay 32.1 18.1 16.1 15.4Queue Length 50th (ft) 194 59 186 178Queue Length 95th (ft) #339 109 289 274Internal Link Dist (ft) 597 600 202 432Turn Bay Length (ft)Base Capacity (vph) 600 626 956 981Starvation Cap Reductn 0 0 0 0Spillback Cap Reductn 0 0 0 0Storage Cap Reductn 0 0 0 0Reduced v/c Ratio 0.76 0.30 0.61 0.58
Intersection Summary# 95th percentile volume exceeds capacity, queue may be longer. Queue shown is maximum after two cycles.
Queues Children's Hospital 4: 55th Street & Telegraph Ave Existing PM Plus Phase 2
Children's Hospital 8:00 am 11/12/2013 Existing PM Plus Phase 2 Synchro 8 Report
Lane Group EBT WBT NBL NBT SBL SBTLane Group Flow (vph) 395 70 70 956 20 1028v/c Ratio 0.86 0.15 0.32 0.49 0.08 0.53Control Delay 44.7 15.2 18.3 13.9 12.4 14.3Queue Delay 0.0 0.0 0.0 0.0 0.0 0.0Total Delay 44.7 15.2 18.3 13.9 12.4 14.3Queue Length 50th (ft) 190 19 21 169 5 185Queue Length 95th (ft) #325 46 60 238 19 261Internal Link Dist (ft) 600 153 628 434Turn Bay Length (ft) 110 65Base Capacity (vph) 528 539 216 1955 245 1957Starvation Cap Reductn 0 0 0 0 0 0Spillback Cap Reductn 0 0 0 0 0 0Storage Cap Reductn 0 0 0 0 0 0Reduced v/c Ratio 0.75 0.13 0.32 0.49 0.08 0.53
Intersection Summary# 95th percentile volume exceeds capacity, queue may be longer. Queue shown is maximum after two cycles.
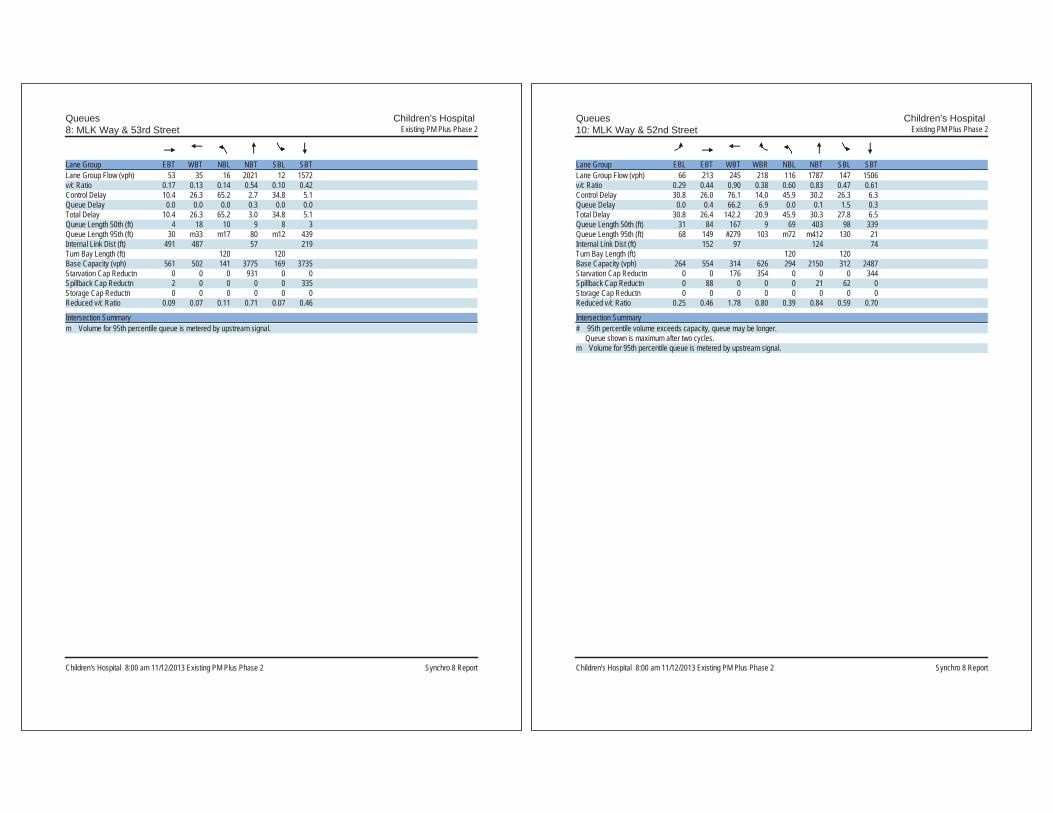
Queues Children's Hospital 8: MLK Way & 53rd Street Existing PM Plus Phase 2
Children's Hospital 8:00 am 11/12/2013 Existing PM Plus Phase 2 Synchro 8 Report
Lane Group EBT WBT NBL NBT SBL SBTLane Group Flow (vph) 53 35 16 2021 12 1572v/c Ratio 0.17 0.13 0.14 0.54 0.10 0.42Control Delay 10.4 26.3 65.2 2.7 34.8 5.1Queue Delay 0.0 0.0 0.0 0.3 0.0 0.0Total Delay 10.4 26.3 65.2 3.0 34.8 5.1Queue Length 50th (ft) 4 18 10 9 8 3Queue Length 95th (ft) 30 m33 m17 80 m12 439Internal Link Dist (ft) 491 487 57 219Turn Bay Length (ft) 120 120Base Capacity (vph) 561 502 141 3775 169 3735Starvation Cap Reductn 0 0 0 931 0 0Spillback Cap Reductn 2 0 0 0 0 335Storage Cap Reductn 0 0 0 0 0 0Reduced v/c Ratio 0.09 0.07 0.11 0.71 0.07 0.46
Intersection Summarym Volume for 95th percentile queue is metered by upstream signal.
Queues Children's Hospital 10: MLK Way & 52nd Street Existing PM Plus Phase 2
Children's Hospital 8:00 am 11/12/2013 Existing PM Plus Phase 2 Synchro 8 Report
Lane Group EBL EBT WBT WBR NBL NBT SBL SBTLane Group Flow (vph) 66 213 245 218 116 1787 147 1506v/c Ratio 0.29 0.44 0.90 0.38 0.60 0.83 0.47 0.61Control Delay 30.8 26.0 76.1 14.0 45.9 30.2 26.3 6.3Queue Delay 0.0 0.4 66.2 6.9 0.0 0.1 1.5 0.3Total Delay 30.8 26.4 142.2 20.9 45.9 30.3 27.8 6.5Queue Length 50th (ft) 31 84 167 9 69 403 98 339Queue Length 95th (ft) 68 149 #279 103 m72 m412 130 21Internal Link Dist (ft) 152 97 124 74Turn Bay Length (ft) 120 120Base Capacity (vph) 264 554 314 626 294 2150 312 2487Starvation Cap Reductn 0 0 176 354 0 0 0 344Spillback Cap Reductn 0 88 0 0 0 21 62 0Storage Cap Reductn 0 0 0 0 0 0 0 0Reduced v/c Ratio 0.25 0.46 1.78 0.80 0.39 0.84 0.59 0.70
Intersection Summary# 95th percentile volume exceeds capacity, queue may be longer. Queue shown is maximum after two cycles.m Volume for 95th percentile queue is metered by upstream signal.

Queues Children's Hospital 11: 52nd Street & Garage Existing PM Plus Phase 2
Children's Hospital 8:00 am 11/12/2013 Existing PM Plus Phase 2 Synchro 8 Report
Lane Group EBT WBT NBT SBTLane Group Flow (vph) 376 405 20 63v/c Ratio 0.42 0.45 0.04 0.09Control Delay 9.6 10.6 8.0 4.0Queue Delay 3.4 1.1 0.1 0.1Total Delay 13.0 11.6 8.0 4.0Queue Length 50th (ft) 54 71 2 1Queue Length 95th (ft) m85 127 12 17Internal Link Dist (ft) 97 24 15 55Turn Bay Length (ft)Base Capacity (vph) 891 908 541 691Starvation Cap Reductn 409 0 0 0Spillback Cap Reductn 0 282 135 174Storage Cap Reductn 0 0 0 0Reduced v/c Ratio 0.78 0.65 0.05 0.12
Intersection Summarym Volume for 95th percentile queue is metered by upstream signal.
Queues Children's Hospital 14: 52nd Street & Shattuck Ave Existing PM Plus Phase 2
Children's Hospital 8:00 am 11/12/2013 Existing PM Plus Phase 2 Synchro 8 Report
Lane Group EBL EBT WBL WBT NBL NBT SBT SBRLane Group Flow (vph) 345 1073 35 968 146 247 283 347v/c Ratio 0.63 0.41 0.34 0.80 0.59 0.41 0.91 0.57Control Delay 39.2 16.5 59.0 44.4 37.3 30.0 74.1 7.7Queue Delay 0.0 0.0 0.0 0.0 0.0 0.0 0.0 0.0Total Delay 39.2 16.5 59.0 44.4 37.3 30.0 74.1 7.7Queue Length 50th (ft) 210 168 24 231 73 129 195 0Queue Length 95th (ft) 311 205 58 284 124 203 #356 77Internal Link Dist (ft) 112 107 500 112Turn Bay Length (ft) 145 100Base Capacity (vph) 544 2598 106 1209 249 597 311 611Starvation Cap Reductn 0 0 0 0 0 0 0 0Spillback Cap Reductn 0 0 0 0 0 0 0 0Storage Cap Reductn 0 0 0 0 0 0 0 0Reduced v/c Ratio 0.63 0.41 0.33 0.80 0.59 0.41 0.91 0.57
Intersection Summary# 95th percentile volume exceeds capacity, queue may be longer. Queue shown is maximum after two cycles.

Queues Children's Hospital 15: Telegraph Ave & 52nd Street/Claremont Ave Existing PM Plus Phase 2
Children's Hospital 8:00 am 11/12/2013 Existing PM Plus Phase 2 Synchro 8 Report
Lane Group EBT WBL WBT NBT SBL SBTLane Group Flow (vph) 33 89 239 1099 101 953v/c Ratio 0.27 0.31 0.72 0.57 0.54 0.45Control Delay 60.5 37.3 36.0 12.5 52.5 9.5Queue Delay 1.5 0.5 4.0 0.3 0.0 0.0Total Delay 62.0 37.8 39.9 12.8 52.5 9.5Queue Length 50th (ft) 14 50 90 249 62 153Queue Length 95th (ft) m16 94 174 m345 112 222Internal Link Dist (ft) 229 175 169 628Turn Bay Length (ft) 80Base Capacity (vph) 150 382 414 1937 238 2134Starvation Cap Reductn 0 0 0 309 0 0Spillback Cap Reductn 47 108 106 0 0 126Storage Cap Reductn 0 0 0 0 0 0Reduced v/c Ratio 0.32 0.32 0.78 0.68 0.42 0.47
Intersection Summarym Volume for 95th percentile queue is metered by upstream signal.
Queues Children's Hospital 16: Telegraph Ave & 51St Street Existing PM Plus Phase 2
Children's Hospital 8:00 am 11/12/2013 Existing PM Plus Phase 2 Synchro 8 Report
Lane Group EBL EBT WBL WBT NBL NBT SBL SBTLane Group Flow (vph) 324 703 56 707 81 671 262 520v/c Ratio 0.66 0.69 0.37 0.88 0.63 0.59 1.15 0.38Control Delay 47.2 35.1 49.3 47.5 67.9 29.3 151.1 16.2Queue Delay 0.0 0.0 0.0 0.2 0.0 6.5 0.7 0.7Total Delay 47.2 35.1 49.3 47.7 67.9 35.8 151.7 16.8Queue Length 50th (ft) 101 208 34 208 51 179 ~205 72Queue Length 95th (ft) 143 278 72 #310 #135 247 #366 92Internal Link Dist (ft) 265 250 396 169Turn Bay Length (ft) 145 150 100Base Capacity (vph) 578 1021 214 802 129 1142 227 1386Starvation Cap Reductn 0 0 0 0 0 0 10 508Spillback Cap Reductn 0 0 0 4 0 413 0 0Storage Cap Reductn 0 0 0 0 0 0 0 0Reduced v/c Ratio 0.56 0.69 0.26 0.89 0.63 0.92 1.21 0.59
Intersection Summary~ Volume exceeds capacity, queue is theoretically infinite. Queue shown is maximum after two cycles.# 95th percentile volume exceeds capacity, queue may be longer. Queue shown is maximum after two cycles.

Queues Children's Hospital 17: SB SR-24 On-Ramp & MLK Way & NB SR-24 Off-Ramp Existing PM Plus Phase 2
Children's Hospital 8:00 am 11/12/2013 Existing PM Plus Phase 2 Synchro 8 Report
Lane Group EBL WBR SBT SBRLane Group Flow (vph) 269 1626 1589 238v/c Ratio 0.32 1.00 0.77 0.08Control Delay 16.2 26.7 24.2 0.0Queue Delay 0.0 0.0 0.0 0.0Total Delay 16.2 26.7 24.2 0.0Queue Length 50th (ft) 32 0 503 0Queue Length 95th (ft) 57 #219 586 m0Internal Link Dist (ft) 344Turn Bay Length (ft)Base Capacity (vph) 850 1627 2072 2814Starvation Cap Reductn 0 0 0 0Spillback Cap Reductn 0 0 0 0Storage Cap Reductn 0 0 0 0Reduced v/c Ratio 0.32 1.00 0.77 0.08
Intersection Summary# 95th percentile volume exceeds capacity, queue may be longer. Queue shown is maximum after two cycles.m Volume for 95th percentile queue is metered by upstream signal.
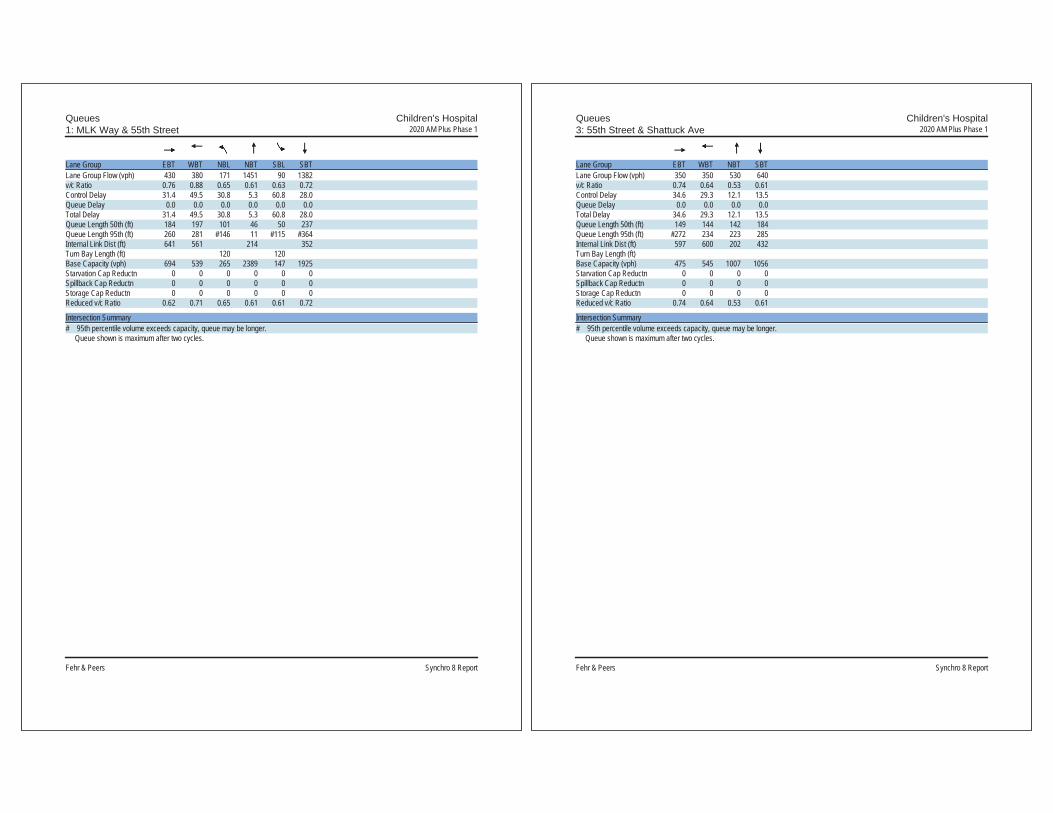
Queues Children's Hospital1: MLK Way & 55th Street 2020 AM Plus Phase 1
Fehr & Peers Synchro 8 Report
Lane Group EBT WBT NBL NBT SBL SBTLane Group Flow (vph) 430 380 171 1451 90 1382v/c Ratio 0.76 0.88 0.65 0.61 0.63 0.72Control Delay 31.4 49.5 30.8 5.3 60.8 28.0Queue Delay 0.0 0.0 0.0 0.0 0.0 0.0Total Delay 31.4 49.5 30.8 5.3 60.8 28.0Queue Length 50th (ft) 184 197 101 46 50 237Queue Length 95th (ft) 260 281 #146 11 #115 #364Internal Link Dist (ft) 641 561 214 352Turn Bay Length (ft) 120 120Base Capacity (vph) 694 539 265 2389 147 1925Starvation Cap Reductn 0 0 0 0 0 0Spillback Cap Reductn 0 0 0 0 0 0Storage Cap Reductn 0 0 0 0 0 0Reduced v/c Ratio 0.62 0.71 0.65 0.61 0.61 0.72
Intersection Summary# 95th percentile volume exceeds capacity, queue may be longer. Queue shown is maximum after two cycles.
Queues Children's Hospital3: 55th Street & Shattuck Ave 2020 AM Plus Phase 1
Fehr & Peers Synchro 8 Report
Lane Group EBT WBT NBT SBTLane Group Flow (vph) 350 350 530 640v/c Ratio 0.74 0.64 0.53 0.61Control Delay 34.6 29.3 12.1 13.5Queue Delay 0.0 0.0 0.0 0.0Total Delay 34.6 29.3 12.1 13.5Queue Length 50th (ft) 149 144 142 184Queue Length 95th (ft) #272 234 223 285Internal Link Dist (ft) 597 600 202 432Turn Bay Length (ft)Base Capacity (vph) 475 545 1007 1056Starvation Cap Reductn 0 0 0 0Spillback Cap Reductn 0 0 0 0Storage Cap Reductn 0 0 0 0Reduced v/c Ratio 0.74 0.64 0.53 0.61
Intersection Summary# 95th percentile volume exceeds capacity, queue may be longer. Queue shown is maximum after two cycles.

Queues Children's Hospital4: 55th Street & Telegraph Ave 2020 AM Plus Phase 1
Fehr & Peers Synchro 8 Report
Lane Group EBT WBT NBL NBT SBL SBTLane Group Flow (vph) 270 60 70 892 40 1244v/c Ratio 0.73 0.17 0.37 0.42 0.12 0.59Control Delay 30.6 16.2 16.9 8.7 9.2 10.3Queue Delay 0.0 0.0 0.0 0.0 0.0 0.0Total Delay 30.6 16.2 16.9 8.7 9.2 10.3Queue Length 50th (ft) 91 17 13 89 6 138Queue Length 95th (ft) 146 37 59 168 25 260Internal Link Dist (ft) 600 153 628 434Turn Bay Length (ft) 110 65Base Capacity (vph) 510 494 190 2148 322 2118Starvation Cap Reductn 0 0 0 0 0 0Spillback Cap Reductn 0 0 0 0 0 0Storage Cap Reductn 0 0 0 0 0 0Reduced v/c Ratio 0.53 0.12 0.37 0.42 0.12 0.59
Intersection Summary
Queues Children's Hospital8: MLK Way & 53rd Street 2020 AM Plus Phase 1
Fehr & Peers Synchro 8 Report
Lane Group EBT WBT NBL NBT SBL SBTLane Group Flow (vph) 60 50 30 1639 20 1663v/c Ratio 0.18 0.16 0.22 0.47 0.14 0.48Control Delay 11.8 17.5 48.4 6.2 21.7 3.7Queue Delay 0.0 0.0 0.0 0.4 0.0 0.0Total Delay 11.8 17.5 48.4 6.6 21.7 3.7Queue Length 50th (ft) 11 17 18 14 11 21Queue Length 95th (ft) 33 m26 m22 372 m13 88Internal Link Dist (ft) 491 487 57 219Turn Bay Length (ft) 120 120Base Capacity (vph) 610 587 157 3501 188 3445Starvation Cap Reductn 0 0 0 1171 0 0Spillback Cap Reductn 0 0 0 0 0 0Storage Cap Reductn 0 0 0 0 0 0Reduced v/c Ratio 0.10 0.09 0.19 0.70 0.11 0.48
Intersection Summarym Volume for 95th percentile queue is metered by upstream signal.
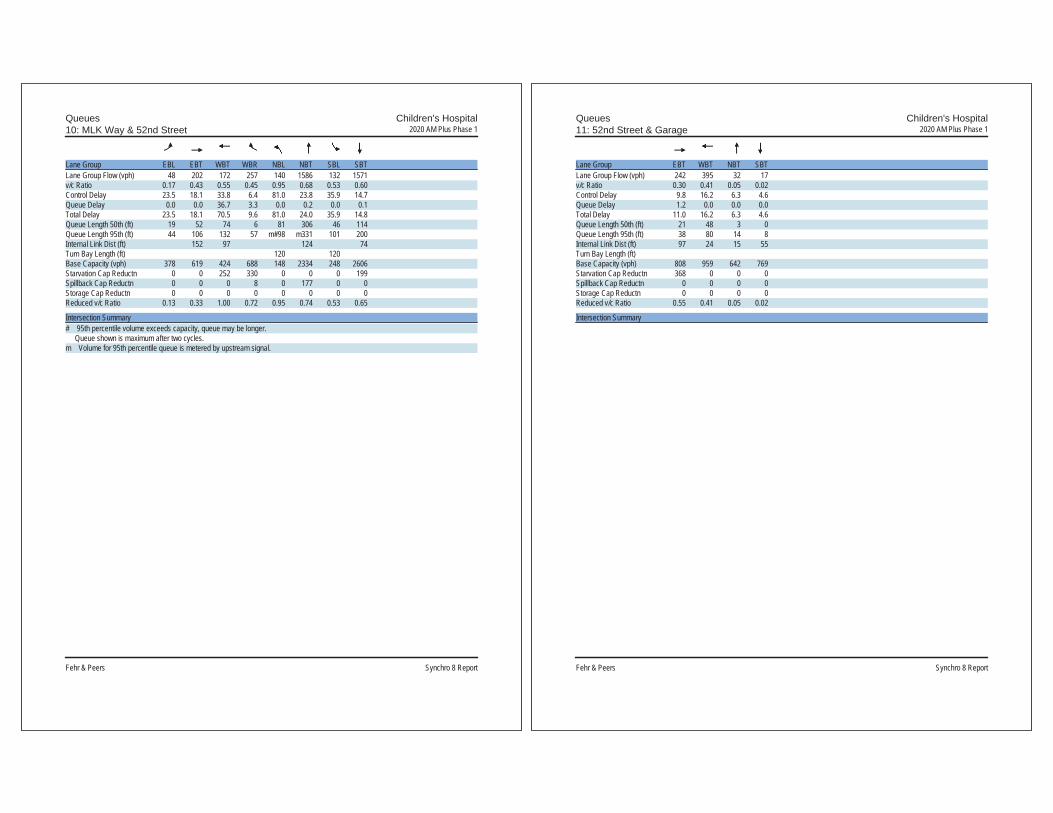
Queues Children's Hospital10: MLK Way & 52nd Street 2020 AM Plus Phase 1
Fehr & Peers Synchro 8 Report
Lane Group EBL EBT WBT WBR NBL NBT SBL SBTLane Group Flow (vph) 48 202 172 257 140 1586 132 1571v/c Ratio 0.17 0.43 0.55 0.45 0.95 0.68 0.53 0.60Control Delay 23.5 18.1 33.8 6.4 81.0 23.8 35.9 14.7Queue Delay 0.0 0.0 36.7 3.3 0.0 0.2 0.0 0.1Total Delay 23.5 18.1 70.5 9.6 81.0 24.0 35.9 14.8Queue Length 50th (ft) 19 52 74 6 81 306 46 114Queue Length 95th (ft) 44 106 132 57 m#98 m331 101 200Internal Link Dist (ft) 152 97 124 74Turn Bay Length (ft) 120 120Base Capacity (vph) 378 619 424 688 148 2334 248 2606Starvation Cap Reductn 0 0 252 330 0 0 0 199Spillback Cap Reductn 0 0 0 8 0 177 0 0Storage Cap Reductn 0 0 0 0 0 0 0 0Reduced v/c Ratio 0.13 0.33 1.00 0.72 0.95 0.74 0.53 0.65
Intersection Summary# 95th percentile volume exceeds capacity, queue may be longer. Queue shown is maximum after two cycles.m Volume for 95th percentile queue is metered by upstream signal.
Queues Children's Hospital11: 52nd Street & Garage 2020 AM Plus Phase 1
Fehr & Peers Synchro 8 Report
Lane Group EBT WBT NBT SBTLane Group Flow (vph) 242 395 32 17v/c Ratio 0.30 0.41 0.05 0.02Control Delay 9.8 16.2 6.3 4.6Queue Delay 1.2 0.0 0.0 0.0Total Delay 11.0 16.2 6.3 4.6Queue Length 50th (ft) 21 48 3 0Queue Length 95th (ft) 38 80 14 8Internal Link Dist (ft) 97 24 15 55Turn Bay Length (ft)Base Capacity (vph) 808 959 642 769Starvation Cap Reductn 368 0 0 0Spillback Cap Reductn 0 0 0 0Storage Cap Reductn 0 0 0 0Reduced v/c Ratio 0.55 0.41 0.05 0.02
Intersection Summary

Queues Children's Hospital14: 52nd Street & Shattuck Ave 2020 AM Plus Phase 1
Fehr & Peers Synchro 8 Report
Lane Group EBL EBT WBL WBT NBL NBT SBT SBRLane Group Flow (vph) 340 902 40 1065 170 170 270 390v/c Ratio 0.80 0.46 0.27 1.09 0.44 0.23 0.64 0.56Control Delay 47.9 21.3 46.8 84.7 20.1 15.7 35.6 6.2Queue Delay 0.0 0.0 0.0 0.0 0.0 0.0 0.0 0.0Total Delay 47.9 21.3 46.8 84.7 20.1 15.7 35.6 6.2Queue Length 50th (ft) 182 139 24 ~254 59 53 132 0Queue Length 95th (ft) #317 187 m39 #329 102 96 219 67Internal Link Dist (ft) 112 107 500 112Turn Bay Length (ft) 145 100Base Capacity (vph) 426 1946 250 976 388 748 420 693Starvation Cap Reductn 0 0 0 0 0 0 0 0Spillback Cap Reductn 0 0 0 0 0 0 0 0Storage Cap Reductn 0 0 0 0 0 0 0 0Reduced v/c Ratio 0.80 0.46 0.16 1.09 0.44 0.23 0.64 0.56
Intersection Summary~ Volume exceeds capacity, queue is theoretically infinite. Queue shown is maximum after two cycles.# 95th percentile volume exceeds capacity, queue may be longer. Queue shown is maximum after two cycles.m Volume for 95th percentile queue is metered by upstream signal.
Queues Children's Hospital15: Telegraph Ave & 52nd Street/Claremont Ave 2020 AM Plus Phase 1
Fehr & Peers Synchro 8 Report
Lane Group EBT WBL WBT NBT SBL SBTLane Group Flow (vph) 30 99 251 912 90 1044v/c Ratio 0.23 0.34 0.64 0.48 0.51 0.49Control Delay 48.4 33.5 21.7 17.9 48.1 10.3Queue Delay 0.0 0.1 0.2 0.2 0.0 0.1Total Delay 48.4 33.6 21.9 18.1 48.1 10.4Queue Length 50th (ft) 11 48 52 136 49 169Queue Length 95th (ft) m17 94 130 307 96 240Internal Link Dist (ft) 229 175 169 628Turn Bay Length (ft) 80Base Capacity (vph) 164 499 562 1888 206 2134Starvation Cap Reductn 0 0 0 323 0 0Spillback Cap Reductn 0 54 50 0 0 139Storage Cap Reductn 0 0 0 0 0 0Reduced v/c Ratio 0.18 0.22 0.49 0.58 0.44 0.52
Intersection Summarym Volume for 95th percentile queue is metered by upstream signal.

Queues Children's Hospital16: Telegraph Ave & 51St Street 2020 AM Plus Phase 1
Fehr & Peers Synchro 8 Report
Lane Group EBL EBT WBL WBT NBL NBT SBL SBTLane Group Flow (vph) 262 610 120 830 111 450 180 640v/c Ratio 0.58 0.59 0.59 0.81 0.57 0.49 0.80 0.58Control Delay 50.0 26.5 49.2 34.0 49.1 28.8 73.2 21.9Queue Delay 0.0 0.0 0.0 0.5 0.0 1.2 0.0 0.9Total Delay 50.0 26.5 49.2 34.5 49.1 30.0 73.2 22.8Queue Length 50th (ft) 80 95 65 204 60 109 104 140Queue Length 95th (ft) 117 168 120 #288 113 159 #211 175Internal Link Dist (ft) 265 250 396 169Turn Bay Length (ft) 145 150 100Base Capacity (vph) 528 1033 238 1023 229 920 233 1113Starvation Cap Reductn 0 0 0 0 0 0 0 226Spillback Cap Reductn 0 0 0 31 0 267 0 0Storage Cap Reductn 0 0 0 0 0 0 0 0Reduced v/c Ratio 0.50 0.59 0.50 0.84 0.48 0.69 0.77 0.72
Intersection Summary# 95th percentile volume exceeds capacity, queue may be longer. Queue shown is maximum after two cycles.
Queues Children's Hospital17: SB SR-24 On-Ramp & MLK Way & NB SR-24 Off-Ramp 2020 AM Plus Phase 1
Fehr & Peers Synchro 8 Report
Lane Group EBL WBR SBT SBRLane Group Flow (vph) 191 1555 1522 251v/c Ratio 0.33 0.96 0.66 0.09Control Delay 18.0 17.8 10.2 0.1Queue Delay 0.0 0.0 0.0 0.0Total Delay 18.0 17.8 10.2 0.1Queue Length 50th (ft) 22 0 157 0Queue Length 95th (ft) 44 #168 m502 m0Internal Link Dist (ft) 344Turn Bay Length (ft)Base Capacity (vph) 581 1627 2303 2814Starvation Cap Reductn 0 0 0 0Spillback Cap Reductn 0 0 0 0Storage Cap Reductn 0 0 0 0Reduced v/c Ratio 0.33 0.96 0.66 0.09
Intersection Summary# 95th percentile volume exceeds capacity, queue may be longer. Queue shown is maximum after two cycles.m Volume for 95th percentile queue is metered by upstream signal.

Queues Children's Hospital 1: MLK Way & 55th Street 2020 PM Plus Phase 1
Fehr & Peers Synchro 8 Report
Lane Group EBT WBT NBL NBT SBL SBTLane Group Flow (vph) 450 300 240 1800 130 1381v/c Ratio 0.85 0.84 0.63 0.79 0.69 0.79Control Delay 46.0 51.1 25.5 12.1 62.4 34.6Queue Delay 0.0 0.0 0.0 0.0 0.0 0.0Total Delay 46.0 51.1 25.5 12.1 62.4 34.6Queue Length 50th (ft) 249 168 91 113 80 289Queue Length 95th (ft) 348 259 176 #179 #156 #409Internal Link Dist (ft) 641 561 214 352Turn Bay Length (ft) 120 120Base Capacity (vph) 624 424 380 2277 203 1755Starvation Cap Reductn 0 0 0 0 0 0Spillback Cap Reductn 0 0 0 0 0 0Storage Cap Reductn 0 0 0 0 0 0Reduced v/c Ratio 0.72 0.71 0.63 0.79 0.64 0.79
Intersection Summary# 95th percentile volume exceeds capacity, queue may be longer. Queue shown is maximum after two cycles.

Queues Children's Hospital 3: 55th Street & Shattuck Ave 2020 PM Plus Phase 1
Fehr & Peers Synchro 8 Report
Lane Group EBT WBT NBT SBTLane Group Flow (vph) 528 240 650 620v/c Ratio 0.90 0.40 0.71 0.65Control Delay 45.5 19.9 19.1 17.0Queue Delay 0.0 0.0 0.0 0.0Total Delay 45.5 19.9 19.1 17.0Queue Length 50th (ft) 242 80 224 203Queue Length 95th (ft) #434 141 354 315Internal Link Dist (ft) 597 600 202 432Turn Bay Length (ft)Base Capacity (vph) 585 600 914 956Starvation Cap Reductn 0 0 0 0Spillback Cap Reductn 0 0 0 0Storage Cap Reductn 0 0 0 0Reduced v/c Ratio 0.90 0.40 0.71 0.65
Intersection Summary# 95th percentile volume exceeds capacity, queue may be longer. Queue shown is maximum after two cycles.
Queues Children's Hospital 4: 55th Street & Telegraph Ave 2020 PM Plus Phase 1
Fehr & Peers Synchro 8 Report
Lane Group EBT WBT NBL NBT SBL SBTLane Group Flow (vph) 438 90 90 1057 20 1101v/c Ratio 0.91 0.19 0.51 0.56 0.10 0.58Control Delay 49.9 15.7 27.5 15.6 13.4 15.9Queue Delay 0.0 0.0 0.0 0.0 0.0 0.0Total Delay 49.9 15.7 27.5 15.6 13.4 15.9Queue Length 50th (ft) 209 25 33 209 6 220Queue Length 95th (ft) #381 58 #98 273 19 287Internal Link Dist (ft) 600 153 628 434Turn Bay Length (ft) 110 65Base Capacity (vph) 528 518 178 1889 195 1887Starvation Cap Reductn 0 0 0 0 0 0Spillback Cap Reductn 0 0 0 0 0 0Storage Cap Reductn 0 0 0 0 0 0Reduced v/c Ratio 0.83 0.17 0.51 0.56 0.10 0.58
Intersection Summary# 95th percentile volume exceeds capacity, queue may be longer. Queue shown is maximum after two cycles.

Queues Children's Hospital 8: MLK Way & 53rd Street 2020 PM Plus Phase 1
Fehr & Peers Synchro 8 Report
Lane Group EBT WBT NBL NBT SBL SBTLane Group Flow (vph) 80 50 20 2101 20 1633v/c Ratio 0.25 0.19 0.17 0.58 0.16 0.44Control Delay 12.0 27.7 64.3 3.6 35.2 5.4Queue Delay 0.0 0.0 0.0 0.4 0.0 0.0Total Delay 12.0 27.7 64.3 4.0 35.2 5.5Queue Length 50th (ft) 12 25 13 9 14 4Queue Length 95th (ft) 41 m46 m20 #89 m20 454Internal Link Dist (ft) 491 487 57 219Turn Bay Length (ft) 120 120Base Capacity (vph) 565 498 141 3626 169 3714Starvation Cap Reductn 0 0 0 870 0 0Spillback Cap Reductn 3 0 0 0 0 353Storage Cap Reductn 0 0 0 0 0 0Reduced v/c Ratio 0.14 0.10 0.14 0.76 0.12 0.49
Intersection Summary# 95th percentile volume exceeds capacity, queue may be longer. Queue shown is maximum after two cycles.m Volume for 95th percentile queue is metered by upstream signal.
Queues Children's Hospital 10: MLK Way & 52nd Street 2020 PM Plus Phase 1
Fehr & Peers Synchro 8 Report
Lane Group EBL EBT WBT WBR NBL NBT SBL SBTLane Group Flow (vph) 71 229 225 216 140 1832 151 1572v/c Ratio 0.30 0.49 0.88 0.39 0.65 0.83 0.48 0.64Control Delay 31.3 28.2 65.1 10.1 45.9 30.0 26.1 7.0Queue Delay 0.0 0.7 53.7 2.2 0.0 0.2 0.0 0.3Total Delay 31.3 28.9 118.8 12.4 45.9 30.1 26.1 7.2Queue Length 50th (ft) 34 94 94 1 85 418 101 365Queue Length 95th (ft) 72 163 #236 70 m87 m415 128 26Internal Link Dist (ft) 152 97 124 74Turn Bay Length (ft) 120 120Base Capacity (vph) 279 549 306 622 294 2198 312 2465Starvation Cap Reductn 0 0 98 281 0 0 0 296Spillback Cap Reductn 0 118 0 1 0 37 0 0Storage Cap Reductn 0 0 0 0 0 0 0 0Reduced v/c Ratio 0.25 0.53 1.08 0.63 0.48 0.85 0.48 0.72
Intersection Summary# 95th percentile volume exceeds capacity, queue may be longer. Queue shown is maximum after two cycles.m Volume for 95th percentile queue is metered by upstream signal.

Queues Children's Hospital 11: 52nd Street & Garage 2020 PM Plus Phase 1
Fehr & Peers Synchro 8 Report
Lane Group EBT WBT NBT SBTLane Group Flow (vph) 358 358 41 63v/c Ratio 0.44 0.38 0.07 0.08Control Delay 16.6 15.9 6.2 3.2Queue Delay 2.3 0.2 0.0 0.0Total Delay 18.9 16.0 6.3 3.3Queue Length 50th (ft) 74 43 4 1Queue Length 95th (ft) m93 73 17 15Internal Link Dist (ft) 97 24 15 55Turn Bay Length (ft)Base Capacity (vph) 815 949 611 786Starvation Cap Reductn 320 0 0 0Spillback Cap Reductn 0 127 151 190Storage Cap Reductn 0 0 0 0Reduced v/c Ratio 0.72 0.44 0.09 0.11
Intersection Summarym Volume for 95th percentile queue is metered by upstream signal.
Queues Children's Hospital 14: 52nd Street & Shattuck Ave 2020 PM Plus Phase 1
Fehr & Peers Synchro 8 Report
Lane Group EBL EBT WBL WBT NBL NBT SBT SBRLane Group Flow (vph) 370 1098 60 1032 160 300 300 360v/c Ratio 0.68 0.44 0.58 0.86 0.66 0.51 1.01 0.59Control Delay 41.0 17.7 72.6 47.4 41.8 31.9 96.4 7.9Queue Delay 0.0 0.0 0.0 0.0 0.0 0.0 0.0 0.0Total Delay 41.0 17.7 72.6 47.4 41.8 31.9 96.4 7.9Queue Length 50th (ft) 229 172 42 250 81 162 ~214 0Queue Length 95th (ft) 336 210 #98 305 #141 248 #394 80Internal Link Dist (ft) 112 107 500 112Turn Bay Length (ft) 145 100Base Capacity (vph) 544 2494 106 1205 243 593 298 615Starvation Cap Reductn 0 0 0 0 0 0 0 0Spillback Cap Reductn 0 0 0 0 0 0 0 0Storage Cap Reductn 0 0 0 0 0 0 0 0Reduced v/c Ratio 0.68 0.44 0.57 0.86 0.66 0.51 1.01 0.59
Intersection Summary~ Volume exceeds capacity, queue is theoretically infinite. Queue shown is maximum after two cycles.# 95th percentile volume exceeds capacity, queue may be longer. Queue shown is maximum after two cycles.

Queues Children's Hospital 15: Telegraph Ave & 52nd Street/Claremont Ave 2020 PM Plus Phase 1
Fehr & Peers Synchro 8 Report
Lane Group EBT WBL WBT NBT SBL SBTLane Group Flow (vph) 60 126 274 1247 140 1022v/c Ratio 0.43 0.41 0.79 0.75 0.67 0.51Control Delay 62.9 39.1 42.6 17.1 57.8 11.6Queue Delay 3.6 0.9 8.8 2.0 0.0 0.1Total Delay 66.6 40.0 51.4 19.1 57.8 11.6Queue Length 50th (ft) 23 72 115 317 85 179Queue Length 95th (ft) m27 127 209 m#495 148 250Internal Link Dist (ft) 229 175 169 628Turn Bay Length (ft) 80Base Capacity (vph) 158 382 409 1658 238 1987Starvation Cap Reductn 0 0 0 261 0 0Spillback Cap Reductn 48 103 101 0 0 135Storage Cap Reductn 0 0 0 0 0 0Reduced v/c Ratio 0.55 0.45 0.89 0.89 0.59 0.55
Intersection Summary# 95th percentile volume exceeds capacity, queue may be longer. Queue shown is maximum after two cycles.m Volume for 95th percentile queue is metered by upstream signal.
Queues Children's Hospital 16: Telegraph Ave & 51St Street 2020 PM Plus Phase 1
Fehr & Peers Synchro 8 Report
Lane Group EBL EBT WBL WBT NBL NBT SBL SBTLane Group Flow (vph) 317 761 70 760 101 810 280 601v/c Ratio 0.66 0.77 0.43 0.95 0.70 0.71 1.23 0.45Control Delay 47.1 38.4 50.5 58.2 71.9 32.4 178.0 16.1Queue Delay 0.0 0.0 0.0 0.8 0.0 51.9 0.6 1.1Total Delay 47.1 38.4 50.5 59.0 71.9 84.3 178.6 17.3Queue Length 50th (ft) 99 234 43 232 64 228 ~228 87Queue Length 95th (ft) 140 #310 85 #354 #171 312 #395 111Internal Link Dist (ft) 265 250 396 169Turn Bay Length (ft) 145 150 100Base Capacity (vph) 578 994 214 796 145 1142 227 1348Starvation Cap Reductn 0 0 0 0 0 0 9 492Spillback Cap Reductn 0 0 0 5 0 515 0 0Storage Cap Reductn 0 0 0 0 0 0 0 0Reduced v/c Ratio 0.55 0.77 0.33 0.96 0.70 1.29 1.28 0.70
Intersection Summary~ Volume exceeds capacity, queue is theoretically infinite. Queue shown is maximum after two cycles.# 95th percentile volume exceeds capacity, queue may be longer. Queue shown is maximum after two cycles.

Queues Children's Hospital 17: SB SR-24 On-Ramp & MLK Way & NB SR-24 Off-Ramp 2020 PM Plus Phase 1
Fehr & Peers Synchro 8 Report
Lane Group EBL WBR SBT SBRLane Group Flow (vph) 300 1672 1628 240v/c Ratio 0.35 1.03 0.79 0.09Control Delay 16.5 35.0 24.5 0.0Queue Delay 0.0 0.0 0.0 0.0Total Delay 16.5 35.0 24.5 0.0Queue Length 50th (ft) 36 ~29 539 0Queue Length 95th (ft) 63 #251 608 m0Internal Link Dist (ft) 344Turn Bay Length (ft)Base Capacity (vph) 850 1627 2072 2814Starvation Cap Reductn 0 0 0 0Spillback Cap Reductn 0 0 0 0Storage Cap Reductn 0 0 0 0Reduced v/c Ratio 0.35 1.03 0.79 0.09
Intersection Summary~ Volume exceeds capacity, queue is theoretically infinite. Queue shown is maximum after two cycles.# 95th percentile volume exceeds capacity, queue may be longer. Queue shown is maximum after two cycles.m Volume for 95th percentile queue is metered by upstream signal.

Queues Children's Hospital1: MLK Way & 55th Street 2020 AM Plus Phase 2
Fehr & Peers Synchro 8 Report
Lane Group EBT WBT NBL NBT SBL SBTLane Group Flow (vph) 430 380 171 1456 90 1391v/c Ratio 0.76 0.88 0.65 0.61 0.63 0.72Control Delay 31.4 49.5 30.5 5.1 60.8 28.1Queue Delay 0.0 0.0 0.0 0.0 0.0 0.0Total Delay 31.4 49.5 30.5 5.1 60.8 28.1Queue Length 50th (ft) 184 197 101 48 50 239Queue Length 95th (ft) 260 281 #146 11 #115 #368Internal Link Dist (ft) 641 561 214 352Turn Bay Length (ft) 120 120Base Capacity (vph) 694 539 265 2389 147 1925Starvation Cap Reductn 0 0 0 0 0 0Spillback Cap Reductn 0 0 0 0 0 0Storage Cap Reductn 0 0 0 0 0 0Reduced v/c Ratio 0.62 0.71 0.65 0.61 0.61 0.72
Intersection Summary# 95th percentile volume exceeds capacity, queue may be longer. Queue shown is maximum after two cycles.
Queues Children's Hospital3: 55th Street & Shattuck Ave 2020 AM Plus Phase 2
Fehr & Peers Synchro 8 Report
Lane Group EBT WBT NBT SBTLane Group Flow (vph) 352 355 531 640v/c Ratio 0.74 0.65 0.53 0.61Control Delay 35.2 29.8 12.1 13.5Queue Delay 0.0 0.0 0.0 0.0Total Delay 35.2 29.8 12.1 13.5Queue Length 50th (ft) 151 147 142 184Queue Length 95th (ft) #277 239 224 285Internal Link Dist (ft) 597 600 202 432Turn Bay Length (ft)Base Capacity (vph) 473 542 1006 1056Starvation Cap Reductn 0 0 0 0Spillback Cap Reductn 0 0 0 0Storage Cap Reductn 0 0 0 0Reduced v/c Ratio 0.74 0.65 0.53 0.61
Intersection Summary# 95th percentile volume exceeds capacity, queue may be longer. Queue shown is maximum after two cycles.

Queues Children's Hospital4: 55th Street & Telegraph Ave 2020 AM Plus Phase 2
Fehr & Peers Synchro 8 Report
Lane Group EBT WBT NBL NBT SBL SBTLane Group Flow (vph) 273 60 70 900 40 1265v/c Ratio 0.73 0.17 0.38 0.42 0.13 0.60Control Delay 30.8 16.1 17.8 8.9 9.3 10.6Queue Delay 0.0 0.0 0.0 0.0 0.0 0.0Total Delay 30.8 16.1 17.8 8.9 9.3 10.6Queue Length 50th (ft) 92 17 13 91 6 143Queue Length 95th (ft) 147 37 #62 172 26 269Internal Link Dist (ft) 600 153 628 434Turn Bay Length (ft) 110 65Base Capacity (vph) 509 494 183 2141 317 2111Starvation Cap Reductn 0 0 0 0 0 0Spillback Cap Reductn 0 0 0 0 0 0Storage Cap Reductn 0 0 0 0 0 0Reduced v/c Ratio 0.54 0.12 0.38 0.42 0.13 0.60
Intersection Summary# 95th percentile volume exceeds capacity, queue may be longer. Queue shown is maximum after two cycles.
Queues Children's Hospital8: MLK Way & 53rd Street 2020 AM Plus Phase 2
Fehr & Peers Synchro 8 Report
Lane Group EBT WBT NBL NBT SBL SBTLane Group Flow (vph) 60 50 30 1644 20 1672v/c Ratio 0.18 0.16 0.22 0.47 0.14 0.49Control Delay 11.8 17.3 48.8 6.2 21.6 3.7Queue Delay 0.0 0.0 0.0 0.5 0.0 0.0Total Delay 11.8 17.3 48.8 6.7 21.6 3.7Queue Length 50th (ft) 11 17 19 15 11 21Queue Length 95th (ft) 33 m26 m21 383 m13 88Internal Link Dist (ft) 491 487 57 219Turn Bay Length (ft) 120 120Base Capacity (vph) 610 587 157 3501 188 3445Starvation Cap Reductn 0 0 0 1218 0 0Spillback Cap Reductn 0 0 0 0 0 0Storage Cap Reductn 0 0 0 0 0 0Reduced v/c Ratio 0.10 0.09 0.19 0.72 0.11 0.49
Intersection Summarym Volume for 95th percentile queue is metered by upstream signal.

Queues Children's Hospital10: MLK Way & 52nd Street 2020 AM Plus Phase 2
Fehr & Peers Synchro 8 Report
Lane Group EBL EBT WBT WBR NBL NBT SBL SBTLane Group Flow (vph) 48 205 191 263 140 1641 141 1571v/c Ratio 0.18 0.42 0.65 0.45 0.95 0.72 0.57 0.61Control Delay 23.6 18.4 38.1 6.6 79.5 24.6 37.1 14.9Queue Delay 0.0 0.0 65.6 3.5 0.0 0.3 0.0 0.1Total Delay 23.6 18.4 103.7 10.1 79.5 24.9 37.1 15.0Queue Length 50th (ft) 19 54 84 8 82 321 49 114Queue Length 95th (ft) 44 109 151 60 m#97 m339 111 201Internal Link Dist (ft) 152 97 124 74Turn Bay Length (ft) 120 120Base Capacity (vph) 358 619 392 688 148 2288 248 2572Starvation Cap Reductn 0 0 218 328 0 0 0 199Spillback Cap Reductn 0 0 0 8 0 181 0 0Storage Cap Reductn 0 0 0 0 0 0 0 0Reduced v/c Ratio 0.13 0.33 1.10 0.73 0.95 0.78 0.57 0.66
Intersection Summary# 95th percentile volume exceeds capacity, queue may be longer. Queue shown is maximum after two cycles.m Volume for 95th percentile queue is metered by upstream signal.
Queues Children's Hospital11: 52nd Street & Garage 2020 AM Plus Phase 2
Fehr & Peers Synchro 8 Report
Lane Group EBT WBT NBT SBTLane Group Flow (vph) 310 425 15 17v/c Ratio 0.40 0.53 0.02 0.02Control Delay 12.0 13.9 6.5 4.6Queue Delay 15.5 0.0 0.0 0.0Total Delay 27.5 13.9 6.5 4.6Queue Length 50th (ft) 59 87 2 0Queue Length 95th (ft) 109 155 9 8Internal Link Dist (ft) 97 24 15 55Turn Bay Length (ft)Base Capacity (vph) 777 795 645 769Starvation Cap Reductn 447 0 0 0Spillback Cap Reductn 0 0 0 0Storage Cap Reductn 0 0 0 0Reduced v/c Ratio 0.94 0.53 0.02 0.02
Intersection Summary

Queues Children's Hospital14: 52nd Street & Shattuck Ave 2020 AM Plus Phase 2
Fehr & Peers Synchro 8 Report
Lane Group EBL EBT WBL WBT NBL NBT SBT SBRLane Group Flow (vph) 341 915 40 1091 170 170 270 392v/c Ratio 0.80 0.47 0.27 1.12 0.44 0.23 0.64 0.56Control Delay 48.1 21.4 46.7 94.9 20.1 15.7 35.6 6.2Queue Delay 0.0 0.0 0.0 0.0 0.0 0.0 0.0 0.0Total Delay 48.1 21.4 46.7 94.9 20.1 15.7 35.6 6.2Queue Length 50th (ft) 183 141 23 ~266 59 53 132 0Queue Length 95th (ft) #319 190 m39 #341 102 96 219 67Internal Link Dist (ft) 112 107 500 112Turn Bay Length (ft) 145 100Base Capacity (vph) 426 1947 250 976 388 748 420 695Starvation Cap Reductn 0 0 0 0 0 0 0 0Spillback Cap Reductn 0 0 0 0 0 0 0 0Storage Cap Reductn 0 0 0 0 0 0 0 0Reduced v/c Ratio 0.80 0.47 0.16 1.12 0.44 0.23 0.64 0.56
Intersection Summary~ Volume exceeds capacity, queue is theoretically infinite. Queue shown is maximum after two cycles.# 95th percentile volume exceeds capacity, queue may be longer. Queue shown is maximum after two cycles.m Volume for 95th percentile queue is metered by upstream signal.
Queues Children's Hospital15: Telegraph Ave & 52nd Street/Claremont Ave 2020 AM Plus Phase 2
Fehr & Peers Synchro 8 Report
Lane Group EBT WBL WBT NBT SBL SBTLane Group Flow (vph) 30 99 251 920 90 1060v/c Ratio 0.23 0.34 0.64 0.49 0.51 0.50Control Delay 48.2 33.5 21.7 18.2 48.1 10.4Queue Delay 0.0 0.1 0.2 0.2 0.0 0.1Total Delay 48.2 33.6 21.9 18.4 48.1 10.4Queue Length 50th (ft) 11 48 52 153 49 172Queue Length 95th (ft) m16 94 130 310 96 244Internal Link Dist (ft) 229 175 169 628Turn Bay Length (ft) 80Base Capacity (vph) 164 499 562 1886 206 2130Starvation Cap Reductn 0 0 0 322 0 0Spillback Cap Reductn 0 54 50 0 0 137Storage Cap Reductn 0 0 0 0 0 0Reduced v/c Ratio 0.18 0.22 0.49 0.59 0.44 0.53
Intersection Summarym Volume for 95th percentile queue is metered by upstream signal.

Queues Children's Hospital16: Telegraph Ave & 51St Street 2020 AM Plus Phase 2
Fehr & Peers Synchro 8 Report
Lane Group EBL EBT WBL WBT NBL NBT SBL SBTLane Group Flow (vph) 270 615 120 834 117 450 180 640v/c Ratio 0.59 0.59 0.59 0.82 0.59 0.49 0.80 0.58Control Delay 50.3 26.7 49.2 34.7 50.0 28.8 73.0 22.0Queue Delay 0.0 0.0 0.0 0.6 0.0 1.3 0.0 0.9Total Delay 50.3 26.7 49.2 35.3 50.0 30.1 73.0 22.9Queue Length 50th (ft) 83 96 65 206 63 109 104 142Queue Length 95th (ft) 120 170 120 #292 118 159 #211 173Internal Link Dist (ft) 265 250 396 169Turn Bay Length (ft) 145 150 100Base Capacity (vph) 528 1034 238 1016 229 920 233 1109Starvation Cap Reductn 0 0 0 0 0 0 0 226Spillback Cap Reductn 0 0 0 35 0 274 0 0Storage Cap Reductn 0 0 0 0 0 0 0 0Reduced v/c Ratio 0.51 0.59 0.50 0.85 0.51 0.70 0.77 0.72
Intersection Summary# 95th percentile volume exceeds capacity, queue may be longer. Queue shown is maximum after two cycles.
Queues Children's Hospital17: SB SR-24 On-Ramp & MLK Way & NB SR-24 Off-Ramp 2020 AM Plus Phase 2
Fehr & Peers Synchro 8 Report
Lane Group EBL WBR SBT SBRLane Group Flow (vph) 193 1584 1538 252v/c Ratio 0.33 0.97 0.67 0.09Control Delay 18.0 21.1 10.2 0.1Queue Delay 0.0 0.0 0.0 0.0Total Delay 18.0 21.1 10.2 0.1Queue Length 50th (ft) 22 0 157 0Queue Length 95th (ft) 44 #186 m501 m0Internal Link Dist (ft) 344Turn Bay Length (ft)Base Capacity (vph) 581 1627 2303 2814Starvation Cap Reductn 0 0 0 0Spillback Cap Reductn 0 0 0 0Storage Cap Reductn 0 0 0 0Reduced v/c Ratio 0.33 0.97 0.67 0.09
Intersection Summary# 95th percentile volume exceeds capacity, queue may be longer. Queue shown is maximum after two cycles.m Volume for 95th percentile queue is metered by upstream signal.

Queues Children's Hospital 1: MLK Way & 55th Street 2020 PM Plus Phase 2
Fehr & Peers Synchro 8 Report
Lane Group EBT WBT NBL NBT SBL SBTLane Group Flow (vph) 450 300 240 1811 130 1384v/c Ratio 0.85 0.84 0.63 0.80 0.69 0.79Control Delay 46.0 51.1 24.7 12.5 62.4 34.6Queue Delay 0.0 0.0 0.0 0.0 0.0 0.0Total Delay 46.0 51.1 24.7 12.5 62.4 34.6Queue Length 50th (ft) 249 168 89 115 80 290Queue Length 95th (ft) 348 259 176 #208 #156 #411Internal Link Dist (ft) 641 561 214 352Turn Bay Length (ft) 120 120Base Capacity (vph) 624 424 380 2277 203 1755Starvation Cap Reductn 0 0 0 0 0 0Spillback Cap Reductn 0 0 0 0 0 0Storage Cap Reductn 0 0 0 0 0 0Reduced v/c Ratio 0.72 0.71 0.63 0.80 0.64 0.79
Intersection Summary# 95th percentile volume exceeds capacity, queue may be longer. Queue shown is maximum after two cycles.
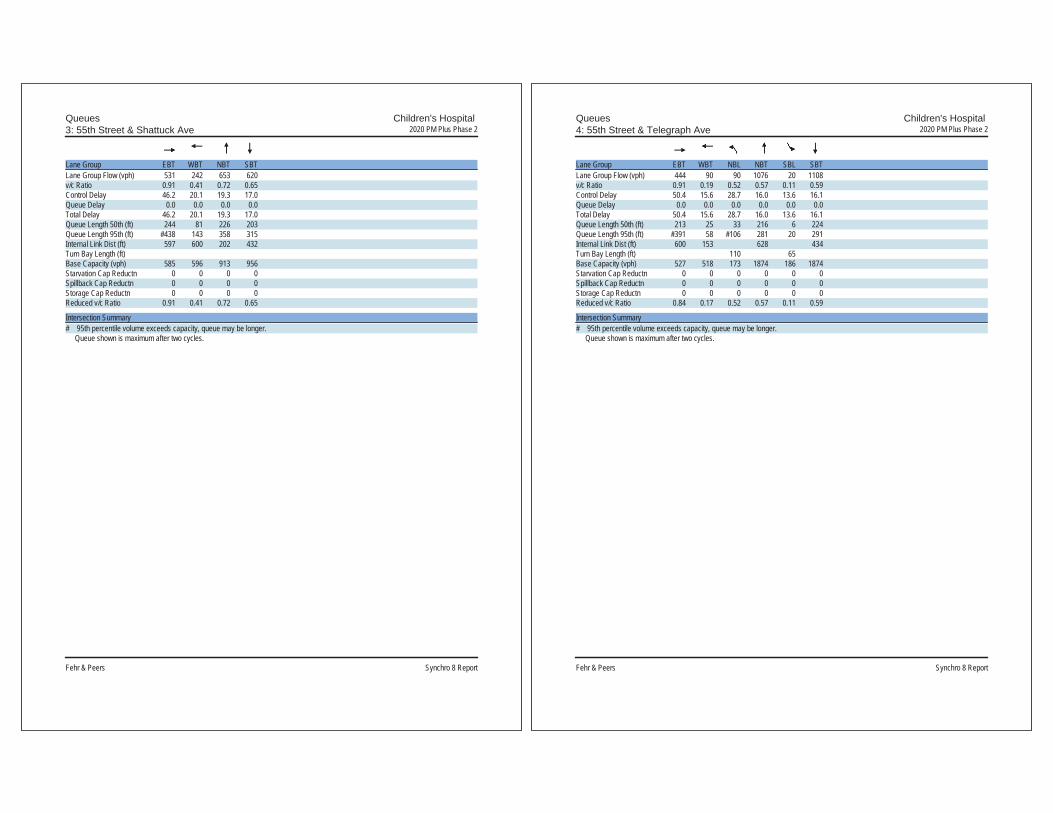
Queues Children's Hospital 3: 55th Street & Shattuck Ave 2020 PM Plus Phase 2
Fehr & Peers Synchro 8 Report
Lane Group EBT WBT NBT SBTLane Group Flow (vph) 531 242 653 620v/c Ratio 0.91 0.41 0.72 0.65Control Delay 46.2 20.1 19.3 17.0Queue Delay 0.0 0.0 0.0 0.0Total Delay 46.2 20.1 19.3 17.0Queue Length 50th (ft) 244 81 226 203Queue Length 95th (ft) #438 143 358 315Internal Link Dist (ft) 597 600 202 432Turn Bay Length (ft)Base Capacity (vph) 585 596 913 956Starvation Cap Reductn 0 0 0 0Spillback Cap Reductn 0 0 0 0Storage Cap Reductn 0 0 0 0Reduced v/c Ratio 0.91 0.41 0.72 0.65
Intersection Summary# 95th percentile volume exceeds capacity, queue may be longer. Queue shown is maximum after two cycles.
Queues Children's Hospital 4: 55th Street & Telegraph Ave 2020 PM Plus Phase 2
Fehr & Peers Synchro 8 Report
Lane Group EBT WBT NBL NBT SBL SBTLane Group Flow (vph) 444 90 90 1076 20 1108v/c Ratio 0.91 0.19 0.52 0.57 0.11 0.59Control Delay 50.4 15.6 28.7 16.0 13.6 16.1Queue Delay 0.0 0.0 0.0 0.0 0.0 0.0Total Delay 50.4 15.6 28.7 16.0 13.6 16.1Queue Length 50th (ft) 213 25 33 216 6 224Queue Length 95th (ft) #391 58 #106 281 20 291Internal Link Dist (ft) 600 153 628 434Turn Bay Length (ft) 110 65Base Capacity (vph) 527 518 173 1874 186 1874Starvation Cap Reductn 0 0 0 0 0 0Spillback Cap Reductn 0 0 0 0 0 0Storage Cap Reductn 0 0 0 0 0 0Reduced v/c Ratio 0.84 0.17 0.52 0.57 0.11 0.59
Intersection Summary# 95th percentile volume exceeds capacity, queue may be longer. Queue shown is maximum after two cycles.

Queues Children's Hospital 8: MLK Way & 53rd Street 2020 PM Plus Phase 2
Fehr & Peers Synchro 8 Report
Lane Group EBT WBT NBL NBT SBL SBTLane Group Flow (vph) 80 50 20 2112 20 1636v/c Ratio 0.25 0.19 0.17 0.58 0.16 0.44Control Delay 12.0 26.5 64.8 3.6 35.2 5.5Queue Delay 0.0 0.0 0.0 0.5 0.0 0.0Total Delay 12.0 26.5 64.8 4.1 35.2 5.5Queue Length 50th (ft) 12 25 13 10 14 4Queue Length 95th (ft) 41 m43 m19 #88 m20 454Internal Link Dist (ft) 491 487 57 219Turn Bay Length (ft) 120 120Base Capacity (vph) 565 498 141 3626 169 3714Starvation Cap Reductn 0 0 0 895 0 0Spillback Cap Reductn 3 0 0 0 0 353Storage Cap Reductn 0 0 0 0 0 0Reduced v/c Ratio 0.14 0.10 0.14 0.77 0.12 0.49
Intersection Summary# 95th percentile volume exceeds capacity, queue may be longer. Queue shown is maximum after two cycles.m Volume for 95th percentile queue is metered by upstream signal.
Queues Children's Hospital 10: MLK Way & 52nd Street 2020 PM Plus Phase 2
Fehr & Peers Synchro 8 Report
Lane Group EBL EBT WBT WBR NBL NBT SBL SBTLane Group Flow (vph) 71 230 266 227 140 1863 154 1572v/c Ratio 0.31 0.46 0.95 0.38 0.65 0.90 0.49 0.67Control Delay 31.1 26.6 82.9 13.6 45.6 33.1 26.3 8.4Queue Delay 0.0 0.5 62.3 11.1 0.0 0.4 5.5 0.4Total Delay 31.1 27.2 145.3 24.6 45.6 33.5 31.8 8.8Queue Length 50th (ft) 34 95 182 19 85 429 103 365Queue Length 95th (ft) 73 164 #316 111 m87 m423 129 26Internal Link Dist (ft) 152 97 124 74Turn Bay Length (ft) 120 120Base Capacity (vph) 252 550 308 629 294 2073 312 2349Starvation Cap Reductn 0 0 170 368 0 0 0 297Spillback Cap Reductn 0 100 0 1 0 33 105 0Storage Cap Reductn 0 0 0 0 0 0 0 0Reduced v/c Ratio 0.28 0.51 1.93 0.87 0.48 0.91 0.74 0.77
Intersection Summary# 95th percentile volume exceeds capacity, queue may be longer. Queue shown is maximum after two cycles.m Volume for 95th percentile queue is metered by upstream signal.

Queues Children's Hospital 11: 52nd Street & Garage 2020 PM Plus Phase 2
Fehr & Peers Synchro 8 Report
Lane Group EBT WBT NBT SBTLane Group Flow (vph) 393 417 20 63v/c Ratio 0.50 0.53 0.03 0.08Control Delay 13.5 13.8 6.4 3.2Queue Delay 7.3 2.9 0.0 0.0Total Delay 20.7 16.7 6.4 3.3Queue Length 50th (ft) 70 85 2 1Queue Length 95th (ft) m99 151 10 15Internal Link Dist (ft) 97 24 15 55Turn Bay Length (ft)Base Capacity (vph) 780 793 620 786Starvation Cap Reductn 335 0 0 0Spillback Cap Reductn 0 265 155 198Storage Cap Reductn 0 0 0 0Reduced v/c Ratio 0.88 0.79 0.04 0.11
Intersection Summarym Volume for 95th percentile queue is metered by upstream signal.
Queues Children's Hospital 14: 52nd Street & Shattuck Ave 2020 PM Plus Phase 2
Fehr & Peers Synchro 8 Report
Lane Group EBL EBT WBL WBT NBL NBT SBT SBRLane Group Flow (vph) 373 1128 60 1040 160 300 300 361v/c Ratio 0.69 0.45 0.58 0.86 0.66 0.51 1.01 0.59Control Delay 41.2 17.9 72.6 47.8 41.8 31.9 96.4 7.9Queue Delay 0.0 0.0 0.0 0.0 0.0 0.0 0.0 0.0Total Delay 41.2 17.9 72.6 47.8 41.8 31.9 96.4 7.9Queue Length 50th (ft) 231 179 42 252 81 162 ~214 0Queue Length 95th (ft) 340 218 #98 #309 #141 248 #394 80Internal Link Dist (ft) 112 107 500 112Turn Bay Length (ft) 145 100Base Capacity (vph) 544 2495 106 1205 243 593 298 616Starvation Cap Reductn 0 0 0 0 0 0 0 0Spillback Cap Reductn 0 0 0 0 0 0 0 0Storage Cap Reductn 0 0 0 0 0 0 0 0Reduced v/c Ratio 0.69 0.45 0.57 0.86 0.66 0.51 1.01 0.59
Intersection Summary~ Volume exceeds capacity, queue is theoretically infinite. Queue shown is maximum after two cycles.# 95th percentile volume exceeds capacity, queue may be longer. Queue shown is maximum after two cycles.

Queues Children's Hospital 15: Telegraph Ave & 52nd Street/Claremont Ave 2020 PM Plus Phase 2
Fehr & Peers Synchro 8 Report
Lane Group EBT WBL WBT NBT SBL SBTLane Group Flow (vph) 60 126 274 1266 140 1027v/c Ratio 0.43 0.41 0.79 0.76 0.67 0.52Control Delay 62.7 39.1 42.6 17.3 57.8 11.6Queue Delay 3.6 0.9 9.4 2.4 0.0 0.1Total Delay 66.4 40.0 52.0 19.8 57.8 11.7Queue Length 50th (ft) 23 72 115 319 85 180Queue Length 95th (ft) m27 127 209 m#509 148 252Internal Link Dist (ft) 229 175 169 628Turn Bay Length (ft) 80Base Capacity (vph) 158 382 409 1658 238 1983Starvation Cap Reductn 0 0 0 261 0 0Spillback Cap Reductn 48 106 103 0 0 135Storage Cap Reductn 0 0 0 0 0 0Reduced v/c Ratio 0.55 0.46 0.90 0.91 0.59 0.56
Intersection Summary# 95th percentile volume exceeds capacity, queue may be longer. Queue shown is maximum after two cycles.m Volume for 95th percentile queue is metered by upstream signal.
Queues Children's Hospital 16: Telegraph Ave & 51St Street 2020 PM Plus Phase 2
Fehr & Peers Synchro 8 Report
Lane Group EBL EBT WBL WBT NBL NBT SBL SBTLane Group Flow (vph) 336 772 70 761 103 810 280 601v/c Ratio 0.68 0.77 0.43 0.96 0.73 0.72 1.23 0.45Control Delay 47.4 38.1 50.5 58.7 76.2 32.9 178.2 16.3Queue Delay 0.0 0.0 0.0 0.7 0.0 52.0 0.6 1.2Total Delay 47.4 38.1 50.5 59.4 76.2 84.9 178.8 17.5Queue Length 50th (ft) 105 236 43 233 66 231 ~228 87Queue Length 95th (ft) 148 #321 85 #355 #175 312 #395 111Internal Link Dist (ft) 265 250 396 169Turn Bay Length (ft) 145 150 100Base Capacity (vph) 578 1007 214 795 141 1128 227 1341Starvation Cap Reductn 0 0 0 0 0 0 9 494Spillback Cap Reductn 0 0 0 4 0 513 0 0Storage Cap Reductn 0 0 0 0 0 0 0 0Reduced v/c Ratio 0.58 0.77 0.33 0.96 0.73 1.32 1.28 0.71
Intersection Summary~ Volume exceeds capacity, queue is theoretically infinite. Queue shown is maximum after two cycles.# 95th percentile volume exceeds capacity, queue may be longer. Queue shown is maximum after two cycles.
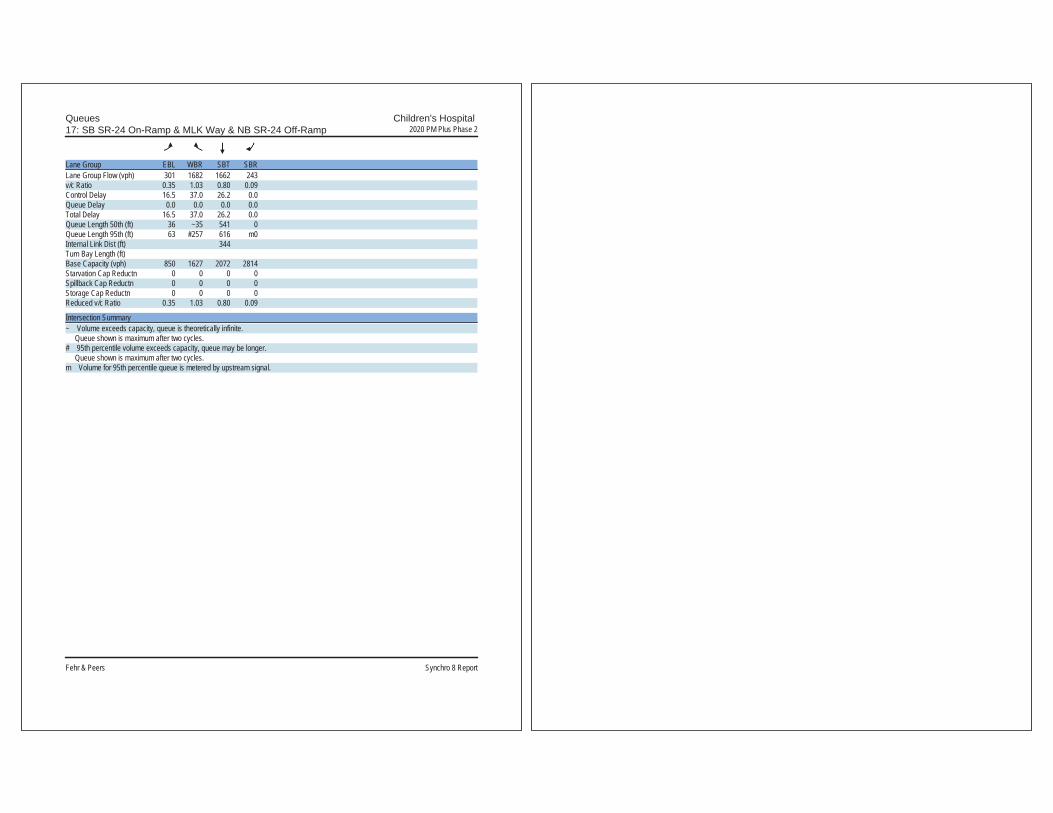
Queues Children's Hospital 17: SB SR-24 On-Ramp & MLK Way & NB SR-24 Off-Ramp 2020 PM Plus Phase 2
Fehr & Peers Synchro 8 Report
Lane Group EBL WBR SBT SBRLane Group Flow (vph) 301 1682 1662 243v/c Ratio 0.35 1.03 0.80 0.09Control Delay 16.5 37.0 26.2 0.0Queue Delay 0.0 0.0 0.0 0.0Total Delay 16.5 37.0 26.2 0.0Queue Length 50th (ft) 36 ~35 541 0Queue Length 95th (ft) 63 #257 616 m0Internal Link Dist (ft) 344Turn Bay Length (ft)Base Capacity (vph) 850 1627 2072 2814Starvation Cap Reductn 0 0 0 0Spillback Cap Reductn 0 0 0 0Storage Cap Reductn 0 0 0 0Reduced v/c Ratio 0.35 1.03 0.80 0.09
Intersection Summary~ Volume exceeds capacity, queue is theoretically infinite. Queue shown is maximum after two cycles.# 95th percentile volume exceeds capacity, queue may be longer. Queue shown is maximum after two cycles.m Volume for 95th percentile queue is metered by upstream signal.

Appendix N Collisions Analysis Summary

Appendix NCollision Analysis Summary (2008-2012)
TotalLocation Total Injured2 Killed Total Injured Killed Total Injured Killed51st St
51st (West St to MLK Jr. Way) 0 0 0 0 0 0 0 0 0 052nd St
52nd (Genoa St to West St) 6 2 0 0 0 0 1 1 0 752nd/West 0 0 0 1 0 0 0 0 0 152nd (West St to MLK Jr. Way) 3 0 0 0 0 0 0 0 0 352nd (MLK Jr. Way to Dover St) 5 0 0 0 0 0 0 0 0 552nd/Dover St 0 0 0 1 1 0 0 0 0 152nd (Dover St to Rt. 24) 1 1 0 0 0 0 0 0 0 152nd/Rt. 24 1 1 0 1 1 0 0 0 0 252nd (Rt. 24 to Shattuck Ave) 5 1 0 0 0 0 0 0 0 552nd/Shattuck 13 5 0 4 4 0 0 0 0 17East of Shattuck 4 1 0 0 0 0 0 0 0 4
53rd St53rd/Genoa 2 0 0 0 0 0 0 0 0 253rd (Genoa to MLK Jr. Way) 0 0 0 0 0 0 0 0 0 053rd (MLK Jr. Way to Dover St) 1 0 0 0 0 0 0 0 0 153rd/Dover St 0 0 0 0 0 0 0 0 0 053rd (Dover St to dead end) 1 0 0 0 0 0 0 0 0 1
54th St54th (Genoa St to MLK Jr. Way) 0 0 0 0 0 0 0 0 0 054th (MLK Jr. Way to Dover St) 1 0 0 0 0 0 0 0 0 154th/Dover St 0 0 0 0 0 0 0 0 0 054th (Dover St to Rt. 24) 0 0 0 0 0 0 0 0 0 0
Dover StDover (55th to 54th) 1 0 0 0 0 0 0 0 0 1Dover (54th to 53rd) 0 0 0 1 1 0 0 0 0 1Dover (53rd to 52nd) 0 0 0 0 0 0 0 0 0 0
West StWest (MLK Jr. Way to 52nd St) 1 1 0 0 0 0 0 0 0 1West (52nd St to 51st St) 2 0 0 0 0 0 0 0 0 2West (51st St to 47th St) 2 0 0 0 0 0 0 0 0 2West/47th 0 0 0 0 0 0 0 0 0 0
MLK Jr. WayMLK Jr./55th St 20 13 0 2 2 0 2 2 0 24MLK Jr. (55th St to 54th St) 7 2 0 0 0 0 0 0 0 7MLK Jr./54th 4 3 0 1 1 0 0 0 0 5MLK Jr. (54th St to 53rd St) 3 0 0 0 0 0 0 0 0 3MLK Jr./53rd St 5 4 0 2 1 0 0 0 0 7MLK Jr. (53rd St to West St) 1 1 0 0 0 0 0 0 0 1MLK Jr./West 0 0 0 0 0 0 0 0 0 0MLK Jr. (West to 52nd St) 6 2 0 0 0 0 0 0 0 6MLK Jr./52nd 31 34 0 1 1 0 1 1 0 33MLK Jr (52nd to 51st) 18 4 0 1 0 0 1 1 0 20MLK Jr./51st 3 0 0 0 0 0 0 0 0 3MLK Jr. (51st to 47th) 8 6 0 0 0 0 1 1 0 9MLK Jr./47th 3 3 0 0 0 0 0 0 0 3MLK Jr. (47th to Rt. 24) 1 2 0 0 0 0 0 0 0 1
1. Vehicle/Vehicle collisions also include single vehicle collisions hitting fixed objects or parked vehicles.2. Total number of injured persons. Source: Statewide Integrated Traffic Records System, summarized by Fehr & Peers, 2014.
Vehicle/Vehicle 1 Vehicle/Bicycle Vehicle/Pedestrian
Appendix O LOS Calculation Worksheets – Dover Street Closure
Conditions

HCM Signalized Intersection Capacity Analysis Children's Hospital1: MLK Way & 55th Street DC_Existing AM Plus Phase 1
Fehr & Peers Synchro 8 Report
Movement EBL EBT EBR WBL WBT WBR NBU NBL NBT NBR SBL SBTLane ConfigurationsVolume (vph) 13 170 219 54 217 57 14 127 1341 61 52 1241Ideal Flow (vphpl) 1900 1900 1900 1900 1900 1900 1900 1900 1900 1900 1900 1900Total Lost time (s) 5.0 5.0 4.5 5.0 4.5 5.0Lane Util. Factor 1.00 1.00 1.00 0.91 1.00 0.91Frpb, ped/bikes 0.98 1.00 1.00 1.00 1.00 1.00Flpb, ped/bikes 1.00 1.00 1.00 1.00 1.00 1.00Frt 0.93 0.98 1.00 0.99 1.00 1.00Flt Protected 1.00 0.99 0.95 1.00 0.95 1.00Satd. Flow (prot) 1707 1759 1770 5038 1770 5064Flt Permitted 0.98 0.77 0.95 1.00 0.95 1.00Satd. Flow (perm) 1683 1364 1770 5038 1770 5064Peak-hour factor, PHF 1.00 1.00 1.00 1.00 1.00 1.00 1.00 1.00 1.00 1.00 1.00 1.00Adj. Flow (vph) 13 170 219 54 217 57 14 127 1341 61 52 1241RTOR Reduction (vph) 0 56 0 0 10 0 0 0 4 0 0 2Lane Group Flow (vph) 0 346 0 0 318 0 0 141 1398 0 52 1266Confl. Peds. (#/hr) 7 14 14 7 21Confl. Bikes (#/hr) 16 15 6Heavy Vehicles (%) 1% 1% 1% 4% 4% 4% 2% 2% 2% 2% 2% 2%Turn Type Perm NA Perm NA Prot Prot NA Prot NAProtected Phases 4 8 5 5 2 1 6Permitted Phases 4 8Actuated Green, G (s) 25.9 25.9 15.3 45.1 4.5 34.3Effective Green, g (s) 25.9 25.9 15.3 45.1 4.5 34.3Actuated g/C Ratio 0.29 0.29 0.17 0.50 0.05 0.38Clearance Time (s) 5.0 5.0 4.5 5.0 4.5 5.0Vehicle Extension (s) 3.0 3.0 3.0 3.0 3.0 3.0Lane Grp Cap (vph) 484 392 300 2524 88 1929v/s Ratio Prot 0.08 c0.28 0.03 c0.25v/s Ratio Perm 0.21 c0.23v/c Ratio 0.72 0.81 0.47 0.55 0.59 0.66Uniform Delay, d1 28.7 29.8 33.7 15.5 41.8 23.0Progression Factor 1.00 1.00 0.52 0.11 1.00 1.00Incremental Delay, d2 5.0 12.0 1.1 0.8 10.2 1.8Delay (s) 33.7 41.8 18.7 2.6 52.0 24.7Level of Service C D B A D CApproach Delay (s) 33.7 41.8 4.1 25.8Approach LOS C D A C
Intersection SummaryHCM 2000 Control Delay 18.8 HCM 2000 Level of Service BHCM 2000 Volume to Capacity ratio 0.70Actuated Cycle Length (s) 90.0 Sum of lost time (s) 14.5Intersection Capacity Utilization 85.3% ICU Level of Service EAnalysis Period (min) 15c Critical Lane Group
HCM Signalized Intersection Capacity Analysis Children's Hospital1: MLK Way & 55th Street DC_Existing AM Plus Phase 1
Fehr & Peers Synchro 8 Report
Movement SBRLane ConfigurationsVolume (vph) 27Ideal Flow (vphpl) 1900Total Lost time (s)Lane Util. FactorFrpb, ped/bikesFlpb, ped/bikesFrtFlt ProtectedSatd. Flow (prot)Flt PermittedSatd. Flow (perm)Peak-hour factor, PHF 1.00Adj. Flow (vph) 27RTOR Reduction (vph) 0Lane Group Flow (vph) 0Confl. Peds. (#/hr) 12Confl. Bikes (#/hr) 7Heavy Vehicles (%) 2%Turn TypeProtected PhasesPermitted PhasesActuated Green, G (s)Effective Green, g (s)Actuated g/C RatioClearance Time (s)Vehicle Extension (s)Lane Grp Cap (vph)v/s Ratio Protv/s Ratio Permv/c RatioUniform Delay, d1Progression FactorIncremental Delay, d2Delay (s)Level of ServiceApproach Delay (s)Approach LOS
Intersection Summary
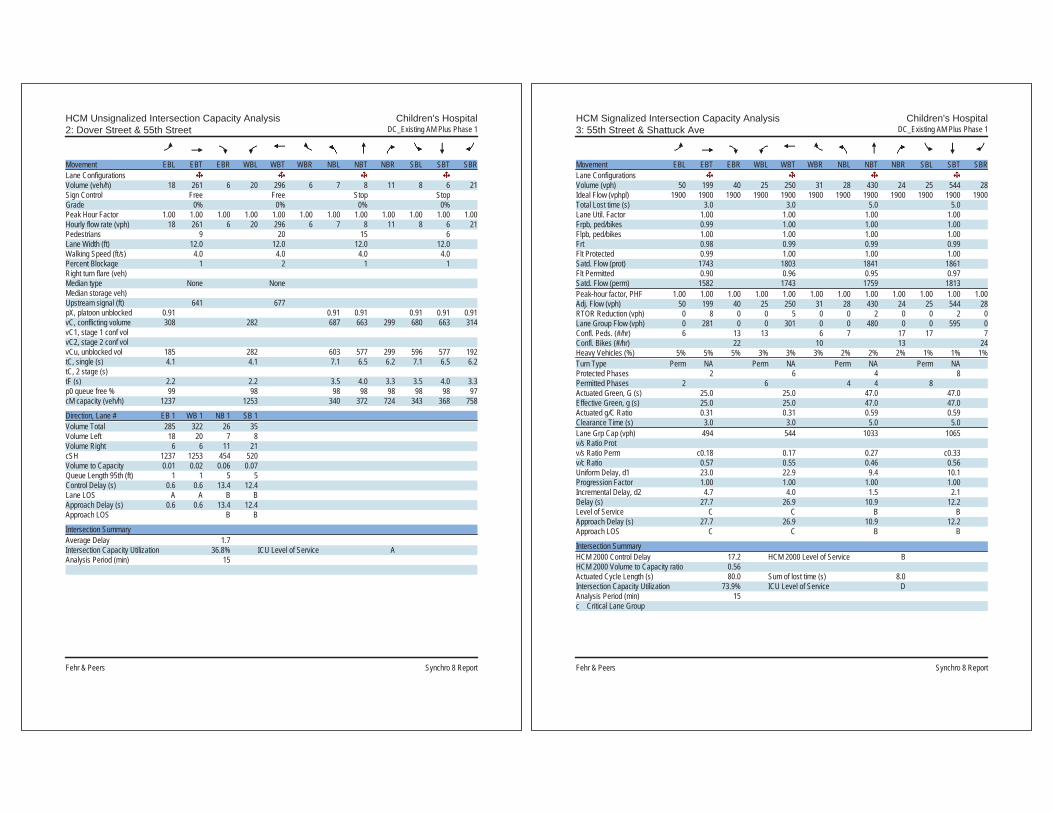
HCM Unsignalized Intersection Capacity Analysis Children's Hospital2: Dover Street & 55th Street DC_Existing AM Plus Phase 1
Fehr & Peers Synchro 8 Report
Movement EBL EBT EBR WBL WBT WBR NBL NBT NBR SBL SBT SBRLane ConfigurationsVolume (veh/h) 18 261 6 20 296 6 7 8 11 8 6 21Sign Control Free Free Stop StopGrade 0% 0% 0% 0%Peak Hour Factor 1.00 1.00 1.00 1.00 1.00 1.00 1.00 1.00 1.00 1.00 1.00 1.00Hourly flow rate (vph) 18 261 6 20 296 6 7 8 11 8 6 21Pedestrians 9 20 15 6Lane Width (ft) 12.0 12.0 12.0 12.0Walking Speed (ft/s) 4.0 4.0 4.0 4.0Percent Blockage 1 2 1 1Right turn flare (veh)Median type None NoneMedian storage veh)Upstream signal (ft) 641 677pX, platoon unblocked 0.91 0.91 0.91 0.91 0.91 0.91vC, conflicting volume 308 282 687 663 299 680 663 314vC1, stage 1 conf volvC2, stage 2 conf volvCu, unblocked vol 185 282 603 577 299 596 577 192tC, single (s) 4.1 4.1 7.1 6.5 6.2 7.1 6.5 6.2tC, 2 stage (s)tF (s) 2.2 2.2 3.5 4.0 3.3 3.5 4.0 3.3p0 queue free % 99 98 98 98 98 98 98 97cM capacity (veh/h) 1237 1253 340 372 724 343 368 758
Direction, Lane # EB 1 WB 1 NB 1 SB 1Volume Total 285 322 26 35Volume Left 18 20 7 8Volume Right 6 6 11 21cSH 1237 1253 454 520Volume to Capacity 0.01 0.02 0.06 0.07Queue Length 95th (ft) 1 1 5 5Control Delay (s) 0.6 0.6 13.4 12.4Lane LOS A A B BApproach Delay (s) 0.6 0.6 13.4 12.4Approach LOS B B
Intersection SummaryAverage Delay 1.7Intersection Capacity Utilization 36.8% ICU Level of Service AAnalysis Period (min) 15
HCM Signalized Intersection Capacity Analysis Children's Hospital3: 55th Street & Shattuck Ave DC_Existing AM Plus Phase 1
Fehr & Peers Synchro 8 Report
Movement EBL EBT EBR WBL WBT WBR NBL NBT NBR SBL SBT SBRLane ConfigurationsVolume (vph) 50 199 40 25 250 31 28 430 24 25 544 28Ideal Flow (vphpl) 1900 1900 1900 1900 1900 1900 1900 1900 1900 1900 1900 1900Total Lost time (s) 3.0 3.0 5.0 5.0Lane Util. Factor 1.00 1.00 1.00 1.00Frpb, ped/bikes 0.99 1.00 1.00 1.00Flpb, ped/bikes 1.00 1.00 1.00 1.00Frt 0.98 0.99 0.99 0.99Flt Protected 0.99 1.00 1.00 1.00Satd. Flow (prot) 1743 1803 1841 1861Flt Permitted 0.90 0.96 0.95 0.97Satd. Flow (perm) 1582 1743 1759 1813Peak-hour factor, PHF 1.00 1.00 1.00 1.00 1.00 1.00 1.00 1.00 1.00 1.00 1.00 1.00Adj. Flow (vph) 50 199 40 25 250 31 28 430 24 25 544 28RTOR Reduction (vph) 0 8 0 0 5 0 0 2 0 0 2 0Lane Group Flow (vph) 0 281 0 0 301 0 0 480 0 0 595 0Confl. Peds. (#/hr) 6 13 13 6 7 17 17 7Confl. Bikes (#/hr) 22 10 13 24Heavy Vehicles (%) 5% 5% 5% 3% 3% 3% 2% 2% 2% 1% 1% 1%Turn Type Perm NA Perm NA Perm NA Perm NAProtected Phases 2 6 4 8Permitted Phases 2 6 4 4 8Actuated Green, G (s) 25.0 25.0 47.0 47.0Effective Green, g (s) 25.0 25.0 47.0 47.0Actuated g/C Ratio 0.31 0.31 0.59 0.59Clearance Time (s) 3.0 3.0 5.0 5.0Lane Grp Cap (vph) 494 544 1033 1065v/s Ratio Protv/s Ratio Perm c0.18 0.17 0.27 c0.33v/c Ratio 0.57 0.55 0.46 0.56Uniform Delay, d1 23.0 22.9 9.4 10.1Progression Factor 1.00 1.00 1.00 1.00Incremental Delay, d2 4.7 4.0 1.5 2.1Delay (s) 27.7 26.9 10.9 12.2Level of Service C C B BApproach Delay (s) 27.7 26.9 10.9 12.2Approach LOS C C B B
Intersection SummaryHCM 2000 Control Delay 17.2 HCM 2000 Level of Service BHCM 2000 Volume to Capacity ratio 0.56Actuated Cycle Length (s) 80.0 Sum of lost time (s) 8.0Intersection Capacity Utilization 73.9% ICU Level of Service DAnalysis Period (min) 15c Critical Lane Group

HCM Signalized Intersection Capacity Analysis Children's Hospital4: 55th Street & Telegraph Ave DC_Existing AM Plus Phase 1
Fehr & Peers Synchro 8 Report
Movement EBL EBT EBR WBL WBT WBR NBL NBT NBR SBL SBT SBRLane ConfigurationsVolume (vph) 148 14 77 32 10 9 58 707 40 27 810 236Ideal Flow (vphpl) 1900 1900 1900 1900 1900 1900 1900 1900 1900 1900 1900 1900Total Lost time (s) 4.5 4.5 4.5 4.5 4.5 4.5Lane Util. Factor 1.00 1.00 1.00 0.95 1.00 0.95Frpb, ped/bikes 0.99 0.99 1.00 1.00 1.00 0.99Flpb, ped/bikes 1.00 1.00 1.00 1.00 0.99 1.00Frt 0.96 0.98 1.00 0.99 1.00 0.97Flt Protected 0.97 0.97 0.95 1.00 0.95 1.00Satd. Flow (prot) 1654 1713 1761 3496 1768 3406Flt Permitted 0.78 0.79 0.23 1.00 0.35 1.00Satd. Flow (perm) 1332 1404 429 3496 643 3406Peak-hour factor, PHF 1.00 1.00 1.00 1.00 1.00 1.00 1.00 1.00 1.00 1.00 1.00 1.00Adj. Flow (vph) 148 14 77 32 10 9 58 707 40 27 810 236RTOR Reduction (vph) 0 29 0 0 7 0 0 4 0 0 29 0Lane Group Flow (vph) 0 210 0 0 44 0 58 743 0 27 1017 0Confl. Peds. (#/hr) 6 11 11 6 13 17 17 13Confl. Bikes (#/hr) 15 15 43 27Heavy Vehicles (%) 5% 5% 5% 4% 4% 4% 2% 2% 2% 1% 1% 1%Turn Type Perm NA Perm NA Perm NA Perm NAProtected Phases 4 8 2 6Permitted Phases 4 8 2 6Actuated Green, G (s) 16.8 16.8 44.2 44.2 44.2 44.2Effective Green, g (s) 16.8 16.8 44.2 44.2 44.2 44.2Actuated g/C Ratio 0.24 0.24 0.63 0.63 0.63 0.63Clearance Time (s) 4.5 4.5 4.5 4.5 4.5 4.5Vehicle Extension (s) 3.0 3.0 3.0 3.0 3.0 3.0Lane Grp Cap (vph) 319 336 270 2207 406 2150v/s Ratio Prot 0.21 c0.30v/s Ratio Perm c0.16 0.03 0.14 0.04v/c Ratio 0.66 0.13 0.21 0.34 0.07 0.47Uniform Delay, d1 24.0 20.9 5.5 6.0 5.0 6.8Progression Factor 1.00 1.00 1.00 1.00 1.00 1.00Incremental Delay, d2 4.9 0.2 1.8 0.4 0.3 0.7Delay (s) 28.9 21.1 7.3 6.5 5.3 7.5Level of Service C C A A A AApproach Delay (s) 28.9 21.1 6.5 7.5Approach LOS C C A A
Intersection SummaryHCM 2000 Control Delay 9.8 HCM 2000 Level of Service AHCM 2000 Volume to Capacity ratio 0.52Actuated Cycle Length (s) 70.0 Sum of lost time (s) 9.0Intersection Capacity Utilization 62.1% ICU Level of Service BAnalysis Period (min) 15c Critical Lane Group
HCM Unsignalized Intersection Capacity Analysis Children's Hospital5: MLK Way & 54th Street DC_Existing AM Plus Phase 1
Fehr & Peers Synchro 8 Report
Movement EBL EBT EBR WBL WBT WBR NBU NBL NBT NBR SBL SBTLane ConfigurationsVolume (veh/h) 4 3 43 5 3 8 11 15 1517 16 5 1488Sign Control Stop Stop Free FreeGrade 0% 0% 0% 0%Peak Hour Factor 1.00 1.00 1.00 1.00 1.00 1.00 1.00 1.00 1.00 1.00 1.00 1.00Hourly flow rate (vph) 4 3 43 5 3 8 0 15 1517 16 5 1488Pedestrians 7 6 8Lane Width (ft) 12.0 12.0 12.0Walking Speed (ft/s) 4.0 4.0 4.0Percent Blockage 1 1 1Right turn flare (veh)Median type None NoneMedian storage veh)Upstream signal (ft) 299 294pX, platoon unblocked 0.88 0.88 0.80 0.88 0.88 0.84 0.00 0.80 0.84vC, conflicting volume 2054 3078 514 2120 3073 520 0 1502 1539vC1, stage 1 conf volvC2, stage 2 conf volvCu, unblocked vol 512 1679 0 587 1674 0 0 749 992tC, single (s) 7.5 6.5 6.9 7.5 6.5 6.9 0.0 4.1 4.1tC, 2 stage (s)tF (s) *5.0 *5.0 *5.0 *5.0 *5.0 *5.0 0.0 2.2 2.2p0 queue free % 99 96 92 98 96 99 0 98 99cM capacity (veh/h) 280 75 568 233 76 605 0 680 587
Direction, Lane # EB 1 WB 1 NB 1 NB 2 NB 3 SB 1 SB 2 SB 3Volume Total 50 16 394 758 395 377 744 379Volume Left 4 5 15 0 0 5 0 0Volume Right 43 8 0 0 16 0 0 7cSH 386 216 680 1700 1700 587 1700 1700Volume to Capacity 0.13 0.07 0.02 0.45 0.23 0.01 0.44 0.22Queue Length 95th (ft) 11 6 2 0 0 1 0 0Control Delay (s) 15.7 23.0 0.7 0.0 0.0 0.3 0.0 0.0Lane LOS C C A AApproach Delay (s) 15.7 23.0 0.2 0.1Approach LOS C C
Intersection SummaryAverage Delay 0.5Intersection Capacity Utilization 60.8% ICU Level of Service BAnalysis Period (min) 15
* User Entered Value

HCM Unsignalized Intersection Capacity Analysis Children's Hospital5: MLK Way & 54th Street DC_Existing AM Plus Phase 1
Fehr & Peers Synchro 8 Report
Movement SBRLane ConfigurationsVolume (veh/h) 7Sign ControlGradePeak Hour Factor 1.00Hourly flow rate (vph) 7PedestriansLane Width (ft)Walking Speed (ft/s)Percent BlockageRight turn flare (veh)Median typeMedian storage veh)Upstream signal (ft)pX, platoon unblockedvC, conflicting volumevC1, stage 1 conf volvC2, stage 2 conf volvCu, unblocked voltC, single (s)tC, 2 stage (s)tF (s)p0 queue free %cM capacity (veh/h)
Direction, Lane #
HCM Unsignalized Intersection Capacity Analysis Children's Hospital6: Dover Street & 54th Street DC_Existing AM Plus Phase 1
Fehr & Peers Synchro 8 Report
Movement EBL EBT EBR WBL WBT WBR NBL NBT NBR SBL SBT SBRLane ConfigurationsVolume (veh/h) 5 11 6 4 6 9 8 17 11 4 33 5Sign Control Stop Stop Free FreeGrade 0% 0% 0% 0%Peak Hour Factor 1.00 1.00 1.00 1.00 1.00 1.00 1.00 1.00 1.00 1.00 1.00 1.00Hourly flow rate (vph) 5 11 6 4 6 9 8 17 11 4 33 5Pedestrians 10 14 2 6Lane Width (ft) 12.0 12.0 12.0 12.0Walking Speed (ft/s) 4.0 4.0 4.0 4.0Percent Blockage 1 1 0 1Right turn flare (veh)Median type None NoneMedian storage veh)Upstream signal (ft)pX, platoon unblockedvC, conflicting volume 110 112 48 110 108 42 48 42vC1, stage 1 conf volvC2, stage 2 conf volvCu, unblocked vol 110 112 48 110 108 42 48 42tC, single (s) 7.1 6.5 6.2 7.1 6.5 6.2 4.1 4.1tC, 2 stage (s)tF (s) 3.5 4.0 3.3 3.5 4.0 3.3 2.2 2.2p0 queue free % 99 99 99 100 99 99 99 100cM capacity (veh/h) 831 761 1017 830 764 1017 1559 1562
Direction, Lane # EB 1 WB 1 NB 1 SB 1Volume Total 22 19 36 42Volume Left 5 4 8 4Volume Right 6 9 11 5cSH 834 883 1559 1562Volume to Capacity 0.03 0.02 0.01 0.00Queue Length 95th (ft) 2 2 0 0Control Delay (s) 9.4 9.2 1.7 0.7Lane LOS A A A AApproach Delay (s) 9.4 9.2 1.7 0.7Approach LOS A A
Intersection SummaryAverage Delay 4.0Intersection Capacity Utilization 19.4% ICU Level of Service AAnalysis Period (min) 15
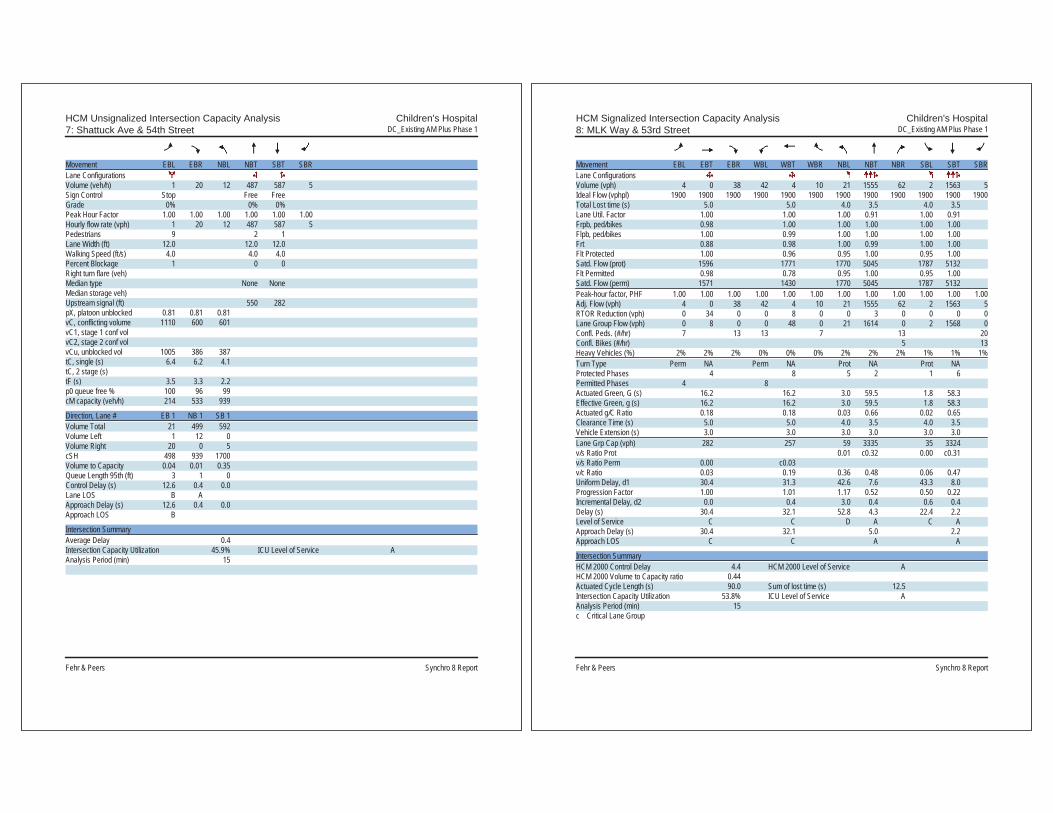
HCM Unsignalized Intersection Capacity Analysis Children's Hospital7: Shattuck Ave & 54th Street DC_Existing AM Plus Phase 1
Fehr & Peers Synchro 8 Report
Movement EBL EBR NBL NBT SBT SBRLane ConfigurationsVolume (veh/h) 1 20 12 487 587 5Sign Control Stop Free FreeGrade 0% 0% 0%Peak Hour Factor 1.00 1.00 1.00 1.00 1.00 1.00Hourly flow rate (vph) 1 20 12 487 587 5Pedestrians 9 2 1Lane Width (ft) 12.0 12.0 12.0Walking Speed (ft/s) 4.0 4.0 4.0Percent Blockage 1 0 0Right turn flare (veh)Median type None NoneMedian storage veh)Upstream signal (ft) 550 282pX, platoon unblocked 0.81 0.81 0.81vC, conflicting volume 1110 600 601vC1, stage 1 conf volvC2, stage 2 conf volvCu, unblocked vol 1005 386 387tC, single (s) 6.4 6.2 4.1tC, 2 stage (s)tF (s) 3.5 3.3 2.2p0 queue free % 100 96 99cM capacity (veh/h) 214 533 939
Direction, Lane # EB 1 NB 1 SB 1Volume Total 21 499 592Volume Left 1 12 0Volume Right 20 0 5cSH 498 939 1700Volume to Capacity 0.04 0.01 0.35Queue Length 95th (ft) 3 1 0Control Delay (s) 12.6 0.4 0.0Lane LOS B AApproach Delay (s) 12.6 0.4 0.0Approach LOS B
Intersection SummaryAverage Delay 0.4Intersection Capacity Utilization 45.9% ICU Level of Service AAnalysis Period (min) 15
HCM Signalized Intersection Capacity Analysis Children's Hospital8: MLK Way & 53rd Street DC_Existing AM Plus Phase 1
Fehr & Peers Synchro 8 Report
Movement EBL EBT EBR WBL WBT WBR NBL NBT NBR SBL SBT SBRLane ConfigurationsVolume (vph) 4 0 38 42 4 10 21 1555 62 2 1563 5Ideal Flow (vphpl) 1900 1900 1900 1900 1900 1900 1900 1900 1900 1900 1900 1900Total Lost time (s) 5.0 5.0 4.0 3.5 4.0 3.5Lane Util. Factor 1.00 1.00 1.00 0.91 1.00 0.91Frpb, ped/bikes 0.98 1.00 1.00 1.00 1.00 1.00Flpb, ped/bikes 1.00 0.99 1.00 1.00 1.00 1.00Frt 0.88 0.98 1.00 0.99 1.00 1.00Flt Protected 1.00 0.96 0.95 1.00 0.95 1.00Satd. Flow (prot) 1596 1771 1770 5045 1787 5132Flt Permitted 0.98 0.78 0.95 1.00 0.95 1.00Satd. Flow (perm) 1571 1430 1770 5045 1787 5132Peak-hour factor, PHF 1.00 1.00 1.00 1.00 1.00 1.00 1.00 1.00 1.00 1.00 1.00 1.00Adj. Flow (vph) 4 0 38 42 4 10 21 1555 62 2 1563 5RTOR Reduction (vph) 0 34 0 0 8 0 0 3 0 0 0 0Lane Group Flow (vph) 0 8 0 0 48 0 21 1614 0 2 1568 0Confl. Peds. (#/hr) 7 13 13 7 13 20Confl. Bikes (#/hr) 5 13Heavy Vehicles (%) 2% 2% 2% 0% 0% 0% 2% 2% 2% 1% 1% 1%Turn Type Perm NA Perm NA Prot NA Prot NAProtected Phases 4 8 5 2 1 6Permitted Phases 4 8Actuated Green, G (s) 16.2 16.2 3.0 59.5 1.8 58.3Effective Green, g (s) 16.2 16.2 3.0 59.5 1.8 58.3Actuated g/C Ratio 0.18 0.18 0.03 0.66 0.02 0.65Clearance Time (s) 5.0 5.0 4.0 3.5 4.0 3.5Vehicle Extension (s) 3.0 3.0 3.0 3.0 3.0 3.0Lane Grp Cap (vph) 282 257 59 3335 35 3324v/s Ratio Prot 0.01 c0.32 0.00 c0.31v/s Ratio Perm 0.00 c0.03v/c Ratio 0.03 0.19 0.36 0.48 0.06 0.47Uniform Delay, d1 30.4 31.3 42.6 7.6 43.3 8.0Progression Factor 1.00 1.01 1.17 0.52 0.50 0.22Incremental Delay, d2 0.0 0.4 3.0 0.4 0.6 0.4Delay (s) 30.4 32.1 52.8 4.3 22.4 2.2Level of Service C C D A C AApproach Delay (s) 30.4 32.1 5.0 2.2Approach LOS C C A A
Intersection SummaryHCM 2000 Control Delay 4.4 HCM 2000 Level of Service AHCM 2000 Volume to Capacity ratio 0.44Actuated Cycle Length (s) 90.0 Sum of lost time (s) 12.5Intersection Capacity Utilization 53.8% ICU Level of Service AAnalysis Period (min) 15c Critical Lane Group

HCM Unsignalized Intersection Capacity Analysis Children's Hospital9: Dover Street & 53rd Street DC_Existing AM Plus Phase 1
Fehr & Peers Synchro 8 Report
Movement EBL EBT EBR WBL WBT WBR NBL NBT NBR SBL SBT SBRLane ConfigurationsVolume (veh/h) 32 13 0 0 6 6 0 0 0 2 0 44Sign Control Stop Stop Free FreeGrade 0% 0% 0% 0%Peak Hour Factor 1.00 1.00 1.00 1.00 1.00 1.00 1.00 1.00 1.00 1.00 1.00 1.00Hourly flow rate (vph) 32 13 0 0 6 6 0 0 0 2 0 44Pedestrians 22 21 2 2Lane Width (ft) 12.0 12.0 12.0 12.0Walking Speed (ft/s) 4.0 4.0 4.0 4.0Percent Blockage 2 2 0 0Right turn flare (veh)Median type None NoneMedian storage veh)Upstream signal (ft)pX, platoon unblockedvC, conflicting volume 59 69 46 56 91 23 66 21vC1, stage 1 conf volvC2, stage 2 conf volvCu, unblocked vol 59 69 46 56 91 23 66 21tC, single (s) 7.1 6.5 6.2 7.1 6.5 6.2 4.1 4.1tC, 2 stage (s)tF (s) 3.5 4.0 3.3 3.5 4.0 3.3 2.2 2.2p0 queue free % 96 98 100 100 99 99 100 100cM capacity (veh/h) 887 795 1009 892 773 1039 1520 1580
Direction, Lane # EB 1 WB 1 NB 1 SB 1Volume Total 45 12 0 46Volume Left 32 0 0 2Volume Right 0 6 0 44cSH 858 887 1700 1580Volume to Capacity 0.05 0.01 0.00 0.00Queue Length 95th (ft) 4 1 0 0Control Delay (s) 9.4 9.1 0.0 0.3Lane LOS A A AApproach Delay (s) 9.4 9.1 0.0 0.3Approach LOS A A
Intersection SummaryAverage Delay 5.3Intersection Capacity Utilization 25.3% ICU Level of Service AAnalysis Period (min) 15
HCM Signalized Intersection Capacity Analysis Children's Hospital10: MLK Way & 52nd Street DC_Existing AM Plus Phase 1
Fehr & Peers Synchro 8 Report
Movement EBL EBT EBR WBL WBT WBR NBU NBL NBT NBR SBU SBLLane ConfigurationsVolume (vph) 45 70 100 58 74 247 50 56 1494 34 28 116Ideal Flow (vphpl) 1900 1900 1900 1900 1900 1900 1900 1900 1900 1900 1900 1900Total Lost time (s) 5.0 5.0 5.0 5.0 4.5 4.5 4.0Lane Util. Factor 1.00 1.00 1.00 1.00 1.00 0.91 1.00Frpb, ped/bikes 1.00 0.97 1.00 0.97 1.00 1.00 1.00Flpb, ped/bikes 0.99 1.00 0.99 1.00 1.00 1.00 1.00Frt 1.00 0.91 1.00 0.85 1.00 1.00 1.00Flt Protected 0.95 1.00 0.98 1.00 0.95 1.00 0.95Satd. Flow (prot) 1774 1656 1797 1544 1787 5116 1787Flt Permitted 0.66 1.00 0.80 1.00 0.95 1.00 0.95Satd. Flow (perm) 1234 1656 1475 1544 1787 5116 1787Peak-hour factor, PHF 1.00 1.00 1.00 1.00 1.00 1.00 1.00 1.00 1.00 1.00 1.00 1.00Adj. Flow (vph) 45 70 100 58 74 247 50 56 1494 34 28 116RTOR Reduction (vph) 0 66 0 0 0 187 0 0 2 0 0 0Lane Group Flow (vph) 45 104 0 0 132 60 0 106 1526 0 0 144Confl. Peds. (#/hr) 10 49 49 10 7Confl. Bikes (#/hr) 6 5 1Heavy Vehicles (%) 1% 1% 1% 2% 2% 2% 1% 1% 1% 1% 1% 1%Turn Type Perm NA Perm NA Perm Prot Prot NA Prot ProtProtected Phases 4 8 5 5 2 1 1Permitted Phases 4 8 8Actuated Green, G (s) 22.0 22.0 22.0 22.0 7.2 42.0 12.5Effective Green, g (s) 22.0 22.0 22.0 22.0 7.2 42.0 12.5Actuated g/C Ratio 0.24 0.24 0.24 0.24 0.08 0.47 0.14Clearance Time (s) 5.0 5.0 5.0 5.0 4.5 4.5 4.0Vehicle Extension (s) 2.0 2.0 2.0 2.0 2.0 2.0 2.0Lane Grp Cap (vph) 301 404 360 377 142 2387 248v/s Ratio Prot 0.06 0.06 c0.30 0.08v/s Ratio Perm 0.04 c0.09 0.04v/c Ratio 0.15 0.26 0.37 0.16 0.75 0.64 0.58Uniform Delay, d1 26.7 27.4 28.2 26.7 40.5 18.2 36.3Progression Factor 1.00 1.00 1.00 1.00 0.99 1.06 0.78Incremental Delay, d2 0.1 0.1 0.2 0.1 8.6 0.6 2.1Delay (s) 26.7 27.5 28.4 26.8 48.9 20.0 30.3Level of Service C C C C D B CApproach Delay (s) 27.4 27.4 21.8Approach LOS C C C
Intersection SummaryHCM 2000 Control Delay 19.2 HCM 2000 Level of Service BHCM 2000 Volume to Capacity ratio 0.57Actuated Cycle Length (s) 90.0 Sum of lost time (s) 14.0Intersection Capacity Utilization 95.2% ICU Level of Service FAnalysis Period (min) 15c Critical Lane Group

HCM Signalized Intersection Capacity Analysis Children's Hospital10: MLK Way & 52nd Street DC_Existing AM Plus Phase 1
Fehr & Peers Synchro 8 Report
Movement SBT SBRLane ConfigurationsVolume (vph) 1483 6Ideal Flow (vphpl) 1900 1900Total Lost time (s) 4.5Lane Util. Factor 0.91Frpb, ped/bikes 1.00Flpb, ped/bikes 1.00Frt 1.00Flt Protected 1.00Satd. Flow (prot) 5131Flt Permitted 1.00Satd. Flow (perm) 5131Peak-hour factor, PHF 1.00 1.00Adj. Flow (vph) 1483 6RTOR Reduction (vph) 0 0Lane Group Flow (vph) 1489 0Confl. Peds. (#/hr) 10Confl. Bikes (#/hr) 10Heavy Vehicles (%) 1% 1%Turn Type NAProtected Phases 6Permitted PhasesActuated Green, G (s) 46.8Effective Green, g (s) 46.8Actuated g/C Ratio 0.52Clearance Time (s) 4.5Vehicle Extension (s) 2.0Lane Grp Cap (vph) 2668v/s Ratio Prot c0.29v/s Ratio Permv/c Ratio 0.56Uniform Delay, d1 14.6Progression Factor 0.76Incremental Delay, d2 0.8Delay (s) 11.9Level of Service BApproach Delay (s) 13.5Approach LOS B
Intersection Summary
HCM Signalized Intersection Capacity Analysis Children's Hospital11: 52nd Street & Garage DC_Existing AM Plus Phase 1
Fehr & Peers Synchro 8 Report
Movement EBL EBT EBR WBL WBT WBR NBL NBT NBR SBL SBT SBRLane ConfigurationsVolume (vph) 4 211 9 5 351 2 15 7 10 0 2 15Ideal Flow (vphpl) 1900 1900 1900 1900 1900 1900 1900 1900 1900 1900 1900 1900Total Lost time (s) 3.0 3.0 3.0 3.0Lane Util. Factor 0.95 0.95 1.00 1.00Frpb, ped/bikes 1.00 1.00 0.96 0.99Flpb, ped/bikes 1.00 1.00 1.00 1.00Frt 0.99 1.00 0.96 0.88Flt Protected 1.00 1.00 0.98 1.00Satd. Flow (prot) 3497 3600 1465 1655Flt Permitted 0.95 0.95 0.94 1.00Satd. Flow (perm) 3338 3428 1404 1655Peak-hour factor, PHF 1.00 1.00 1.00 1.00 1.00 1.00 1.00 1.00 1.00 1.00 1.00 1.00Adj. Flow (vph) 4 211 9 5 351 2 15 7 10 0 2 15RTOR Reduction (vph) 0 5 0 0 1 0 0 5 0 0 8 0Lane Group Flow (vph) 0 219 0 0 357 0 0 27 0 0 9 0Confl. Peds. (#/hr) 17 55 55 17 202 202Confl. Bikes (#/hr) 6 5 1Heavy Vehicles (%) 2% 2% 2% 0% 0% 0% 16% 16% 16% 0% 0% 0%Turn Type Prot NA Perm NA Perm NA NAProtected Phases 5 2 6 4 8Permitted Phases 6 4 8Actuated Green, G (s) 21.0 14.0 23.0 23.0Effective Green, g (s) 21.0 14.0 23.0 23.0Actuated g/C Ratio 0.42 0.28 0.46 0.46Clearance Time (s) 3.0 3.0 3.0 3.0Lane Grp Cap (vph) 1414 959 645 761v/s Ratio Prot c0.01 0.01v/s Ratio Perm 0.05 c0.10 c0.02v/c Ratio 0.15 0.37 0.04 0.01Uniform Delay, d1 9.0 14.5 7.4 7.3Progression Factor 1.00 1.00 1.00 1.00Incremental Delay, d2 0.2 1.1 0.1 0.0Delay (s) 9.2 15.6 7.6 7.4Level of Service A B A AApproach Delay (s) 9.2 15.6 7.6 7.4Approach LOS A B A A
Intersection SummaryHCM 2000 Control Delay 12.7 HCM 2000 Level of Service BHCM 2000 Volume to Capacity ratio 0.17Actuated Cycle Length (s) 50.0 Sum of lost time (s) 9.0Intersection Capacity Utilization 39.1% ICU Level of Service AAnalysis Period (min) 15c Critical Lane Group

HCM Unsignalized Intersection Capacity Analysis Children's Hospital12: 52nd Street & Dover Street DC_Existing AM Plus Phase 1
Fehr & Peers Synchro 8 Report
Movement EBL EBT EBR WBL WBT WBR NBL NBT NBR SBL SBT SBRLane ConfigurationsVolume (veh/h) 12 211 3 11 351 5 3 0 7 2 0 6Sign Control Free Free Stop StopGrade 0% 0% 0% 0%Peak Hour Factor 1.00 1.00 1.00 1.00 1.00 1.00 1.00 1.00 1.00 1.00 1.00 1.00Hourly flow rate (vph) 12 211 3 11 351 5 3 0 7 2 0 6Pedestrians 20 10 12 23Lane Width (ft) 12.0 12.0 12.0 12.0Walking Speed (ft/s) 4.0 4.0 4.0 4.0Percent Blockage 2 1 1 2Right turn flare (veh)Median type None NoneMedian storage veh)Upstream signal (ft) 312 647pX, platoon unblocked 0.91 0.94 0.94 0.94 0.94 0.94 0.94 0.91vC, conflicting volume 379 226 650 650 234 652 648 396vC1, stage 1 conf volvC2, stage 2 conf volvCu, unblocked vol 267 150 457 457 159 459 456 286tC, single (s) 4.1 4.1 7.2 6.6 6.3 7.1 6.5 6.2tC, 2 stage (s)tF (s) 2.2 2.2 3.6 4.1 3.4 3.5 4.0 3.3p0 queue free % 99 99 99 100 99 100 100 99cM capacity (veh/h) 1151 1343 436 436 802 449 450 664
Direction, Lane # EB 1 WB 1 NB 1 SB 1Volume Total 226 367 10 8Volume Left 12 11 3 2Volume Right 3 5 7 6cSH 1151 1343 641 593Volume to Capacity 0.01 0.01 0.02 0.01Queue Length 95th (ft) 1 1 1 1Control Delay (s) 0.5 0.3 10.7 11.2Lane LOS A A B BApproach Delay (s) 0.5 0.3 10.7 11.2Approach LOS B B
Intersection SummaryAverage Delay 0.7Intersection Capacity Utilization 37.2% ICU Level of Service AAnalysis Period (min) 15
HCM Unsignalized Intersection Capacity Analysis Children's Hospital13: SR-24 NB Off-Ramp & 52nd Street DC_Existing AM Plus Phase 1
Fehr & Peers Synchro 8 Report
Movement EBL EBT EBR WBL WBT WBR NBL NBR SEL SERLane ConfigurationsVolume (veh/h) 0 218 0 0 371 1077 0 898 0 0Sign Control Free Free Stop StopGrade 0% 0% 0% 0%Peak Hour Factor 1.00 1.00 1.00 1.00 1.00 1.00 1.00 1.00 1.00 1.00Hourly flow rate (vph) 0 218 0 0 371 1077 0 898 0 0Pedestrians 24Lane Width (ft) 12.0Walking Speed (ft/s) 4.0Percent Blockage 2Right turn flare (veh)Median type None NoneMedian storage veh)Upstream signal (ft) 767 192pX, platoon unblocked 0.83 0.83 0.83 0.83vC, conflicting volume 1448 242 1690 133 1378 613vC1, stage 1 conf volvC2, stage 2 conf volvCu, unblocked vol 1133 242 1424 133 1049 129tC, single (s) 4.1 4.1 6.5 7.0 7.5 6.5tC, 2 stage (s)tF (s) 2.2 2.2 4.0 3.3 3.5 4.0p0 queue free % 100 100 100 0 0 100cM capacity (veh/h) 509 1295 110 871 0 620
Direction, Lane # EB 1 EB 2 WB 1 WB 2 WB 3 NB 1 NB 2Volume Total 109 109 247 483 718 449 449Volume Left 0 0 0 0 0 0 0Volume Right 0 0 0 359 718 449 449cSH 1700 1700 1700 1700 1700 871 871Volume to Capacity 0.06 0.06 0.15 0.28 0.42 0.52 0.52Queue Length 95th (ft) 0 0 0 0 0 76 76Control Delay (s) 0.0 0.0 0.0 0.0 0.0 13.5 13.5Lane LOS B BApproach Delay (s) 0.0 0.0 13.5Approach LOS B
Intersection SummaryAverage Delay 4.7Intersection Capacity Utilization 48.1% ICU Level of Service AAnalysis Period (min) 15

HCM Signalized Intersection Capacity Analysis Children's Hospital14: 52nd Street & Shattuck Ave DC_Existing AM Plus Phase 1
Fehr & Peers Synchro 8 Report
Movement EBU EBL EBT EBR WBL WBT WBR NBL NBT NBR SBL SBTLane ConfigurationsVolume (vph) 40 285 678 148 24 871 82 154 123 30 101 136Ideal Flow (vphpl) 1900 1900 1900 1900 1900 1900 1900 1900 1900 1900 1900 1900Total Lost time (s) 4.0 4.5 4.0 4.5 4.0 5.5 5.5Lane Util. Factor 1.00 0.91 1.00 0.91 1.00 1.00 1.00Frpb, ped/bikes 1.00 0.99 1.00 1.00 1.00 0.99 1.00Flpb, ped/bikes 1.00 1.00 1.00 1.00 1.00 1.00 1.00Frt 1.00 0.97 1.00 0.99 1.00 0.97 1.00Flt Protected 0.95 1.00 0.95 1.00 0.95 1.00 0.98Satd. Flow (prot) 1787 4943 1805 5105 1752 1781 1733Flt Permitted 0.95 1.00 0.95 1.00 0.43 1.00 0.79Satd. Flow (perm) 1787 4943 1805 5105 796 1781 1401Peak-hour factor, PHF 1.00 1.00 1.00 1.00 1.00 1.00 1.00 1.00 1.00 1.00 1.00 1.00Adj. Flow (vph) 40 285 678 148 24 871 82 154 123 30 101 136RTOR Reduction (vph) 0 0 31 0 0 12 0 0 10 0 0 0Lane Group Flow (vph) 0 325 795 0 24 941 0 154 143 0 0 237Confl. Peds. (#/hr) 12 5 10 10Confl. Bikes (#/hr) 12 1 10Heavy Vehicles (%) 1% 1% 1% 1% 0% 0% 0% 3% 3% 3% 7% 7%Turn Type Prot Prot NA Prot NA pm+pt NA Perm NAProtected Phases 7 7 4 3 8 5 2 6Permitted Phases 2 6Actuated Green, G (s) 21.5 37.7 3.2 19.4 35.1 35.1 24.6Effective Green, g (s) 21.5 37.7 3.2 19.4 35.1 35.1 24.6Actuated g/C Ratio 0.24 0.42 0.04 0.22 0.39 0.39 0.27Clearance Time (s) 4.0 4.5 4.0 4.5 4.0 5.5 5.5Vehicle Extension (s) 3.0 3.0 3.0 3.0 3.0 3.0 3.0Lane Grp Cap (vph) 426 2070 64 1100 379 694 382v/s Ratio Prot c0.18 0.16 0.01 c0.18 c0.03 0.08v/s Ratio Perm 0.13 c0.17v/c Ratio 0.76 0.38 0.38 0.86 0.41 0.21 0.62Uniform Delay, d1 31.9 18.1 42.4 34.0 18.8 18.2 28.6Progression Factor 1.00 1.00 1.22 0.83 1.00 1.00 1.00Incremental Delay, d2 12.2 0.5 3.0 7.2 0.7 0.7 7.4Delay (s) 44.1 18.6 54.7 35.5 19.5 18.9 36.0Level of Service D B D D B B DApproach Delay (s) 25.8 36.0 19.2 30.7Approach LOS C D B C
Intersection SummaryHCM 2000 Control Delay 29.4 HCM 2000 Level of Service CHCM 2000 Volume to Capacity ratio 0.71Actuated Cycle Length (s) 90.0 Sum of lost time (s) 18.0Intersection Capacity Utilization 100.4% ICU Level of Service GAnalysis Period (min) 15c Critical Lane Group
HCM Signalized Intersection Capacity Analysis Children's Hospital14: 52nd Street & Shattuck Ave DC_Existing AM Plus Phase 1
Fehr & Peers Synchro 8 Report
Movement SBRLane ConfigurationsVolume (vph) 377Ideal Flow (vphpl) 1900Total Lost time (s) 5.5Lane Util. Factor 1.00Frpb, ped/bikes 0.94Flpb, ped/bikes 1.00Frt 0.85Flt Protected 1.00Satd. Flow (prot) 1419Flt Permitted 1.00Satd. Flow (perm) 1419Peak-hour factor, PHF 1.00Adj. Flow (vph) 377RTOR Reduction (vph) 274Lane Group Flow (vph) 103Confl. Peds. (#/hr) 16Confl. Bikes (#/hr) 41Heavy Vehicles (%) 7%Turn Type PermProtected PhasesPermitted Phases 6Actuated Green, G (s) 24.6Effective Green, g (s) 24.6Actuated g/C Ratio 0.27Clearance Time (s) 5.5Vehicle Extension (s) 3.0Lane Grp Cap (vph) 387v/s Ratio Protv/s Ratio Perm 0.07v/c Ratio 0.27Uniform Delay, d1 25.6Progression Factor 1.00Incremental Delay, d2 1.7Delay (s) 27.3Level of Service CApproach Delay (s)Approach LOS
Intersection Summary

HCM Signalized Intersection Capacity Analysis Children's Hospital15: Telegraph Ave & 52nd Street/Claremont Ave DC_Existing AM Plus Phase 1
Fehr & Peers Synchro 8 Report
Movement EBL EBT EBR WBL WBT WBR NBL NBT NBR SBL SBT SBRLane ConfigurationsVolume (vph) 6 0 6 94 52 154 0 657 117 64 598 273Ideal Flow (vphpl) 1900 1900 1900 1900 1900 1900 1900 1900 1900 1900 1900 1900Lane Width 12 12 12 12 12 12 12 16 12 12 12 12Total Lost time (s) 4.5 4.5 4.5 4.5 4.5 4.5Lane Util. Factor 1.00 0.95 0.95 0.95 1.00 0.95Frpb, ped/bikes 0.98 1.00 0.99 0.99 1.00 0.97Flpb, ped/bikes 1.00 1.00 1.00 1.00 1.00 1.00Frt 0.93 1.00 0.89 0.98 1.00 0.95Flt Protected 0.98 0.95 1.00 1.00 0.95 1.00Satd. Flow (prot) 1576 1698 1569 3852 1770 3280Flt Permitted 0.98 0.95 1.00 1.00 0.95 1.00Satd. Flow (perm) 1576 1698 1569 3852 1770 3280Peak-hour factor, PHF 1.00 1.00 1.00 1.00 1.00 1.00 1.00 1.00 1.00 1.00 1.00 1.00Adj. Flow (vph) 6 0 6 94 52 154 0 657 117 64 598 273RTOR Reduction (vph) 0 12 0 0 119 0 0 11 0 0 37 0Lane Group Flow (vph) 0 0 0 85 96 0 0 763 0 64 834 0Confl. Peds. (#/hr) 4 4 22 18 22Confl. Bikes (#/hr) 1 2 33 27Heavy Vehicles (%) 8% 8% 8% 1% 1% 1% 3% 3% 3% 2% 2% 2%Turn Type Split NA Split NA NA Prot NAProtected Phases 4 4 8 8 2 1 6Permitted Phases 2Actuated Green, G (s) 1.1 15.4 15.4 48.2 7.3 60.0Effective Green, g (s) 1.1 15.4 15.4 48.2 7.3 60.0Actuated g/C Ratio 0.01 0.17 0.17 0.54 0.08 0.67Clearance Time (s) 4.5 4.5 4.5 4.5 4.5 4.5Vehicle Extension (s) 3.0 3.0 3.0 3.0 3.0 3.0Lane Grp Cap (vph) 19 290 268 2062 143 2186v/s Ratio Prot c0.00 0.05 c0.06 0.20 0.04 c0.25v/s Ratio Permv/c Ratio 0.01 0.29 0.36 0.37 0.45 0.38Uniform Delay, d1 43.9 32.6 32.9 12.1 39.4 6.7Progression Factor 1.00 1.00 1.00 0.95 1.00 1.00Incremental Delay, d2 0.1 0.6 0.8 0.4 2.2 0.5Delay (s) 44.0 33.1 33.8 11.9 41.7 7.2Level of Service D C C B D AApproach Delay (s) 44.0 33.6 11.9 9.6Approach LOS D C B A
Intersection SummaryHCM 2000 Control Delay 14.3 HCM 2000 Level of Service BHCM 2000 Volume to Capacity ratio 0.39Actuated Cycle Length (s) 90.0 Sum of lost time (s) 18.0Intersection Capacity Utilization 70.1% ICU Level of Service CAnalysis Period (min) 15c Critical Lane Group
HCM Signalized Intersection Capacity Analysis Children's Hospital16: Telegraph Ave & 51St Street DC_Existing AM Plus Phase 1
Fehr & Peers Synchro 8 Report
Movement EBL EBT EBR WBL WBT WBR NBL NBT NBR SBL SBT SBRLane ConfigurationsVolume (vph) 220 488 68 101 530 238 91 320 58 147 511 38Ideal Flow (vphpl) 1900 1900 1900 1900 1900 1900 1900 1900 1900 1900 1900 1900Total Lost time (s) 4.0 4.0 4.0 3.5 4.0 4.5 4.0 3.5Lane Util. Factor 0.97 0.95 1.00 0.95 1.00 0.95 1.00 0.95Frpb, ped/bikes 1.00 0.99 1.00 0.98 1.00 0.99 1.00 0.99Flpb, ped/bikes 1.00 1.00 1.00 1.00 1.00 1.00 1.00 1.00Frt 1.00 0.98 1.00 0.95 1.00 0.98 1.00 0.99Flt Protected 0.95 1.00 0.95 1.00 0.95 1.00 0.95 1.00Satd. Flow (prot) 3400 3417 1787 3349 1719 3324 1752 3447Flt Permitted 0.95 1.00 0.95 1.00 0.95 1.00 0.95 1.00Satd. Flow (perm) 3400 3417 1787 3349 1719 3324 1752 3447Peak-hour factor, PHF 1.00 1.00 1.00 1.00 1.00 1.00 1.00 1.00 1.00 1.00 1.00 1.00Adj. Flow (vph) 220 488 68 101 530 238 91 320 58 147 511 38RTOR Reduction (vph) 0 12 0 0 56 0 0 16 0 0 5 0Lane Group Flow (vph) 220 544 0 101 712 0 91 362 0 147 544 0Confl. Peds. (#/hr) 31 31 30 37Confl. Bikes (#/hr) 9 7 27 27Heavy Vehicles (%) 3% 3% 3% 1% 1% 1% 5% 5% 5% 3% 3% 3%Turn Type Prot NA Prot NA Prot NA Prot NAProtected Phases 7 4 3 8 5 2 1 6Permitted PhasesActuated Green, G (s) 11.0 29.0 8.6 27.1 8.4 24.9 11.0 28.5Effective Green, g (s) 11.0 29.0 8.6 27.1 8.4 24.9 11.0 28.5Actuated g/C Ratio 0.12 0.32 0.10 0.30 0.09 0.28 0.12 0.32Clearance Time (s) 4.0 4.0 4.0 3.5 4.0 4.5 4.0 3.5Vehicle Extension (s) 3.0 3.0 3.0 3.0 3.0 3.0 3.0 3.0Lane Grp Cap (vph) 415 1101 170 1008 160 919 214 1091v/s Ratio Prot c0.06 0.16 0.06 c0.21 0.05 0.11 c0.08 c0.16v/s Ratio Permv/c Ratio 0.53 0.49 0.59 0.71 0.57 0.39 0.69 0.50Uniform Delay, d1 37.1 24.6 39.0 27.9 39.1 26.4 37.8 24.9Progression Factor 1.28 0.79 1.00 1.00 1.00 1.00 1.01 0.86Incremental Delay, d2 1.2 1.5 5.5 4.2 4.6 1.3 8.5 1.6Delay (s) 48.5 20.8 44.5 32.1 43.6 27.7 46.7 23.1Level of Service D C D C D C D CApproach Delay (s) 28.7 33.5 30.8 28.1Approach LOS C C C C
Intersection SummaryHCM 2000 Control Delay 30.4 HCM 2000 Level of Service CHCM 2000 Volume to Capacity ratio 0.62Actuated Cycle Length (s) 90.0 Sum of lost time (s) 16.5Intersection Capacity Utilization 69.6% ICU Level of Service CAnalysis Period (min) 15c Critical Lane Group

HCM Signalized Intersection Capacity Analysis Children's Hospital17: SB SR-24 On-Ramp & MLK Way & NB SR-24 Off-Ramp DC_Existing AM Plus Phase 1
Fehr & Peers Synchro 8 Report
Movement EBL EBT EBR WBL WBT WBR NBL NBT NBR SBL SBT SBRLane ConfigurationsVolume (vph) 149 0 0 0 0 1506 0 0 0 0 1418 234Ideal Flow (vphpl) 1900 1900 1900 1900 1900 1900 1900 1900 1900 1900 1900 1900Total Lost time (s) 4.0 4.0 4.0 4.0Lane Util. Factor 0.97 1.00 0.95 0.88Frpb, ped/bikes 1.00 1.00 1.00 1.00Flpb, ped/bikes 1.00 1.00 1.00 1.00Frt 1.00 0.86 1.00 0.85Flt Protected 0.95 1.00 1.00 1.00Satd. Flow (prot) 3273 1627 3574 2814Flt Permitted 0.95 1.00 1.00 1.00Satd. Flow (perm) 3273 1627 3574 2814Peak-hour factor, PHF 1.00 1.00 1.00 1.00 1.00 1.00 1.00 1.00 1.00 1.00 1.00 1.00Adj. Flow (vph) 149 0 0 0 0 1506 0 0 0 0 1418 234RTOR Reduction (vph) 0 0 0 0 0 0 0 0 0 0 0 0Lane Group Flow (vph) 149 0 0 0 0 1506 0 0 0 0 1418 234Confl. Bikes (#/hr) 2Heavy Vehicles (%) 7% 7% 2% 2% 1% 1% 2% 2% 2% 2% 1% 1%Turn Type Prot Free NA customProtected Phases 2 6 FreePermitted Phases FreeActuated Green, G (s) 8.0 45.0 29.0 45.0Effective Green, g (s) 8.0 45.0 29.0 45.0Actuated g/C Ratio 0.18 1.00 0.64 1.00Clearance Time (s) 4.0 4.0Lane Grp Cap (vph) 581 1627 2303 2814v/s Ratio Prot 0.05 0.40 0.08v/s Ratio Perm c0.93v/c Ratio 0.26 0.93 0.62 0.08Uniform Delay, d1 15.9 0.0 4.7 0.0Progression Factor 1.00 1.00 1.77 1.00Incremental Delay, d2 1.1 10.5 1.1 0.0Delay (s) 17.0 10.5 9.4 0.0Level of Service B B A AApproach Delay (s) 17.0 10.5 0.0 8.1Approach LOS B B A A
Intersection SummaryHCM 2000 Control Delay 9.6 HCM 2000 Level of Service AHCM 2000 Volume to Capacity ratio 1.13Actuated Cycle Length (s) 45.0 Sum of lost time (s) 8.0Intersection Capacity Utilization 50.1% ICU Level of Service AAnalysis Period (min) 15c Critical Lane Group
HCM Unsignalized Intersection Capacity Analysis Children's Hospital18: West Street & 52nd Street DC_Existing AM Plus Phase 1
Fehr & Peers Synchro 8 Report
Movement EBL EBT EBR WBL WBT WBR NBL NBT NBR SBL SBT SBRLane ConfigurationsSign Control Stop Stop Stop StopVolume (vph) 0 159 10 57 72 0 22 0 71 2 43 5Peak Hour Factor 1.00 1.00 1.00 1.00 1.00 1.00 1.00 1.00 1.00 1.00 1.00 1.00Hourly flow rate (vph) 0 159 10 57 72 0 22 0 71 2 43 5
Direction, Lane # EB 1 WB 1 NB 1 NB 2 SB 1Volume Total (vph) 169 129 22 71 50Volume Left (vph) 0 57 22 0 2Volume Right (vph) 10 0 0 71 5Hadj (s) -0.02 0.12 0.50 -0.70 -0.02Departure Headway (s) 4.4 4.6 5.7 4.5 4.8Degree Utilization, x 0.21 0.16 0.04 0.09 0.07Capacity (veh/h) 792 751 591 739 693Control Delay (s) 8.5 8.4 7.8 6.8 8.1Approach Delay (s) 8.5 8.4 7.0 8.1Approach LOS A A A A
Intersection SummaryDelay 8.1Level of Service AIntersection Capacity Utilization 36.2% ICU Level of Service AAnalysis Period (min) 15

HCM Unsignalized Intersection Capacity Analysis Children's Hospital19: Genoa Street & 52nd Street DC_Existing AM Plus Phase 1
Fehr & Peers Synchro 8 Report
Movement EBL EBT EBR WBL WBT WBR NBL NBT NBR SBL SBT SBRLane ConfigurationsSign Control Stop Stop Stop StopVolume (vph) 5 144 1 4 77 20 1 0 3 15 0 3Peak Hour Factor 1.00 1.00 1.00 1.00 1.00 1.00 1.00 1.00 1.00 1.00 1.00 1.00Hourly flow rate (vph) 5 144 1 4 77 20 1 0 3 15 0 3
Direction, Lane # EB 1 WB 1 NB 1 SB 1Volume Total (vph) 150 101 4 18Volume Left (vph) 5 4 1 15Volume Right (vph) 1 20 3 3Hadj (s) 0.02 -0.11 -0.40 0.07Departure Headway (s) 4.1 4.0 4.1 4.5Degree Utilization, x 0.17 0.11 0.00 0.02Capacity (veh/h) 872 890 827 744Control Delay (s) 7.9 7.5 7.1 7.6Approach Delay (s) 7.9 7.5 7.1 7.6Approach LOS A A A A
Intersection SummaryDelay 7.7Level of Service AIntersection Capacity Utilization 21.4% ICU Level of Service AAnalysis Period (min) 15
HCM Unsignalized Intersection Capacity Analysis Children's Hospital20: Genoa Street & 55th Street DC_Existing AM Plus Phase 1
Fehr & Peers Synchro 8 Report
Movement EBL EBT EBR WBL WBT WBR NBL NBT NBR SBL SBT SBRLane ConfigurationsVolume (veh/h) 2 354 0 4 312 10 6 11 14 32 12 8Sign Control Free Free Stop StopGrade 0% 0% 0% 0%Peak Hour Factor 1.00 1.00 1.00 1.00 1.00 1.00 1.00 1.00 1.00 1.00 1.00 1.00Hourly flow rate (vph) 2 354 0 4 312 10 6 11 14 32 12 8Pedestrians 8 2 10 11Lane Width (ft) 12.0 12.0 12.0 12.0Walking Speed (ft/s) 4.0 4.0 4.0 4.0Percent Blockage 1 0 1 1Right turn flare (veh)Median type None NoneMedian storage veh)Upstream signal (ft) 721pX, platoon unblockedvC, conflicting volume 333 364 715 709 366 716 704 336vC1, stage 1 conf volvC2, stage 2 conf volvCu, unblocked vol 333 364 715 709 366 716 704 336tC, single (s) 4.1 4.1 7.1 6.5 6.2 7.1 6.5 6.2tC, 2 stage (s)tF (s) 2.2 2.2 3.5 4.0 3.3 3.5 4.0 3.3p0 queue free % 100 100 98 97 98 90 97 99cM capacity (veh/h) 1221 1196 325 353 677 321 353 695
Direction, Lane # EB 1 WB 1 NB 1 SB 1Volume Total 356 326 31 52Volume Left 2 4 6 32Volume Right 0 10 14 8cSH 1221 1196 441 358Volume to Capacity 0.00 0.00 0.07 0.15Queue Length 95th (ft) 0 0 6 13Control Delay (s) 0.1 0.1 13.8 16.7Lane LOS A A B CApproach Delay (s) 0.1 0.1 13.8 16.7Approach LOS B C
Intersection SummaryAverage Delay 1.8Intersection Capacity Utilization 35.4% ICU Level of Service AAnalysis Period (min) 15
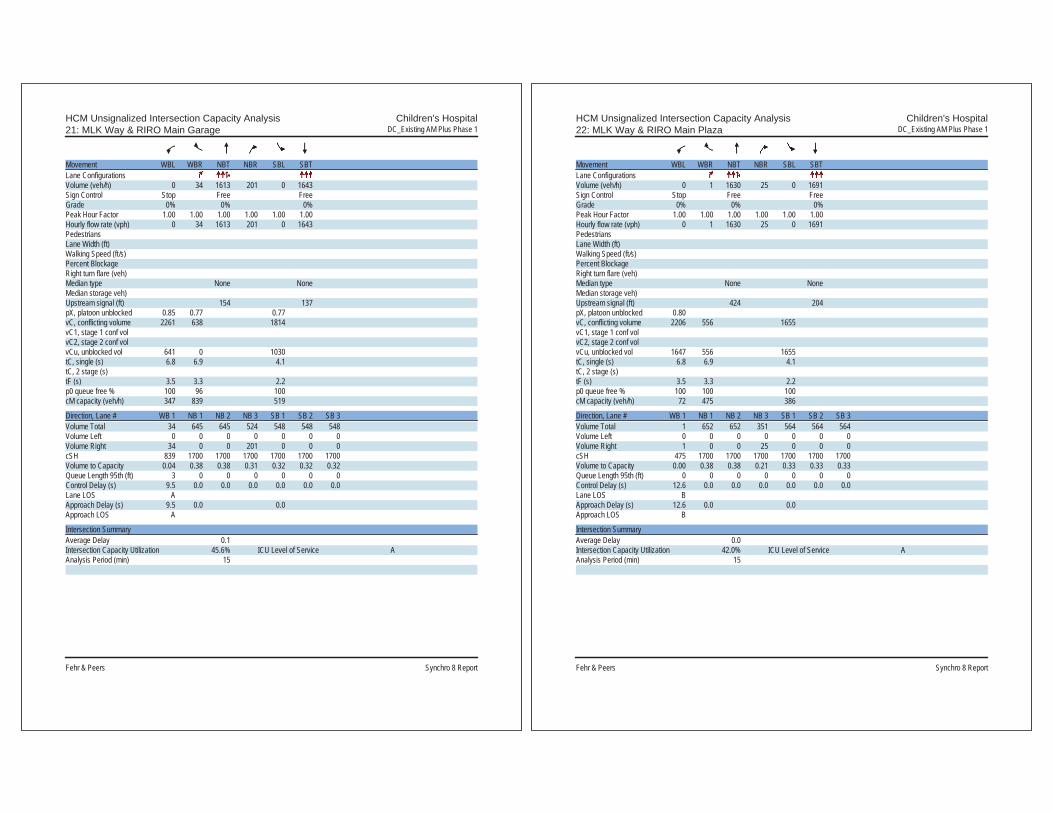
HCM Unsignalized Intersection Capacity Analysis Children's Hospital21: MLK Way & RIRO Main Garage DC_Existing AM Plus Phase 1
Fehr & Peers Synchro 8 Report
Movement WBL WBR NBT NBR SBL SBTLane ConfigurationsVolume (veh/h) 0 34 1613 201 0 1643Sign Control Stop Free FreeGrade 0% 0% 0%Peak Hour Factor 1.00 1.00 1.00 1.00 1.00 1.00Hourly flow rate (vph) 0 34 1613 201 0 1643PedestriansLane Width (ft)Walking Speed (ft/s)Percent BlockageRight turn flare (veh)Median type None NoneMedian storage veh)Upstream signal (ft) 154 137pX, platoon unblocked 0.85 0.77 0.77vC, conflicting volume 2261 638 1814vC1, stage 1 conf volvC2, stage 2 conf volvCu, unblocked vol 641 0 1030tC, single (s) 6.8 6.9 4.1tC, 2 stage (s)tF (s) 3.5 3.3 2.2p0 queue free % 100 96 100cM capacity (veh/h) 347 839 519
Direction, Lane # WB 1 NB 1 NB 2 NB 3 SB 1 SB 2 SB 3Volume Total 34 645 645 524 548 548 548Volume Left 0 0 0 0 0 0 0Volume Right 34 0 0 201 0 0 0cSH 839 1700 1700 1700 1700 1700 1700Volume to Capacity 0.04 0.38 0.38 0.31 0.32 0.32 0.32Queue Length 95th (ft) 3 0 0 0 0 0 0Control Delay (s) 9.5 0.0 0.0 0.0 0.0 0.0 0.0Lane LOS AApproach Delay (s) 9.5 0.0 0.0Approach LOS A
Intersection SummaryAverage Delay 0.1Intersection Capacity Utilization 45.6% ICU Level of Service AAnalysis Period (min) 15
HCM Unsignalized Intersection Capacity Analysis Children's Hospital22: MLK Way & RIRO Main Plaza DC_Existing AM Plus Phase 1
Fehr & Peers Synchro 8 Report
Movement WBL WBR NBT NBR SBL SBTLane ConfigurationsVolume (veh/h) 0 1 1630 25 0 1691Sign Control Stop Free FreeGrade 0% 0% 0%Peak Hour Factor 1.00 1.00 1.00 1.00 1.00 1.00Hourly flow rate (vph) 0 1 1630 25 0 1691PedestriansLane Width (ft)Walking Speed (ft/s)Percent BlockageRight turn flare (veh)Median type None NoneMedian storage veh)Upstream signal (ft) 424 204pX, platoon unblocked 0.80vC, conflicting volume 2206 556 1655vC1, stage 1 conf volvC2, stage 2 conf volvCu, unblocked vol 1647 556 1655tC, single (s) 6.8 6.9 4.1tC, 2 stage (s)tF (s) 3.5 3.3 2.2p0 queue free % 100 100 100cM capacity (veh/h) 72 475 386
Direction, Lane # WB 1 NB 1 NB 2 NB 3 SB 1 SB 2 SB 3Volume Total 1 652 652 351 564 564 564Volume Left 0 0 0 0 0 0 0Volume Right 1 0 0 25 0 0 0cSH 475 1700 1700 1700 1700 1700 1700Volume to Capacity 0.00 0.38 0.38 0.21 0.33 0.33 0.33Queue Length 95th (ft) 0 0 0 0 0 0 0Control Delay (s) 12.6 0.0 0.0 0.0 0.0 0.0 0.0Lane LOS BApproach Delay (s) 12.6 0.0 0.0Approach LOS B
Intersection SummaryAverage Delay 0.0Intersection Capacity Utilization 42.0% ICU Level of Service AAnalysis Period (min) 15

HCM Unsignalized Intersection Capacity Analysis Children's Hospital24: 51St Street & 52nd Street DC_Existing AM Plus Phase 1
Fehr & Peers Synchro 8 Report
Intersection Sign configuration not allowed in HCM analysis.
HCM Signalized Intersection Capacity Analysis Children's Hospital 1: MLK Way & 55th Street DC_Existing PM Plus Phase 1
Fehr & Peers Synchro 8 Report
Movement EBL EBT EBR WBL WBT WBR NBU NBL NBT NBR SBL SBTLane ConfigurationsVolume (vph) 12 247 161 49 137 42 22 198 1580 143 86 1295Ideal Flow (vphpl) 1900 1900 1900 1900 1900 1900 1900 1900 1900 1900 1900 1900Total Lost time (s) 5.0 5.0 4.5 5.0 4.5 5.0Lane Util. Factor 1.00 1.00 1.00 0.91 1.00 0.91Frpb, ped/bikes 0.99 0.99 1.00 0.99 1.00 1.00Flpb, ped/bikes 1.00 1.00 1.00 1.00 1.00 1.00Frt 0.95 0.98 1.00 0.99 1.00 1.00Flt Protected 1.00 0.99 0.95 1.00 0.95 1.00Satd. Flow (prot) 1756 1751 1770 4991 1770 5074Flt Permitted 0.99 0.70 0.95 1.00 0.95 1.00Satd. Flow (perm) 1739 1233 1770 4991 1770 5074Peak-hour factor, PHF 1.00 1.00 1.00 1.00 1.00 1.00 1.00 1.00 1.00 1.00 1.00 1.00Adj. Flow (vph) 12 247 161 49 137 42 22 198 1580 143 86 1295RTOR Reduction (vph) 0 24 0 0 9 0 0 0 9 0 0 1Lane Group Flow (vph) 0 396 0 0 219 0 0 220 1714 0 86 1308Confl. Peds. (#/hr) 11 15 15 11 12 20 20Confl. Bikes (#/hr) 16 12 15Heavy Vehicles (%) 1% 1% 1% 4% 4% 4% 2% 2% 2% 2% 2% 2%Turn Type Perm NA Perm NA Prot Prot NA Prot NAProtected Phases 4 8 5 5 2 1 6Permitted Phases 4 8Actuated Green, G (s) 28.2 28.2 22.4 48.9 8.4 34.9Effective Green, g (s) 28.2 28.2 22.4 48.9 8.4 34.9Actuated g/C Ratio 0.28 0.28 0.22 0.49 0.08 0.35Clearance Time (s) 5.0 5.0 4.5 5.0 4.5 5.0Vehicle Extension (s) 3.0 3.0 3.0 3.0 3.0 3.0Lane Grp Cap (vph) 490 347 396 2440 148 1770v/s Ratio Prot 0.12 c0.34 0.05 c0.26v/s Ratio Perm c0.23 0.18v/c Ratio 0.81 0.63 0.56 0.70 0.58 0.74Uniform Delay, d1 33.4 31.3 34.4 19.9 44.1 28.6Progression Factor 1.00 1.00 0.51 0.34 1.00 1.00Incremental Delay, d2 9.4 3.7 1.4 1.5 5.7 2.8Delay (s) 42.8 35.0 19.1 8.2 49.8 31.4Level of Service D D B A D CApproach Delay (s) 42.8 35.0 9.5 32.5Approach LOS D D A C
Intersection SummaryHCM 2000 Control Delay 22.5 HCM 2000 Level of Service CHCM 2000 Volume to Capacity ratio 0.77Actuated Cycle Length (s) 100.0 Sum of lost time (s) 14.5Intersection Capacity Utilization 86.3% ICU Level of Service EAnalysis Period (min) 15c Critical Lane Group

HCM Signalized Intersection Capacity Analysis Children's Hospital 1: MLK Way & 55th Street DC_Existing PM Plus Phase 1
Fehr & Peers Synchro 8 Report
Movement SBRLane ConfigurationsVolume (vph) 14Ideal Flow (vphpl) 1900Total Lost time (s)Lane Util. FactorFrpb, ped/bikesFlpb, ped/bikesFrtFlt ProtectedSatd. Flow (prot)Flt PermittedSatd. Flow (perm)Peak-hour factor, PHF 1.00Adj. Flow (vph) 14RTOR Reduction (vph) 0Lane Group Flow (vph) 0Confl. Peds. (#/hr) 12Confl. Bikes (#/hr) 15Heavy Vehicles (%) 2%Turn TypeProtected PhasesPermitted PhasesActuated Green, G (s)Effective Green, g (s)Actuated g/C RatioClearance Time (s)Vehicle Extension (s)Lane Grp Cap (vph)v/s Ratio Protv/s Ratio Permv/c RatioUniform Delay, d1Progression FactorIncremental Delay, d2Delay (s)Level of ServiceApproach Delay (s)Approach LOS
Intersection Summary
HCM Unsignalized Intersection Capacity Analysis Children's Hospital 2: Dover Street & 55th Street DC_Existing PM Plus Phase 1
Fehr & Peers Synchro 8 Report
Movement EBL EBT EBR WBL WBT WBR NBL NBT NBR SBL SBT SBRLane ConfigurationsVolume (veh/h) 17 446 9 6 174 9 12 12 22 11 9 30Sign Control Free Free Stop StopGrade 0% 0% 0% 0%Peak Hour Factor 1.00 1.00 1.00 1.00 1.00 1.00 1.00 1.00 1.00 1.00 1.00 1.00Hourly flow rate (vph) 17 446 9 6 174 9 12 12 22 11 9 30Pedestrians 4 13 7 17Lane Width (ft) 12.0 12.0 12.0 12.0Walking Speed (ft/s) 4.0 4.0 4.0 4.0Percent Blockage 0 1 1 1Right turn flare (veh)Median type None NoneMedian storage veh)Upstream signal (ft) 641 677pX, platoon unblocked 0.95 0.95 0.95 0.95 0.95 0.95vC, conflicting volume 200 462 720 704 470 733 704 200vC1, stage 1 conf volvC2, stage 2 conf volvCu, unblocked vol 200 403 676 658 412 689 658 200tC, single (s) 4.1 4.1 7.1 6.5 6.2 7.1 6.5 6.2tC, 2 stage (s)tF (s) 2.2 2.2 3.5 4.0 3.3 3.5 4.0 3.3p0 queue free % 99 99 96 97 96 96 97 96cM capacity (veh/h) 1335 1077 318 352 600 301 348 824
Direction, Lane # EB 1 WB 1 NB 1 SB 1Volume Total 472 189 46 50Volume Left 17 6 12 11Volume Right 9 9 22 30cSH 1335 1077 424 506Volume to Capacity 0.01 0.01 0.11 0.10Queue Length 95th (ft) 1 0 9 8Control Delay (s) 0.4 0.3 14.5 12.9Lane LOS A A B BApproach Delay (s) 0.4 0.3 14.5 12.9Approach LOS B B
Intersection SummaryAverage Delay 2.1Intersection Capacity Utilization 45.4% ICU Level of Service AAnalysis Period (min) 15

HCM Signalized Intersection Capacity Analysis Children's Hospital 3: 55th Street & Shattuck Ave DC_Existing PM Plus Phase 1
Fehr & Peers Synchro 8 Report
Movement EBL EBT EBR WBL WBT WBR NBL NBT NBR SBL SBT SBRLane ConfigurationsVolume (vph) 70 348 43 16 134 36 27 523 33 18 530 24Ideal Flow (vphpl) 1900 1900 1900 1900 1900 1900 1900 1900 1900 1900 1900 1900Total Lost time (s) 3.0 3.0 5.0 5.0Lane Util. Factor 1.00 1.00 1.00 1.00Frpb, ped/bikes 1.00 0.99 1.00 1.00Flpb, ped/bikes 1.00 1.00 1.00 1.00Frt 0.99 0.97 0.99 0.99Flt Protected 0.99 1.00 1.00 1.00Satd. Flow (prot) 1762 1772 1839 1863Flt Permitted 0.93 0.96 0.96 0.98Satd. Flow (perm) 1647 1702 1775 1824Peak-hour factor, PHF 1.00 1.00 1.00 1.00 1.00 1.00 1.00 1.00 1.00 1.00 1.00 1.00Adj. Flow (vph) 70 348 43 16 134 36 27 523 33 18 530 24RTOR Reduction (vph) 0 4 0 0 11 0 0 3 0 0 2 0Lane Group Flow (vph) 0 457 0 0 175 0 0 580 0 0 570 0Confl. Peds. (#/hr) 11 11 11 11 19 7 7 19Confl. Bikes (#/hr) 15 10 31 22Heavy Vehicles (%) 5% 5% 5% 3% 3% 3% 2% 2% 2% 1% 1% 1%Turn Type Perm NA Perm NA Perm NA Perm NAProtected Phases 2 6 4 8Permitted Phases 2 6 4 4 8Actuated Green, G (s) 29.0 29.0 43.0 43.0Effective Green, g (s) 29.0 29.0 43.0 43.0Actuated g/C Ratio 0.36 0.36 0.54 0.54Clearance Time (s) 3.0 3.0 5.0 5.0Lane Grp Cap (vph) 597 616 954 980v/s Ratio Protv/s Ratio Perm c0.28 0.10 c0.33 0.31v/c Ratio 0.76 0.28 0.61 0.58Uniform Delay, d1 22.5 18.1 12.7 12.4Progression Factor 1.00 1.00 1.00 1.00Incremental Delay, d2 9.0 1.2 2.9 2.5Delay (s) 31.5 19.3 15.6 15.0Level of Service C B B BApproach Delay (s) 31.5 19.3 15.6 15.0Approach LOS C B B B
Intersection SummaryHCM 2000 Control Delay 19.9 HCM 2000 Level of Service BHCM 2000 Volume to Capacity ratio 0.67Actuated Cycle Length (s) 80.0 Sum of lost time (s) 8.0Intersection Capacity Utilization 88.5% ICU Level of Service EAnalysis Period (min) 15c Critical Lane Group
HCM Signalized Intersection Capacity Analysis Children's Hospital 4: 55th Street & Telegraph Ave DC_Existing PM Plus Phase 1
Fehr & Peers Synchro 8 Report
Movement EBL EBT EBR WBL WBT WBR NBL NBT NBR SBL SBT SBRLane ConfigurationsVolume (vph) 283 20 94 38 14 18 70 880 57 20 925 96Ideal Flow (vphpl) 1900 1900 1900 1900 1900 1900 1900 1900 1900 1900 1900 1900Total Lost time (s) 4.5 4.5 4.5 4.5 4.5 4.5Lane Util. Factor 1.00 1.00 1.00 0.95 1.00 0.95Frpb, ped/bikes 0.99 0.99 1.00 1.00 1.00 0.99Flpb, ped/bikes 0.99 0.99 0.99 1.00 0.99 1.00Frt 0.97 0.97 1.00 0.99 1.00 0.99Flt Protected 0.97 0.97 0.95 1.00 0.95 1.00Satd. Flow (prot) 1659 1692 1752 3490 1772 3488Flt Permitted 0.76 0.77 0.21 1.00 0.24 1.00Satd. Flow (perm) 1307 1341 389 3490 450 3488Peak-hour factor, PHF 1.00 1.00 1.00 1.00 1.00 1.00 1.00 1.00 1.00 1.00 1.00 1.00Adj. Flow (vph) 283 20 94 38 14 18 70 880 57 20 925 96RTOR Reduction (vph) 0 13 0 0 12 0 0 5 0 0 8 0Lane Group Flow (vph) 0 384 0 0 58 0 70 932 0 20 1013 0Confl. Peds. (#/hr) 11 26 26 11 25 17 17 25Confl. Bikes (#/hr) 8 9 29 45Heavy Vehicles (%) 5% 5% 5% 4% 4% 4% 2% 2% 2% 1% 1% 1%Turn Type Perm NA Perm NA Perm NA Perm NAProtected Phases 4 8 2 6Permitted Phases 4 8 2 6Actuated Green, G (s) 30.8 30.8 50.2 50.2 50.2 50.2Effective Green, g (s) 30.8 30.8 50.2 50.2 50.2 50.2Actuated g/C Ratio 0.34 0.34 0.56 0.56 0.56 0.56Clearance Time (s) 4.5 4.5 4.5 4.5 4.5 4.5Vehicle Extension (s) 3.0 3.0 3.0 3.0 3.0 3.0Lane Grp Cap (vph) 447 458 216 1946 251 1945v/s Ratio Prot 0.27 c0.29v/s Ratio Perm c0.29 0.04 0.18 0.04v/c Ratio 0.86 0.13 0.32 0.48 0.08 0.52Uniform Delay, d1 27.6 20.4 10.7 12.0 9.2 12.4Progression Factor 1.00 1.00 1.00 1.00 1.00 1.00Incremental Delay, d2 15.0 0.1 3.9 0.8 0.6 1.0Delay (s) 42.6 20.5 14.7 12.9 9.8 13.4Level of Service D C B B A BApproach Delay (s) 42.6 20.5 13.0 13.3Approach LOS D C B B
Intersection SummaryHCM 2000 Control Delay 18.0 HCM 2000 Level of Service BHCM 2000 Volume to Capacity ratio 0.65Actuated Cycle Length (s) 90.0 Sum of lost time (s) 9.0Intersection Capacity Utilization 73.7% ICU Level of Service DAnalysis Period (min) 15c Critical Lane Group

HCM Unsignalized Intersection Capacity Analysis Children's Hospital 5: MLK Way & 54th Street DC_Existing PM Plus Phase 1
Fehr & Peers Synchro 8 Report
Movement EBL EBT EBR WBL WBT WBR NBU NBL NBT NBR SBU SBLLane ConfigurationsVolume (veh/h) 4 5 38 14 2 8 11 32 1904 43 6 9Sign Control Stop Stop FreeGrade 0% 0% 0%Peak Hour Factor 1.00 1.00 1.00 1.00 1.00 1.00 1.00 1.00 1.00 1.00 1.00 1.00Hourly flow rate (vph) 4 5 38 14 2 8 0 32 1904 43 0 9Pedestrians 5 19 11Lane Width (ft) 12.0 12.0 12.0Walking Speed (ft/s) 4.0 4.0 4.0Percent Blockage 0 2 1Right turn flare (veh)Median type NoneMedian storage veh)Upstream signal (ft) 299pX, platoon unblocked 0.88 0.88 0.78 0.88 0.88 0.79 0.00 0.78 0.00 0.79vC, conflicting volume 2230 3552 518 2577 3534 675 0 1508 0 1966vC1, stage 1 conf volvC2, stage 2 conf volvCu, unblocked vol 297 1793 0 689 1773 0 0 648 0 1276tC, single (s) 7.5 6.5 6.9 7.5 6.5 6.9 0.0 4.1 0.0 4.1tC, 2 stage (s)tF (s) 3.5 4.0 3.3 *5.0 *5.0 *5.0 0.0 2.2 0.0 2.2p0 queue free % 99 92 95 93 97 99 0 96 0 98cM capacity (veh/h) 506 66 836 193 64 557 0 722 0 422
Direction, Lane # EB 1 WB 1 NB 1 NB 2 NB 3 SB 1 SB 2 SB 3Volume Total 47 24 508 952 519 383 748 381Volume Left 4 14 32 0 0 9 0 0Volume Right 38 8 0 0 43 0 0 7cSH 364 203 722 1700 1700 422 1700 1700Volume to Capacity 0.13 0.12 0.04 0.56 0.31 0.02 0.44 0.22Queue Length 95th (ft) 11 10 3 0 0 2 0 0Control Delay (s) 16.3 25.1 1.2 0.0 0.0 0.7 0.0 0.0Lane LOS C D A AApproach Delay (s) 16.3 25.1 0.3 0.2Approach LOS C D
Intersection SummaryAverage Delay 0.6Intersection Capacity Utilization 81.9% ICU Level of Service DAnalysis Period (min) 15
* User Entered Value
HCM Unsignalized Intersection Capacity Analysis Children's Hospital 5: MLK Way & 54th Street DC_Existing PM Plus Phase 1
Fehr & Peers Synchro 8 Report
Movement SBT SBRLane ConfigurationsVolume (veh/h) 1496 7Sign Control FreeGrade 0%Peak Hour Factor 1.00 1.00Hourly flow rate (vph) 1496 7PedestriansLane Width (ft)Walking Speed (ft/s)Percent BlockageRight turn flare (veh)Median type NoneMedian storage veh)Upstream signal (ft) 294pX, platoon unblockedvC, conflicting volumevC1, stage 1 conf volvC2, stage 2 conf volvCu, unblocked voltC, single (s)tC, 2 stage (s)tF (s)p0 queue free %cM capacity (veh/h)
Direction, Lane #
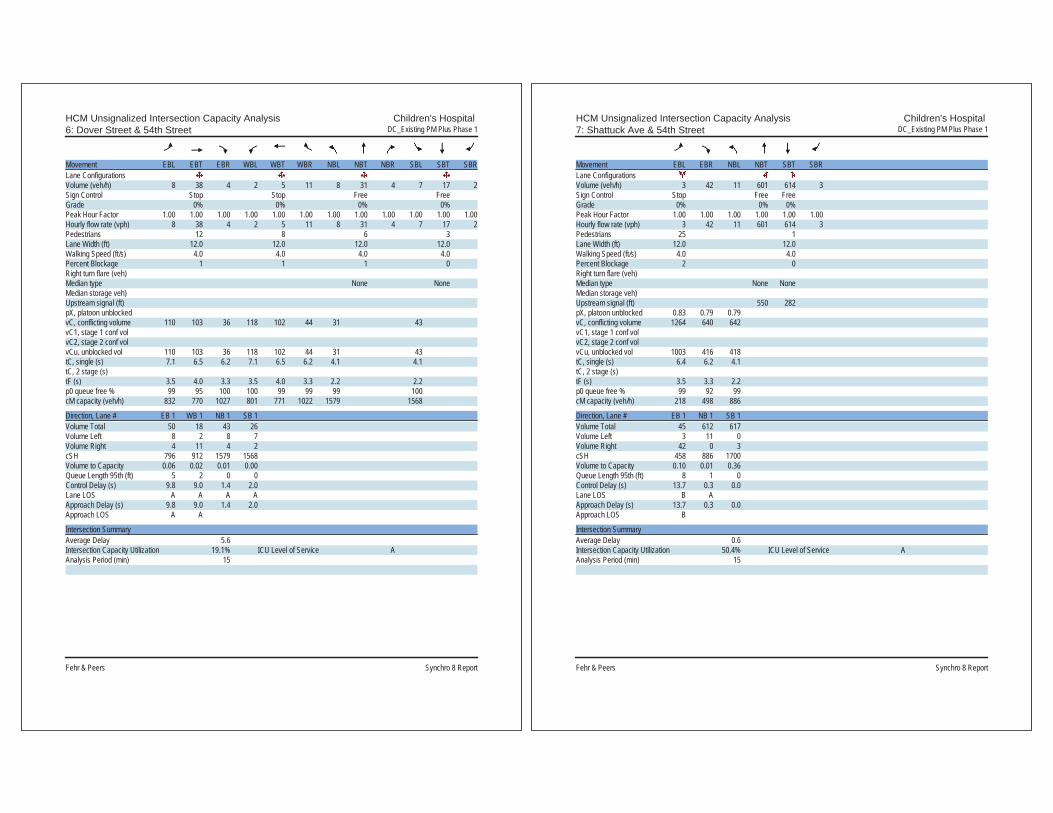
HCM Unsignalized Intersection Capacity Analysis Children's Hospital 6: Dover Street & 54th Street DC_Existing PM Plus Phase 1
Fehr & Peers Synchro 8 Report
Movement EBL EBT EBR WBL WBT WBR NBL NBT NBR SBL SBT SBRLane ConfigurationsVolume (veh/h) 8 38 4 2 5 11 8 31 4 7 17 2Sign Control Stop Stop Free FreeGrade 0% 0% 0% 0%Peak Hour Factor 1.00 1.00 1.00 1.00 1.00 1.00 1.00 1.00 1.00 1.00 1.00 1.00Hourly flow rate (vph) 8 38 4 2 5 11 8 31 4 7 17 2Pedestrians 12 8 6 3Lane Width (ft) 12.0 12.0 12.0 12.0Walking Speed (ft/s) 4.0 4.0 4.0 4.0Percent Blockage 1 1 1 0Right turn flare (veh)Median type None NoneMedian storage veh)Upstream signal (ft)pX, platoon unblockedvC, conflicting volume 110 103 36 118 102 44 31 43vC1, stage 1 conf volvC2, stage 2 conf volvCu, unblocked vol 110 103 36 118 102 44 31 43tC, single (s) 7.1 6.5 6.2 7.1 6.5 6.2 4.1 4.1tC, 2 stage (s)tF (s) 3.5 4.0 3.3 3.5 4.0 3.3 2.2 2.2p0 queue free % 99 95 100 100 99 99 99 100cM capacity (veh/h) 832 770 1027 801 771 1022 1579 1568
Direction, Lane # EB 1 WB 1 NB 1 SB 1Volume Total 50 18 43 26Volume Left 8 2 8 7Volume Right 4 11 4 2cSH 796 912 1579 1568Volume to Capacity 0.06 0.02 0.01 0.00Queue Length 95th (ft) 5 2 0 0Control Delay (s) 9.8 9.0 1.4 2.0Lane LOS A A A AApproach Delay (s) 9.8 9.0 1.4 2.0Approach LOS A A
Intersection SummaryAverage Delay 5.6Intersection Capacity Utilization 19.1% ICU Level of Service AAnalysis Period (min) 15
HCM Unsignalized Intersection Capacity Analysis Children's Hospital 7: Shattuck Ave & 54th Street DC_Existing PM Plus Phase 1
Fehr & Peers Synchro 8 Report
Movement EBL EBR NBL NBT SBT SBRLane ConfigurationsVolume (veh/h) 3 42 11 601 614 3Sign Control Stop Free FreeGrade 0% 0% 0%Peak Hour Factor 1.00 1.00 1.00 1.00 1.00 1.00Hourly flow rate (vph) 3 42 11 601 614 3Pedestrians 25 1Lane Width (ft) 12.0 12.0Walking Speed (ft/s) 4.0 4.0Percent Blockage 2 0Right turn flare (veh)Median type None NoneMedian storage veh)Upstream signal (ft) 550 282pX, platoon unblocked 0.83 0.79 0.79vC, conflicting volume 1264 640 642vC1, stage 1 conf volvC2, stage 2 conf volvCu, unblocked vol 1003 416 418tC, single (s) 6.4 6.2 4.1tC, 2 stage (s)tF (s) 3.5 3.3 2.2p0 queue free % 99 92 99cM capacity (veh/h) 218 498 886
Direction, Lane # EB 1 NB 1 SB 1Volume Total 45 612 617Volume Left 3 11 0Volume Right 42 0 3cSH 458 886 1700Volume to Capacity 0.10 0.01 0.36Queue Length 95th (ft) 8 1 0Control Delay (s) 13.7 0.3 0.0Lane LOS B AApproach Delay (s) 13.7 0.3 0.0Approach LOS B
Intersection SummaryAverage Delay 0.6Intersection Capacity Utilization 50.4% ICU Level of Service AAnalysis Period (min) 15

HCM Signalized Intersection Capacity Analysis Children's Hospital 8: MLK Way & 53rd Street DC_Existing PM Plus Phase 1
Fehr & Peers Synchro 8 Report
Movement EBL EBT EBR WBL WBT WBR NBU NBL NBT NBR SBL SBTLane ConfigurationsVolume (vph) 2 3 52 46 6 4 7 9 1993 68 2 1581Ideal Flow (vphpl) 1900 1900 1900 1900 1900 1900 1900 1900 1900 1900 1900 1900Total Lost time (s) 5.0 5.0 4.0 3.5 4.0 3.5Lane Util. Factor 1.00 1.00 1.00 0.91 1.00 0.91Frpb, ped/bikes 0.98 1.00 1.00 1.00 1.00 1.00Flpb, ped/bikes 1.00 1.00 1.00 1.00 1.00 1.00Frt 0.88 0.99 1.00 1.00 1.00 1.00Flt Protected 1.00 0.96 0.95 1.00 0.95 1.00Satd. Flow (prot) 1600 1801 1770 5040 1787 5133Flt Permitted 0.99 0.74 0.95 1.00 0.95 1.00Satd. Flow (perm) 1592 1391 1770 5040 1787 5133Peak-hour factor, PHF 1.00 1.00 1.00 1.00 1.00 1.00 1.00 1.00 1.00 1.00 1.00 1.00Adj. Flow (vph) 2 3 52 46 6 4 7 9 1993 68 2 1581RTOR Reduction (vph) 0 43 0 0 3 0 0 0 2 0 0 0Lane Group Flow (vph) 0 14 0 0 53 0 0 16 2059 0 2 1585Confl. Peds. (#/hr) 8 4 4 8 14 32 32Confl. Bikes (#/hr) 4 2 13Heavy Vehicles (%) 2% 2% 2% 0% 0% 0% 2% 2% 2% 2% 1% 1%Turn Type Perm NA Perm NA Prot Prot NA Prot NAProtected Phases 4 8 5 5 2 1 6Permitted Phases 4 8Actuated Green, G (s) 16.4 16.4 3.0 69.3 1.8 68.1Effective Green, g (s) 16.4 16.4 3.0 69.3 1.8 68.1Actuated g/C Ratio 0.16 0.16 0.03 0.69 0.02 0.68Clearance Time (s) 5.0 5.0 4.0 3.5 4.0 3.5Vehicle Extension (s) 3.0 3.0 3.0 3.0 3.0 3.0Lane Grp Cap (vph) 261 228 53 3492 32 3495v/s Ratio Prot 0.01 c0.41 0.00 c0.31v/s Ratio Perm 0.01 c0.04v/c Ratio 0.05 0.23 0.30 0.59 0.06 0.45Uniform Delay, d1 35.2 36.3 47.5 8.0 48.3 7.4Progression Factor 1.00 1.03 1.42 0.21 0.78 0.47Incremental Delay, d2 0.1 0.5 2.4 0.5 0.6 0.3Delay (s) 35.3 37.8 69.9 2.2 38.5 3.8Level of Service D D E A D AApproach Delay (s) 35.3 37.8 2.8 3.8Approach LOS D D A A
Intersection SummaryHCM 2000 Control Delay 4.2 HCM 2000 Level of Service AHCM 2000 Volume to Capacity ratio 0.54Actuated Cycle Length (s) 100.0 Sum of lost time (s) 12.5Intersection Capacity Utilization 62.9% ICU Level of Service BAnalysis Period (min) 15c Critical Lane Group
HCM Signalized Intersection Capacity Analysis Children's Hospital 8: MLK Way & 53rd Street DC_Existing PM Plus Phase 1
Fehr & Peers Synchro 8 Report
Movement SBRLane ConfigurationsVolume (vph) 4Ideal Flow (vphpl) 1900Total Lost time (s)Lane Util. FactorFrpb, ped/bikesFlpb, ped/bikesFrtFlt ProtectedSatd. Flow (prot)Flt PermittedSatd. Flow (perm)Peak-hour factor, PHF 1.00Adj. Flow (vph) 4RTOR Reduction (vph) 0Lane Group Flow (vph) 0Confl. Peds. (#/hr) 14Confl. Bikes (#/hr) 16Heavy Vehicles (%) 1%Turn TypeProtected PhasesPermitted PhasesActuated Green, G (s)Effective Green, g (s)Actuated g/C RatioClearance Time (s)Vehicle Extension (s)Lane Grp Cap (vph)v/s Ratio Protv/s Ratio Permv/c RatioUniform Delay, d1Progression FactorIncremental Delay, d2Delay (s)Level of ServiceApproach Delay (s)Approach LOS
Intersection Summary

HCM Unsignalized Intersection Capacity Analysis Children's Hospital 9: Dover Street & 53rd Street DC_Existing PM Plus Phase 1
Fehr & Peers Synchro 8 Report
Movement EBL EBT EBR WBL WBT WBR NBL NBT NBR SBL SBT SBRLane ConfigurationsVolume (veh/h) 41 8 0 0 6 5 0 0 0 1 0 28Sign Control Stop Stop Free FreeGrade 0% 0% 0% 0%Peak Hour Factor 1.00 1.00 1.00 1.00 1.00 1.00 1.00 1.00 1.00 1.00 1.00 1.00Hourly flow rate (vph) 41 8 0 0 6 5 0 0 0 1 0 28Pedestrians 25 10 4 4Lane Width (ft) 12.0 12.0 12.0 12.0Walking Speed (ft/s) 4.0 4.0 4.0 4.0Percent Blockage 2 1 0 0Right turn flare (veh)Median type None NoneMedian storage veh)Upstream signal (ft)pX, platoon unblockedvC, conflicting volume 53 51 43 34 65 14 53 10vC1, stage 1 conf volvC2, stage 2 conf volvCu, unblocked vol 53 51 43 34 65 14 53 10tC, single (s) 7.1 6.5 6.2 7.1 6.5 6.2 4.1 4.1tC, 2 stage (s)tF (s) 3.5 4.0 3.3 3.5 4.0 3.3 2.2 2.2p0 queue free % 95 99 100 100 99 100 100 100cM capacity (veh/h) 897 819 1008 938 805 1059 1533 1609
Direction, Lane # EB 1 WB 1 NB 1 SB 1Volume Total 49 11 0 29Volume Left 41 0 0 1Volume Right 0 5 0 28cSH 884 904 1700 1609Volume to Capacity 0.06 0.01 0.00 0.00Queue Length 95th (ft) 4 1 0 0Control Delay (s) 9.3 9.0 0.0 0.3Lane LOS A A AApproach Delay (s) 9.3 9.0 0.0 0.3Approach LOS A A
Intersection SummaryAverage Delay 6.3Intersection Capacity Utilization 25.8% ICU Level of Service AAnalysis Period (min) 15
HCM Signalized Intersection Capacity Analysis Children's Hospital 10: MLK Way & 52nd Street DC_Existing PM Plus Phase 1
Fehr & Peers Synchro 8 Report
Movement EBL EBT EBR WBL WBT WBR NBU NBL NBT NBR SBU SBLLane ConfigurationsVolume (vph) 76 107 95 110 81 238 42 74 1685 71 4 180Ideal Flow (vphpl) 1900 1900 1900 1900 1900 1900 1900 1900 1900 1900 1900 1900Total Lost time (s) 5.0 5.0 5.0 5.0 4.5 4.5 4.0Lane Util. Factor 1.00 1.00 1.00 1.00 1.00 0.91 1.00Frpb, ped/bikes 1.00 0.96 1.00 0.97 1.00 1.00 1.00Flpb, ped/bikes 0.99 1.00 0.98 1.00 1.00 1.00 1.00Frt 1.00 0.93 1.00 0.85 1.00 0.99 1.00Flt Protected 0.95 1.00 0.97 1.00 0.95 1.00 0.95Satd. Flow (prot) 1767 1685 1768 1535 1787 5097 1787Flt Permitted 0.53 1.00 0.58 1.00 0.95 1.00 0.95Satd. Flow (perm) 993 1685 1053 1535 1787 5097 1787Peak-hour factor, PHF 1.00 1.00 1.00 1.00 1.00 1.00 1.00 1.00 1.00 1.00 1.00 1.00Adj. Flow (vph) 76 107 95 110 81 238 42 74 1685 71 4 180RTOR Reduction (vph) 0 35 0 0 0 180 0 0 4 0 0 0Lane Group Flow (vph) 76 167 0 0 191 58 0 116 1752 0 0 184Confl. Peds. (#/hr) 16 61 61 16 13 10 10Confl. Bikes (#/hr) 9 4 15Heavy Vehicles (%) 1% 1% 1% 2% 2% 2% 1% 1% 1% 1% 1% 1%Turn Type Perm NA Perm NA Perm Prot Prot NA Prot ProtProtected Phases 4 8 5 5 2 1 1Permitted Phases 4 8 8Actuated Green, G (s) 24.4 24.4 24.4 24.4 10.8 44.6 17.5Effective Green, g (s) 24.4 24.4 24.4 24.4 10.8 44.6 17.5Actuated g/C Ratio 0.24 0.24 0.24 0.24 0.11 0.45 0.18Clearance Time (s) 5.0 5.0 5.0 5.0 4.5 4.5 4.0Vehicle Extension (s) 2.0 2.0 2.0 2.0 2.0 2.0 2.0Lane Grp Cap (vph) 242 411 256 374 192 2273 312v/s Ratio Prot 0.10 0.06 c0.34 0.10v/s Ratio Perm 0.08 c0.18 0.04v/c Ratio 0.31 0.41 0.75 0.16 0.60 0.77 0.59Uniform Delay, d1 30.9 31.7 34.9 29.7 42.6 23.4 37.9Progression Factor 1.00 1.00 0.91 2.42 0.98 1.06 0.61Incremental Delay, d2 0.3 0.2 9.5 0.1 1.6 1.1 1.7Delay (s) 31.2 32.0 41.5 71.8 43.3 25.9 25.0Level of Service C C D E D C CApproach Delay (s) 31.8 58.3 26.9Approach LOS C E C
Intersection SummaryHCM 2000 Control Delay 22.7 HCM 2000 Level of Service CHCM 2000 Volume to Capacity ratio 0.74Actuated Cycle Length (s) 100.0 Sum of lost time (s) 14.0Intersection Capacity Utilization 104.3% ICU Level of Service GAnalysis Period (min) 15c Critical Lane Group
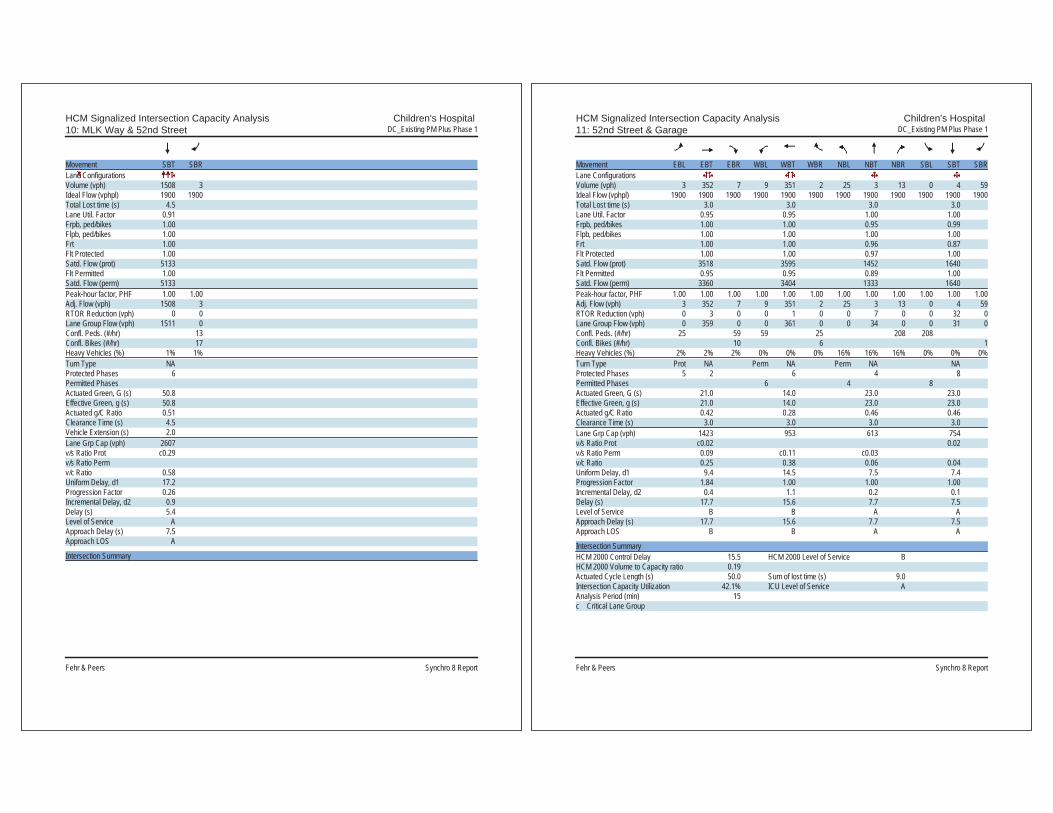
HCM Signalized Intersection Capacity Analysis Children's Hospital 10: MLK Way & 52nd Street DC_Existing PM Plus Phase 1
Fehr & Peers Synchro 8 Report
Movement SBT SBRLane ConfigurationsVolume (vph) 1508 3Ideal Flow (vphpl) 1900 1900Total Lost time (s) 4.5Lane Util. Factor 0.91Frpb, ped/bikes 1.00Flpb, ped/bikes 1.00Frt 1.00Flt Protected 1.00Satd. Flow (prot) 5133Flt Permitted 1.00Satd. Flow (perm) 5133Peak-hour factor, PHF 1.00 1.00Adj. Flow (vph) 1508 3RTOR Reduction (vph) 0 0Lane Group Flow (vph) 1511 0Confl. Peds. (#/hr) 13Confl. Bikes (#/hr) 17Heavy Vehicles (%) 1% 1%Turn Type NAProtected Phases 6Permitted PhasesActuated Green, G (s) 50.8Effective Green, g (s) 50.8Actuated g/C Ratio 0.51Clearance Time (s) 4.5Vehicle Extension (s) 2.0Lane Grp Cap (vph) 2607v/s Ratio Prot c0.29v/s Ratio Permv/c Ratio 0.58Uniform Delay, d1 17.2Progression Factor 0.26Incremental Delay, d2 0.9Delay (s) 5.4Level of Service AApproach Delay (s) 7.5Approach LOS A
Intersection Summary
HCM Signalized Intersection Capacity Analysis Children's Hospital 11: 52nd Street & Garage DC_Existing PM Plus Phase 1
Fehr & Peers Synchro 8 Report
Movement EBL EBT EBR WBL WBT WBR NBL NBT NBR SBL SBT SBRLane ConfigurationsVolume (vph) 3 352 7 9 351 2 25 3 13 0 4 59Ideal Flow (vphpl) 1900 1900 1900 1900 1900 1900 1900 1900 1900 1900 1900 1900Total Lost time (s) 3.0 3.0 3.0 3.0Lane Util. Factor 0.95 0.95 1.00 1.00Frpb, ped/bikes 1.00 1.00 0.95 0.99Flpb, ped/bikes 1.00 1.00 1.00 1.00Frt 1.00 1.00 0.96 0.87Flt Protected 1.00 1.00 0.97 1.00Satd. Flow (prot) 3518 3595 1452 1640Flt Permitted 0.95 0.95 0.89 1.00Satd. Flow (perm) 3360 3404 1333 1640Peak-hour factor, PHF 1.00 1.00 1.00 1.00 1.00 1.00 1.00 1.00 1.00 1.00 1.00 1.00Adj. Flow (vph) 3 352 7 9 351 2 25 3 13 0 4 59RTOR Reduction (vph) 0 3 0 0 1 0 0 7 0 0 32 0Lane Group Flow (vph) 0 359 0 0 361 0 0 34 0 0 31 0Confl. Peds. (#/hr) 25 59 59 25 208 208Confl. Bikes (#/hr) 10 6 1Heavy Vehicles (%) 2% 2% 2% 0% 0% 0% 16% 16% 16% 0% 0% 0%Turn Type Prot NA Perm NA Perm NA NAProtected Phases 5 2 6 4 8Permitted Phases 6 4 8Actuated Green, G (s) 21.0 14.0 23.0 23.0Effective Green, g (s) 21.0 14.0 23.0 23.0Actuated g/C Ratio 0.42 0.28 0.46 0.46Clearance Time (s) 3.0 3.0 3.0 3.0Lane Grp Cap (vph) 1423 953 613 754v/s Ratio Prot c0.02 0.02v/s Ratio Perm 0.09 c0.11 c0.03v/c Ratio 0.25 0.38 0.06 0.04Uniform Delay, d1 9.4 14.5 7.5 7.4Progression Factor 1.84 1.00 1.00 1.00Incremental Delay, d2 0.4 1.1 0.2 0.1Delay (s) 17.7 15.6 7.7 7.5Level of Service B B A AApproach Delay (s) 17.7 15.6 7.7 7.5Approach LOS B B A A
Intersection SummaryHCM 2000 Control Delay 15.5 HCM 2000 Level of Service BHCM 2000 Volume to Capacity ratio 0.19Actuated Cycle Length (s) 50.0 Sum of lost time (s) 9.0Intersection Capacity Utilization 42.1% ICU Level of Service AAnalysis Period (min) 15c Critical Lane Group

HCM Unsignalized Intersection Capacity Analysis Children's Hospital 12: 52nd Street & Dover Street DC_Existing PM Plus Phase 1
Fehr & Peers Synchro 8 Report
Movement EBL EBT EBR WBL WBT WBR NBL NBT NBR SBL SBT SBRLane ConfigurationsVolume (veh/h) 8 347 8 5 350 4 7 0 8 10 0 14Sign Control Free Free Stop StopGrade 0% 0% 0% 0%Peak Hour Factor 1.00 1.00 1.00 1.00 1.00 1.00 1.00 1.00 1.00 1.00 1.00 1.00Hourly flow rate (vph) 8 347 8 5 350 4 7 0 8 10 0 14Pedestrians 37 7 35 15Lane Width (ft) 12.0 12.0 12.0 12.0Walking Speed (ft/s) 4.0 4.0 4.0 4.0Percent Blockage 3 1 3 1Right turn flare (veh)Median type None NoneMedian storage veh)Upstream signal (ft) 312 647pX, platoon unblocked 0.91 0.89 0.94 0.94 0.89 0.94 0.94 0.91vC, conflicting volume 369 390 815 781 393 759 783 404vC1, stage 1 conf volvC2, stage 2 conf volvCu, unblocked vol 252 254 545 509 257 485 511 291tC, single (s) 4.1 4.1 7.2 6.6 6.3 7.1 6.5 6.2tC, 2 stage (s)tF (s) 2.2 2.2 3.6 4.1 3.4 3.5 4.0 3.3p0 queue free % 99 100 98 100 99 98 100 98cM capacity (veh/h) 1170 1139 362 405 655 433 417 653
Direction, Lane # EB 1 WB 1 NB 1 SB 1Volume Total 363 359 15 24Volume Left 8 5 7 10Volume Right 8 4 8 14cSH 1170 1139 476 539Volume to Capacity 0.01 0.00 0.03 0.04Queue Length 95th (ft) 1 0 2 3Control Delay (s) 0.2 0.2 12.8 12.0Lane LOS A A B BApproach Delay (s) 0.2 0.2 12.8 12.0Approach LOS B B
Intersection SummaryAverage Delay 0.8Intersection Capacity Utilization 40.6% ICU Level of Service AAnalysis Period (min) 15
HCM Unsignalized Intersection Capacity Analysis Children's Hospital 13: SR-24 NB Off-Ramp & 52nd Street DC_Existing PM Plus Phase 1
Fehr & Peers Synchro 8 Report
Movement EBL EBT EBR WBL WBT WBR NBL NBR SEL SERLane ConfigurationsVolume (veh/h) 0 360 0 0 366 1003 0 1024 0 0Sign Control Free Free Stop StopGrade 0% 0% 0% 0%Peak Hour Factor 1.00 1.00 1.00 1.00 1.00 1.00 1.00 1.00 1.00 1.00Hourly flow rate (vph) 0 360 0 0 366 1003 0 1024 0 0Pedestrians 33 9Lane Width (ft) 12.0 0.0Walking Speed (ft/s) 4.0 4.0Percent Blockage 3 0Right turn flare (veh)Median type None NoneMedian storage veh)Upstream signal (ft) 767 192pX, platoon unblocked 0.84 0.84 0.84 0.84vC, conflicting volume 1378 393 1771 213 1579 768vC1, stage 1 conf volvC2, stage 2 conf volvCu, unblocked vol 1060 393 1530 213 1301 331tC, single (s) 4.1 4.1 6.5 7.0 7.5 6.5tC, 2 stage (s)tF (s) 2.2 2.2 4.0 3.3 3.5 4.0p0 queue free % 100 100 100 0 0 100cM capacity (veh/h) 546 1130 94 767 0 478
Direction, Lane # EB 1 EB 2 WB 1 WB 2 WB 3 NB 1 NB 2Volume Total 180 180 244 456 669 512 512Volume Left 0 0 0 0 0 0 0Volume Right 0 0 0 334 669 512 512cSH 1700 1700 1700 1700 1700 767 767Volume to Capacity 0.11 0.11 0.14 0.27 0.39 0.67 0.67Queue Length 95th (ft) 0 0 0 0 0 129 129Control Delay (s) 0.0 0.0 0.0 0.0 0.0 18.6 18.6Lane LOS C CApproach Delay (s) 0.0 0.0 18.6Approach LOS C
Intersection SummaryAverage Delay 6.9Intersection Capacity Utilization 54.7% ICU Level of Service AAnalysis Period (min) 15

HCM Signalized Intersection Capacity Analysis Children's Hospital 14: 52nd Street & Shattuck Ave DC_Existing PM Plus Phase 1
Fehr & Peers Synchro 8 Report
Movement EBU EBL EBT EBR WBL WBT WBR NBL NBT NBR SBL SBTLane ConfigurationsVolume (vph) 40 302 850 172 35 831 129 146 207 40 161 143Ideal Flow (vphpl) 1900 1900 1900 1900 1900 1900 1900 1900 1900 1900 1900 1900Total Lost time (s) 4.0 4.5 4.0 4.5 4.0 5.5 5.5Lane Util. Factor 1.00 0.91 1.00 0.91 1.00 1.00 1.00Frpb, ped/bikes 1.00 0.99 1.00 0.99 1.00 0.99 1.00Flpb, ped/bikes 1.00 1.00 1.00 1.00 1.00 1.00 0.99Frt 1.00 0.97 1.00 0.98 1.00 0.98 1.00Flt Protected 0.95 1.00 0.95 1.00 0.95 1.00 0.97Satd. Flow (prot) 1787 4944 1805 5037 1748 1783 1712Flt Permitted 0.95 1.00 0.95 1.00 0.27 1.00 0.71Satd. Flow (perm) 1787 4944 1805 5037 493 1783 1243Peak-hour factor, PHF 1.00 1.00 1.00 1.00 1.00 1.00 1.00 1.00 1.00 1.00 1.00 1.00Adj. Flow (vph) 40 302 850 172 35 831 129 146 207 40 161 143RTOR Reduction (vph) 0 0 26 0 0 19 0 0 6 0 0 0Lane Group Flow (vph) 0 342 996 0 35 941 0 146 241 0 0 304Confl. Peds. (#/hr) 11 14 14 11 18 22 22Confl. Bikes (#/hr) 13 8 30Heavy Vehicles (%) 1% 1% 1% 1% 0% 0% 0% 3% 3% 3% 7% 7%Turn Type Prot Prot NA Prot NA pm+pt NA Perm NAProtected Phases 7 7 4 3 8 5 2 6Permitted Phases 2 6Actuated Green, G (s) 33.5 57.2 3.9 27.6 34.9 34.9 25.4Effective Green, g (s) 33.5 57.2 3.9 27.6 34.9 34.9 25.4Actuated g/C Ratio 0.30 0.52 0.04 0.25 0.32 0.32 0.23Clearance Time (s) 4.0 4.5 4.0 4.5 4.0 5.5 5.5Vehicle Extension (s) 3.0 3.0 3.0 3.0 3.0 3.0 3.0Lane Grp Cap (vph) 544 2570 63 1263 219 565 287v/s Ratio Prot c0.19 0.20 0.02 c0.19 c0.03 0.14v/s Ratio Perm 0.18 c0.24v/c Ratio 0.63 0.39 0.56 0.75 0.67 0.43 1.06Uniform Delay, d1 32.9 15.9 52.2 38.0 31.8 29.6 42.3Progression Factor 1.00 1.00 1.00 1.00 1.00 1.00 1.00Incremental Delay, d2 5.4 0.4 10.2 4.0 7.5 2.3 69.6Delay (s) 38.3 16.3 62.4 42.0 39.2 32.0 111.9Level of Service D B E D D C FApproach Delay (s) 21.8 42.7 34.7 71.3Approach LOS C D C E
Intersection SummaryHCM 2000 Control Delay 38.9 HCM 2000 Level of Service DHCM 2000 Volume to Capacity ratio 0.79Actuated Cycle Length (s) 110.0 Sum of lost time (s) 18.0Intersection Capacity Utilization 100.4% ICU Level of Service GAnalysis Period (min) 15c Critical Lane Group
HCM Signalized Intersection Capacity Analysis Children's Hospital 14: 52nd Street & Shattuck Ave DC_Existing PM Plus Phase 1
Fehr & Peers Synchro 8 Report
Movement SBRLane ConfigurationsVolume (vph) 353Ideal Flow (vphpl) 1900Total Lost time (s) 5.5Lane Util. Factor 1.00Frpb, ped/bikes 0.94Flpb, ped/bikes 1.00Frt 0.85Flt Protected 1.00Satd. Flow (prot) 1421Flt Permitted 1.00Satd. Flow (perm) 1421Peak-hour factor, PHF 1.00Adj. Flow (vph) 353RTOR Reduction (vph) 271Lane Group Flow (vph) 82Confl. Peds. (#/hr) 18Confl. Bikes (#/hr) 27Heavy Vehicles (%) 7%Turn Type PermProtected PhasesPermitted Phases 6Actuated Green, G (s) 25.4Effective Green, g (s) 25.4Actuated g/C Ratio 0.23Clearance Time (s) 5.5Vehicle Extension (s) 3.0Lane Grp Cap (vph) 328v/s Ratio Protv/s Ratio Perm 0.06v/c Ratio 0.25Uniform Delay, d1 34.5Progression Factor 1.00Incremental Delay, d2 1.8Delay (s) 36.3Level of Service DApproach Delay (s)Approach LOS
Intersection Summary

HCM Signalized Intersection Capacity Analysis Children's Hospital 15: Telegraph Ave & 52nd Street/Claremont Ave DC_Existing PM Plus Phase 1
Fehr & Peers Synchro 8 Report
Movement EBL EBT EBR WBL WBT WBR NBL NBT NBR SBL SBT SBRLane ConfigurationsVolume (vph) 13 7 13 99 72 157 14 842 224 101 667 281Ideal Flow (vphpl) 1900 1900 1900 1900 1900 1900 1900 1900 1900 1900 1900 1900Lane Width 12 12 12 12 12 12 12 16 12 12 12 12Total Lost time (s) 4.5 4.5 4.5 4.5 4.5 4.5Lane Util. Factor 1.00 0.95 0.95 0.95 1.00 0.95Frpb, ped/bikes 0.99 1.00 0.95 0.99 1.00 0.93Flpb, ped/bikes 1.00 1.00 1.00 1.00 1.00 1.00Frt 0.95 1.00 0.90 0.97 1.00 0.96Flt Protected 0.98 0.95 1.00 1.00 0.95 1.00Satd. Flow (prot) 1623 1698 1532 3794 1770 3149Flt Permitted 0.98 0.95 1.00 0.94 0.95 1.00Satd. Flow (perm) 1623 1698 1532 3561 1770 3149Peak-hour factor, PHF 1.00 1.00 1.00 1.00 1.00 1.00 1.00 1.00 1.00 1.00 1.00 1.00Adj. Flow (vph) 13 7 13 99 72 157 14 842 224 101 667 281RTOR Reduction (vph) 0 12 0 0 74 0 0 19 0 0 36 0Lane Group Flow (vph) 0 21 0 89 165 0 0 1061 0 101 912 0Confl. Peds. (#/hr) 34 34 70 22 22 70Confl. Bikes (#/hr) 1 10 35 48Heavy Vehicles (%) 8% 8% 8% 1% 1% 1% 3% 3% 3% 2% 2% 2%Turn Type Split NA Split NA Perm NA Prot NAProtected Phases 4 4 8 8 2 1 6Permitted Phases 2Actuated Green, G (s) 4.6 16.9 16.9 51.2 9.3 65.0Effective Green, g (s) 4.6 16.9 16.9 51.2 9.3 65.0Actuated g/C Ratio 0.05 0.17 0.17 0.51 0.09 0.65Clearance Time (s) 4.5 4.5 4.5 4.5 4.5 4.5Vehicle Extension (s) 3.0 3.0 3.0 3.0 3.0 3.0Lane Grp Cap (vph) 74 286 258 1823 164 2046v/s Ratio Prot c0.01 0.05 c0.11 c0.06 0.29v/s Ratio Perm c0.30v/c Ratio 0.28 0.31 0.64 0.58 0.62 0.45Uniform Delay, d1 46.1 36.4 38.7 17.0 43.6 8.6Progression Factor 1.88 1.00 1.00 0.60 1.00 1.00Incremental Delay, d2 1.2 0.6 5.1 1.1 6.7 0.7Delay (s) 87.7 37.1 43.9 11.3 50.3 9.3Level of Service F D D B D AApproach Delay (s) 87.7 42.0 11.3 13.3Approach LOS F D B B
Intersection SummaryHCM 2000 Control Delay 17.2 HCM 2000 Level of Service BHCM 2000 Volume to Capacity ratio 0.58Actuated Cycle Length (s) 100.0 Sum of lost time (s) 18.0Intersection Capacity Utilization 87.3% ICU Level of Service EAnalysis Period (min) 15c Critical Lane Group
HCM Signalized Intersection Capacity Analysis Children's Hospital 16: Telegraph Ave & 51St Street DC_Existing PM Plus Phase 1
Fehr & Peers Synchro 8 Report
Movement EBL EBT EBR WBL WBT WBR NBL NBT NBR SBL SBT SBRLane ConfigurationsVolume (vph) 305 607 85 56 477 229 79 574 97 262 476 44Ideal Flow (vphpl) 1900 1900 1900 1900 1900 1900 1900 1900 1900 1900 1900 1900Total Lost time (s) 4.0 4.0 4.0 3.5 4.0 4.5 4.0 3.5Lane Util. Factor 0.97 0.95 1.00 0.95 1.00 0.95 1.00 0.95Frpb, ped/bikes 1.00 0.99 1.00 0.97 1.00 0.98 1.00 0.98Flpb, ped/bikes 1.00 1.00 1.00 1.00 1.00 1.00 1.00 1.00Frt 1.00 0.98 1.00 0.95 1.00 0.98 1.00 0.99Flt Protected 0.95 1.00 0.95 1.00 0.95 1.00 0.95 1.00Satd. Flow (prot) 3400 3402 1787 3314 1719 3311 1752 3401Flt Permitted 0.95 1.00 0.95 1.00 0.95 1.00 0.95 1.00Satd. Flow (perm) 3400 3402 1787 3314 1719 3311 1752 3401Peak-hour factor, PHF 1.00 1.00 1.00 1.00 1.00 1.00 1.00 1.00 1.00 1.00 1.00 1.00Adj. Flow (vph) 305 607 85 56 477 229 79 574 97 262 476 44RTOR Reduction (vph) 0 11 0 0 57 0 0 13 0 0 7 0Lane Group Flow (vph) 305 681 0 56 649 0 79 658 0 262 513 0Confl. Peds. (#/hr) 38 52 52 38 92 57 57 92Confl. Bikes (#/hr) 8 15 34 54Heavy Vehicles (%) 3% 3% 3% 1% 1% 1% 5% 5% 5% 3% 3% 3%Turn Type Prot NA Prot NA Prot NA Prot NAProtected Phases 7 4 3 8 5 2 1 6Permitted PhasesActuated Green, G (s) 14.0 29.3 7.4 23.2 7.7 33.8 13.0 40.1Effective Green, g (s) 14.0 29.3 7.4 23.2 7.7 33.8 13.0 40.1Actuated g/C Ratio 0.14 0.29 0.07 0.23 0.08 0.34 0.13 0.40Clearance Time (s) 4.0 4.0 4.0 3.5 4.0 4.5 4.0 3.5Vehicle Extension (s) 3.0 3.0 3.0 3.0 3.0 3.0 3.0 3.0Lane Grp Cap (vph) 476 996 132 768 132 1119 227 1363v/s Ratio Prot c0.09 0.20 0.03 c0.20 0.05 c0.20 c0.15 0.15v/s Ratio Permv/c Ratio 0.64 0.68 0.42 0.85 0.60 0.59 1.15 0.38Uniform Delay, d1 40.6 31.3 44.3 36.7 44.7 27.3 43.5 21.1Progression Factor 1.00 1.00 1.00 1.00 1.00 1.00 1.17 0.74Incremental Delay, d2 2.9 3.8 2.2 11.1 7.1 2.3 105.5 0.7Delay (s) 43.6 35.1 46.5 47.7 51.8 29.6 156.5 16.3Level of Service D D D D D C F BApproach Delay (s) 37.7 47.6 31.9 63.3Approach LOS D D C E
Intersection SummaryHCM 2000 Control Delay 44.8 HCM 2000 Level of Service DHCM 2000 Volume to Capacity ratio 0.76Actuated Cycle Length (s) 100.0 Sum of lost time (s) 16.5Intersection Capacity Utilization 78.1% ICU Level of Service DAnalysis Period (min) 15c Critical Lane Group
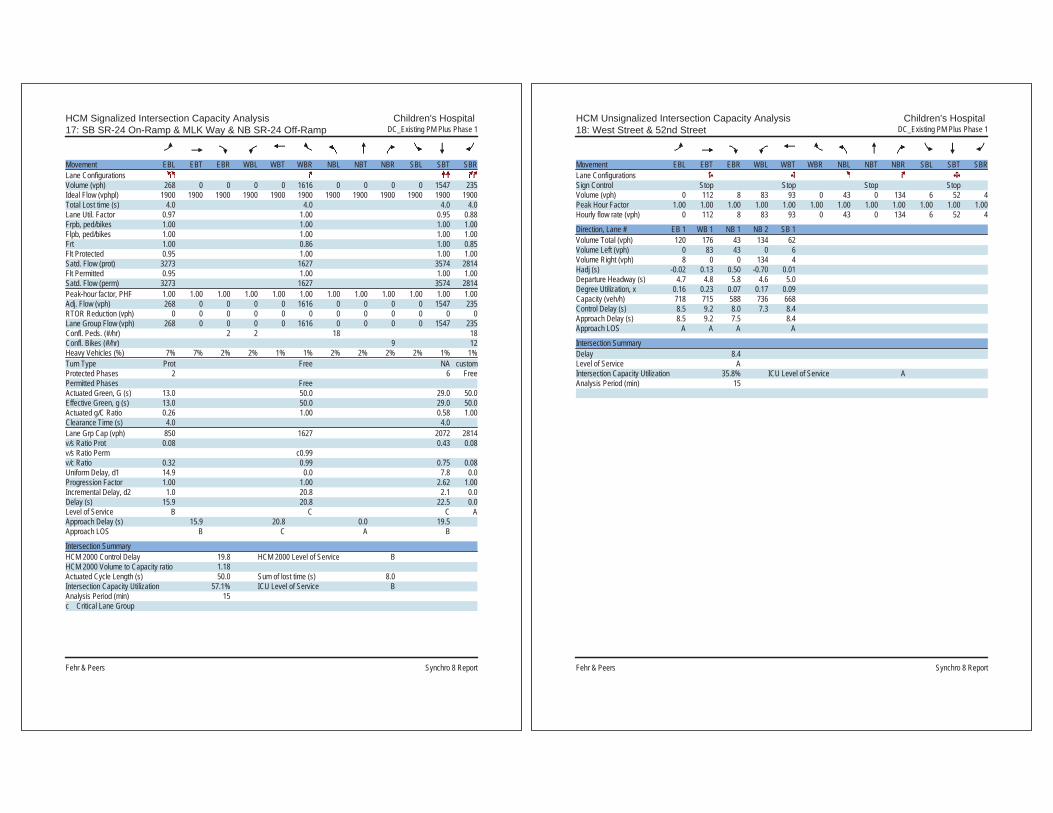
HCM Signalized Intersection Capacity Analysis Children's Hospital 17: SB SR-24 On-Ramp & MLK Way & NB SR-24 Off-Ramp DC_Existing PM Plus Phase 1
Fehr & Peers Synchro 8 Report
Movement EBL EBT EBR WBL WBT WBR NBL NBT NBR SBL SBT SBRLane ConfigurationsVolume (vph) 268 0 0 0 0 1616 0 0 0 0 1547 235Ideal Flow (vphpl) 1900 1900 1900 1900 1900 1900 1900 1900 1900 1900 1900 1900Total Lost time (s) 4.0 4.0 4.0 4.0Lane Util. Factor 0.97 1.00 0.95 0.88Frpb, ped/bikes 1.00 1.00 1.00 1.00Flpb, ped/bikes 1.00 1.00 1.00 1.00Frt 1.00 0.86 1.00 0.85Flt Protected 0.95 1.00 1.00 1.00Satd. Flow (prot) 3273 1627 3574 2814Flt Permitted 0.95 1.00 1.00 1.00Satd. Flow (perm) 3273 1627 3574 2814Peak-hour factor, PHF 1.00 1.00 1.00 1.00 1.00 1.00 1.00 1.00 1.00 1.00 1.00 1.00Adj. Flow (vph) 268 0 0 0 0 1616 0 0 0 0 1547 235RTOR Reduction (vph) 0 0 0 0 0 0 0 0 0 0 0 0Lane Group Flow (vph) 268 0 0 0 0 1616 0 0 0 0 1547 235Confl. Peds. (#/hr) 2 2 18 18Confl. Bikes (#/hr) 9 12Heavy Vehicles (%) 7% 7% 2% 2% 1% 1% 2% 2% 2% 2% 1% 1%Turn Type Prot Free NA customProtected Phases 2 6 FreePermitted Phases FreeActuated Green, G (s) 13.0 50.0 29.0 50.0Effective Green, g (s) 13.0 50.0 29.0 50.0Actuated g/C Ratio 0.26 1.00 0.58 1.00Clearance Time (s) 4.0 4.0Lane Grp Cap (vph) 850 1627 2072 2814v/s Ratio Prot 0.08 0.43 0.08v/s Ratio Perm c0.99v/c Ratio 0.32 0.99 0.75 0.08Uniform Delay, d1 14.9 0.0 7.8 0.0Progression Factor 1.00 1.00 2.62 1.00Incremental Delay, d2 1.0 20.8 2.1 0.0Delay (s) 15.9 20.8 22.5 0.0Level of Service B C C AApproach Delay (s) 15.9 20.8 0.0 19.5Approach LOS B C A B
Intersection SummaryHCM 2000 Control Delay 19.8 HCM 2000 Level of Service BHCM 2000 Volume to Capacity ratio 1.18Actuated Cycle Length (s) 50.0 Sum of lost time (s) 8.0Intersection Capacity Utilization 57.1% ICU Level of Service BAnalysis Period (min) 15c Critical Lane Group
HCM Unsignalized Intersection Capacity Analysis Children's Hospital 18: West Street & 52nd Street DC_Existing PM Plus Phase 1
Fehr & Peers Synchro 8 Report
Movement EBL EBT EBR WBL WBT WBR NBL NBT NBR SBL SBT SBRLane ConfigurationsSign Control Stop Stop Stop StopVolume (vph) 0 112 8 83 93 0 43 0 134 6 52 4Peak Hour Factor 1.00 1.00 1.00 1.00 1.00 1.00 1.00 1.00 1.00 1.00 1.00 1.00Hourly flow rate (vph) 0 112 8 83 93 0 43 0 134 6 52 4
Direction, Lane # EB 1 WB 1 NB 1 NB 2 SB 1Volume Total (vph) 120 176 43 134 62Volume Left (vph) 0 83 43 0 6Volume Right (vph) 8 0 0 134 4Hadj (s) -0.02 0.13 0.50 -0.70 0.01Departure Headway (s) 4.7 4.8 5.8 4.6 5.0Degree Utilization, x 0.16 0.23 0.07 0.17 0.09Capacity (veh/h) 718 715 588 736 668Control Delay (s) 8.5 9.2 8.0 7.3 8.4Approach Delay (s) 8.5 9.2 7.5 8.4Approach LOS A A A A
Intersection SummaryDelay 8.4Level of Service AIntersection Capacity Utilization 35.8% ICU Level of Service AAnalysis Period (min) 15

HCM Unsignalized Intersection Capacity Analysis Children's Hospital 19: Genoa Street & 52nd Street DC_Existing PM Plus Phase 1
Fehr & Peers Synchro 8 Report
Movement EBL EBT EBR WBL WBT WBR NBL NBT NBR SBL SBT SBRLane ConfigurationsSign Control Stop Stop Stop StopVolume (vph) 1 110 2 2 96 36 2 0 3 11 0 3Peak Hour Factor 1.00 1.00 1.00 1.00 1.00 1.00 1.00 1.00 1.00 1.00 1.00 1.00Hourly flow rate (vph) 1 110 2 2 96 36 2 0 3 11 0 3
Direction, Lane # EB 1 WB 1 NB 1 SB 1Volume Total (vph) 113 134 5 14Volume Left (vph) 1 2 2 11Volume Right (vph) 2 36 3 3Hadj (s) 0.01 -0.16 -0.28 0.03Departure Headway (s) 4.1 3.9 4.1 4.4Degree Utilization, x 0.13 0.14 0.01 0.02Capacity (veh/h) 870 912 809 753Control Delay (s) 7.7 7.5 7.2 7.5Approach Delay (s) 7.7 7.5 7.2 7.5Approach LOS A A A A
Intersection SummaryDelay 7.6Level of Service AIntersection Capacity Utilization 20.2% ICU Level of Service AAnalysis Period (min) 15
HCM Unsignalized Intersection Capacity Analysis Children's Hospital 20: Genoa Street & 55th Street DC_Existing PM Plus Phase 1
Fehr & Peers Synchro 8 Report
Movement EBL EBT EBR WBL WBT WBR NBL NBT NBR SBL SBT SBRLane ConfigurationsVolume (veh/h) 12 370 1 10 339 29 8 18 29 27 3 10Sign Control Free Free Stop StopGrade 0% 0% 0% 0%Peak Hour Factor 1.00 1.00 1.00 1.00 1.00 1.00 1.00 1.00 1.00 1.00 1.00 1.00Hourly flow rate (vph) 12 370 1 10 339 29 8 18 29 27 3 10Pedestrians 5 7 3Lane Width (ft) 12.0 12.0 12.0Walking Speed (ft/s) 4.0 4.0 4.0Percent Blockage 0 1 0Right turn flare (veh)Median type None NoneMedian storage veh)Upstream signal (ft) 721pX, platoon unblockedvC, conflicting volume 371 378 792 792 378 809 778 362vC1, stage 1 conf volvC2, stage 2 conf volvCu, unblocked vol 371 378 792 792 378 809 778 362tC, single (s) 4.1 4.1 7.1 6.5 6.2 7.1 6.5 6.2tC, 2 stage (s)tF (s) 2.2 2.2 3.5 4.0 3.3 3.5 4.0 3.3p0 queue free % 99 99 97 94 96 90 99 99cM capacity (veh/h) 1190 1185 294 315 670 267 319 679
Direction, Lane # EB 1 WB 1 NB 1 SB 1Volume Total 383 378 55 40Volume Left 12 10 8 27Volume Right 1 29 29 10cSH 1190 1185 431 320Volume to Capacity 0.01 0.01 0.13 0.13Queue Length 95th (ft) 1 1 11 11Control Delay (s) 0.4 0.3 14.6 17.9Lane LOS A A B CApproach Delay (s) 0.4 0.3 14.6 17.9Approach LOS B C
Intersection SummaryAverage Delay 2.1Intersection Capacity Utilization 40.3% ICU Level of Service AAnalysis Period (min) 15

HCM Unsignalized Intersection Capacity Analysis Children's Hospital 21: MLK Way & RIRO Main Garage DC_Existing PM Plus Phase 1
Fehr & Peers Synchro 8 Report
Movement WBL WBR NBT NBR SBL SBTLane ConfigurationsVolume (veh/h) 0 123 1969 34 0 1686Sign Control Stop Free FreeGrade 0% 0% 0%Peak Hour Factor 1.00 1.00 1.00 1.00 1.00 1.00Hourly flow rate (vph) 0 123 1969 34 0 1686PedestriansLane Width (ft)Walking Speed (ft/s)Percent BlockageRight turn flare (veh)Median type None NoneMedian storage veh)Upstream signal (ft) 154 137pX, platoon unblocked 0.78 0.71 0.71vC, conflicting volume 2548 673 2003vC1, stage 1 conf volvC2, stage 2 conf volvCu, unblocked vol 766 0 981tC, single (s) 6.8 6.9 4.1tC, 2 stage (s)tF (s) 3.5 3.3 2.2p0 queue free % 100 84 100cM capacity (veh/h) 265 769 496
Direction, Lane # WB 1 NB 1 NB 2 NB 3 SB 1 SB 2 SB 3Volume Total 123 788 788 428 562 562 562Volume Left 0 0 0 0 0 0 0Volume Right 123 0 0 34 0 0 0cSH 769 1700 1700 1700 1700 1700 1700Volume to Capacity 0.16 0.46 0.46 0.25 0.33 0.33 0.33Queue Length 95th (ft) 14 0 0 0 0 0 0Control Delay (s) 10.6 0.0 0.0 0.0 0.0 0.0 0.0Lane LOS BApproach Delay (s) 10.6 0.0 0.0Approach LOS B
Intersection SummaryAverage Delay 0.3Intersection Capacity Utilization 53.1% ICU Level of Service AAnalysis Period (min) 15
HCM Unsignalized Intersection Capacity Analysis Children's Hospital 22: MLK Way & RIRO Main Plaza DC_Existing PM Plus Phase 1
Fehr & Peers Synchro 8 Report
Movement WBL WBR NBT NBR SBL SBTLane ConfigurationsVolume (veh/h) 0 0 1864 20 0 1755Sign Control Stop Free FreeGrade 0% 0% 0%Peak Hour Factor 1.00 1.00 1.00 1.00 1.00 1.00Hourly flow rate (vph) 0 0 1864 20 0 1755PedestriansLane Width (ft)Walking Speed (ft/s)Percent BlockageRight turn flare (veh)Median type None NoneMedian storage veh)Upstream signal (ft) 424 204pX, platoon unblocked 0.79vC, conflicting volume 2459 631 1884vC1, stage 1 conf volvC2, stage 2 conf volvCu, unblocked vol 1932 631 1884tC, single (s) 6.8 6.9 4.1tC, 2 stage (s)tF (s) 3.5 3.3 2.2p0 queue free % 100 100 100cM capacity (veh/h) 46 424 314
Direction, Lane # WB 1 NB 1 NB 2 NB 3 SB 1 SB 2 SB 3Volume Total 0 746 746 393 585 585 585Volume Left 0 0 0 0 0 0 0Volume Right 0 0 0 20 0 0 0cSH 1700 1700 1700 1700 1700 1700 1700Volume to Capacity 0.00 0.44 0.44 0.23 0.34 0.34 0.34Queue Length 95th (ft) 0 0 0 0 0 0 0Control Delay (s) 0.0 0.0 0.0 0.0 0.0 0.0 0.0Lane LOS AApproach Delay (s) 0.0 0.0 0.0Approach LOS A
Intersection SummaryAverage Delay 0.0Intersection Capacity Utilization 39.8% ICU Level of Service AAnalysis Period (min) 15

HCM Unsignalized Intersection Capacity Analysis Children's Hospital 24: 51St Street & 52nd Street DC_Existing PM Plus Phase 1
Fehr & Peers Synchro 8 Report
Intersection Sign configuration not allowed in HCM analysis.
HCM Signalized Intersection Capacity Analysis Children's Hospital1: MLK Way & 55th Street DC_Existing AM Plus Phase 2
Fehr & Peers Synchro 8 Report
Movement EBL EBT EBR WBL WBT WBR NBU NBL NBT NBR SBL SBTLane ConfigurationsVolume (vph) 13 170 219 54 217 57 14 127 1346 61 52 1250Ideal Flow (vphpl) 1900 1900 1900 1900 1900 1900 1900 1900 1900 1900 1900 1900Total Lost time (s) 5.0 5.0 4.5 5.0 4.5 5.0Lane Util. Factor 1.00 1.00 1.00 0.91 1.00 0.91Frpb, ped/bikes 0.98 1.00 1.00 1.00 1.00 1.00Flpb, ped/bikes 1.00 1.00 1.00 1.00 1.00 1.00Frt 0.93 0.98 1.00 0.99 1.00 1.00Flt Protected 1.00 0.99 0.95 1.00 0.95 1.00Satd. Flow (prot) 1707 1759 1770 5038 1770 5064Flt Permitted 0.98 0.77 0.95 1.00 0.95 1.00Satd. Flow (perm) 1683 1364 1770 5038 1770 5064Peak-hour factor, PHF 1.00 1.00 1.00 1.00 1.00 1.00 1.00 1.00 1.00 1.00 1.00 1.00Adj. Flow (vph) 13 170 219 54 217 57 14 127 1346 61 52 1250RTOR Reduction (vph) 0 56 0 0 10 0 0 0 4 0 0 2Lane Group Flow (vph) 0 346 0 0 318 0 0 141 1403 0 52 1275Confl. Peds. (#/hr) 7 14 14 7 21Confl. Bikes (#/hr) 16 15 6Heavy Vehicles (%) 1% 1% 1% 4% 4% 4% 2% 2% 2% 2% 2% 2%Turn Type Perm NA Perm NA Prot Prot NA Prot NAProtected Phases 4 8 5 5 2 1 6Permitted Phases 4 8Actuated Green, G (s) 25.9 25.9 15.3 45.1 4.5 34.3Effective Green, g (s) 25.9 25.9 15.3 45.1 4.5 34.3Actuated g/C Ratio 0.29 0.29 0.17 0.50 0.05 0.38Clearance Time (s) 5.0 5.0 4.5 5.0 4.5 5.0Vehicle Extension (s) 3.0 3.0 3.0 3.0 3.0 3.0Lane Grp Cap (vph) 484 392 300 2524 88 1929v/s Ratio Prot 0.08 c0.28 0.03 c0.25v/s Ratio Perm 0.21 c0.23v/c Ratio 0.72 0.81 0.47 0.56 0.59 0.66Uniform Delay, d1 28.7 29.8 33.7 15.5 41.8 23.0Progression Factor 1.00 1.00 0.52 0.11 1.00 1.00Incremental Delay, d2 5.0 12.0 1.1 0.8 10.2 1.8Delay (s) 33.7 41.8 18.6 2.6 52.0 24.8Level of Service C D B A D CApproach Delay (s) 33.7 41.8 4.1 25.9Approach LOS C D A C
Intersection SummaryHCM 2000 Control Delay 18.8 HCM 2000 Level of Service BHCM 2000 Volume to Capacity ratio 0.71Actuated Cycle Length (s) 90.0 Sum of lost time (s) 14.5Intersection Capacity Utilization 85.5% ICU Level of Service EAnalysis Period (min) 15c Critical Lane Group

HCM Signalized Intersection Capacity Analysis Children's Hospital1: MLK Way & 55th Street DC_Existing AM Plus Phase 2
Fehr & Peers Synchro 8 Report
Movement SBRLane ConfigurationsVolume (vph) 27Ideal Flow (vphpl) 1900Total Lost time (s)Lane Util. FactorFrpb, ped/bikesFlpb, ped/bikesFrtFlt ProtectedSatd. Flow (prot)Flt PermittedSatd. Flow (perm)Peak-hour factor, PHF 1.00Adj. Flow (vph) 27RTOR Reduction (vph) 0Lane Group Flow (vph) 0Confl. Peds. (#/hr) 12Confl. Bikes (#/hr) 7Heavy Vehicles (%) 2%Turn TypeProtected PhasesPermitted PhasesActuated Green, G (s)Effective Green, g (s)Actuated g/C RatioClearance Time (s)Vehicle Extension (s)Lane Grp Cap (vph)v/s Ratio Protv/s Ratio Permv/c RatioUniform Delay, d1Progression FactorIncremental Delay, d2Delay (s)Level of ServiceApproach Delay (s)Approach LOS
Intersection Summary
HCM Unsignalized Intersection Capacity Analysis Children's Hospital2: Dover Street & 55th Street DC_Existing AM Plus Phase 2
Fehr & Peers Synchro 8 Report
Movement EBL EBT EBR WBL WBT WBR NBL NBT NBR SBL SBT SBRLane ConfigurationsVolume (veh/h) 18 261 6 20 296 6 7 8 11 8 6 21Sign Control Free Free Stop StopGrade 0% 0% 0% 0%Peak Hour Factor 1.00 1.00 1.00 1.00 1.00 1.00 1.00 1.00 1.00 1.00 1.00 1.00Hourly flow rate (vph) 18 261 6 20 296 6 7 8 11 8 6 21Pedestrians 9 20 15 6Lane Width (ft) 12.0 12.0 12.0 12.0Walking Speed (ft/s) 4.0 4.0 4.0 4.0Percent Blockage 1 2 1 1Right turn flare (veh)Median type None NoneMedian storage veh)Upstream signal (ft) 641 677pX, platoon unblocked 0.91 0.91 0.91 0.91 0.91 0.91vC, conflicting volume 308 282 687 663 299 680 663 314vC1, stage 1 conf volvC2, stage 2 conf volvCu, unblocked vol 186 282 604 577 299 596 577 192tC, single (s) 4.1 4.1 7.1 6.5 6.2 7.1 6.5 6.2tC, 2 stage (s)tF (s) 2.2 2.2 3.5 4.0 3.3 3.5 4.0 3.3p0 queue free % 99 98 98 98 98 98 98 97cM capacity (veh/h) 1237 1253 340 372 724 343 368 758
Direction, Lane # EB 1 WB 1 NB 1 SB 1Volume Total 285 322 26 35Volume Left 18 20 7 8Volume Right 6 6 11 21cSH 1237 1253 454 520Volume to Capacity 0.01 0.02 0.06 0.07Queue Length 95th (ft) 1 1 5 5Control Delay (s) 0.6 0.6 13.4 12.4Lane LOS A A B BApproach Delay (s) 0.6 0.6 13.4 12.4Approach LOS B B
Intersection SummaryAverage Delay 1.7Intersection Capacity Utilization 36.8% ICU Level of Service AAnalysis Period (min) 15

HCM Signalized Intersection Capacity Analysis Children's Hospital3: 55th Street & Shattuck Ave DC_Existing AM Plus Phase 2
Fehr & Peers Synchro 8 Report
Movement EBL EBT EBR WBL WBT WBR NBL NBT NBR SBL SBT SBRLane ConfigurationsVolume (vph) 50 199 40 30 250 31 28 430 27 25 544 28Ideal Flow (vphpl) 1900 1900 1900 1900 1900 1900 1900 1900 1900 1900 1900 1900Total Lost time (s) 3.0 3.0 5.0 5.0Lane Util. Factor 1.00 1.00 1.00 1.00Frpb, ped/bikes 0.99 1.00 1.00 1.00Flpb, ped/bikes 1.00 1.00 1.00 1.00Frt 0.98 0.99 0.99 0.99Flt Protected 0.99 1.00 1.00 1.00Satd. Flow (prot) 1743 1802 1839 1861Flt Permitted 0.90 0.96 0.95 0.97Satd. Flow (perm) 1578 1735 1758 1813Peak-hour factor, PHF 1.00 1.00 1.00 1.00 1.00 1.00 1.00 1.00 1.00 1.00 1.00 1.00Adj. Flow (vph) 50 199 40 30 250 31 28 430 27 25 544 28RTOR Reduction (vph) 0 8 0 0 5 0 0 2 0 0 2 0Lane Group Flow (vph) 0 281 0 0 306 0 0 483 0 0 595 0Confl. Peds. (#/hr) 6 13 13 6 7 17 17 7Confl. Bikes (#/hr) 22 10 13 24Heavy Vehicles (%) 5% 5% 5% 3% 3% 3% 2% 2% 2% 1% 1% 1%Turn Type Perm NA Perm NA Perm NA Perm NAProtected Phases 2 6 4 8Permitted Phases 2 6 4 4 8Actuated Green, G (s) 25.0 25.0 47.0 47.0Effective Green, g (s) 25.0 25.0 47.0 47.0Actuated g/C Ratio 0.31 0.31 0.59 0.59Clearance Time (s) 3.0 3.0 5.0 5.0Lane Grp Cap (vph) 493 542 1032 1065v/s Ratio Protv/s Ratio Perm c0.18 0.18 0.27 c0.33v/c Ratio 0.57 0.56 0.47 0.56Uniform Delay, d1 23.0 23.0 9.4 10.1Progression Factor 1.00 1.00 1.00 1.00Incremental Delay, d2 4.7 4.2 1.5 2.1Delay (s) 27.8 27.2 10.9 12.2Level of Service C C B BApproach Delay (s) 27.8 27.2 10.9 12.2Approach LOS C C B B
Intersection SummaryHCM 2000 Control Delay 17.3 HCM 2000 Level of Service BHCM 2000 Volume to Capacity ratio 0.56Actuated Cycle Length (s) 80.0 Sum of lost time (s) 8.0Intersection Capacity Utilization 72.4% ICU Level of Service CAnalysis Period (min) 15c Critical Lane Group
HCM Signalized Intersection Capacity Analysis Children's Hospital4: 55th Street & Telegraph Ave DC_Existing AM Plus Phase 2
Fehr & Peers Synchro 8 Report
Movement EBL EBT EBR WBL WBT WBR NBL NBT NBR SBL SBT SBRLane ConfigurationsVolume (vph) 151 14 77 32 10 9 58 715 40 27 826 241Ideal Flow (vphpl) 1900 1900 1900 1900 1900 1900 1900 1900 1900 1900 1900 1900Total Lost time (s) 4.5 4.5 4.5 4.5 4.5 4.5Lane Util. Factor 1.00 1.00 1.00 0.95 1.00 0.95Frpb, ped/bikes 0.99 0.99 1.00 1.00 1.00 0.99Flpb, ped/bikes 1.00 1.00 1.00 1.00 0.99 1.00Frt 0.96 0.98 1.00 0.99 1.00 0.97Flt Protected 0.97 0.97 0.95 1.00 0.95 1.00Satd. Flow (prot) 1655 1713 1761 3497 1768 3406Flt Permitted 0.78 0.79 0.22 1.00 0.34 1.00Satd. Flow (perm) 1331 1403 415 3497 636 3406Peak-hour factor, PHF 1.00 1.00 1.00 1.00 1.00 1.00 1.00 1.00 1.00 1.00 1.00 1.00Adj. Flow (vph) 151 14 77 32 10 9 58 715 40 27 826 241RTOR Reduction (vph) 0 29 0 0 7 0 0 4 0 0 29 0Lane Group Flow (vph) 0 213 0 0 44 0 58 751 0 27 1038 0Confl. Peds. (#/hr) 6 11 11 6 13 17 17 13Confl. Bikes (#/hr) 15 15 43 27Heavy Vehicles (%) 5% 5% 5% 4% 4% 4% 2% 2% 2% 1% 1% 1%Turn Type Perm NA Perm NA Perm NA Perm NAProtected Phases 4 8 2 6Permitted Phases 4 8 2 6Actuated Green, G (s) 16.9 16.9 44.1 44.1 44.1 44.1Effective Green, g (s) 16.9 16.9 44.1 44.1 44.1 44.1Actuated g/C Ratio 0.24 0.24 0.63 0.63 0.63 0.63Clearance Time (s) 4.5 4.5 4.5 4.5 4.5 4.5Vehicle Extension (s) 3.0 3.0 3.0 3.0 3.0 3.0Lane Grp Cap (vph) 321 338 261 2203 400 2145v/s Ratio Prot 0.21 c0.30v/s Ratio Perm c0.16 0.03 0.14 0.04v/c Ratio 0.66 0.13 0.22 0.34 0.07 0.48Uniform Delay, d1 24.0 20.8 5.6 6.1 5.0 6.9Progression Factor 1.00 1.00 1.00 1.00 1.00 1.00Incremental Delay, d2 5.1 0.2 2.0 0.4 0.3 0.8Delay (s) 29.1 21.0 7.5 6.5 5.3 7.7Level of Service C C A A A AApproach Delay (s) 29.1 21.0 6.6 7.6Approach LOS C C A A
Intersection SummaryHCM 2000 Control Delay 9.9 HCM 2000 Level of Service AHCM 2000 Volume to Capacity ratio 0.53Actuated Cycle Length (s) 70.0 Sum of lost time (s) 9.0Intersection Capacity Utilization 62.9% ICU Level of Service BAnalysis Period (min) 15c Critical Lane Group

HCM Unsignalized Intersection Capacity Analysis Children's Hospital5: MLK Way & 54th Street DC_Existing AM Plus Phase 2
Fehr & Peers Synchro 8 Report
Movement EBL EBT EBR WBL WBT WBR NBU NBL NBT NBR SBL SBTLane ConfigurationsVolume (veh/h) 4 3 43 5 3 8 11 15 1522 16 5 1497Sign Control Stop Stop Free FreeGrade 0% 0% 0% 0%Peak Hour Factor 1.00 1.00 1.00 1.00 1.00 1.00 1.00 1.00 1.00 1.00 1.00 1.00Hourly flow rate (vph) 4 3 43 5 3 8 0 15 1522 16 5 1497Pedestrians 7 6 8Lane Width (ft) 12.0 12.0 12.0Walking Speed (ft/s) 4.0 4.0 4.0Percent Blockage 1 1 1Right turn flare (veh)Median type None NoneMedian storage veh)Upstream signal (ft) 299 294pX, platoon unblocked 0.88 0.88 0.80 0.88 0.88 0.84 0.00 0.80 0.84vC, conflicting volume 2064 3092 518 2128 3087 521 0 1511 1544vC1, stage 1 conf volvC2, stage 2 conf volvCu, unblocked vol 510 1684 0 582 1678 0 0 750 995tC, single (s) 7.5 6.5 6.9 7.5 6.5 6.9 0.0 4.1 4.1tC, 2 stage (s)tF (s) *5.0 *5.0 *5.0 *5.0 *5.0 *5.0 0.0 2.2 2.2p0 queue free % 99 96 92 98 96 99 0 98 99cM capacity (veh/h) 280 75 567 234 75 604 0 677 585
Direction, Lane # EB 1 WB 1 NB 1 NB 2 NB 3 SB 1 SB 2 SB 3Volume Total 50 16 396 761 396 379 748 381Volume Left 4 5 15 0 0 5 0 0Volume Right 43 8 0 0 16 0 0 7cSH 384 215 677 1700 1700 585 1700 1700Volume to Capacity 0.13 0.07 0.02 0.45 0.23 0.01 0.44 0.22Queue Length 95th (ft) 11 6 2 0 0 1 0 0Control Delay (s) 15.8 23.1 0.7 0.0 0.0 0.3 0.0 0.0Lane LOS C C A AApproach Delay (s) 15.8 23.1 0.2 0.1Approach LOS C C
Intersection SummaryAverage Delay 0.5Intersection Capacity Utilization 60.9% ICU Level of Service BAnalysis Period (min) 15
* User Entered Value
HCM Unsignalized Intersection Capacity Analysis Children's Hospital5: MLK Way & 54th Street DC_Existing AM Plus Phase 2
Fehr & Peers Synchro 8 Report
Movement SBRLane ConfigurationsVolume (veh/h) 7Sign ControlGradePeak Hour Factor 1.00Hourly flow rate (vph) 7PedestriansLane Width (ft)Walking Speed (ft/s)Percent BlockageRight turn flare (veh)Median typeMedian storage veh)Upstream signal (ft)pX, platoon unblockedvC, conflicting volumevC1, stage 1 conf volvC2, stage 2 conf volvCu, unblocked voltC, single (s)tC, 2 stage (s)tF (s)p0 queue free %cM capacity (veh/h)
Direction, Lane #

HCM Unsignalized Intersection Capacity Analysis Children's Hospital6: Dover Street & 54th Street DC_Existing AM Plus Phase 2
Fehr & Peers Synchro 8 Report
Movement EBL EBT EBR WBL WBT WBR NBL NBT NBR SBL SBT SBRLane ConfigurationsVolume (veh/h) 5 11 6 4 6 9 8 17 11 4 33 5Sign Control Stop Stop Free FreeGrade 0% 0% 0% 0%Peak Hour Factor 1.00 1.00 1.00 1.00 1.00 1.00 1.00 1.00 1.00 1.00 1.00 1.00Hourly flow rate (vph) 5 11 6 4 6 9 8 17 11 4 33 5Pedestrians 10 14 2 6Lane Width (ft) 12.0 12.0 12.0 12.0Walking Speed (ft/s) 4.0 4.0 4.0 4.0Percent Blockage 1 1 0 1Right turn flare (veh)Median type None NoneMedian storage veh)Upstream signal (ft)pX, platoon unblockedvC, conflicting volume 110 112 48 110 108 42 48 42vC1, stage 1 conf volvC2, stage 2 conf volvCu, unblocked vol 110 112 48 110 108 42 48 42tC, single (s) 7.1 6.5 6.2 7.1 6.5 6.2 4.1 4.1tC, 2 stage (s)tF (s) 3.5 4.0 3.3 3.5 4.0 3.3 2.2 2.2p0 queue free % 99 99 99 100 99 99 99 100cM capacity (veh/h) 831 761 1017 830 764 1017 1559 1562
Direction, Lane # EB 1 WB 1 NB 1 SB 1Volume Total 22 19 36 42Volume Left 5 4 8 4Volume Right 6 9 11 5cSH 834 883 1559 1562Volume to Capacity 0.03 0.02 0.01 0.00Queue Length 95th (ft) 2 2 0 0Control Delay (s) 9.4 9.2 1.7 0.7Lane LOS A A A AApproach Delay (s) 9.4 9.2 1.7 0.7Approach LOS A A
Intersection SummaryAverage Delay 4.0Intersection Capacity Utilization 19.4% ICU Level of Service AAnalysis Period (min) 15
HCM Unsignalized Intersection Capacity Analysis Children's Hospital7: Shattuck Ave & 54th Street DC_Existing AM Plus Phase 2
Fehr & Peers Synchro 8 Report
Movement EBL EBR NBL NBT SBT SBRLane ConfigurationsVolume (veh/h) 1 20 12 490 592 5Sign Control Stop Free FreeGrade 0% 0% 0%Peak Hour Factor 1.00 1.00 1.00 1.00 1.00 1.00Hourly flow rate (vph) 1 20 12 490 592 5Pedestrians 9 2 1Lane Width (ft) 12.0 12.0 12.0Walking Speed (ft/s) 4.0 4.0 4.0Percent Blockage 1 0 0Right turn flare (veh)Median type None NoneMedian storage veh)Upstream signal (ft) 550 282pX, platoon unblocked 0.81 0.81 0.81vC, conflicting volume 1118 606 606vC1, stage 1 conf volvC2, stage 2 conf volvCu, unblocked vol 1015 392 393tC, single (s) 6.4 6.2 4.1tC, 2 stage (s)tF (s) 3.5 3.3 2.2p0 queue free % 100 96 99cM capacity (veh/h) 211 529 934
Direction, Lane # EB 1 NB 1 SB 1Volume Total 21 502 597Volume Left 1 12 0Volume Right 20 0 5cSH 493 934 1700Volume to Capacity 0.04 0.01 0.35Queue Length 95th (ft) 3 1 0Control Delay (s) 12.6 0.4 0.0Lane LOS B AApproach Delay (s) 12.6 0.4 0.0Approach LOS B
Intersection SummaryAverage Delay 0.4Intersection Capacity Utilization 46.1% ICU Level of Service AAnalysis Period (min) 15

HCM Signalized Intersection Capacity Analysis Children's Hospital8: MLK Way & 53rd Street DC_Existing AM Plus Phase 2
Fehr & Peers Synchro 8 Report
Movement EBL EBT EBR WBL WBT WBR NBL NBT NBR SBL SBT SBRLane ConfigurationsVolume (vph) 4 0 38 42 4 10 21 1560 62 2 1572 5Ideal Flow (vphpl) 1900 1900 1900 1900 1900 1900 1900 1900 1900 1900 1900 1900Total Lost time (s) 5.0 5.0 4.0 3.5 4.0 3.5Lane Util. Factor 1.00 1.00 1.00 0.91 1.00 0.91Frpb, ped/bikes 0.98 1.00 1.00 1.00 1.00 1.00Flpb, ped/bikes 1.00 0.99 1.00 1.00 1.00 1.00Frt 0.88 0.98 1.00 0.99 1.00 1.00Flt Protected 1.00 0.96 0.95 1.00 0.95 1.00Satd. Flow (prot) 1596 1771 1770 5045 1787 5132Flt Permitted 0.98 0.78 0.95 1.00 0.95 1.00Satd. Flow (perm) 1571 1430 1770 5045 1787 5132Peak-hour factor, PHF 1.00 1.00 1.00 1.00 1.00 1.00 1.00 1.00 1.00 1.00 1.00 1.00Adj. Flow (vph) 4 0 38 42 4 10 21 1560 62 2 1572 5RTOR Reduction (vph) 0 34 0 0 8 0 0 3 0 0 0 0Lane Group Flow (vph) 0 8 0 0 48 0 21 1619 0 2 1577 0Confl. Peds. (#/hr) 7 13 13 7 13 20Confl. Bikes (#/hr) 5 13Heavy Vehicles (%) 2% 2% 2% 0% 0% 0% 2% 2% 2% 1% 1% 1%Turn Type Perm NA Perm NA Prot NA Prot NAProtected Phases 4 8 5 2 1 6Permitted Phases 4 8Actuated Green, G (s) 16.2 16.2 3.0 59.5 1.8 58.3Effective Green, g (s) 16.2 16.2 3.0 59.5 1.8 58.3Actuated g/C Ratio 0.18 0.18 0.03 0.66 0.02 0.65Clearance Time (s) 5.0 5.0 4.0 3.5 4.0 3.5Vehicle Extension (s) 3.0 3.0 3.0 3.0 3.0 3.0Lane Grp Cap (vph) 282 257 59 3335 35 3324v/s Ratio Prot 0.01 c0.32 0.00 c0.31v/s Ratio Perm 0.00 c0.03v/c Ratio 0.03 0.19 0.36 0.49 0.06 0.47Uniform Delay, d1 30.4 31.3 42.6 7.6 43.3 8.1Progression Factor 1.00 1.01 1.17 0.50 0.50 0.22Incremental Delay, d2 0.0 0.4 2.9 0.4 0.6 0.4Delay (s) 30.4 32.1 52.9 4.2 22.4 2.2Level of Service C C D A C AApproach Delay (s) 30.4 32.1 4.8 2.2Approach LOS C C A A
Intersection SummaryHCM 2000 Control Delay 4.4 HCM 2000 Level of Service AHCM 2000 Volume to Capacity ratio 0.44Actuated Cycle Length (s) 90.0 Sum of lost time (s) 12.5Intersection Capacity Utilization 53.9% ICU Level of Service AAnalysis Period (min) 15c Critical Lane Group
HCM Unsignalized Intersection Capacity Analysis Children's Hospital9: Dover Street & 53rd Street DC_Existing AM Plus Phase 2
Fehr & Peers Synchro 8 Report
Movement EBL EBT EBR WBL WBT WBR NBL NBT NBR SBL SBT SBRLane ConfigurationsVolume (veh/h) 32 13 0 0 6 6 0 0 0 2 0 44Sign Control Stop Stop Free FreeGrade 0% 0% 0% 0%Peak Hour Factor 1.00 1.00 1.00 1.00 1.00 1.00 1.00 1.00 1.00 1.00 1.00 1.00Hourly flow rate (vph) 32 13 0 0 6 6 0 0 0 2 0 44Pedestrians 22 21 2 2Lane Width (ft) 12.0 12.0 12.0 12.0Walking Speed (ft/s) 4.0 4.0 4.0 4.0Percent Blockage 2 2 0 0Right turn flare (veh)Median type None NoneMedian storage veh)Upstream signal (ft)pX, platoon unblockedvC, conflicting volume 59 69 46 56 91 23 66 21vC1, stage 1 conf volvC2, stage 2 conf volvCu, unblocked vol 59 69 46 56 91 23 66 21tC, single (s) 7.1 6.5 6.2 7.1 6.5 6.2 4.1 4.1tC, 2 stage (s)tF (s) 3.5 4.0 3.3 3.5 4.0 3.3 2.2 2.2p0 queue free % 96 98 100 100 99 99 100 100cM capacity (veh/h) 887 795 1009 892 773 1039 1520 1580
Direction, Lane # EB 1 WB 1 NB 1 SB 1Volume Total 45 12 0 46Volume Left 32 0 0 2Volume Right 0 6 0 44cSH 858 887 1700 1580Volume to Capacity 0.05 0.01 0.00 0.00Queue Length 95th (ft) 4 1 0 0Control Delay (s) 9.4 9.1 0.0 0.3Lane LOS A A AApproach Delay (s) 9.4 9.1 0.0 0.3Approach LOS A A
Intersection SummaryAverage Delay 5.3Intersection Capacity Utilization 25.3% ICU Level of Service AAnalysis Period (min) 15

HCM Signalized Intersection Capacity Analysis Children's Hospital10: MLK Way & 52nd Street DC_Existing AM Plus Phase 2
Fehr & Peers Synchro 8 Report
Movement EBL EBT EBR WBL WBT WBR NBU NBL NBT NBR SBU SBLLane ConfigurationsVolume (vph) 45 73 100 75 76 253 50 56 1493 90 28 125Ideal Flow (vphpl) 1900 1900 1900 1900 1900 1900 1900 1900 1900 1900 1900 1900Total Lost time (s) 5.0 5.0 5.0 5.0 4.5 4.5 4.0Lane Util. Factor 1.00 1.00 1.00 1.00 1.00 0.91 1.00Frpb, ped/bikes 1.00 0.97 1.00 0.98 1.00 1.00 1.00Flpb, ped/bikes 0.99 1.00 0.98 1.00 1.00 1.00 1.00Frt 1.00 0.91 1.00 0.85 1.00 0.99 1.00Flt Protected 0.95 1.00 0.98 1.00 0.95 1.00 0.95Satd. Flow (prot) 1775 1660 1788 1544 1787 5081 1787Flt Permitted 0.63 1.00 0.74 1.00 0.95 1.00 0.95Satd. Flow (perm) 1169 1660 1351 1544 1787 5081 1787Peak-hour factor, PHF 1.00 1.00 1.00 1.00 1.00 1.00 1.00 1.00 1.00 1.00 1.00 1.00Adj. Flow (vph) 45 73 100 75 76 253 50 56 1493 90 28 125RTOR Reduction (vph) 0 63 0 0 0 190 0 0 6 0 0 0Lane Group Flow (vph) 45 110 0 0 151 63 0 106 1577 0 0 153Confl. Peds. (#/hr) 10 49 49 10 7Confl. Bikes (#/hr) 6 5 1Heavy Vehicles (%) 1% 1% 1% 2% 2% 2% 1% 1% 1% 1% 1% 1%Turn Type Perm NA Perm NA Perm Prot Prot NA Prot ProtProtected Phases 4 8 5 5 2 1 1Permitted Phases 4 8 8Actuated Green, G (s) 22.4 22.4 22.4 22.4 7.2 41.6 12.5Effective Green, g (s) 22.4 22.4 22.4 22.4 7.2 41.6 12.5Actuated g/C Ratio 0.25 0.25 0.25 0.25 0.08 0.46 0.14Clearance Time (s) 5.0 5.0 5.0 5.0 4.5 4.5 4.0Vehicle Extension (s) 2.0 2.0 2.0 2.0 2.0 2.0 2.0Lane Grp Cap (vph) 290 413 336 384 142 2348 248v/s Ratio Prot 0.07 0.06 c0.31 0.09v/s Ratio Perm 0.04 c0.11 0.04v/c Ratio 0.16 0.27 0.45 0.16 0.75 0.67 0.62Uniform Delay, d1 26.4 27.2 28.6 26.5 40.5 18.9 36.5Progression Factor 1.00 1.00 1.00 1.00 0.99 1.06 0.78Incremental Delay, d2 0.1 0.1 0.3 0.1 8.1 0.7 2.9Delay (s) 26.5 27.3 28.9 26.5 48.4 20.7 31.4Level of Service C C C C D C CApproach Delay (s) 27.1 27.4 22.4Approach LOS C C C
Intersection SummaryHCM 2000 Control Delay 19.7 HCM 2000 Level of Service BHCM 2000 Volume to Capacity ratio 0.61Actuated Cycle Length (s) 90.0 Sum of lost time (s) 14.0Intersection Capacity Utilization 97.3% ICU Level of Service FAnalysis Period (min) 15c Critical Lane Group
HCM Signalized Intersection Capacity Analysis Children's Hospital10: MLK Way & 52nd Street DC_Existing AM Plus Phase 2
Fehr & Peers Synchro 8 Report
Movement SBT SBRLane ConfigurationsVolume (vph) 1483 6Ideal Flow (vphpl) 1900 1900Total Lost time (s) 4.5Lane Util. Factor 0.91Frpb, ped/bikes 1.00Flpb, ped/bikes 1.00Frt 1.00Flt Protected 1.00Satd. Flow (prot) 5131Flt Permitted 1.00Satd. Flow (perm) 5131Peak-hour factor, PHF 1.00 1.00Adj. Flow (vph) 1483 6RTOR Reduction (vph) 0 0Lane Group Flow (vph) 1489 0Confl. Peds. (#/hr) 10Confl. Bikes (#/hr) 10Heavy Vehicles (%) 1% 1%Turn Type NAProtected Phases 6Permitted PhasesActuated Green, G (s) 46.4Effective Green, g (s) 46.4Actuated g/C Ratio 0.52Clearance Time (s) 4.5Vehicle Extension (s) 2.0Lane Grp Cap (vph) 2645v/s Ratio Prot c0.29v/s Ratio Permv/c Ratio 0.56Uniform Delay, d1 14.9Progression Factor 0.76Incremental Delay, d2 0.8Delay (s) 12.1Level of Service BApproach Delay (s) 13.9Approach LOS B
Intersection Summary

HCM Signalized Intersection Capacity Analysis Children's Hospital11: 52nd Street & Garage DC_Existing AM Plus Phase 2
Fehr & Peers Synchro 8 Report
Movement EBL EBT EBR WBL WBT WBR NBL NBT NBR SBL SBT SBRLane ConfigurationsVolume (vph) 4 283 5 2 384 2 7 3 5 0 2 15Ideal Flow (vphpl) 1900 1900 1900 1900 1900 1900 1900 1900 1900 1900 1900 1900Total Lost time (s) 3.0 3.0 3.0 3.0Lane Util. Factor 1.00 1.00 1.00 1.00Frpb, ped/bikes 1.00 1.00 0.95 0.99Flpb, ped/bikes 1.00 1.00 1.00 1.00Frt 1.00 1.00 0.95 0.88Flt Protected 1.00 1.00 0.98 1.00Satd. Flow (prot) 1853 1897 1457 1655Flt Permitted 1.00 1.00 0.95 1.00Satd. Flow (perm) 1847 1896 1418 1655Peak-hour factor, PHF 1.00 1.00 1.00 1.00 1.00 1.00 1.00 1.00 1.00 1.00 1.00 1.00Adj. Flow (vph) 4 283 5 2 384 2 7 3 5 0 2 15RTOR Reduction (vph) 0 1 0 0 1 0 0 3 0 0 8 0Lane Group Flow (vph) 0 291 0 0 387 0 0 12 0 0 9 0Confl. Peds. (#/hr) 17 55 55 17 202 202Confl. Bikes (#/hr) 6 5 1Heavy Vehicles (%) 2% 2% 2% 0% 0% 0% 16% 16% 16% 0% 0% 0%Turn Type Perm NA Perm NA Perm NA NAProtected Phases 2 6 4 8Permitted Phases 2 6 4 8Actuated Green, G (s) 21.0 21.0 23.0 23.0Effective Green, g (s) 21.0 21.0 23.0 23.0Actuated g/C Ratio 0.42 0.42 0.46 0.46Clearance Time (s) 3.0 3.0 3.0 3.0Lane Grp Cap (vph) 775 796 652 761v/s Ratio Prot 0.01v/s Ratio Perm 0.16 c0.20 c0.01v/c Ratio 0.38 0.49 0.02 0.01Uniform Delay, d1 10.0 10.6 7.4 7.3Progression Factor 1.00 1.00 1.00 1.00Incremental Delay, d2 1.4 2.1 0.1 0.0Delay (s) 11.4 12.7 7.4 7.4Level of Service B B A AApproach Delay (s) 11.4 12.7 7.4 7.4Approach LOS B B A A
Intersection SummaryHCM 2000 Control Delay 11.9 HCM 2000 Level of Service BHCM 2000 Volume to Capacity ratio 0.24Actuated Cycle Length (s) 50.0 Sum of lost time (s) 6.0Intersection Capacity Utilization 47.3% ICU Level of Service AAnalysis Period (min) 15c Critical Lane Group
HCM Unsignalized Intersection Capacity Analysis Children's Hospital12: 52nd Street & Dover Street DC_Existing AM Plus Phase 2
Fehr & Peers Synchro 8 Report
Movement EBL EBT EBR WBL WBT WBR NBL NBT NBR SBL SBT SBRLane ConfigurationsVolume (veh/h) 12 206 75 45 348 5 36 0 28 2 0 6Sign Control Free Free Stop StopGrade 0% 0% 0% 0%Peak Hour Factor 1.00 1.00 1.00 1.00 1.00 1.00 1.00 1.00 1.00 1.00 1.00 1.00Hourly flow rate (vph) 12 206 75 45 348 5 36 0 28 2 0 6Pedestrians 20 10 12 23Lane Width (ft) 12.0 12.0 12.0 12.0Walking Speed (ft/s) 4.0 4.0 4.0 4.0Percent Blockage 2 1 1 2Right turn flare (veh)Median type None NoneMedian storage veh)Upstream signal (ft) 312 647pX, platoon unblocked 0.88 0.90 0.93 0.93 0.90 0.93 0.93 0.88vC, conflicting volume 376 293 746 746 266 769 780 394vC1, stage 1 conf volvC2, stage 2 conf volvCu, unblocked vol 227 162 455 455 132 480 492 247tC, single (s) 4.1 4.1 7.2 6.6 6.3 7.1 6.5 6.2tC, 2 stage (s)tF (s) 2.2 2.2 3.6 4.1 3.4 3.5 4.0 3.3p0 queue free % 99 96 92 100 96 100 100 99cM capacity (veh/h) 1156 1271 426 423 794 412 415 678
Direction, Lane # EB 1 WB 1 NB 1 SB 1Volume Total 293 398 64 8Volume Left 12 45 36 2Volume Right 75 5 28 6cSH 1156 1271 534 584Volume to Capacity 0.01 0.04 0.12 0.01Queue Length 95th (ft) 1 3 10 1Control Delay (s) 0.4 1.2 12.7 11.2Lane LOS A A B BApproach Delay (s) 0.4 1.2 12.7 11.2Approach LOS B B
Intersection SummaryAverage Delay 2.0Intersection Capacity Utilization 52.8% ICU Level of Service AAnalysis Period (min) 15
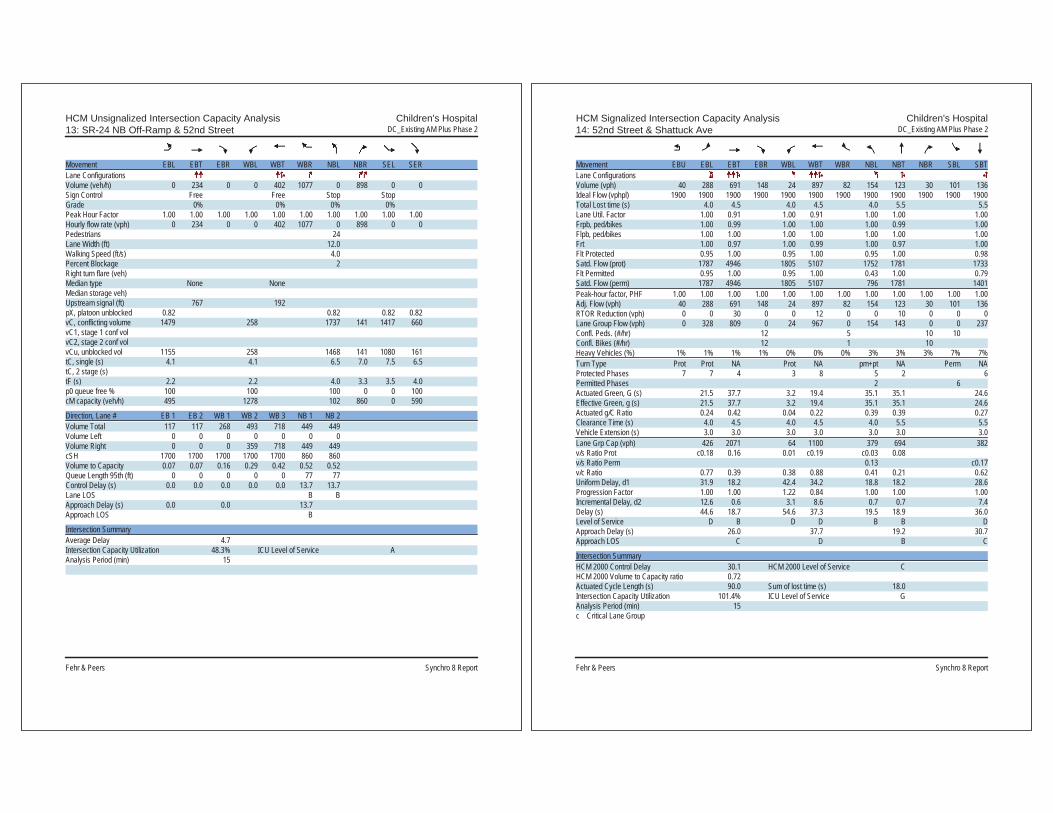
HCM Unsignalized Intersection Capacity Analysis Children's Hospital13: SR-24 NB Off-Ramp & 52nd Street DC_Existing AM Plus Phase 2
Fehr & Peers Synchro 8 Report
Movement EBL EBT EBR WBL WBT WBR NBL NBR SEL SERLane ConfigurationsVolume (veh/h) 0 234 0 0 402 1077 0 898 0 0Sign Control Free Free Stop StopGrade 0% 0% 0% 0%Peak Hour Factor 1.00 1.00 1.00 1.00 1.00 1.00 1.00 1.00 1.00 1.00Hourly flow rate (vph) 0 234 0 0 402 1077 0 898 0 0Pedestrians 24Lane Width (ft) 12.0Walking Speed (ft/s) 4.0Percent Blockage 2Right turn flare (veh)Median type None NoneMedian storage veh)Upstream signal (ft) 767 192pX, platoon unblocked 0.82 0.82 0.82 0.82vC, conflicting volume 1479 258 1737 141 1417 660vC1, stage 1 conf volvC2, stage 2 conf volvCu, unblocked vol 1155 258 1468 141 1080 161tC, single (s) 4.1 4.1 6.5 7.0 7.5 6.5tC, 2 stage (s)tF (s) 2.2 2.2 4.0 3.3 3.5 4.0p0 queue free % 100 100 100 0 0 100cM capacity (veh/h) 495 1278 102 860 0 590
Direction, Lane # EB 1 EB 2 WB 1 WB 2 WB 3 NB 1 NB 2Volume Total 117 117 268 493 718 449 449Volume Left 0 0 0 0 0 0 0Volume Right 0 0 0 359 718 449 449cSH 1700 1700 1700 1700 1700 860 860Volume to Capacity 0.07 0.07 0.16 0.29 0.42 0.52 0.52Queue Length 95th (ft) 0 0 0 0 0 77 77Control Delay (s) 0.0 0.0 0.0 0.0 0.0 13.7 13.7Lane LOS B BApproach Delay (s) 0.0 0.0 13.7Approach LOS B
Intersection SummaryAverage Delay 4.7Intersection Capacity Utilization 48.3% ICU Level of Service AAnalysis Period (min) 15
HCM Signalized Intersection Capacity Analysis Children's Hospital14: 52nd Street & Shattuck Ave DC_Existing AM Plus Phase 2
Fehr & Peers Synchro 8 Report
Movement EBU EBL EBT EBR WBL WBT WBR NBL NBT NBR SBL SBTLane ConfigurationsVolume (vph) 40 288 691 148 24 897 82 154 123 30 101 136Ideal Flow (vphpl) 1900 1900 1900 1900 1900 1900 1900 1900 1900 1900 1900 1900Total Lost time (s) 4.0 4.5 4.0 4.5 4.0 5.5 5.5Lane Util. Factor 1.00 0.91 1.00 0.91 1.00 1.00 1.00Frpb, ped/bikes 1.00 0.99 1.00 1.00 1.00 0.99 1.00Flpb, ped/bikes 1.00 1.00 1.00 1.00 1.00 1.00 1.00Frt 1.00 0.97 1.00 0.99 1.00 0.97 1.00Flt Protected 0.95 1.00 0.95 1.00 0.95 1.00 0.98Satd. Flow (prot) 1787 4946 1805 5107 1752 1781 1733Flt Permitted 0.95 1.00 0.95 1.00 0.43 1.00 0.79Satd. Flow (perm) 1787 4946 1805 5107 796 1781 1401Peak-hour factor, PHF 1.00 1.00 1.00 1.00 1.00 1.00 1.00 1.00 1.00 1.00 1.00 1.00Adj. Flow (vph) 40 288 691 148 24 897 82 154 123 30 101 136RTOR Reduction (vph) 0 0 30 0 0 12 0 0 10 0 0 0Lane Group Flow (vph) 0 328 809 0 24 967 0 154 143 0 0 237Confl. Peds. (#/hr) 12 5 10 10Confl. Bikes (#/hr) 12 1 10Heavy Vehicles (%) 1% 1% 1% 1% 0% 0% 0% 3% 3% 3% 7% 7%Turn Type Prot Prot NA Prot NA pm+pt NA Perm NAProtected Phases 7 7 4 3 8 5 2 6Permitted Phases 2 6Actuated Green, G (s) 21.5 37.7 3.2 19.4 35.1 35.1 24.6Effective Green, g (s) 21.5 37.7 3.2 19.4 35.1 35.1 24.6Actuated g/C Ratio 0.24 0.42 0.04 0.22 0.39 0.39 0.27Clearance Time (s) 4.0 4.5 4.0 4.5 4.0 5.5 5.5Vehicle Extension (s) 3.0 3.0 3.0 3.0 3.0 3.0 3.0Lane Grp Cap (vph) 426 2071 64 1100 379 694 382v/s Ratio Prot c0.18 0.16 0.01 c0.19 c0.03 0.08v/s Ratio Perm 0.13 c0.17v/c Ratio 0.77 0.39 0.38 0.88 0.41 0.21 0.62Uniform Delay, d1 31.9 18.2 42.4 34.2 18.8 18.2 28.6Progression Factor 1.00 1.00 1.22 0.84 1.00 1.00 1.00Incremental Delay, d2 12.6 0.6 3.1 8.6 0.7 0.7 7.4Delay (s) 44.6 18.7 54.6 37.3 19.5 18.9 36.0Level of Service D B D D B B DApproach Delay (s) 26.0 37.7 19.2 30.7Approach LOS C D B C
Intersection SummaryHCM 2000 Control Delay 30.1 HCM 2000 Level of Service CHCM 2000 Volume to Capacity ratio 0.72Actuated Cycle Length (s) 90.0 Sum of lost time (s) 18.0Intersection Capacity Utilization 101.4% ICU Level of Service GAnalysis Period (min) 15c Critical Lane Group
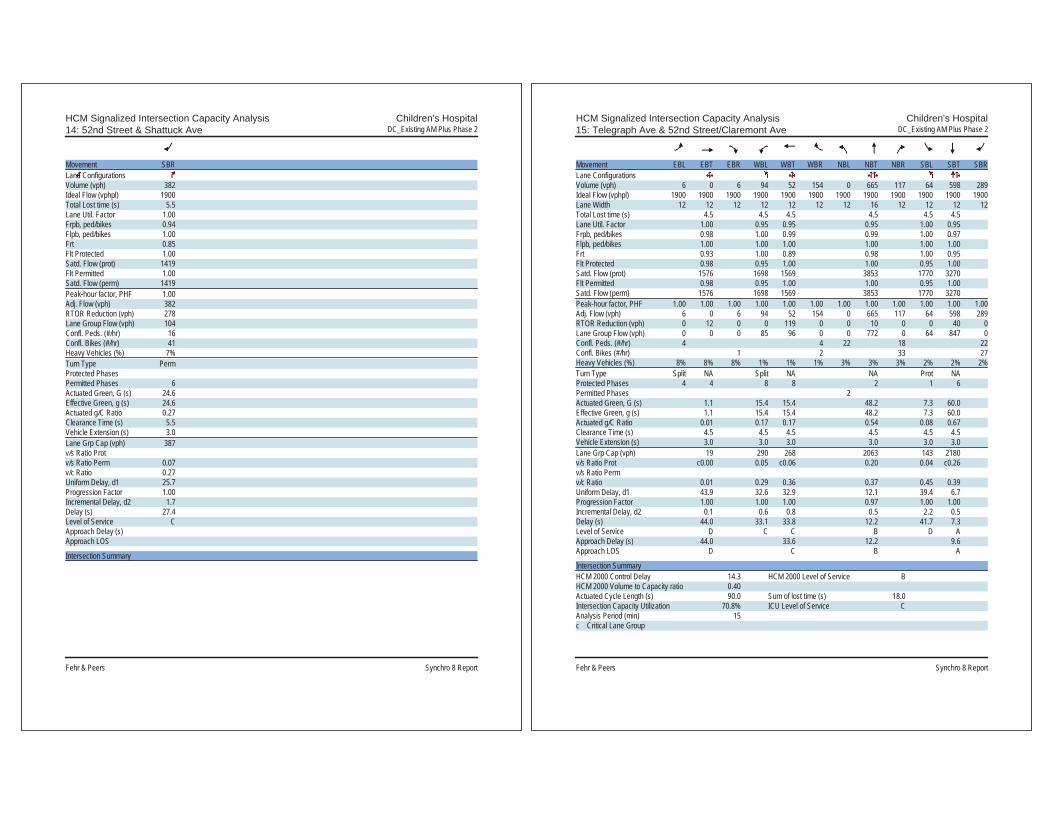
HCM Signalized Intersection Capacity Analysis Children's Hospital14: 52nd Street & Shattuck Ave DC_Existing AM Plus Phase 2
Fehr & Peers Synchro 8 Report
Movement SBRLane ConfigurationsVolume (vph) 382Ideal Flow (vphpl) 1900Total Lost time (s) 5.5Lane Util. Factor 1.00Frpb, ped/bikes 0.94Flpb, ped/bikes 1.00Frt 0.85Flt Protected 1.00Satd. Flow (prot) 1419Flt Permitted 1.00Satd. Flow (perm) 1419Peak-hour factor, PHF 1.00Adj. Flow (vph) 382RTOR Reduction (vph) 278Lane Group Flow (vph) 104Confl. Peds. (#/hr) 16Confl. Bikes (#/hr) 41Heavy Vehicles (%) 7%Turn Type PermProtected PhasesPermitted Phases 6Actuated Green, G (s) 24.6Effective Green, g (s) 24.6Actuated g/C Ratio 0.27Clearance Time (s) 5.5Vehicle Extension (s) 3.0Lane Grp Cap (vph) 387v/s Ratio Protv/s Ratio Perm 0.07v/c Ratio 0.27Uniform Delay, d1 25.7Progression Factor 1.00Incremental Delay, d2 1.7Delay (s) 27.4Level of Service CApproach Delay (s)Approach LOS
Intersection Summary
HCM Signalized Intersection Capacity Analysis Children's Hospital15: Telegraph Ave & 52nd Street/Claremont Ave DC_Existing AM Plus Phase 2
Fehr & Peers Synchro 8 Report
Movement EBL EBT EBR WBL WBT WBR NBL NBT NBR SBL SBT SBRLane ConfigurationsVolume (vph) 6 0 6 94 52 154 0 665 117 64 598 289Ideal Flow (vphpl) 1900 1900 1900 1900 1900 1900 1900 1900 1900 1900 1900 1900Lane Width 12 12 12 12 12 12 12 16 12 12 12 12Total Lost time (s) 4.5 4.5 4.5 4.5 4.5 4.5Lane Util. Factor 1.00 0.95 0.95 0.95 1.00 0.95Frpb, ped/bikes 0.98 1.00 0.99 0.99 1.00 0.97Flpb, ped/bikes 1.00 1.00 1.00 1.00 1.00 1.00Frt 0.93 1.00 0.89 0.98 1.00 0.95Flt Protected 0.98 0.95 1.00 1.00 0.95 1.00Satd. Flow (prot) 1576 1698 1569 3853 1770 3270Flt Permitted 0.98 0.95 1.00 1.00 0.95 1.00Satd. Flow (perm) 1576 1698 1569 3853 1770 3270Peak-hour factor, PHF 1.00 1.00 1.00 1.00 1.00 1.00 1.00 1.00 1.00 1.00 1.00 1.00Adj. Flow (vph) 6 0 6 94 52 154 0 665 117 64 598 289RTOR Reduction (vph) 0 12 0 0 119 0 0 10 0 0 40 0Lane Group Flow (vph) 0 0 0 85 96 0 0 772 0 64 847 0Confl. Peds. (#/hr) 4 4 22 18 22Confl. Bikes (#/hr) 1 2 33 27Heavy Vehicles (%) 8% 8% 8% 1% 1% 1% 3% 3% 3% 2% 2% 2%Turn Type Split NA Split NA NA Prot NAProtected Phases 4 4 8 8 2 1 6Permitted Phases 2Actuated Green, G (s) 1.1 15.4 15.4 48.2 7.3 60.0Effective Green, g (s) 1.1 15.4 15.4 48.2 7.3 60.0Actuated g/C Ratio 0.01 0.17 0.17 0.54 0.08 0.67Clearance Time (s) 4.5 4.5 4.5 4.5 4.5 4.5Vehicle Extension (s) 3.0 3.0 3.0 3.0 3.0 3.0Lane Grp Cap (vph) 19 290 268 2063 143 2180v/s Ratio Prot c0.00 0.05 c0.06 0.20 0.04 c0.26v/s Ratio Permv/c Ratio 0.01 0.29 0.36 0.37 0.45 0.39Uniform Delay, d1 43.9 32.6 32.9 12.1 39.4 6.7Progression Factor 1.00 1.00 1.00 0.97 1.00 1.00Incremental Delay, d2 0.1 0.6 0.8 0.5 2.2 0.5Delay (s) 44.0 33.1 33.8 12.2 41.7 7.3Level of Service D C C B D AApproach Delay (s) 44.0 33.6 12.2 9.6Approach LOS D C B A
Intersection SummaryHCM 2000 Control Delay 14.3 HCM 2000 Level of Service BHCM 2000 Volume to Capacity ratio 0.40Actuated Cycle Length (s) 90.0 Sum of lost time (s) 18.0Intersection Capacity Utilization 70.8% ICU Level of Service CAnalysis Period (min) 15c Critical Lane Group

HCM Signalized Intersection Capacity Analysis Children's Hospital16: Telegraph Ave & 51St Street DC_Existing AM Plus Phase 2
Fehr & Peers Synchro 8 Report
Movement EBL EBT EBR WBL WBT WBR NBL NBT NBR SBL SBT SBRLane ConfigurationsVolume (vph) 228 490 71 101 534 238 97 320 58 147 511 38Ideal Flow (vphpl) 1900 1900 1900 1900 1900 1900 1900 1900 1900 1900 1900 1900Total Lost time (s) 4.0 4.0 4.0 3.5 4.0 4.5 4.0 3.5Lane Util. Factor 0.97 0.95 1.00 0.95 1.00 0.95 1.00 0.95Frpb, ped/bikes 1.00 0.99 1.00 0.98 1.00 0.99 1.00 0.99Flpb, ped/bikes 1.00 1.00 1.00 1.00 1.00 1.00 1.00 1.00Frt 1.00 0.98 1.00 0.95 1.00 0.98 1.00 0.99Flt Protected 0.95 1.00 0.95 1.00 0.95 1.00 0.95 1.00Satd. Flow (prot) 3400 3414 1787 3350 1719 3324 1752 3447Flt Permitted 0.95 1.00 0.95 1.00 0.95 1.00 0.95 1.00Satd. Flow (perm) 3400 3414 1787 3350 1719 3324 1752 3447Peak-hour factor, PHF 1.00 1.00 1.00 1.00 1.00 1.00 1.00 1.00 1.00 1.00 1.00 1.00Adj. Flow (vph) 228 490 71 101 534 238 97 320 58 147 511 38RTOR Reduction (vph) 0 12 0 0 55 0 0 16 0 0 5 0Lane Group Flow (vph) 228 549 0 101 717 0 97 362 0 147 544 0Confl. Peds. (#/hr) 31 31 30 37Confl. Bikes (#/hr) 9 7 27 27Heavy Vehicles (%) 3% 3% 3% 1% 1% 1% 5% 5% 5% 3% 3% 3%Turn Type Prot NA Prot NA Prot NA Prot NAProtected Phases 7 4 3 8 5 2 1 6Permitted PhasesActuated Green, G (s) 11.2 29.0 8.6 26.9 8.6 24.9 11.0 28.3Effective Green, g (s) 11.2 29.0 8.6 26.9 8.6 24.9 11.0 28.3Actuated g/C Ratio 0.12 0.32 0.10 0.30 0.10 0.28 0.12 0.31Clearance Time (s) 4.0 4.0 4.0 3.5 4.0 4.5 4.0 3.5Vehicle Extension (s) 3.0 3.0 3.0 3.0 3.0 3.0 3.0 3.0Lane Grp Cap (vph) 423 1100 170 1001 164 919 214 1083v/s Ratio Prot c0.07 c0.16 0.06 c0.21 0.06 0.11 c0.08 c0.16v/s Ratio Permv/c Ratio 0.54 0.50 0.59 0.72 0.59 0.39 0.69 0.50Uniform Delay, d1 37.0 24.6 39.0 28.1 39.0 26.4 37.8 25.1Progression Factor 1.29 0.79 1.00 1.00 1.00 1.00 1.01 0.86Incremental Delay, d2 1.2 1.5 5.5 4.4 5.6 1.3 8.4 1.6Delay (s) 48.8 21.0 44.5 32.5 44.6 27.7 46.6 23.3Level of Service D C D C D C D CApproach Delay (s) 29.0 33.9 31.2 28.2Approach LOS C C C C
Intersection SummaryHCM 2000 Control Delay 30.7 HCM 2000 Level of Service CHCM 2000 Volume to Capacity ratio 0.62Actuated Cycle Length (s) 90.0 Sum of lost time (s) 16.5Intersection Capacity Utilization 70.0% ICU Level of Service CAnalysis Period (min) 15c Critical Lane Group
HCM Signalized Intersection Capacity Analysis Children's Hospital17: SB SR-24 On-Ramp & MLK Way & NB SR-24 Off-Ramp DC_Existing AM Plus Phase 2
Fehr & Peers Synchro 8 Report
Movement EBL EBT EBR WBL WBT WBR NBL NBT NBR SBL SBT SBRLane ConfigurationsVolume (vph) 151 0 0 0 0 1535 0 0 0 0 1434 235Ideal Flow (vphpl) 1900 1900 1900 1900 1900 1900 1900 1900 1900 1900 1900 1900Total Lost time (s) 4.0 4.0 4.0 4.0Lane Util. Factor 0.97 1.00 0.95 0.88Frpb, ped/bikes 1.00 1.00 1.00 1.00Flpb, ped/bikes 1.00 1.00 1.00 1.00Frt 1.00 0.86 1.00 0.85Flt Protected 0.95 1.00 1.00 1.00Satd. Flow (prot) 3273 1627 3574 2814Flt Permitted 0.95 1.00 1.00 1.00Satd. Flow (perm) 3273 1627 3574 2814Peak-hour factor, PHF 1.00 1.00 1.00 1.00 1.00 1.00 1.00 1.00 1.00 1.00 1.00 1.00Adj. Flow (vph) 151 0 0 0 0 1535 0 0 0 0 1434 235RTOR Reduction (vph) 0 0 0 0 0 0 0 0 0 0 0 0Lane Group Flow (vph) 151 0 0 0 0 1535 0 0 0 0 1434 235Confl. Bikes (#/hr) 2Heavy Vehicles (%) 7% 7% 2% 2% 1% 1% 2% 2% 2% 2% 1% 1%Turn Type Prot Free NA customProtected Phases 2 6 FreePermitted Phases FreeActuated Green, G (s) 8.0 45.0 29.0 45.0Effective Green, g (s) 8.0 45.0 29.0 45.0Actuated g/C Ratio 0.18 1.00 0.64 1.00Clearance Time (s) 4.0 4.0Lane Grp Cap (vph) 581 1627 2303 2814v/s Ratio Prot 0.05 0.40 0.08v/s Ratio Perm c0.94v/c Ratio 0.26 0.94 0.62 0.08Uniform Delay, d1 15.9 0.0 4.8 0.0Progression Factor 1.00 1.00 1.76 1.00Incremental Delay, d2 1.1 12.4 1.1 0.0Delay (s) 17.0 12.4 9.5 0.0Level of Service B B A AApproach Delay (s) 17.0 12.4 0.0 8.1Approach LOS B B A A
Intersection SummaryHCM 2000 Control Delay 10.5 HCM 2000 Level of Service BHCM 2000 Volume to Capacity ratio 1.15Actuated Cycle Length (s) 45.0 Sum of lost time (s) 8.0Intersection Capacity Utilization 50.6% ICU Level of Service AAnalysis Period (min) 15c Critical Lane Group

HCM Unsignalized Intersection Capacity Analysis Children's Hospital18: West Street & 52nd Street DC_Existing AM Plus Phase 2
Fehr & Peers Synchro 8 Report
Movement EBL EBT EBR WBL WBT WBR NBL NBT NBR SBL SBT SBRLane ConfigurationsSign Control Stop Stop Stop StopVolume (vph) 0 162 10 57 74 0 22 0 71 2 43 5Peak Hour Factor 1.00 1.00 1.00 1.00 1.00 1.00 1.00 1.00 1.00 1.00 1.00 1.00Hourly flow rate (vph) 0 162 10 57 74 0 22 0 71 2 43 5
Direction, Lane # EB 1 WB 1 NB 1 NB 2 SB 1Volume Total (vph) 172 131 22 71 50Volume Left (vph) 0 57 22 0 2Volume Right (vph) 10 0 0 71 5Hadj (s) -0.02 0.12 0.50 -0.70 -0.02Departure Headway (s) 4.4 4.6 5.8 4.6 4.8Degree Utilization, x 0.21 0.17 0.04 0.09 0.07Capacity (veh/h) 792 751 589 736 691Control Delay (s) 8.5 8.5 7.8 6.8 8.2Approach Delay (s) 8.5 8.5 7.0 8.2Approach LOS A A A A
Intersection SummaryDelay 8.2Level of Service AIntersection Capacity Utilization 36.4% ICU Level of Service AAnalysis Period (min) 15
HCM Unsignalized Intersection Capacity Analysis Children's Hospital19: Genoa Street & 52nd Street DC_Existing AM Plus Phase 2
Fehr & Peers Synchro 8 Report
Movement EBL EBT EBR WBL WBT WBR NBL NBT NBR SBL SBT SBRLane ConfigurationsSign Control Stop Stop Stop StopVolume (vph) 5 147 1 4 79 20 1 0 3 15 0 3Peak Hour Factor 1.00 1.00 1.00 1.00 1.00 1.00 1.00 1.00 1.00 1.00 1.00 1.00Hourly flow rate (vph) 5 147 1 4 79 20 1 0 3 15 0 3
Direction, Lane # EB 1 WB 1 NB 1 SB 1Volume Total (vph) 153 103 4 18Volume Left (vph) 5 4 1 15Volume Right (vph) 1 20 3 3Hadj (s) 0.02 -0.11 -0.40 0.07Departure Headway (s) 4.1 4.0 4.1 4.5Degree Utilization, x 0.17 0.11 0.00 0.02Capacity (veh/h) 872 888 824 742Control Delay (s) 7.9 7.5 7.1 7.6Approach Delay (s) 7.9 7.5 7.1 7.6Approach LOS A A A A
Intersection SummaryDelay 7.7Level of Service AIntersection Capacity Utilization 21.6% ICU Level of Service AAnalysis Period (min) 15

HCM Unsignalized Intersection Capacity Analysis Children's Hospital20: Genoa Street & 55th Street DC_Existing AM Plus Phase 2
Fehr & Peers Synchro 8 Report
Movement EBL EBT EBR WBL WBT WBR NBL NBT NBR SBL SBT SBRLane ConfigurationsVolume (veh/h) 2 354 0 4 312 10 6 11 14 32 12 8Sign Control Free Free Stop StopGrade 0% 0% 0% 0%Peak Hour Factor 1.00 1.00 1.00 1.00 1.00 1.00 1.00 1.00 1.00 1.00 1.00 1.00Hourly flow rate (vph) 2 354 0 4 312 10 6 11 14 32 12 8Pedestrians 8 2 10 11Lane Width (ft) 12.0 12.0 12.0 12.0Walking Speed (ft/s) 4.0 4.0 4.0 4.0Percent Blockage 1 0 1 1Right turn flare (veh)Median type None NoneMedian storage veh)Upstream signal (ft) 721pX, platoon unblockedvC, conflicting volume 333 364 715 709 366 716 704 336vC1, stage 1 conf volvC2, stage 2 conf volvCu, unblocked vol 333 364 715 709 366 716 704 336tC, single (s) 4.1 4.1 7.1 6.5 6.2 7.1 6.5 6.2tC, 2 stage (s)tF (s) 2.2 2.2 3.5 4.0 3.3 3.5 4.0 3.3p0 queue free % 100 100 98 97 98 90 97 99cM capacity (veh/h) 1221 1196 325 353 677 321 353 695
Direction, Lane # EB 1 WB 1 NB 1 SB 1Volume Total 356 326 31 52Volume Left 2 4 6 32Volume Right 0 10 14 8cSH 1221 1196 441 358Volume to Capacity 0.00 0.00 0.07 0.15Queue Length 95th (ft) 0 0 6 13Control Delay (s) 0.1 0.1 13.8 16.7Lane LOS A A B CApproach Delay (s) 0.1 0.1 13.8 16.7Approach LOS B C
Intersection SummaryAverage Delay 1.8Intersection Capacity Utilization 35.4% ICU Level of Service AAnalysis Period (min) 15
HCM Unsignalized Intersection Capacity Analysis Children's Hospital21: MLK Way & RIRO Main Garage DC_Existing AM Plus Phase 2
Fehr & Peers Synchro 8 Report
Movement WBL WBR NBT NBR SBL SBTLane ConfigurationsVolume (veh/h) 0 34 1618 201 0 1652Sign Control Stop Free FreeGrade 0% 0% 0%Peak Hour Factor 1.00 1.00 1.00 1.00 1.00 1.00Hourly flow rate (vph) 0 34 1618 201 0 1652PedestriansLane Width (ft)Walking Speed (ft/s)Percent BlockageRight turn flare (veh)Median type None NoneMedian storage veh)Upstream signal (ft) 154 137pX, platoon unblocked 0.84 0.76 0.76vC, conflicting volume 2269 640 1819vC1, stage 1 conf volvC2, stage 2 conf volvCu, unblocked vol 576 0 970tC, single (s) 6.8 6.9 4.1tC, 2 stage (s)tF (s) 3.5 3.3 2.2p0 queue free % 100 96 100cM capacity (veh/h) 375 824 536
Direction, Lane # WB 1 NB 1 NB 2 NB 3 SB 1 SB 2 SB 3Volume Total 34 647 647 525 551 551 551Volume Left 0 0 0 0 0 0 0Volume Right 34 0 0 201 0 0 0cSH 824 1700 1700 1700 1700 1700 1700Volume to Capacity 0.04 0.38 0.38 0.31 0.32 0.32 0.32Queue Length 95th (ft) 3 0 0 0 0 0 0Control Delay (s) 9.6 0.0 0.0 0.0 0.0 0.0 0.0Lane LOS AApproach Delay (s) 9.6 0.0 0.0Approach LOS A
Intersection SummaryAverage Delay 0.1Intersection Capacity Utilization 45.7% ICU Level of Service AAnalysis Period (min) 15

HCM Unsignalized Intersection Capacity Analysis Children's Hospital22: MLK Way & RIRO Main Plaza DC_Existing AM Plus Phase 2
Fehr & Peers Synchro 8 Report
Movement WBL WBR NBT NBR SBL SBTLane ConfigurationsVolume (veh/h) 0 0 1686 0 0 1708Sign Control Stop Free FreeGrade 0% 0% 0%Peak Hour Factor 1.00 1.00 1.00 1.00 1.00 1.00Hourly flow rate (vph) 0 0 1686 0 0 1708PedestriansLane Width (ft)Walking Speed (ft/s)Percent BlockageRight turn flare (veh)Median type None NoneMedian storage veh)Upstream signal (ft) 424 204pX, platoon unblocked 0.80vC, conflicting volume 2255 562 1686vC1, stage 1 conf volvC2, stage 2 conf volvCu, unblocked vol 1701 562 1686tC, single (s) 6.8 6.9 4.1tC, 2 stage (s)tF (s) 3.5 3.3 2.2p0 queue free % 100 100 100cM capacity (veh/h) 66 470 375
Direction, Lane # WB 1 NB 1 NB 2 NB 3 SB 1 SB 2 SB 3Volume Total 0 674 674 337 569 569 569Volume Left 0 0 0 0 0 0 0Volume Right 0 0 0 0 0 0 0cSH 1700 1700 1700 1700 1700 1700 1700Volume to Capacity 0.00 0.40 0.40 0.20 0.33 0.33 0.33Queue Length 95th (ft) 0 0 0 0 0 0 0Control Delay (s) 0.0 0.0 0.0 0.0 0.0 0.0 0.0Lane LOS AApproach Delay (s) 0.0 0.0 0.0Approach LOS A
Intersection SummaryAverage Delay 0.0Intersection Capacity Utilization 36.3% ICU Level of Service AAnalysis Period (min) 15
HCM Unsignalized Intersection Capacity Analysis Children's Hospital24: 51St Street & 52nd Street DC_Existing AM Plus Phase 2
Fehr & Peers Synchro 8 Report
Intersection Sign configuration not allowed in HCM analysis.

HCM Signalized Intersection Capacity Analysis Children's Hospital 1: MLK Way & 55th Street DC_Existing PM Plus Phase 2
Fehr & Peers Synchro 8 Report
Movement EBL EBT EBR WBL WBT WBR NBU NBL NBT NBR SBL SBTLane ConfigurationsVolume (vph) 12 247 161 49 137 42 22 198 1591 143 86 1298Ideal Flow (vphpl) 1900 1900 1900 1900 1900 1900 1900 1900 1900 1900 1900 1900Total Lost time (s) 5.0 5.0 4.5 5.0 4.5 5.0Lane Util. Factor 1.00 1.00 1.00 0.91 1.00 0.91Frpb, ped/bikes 0.99 0.99 1.00 0.99 1.00 1.00Flpb, ped/bikes 1.00 1.00 1.00 1.00 1.00 1.00Frt 0.95 0.98 1.00 0.99 1.00 1.00Flt Protected 1.00 0.99 0.95 1.00 0.95 1.00Satd. Flow (prot) 1756 1751 1770 4991 1770 5074Flt Permitted 0.99 0.70 0.95 1.00 0.95 1.00Satd. Flow (perm) 1739 1233 1770 4991 1770 5074Peak-hour factor, PHF 1.00 1.00 1.00 1.00 1.00 1.00 1.00 1.00 1.00 1.00 1.00 1.00Adj. Flow (vph) 12 247 161 49 137 42 22 198 1591 143 86 1298RTOR Reduction (vph) 0 24 0 0 9 0 0 0 9 0 0 1Lane Group Flow (vph) 0 396 0 0 219 0 0 220 1725 0 86 1311Confl. Peds. (#/hr) 11 15 15 11 12 20 20Confl. Bikes (#/hr) 16 12 15Heavy Vehicles (%) 1% 1% 1% 4% 4% 4% 2% 2% 2% 2% 2% 2%Turn Type Perm NA Perm NA Prot Prot NA Prot NAProtected Phases 4 8 5 5 2 1 6Permitted Phases 4 8Actuated Green, G (s) 28.2 28.2 22.4 48.9 8.4 34.9Effective Green, g (s) 28.2 28.2 22.4 48.9 8.4 34.9Actuated g/C Ratio 0.28 0.28 0.22 0.49 0.08 0.35Clearance Time (s) 5.0 5.0 4.5 5.0 4.5 5.0Vehicle Extension (s) 3.0 3.0 3.0 3.0 3.0 3.0Lane Grp Cap (vph) 490 347 396 2440 148 1770v/s Ratio Prot 0.12 c0.35 0.05 c0.26v/s Ratio Perm c0.23 0.18v/c Ratio 0.81 0.63 0.56 0.71 0.58 0.74Uniform Delay, d1 33.4 31.3 34.4 20.0 44.1 28.6Progression Factor 1.00 1.00 0.52 0.37 1.00 1.00Incremental Delay, d2 9.4 3.7 1.4 1.5 5.7 2.8Delay (s) 42.8 35.0 19.2 8.8 49.8 31.4Level of Service D D B A D CApproach Delay (s) 42.8 35.0 10.0 32.5Approach LOS D D A C
Intersection SummaryHCM 2000 Control Delay 22.7 HCM 2000 Level of Service CHCM 2000 Volume to Capacity ratio 0.77Actuated Cycle Length (s) 100.0 Sum of lost time (s) 14.5Intersection Capacity Utilization 86.5% ICU Level of Service EAnalysis Period (min) 15c Critical Lane Group
HCM Signalized Intersection Capacity Analysis Children's Hospital 1: MLK Way & 55th Street DC_Existing PM Plus Phase 2
Fehr & Peers Synchro 8 Report
Movement SBRLane ConfigurationsVolume (vph) 14Ideal Flow (vphpl) 1900Total Lost time (s)Lane Util. FactorFrpb, ped/bikesFlpb, ped/bikesFrtFlt ProtectedSatd. Flow (prot)Flt PermittedSatd. Flow (perm)Peak-hour factor, PHF 1.00Adj. Flow (vph) 14RTOR Reduction (vph) 0Lane Group Flow (vph) 0Confl. Peds. (#/hr) 12Confl. Bikes (#/hr) 15Heavy Vehicles (%) 2%Turn TypeProtected PhasesPermitted PhasesActuated Green, G (s)Effective Green, g (s)Actuated g/C RatioClearance Time (s)Vehicle Extension (s)Lane Grp Cap (vph)v/s Ratio Protv/s Ratio Permv/c RatioUniform Delay, d1Progression FactorIncremental Delay, d2Delay (s)Level of ServiceApproach Delay (s)Approach LOS
Intersection Summary

HCM Unsignalized Intersection Capacity Analysis Children's Hospital 2: Dover Street & 55th Street DC_Existing PM Plus Phase 2
Fehr & Peers Synchro 8 Report
Movement EBL EBT EBR WBL WBT WBR NBL NBT NBR SBL SBT SBRLane ConfigurationsVolume (veh/h) 17 446 9 6 174 9 12 12 22 11 9 30Sign Control Free Free Stop StopGrade 0% 0% 0% 0%Peak Hour Factor 1.00 1.00 1.00 1.00 1.00 1.00 1.00 1.00 1.00 1.00 1.00 1.00Hourly flow rate (vph) 17 446 9 6 174 9 12 12 22 11 9 30Pedestrians 4 13 7 17Lane Width (ft) 12.0 12.0 12.0 12.0Walking Speed (ft/s) 4.0 4.0 4.0 4.0Percent Blockage 0 1 1 1Right turn flare (veh)Median type None NoneMedian storage veh)Upstream signal (ft) 641 677pX, platoon unblocked 0.95 0.95 0.95 0.95 0.95 0.95vC, conflicting volume 200 462 720 704 470 733 704 200vC1, stage 1 conf volvC2, stage 2 conf volvCu, unblocked vol 200 403 676 658 412 689 658 200tC, single (s) 4.1 4.1 7.1 6.5 6.2 7.1 6.5 6.2tC, 2 stage (s)tF (s) 2.2 2.2 3.5 4.0 3.3 3.5 4.0 3.3p0 queue free % 99 99 96 97 96 96 97 96cM capacity (veh/h) 1335 1077 318 352 600 301 348 824
Direction, Lane # EB 1 WB 1 NB 1 SB 1Volume Total 472 189 46 50Volume Left 17 6 12 11Volume Right 9 9 22 30cSH 1335 1077 424 506Volume to Capacity 0.01 0.01 0.11 0.10Queue Length 95th (ft) 1 0 9 8Control Delay (s) 0.4 0.3 14.5 12.9Lane LOS A A B BApproach Delay (s) 0.4 0.3 14.5 12.9Approach LOS B B
Intersection SummaryAverage Delay 2.1Intersection Capacity Utilization 45.4% ICU Level of Service AAnalysis Period (min) 15
HCM Signalized Intersection Capacity Analysis Children's Hospital 3: 55th Street & Shattuck Ave DC_Existing PM Plus Phase 2
Fehr & Peers Synchro 8 Report
Movement EBL EBT EBR WBL WBT WBR NBL NBT NBR SBL SBT SBRLane ConfigurationsVolume (vph) 70 348 43 18 134 36 27 523 39 18 530 24Ideal Flow (vphpl) 1900 1900 1900 1900 1900 1900 1900 1900 1900 1900 1900 1900Total Lost time (s) 3.0 3.0 5.0 5.0Lane Util. Factor 1.00 1.00 1.00 1.00Frpb, ped/bikes 1.00 0.99 1.00 1.00Flpb, ped/bikes 1.00 1.00 1.00 1.00Frt 0.99 0.97 0.99 0.99Flt Protected 0.99 1.00 1.00 1.00Satd. Flow (prot) 1762 1772 1835 1863Flt Permitted 0.93 0.95 0.96 0.98Satd. Flow (perm) 1646 1692 1772 1824Peak-hour factor, PHF 1.00 1.00 1.00 1.00 1.00 1.00 1.00 1.00 1.00 1.00 1.00 1.00Adj. Flow (vph) 70 348 43 18 134 36 27 523 39 18 530 24RTOR Reduction (vph) 0 4 0 0 11 0 0 3 0 0 2 0Lane Group Flow (vph) 0 457 0 0 177 0 0 586 0 0 570 0Confl. Peds. (#/hr) 11 11 11 11 19 7 7 19Confl. Bikes (#/hr) 15 10 31 22Heavy Vehicles (%) 5% 5% 5% 3% 3% 3% 2% 2% 2% 1% 1% 1%Turn Type Perm NA Perm NA Perm NA Perm NAProtected Phases 2 6 4 8Permitted Phases 2 6 4 4 8Actuated Green, G (s) 29.0 29.0 43.0 43.0Effective Green, g (s) 29.0 29.0 43.0 43.0Actuated g/C Ratio 0.36 0.36 0.54 0.54Clearance Time (s) 3.0 3.0 5.0 5.0Lane Grp Cap (vph) 596 613 952 980v/s Ratio Protv/s Ratio Perm c0.28 0.10 c0.33 0.31v/c Ratio 0.77 0.29 0.62 0.58Uniform Delay, d1 22.5 18.2 12.8 12.4Progression Factor 1.00 1.00 1.00 1.00Incremental Delay, d2 9.1 1.2 3.0 2.5Delay (s) 31.6 19.3 15.8 15.0Level of Service C B B BApproach Delay (s) 31.6 19.3 15.8 15.0Approach LOS C B B B
Intersection SummaryHCM 2000 Control Delay 19.9 HCM 2000 Level of Service BHCM 2000 Volume to Capacity ratio 0.68Actuated Cycle Length (s) 80.0 Sum of lost time (s) 8.0Intersection Capacity Utilization 87.5% ICU Level of Service EAnalysis Period (min) 15c Critical Lane Group

HCM Signalized Intersection Capacity Analysis Children's Hospital 4: 55th Street & Telegraph Ave DC_Existing PM Plus Phase 2
Fehr & Peers Synchro 8 Report
Movement EBL EBT EBR WBL WBT WBR NBL NBT NBR SBL SBT SBRLane ConfigurationsVolume (vph) 289 20 94 38 14 18 70 899 57 20 930 98Ideal Flow (vphpl) 1900 1900 1900 1900 1900 1900 1900 1900 1900 1900 1900 1900Total Lost time (s) 4.5 4.5 4.5 4.5 4.5 4.5Lane Util. Factor 1.00 1.00 1.00 0.95 1.00 0.95Frpb, ped/bikes 0.99 0.99 1.00 1.00 1.00 0.99Flpb, ped/bikes 0.99 0.99 0.99 1.00 0.99 1.00Frt 0.97 0.97 1.00 0.99 1.00 0.99Flt Protected 0.97 0.97 0.95 1.00 0.95 1.00Satd. Flow (prot) 1659 1692 1752 3491 1773 3486Flt Permitted 0.76 0.77 0.21 1.00 0.23 1.00Satd. Flow (perm) 1305 1339 383 3491 435 3486Peak-hour factor, PHF 1.00 1.00 1.00 1.00 1.00 1.00 1.00 1.00 1.00 1.00 1.00 1.00Adj. Flow (vph) 289 20 94 38 14 18 70 899 57 20 930 98RTOR Reduction (vph) 0 13 0 0 12 0 0 4 0 0 8 0Lane Group Flow (vph) 0 390 0 0 58 0 70 952 0 20 1020 0Confl. Peds. (#/hr) 11 26 26 11 25 17 17 25Confl. Bikes (#/hr) 8 9 29 45Heavy Vehicles (%) 5% 5% 5% 4% 4% 4% 2% 2% 2% 1% 1% 1%Turn Type Perm NA Perm NA Perm NA Perm NAProtected Phases 4 8 2 6Permitted Phases 4 8 2 6Actuated Green, G (s) 31.1 31.1 49.9 49.9 49.9 49.9Effective Green, g (s) 31.1 31.1 49.9 49.9 49.9 49.9Actuated g/C Ratio 0.35 0.35 0.55 0.55 0.55 0.55Clearance Time (s) 4.5 4.5 4.5 4.5 4.5 4.5Vehicle Extension (s) 3.0 3.0 3.0 3.0 3.0 3.0Lane Grp Cap (vph) 450 462 212 1935 241 1932v/s Ratio Prot 0.27 c0.29v/s Ratio Perm c0.30 0.04 0.18 0.05v/c Ratio 0.87 0.13 0.33 0.49 0.08 0.53Uniform Delay, d1 27.5 20.2 10.9 12.3 9.4 12.6Progression Factor 1.00 1.00 1.00 1.00 1.00 1.00Incremental Delay, d2 15.9 0.1 4.1 0.9 0.7 1.0Delay (s) 43.4 20.3 15.1 13.2 10.0 13.7Level of Service D C B B B BApproach Delay (s) 43.4 20.3 13.3 13.6Approach LOS D C B B
Intersection SummaryHCM 2000 Control Delay 18.4 HCM 2000 Level of Service BHCM 2000 Volume to Capacity ratio 0.66Actuated Cycle Length (s) 90.0 Sum of lost time (s) 9.0Intersection Capacity Utilization 74.2% ICU Level of Service DAnalysis Period (min) 15c Critical Lane Group
HCM Unsignalized Intersection Capacity Analysis Children's Hospital 5: MLK Way & 54th Street DC_Existing PM Plus Phase 2
Fehr & Peers Synchro 8 Report
Movement EBL EBT EBR WBL WBT WBR NBU NBL NBT NBR SBU SBLLane ConfigurationsVolume (veh/h) 4 5 38 14 2 8 11 32 1915 43 6 9Sign Control Stop Stop FreeGrade 0% 0% 0%Peak Hour Factor 1.00 1.00 1.00 1.00 1.00 1.00 1.00 1.00 1.00 1.00 1.00 1.00Hourly flow rate (vph) 4 5 38 14 2 8 0 32 1915 43 0 9Pedestrians 5 19 11Lane Width (ft) 12.0 12.0 12.0Walking Speed (ft/s) 4.0 4.0 4.0Percent Blockage 0 2 1Right turn flare (veh)Median type NoneMedian storage veh)Upstream signal (ft) 299pX, platoon unblocked 0.88 0.88 0.78 0.88 0.88 0.78 0.00 0.78 0.00 0.78vC, conflicting volume 2237 3566 519 2589 3548 679 0 1511 0 1977vC1, stage 1 conf volvC2, stage 2 conf volvCu, unblocked vol 290 1794 0 688 1774 0 0 649 0 1281tC, single (s) 7.5 6.5 6.9 7.5 6.5 6.9 0.0 4.1 0.0 4.1tC, 2 stage (s)tF (s) 3.5 4.0 3.3 *5.5 *5.5 *5.5 0.0 2.2 0.0 2.2p0 queue free % 99 92 95 92 97 98 0 96 0 98cM capacity (veh/h) 510 66 835 183 63 505 0 721 0 419
Direction, Lane # EB 1 WB 1 NB 1 NB 2 NB 3 SB 1 SB 2 SB 3Volume Total 47 24 511 958 522 384 750 382Volume Left 4 14 32 0 0 9 0 0Volume Right 38 8 0 0 43 0 0 7cSH 364 193 721 1700 1700 419 1700 1700Volume to Capacity 0.13 0.12 0.04 0.56 0.31 0.02 0.44 0.22Queue Length 95th (ft) 11 10 3 0 0 2 0 0Control Delay (s) 16.4 26.3 1.2 0.0 0.0 0.7 0.0 0.0Lane LOS C D A AApproach Delay (s) 16.4 26.3 0.3 0.2Approach LOS C D
Intersection SummaryAverage Delay 0.6Intersection Capacity Utilization 82.1% ICU Level of Service EAnalysis Period (min) 15
* User Entered Value

HCM Unsignalized Intersection Capacity Analysis Children's Hospital 5: MLK Way & 54th Street DC_Existing PM Plus Phase 2
Fehr & Peers Synchro 8 Report
Movement SBT SBRLane ConfigurationsVolume (veh/h) 1499 7Sign Control FreeGrade 0%Peak Hour Factor 1.00 1.00Hourly flow rate (vph) 1499 7PedestriansLane Width (ft)Walking Speed (ft/s)Percent BlockageRight turn flare (veh)Median type NoneMedian storage veh)Upstream signal (ft) 294pX, platoon unblockedvC, conflicting volumevC1, stage 1 conf volvC2, stage 2 conf volvCu, unblocked voltC, single (s)tC, 2 stage (s)tF (s)p0 queue free %cM capacity (veh/h)
Direction, Lane #
HCM Unsignalized Intersection Capacity Analysis Children's Hospital 6: Dover Street & 54th Street DC_Existing PM Plus Phase 2
Fehr & Peers Synchro 8 Report
Movement EBL EBT EBR WBL WBT WBR NBL NBT NBR SBL SBT SBRLane ConfigurationsVolume (veh/h) 8 38 4 2 5 11 8 31 4 7 17 2Sign Control Stop Stop Free FreeGrade 0% 0% 0% 0%Peak Hour Factor 1.00 1.00 1.00 1.00 1.00 1.00 1.00 1.00 1.00 1.00 1.00 1.00Hourly flow rate (vph) 8 38 4 2 5 11 8 31 4 7 17 2Pedestrians 12 8 6 3Lane Width (ft) 12.0 12.0 12.0 12.0Walking Speed (ft/s) 4.0 4.0 4.0 4.0Percent Blockage 1 1 1 0Right turn flare (veh)Median type None NoneMedian storage veh)Upstream signal (ft)pX, platoon unblockedvC, conflicting volume 110 103 36 118 102 44 31 43vC1, stage 1 conf volvC2, stage 2 conf volvCu, unblocked vol 110 103 36 118 102 44 31 43tC, single (s) 7.1 6.5 6.2 7.1 6.5 6.2 4.1 4.1tC, 2 stage (s)tF (s) 3.5 4.0 3.3 3.5 4.0 3.3 2.2 2.2p0 queue free % 99 95 100 100 99 99 99 100cM capacity (veh/h) 832 770 1027 801 771 1022 1579 1568
Direction, Lane # EB 1 WB 1 NB 1 SB 1Volume Total 50 18 43 26Volume Left 8 2 8 7Volume Right 4 11 4 2cSH 796 912 1579 1568Volume to Capacity 0.06 0.02 0.01 0.00Queue Length 95th (ft) 5 2 0 0Control Delay (s) 9.8 9.0 1.4 2.0Lane LOS A A A AApproach Delay (s) 9.8 9.0 1.4 2.0Approach LOS A A
Intersection SummaryAverage Delay 5.6Intersection Capacity Utilization 19.1% ICU Level of Service AAnalysis Period (min) 15

HCM Unsignalized Intersection Capacity Analysis Children's Hospital 7: Shattuck Ave & 54th Street DC_Existing PM Plus Phase 2
Fehr & Peers Synchro 8 Report
Movement EBL EBR NBL NBT SBT SBRLane ConfigurationsVolume (veh/h) 3 42 11 607 616 3Sign Control Stop Free FreeGrade 0% 0% 0%Peak Hour Factor 1.00 1.00 1.00 1.00 1.00 1.00Hourly flow rate (vph) 3 42 11 607 616 3Pedestrians 25 1Lane Width (ft) 12.0 12.0Walking Speed (ft/s) 4.0 4.0Percent Blockage 2 0Right turn flare (veh)Median type None NoneMedian storage veh)Upstream signal (ft) 550 282pX, platoon unblocked 0.83 0.79 0.79vC, conflicting volume 1272 642 644vC1, stage 1 conf volvC2, stage 2 conf volvCu, unblocked vol 1012 419 421tC, single (s) 6.4 6.2 4.1tC, 2 stage (s)tF (s) 3.5 3.3 2.2p0 queue free % 99 92 99cM capacity (veh/h) 215 496 884
Direction, Lane # EB 1 NB 1 SB 1Volume Total 45 618 619Volume Left 3 11 0Volume Right 42 0 3cSH 456 884 1700Volume to Capacity 0.10 0.01 0.36Queue Length 95th (ft) 8 1 0Control Delay (s) 13.8 0.3 0.0Lane LOS B AApproach Delay (s) 13.8 0.3 0.0Approach LOS B
Intersection SummaryAverage Delay 0.6Intersection Capacity Utilization 50.8% ICU Level of Service AAnalysis Period (min) 15
HCM Signalized Intersection Capacity Analysis Children's Hospital 8: MLK Way & 53rd Street DC_Existing PM Plus Phase 2
Fehr & Peers Synchro 8 Report
Movement EBL EBT EBR WBL WBT WBR NBU NBL NBT NBR SBL SBTLane ConfigurationsVolume (vph) 2 3 52 46 6 4 7 9 2004 68 2 1584Ideal Flow (vphpl) 1900 1900 1900 1900 1900 1900 1900 1900 1900 1900 1900 1900Total Lost time (s) 5.0 5.0 4.0 3.5 4.0 3.5Lane Util. Factor 1.00 1.00 1.00 0.91 1.00 0.91Frpb, ped/bikes 0.98 1.00 1.00 1.00 1.00 1.00Flpb, ped/bikes 1.00 1.00 1.00 1.00 1.00 1.00Frt 0.88 0.99 1.00 1.00 1.00 1.00Flt Protected 1.00 0.96 0.95 1.00 0.95 1.00Satd. Flow (prot) 1600 1801 1770 5041 1787 5133Flt Permitted 0.99 0.74 0.95 1.00 0.95 1.00Satd. Flow (perm) 1592 1391 1770 5041 1787 5133Peak-hour factor, PHF 1.00 1.00 1.00 1.00 1.00 1.00 1.00 1.00 1.00 1.00 1.00 1.00Adj. Flow (vph) 2 3 52 46 6 4 7 9 2004 68 2 1584RTOR Reduction (vph) 0 43 0 0 3 0 0 0 2 0 0 0Lane Group Flow (vph) 0 14 0 0 53 0 0 16 2070 0 2 1588Confl. Peds. (#/hr) 8 4 4 8 14 32 32Confl. Bikes (#/hr) 4 2 13Heavy Vehicles (%) 2% 2% 2% 0% 0% 0% 2% 2% 2% 2% 1% 1%Turn Type Perm NA Perm NA Prot Prot NA Prot NAProtected Phases 4 8 5 5 2 1 6Permitted Phases 4 8Actuated Green, G (s) 16.4 16.4 3.0 69.3 1.8 68.1Effective Green, g (s) 16.4 16.4 3.0 69.3 1.8 68.1Actuated g/C Ratio 0.16 0.16 0.03 0.69 0.02 0.68Clearance Time (s) 5.0 5.0 4.0 3.5 4.0 3.5Vehicle Extension (s) 3.0 3.0 3.0 3.0 3.0 3.0Lane Grp Cap (vph) 261 228 53 3493 32 3495v/s Ratio Prot 0.01 c0.41 0.00 c0.31v/s Ratio Perm 0.01 c0.04v/c Ratio 0.05 0.23 0.30 0.59 0.06 0.45Uniform Delay, d1 35.2 36.3 47.5 8.0 48.3 7.4Progression Factor 1.00 1.03 1.41 0.21 0.78 0.47Incremental Delay, d2 0.1 0.5 2.3 0.5 0.6 0.3Delay (s) 35.3 37.8 69.3 2.2 38.5 3.8Level of Service D D E A D AApproach Delay (s) 35.3 37.8 2.7 3.8Approach LOS D D A A
Intersection SummaryHCM 2000 Control Delay 4.2 HCM 2000 Level of Service AHCM 2000 Volume to Capacity ratio 0.54Actuated Cycle Length (s) 100.0 Sum of lost time (s) 12.5Intersection Capacity Utilization 63.2% ICU Level of Service BAnalysis Period (min) 15c Critical Lane Group

HCM Signalized Intersection Capacity Analysis Children's Hospital 8: MLK Way & 53rd Street DC_Existing PM Plus Phase 2
Fehr & Peers Synchro 8 Report
Movement SBRLane ConfigurationsVolume (vph) 4Ideal Flow (vphpl) 1900Total Lost time (s)Lane Util. FactorFrpb, ped/bikesFlpb, ped/bikesFrtFlt ProtectedSatd. Flow (prot)Flt PermittedSatd. Flow (perm)Peak-hour factor, PHF 1.00Adj. Flow (vph) 4RTOR Reduction (vph) 0Lane Group Flow (vph) 0Confl. Peds. (#/hr) 14Confl. Bikes (#/hr) 16Heavy Vehicles (%) 1%Turn TypeProtected PhasesPermitted PhasesActuated Green, G (s)Effective Green, g (s)Actuated g/C RatioClearance Time (s)Vehicle Extension (s)Lane Grp Cap (vph)v/s Ratio Protv/s Ratio Permv/c RatioUniform Delay, d1Progression FactorIncremental Delay, d2Delay (s)Level of ServiceApproach Delay (s)Approach LOS
Intersection Summary
HCM Unsignalized Intersection Capacity Analysis Children's Hospital 9: Dover Street & 53rd Street DC_Existing PM Plus Phase 2
Fehr & Peers Synchro 8 Report
Movement EBL EBT EBR WBL WBT WBR NBL NBT NBR SBL SBT SBRLane ConfigurationsVolume (veh/h) 41 8 0 0 6 5 0 0 0 1 0 28Sign Control Stop Stop Free FreeGrade 0% 0% 0% 0%Peak Hour Factor 1.00 1.00 1.00 1.00 1.00 1.00 1.00 1.00 1.00 1.00 1.00 1.00Hourly flow rate (vph) 41 8 0 0 6 5 0 0 0 1 0 28Pedestrians 25 10 4 4Lane Width (ft) 12.0 12.0 12.0 12.0Walking Speed (ft/s) 4.0 4.0 4.0 4.0Percent Blockage 2 1 0 0Right turn flare (veh)Median type None NoneMedian storage veh)Upstream signal (ft)pX, platoon unblockedvC, conflicting volume 53 51 43 34 65 14 53 10vC1, stage 1 conf volvC2, stage 2 conf volvCu, unblocked vol 53 51 43 34 65 14 53 10tC, single (s) 7.1 6.5 6.2 7.1 6.5 6.2 4.1 4.1tC, 2 stage (s)tF (s) 3.5 4.0 3.3 3.5 4.0 3.3 2.2 2.2p0 queue free % 95 99 100 100 99 100 100 100cM capacity (veh/h) 897 819 1008 938 805 1059 1533 1609
Direction, Lane # EB 1 WB 1 NB 1 SB 1Volume Total 49 11 0 29Volume Left 41 0 0 1Volume Right 0 5 0 28cSH 884 904 1700 1609Volume to Capacity 0.06 0.01 0.00 0.00Queue Length 95th (ft) 4 1 0 0Control Delay (s) 9.3 9.0 0.0 0.3Lane LOS A A AApproach Delay (s) 9.3 9.0 0.0 0.3Approach LOS A A
Intersection SummaryAverage Delay 6.3Intersection Capacity Utilization 25.8% ICU Level of Service AAnalysis Period (min) 15

HCM Signalized Intersection Capacity Analysis Children's Hospital 10: MLK Way & 52nd Street DC_Existing PM Plus Phase 2
Fehr & Peers Synchro 8 Report
Movement EBL EBT EBR WBL WBT WBR NBU NBL NBT NBR SBU SBLLane ConfigurationsVolume (vph) 76 108 95 147 85 249 42 74 1685 102 4 183Ideal Flow (vphpl) 1900 1900 1900 1900 1900 1900 1900 1900 1900 1900 1900 1900Total Lost time (s) 5.0 5.0 5.0 5.0 4.5 4.5 4.0Lane Util. Factor 1.00 1.00 1.00 1.00 1.00 0.91 1.00Frpb, ped/bikes 1.00 0.96 1.00 0.97 1.00 1.00 1.00Flpb, ped/bikes 0.99 1.00 0.97 1.00 1.00 1.00 1.00Frt 1.00 0.93 1.00 0.85 1.00 0.99 1.00Flt Protected 0.95 1.00 0.97 1.00 0.95 1.00 0.95Satd. Flow (prot) 1769 1686 1758 1535 1787 5075 1787Flt Permitted 0.47 1.00 0.57 1.00 0.95 1.00 0.95Satd. Flow (perm) 880 1686 1041 1535 1787 5075 1787Peak-hour factor, PHF 1.00 1.00 1.00 1.00 1.00 1.00 1.00 1.00 1.00 1.00 1.00 1.00Adj. Flow (vph) 76 108 95 147 85 249 42 74 1685 102 4 183RTOR Reduction (vph) 0 34 0 0 0 185 0 0 6 0 0 0Lane Group Flow (vph) 76 169 0 0 232 64 0 116 1781 0 0 187Confl. Peds. (#/hr) 16 61 61 16 13 10 10Confl. Bikes (#/hr) 9 4 15Heavy Vehicles (%) 1% 1% 1% 2% 2% 2% 1% 1% 1% 1% 1% 1%Turn Type Perm NA Perm NA Perm Prot Prot NA Prot ProtProtected Phases 4 8 5 5 2 1 1Permitted Phases 4 8 8Actuated Green, G (s) 25.9 25.9 25.9 25.9 10.8 43.1 17.5Effective Green, g (s) 25.9 25.9 25.9 25.9 10.8 43.1 17.5Actuated g/C Ratio 0.26 0.26 0.26 0.26 0.11 0.43 0.18Clearance Time (s) 5.0 5.0 5.0 5.0 4.5 4.5 4.0Vehicle Extension (s) 2.0 2.0 2.0 2.0 2.0 2.0 2.0Lane Grp Cap (vph) 227 436 269 397 192 2187 312v/s Ratio Prot 0.10 0.06 c0.35 0.10v/s Ratio Perm 0.09 c0.22 0.04v/c Ratio 0.33 0.39 0.86 0.16 0.60 0.81 0.60Uniform Delay, d1 30.1 30.5 35.4 28.7 42.6 24.9 38.0Progression Factor 1.00 1.00 0.79 2.03 0.97 1.06 0.61Incremental Delay, d2 0.3 0.2 21.1 0.1 1.5 1.5 1.9Delay (s) 30.4 30.7 49.2 58.2 42.9 27.9 25.3Level of Service C C D E D C CApproach Delay (s) 30.6 53.9 28.8Approach LOS C D C
Intersection SummaryHCM 2000 Control Delay 23.6 HCM 2000 Level of Service CHCM 2000 Volume to Capacity ratio 0.80Actuated Cycle Length (s) 100.0 Sum of lost time (s) 14.0Intersection Capacity Utilization 105.5% ICU Level of Service GAnalysis Period (min) 15c Critical Lane Group
HCM Signalized Intersection Capacity Analysis Children's Hospital 10: MLK Way & 52nd Street DC_Existing PM Plus Phase 2
Fehr & Peers Synchro 8 Report
Movement SBT SBRLane ConfigurationsVolume (vph) 1508 3Ideal Flow (vphpl) 1900 1900Total Lost time (s) 4.5Lane Util. Factor 0.91Frpb, ped/bikes 1.00Flpb, ped/bikes 1.00Frt 1.00Flt Protected 1.00Satd. Flow (prot) 5133Flt Permitted 1.00Satd. Flow (perm) 5133Peak-hour factor, PHF 1.00 1.00Adj. Flow (vph) 1508 3RTOR Reduction (vph) 0 0Lane Group Flow (vph) 1511 0Confl. Peds. (#/hr) 13Confl. Bikes (#/hr) 17Heavy Vehicles (%) 1% 1%Turn Type NAProtected Phases 6Permitted PhasesActuated Green, G (s) 49.3Effective Green, g (s) 49.3Actuated g/C Ratio 0.49Clearance Time (s) 4.5Vehicle Extension (s) 2.0Lane Grp Cap (vph) 2530v/s Ratio Prot c0.29v/s Ratio Permv/c Ratio 0.60Uniform Delay, d1 18.2Progression Factor 0.27Incremental Delay, d2 1.0Delay (s) 5.9Level of Service AApproach Delay (s) 8.1Approach LOS A
Intersection Summary

HCM Signalized Intersection Capacity Analysis Children's Hospital 11: 52nd Street & Garage DC_Existing PM Plus Phase 2
Fehr & Peers Synchro 8 Report
Movement EBL EBT EBR WBL WBT WBR NBL NBT NBR SBL SBT SBRLane ConfigurationsVolume (vph) 3 390 4 3 416 2 12 1 7 0 4 59Ideal Flow (vphpl) 1900 1900 1900 1900 1900 1900 1900 1900 1900 1900 1900 1900Total Lost time (s) 3.0 3.0 3.0 3.0Lane Util. Factor 1.00 1.00 1.00 1.00Frpb, ped/bikes 1.00 1.00 0.95 0.99Flpb, ped/bikes 1.00 1.00 1.00 1.00Frt 1.00 1.00 0.95 0.87Flt Protected 1.00 1.00 0.97 1.00Satd. Flow (prot) 1857 1897 1438 1640Flt Permitted 1.00 1.00 0.92 1.00Satd. Flow (perm) 1854 1894 1359 1640Peak-hour factor, PHF 1.00 1.00 1.00 1.00 1.00 1.00 1.00 1.00 1.00 1.00 1.00 1.00Adj. Flow (vph) 3 390 4 3 416 2 12 1 7 0 4 59RTOR Reduction (vph) 0 1 0 0 1 0 0 4 0 0 32 0Lane Group Flow (vph) 0 396 0 0 420 0 0 16 0 0 31 0Confl. Peds. (#/hr) 25 59 59 25 208 208Confl. Bikes (#/hr) 10 6 1Heavy Vehicles (%) 2% 2% 2% 0% 0% 0% 16% 16% 16% 0% 0% 0%Turn Type Perm NA Perm NA Perm NA NAProtected Phases 2 6 4 8Permitted Phases 2 6 4 8Actuated Green, G (s) 21.0 21.0 23.0 23.0Effective Green, g (s) 21.0 21.0 23.0 23.0Actuated g/C Ratio 0.42 0.42 0.46 0.46Clearance Time (s) 3.0 3.0 3.0 3.0Lane Grp Cap (vph) 778 795 625 754v/s Ratio Prot c0.02v/s Ratio Perm 0.21 c0.22 0.01v/c Ratio 0.51 0.53 0.03 0.04Uniform Delay, d1 10.7 10.8 7.4 7.4Progression Factor 1.70 1.00 1.00 1.00Incremental Delay, d2 1.9 2.5 0.1 0.1Delay (s) 20.1 13.3 7.5 7.5Level of Service C B A AApproach Delay (s) 20.1 13.3 7.5 7.5Approach LOS C B A A
Intersection SummaryHCM 2000 Control Delay 15.8 HCM 2000 Level of Service BHCM 2000 Volume to Capacity ratio 0.27Actuated Cycle Length (s) 50.0 Sum of lost time (s) 6.0Intersection Capacity Utilization 49.8% ICU Level of Service AAnalysis Period (min) 15c Critical Lane Group
HCM Unsignalized Intersection Capacity Analysis Children's Hospital 12: 52nd Street & Dover Street DC_Existing PM Plus Phase 2
Fehr & Peers Synchro 8 Report
Movement EBL EBT EBR WBL WBT WBR NBL NBT NBR SBL SBT SBRLane ConfigurationsVolume (veh/h) 8 341 46 21 344 4 72 0 50 10 0 14Sign Control Free Free Stop StopGrade 0% 0% 0% 0%Peak Hour Factor 1.00 1.00 1.00 1.00 1.00 1.00 1.00 1.00 1.00 1.00 1.00 1.00Hourly flow rate (vph) 8 341 46 21 344 4 72 0 50 10 0 14Pedestrians 37 7 35 15Lane Width (ft) 12.0 12.0 12.0 12.0Walking Speed (ft/s) 4.0 4.0 4.0 4.0Percent Blockage 3 1 3 1Right turn flare (veh)Median type None NoneMedian storage veh)Upstream signal (ft) 312 647pX, platoon unblocked 0.90 0.84 0.89 0.89 0.84 0.89 0.89 0.90vC, conflicting volume 363 422 854 820 406 840 841 398vC1, stage 1 conf volvC2, stage 2 conf volvCu, unblocked vol 233 221 519 481 202 504 505 272tC, single (s) 4.1 4.1 7.2 6.6 6.3 7.1 6.5 6.2tC, 2 stage (s)tF (s) 2.2 2.2 3.6 4.1 3.4 3.5 4.0 3.3p0 queue free % 99 98 80 100 92 97 100 98cM capacity (veh/h) 1177 1108 356 395 666 371 395 663
Direction, Lane # EB 1 WB 1 NB 1 SB 1Volume Total 395 369 122 24Volume Left 8 21 72 10Volume Right 46 4 50 14cSH 1177 1108 440 499Volume to Capacity 0.01 0.02 0.28 0.05Queue Length 95th (ft) 1 1 28 4Control Delay (s) 0.2 0.7 16.3 12.6Lane LOS A A C BApproach Delay (s) 0.2 0.7 16.3 12.6Approach LOS C B
Intersection SummaryAverage Delay 2.9Intersection Capacity Utilization 47.4% ICU Level of Service AAnalysis Period (min) 15

HCM Unsignalized Intersection Capacity Analysis Children's Hospital 13: SR-24 NB Off-Ramp & 52nd Street DC_Existing PM Plus Phase 2
Fehr & Peers Synchro 8 Report
Movement EBL EBT EBR WBL WBT WBR NBL NBR SEL SERLane ConfigurationsVolume (veh/h) 0 396 0 0 376 1003 0 1024 0 0Sign Control Free Free Stop StopGrade 0% 0% 0% 0%Peak Hour Factor 1.00 1.00 1.00 1.00 1.00 1.00 1.00 1.00 1.00 1.00Hourly flow rate (vph) 0 396 0 0 376 1003 0 1024 0 0Pedestrians 33 9Lane Width (ft) 12.0 0.0Walking Speed (ft/s) 4.0 4.0Percent Blockage 3 0Right turn flare (veh)Median type None NoneMedian storage veh)Upstream signal (ft) 767 192pX, platoon unblocked 0.83 0.83 0.83 0.83vC, conflicting volume 1388 429 1817 231 1607 814vC1, stage 1 conf volvC2, stage 2 conf volvCu, unblocked vol 1067 429 1582 231 1330 379tC, single (s) 4.1 4.1 6.5 7.0 7.5 6.5tC, 2 stage (s)tF (s) 2.2 2.2 4.0 3.3 3.5 4.0p0 queue free % 100 100 100 0 0 100cM capacity (veh/h) 541 1096 87 747 0 447
Direction, Lane # EB 1 EB 2 WB 1 WB 2 WB 3 NB 1 NB 2Volume Total 198 198 251 460 669 512 512Volume Left 0 0 0 0 0 0 0Volume Right 0 0 0 334 669 512 512cSH 1700 1700 1700 1700 1700 747 747Volume to Capacity 0.12 0.12 0.15 0.27 0.39 0.69 0.69Queue Length 95th (ft) 0 0 0 0 0 138 138Control Delay (s) 0.0 0.0 0.0 0.0 0.0 19.6 19.6Lane LOS C CApproach Delay (s) 0.0 0.0 19.6Approach LOS C
Intersection SummaryAverage Delay 7.2Intersection Capacity Utilization 55.0% ICU Level of Service BAnalysis Period (min) 15
HCM Signalized Intersection Capacity Analysis Children's Hospital 14: 52nd Street & Shattuck Ave DC_Existing PM Plus Phase 2
Fehr & Peers Synchro 8 Report
Movement EBU EBL EBT EBR WBL WBT WBR NBL NBT NBR SBL SBTLane ConfigurationsVolume (vph) 40 308 880 172 35 839 129 146 207 40 161 143Ideal Flow (vphpl) 1900 1900 1900 1900 1900 1900 1900 1900 1900 1900 1900 1900Total Lost time (s) 4.0 4.5 4.0 4.5 4.0 5.5 5.5Lane Util. Factor 1.00 0.91 1.00 0.91 1.00 1.00 1.00Frpb, ped/bikes 1.00 0.99 1.00 0.99 1.00 0.99 1.00Flpb, ped/bikes 1.00 1.00 1.00 1.00 1.00 1.00 0.99Frt 1.00 0.98 1.00 0.98 1.00 0.98 1.00Flt Protected 0.95 1.00 0.95 1.00 0.95 1.00 0.97Satd. Flow (prot) 1787 4950 1805 5038 1748 1783 1712Flt Permitted 0.95 1.00 0.95 1.00 0.27 1.00 0.71Satd. Flow (perm) 1787 4950 1805 5038 493 1783 1243Peak-hour factor, PHF 1.00 1.00 1.00 1.00 1.00 1.00 1.00 1.00 1.00 1.00 1.00 1.00Adj. Flow (vph) 40 308 880 172 35 839 129 146 207 40 161 143RTOR Reduction (vph) 0 0 24 0 0 18 0 0 6 0 0 0Lane Group Flow (vph) 0 348 1028 0 35 950 0 146 241 0 0 304Confl. Peds. (#/hr) 11 14 14 11 18 22 22Confl. Bikes (#/hr) 13 8 30Heavy Vehicles (%) 1% 1% 1% 1% 0% 0% 0% 3% 3% 3% 7% 7%Turn Type Prot Prot NA Prot NA pm+pt NA Perm NAProtected Phases 7 7 4 3 8 5 2 6Permitted Phases 2 6Actuated Green, G (s) 33.5 57.2 3.9 27.6 34.9 34.9 25.4Effective Green, g (s) 33.5 57.2 3.9 27.6 34.9 34.9 25.4Actuated g/C Ratio 0.30 0.52 0.04 0.25 0.32 0.32 0.23Clearance Time (s) 4.0 4.5 4.0 4.5 4.0 5.5 5.5Vehicle Extension (s) 3.0 3.0 3.0 3.0 3.0 3.0 3.0Lane Grp Cap (vph) 544 2574 63 1264 219 565 287v/s Ratio Prot c0.19 0.21 0.02 c0.19 c0.03 0.14v/s Ratio Perm 0.18 c0.24v/c Ratio 0.64 0.40 0.56 0.75 0.67 0.43 1.06Uniform Delay, d1 33.0 16.0 52.2 38.0 31.8 29.6 42.3Progression Factor 1.00 1.00 1.00 1.00 1.00 1.00 1.00Incremental Delay, d2 5.7 0.5 10.2 4.2 7.5 2.3 69.6Delay (s) 38.7 16.5 62.4 42.2 39.2 32.0 111.9Level of Service D B E D D C FApproach Delay (s) 22.0 42.9 34.7 71.2Approach LOS C D C E
Intersection SummaryHCM 2000 Control Delay 38.9 HCM 2000 Level of Service DHCM 2000 Volume to Capacity ratio 0.79Actuated Cycle Length (s) 110.0 Sum of lost time (s) 18.0Intersection Capacity Utilization 101.0% ICU Level of Service GAnalysis Period (min) 15c Critical Lane Group

HCM Signalized Intersection Capacity Analysis Children's Hospital 14: 52nd Street & Shattuck Ave DC_Existing PM Plus Phase 2
Fehr & Peers Synchro 8 Report
Movement SBRLane ConfigurationsVolume (vph) 355Ideal Flow (vphpl) 1900Total Lost time (s) 5.5Lane Util. Factor 1.00Frpb, ped/bikes 0.94Flpb, ped/bikes 1.00Frt 0.85Flt Protected 1.00Satd. Flow (prot) 1421Flt Permitted 1.00Satd. Flow (perm) 1421Peak-hour factor, PHF 1.00Adj. Flow (vph) 355RTOR Reduction (vph) 273Lane Group Flow (vph) 82Confl. Peds. (#/hr) 18Confl. Bikes (#/hr) 27Heavy Vehicles (%) 7%Turn Type PermProtected PhasesPermitted Phases 6Actuated Green, G (s) 25.4Effective Green, g (s) 25.4Actuated g/C Ratio 0.23Clearance Time (s) 5.5Vehicle Extension (s) 3.0Lane Grp Cap (vph) 328v/s Ratio Protv/s Ratio Perm 0.06v/c Ratio 0.25Uniform Delay, d1 34.5Progression Factor 1.00Incremental Delay, d2 1.8Delay (s) 36.3Level of Service DApproach Delay (s)Approach LOS
Intersection Summary
HCM Signalized Intersection Capacity Analysis Children's Hospital 15: Telegraph Ave & 52nd Street/Claremont Ave DC_Existing PM Plus Phase 2
Fehr & Peers Synchro 8 Report
Movement EBL EBT EBR WBL WBT WBR NBL NBT NBR SBL SBT SBRLane ConfigurationsVolume (vph) 13 7 13 99 72 157 14 861 224 101 667 286Ideal Flow (vphpl) 1900 1900 1900 1900 1900 1900 1900 1900 1900 1900 1900 1900Lane Width 12 12 12 12 12 12 12 16 12 12 12 12Total Lost time (s) 4.5 4.5 4.5 4.5 4.5 4.5Lane Util. Factor 1.00 0.95 0.95 0.95 1.00 0.95Frpb, ped/bikes 0.99 1.00 0.95 0.99 1.00 0.93Flpb, ped/bikes 1.00 1.00 1.00 1.00 1.00 1.00Frt 0.95 1.00 0.90 0.97 1.00 0.95Flt Protected 0.98 0.95 1.00 1.00 0.95 1.00Satd. Flow (prot) 1623 1698 1532 3797 1770 3144Flt Permitted 0.98 0.95 1.00 0.94 0.95 1.00Satd. Flow (perm) 1623 1698 1532 3564 1770 3144Peak-hour factor, PHF 1.00 1.00 1.00 1.00 1.00 1.00 1.00 1.00 1.00 1.00 1.00 1.00Adj. Flow (vph) 13 7 13 99 72 157 14 861 224 101 667 286RTOR Reduction (vph) 0 12 0 0 74 0 0 18 0 0 37 0Lane Group Flow (vph) 0 21 0 89 165 0 0 1081 0 101 916 0Confl. Peds. (#/hr) 34 34 70 22 22 70Confl. Bikes (#/hr) 1 10 35 48Heavy Vehicles (%) 8% 8% 8% 1% 1% 1% 3% 3% 3% 2% 2% 2%Turn Type Split NA Split NA Perm NA Prot NAProtected Phases 4 4 8 8 2 1 6Permitted Phases 2Actuated Green, G (s) 4.6 16.9 16.9 51.2 9.3 65.0Effective Green, g (s) 4.6 16.9 16.9 51.2 9.3 65.0Actuated g/C Ratio 0.05 0.17 0.17 0.51 0.09 0.65Clearance Time (s) 4.5 4.5 4.5 4.5 4.5 4.5Vehicle Extension (s) 3.0 3.0 3.0 3.0 3.0 3.0Lane Grp Cap (vph) 74 286 258 1824 164 2043v/s Ratio Prot c0.01 0.05 c0.11 c0.06 0.29v/s Ratio Perm c0.30v/c Ratio 0.28 0.31 0.64 0.59 0.62 0.45Uniform Delay, d1 46.1 36.4 38.7 17.1 43.6 8.6Progression Factor 1.87 1.00 1.00 0.60 1.00 1.00Incremental Delay, d2 1.2 0.6 5.1 1.1 6.7 0.7Delay (s) 87.3 37.1 43.9 11.4 50.3 9.4Level of Service F D D B D AApproach Delay (s) 87.3 42.0 11.4 13.3Approach LOS F D B B
Intersection SummaryHCM 2000 Control Delay 17.2 HCM 2000 Level of Service BHCM 2000 Volume to Capacity ratio 0.59Actuated Cycle Length (s) 100.0 Sum of lost time (s) 18.0Intersection Capacity Utilization 88.0% ICU Level of Service EAnalysis Period (min) 15c Critical Lane Group

HCM Signalized Intersection Capacity Analysis Children's Hospital 16: Telegraph Ave & 51St Street DC_Existing PM Plus Phase 2
Fehr & Peers Synchro 8 Report
Movement EBL EBT EBR WBL WBT WBR NBL NBT NBR SBL SBT SBRLane ConfigurationsVolume (vph) 324 611 92 56 478 229 81 574 97 262 476 44Ideal Flow (vphpl) 1900 1900 1900 1900 1900 1900 1900 1900 1900 1900 1900 1900Total Lost time (s) 4.0 4.0 4.0 3.5 4.0 4.5 4.0 3.5Lane Util. Factor 0.97 0.95 1.00 0.95 1.00 0.95 1.00 0.95Frpb, ped/bikes 1.00 0.99 1.00 0.97 1.00 0.98 1.00 0.98Flpb, ped/bikes 1.00 1.00 1.00 1.00 1.00 1.00 1.00 1.00Frt 1.00 0.98 1.00 0.95 1.00 0.98 1.00 0.99Flt Protected 0.95 1.00 0.95 1.00 0.95 1.00 0.95 1.00Satd. Flow (prot) 3400 3396 1787 3314 1719 3311 1752 3401Flt Permitted 0.95 1.00 0.95 1.00 0.95 1.00 0.95 1.00Satd. Flow (perm) 3400 3396 1787 3314 1719 3311 1752 3401Peak-hour factor, PHF 1.00 1.00 1.00 1.00 1.00 1.00 1.00 1.00 1.00 1.00 1.00 1.00Adj. Flow (vph) 324 611 92 56 478 229 81 574 97 262 476 44RTOR Reduction (vph) 0 11 0 0 57 0 0 13 0 0 7 0Lane Group Flow (vph) 324 692 0 56 650 0 81 658 0 262 513 0Confl. Peds. (#/hr) 38 52 52 38 92 57 57 92Confl. Bikes (#/hr) 8 15 34 54Heavy Vehicles (%) 3% 3% 3% 1% 1% 1% 5% 5% 5% 3% 3% 3%Turn Type Prot NA Prot NA Prot NA Prot NAProtected Phases 7 4 3 8 5 2 1 6Permitted PhasesActuated Green, G (s) 14.4 29.8 7.4 23.3 7.5 33.3 13.0 39.8Effective Green, g (s) 14.4 29.8 7.4 23.3 7.5 33.3 13.0 39.8Actuated g/C Ratio 0.14 0.30 0.07 0.23 0.08 0.33 0.13 0.40Clearance Time (s) 4.0 4.0 4.0 3.5 4.0 4.5 4.0 3.5Vehicle Extension (s) 3.0 3.0 3.0 3.0 3.0 3.0 3.0 3.0Lane Grp Cap (vph) 489 1012 132 772 128 1102 227 1353v/s Ratio Prot c0.10 0.20 0.03 c0.20 0.05 c0.20 c0.15 0.15v/s Ratio Permv/c Ratio 0.66 0.68 0.42 0.84 0.63 0.60 1.15 0.38Uniform Delay, d1 40.5 30.9 44.3 36.6 44.9 27.8 43.5 21.3Progression Factor 1.00 1.00 1.00 1.00 1.00 1.00 1.18 0.74Incremental Delay, d2 3.4 3.7 2.2 10.8 9.8 2.4 105.5 0.8Delay (s) 43.9 34.7 46.5 47.4 54.7 30.1 156.6 16.6Level of Service D C D D D C F BApproach Delay (s) 37.6 47.3 32.8 63.5Approach LOS D D C E
Intersection SummaryHCM 2000 Control Delay 44.8 HCM 2000 Level of Service DHCM 2000 Volume to Capacity ratio 0.77Actuated Cycle Length (s) 100.0 Sum of lost time (s) 16.5Intersection Capacity Utilization 78.7% ICU Level of Service DAnalysis Period (min) 15c Critical Lane Group
HCM Signalized Intersection Capacity Analysis Children's Hospital 17: SB SR-24 On-Ramp & MLK Way & NB SR-24 Off-Ramp DC_Existing PM Plus Phase 2
Fehr & Peers Synchro 8 Report
Movement EBL EBT EBR WBL WBT WBR NBL NBT NBR SBL SBT SBRLane ConfigurationsVolume (vph) 269 0 0 0 0 1626 0 0 0 0 1581 238Ideal Flow (vphpl) 1900 1900 1900 1900 1900 1900 1900 1900 1900 1900 1900 1900Total Lost time (s) 4.0 4.0 4.0 4.0Lane Util. Factor 0.97 1.00 0.95 0.88Frpb, ped/bikes 1.00 1.00 1.00 1.00Flpb, ped/bikes 1.00 1.00 1.00 1.00Frt 1.00 0.86 1.00 0.85Flt Protected 0.95 1.00 1.00 1.00Satd. Flow (prot) 3273 1627 3574 2814Flt Permitted 0.95 1.00 1.00 1.00Satd. Flow (perm) 3273 1627 3574 2814Peak-hour factor, PHF 1.00 1.00 1.00 1.00 1.00 1.00 1.00 1.00 1.00 1.00 1.00 1.00Adj. Flow (vph) 269 0 0 0 0 1626 0 0 0 0 1581 238RTOR Reduction (vph) 0 0 0 0 0 0 0 0 0 0 0 0Lane Group Flow (vph) 269 0 0 0 0 1626 0 0 0 0 1581 238Confl. Peds. (#/hr) 2 2 18 18Confl. Bikes (#/hr) 9 12Heavy Vehicles (%) 7% 7% 2% 2% 1% 1% 2% 2% 2% 2% 1% 1%Turn Type Prot Free NA customProtected Phases 2 6 FreePermitted Phases FreeActuated Green, G (s) 13.0 50.0 29.0 50.0Effective Green, g (s) 13.0 50.0 29.0 50.0Actuated g/C Ratio 0.26 1.00 0.58 1.00Clearance Time (s) 4.0 4.0Lane Grp Cap (vph) 850 1627 2072 2814v/s Ratio Prot 0.08 0.44 0.08v/s Ratio Perm c1.00v/c Ratio 0.32 1.00 0.76 0.08Uniform Delay, d1 14.9 0.0 7.9 0.0Progression Factor 1.00 1.00 2.66 1.00Incremental Delay, d2 1.0 22.2 2.2 0.0Delay (s) 15.9 22.2 23.3 0.0Level of Service B C C AApproach Delay (s) 15.9 22.2 0.0 20.3Approach LOS B C A C
Intersection SummaryHCM 2000 Control Delay 20.8 HCM 2000 Level of Service CHCM 2000 Volume to Capacity ratio 1.19Actuated Cycle Length (s) 50.0 Sum of lost time (s) 8.0Intersection Capacity Utilization 58.0% ICU Level of Service BAnalysis Period (min) 15c Critical Lane Group

HCM Unsignalized Intersection Capacity Analysis Children's Hospital 18: West Street & 52nd Street DC_Existing PM Plus Phase 2
Fehr & Peers Synchro 8 Report
Movement EBL EBT EBR WBL WBT WBR NBL NBT NBR SBL SBT SBRLane ConfigurationsSign Control Stop Stop Stop StopVolume (vph) 0 113 8 83 97 0 43 0 134 6 52 4Peak Hour Factor 1.00 1.00 1.00 1.00 1.00 1.00 1.00 1.00 1.00 1.00 1.00 1.00Hourly flow rate (vph) 0 113 8 83 97 0 43 0 134 6 52 4
Direction, Lane # EB 1 WB 1 NB 1 NB 2 SB 1Volume Total (vph) 121 180 43 134 62Volume Left (vph) 0 83 43 0 6Volume Right (vph) 8 0 0 134 4Hadj (s) -0.02 0.13 0.50 -0.70 0.01Departure Headway (s) 4.7 4.8 5.8 4.6 5.0Degree Utilization, x 0.16 0.24 0.07 0.17 0.09Capacity (veh/h) 716 715 587 733 665Control Delay (s) 8.6 9.2 8.0 7.4 8.5Approach Delay (s) 8.6 9.2 7.5 8.5Approach LOS A A A A
Intersection SummaryDelay 8.4Level of Service AIntersection Capacity Utilization 40.2% ICU Level of Service AAnalysis Period (min) 15
HCM Unsignalized Intersection Capacity Analysis Children's Hospital 19: Genoa Street & 52nd Street DC_Existing PM Plus Phase 2
Fehr & Peers Synchro 8 Report
Movement EBL EBT EBR WBL WBT WBR NBL NBT NBR SBL SBT SBRLane ConfigurationsSign Control Stop Stop Stop StopVolume (vph) 1 111 2 2 100 36 2 0 3 11 0 3Peak Hour Factor 1.00 1.00 1.00 1.00 1.00 1.00 1.00 1.00 1.00 1.00 1.00 1.00Hourly flow rate (vph) 1 111 2 2 100 36 2 0 3 11 0 3
Direction, Lane # EB 1 WB 1 NB 1 SB 1Volume Total (vph) 114 138 5 14Volume Left (vph) 1 2 2 11Volume Right (vph) 2 36 3 3Hadj (s) 0.01 -0.15 -0.28 0.03Departure Headway (s) 4.1 3.9 4.2 4.5Degree Utilization, x 0.13 0.15 0.01 0.02Capacity (veh/h) 869 911 806 751Control Delay (s) 7.7 7.6 7.2 7.5Approach Delay (s) 7.7 7.6 7.2 7.5Approach LOS A A A A
Intersection SummaryDelay 7.6Level of Service AIntersection Capacity Utilization 20.4% ICU Level of Service AAnalysis Period (min) 15

HCM Unsignalized Intersection Capacity Analysis Children's Hospital 20: Genoa Street & 55th Street DC_Existing PM Plus Phase 2
Fehr & Peers Synchro 8 Report
Movement EBL EBT EBR WBL WBT WBR NBL NBT NBR SBL SBT SBRLane ConfigurationsVolume (veh/h) 12 370 1 10 339 29 8 18 29 27 3 10Sign Control Free Free Stop StopGrade 0% 0% 0% 0%Peak Hour Factor 1.00 1.00 1.00 1.00 1.00 1.00 1.00 1.00 1.00 1.00 1.00 1.00Hourly flow rate (vph) 12 370 1 10 339 29 8 18 29 27 3 10Pedestrians 5 7 3Lane Width (ft) 12.0 12.0 12.0Walking Speed (ft/s) 4.0 4.0 4.0Percent Blockage 0 1 0Right turn flare (veh)Median type None NoneMedian storage veh)Upstream signal (ft) 721pX, platoon unblockedvC, conflicting volume 371 378 792 792 378 809 778 362vC1, stage 1 conf volvC2, stage 2 conf volvCu, unblocked vol 371 378 792 792 378 809 778 362tC, single (s) 4.1 4.1 7.1 6.5 6.2 7.1 6.5 6.2tC, 2 stage (s)tF (s) 2.2 2.2 3.5 4.0 3.3 3.5 4.0 3.3p0 queue free % 99 99 97 94 96 90 99 99cM capacity (veh/h) 1190 1185 294 315 670 267 319 679
Direction, Lane # EB 1 WB 1 NB 1 SB 1Volume Total 383 378 55 40Volume Left 12 10 8 27Volume Right 1 29 29 10cSH 1190 1185 431 320Volume to Capacity 0.01 0.01 0.13 0.13Queue Length 95th (ft) 1 1 11 11Control Delay (s) 0.4 0.3 14.6 17.9Lane LOS A A B CApproach Delay (s) 0.4 0.3 14.6 17.9Approach LOS B C
Intersection SummaryAverage Delay 2.1Intersection Capacity Utilization 40.3% ICU Level of Service AAnalysis Period (min) 15
HCM Unsignalized Intersection Capacity Analysis Children's Hospital 21: MLK Way & RIRO Main Garage DC_Existing PM Plus Phase 2
Fehr & Peers Synchro 8 Report
Movement WBL WBR NBT NBR SBL SBTLane ConfigurationsVolume (veh/h) 0 123 1980 34 0 1689Sign Control Stop Free FreeGrade 0% 0% 0%Peak Hour Factor 1.00 1.00 1.00 1.00 1.00 1.00Hourly flow rate (vph) 0 123 1980 34 0 1689PedestriansLane Width (ft)Walking Speed (ft/s)Percent BlockageRight turn flare (veh)Median type None NoneMedian storage veh)Upstream signal (ft) 154 137pX, platoon unblocked 0.76 0.69 0.69vC, conflicting volume 2560 677 2014vC1, stage 1 conf volvC2, stage 2 conf volvCu, unblocked vol 694 0 909tC, single (s) 6.8 6.9 4.1tC, 2 stage (s)tF (s) 3.5 3.3 2.2p0 queue free % 100 84 100cM capacity (veh/h) 288 751 516
Direction, Lane # WB 1 NB 1 NB 2 NB 3 SB 1 SB 2 SB 3Volume Total 123 792 792 430 563 563 563Volume Left 0 0 0 0 0 0 0Volume Right 123 0 0 34 0 0 0cSH 751 1700 1700 1700 1700 1700 1700Volume to Capacity 0.16 0.47 0.47 0.25 0.33 0.33 0.33Queue Length 95th (ft) 15 0 0 0 0 0 0Control Delay (s) 10.7 0.0 0.0 0.0 0.0 0.0 0.0Lane LOS BApproach Delay (s) 10.7 0.0 0.0Approach LOS B
Intersection SummaryAverage Delay 0.3Intersection Capacity Utilization 53.3% ICU Level of Service AAnalysis Period (min) 15

HCM Unsignalized Intersection Capacity Analysis Children's Hospital 22: MLK Way & RIRO Main Plaza DC_Existing PM Plus Phase 2
Fehr & Peers Synchro 8 Report
Movement WBL WBR NBT NBR SBL SBTLane ConfigurationsVolume (veh/h) 0 0 1895 0 0 1792Sign Control Stop Free FreeGrade 0% 0% 0%Peak Hour Factor 1.00 1.00 1.00 1.00 1.00 1.00Hourly flow rate (vph) 0 0 1895 0 0 1792PedestriansLane Width (ft)Walking Speed (ft/s)Percent BlockageRight turn flare (veh)Median type None NoneMedian storage veh)Upstream signal (ft) 424 204pX, platoon unblocked 0.79vC, conflicting volume 2492 632 1895vC1, stage 1 conf volvC2, stage 2 conf volvCu, unblocked vol 1954 632 1895tC, single (s) 6.8 6.9 4.1tC, 2 stage (s)tF (s) 3.5 3.3 2.2p0 queue free % 100 100 100cM capacity (veh/h) 44 423 311
Direction, Lane # WB 1 NB 1 NB 2 NB 3 SB 1 SB 2 SB 3Volume Total 0 758 758 379 597 597 597Volume Left 0 0 0 0 0 0 0Volume Right 0 0 0 0 0 0 0cSH 1700 1700 1700 1700 1700 1700 1700Volume to Capacity 0.00 0.45 0.45 0.22 0.35 0.35 0.35Queue Length 95th (ft) 0 0 0 0 0 0 0Control Delay (s) 0.0 0.0 0.0 0.0 0.0 0.0 0.0Lane LOS AApproach Delay (s) 0.0 0.0 0.0Approach LOS A
Intersection SummaryAverage Delay 0.0Intersection Capacity Utilization 39.9% ICU Level of Service AAnalysis Period (min) 15
HCM Unsignalized Intersection Capacity Analysis Children's Hospital 24: 51St Street & 52nd Street DC_Existing PM Plus Phase 2
Fehr & Peers Synchro 8 Report
Intersection Sign configuration not allowed in HCM analysis.

HCM Signalized Intersection Capacity Analysis Children's Hospital1: MLK Way & 55th Street DC_2020 AM Plus Phase 1
Fehr & Peers Synchro 8 Report
Movement EBL EBT EBR WBL WBT WBR NBU NBL NBT NBR SBL SBTLane ConfigurationsVolume (vph) 20 180 230 60 240 80 21 150 1381 72 90 1332Ideal Flow (vphpl) 1900 1900 1900 1900 1900 1900 1900 1900 1900 1900 1900 1900Total Lost time (s) 5.0 5.0 4.5 5.0 4.5 5.0Lane Util. Factor 1.00 1.00 1.00 0.91 1.00 0.91Frpb, ped/bikes 0.98 0.99 1.00 1.00 1.00 1.00Flpb, ped/bikes 1.00 1.00 1.00 1.00 1.00 1.00Frt 0.93 0.97 1.00 0.99 1.00 0.99Flt Protected 1.00 0.99 0.95 1.00 0.95 1.00Satd. Flow (prot) 1703 1747 1770 5027 1770 5046Flt Permitted 0.98 0.77 0.95 1.00 0.95 1.00Satd. Flow (perm) 1664 1360 1770 5027 1770 5046Peak-hour factor, PHF 1.00 1.00 1.00 1.00 1.00 1.00 1.00 1.00 1.00 1.00 1.00 1.00Adj. Flow (vph) 20 180 230 60 240 80 21 150 1381 72 90 1332RTOR Reduction (vph) 0 52 0 0 12 0 0 0 5 0 0 4Lane Group Flow (vph) 0 378 0 0 368 0 0 171 1448 0 90 1378Confl. Peds. (#/hr) 10 19 19 10 28Confl. Bikes (#/hr) 21 20 8Heavy Vehicles (%) 1% 1% 1% 4% 4% 4% 2% 2% 2% 2% 2% 2%Turn Type Perm NA Perm NA Prot Prot NA Prot NAProtected Phases 4 8 5 5 2 1 6Permitted Phases 4 8Actuated Green, G (s) 27.7 27.7 14.4 41.8 6.0 33.4Effective Green, g (s) 27.7 27.7 14.4 41.8 6.0 33.4Actuated g/C Ratio 0.31 0.31 0.16 0.46 0.07 0.37Clearance Time (s) 5.0 5.0 4.5 5.0 4.5 5.0Vehicle Extension (s) 3.0 3.0 3.0 3.0 3.0 3.0Lane Grp Cap (vph) 512 418 283 2334 118 1872v/s Ratio Prot 0.10 c0.29 0.05 c0.27v/s Ratio Perm 0.23 c0.27v/c Ratio 0.74 0.88 0.60 0.62 0.76 0.74Uniform Delay, d1 27.9 29.6 35.2 18.1 41.3 24.5Progression Factor 1.00 1.00 0.55 0.26 1.00 1.00Incremental Delay, d2 5.5 19.0 3.3 1.1 24.8 2.6Delay (s) 33.4 48.6 22.7 5.8 66.1 27.1Level of Service C D C A E CApproach Delay (s) 33.4 48.6 7.6 29.5Approach LOS C D A C
Intersection SummaryHCM 2000 Control Delay 22.7 HCM 2000 Level of Service CHCM 2000 Volume to Capacity ratio 0.78Actuated Cycle Length (s) 90.0 Sum of lost time (s) 14.5Intersection Capacity Utilization 90.1% ICU Level of Service EAnalysis Period (min) 15c Critical Lane Group
HCM Signalized Intersection Capacity Analysis Children's Hospital1: MLK Way & 55th Street DC_2020 AM Plus Phase 1
Fehr & Peers Synchro 8 Report
Movement SBRLane ConfigurationsVolume (vph) 50Ideal Flow (vphpl) 1900Total Lost time (s)Lane Util. FactorFrpb, ped/bikesFlpb, ped/bikesFrtFlt ProtectedSatd. Flow (prot)Flt PermittedSatd. Flow (perm)Peak-hour factor, PHF 1.00Adj. Flow (vph) 50RTOR Reduction (vph) 0Lane Group Flow (vph) 0Confl. Peds. (#/hr) 16Confl. Bikes (#/hr) 10Heavy Vehicles (%) 2%Turn TypeProtected PhasesPermitted PhasesActuated Green, G (s)Effective Green, g (s)Actuated g/C RatioClearance Time (s)Vehicle Extension (s)Lane Grp Cap (vph)v/s Ratio Protv/s Ratio Permv/c RatioUniform Delay, d1Progression FactorIncremental Delay, d2Delay (s)Level of ServiceApproach Delay (s)Approach LOS
Intersection Summary

HCM Unsignalized Intersection Capacity Analysis Children's Hospital2: Dover Street & 55th Street DC_2020 AM Plus Phase 1
Fehr & Peers Synchro 8 Report
Movement EBL EBT EBR WBL WBT WBR NBL NBT NBR SBL SBT SBRLane ConfigurationsVolume (veh/h) 30 302 10 30 320 10 10 10 20 10 10 30Sign Control Free Free Stop StopGrade 0% 0% 0% 0%Peak Hour Factor 1.00 1.00 1.00 1.00 1.00 1.00 1.00 1.00 1.00 1.00 1.00 1.00Hourly flow rate (vph) 30 302 10 30 320 10 10 10 20 10 10 30Pedestrians 12 26 20 8Lane Width (ft) 12.0 12.0 12.0 12.0Walking Speed (ft/s) 4.0 4.0 4.0 4.0Percent Blockage 1 2 2 1Right turn flare (veh)Median type None NoneMedian storage veh)Upstream signal (ft) 641 677pX, platoon unblocked 0.89 0.89 0.89 0.89 0.89 0.89vC, conflicting volume 338 332 819 785 353 811 785 345vC1, stage 1 conf volvC2, stage 2 conf volvCu, unblocked vol 196 332 736 698 353 727 698 204tC, single (s) 4.1 4.1 7.1 6.5 6.2 7.1 6.5 6.2tC, 2 stage (s)tF (s) 2.2 2.2 3.5 4.0 3.3 3.5 4.0 3.3p0 queue free % 98 97 96 97 97 96 97 96cM capacity (veh/h) 1203 1196 259 304 669 262 301 731
Direction, Lane # EB 1 WB 1 NB 1 SB 1Volume Total 342 360 40 50Volume Left 30 30 10 10Volume Right 10 10 20 30cSH 1203 1196 394 445Volume to Capacity 0.02 0.03 0.10 0.11Queue Length 95th (ft) 2 2 8 9Control Delay (s) 0.9 0.9 15.2 14.1Lane LOS A A C BApproach Delay (s) 0.9 0.9 15.2 14.1Approach LOS C B
Intersection SummaryAverage Delay 2.5Intersection Capacity Utilization 41.1% ICU Level of Service AAnalysis Period (min) 15
HCM Signalized Intersection Capacity Analysis Children's Hospital3: 55th Street & Shattuck Ave DC_2020 AM Plus Phase 1
Fehr & Peers Synchro 8 Report
Movement EBL EBT EBR WBL WBT WBR NBL NBT NBR SBL SBT SBRLane ConfigurationsVolume (vph) 60 232 60 30 270 50 40 460 30 30 570 40Ideal Flow (vphpl) 1900 1900 1900 1900 1900 1900 1900 1900 1900 1900 1900 1900Total Lost time (s) 3.0 3.0 5.0 5.0Lane Util. Factor 1.00 1.00 1.00 1.00Frpb, ped/bikes 0.99 0.99 1.00 1.00Flpb, ped/bikes 1.00 1.00 1.00 1.00Frt 0.98 0.98 0.99 0.99Flt Protected 0.99 1.00 1.00 1.00Satd. Flow (prot) 1727 1787 1836 1855Flt Permitted 0.86 0.96 0.93 0.96Satd. Flow (perm) 1493 1719 1710 1792Peak-hour factor, PHF 1.00 1.00 1.00 1.00 1.00 1.00 1.00 1.00 1.00 1.00 1.00 1.00Adj. Flow (vph) 60 232 60 30 270 50 40 460 30 30 570 40RTOR Reduction (vph) 0 9 0 0 8 0 0 3 0 0 3 0Lane Group Flow (vph) 0 343 0 0 342 0 0 527 0 0 637 0Confl. Peds. (#/hr) 8 17 17 8 10 23 23 10Confl. Bikes (#/hr) 29 13 17 32Heavy Vehicles (%) 5% 5% 5% 3% 3% 3% 2% 2% 2% 1% 1% 1%Turn Type Perm NA Perm NA Perm NA Perm NAProtected Phases 2 6 4 8Permitted Phases 2 6 4 4 8Actuated Green, G (s) 25.0 25.0 47.0 47.0Effective Green, g (s) 25.0 25.0 47.0 47.0Actuated g/C Ratio 0.31 0.31 0.59 0.59Clearance Time (s) 3.0 3.0 5.0 5.0Lane Grp Cap (vph) 466 537 1004 1052v/s Ratio Protv/s Ratio Perm c0.23 0.20 0.31 c0.36v/c Ratio 0.74 0.64 0.53 0.61Uniform Delay, d1 24.6 23.6 9.8 10.6Progression Factor 1.00 1.00 1.00 1.00Incremental Delay, d2 9.9 5.7 2.0 2.6Delay (s) 34.5 29.3 11.8 13.2Level of Service C C B BApproach Delay (s) 34.5 29.3 11.8 13.2Approach LOS C C B B
Intersection SummaryHCM 2000 Control Delay 19.8 HCM 2000 Level of Service BHCM 2000 Volume to Capacity ratio 0.65Actuated Cycle Length (s) 80.0 Sum of lost time (s) 8.0Intersection Capacity Utilization 80.8% ICU Level of Service DAnalysis Period (min) 15c Critical Lane Group

HCM Signalized Intersection Capacity Analysis Children's Hospital4: 55th Street & Telegraph Ave DC_2020 AM Plus Phase 1
Fehr & Peers Synchro 8 Report
Movement EBL EBT EBR WBL WBT WBR NBL NBT NBR SBL SBT SBRLane ConfigurationsVolume (vph) 162 20 90 40 10 10 70 842 50 40 984 260Ideal Flow (vphpl) 1900 1900 1900 1900 1900 1900 1900 1900 1900 1900 1900 1900Total Lost time (s) 4.5 4.5 4.5 4.5 4.5 4.5Lane Util. Factor 1.00 1.00 1.00 0.95 1.00 0.95Frpb, ped/bikes 0.99 0.99 1.00 0.99 1.00 0.98Flpb, ped/bikes 1.00 0.99 1.00 1.00 0.99 1.00Frt 0.96 0.98 1.00 0.99 1.00 0.97Flt Protected 0.97 0.97 0.95 1.00 0.95 1.00Satd. Flow (prot) 1649 1709 1762 3491 1767 3409Flt Permitted 0.78 0.76 0.17 1.00 0.28 1.00Satd. Flow (perm) 1329 1338 310 3491 523 3409Peak-hour factor, PHF 1.00 1.00 1.00 1.00 1.00 1.00 1.00 1.00 1.00 1.00 1.00 1.00Adj. Flow (vph) 162 20 90 40 10 10 70 842 50 40 984 260RTOR Reduction (vph) 0 30 0 0 7 0 0 5 0 0 27 0Lane Group Flow (vph) 0 242 0 0 53 0 70 887 0 40 1217 0Confl. Peds. (#/hr) 8 15 15 8 17 23 23 17Confl. Bikes (#/hr) 20 20 56 36Heavy Vehicles (%) 5% 5% 5% 4% 4% 4% 2% 2% 2% 1% 1% 1%Turn Type Perm NA Perm NA Perm NA Perm NAProtected Phases 4 8 2 6Permitted Phases 4 8 2 6Actuated Green, G (s) 18.1 18.1 42.9 42.9 42.9 42.9Effective Green, g (s) 18.1 18.1 42.9 42.9 42.9 42.9Actuated g/C Ratio 0.26 0.26 0.61 0.61 0.61 0.61Clearance Time (s) 4.5 4.5 4.5 4.5 4.5 4.5Vehicle Extension (s) 3.0 3.0 3.0 3.0 3.0 3.0Lane Grp Cap (vph) 343 345 189 2139 320 2089v/s Ratio Prot 0.25 c0.36v/s Ratio Perm c0.18 0.04 0.23 0.08v/c Ratio 0.71 0.15 0.37 0.41 0.12 0.58Uniform Delay, d1 23.5 20.0 6.8 7.0 5.7 8.2Progression Factor 1.00 1.00 1.00 1.00 1.00 1.00Incremental Delay, d2 6.5 0.2 5.5 0.6 0.8 1.2Delay (s) 30.0 20.2 12.3 7.6 6.5 9.4Level of Service C C B A A AApproach Delay (s) 30.0 20.2 8.0 9.3Approach LOS C C A A
Intersection SummaryHCM 2000 Control Delay 11.2 HCM 2000 Level of Service BHCM 2000 Volume to Capacity ratio 0.62Actuated Cycle Length (s) 70.0 Sum of lost time (s) 9.0Intersection Capacity Utilization 69.4% ICU Level of Service CAnalysis Period (min) 15c Critical Lane Group
HCM Unsignalized Intersection Capacity Analysis Children's Hospital5: MLK Way & 54th Street DC_2020 AM Plus Phase 1
Fehr & Peers Synchro 8 Report
Movement EBL EBT EBR WBL WBT WBR NBU NBL NBT NBR SBL SBTLane ConfigurationsVolume (veh/h) 10 10 50 10 10 10 11 20 1572 26 20 1593Sign Control Stop Stop Free FreeGrade 0% 0% 0% 0%Peak Hour Factor 1.00 1.00 1.00 1.00 1.00 1.00 1.00 1.00 1.00 1.00 1.00 1.00Hourly flow rate (vph) 10 10 50 10 10 10 0 20 1572 26 20 1593Pedestrians 10 8 11Lane Width (ft) 12.0 12.0 12.0Walking Speed (ft/s) 4.0 4.0 4.0Percent Blockage 1 1 1Right turn flare (veh)Median type None NoneMedian storage veh)Upstream signal (ft) 299 294pX, platoon unblocked 0.85 0.85 0.77 0.85 0.85 0.83 0.00 0.77 0.83vC, conflicting volume 2227 3294 557 2270 3286 545 0 1613 1606vC1, stage 1 conf volvC2, stage 2 conf volvCu, unblocked vol 486 1734 0 536 1725 0 0 746 1007tC, single (s) 7.5 6.5 6.9 7.5 6.5 6.9 0.0 4.1 4.1tC, 2 stage (s)tF (s) *5.0 *5.0 *5.0 *4.5 *4.5 *4.5 0.0 2.2 2.2p0 queue free % 96 85 91 96 85 98 0 97 96cM capacity (veh/h) 251 66 544 228 68 658 0 654 568
Direction, Lane # EB 1 WB 1 NB 1 NB 2 NB 3 SB 1 SB 2 SB 3Volume Total 70 30 413 786 419 418 796 408Volume Left 10 10 20 0 0 20 0 0Volume Right 50 10 0 0 26 0 0 10cSH 246 146 654 1700 1700 568 1700 1700Volume to Capacity 0.28 0.21 0.03 0.46 0.25 0.04 0.47 0.24Queue Length 95th (ft) 28 18 2 0 0 3 0 0Control Delay (s) 25.3 35.9 0.9 0.0 0.0 1.1 0.0 0.0Lane LOS D E A AApproach Delay (s) 25.3 35.9 0.2 0.3Approach LOS D E
Intersection SummaryAverage Delay 1.1Intersection Capacity Utilization 67.4% ICU Level of Service CAnalysis Period (min) 15
* User Entered Value

HCM Unsignalized Intersection Capacity Analysis Children's Hospital5: MLK Way & 54th Street DC_2020 AM Plus Phase 1
Fehr & Peers Synchro 8 Report
Movement SBRLane ConfigurationsVolume (veh/h) 10Sign ControlGradePeak Hour Factor 1.00Hourly flow rate (vph) 10PedestriansLane Width (ft)Walking Speed (ft/s)Percent BlockageRight turn flare (veh)Median typeMedian storage veh)Upstream signal (ft)pX, platoon unblockedvC, conflicting volumevC1, stage 1 conf volvC2, stage 2 conf volvCu, unblocked voltC, single (s)tC, 2 stage (s)tF (s)p0 queue free %cM capacity (veh/h)
Direction, Lane #
HCM Unsignalized Intersection Capacity Analysis Children's Hospital6: Dover Street & 54th Street DC_2020 AM Plus Phase 1
Fehr & Peers Synchro 8 Report
Movement EBL EBT EBR WBL WBT WBR NBL NBT NBR SBL SBT SBRLane ConfigurationsVolume (veh/h) 10 16 10 10 10 10 10 20 20 10 40 10Sign Control Stop Stop Free FreeGrade 0% 0% 0% 0%Peak Hour Factor 1.00 1.00 1.00 1.00 1.00 1.00 1.00 1.00 1.00 1.00 1.00 1.00Hourly flow rate (vph) 10 16 10 10 10 10 10 20 20 10 40 10Pedestrians 13 19 3 8Lane Width (ft) 12.0 12.0 12.0 12.0Walking Speed (ft/s) 4.0 4.0 4.0 4.0Percent Blockage 1 2 0 1Right turn flare (veh)Median type None NoneMedian storage veh)Upstream signal (ft)pX, platoon unblockedvC, conflicting volume 151 157 61 155 152 57 63 59vC1, stage 1 conf volvC2, stage 2 conf volvCu, unblocked vol 151 157 61 155 152 57 63 59tC, single (s) 7.1 6.5 6.2 7.1 6.5 6.2 4.1 4.1tC, 2 stage (s)tF (s) 3.5 4.0 3.3 3.5 4.0 3.3 2.2 2.2p0 queue free % 99 98 99 99 99 99 99 99cM capacity (veh/h) 767 710 996 756 714 992 1536 1533
Direction, Lane # EB 1 WB 1 NB 1 SB 1Volume Total 36 30 50 60Volume Left 10 10 10 10Volume Right 10 10 20 10cSH 789 804 1536 1533Volume to Capacity 0.05 0.04 0.01 0.01Queue Length 95th (ft) 4 3 0 0Control Delay (s) 9.8 9.6 1.5 1.3Lane LOS A A A AApproach Delay (s) 9.8 9.6 1.5 1.3Approach LOS A A
Intersection SummaryAverage Delay 4.5Intersection Capacity Utilization 21.1% ICU Level of Service AAnalysis Period (min) 15

HCM Unsignalized Intersection Capacity Analysis Children's Hospital7: Shattuck Ave & 54th Street DC_2020 AM Plus Phase 1
Fehr & Peers Synchro 8 Report
Movement EBL EBR NBL NBT SBT SBRLane ConfigurationsVolume (veh/h) 10 26 20 520 630 10Sign Control Stop Free FreeGrade 0% 0% 0%Peak Hour Factor 1.00 1.00 1.00 1.00 1.00 1.00Hourly flow rate (vph) 10 26 20 520 630 10Pedestrians 12 3 2Lane Width (ft) 12.0 12.0 12.0Walking Speed (ft/s) 4.0 4.0 4.0Percent Blockage 1 0 0Right turn flare (veh)Median type None NoneMedian storage veh)Upstream signal (ft) 550 282pX, platoon unblocked 0.79 0.79 0.79vC, conflicting volume 1209 650 652vC1, stage 1 conf volvC2, stage 2 conf volvCu, unblocked vol 1118 419 422tC, single (s) 6.4 6.2 4.1tC, 2 stage (s)tF (s) 3.5 3.3 2.2p0 queue free % 94 95 98cM capacity (veh/h) 176 496 886
Direction, Lane # EB 1 NB 1 SB 1Volume Total 36 540 640Volume Left 10 20 0Volume Right 26 0 10cSH 330 886 1700Volume to Capacity 0.11 0.02 0.38Queue Length 95th (ft) 9 2 0Control Delay (s) 17.3 0.6 0.0Lane LOS C AApproach Delay (s) 17.3 0.6 0.0Approach LOS C
Intersection SummaryAverage Delay 0.8Intersection Capacity Utilization 54.5% ICU Level of Service AAnalysis Period (min) 15
HCM Signalized Intersection Capacity Analysis Children's Hospital8: MLK Way & 53rd Street DC_2020 AM Plus Phase 1
Fehr & Peers Synchro 8 Report
Movement EBL EBT EBR WBL WBT WBR NBL NBT NBR SBL SBT SBRLane ConfigurationsVolume (vph) 10 1 49 60 10 18 30 1611 93 4 1675 10Ideal Flow (vphpl) 1900 1900 1900 1900 1900 1900 1900 1900 1900 1900 1900 1900Total Lost time (s) 5.0 5.0 4.0 3.5 4.0 3.5Lane Util. Factor 1.00 1.00 1.00 0.91 1.00 0.91Frpb, ped/bikes 0.98 1.00 1.00 1.00 1.00 1.00Flpb, ped/bikes 1.00 0.99 1.00 1.00 1.00 1.00Frt 0.89 0.97 1.00 0.99 1.00 1.00Flt Protected 0.99 0.97 0.95 1.00 0.95 1.00Satd. Flow (prot) 1611 1767 1770 5025 1787 5128Flt Permitted 0.95 0.77 0.95 1.00 0.95 1.00Satd. Flow (perm) 1548 1400 1770 5025 1787 5128Peak-hour factor, PHF 1.00 1.00 1.00 1.00 1.00 1.00 1.00 1.00 1.00 1.00 1.00 1.00Adj. Flow (vph) 10 1 49 60 10 18 30 1611 93 4 1675 10RTOR Reduction (vph) 0 40 0 0 13 0 0 4 0 0 0 0Lane Group Flow (vph) 0 20 0 0 75 0 30 1700 0 4 1685 0Confl. Peds. (#/hr) 10 17 17 10 17 26Confl. Bikes (#/hr) 7 17Heavy Vehicles (%) 2% 2% 2% 0% 0% 0% 2% 2% 2% 1% 1% 1%Turn Type Perm NA Perm NA Prot NA Prot NAProtected Phases 4 8 5 2 1 6Permitted Phases 4 8Actuated Green, G (s) 16.7 16.7 4.5 59.0 1.8 56.3Effective Green, g (s) 16.7 16.7 4.5 59.0 1.8 56.3Actuated g/C Ratio 0.19 0.19 0.05 0.66 0.02 0.63Clearance Time (s) 5.0 5.0 4.0 3.5 4.0 3.5Vehicle Extension (s) 3.0 3.0 3.0 3.0 3.0 3.0Lane Grp Cap (vph) 287 259 88 3294 35 3207v/s Ratio Prot 0.02 c0.34 0.00 c0.33v/s Ratio Perm 0.01 c0.05v/c Ratio 0.07 0.29 0.34 0.52 0.11 0.53Uniform Delay, d1 30.2 31.5 41.3 8.1 43.3 9.4Progression Factor 1.00 1.00 1.17 0.56 0.52 0.26Incremental Delay, d2 0.1 0.6 1.8 0.5 1.1 0.5Delay (s) 30.3 32.2 50.1 5.0 23.6 2.9Level of Service C C D A C AApproach Delay (s) 30.3 32.2 5.8 3.0Approach LOS C C A A
Intersection SummaryHCM 2000 Control Delay 5.5 HCM 2000 Level of Service AHCM 2000 Volume to Capacity ratio 0.49Actuated Cycle Length (s) 90.0 Sum of lost time (s) 12.5Intersection Capacity Utilization 58.7% ICU Level of Service BAnalysis Period (min) 15c Critical Lane Group
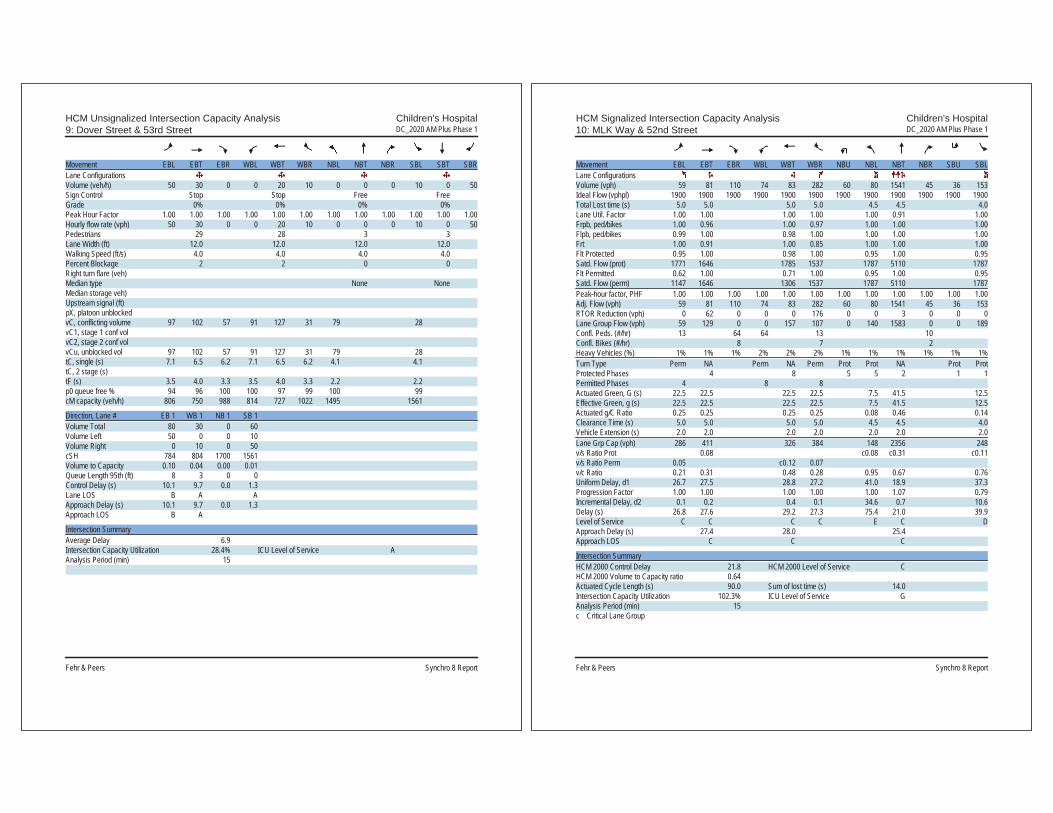
HCM Unsignalized Intersection Capacity Analysis Children's Hospital9: Dover Street & 53rd Street DC_2020 AM Plus Phase 1
Fehr & Peers Synchro 8 Report
Movement EBL EBT EBR WBL WBT WBR NBL NBT NBR SBL SBT SBRLane ConfigurationsVolume (veh/h) 50 30 0 0 20 10 0 0 0 10 0 50Sign Control Stop Stop Free FreeGrade 0% 0% 0% 0%Peak Hour Factor 1.00 1.00 1.00 1.00 1.00 1.00 1.00 1.00 1.00 1.00 1.00 1.00Hourly flow rate (vph) 50 30 0 0 20 10 0 0 0 10 0 50Pedestrians 29 28 3 3Lane Width (ft) 12.0 12.0 12.0 12.0Walking Speed (ft/s) 4.0 4.0 4.0 4.0Percent Blockage 2 2 0 0Right turn flare (veh)Median type None NoneMedian storage veh)Upstream signal (ft)pX, platoon unblockedvC, conflicting volume 97 102 57 91 127 31 79 28vC1, stage 1 conf volvC2, stage 2 conf volvCu, unblocked vol 97 102 57 91 127 31 79 28tC, single (s) 7.1 6.5 6.2 7.1 6.5 6.2 4.1 4.1tC, 2 stage (s)tF (s) 3.5 4.0 3.3 3.5 4.0 3.3 2.2 2.2p0 queue free % 94 96 100 100 97 99 100 99cM capacity (veh/h) 806 750 988 814 727 1022 1495 1561
Direction, Lane # EB 1 WB 1 NB 1 SB 1Volume Total 80 30 0 60Volume Left 50 0 0 10Volume Right 0 10 0 50cSH 784 804 1700 1561Volume to Capacity 0.10 0.04 0.00 0.01Queue Length 95th (ft) 8 3 0 0Control Delay (s) 10.1 9.7 0.0 1.3Lane LOS B A AApproach Delay (s) 10.1 9.7 0.0 1.3Approach LOS B A
Intersection SummaryAverage Delay 6.9Intersection Capacity Utilization 28.4% ICU Level of Service AAnalysis Period (min) 15
HCM Signalized Intersection Capacity Analysis Children's Hospital10: MLK Way & 52nd Street DC_2020 AM Plus Phase 1
Fehr & Peers Synchro 8 Report
Movement EBL EBT EBR WBL WBT WBR NBU NBL NBT NBR SBU SBLLane ConfigurationsVolume (vph) 59 81 110 74 83 282 60 80 1541 45 36 153Ideal Flow (vphpl) 1900 1900 1900 1900 1900 1900 1900 1900 1900 1900 1900 1900Total Lost time (s) 5.0 5.0 5.0 5.0 4.5 4.5 4.0Lane Util. Factor 1.00 1.00 1.00 1.00 1.00 0.91 1.00Frpb, ped/bikes 1.00 0.96 1.00 0.97 1.00 1.00 1.00Flpb, ped/bikes 0.99 1.00 0.98 1.00 1.00 1.00 1.00Frt 1.00 0.91 1.00 0.85 1.00 1.00 1.00Flt Protected 0.95 1.00 0.98 1.00 0.95 1.00 0.95Satd. Flow (prot) 1771 1646 1785 1537 1787 5110 1787Flt Permitted 0.62 1.00 0.71 1.00 0.95 1.00 0.95Satd. Flow (perm) 1147 1646 1306 1537 1787 5110 1787Peak-hour factor, PHF 1.00 1.00 1.00 1.00 1.00 1.00 1.00 1.00 1.00 1.00 1.00 1.00Adj. Flow (vph) 59 81 110 74 83 282 60 80 1541 45 36 153RTOR Reduction (vph) 0 62 0 0 0 176 0 0 3 0 0 0Lane Group Flow (vph) 59 129 0 0 157 107 0 140 1583 0 0 189Confl. Peds. (#/hr) 13 64 64 13 10Confl. Bikes (#/hr) 8 7 2Heavy Vehicles (%) 1% 1% 1% 2% 2% 2% 1% 1% 1% 1% 1% 1%Turn Type Perm NA Perm NA Perm Prot Prot NA Prot ProtProtected Phases 4 8 5 5 2 1 1Permitted Phases 4 8 8Actuated Green, G (s) 22.5 22.5 22.5 22.5 7.5 41.5 12.5Effective Green, g (s) 22.5 22.5 22.5 22.5 7.5 41.5 12.5Actuated g/C Ratio 0.25 0.25 0.25 0.25 0.08 0.46 0.14Clearance Time (s) 5.0 5.0 5.0 5.0 4.5 4.5 4.0Vehicle Extension (s) 2.0 2.0 2.0 2.0 2.0 2.0 2.0Lane Grp Cap (vph) 286 411 326 384 148 2356 248v/s Ratio Prot 0.08 c0.08 c0.31 c0.11v/s Ratio Perm 0.05 c0.12 0.07v/c Ratio 0.21 0.31 0.48 0.28 0.95 0.67 0.76Uniform Delay, d1 26.7 27.5 28.8 27.2 41.0 18.9 37.3Progression Factor 1.00 1.00 1.00 1.00 1.00 1.07 0.79Incremental Delay, d2 0.1 0.2 0.4 0.1 34.6 0.7 10.6Delay (s) 26.8 27.6 29.2 27.3 75.4 21.0 39.9Level of Service C C C C E C DApproach Delay (s) 27.4 28.0 25.4Approach LOS C C C
Intersection SummaryHCM 2000 Control Delay 21.8 HCM 2000 Level of Service CHCM 2000 Volume to Capacity ratio 0.64Actuated Cycle Length (s) 90.0 Sum of lost time (s) 14.0Intersection Capacity Utilization 102.3% ICU Level of Service GAnalysis Period (min) 15c Critical Lane Group

HCM Signalized Intersection Capacity Analysis Children's Hospital10: MLK Way & 52nd Street DC_2020 AM Plus Phase 1
Fehr & Peers Synchro 8 Report
Movement SBT SBRLane ConfigurationsVolume (vph) 1578 7Ideal Flow (vphpl) 1900 1900Total Lost time (s) 4.5Lane Util. Factor 0.91Frpb, ped/bikes 1.00Flpb, ped/bikes 1.00Frt 1.00Flt Protected 1.00Satd. Flow (prot) 5131Flt Permitted 1.00Satd. Flow (perm) 5131Peak-hour factor, PHF 1.00 1.00Adj. Flow (vph) 1578 7RTOR Reduction (vph) 0 0Lane Group Flow (vph) 1585 0Confl. Peds. (#/hr) 13Confl. Bikes (#/hr) 13Heavy Vehicles (%) 1% 1%Turn Type NAProtected Phases 6Permitted PhasesActuated Green, G (s) 46.0Effective Green, g (s) 46.0Actuated g/C Ratio 0.51Clearance Time (s) 4.5Vehicle Extension (s) 2.0Lane Grp Cap (vph) 2622v/s Ratio Prot 0.31v/s Ratio Permv/c Ratio 0.60Uniform Delay, d1 15.6Progression Factor 0.79Incremental Delay, d2 0.9Delay (s) 13.2Level of Service BApproach Delay (s) 16.1Approach LOS B
Intersection Summary
HCM Signalized Intersection Capacity Analysis Children's Hospital11: 52nd Street & Garage DC_2020 AM Plus Phase 1
Fehr & Peers Synchro 8 Report
Movement EBL EBT EBR WBL WBT WBR NBL NBT NBR SBL SBT SBRLane ConfigurationsVolume (vph) 4 246 9 5 397 2 15 7 10 0 2 15Ideal Flow (vphpl) 1900 1900 1900 1900 1900 1900 1900 1900 1900 1900 1900 1900Total Lost time (s) 3.0 3.0 3.0 3.0Lane Util. Factor 0.95 0.95 1.00 1.00Frpb, ped/bikes 0.99 1.00 0.94 0.99Flpb, ped/bikes 1.00 1.00 1.00 1.00Frt 0.99 1.00 0.96 0.88Flt Protected 1.00 1.00 0.98 1.00Satd. Flow (prot) 3498 3600 1447 1655Flt Permitted 0.95 0.95 0.94 1.00Satd. Flow (perm) 3340 3429 1386 1655Peak-hour factor, PHF 1.00 1.00 1.00 1.00 1.00 1.00 1.00 1.00 1.00 1.00 1.00 1.00Adj. Flow (vph) 4 246 9 5 397 2 15 7 10 0 2 15RTOR Reduction (vph) 0 5 0 0 1 0 0 5 0 0 8 0Lane Group Flow (vph) 0 254 0 0 403 0 0 27 0 0 9 0Confl. Peds. (#/hr) 23 72 72 23 263 263Confl. Bikes (#/hr) 8 7 2Heavy Vehicles (%) 2% 2% 2% 0% 0% 0% 16% 16% 16% 0% 0% 0%Turn Type Prot NA Perm NA Perm NA NAProtected Phases 5 2 6 4 8Permitted Phases 6 4 8Actuated Green, G (s) 21.0 14.0 23.0 23.0Effective Green, g (s) 21.0 14.0 23.0 23.0Actuated g/C Ratio 0.42 0.28 0.46 0.46Clearance Time (s) 3.0 3.0 3.0 3.0Lane Grp Cap (vph) 1415 960 637 761v/s Ratio Prot c0.01 0.01v/s Ratio Perm 0.06 c0.12 c0.02v/c Ratio 0.18 0.42 0.04 0.01Uniform Delay, d1 9.1 14.7 7.4 7.3Progression Factor 1.00 1.00 1.00 1.00Incremental Delay, d2 0.3 1.4 0.1 0.0Delay (s) 9.4 16.0 7.6 7.4Level of Service A B A AApproach Delay (s) 9.4 16.0 7.6 7.4Approach LOS A B A A
Intersection SummaryHCM 2000 Control Delay 13.0 HCM 2000 Level of Service BHCM 2000 Volume to Capacity ratio 0.19Actuated Cycle Length (s) 50.0 Sum of lost time (s) 9.0Intersection Capacity Utilization 40.4% ICU Level of Service AAnalysis Period (min) 15c Critical Lane Group
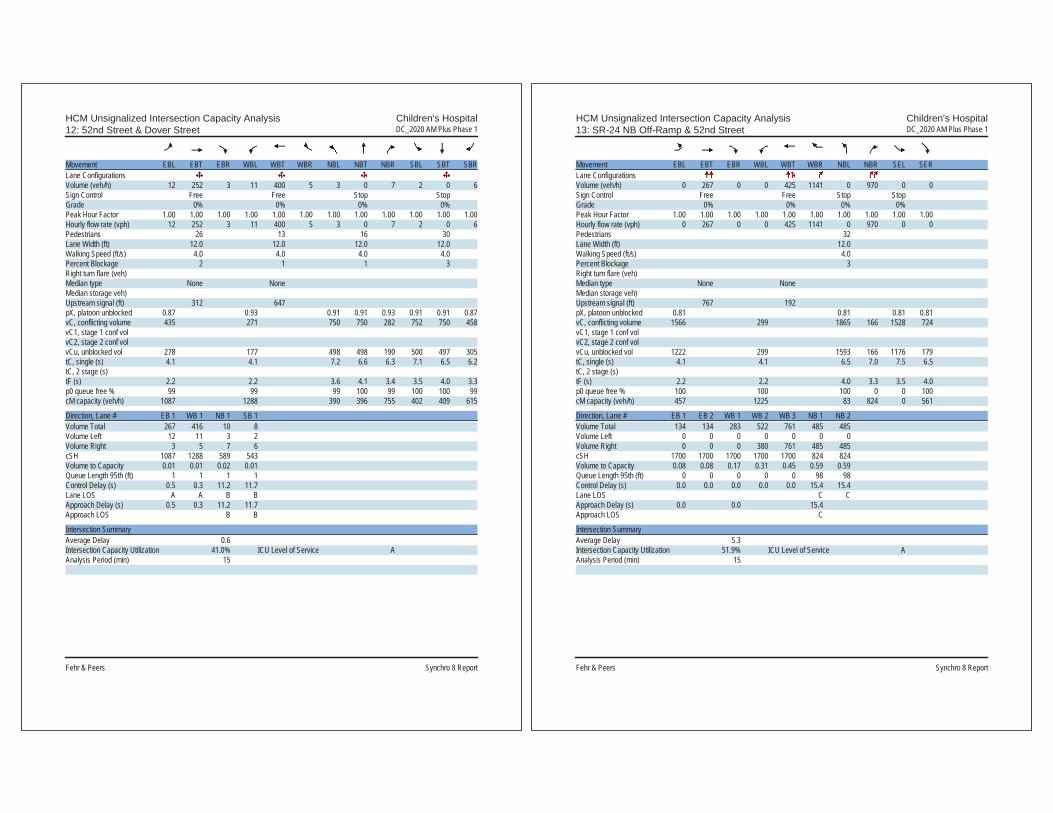
HCM Unsignalized Intersection Capacity Analysis Children's Hospital12: 52nd Street & Dover Street DC_2020 AM Plus Phase 1
Fehr & Peers Synchro 8 Report
Movement EBL EBT EBR WBL WBT WBR NBL NBT NBR SBL SBT SBRLane ConfigurationsVolume (veh/h) 12 252 3 11 400 5 3 0 7 2 0 6Sign Control Free Free Stop StopGrade 0% 0% 0% 0%Peak Hour Factor 1.00 1.00 1.00 1.00 1.00 1.00 1.00 1.00 1.00 1.00 1.00 1.00Hourly flow rate (vph) 12 252 3 11 400 5 3 0 7 2 0 6Pedestrians 26 13 16 30Lane Width (ft) 12.0 12.0 12.0 12.0Walking Speed (ft/s) 4.0 4.0 4.0 4.0Percent Blockage 2 1 1 3Right turn flare (veh)Median type None NoneMedian storage veh)Upstream signal (ft) 312 647pX, platoon unblocked 0.87 0.93 0.91 0.91 0.93 0.91 0.91 0.87vC, conflicting volume 435 271 750 750 282 752 750 458vC1, stage 1 conf volvC2, stage 2 conf volvCu, unblocked vol 278 177 498 498 190 500 497 305tC, single (s) 4.1 4.1 7.2 6.6 6.3 7.1 6.5 6.2tC, 2 stage (s)tF (s) 2.2 2.2 3.6 4.1 3.4 3.5 4.0 3.3p0 queue free % 99 99 99 100 99 100 100 99cM capacity (veh/h) 1087 1288 390 396 755 402 409 615
Direction, Lane # EB 1 WB 1 NB 1 SB 1Volume Total 267 416 10 8Volume Left 12 11 3 2Volume Right 3 5 7 6cSH 1087 1288 589 543Volume to Capacity 0.01 0.01 0.02 0.01Queue Length 95th (ft) 1 1 1 1Control Delay (s) 0.5 0.3 11.2 11.7Lane LOS A A B BApproach Delay (s) 0.5 0.3 11.2 11.7Approach LOS B B
Intersection SummaryAverage Delay 0.6Intersection Capacity Utilization 41.0% ICU Level of Service AAnalysis Period (min) 15
HCM Unsignalized Intersection Capacity Analysis Children's Hospital13: SR-24 NB Off-Ramp & 52nd Street DC_2020 AM Plus Phase 1
Fehr & Peers Synchro 8 Report
Movement EBL EBT EBR WBL WBT WBR NBL NBR SEL SERLane ConfigurationsVolume (veh/h) 0 267 0 0 425 1141 0 970 0 0Sign Control Free Free Stop StopGrade 0% 0% 0% 0%Peak Hour Factor 1.00 1.00 1.00 1.00 1.00 1.00 1.00 1.00 1.00 1.00Hourly flow rate (vph) 0 267 0 0 425 1141 0 970 0 0Pedestrians 32Lane Width (ft) 12.0Walking Speed (ft/s) 4.0Percent Blockage 3Right turn flare (veh)Median type None NoneMedian storage veh)Upstream signal (ft) 767 192pX, platoon unblocked 0.81 0.81 0.81 0.81vC, conflicting volume 1566 299 1865 166 1528 724vC1, stage 1 conf volvC2, stage 2 conf volvCu, unblocked vol 1222 299 1593 166 1176 179tC, single (s) 4.1 4.1 6.5 7.0 7.5 6.5tC, 2 stage (s)tF (s) 2.2 2.2 4.0 3.3 3.5 4.0p0 queue free % 100 100 100 0 0 100cM capacity (veh/h) 457 1225 83 824 0 561
Direction, Lane # EB 1 EB 2 WB 1 WB 2 WB 3 NB 1 NB 2Volume Total 134 134 283 522 761 485 485Volume Left 0 0 0 0 0 0 0Volume Right 0 0 0 380 761 485 485cSH 1700 1700 1700 1700 1700 824 824Volume to Capacity 0.08 0.08 0.17 0.31 0.45 0.59 0.59Queue Length 95th (ft) 0 0 0 0 0 98 98Control Delay (s) 0.0 0.0 0.0 0.0 0.0 15.4 15.4Lane LOS C CApproach Delay (s) 0.0 0.0 15.4Approach LOS C
Intersection SummaryAverage Delay 5.3Intersection Capacity Utilization 51.9% ICU Level of Service AAnalysis Period (min) 15

HCM Signalized Intersection Capacity Analysis Children's Hospital14: 52nd Street & Shattuck Ave DC_2020 AM Plus Phase 1
Fehr & Peers Synchro 8 Report
Movement EBU EBL EBT EBR WBL WBT WBR NBL NBT NBR SBL SBTLane ConfigurationsVolume (vph) 50 290 737 160 40 955 110 170 130 40 115 160Ideal Flow (vphpl) 1900 1900 1900 1900 1900 1900 1900 1900 1900 1900 1900 1900Total Lost time (s) 4.0 4.5 4.0 4.5 4.0 5.5 5.5Lane Util. Factor 1.00 0.91 1.00 0.91 1.00 1.00 1.00Frpb, ped/bikes 1.00 0.99 1.00 1.00 1.00 0.99 1.00Flpb, ped/bikes 1.00 1.00 1.00 1.00 1.00 1.00 1.00Frt 1.00 0.97 1.00 0.98 1.00 0.96 1.00Flt Protected 0.95 1.00 0.95 1.00 0.95 1.00 0.98Satd. Flow (prot) 1787 4930 1805 5085 1752 1766 1732Flt Permitted 0.95 1.00 0.95 1.00 0.39 1.00 0.79Satd. Flow (perm) 1787 4930 1805 5085 713 1766 1392Peak-hour factor, PHF 1.00 1.00 1.00 1.00 1.00 1.00 1.00 1.00 1.00 1.00 1.00 1.00Adj. Flow (vph) 50 290 737 160 40 955 110 170 130 40 115 160RTOR Reduction (vph) 0 0 32 0 0 15 0 0 13 0 0 0Lane Group Flow (vph) 0 340 865 0 40 1050 0 170 157 0 0 275Confl. Peds. (#/hr) 16 7 13 13Confl. Bikes (#/hr) 16 2 13Heavy Vehicles (%) 1% 1% 1% 1% 0% 0% 0% 3% 3% 3% 7% 7%Turn Type Prot Prot NA Prot NA pm+pt NA Perm NAProtected Phases 7 7 4 3 8 5 2 6Permitted Phases 2 6Actuated Green, G (s) 21.5 35.0 5.1 18.6 35.9 35.9 25.4Effective Green, g (s) 21.5 35.0 5.1 18.6 35.9 35.9 25.4Actuated g/C Ratio 0.24 0.39 0.06 0.21 0.40 0.40 0.28Clearance Time (s) 4.0 4.5 4.0 4.5 4.0 5.5 5.5Vehicle Extension (s) 3.0 3.0 3.0 3.0 3.0 3.0 3.0Lane Grp Cap (vph) 426 1917 102 1050 359 704 392v/s Ratio Prot c0.19 0.18 0.02 c0.21 c0.03 0.09v/s Ratio Perm 0.15 c0.20v/c Ratio 0.80 0.45 0.39 1.00 0.47 0.22 0.70Uniform Delay, d1 32.2 20.4 41.0 35.7 18.7 17.9 28.9Progression Factor 1.00 1.00 1.14 0.85 1.00 1.00 1.00Incremental Delay, d2 14.4 0.8 1.9 24.3 1.0 0.7 10.0Delay (s) 46.6 21.1 48.6 54.5 19.7 18.6 38.9Level of Service D C D D B B DApproach Delay (s) 28.2 54.3 19.1 31.9Approach LOS C D B C
Intersection SummaryHCM 2000 Control Delay 36.6 HCM 2000 Level of Service DHCM 2000 Volume to Capacity ratio 0.79Actuated Cycle Length (s) 90.0 Sum of lost time (s) 18.0Intersection Capacity Utilization 104.8% ICU Level of Service GAnalysis Period (min) 15c Critical Lane Group
HCM Signalized Intersection Capacity Analysis Children's Hospital14: 52nd Street & Shattuck Ave DC_2020 AM Plus Phase 1
Fehr & Peers Synchro 8 Report
Movement SBRLane ConfigurationsVolume (vph) 391Ideal Flow (vphpl) 1900Total Lost time (s) 5.5Lane Util. Factor 1.00Frpb, ped/bikes 0.93Flpb, ped/bikes 1.00Frt 0.85Flt Protected 1.00Satd. Flow (prot) 1398Flt Permitted 1.00Satd. Flow (perm) 1398Peak-hour factor, PHF 1.00Adj. Flow (vph) 391RTOR Reduction (vph) 281Lane Group Flow (vph) 110Confl. Peds. (#/hr) 21Confl. Bikes (#/hr) 54Heavy Vehicles (%) 7%Turn Type PermProtected PhasesPermitted Phases 6Actuated Green, G (s) 25.4Effective Green, g (s) 25.4Actuated g/C Ratio 0.28Clearance Time (s) 5.5Vehicle Extension (s) 3.0Lane Grp Cap (vph) 394v/s Ratio Protv/s Ratio Perm 0.08v/c Ratio 0.28Uniform Delay, d1 25.2Progression Factor 1.00Incremental Delay, d2 1.8Delay (s) 26.9Level of Service CApproach Delay (s)Approach LOS
Intersection Summary

HCM Signalized Intersection Capacity Analysis Children's Hospital15: Telegraph Ave & 52nd Street/Claremont Ave DC_2020 AM Plus Phase 1
Fehr & Peers Synchro 8 Report
Movement EBL EBT EBR WBL WBT WBR NBL NBT NBR SBL SBT SBRLane ConfigurationsVolume (vph) 10 10 10 110 60 180 10 772 130 90 700 344Ideal Flow (vphpl) 1900 1900 1900 1900 1900 1900 1900 1900 1900 1900 1900 1900Lane Width 12 12 12 12 12 12 12 16 12 12 12 12Total Lost time (s) 4.5 4.5 4.5 4.5 4.5 4.5Lane Util. Factor 1.00 0.95 0.95 0.95 1.00 0.95Frpb, ped/bikes 0.99 1.00 0.98 0.99 1.00 0.96Flpb, ped/bikes 1.00 1.00 1.00 1.00 1.00 1.00Frt 0.95 1.00 0.89 0.98 1.00 0.95Flt Protected 0.98 0.95 1.00 1.00 0.95 1.00Satd. Flow (prot) 1641 1698 1565 3848 1770 3241Flt Permitted 0.98 0.95 1.00 0.94 0.95 1.00Satd. Flow (perm) 1641 1698 1565 3625 1770 3241Peak-hour factor, PHF 1.00 1.00 1.00 1.00 1.00 1.00 1.00 1.00 1.00 1.00 1.00 1.00Adj. Flow (vph) 10 10 10 110 60 180 10 772 130 90 700 344RTOR Reduction (vph) 0 10 0 0 119 0 0 11 0 0 47 0Lane Group Flow (vph) 0 21 0 99 132 0 0 901 0 90 997 0Confl. Peds. (#/hr) 6 6 29 24 29Confl. Bikes (#/hr) 2 3 43 36Heavy Vehicles (%) 8% 8% 8% 1% 1% 1% 3% 3% 3% 2% 2% 2%Turn Type Split NA Split NA Perm NA Prot NAProtected Phases 4 4 8 8 2 1 6Permitted Phases 2Actuated Green, G (s) 4.5 15.7 15.7 43.9 7.9 56.3Effective Green, g (s) 4.5 15.7 15.7 43.9 7.9 56.3Actuated g/C Ratio 0.05 0.17 0.17 0.49 0.09 0.63Clearance Time (s) 4.5 4.5 4.5 4.5 4.5 4.5Vehicle Extension (s) 3.0 3.0 3.0 3.0 3.0 3.0Lane Grp Cap (vph) 82 296 273 1768 155 2027v/s Ratio Prot c0.01 0.06 c0.08 0.05 c0.31v/s Ratio Perm 0.25v/c Ratio 0.25 0.33 0.48 0.51 0.58 0.49Uniform Delay, d1 41.1 32.6 33.5 15.7 39.5 9.1Progression Factor 1.57 1.00 1.00 0.95 1.00 1.00Incremental Delay, d2 1.0 0.7 1.4 0.9 5.4 0.9Delay (s) 65.5 33.2 34.8 15.8 44.9 10.0Level of Service E C C B D AApproach Delay (s) 65.5 34.4 15.8 12.7Approach LOS E C B B
Intersection SummaryHCM 2000 Control Delay 17.7 HCM 2000 Level of Service BHCM 2000 Volume to Capacity ratio 0.51Actuated Cycle Length (s) 90.0 Sum of lost time (s) 18.0Intersection Capacity Utilization 82.7% ICU Level of Service EAnalysis Period (min) 15c Critical Lane Group
HCM Signalized Intersection Capacity Analysis Children's Hospital16: Telegraph Ave & 51St Street DC_2020 AM Plus Phase 1
Fehr & Peers Synchro 8 Report
Movement EBL EBT EBR WBL WBT WBR NBL NBT NBR SBL SBT SBRLane ConfigurationsVolume (vph) 262 530 80 120 560 270 111 380 70 180 590 50Ideal Flow (vphpl) 1900 1900 1900 1900 1900 1900 1900 1900 1900 1900 1900 1900Total Lost time (s) 4.0 4.0 4.0 3.5 4.0 4.5 4.0 3.5Lane Util. Factor 0.97 0.95 1.00 0.95 1.00 0.95 1.00 0.95Frpb, ped/bikes 1.00 0.99 1.00 0.98 1.00 0.99 1.00 0.99Flpb, ped/bikes 1.00 1.00 1.00 1.00 1.00 1.00 1.00 1.00Frt 1.00 0.98 1.00 0.95 1.00 0.98 1.00 0.99Flt Protected 0.95 1.00 0.95 1.00 0.95 1.00 0.95 1.00Satd. Flow (prot) 3400 3404 1787 3322 1719 3313 1752 3433Flt Permitted 0.95 1.00 0.95 1.00 0.95 1.00 0.95 1.00Satd. Flow (perm) 3400 3404 1787 3322 1719 3313 1752 3433Peak-hour factor, PHF 1.00 1.00 1.00 1.00 1.00 1.00 1.00 1.00 1.00 1.00 1.00 1.00Adj. Flow (vph) 262 530 80 120 560 270 111 380 70 180 590 50RTOR Reduction (vph) 0 13 0 0 64 0 0 16 0 0 6 0Lane Group Flow (vph) 262 597 0 120 766 0 111 434 0 180 634 0Confl. Peds. (#/hr) 41 41 39 49Confl. Bikes (#/hr) 12 10 36 36Heavy Vehicles (%) 3% 3% 3% 1% 1% 1% 5% 5% 5% 3% 3% 3%Turn Type Prot NA Prot NA Prot NA Prot NAProtected Phases 7 4 3 8 5 2 1 6Permitted PhasesActuated Green, G (s) 11.9 27.0 10.4 26.0 8.9 24.5 11.6 28.2Effective Green, g (s) 11.9 27.0 10.4 26.0 8.9 24.5 11.6 28.2Actuated g/C Ratio 0.13 0.30 0.12 0.29 0.10 0.27 0.13 0.31Clearance Time (s) 4.0 4.0 4.0 3.5 4.0 4.5 4.0 3.5Vehicle Extension (s) 3.0 3.0 3.0 3.0 3.0 3.0 3.0 3.0Lane Grp Cap (vph) 449 1021 206 959 169 901 225 1075v/s Ratio Prot c0.08 0.18 0.07 c0.23 0.06 0.13 c0.10 c0.18v/s Ratio Permv/c Ratio 0.58 0.58 0.58 0.80 0.66 0.48 0.80 0.59Uniform Delay, d1 36.7 26.7 37.7 29.6 39.1 27.4 38.1 26.0Progression Factor 1.23 0.92 1.00 1.00 1.00 1.00 1.29 0.74Incremental Delay, d2 1.7 2.2 4.2 6.9 8.9 1.8 16.7 2.2Delay (s) 46.9 26.8 41.9 36.5 47.9 29.3 65.8 21.3Level of Service D C D D D C E CApproach Delay (s) 32.9 37.2 33.0 31.1Approach LOS C D C C
Intersection SummaryHCM 2000 Control Delay 33.7 HCM 2000 Level of Service CHCM 2000 Volume to Capacity ratio 0.72Actuated Cycle Length (s) 90.0 Sum of lost time (s) 16.5Intersection Capacity Utilization 74.8% ICU Level of Service DAnalysis Period (min) 15c Critical Lane Group
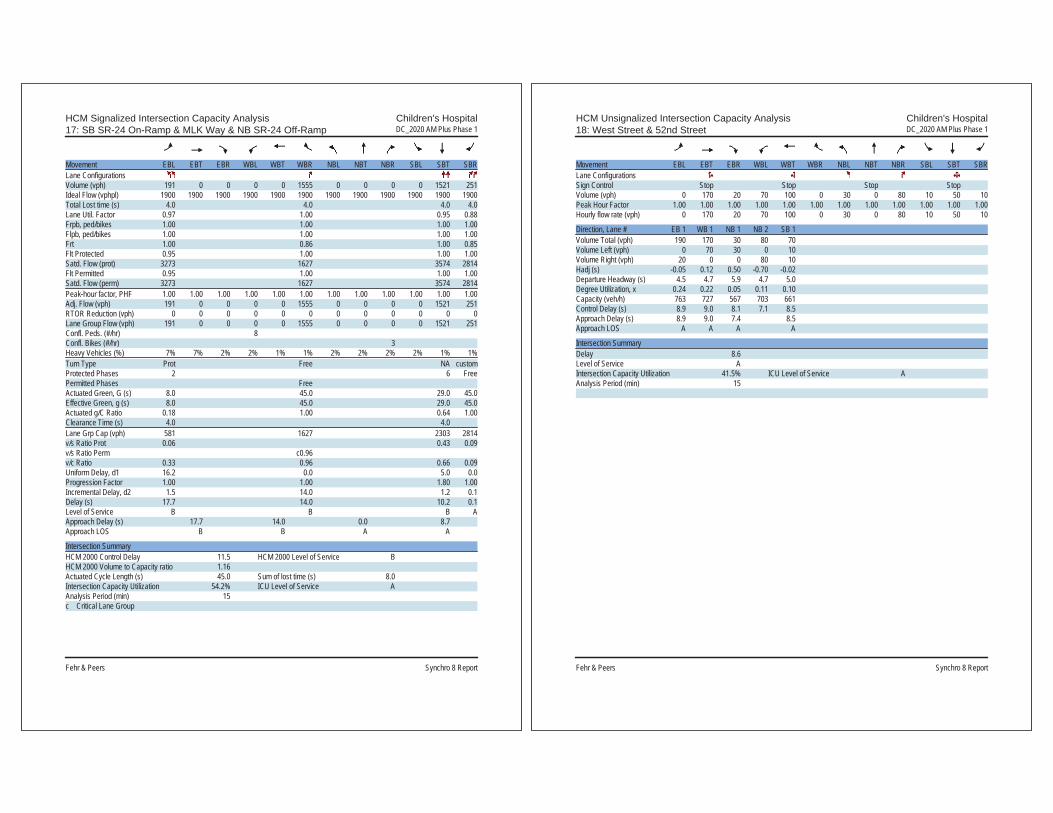
HCM Signalized Intersection Capacity Analysis Children's Hospital17: SB SR-24 On-Ramp & MLK Way & NB SR-24 Off-Ramp DC_2020 AM Plus Phase 1
Fehr & Peers Synchro 8 Report
Movement EBL EBT EBR WBL WBT WBR NBL NBT NBR SBL SBT SBRLane ConfigurationsVolume (vph) 191 0 0 0 0 1555 0 0 0 0 1521 251Ideal Flow (vphpl) 1900 1900 1900 1900 1900 1900 1900 1900 1900 1900 1900 1900Total Lost time (s) 4.0 4.0 4.0 4.0Lane Util. Factor 0.97 1.00 0.95 0.88Frpb, ped/bikes 1.00 1.00 1.00 1.00Flpb, ped/bikes 1.00 1.00 1.00 1.00Frt 1.00 0.86 1.00 0.85Flt Protected 0.95 1.00 1.00 1.00Satd. Flow (prot) 3273 1627 3574 2814Flt Permitted 0.95 1.00 1.00 1.00Satd. Flow (perm) 3273 1627 3574 2814Peak-hour factor, PHF 1.00 1.00 1.00 1.00 1.00 1.00 1.00 1.00 1.00 1.00 1.00 1.00Adj. Flow (vph) 191 0 0 0 0 1555 0 0 0 0 1521 251RTOR Reduction (vph) 0 0 0 0 0 0 0 0 0 0 0 0Lane Group Flow (vph) 191 0 0 0 0 1555 0 0 0 0 1521 251Confl. Peds. (#/hr) 8Confl. Bikes (#/hr) 3Heavy Vehicles (%) 7% 7% 2% 2% 1% 1% 2% 2% 2% 2% 1% 1%Turn Type Prot Free NA customProtected Phases 2 6 FreePermitted Phases FreeActuated Green, G (s) 8.0 45.0 29.0 45.0Effective Green, g (s) 8.0 45.0 29.0 45.0Actuated g/C Ratio 0.18 1.00 0.64 1.00Clearance Time (s) 4.0 4.0Lane Grp Cap (vph) 581 1627 2303 2814v/s Ratio Prot 0.06 0.43 0.09v/s Ratio Perm c0.96v/c Ratio 0.33 0.96 0.66 0.09Uniform Delay, d1 16.2 0.0 5.0 0.0Progression Factor 1.00 1.00 1.80 1.00Incremental Delay, d2 1.5 14.0 1.2 0.1Delay (s) 17.7 14.0 10.2 0.1Level of Service B B B AApproach Delay (s) 17.7 14.0 0.0 8.7Approach LOS B B A A
Intersection SummaryHCM 2000 Control Delay 11.5 HCM 2000 Level of Service BHCM 2000 Volume to Capacity ratio 1.16Actuated Cycle Length (s) 45.0 Sum of lost time (s) 8.0Intersection Capacity Utilization 54.2% ICU Level of Service AAnalysis Period (min) 15c Critical Lane Group
HCM Unsignalized Intersection Capacity Analysis Children's Hospital18: West Street & 52nd Street DC_2020 AM Plus Phase 1
Fehr & Peers Synchro 8 Report
Movement EBL EBT EBR WBL WBT WBR NBL NBT NBR SBL SBT SBRLane ConfigurationsSign Control Stop Stop Stop StopVolume (vph) 0 170 20 70 100 0 30 0 80 10 50 10Peak Hour Factor 1.00 1.00 1.00 1.00 1.00 1.00 1.00 1.00 1.00 1.00 1.00 1.00Hourly flow rate (vph) 0 170 20 70 100 0 30 0 80 10 50 10
Direction, Lane # EB 1 WB 1 NB 1 NB 2 SB 1Volume Total (vph) 190 170 30 80 70Volume Left (vph) 0 70 30 0 10Volume Right (vph) 20 0 0 80 10Hadj (s) -0.05 0.12 0.50 -0.70 -0.02Departure Headway (s) 4.5 4.7 5.9 4.7 5.0Degree Utilization, x 0.24 0.22 0.05 0.11 0.10Capacity (veh/h) 763 727 567 703 661Control Delay (s) 8.9 9.0 8.1 7.1 8.5Approach Delay (s) 8.9 9.0 7.4 8.5Approach LOS A A A A
Intersection SummaryDelay 8.6Level of Service AIntersection Capacity Utilization 41.5% ICU Level of Service AAnalysis Period (min) 15

HCM Unsignalized Intersection Capacity Analysis Children's Hospital19: Genoa Street & 52nd Street DC_2020 AM Plus Phase 1
Fehr & Peers Synchro 8 Report
Movement EBL EBT EBR WBL WBT WBR NBL NBT NBR SBL SBT SBRLane ConfigurationsSign Control Stop Stop Stop StopVolume (vph) 10 160 10 10 100 30 10 10 10 20 10 10Peak Hour Factor 1.00 1.00 1.00 1.00 1.00 1.00 1.00 1.00 1.00 1.00 1.00 1.00Hourly flow rate (vph) 10 160 10 10 100 30 10 10 10 20 10 10
Direction, Lane # EB 1 WB 1 NB 1 SB 1Volume Total (vph) 180 140 30 40Volume Left (vph) 10 10 10 20Volume Right (vph) 10 30 10 10Hadj (s) -0.01 -0.11 -0.13 -0.05Departure Headway (s) 4.2 4.1 4.5 4.6Degree Utilization, x 0.21 0.16 0.04 0.05Capacity (veh/h) 836 848 737 722Control Delay (s) 8.3 7.9 7.7 7.8Approach Delay (s) 8.3 7.9 7.7 7.8Approach LOS A A A A
Intersection SummaryDelay 8.1Level of Service AIntersection Capacity Utilization 24.1% ICU Level of Service AAnalysis Period (min) 15
HCM Unsignalized Intersection Capacity Analysis Children's Hospital20: Genoa Street & 55th Street DC_2020 AM Plus Phase 1
Fehr & Peers Synchro 8 Report
Movement EBL EBT EBR WBL WBT WBR NBL NBT NBR SBL SBT SBRLane ConfigurationsVolume (veh/h) 10 370 10 10 360 20 10 20 20 40 20 10Sign Control Free Free Stop StopGrade 0% 0% 0% 0%Peak Hour Factor 1.00 1.00 1.00 1.00 1.00 1.00 1.00 1.00 1.00 1.00 1.00 1.00Hourly flow rate (vph) 10 370 10 10 360 20 10 20 20 40 20 10Pedestrians 11 3 13 15Lane Width (ft) 12.0 12.0 12.0 12.0Walking Speed (ft/s) 4.0 4.0 4.0 4.0Percent Blockage 1 0 1 1Right turn flare (veh)Median type None NoneMedian storage veh)Upstream signal (ft) 721pX, platoon unblockedvC, conflicting volume 395 393 829 823 391 833 818 396vC1, stage 1 conf volvC2, stage 2 conf volvCu, unblocked vol 395 393 829 823 391 833 818 396tC, single (s) 4.1 4.1 7.1 6.5 6.2 7.1 6.5 6.2tC, 2 stage (s)tF (s) 2.2 2.2 3.5 4.0 3.3 3.5 4.0 3.3p0 queue free % 99 99 96 93 97 84 93 98cM capacity (veh/h) 1154 1164 259 298 653 253 298 639
Direction, Lane # EB 1 WB 1 NB 1 SB 1Volume Total 390 390 50 70Volume Left 10 10 10 40Volume Right 10 20 20 10cSH 1154 1164 367 291Volume to Capacity 0.01 0.01 0.14 0.24Queue Length 95th (ft) 1 1 12 23Control Delay (s) 0.3 0.3 16.3 21.3Lane LOS A A C CApproach Delay (s) 0.3 0.3 16.3 21.3Approach LOS C C
Intersection SummaryAverage Delay 2.8Intersection Capacity Utilization 42.1% ICU Level of Service AAnalysis Period (min) 15

HCM Unsignalized Intersection Capacity Analysis Children's Hospital21: MLK Way & RIRO Main Garage DC_2020 AM Plus Phase 1
Fehr & Peers Synchro 8 Report
Movement WBL WBR NBT NBR SBL SBTLane ConfigurationsVolume (veh/h) 0 34 1707 201 0 1784Sign Control Stop Free FreeGrade 0% 0% 0%Peak Hour Factor 1.00 1.00 1.00 1.00 1.00 1.00Hourly flow rate (vph) 0 34 1707 201 0 1784PedestriansLane Width (ft)Walking Speed (ft/s)Percent BlockageRight turn flare (veh)Median type None NoneMedian storage veh)Upstream signal (ft) 154 137pX, platoon unblocked 0.85 0.76 0.76vC, conflicting volume 2402 670 1908vC1, stage 1 conf volvC2, stage 2 conf volvCu, unblocked vol 574 0 1085tC, single (s) 6.8 6.9 4.1tC, 2 stage (s)tF (s) 3.5 3.3 2.2p0 queue free % 100 96 100cM capacity (veh/h) 382 823 485
Direction, Lane # WB 1 NB 1 NB 2 NB 3 SB 1 SB 2 SB 3Volume Total 34 683 683 542 595 595 595Volume Left 0 0 0 0 0 0 0Volume Right 34 0 0 201 0 0 0cSH 823 1700 1700 1700 1700 1700 1700Volume to Capacity 0.04 0.40 0.40 0.32 0.35 0.35 0.35Queue Length 95th (ft) 3 0 0 0 0 0 0Control Delay (s) 9.6 0.0 0.0 0.0 0.0 0.0 0.0Lane LOS AApproach Delay (s) 9.6 0.0 0.0Approach LOS A
Intersection SummaryAverage Delay 0.1Intersection Capacity Utilization 47.5% ICU Level of Service AAnalysis Period (min) 15
HCM Unsignalized Intersection Capacity Analysis Children's Hospital22: MLK Way & RIRO Main Plaza DC_2020 AM Plus Phase 1
Fehr & Peers Synchro 8 Report
Movement WBL WBR NBT NBR SBL SBTLane ConfigurationsVolume (veh/h) 0 1 1721 25 0 1822Sign Control Stop Free FreeGrade 0% 0% 0%Peak Hour Factor 1.00 1.00 1.00 1.00 1.00 1.00Hourly flow rate (vph) 0 1 1721 25 0 1822PedestriansLane Width (ft)Walking Speed (ft/s)Percent BlockageRight turn flare (veh)Median type None NoneMedian storage veh)Upstream signal (ft) 424 204pX, platoon unblocked 0.78vC, conflicting volume 2341 586 1746vC1, stage 1 conf volvC2, stage 2 conf volvCu, unblocked vol 1735 586 1746tC, single (s) 6.8 6.9 4.1tC, 2 stage (s)tF (s) 3.5 3.3 2.2p0 queue free % 100 100 100cM capacity (veh/h) 61 453 356
Direction, Lane # WB 1 NB 1 NB 2 NB 3 SB 1 SB 2 SB 3Volume Total 1 688 688 369 607 607 607Volume Left 0 0 0 0 0 0 0Volume Right 1 0 0 25 0 0 0cSH 453 1700 1700 1700 1700 1700 1700Volume to Capacity 0.00 0.40 0.40 0.22 0.36 0.36 0.36Queue Length 95th (ft) 0 0 0 0 0 0 0Control Delay (s) 13.0 0.0 0.0 0.0 0.0 0.0 0.0Lane LOS BApproach Delay (s) 13.0 0.0 0.0Approach LOS B
Intersection SummaryAverage Delay 0.0Intersection Capacity Utilization 43.8% ICU Level of Service AAnalysis Period (min) 15

HCM Unsignalized Intersection Capacity Analysis Children's Hospital24: 51St Street & 52nd Street DC_2020 AM Plus Phase 1
Fehr & Peers Synchro 8 Report
Intersection Sign configuration not allowed in HCM analysis.
HCM Signalized Intersection Capacity Analysis Children's Hospital 1: MLK Way & 55th Street DC_2020 PM Plus Phase 1
Fehr & Peers Synchro 8 Report
Movement EBL EBT EBR WBL WBT WBR NBU NBL NBT NBR SBL SBTLane ConfigurationsVolume (vph) 20 260 170 60 170 70 29 211 1652 156 130 1351Ideal Flow (vphpl) 1900 1900 1900 1900 1900 1900 1900 1900 1900 1900 1900 1900Total Lost time (s) 5.0 5.0 4.5 5.0 4.5 5.0Lane Util. Factor 1.00 1.00 1.00 0.91 1.00 0.91Frpb, ped/bikes 0.98 0.99 1.00 0.99 1.00 1.00Flpb, ped/bikes 1.00 1.00 1.00 1.00 1.00 1.00Frt 0.95 0.97 1.00 0.99 1.00 1.00Flt Protected 1.00 0.99 0.95 1.00 0.95 1.00Satd. Flow (prot) 1751 1735 1770 4979 1770 5060Flt Permitted 0.98 0.67 0.95 1.00 0.95 1.00Satd. Flow (perm) 1718 1181 1770 4979 1770 5060Peak-hour factor, PHF 1.00 1.00 1.00 1.00 1.00 1.00 1.00 1.00 1.00 1.00 1.00 1.00Adj. Flow (vph) 20 260 170 60 170 70 29 211 1652 156 130 1351RTOR Reduction (vph) 0 24 0 0 12 0 0 0 10 0 0 2Lane Group Flow (vph) 0 426 0 0 288 0 0 240 1798 0 130 1379Confl. Peds. (#/hr) 15 20 20 15 26Confl. Bikes (#/hr) 21 16 20Heavy Vehicles (%) 1% 1% 1% 4% 4% 4% 2% 2% 2% 2% 2% 2%Turn Type Perm NA Perm NA Prot Prot NA Prot NAProtected Phases 4 8 5 5 2 1 6Permitted Phases 4 8Actuated Green, G (s) 29.3 29.3 21.5 45.5 10.7 34.7Effective Green, g (s) 29.3 29.3 21.5 45.5 10.7 34.7Actuated g/C Ratio 0.29 0.29 0.22 0.46 0.11 0.35Clearance Time (s) 5.0 5.0 4.5 5.0 4.5 5.0Vehicle Extension (s) 3.0 3.0 3.0 3.0 3.0 3.0Lane Grp Cap (vph) 503 346 380 2265 189 1755v/s Ratio Prot 0.14 c0.36 0.07 c0.27v/s Ratio Perm c0.25 0.24v/c Ratio 0.85 0.83 0.63 0.79 0.69 0.79Uniform Delay, d1 33.2 33.1 35.7 23.2 43.0 29.3Progression Factor 1.00 1.00 0.55 0.39 1.00 1.00Incremental Delay, d2 12.5 15.6 2.8 2.5 10.0 3.6Delay (s) 45.7 48.6 22.5 11.5 53.0 32.9Level of Service D D C B D CApproach Delay (s) 45.7 48.6 12.8 34.7Approach LOS D D B C
Intersection SummaryHCM 2000 Control Delay 26.4 HCM 2000 Level of Service CHCM 2000 Volume to Capacity ratio 0.83Actuated Cycle Length (s) 100.0 Sum of lost time (s) 14.5Intersection Capacity Utilization 93.8% ICU Level of Service FAnalysis Period (min) 15c Critical Lane Group
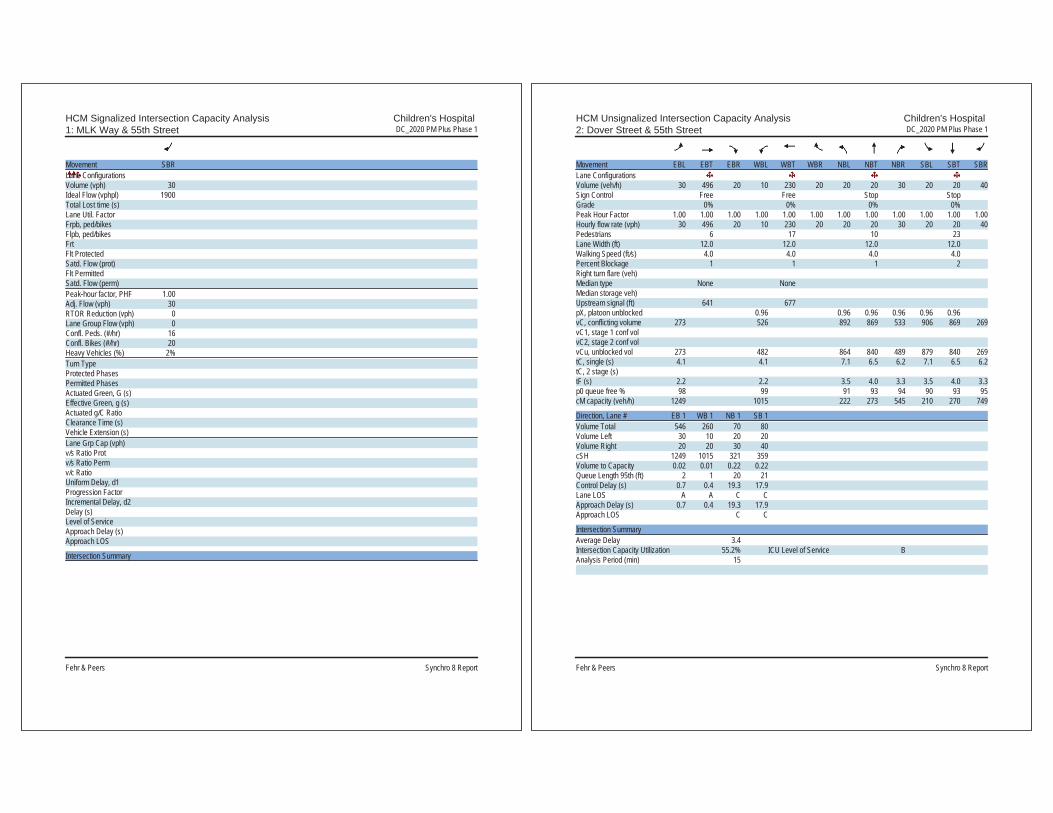
HCM Signalized Intersection Capacity Analysis Children's Hospital 1: MLK Way & 55th Street DC_2020 PM Plus Phase 1
Fehr & Peers Synchro 8 Report
Movement SBRLane ConfigurationsVolume (vph) 30Ideal Flow (vphpl) 1900Total Lost time (s)Lane Util. FactorFrpb, ped/bikesFlpb, ped/bikesFrtFlt ProtectedSatd. Flow (prot)Flt PermittedSatd. Flow (perm)Peak-hour factor, PHF 1.00Adj. Flow (vph) 30RTOR Reduction (vph) 0Lane Group Flow (vph) 0Confl. Peds. (#/hr) 16Confl. Bikes (#/hr) 20Heavy Vehicles (%) 2%Turn TypeProtected PhasesPermitted PhasesActuated Green, G (s)Effective Green, g (s)Actuated g/C RatioClearance Time (s)Vehicle Extension (s)Lane Grp Cap (vph)v/s Ratio Protv/s Ratio Permv/c RatioUniform Delay, d1Progression FactorIncremental Delay, d2Delay (s)Level of ServiceApproach Delay (s)Approach LOS
Intersection Summary
HCM Unsignalized Intersection Capacity Analysis Children's Hospital 2: Dover Street & 55th Street DC_2020 PM Plus Phase 1
Fehr & Peers Synchro 8 Report
Movement EBL EBT EBR WBL WBT WBR NBL NBT NBR SBL SBT SBRLane ConfigurationsVolume (veh/h) 30 496 20 10 230 20 20 20 30 20 20 40Sign Control Free Free Stop StopGrade 0% 0% 0% 0%Peak Hour Factor 1.00 1.00 1.00 1.00 1.00 1.00 1.00 1.00 1.00 1.00 1.00 1.00Hourly flow rate (vph) 30 496 20 10 230 20 20 20 30 20 20 40Pedestrians 6 17 10 23Lane Width (ft) 12.0 12.0 12.0 12.0Walking Speed (ft/s) 4.0 4.0 4.0 4.0Percent Blockage 1 1 1 2Right turn flare (veh)Median type None NoneMedian storage veh)Upstream signal (ft) 641 677pX, platoon unblocked 0.96 0.96 0.96 0.96 0.96 0.96vC, conflicting volume 273 526 892 869 533 906 869 269vC1, stage 1 conf volvC2, stage 2 conf volvCu, unblocked vol 273 482 864 840 489 879 840 269tC, single (s) 4.1 4.1 7.1 6.5 6.2 7.1 6.5 6.2tC, 2 stage (s)tF (s) 2.2 2.2 3.5 4.0 3.3 3.5 4.0 3.3p0 queue free % 98 99 91 93 94 90 93 95cM capacity (veh/h) 1249 1015 222 273 545 210 270 749
Direction, Lane # EB 1 WB 1 NB 1 SB 1Volume Total 546 260 70 80Volume Left 30 10 20 20Volume Right 20 20 30 40cSH 1249 1015 321 359Volume to Capacity 0.02 0.01 0.22 0.22Queue Length 95th (ft) 2 1 20 21Control Delay (s) 0.7 0.4 19.3 17.9Lane LOS A A C CApproach Delay (s) 0.7 0.4 19.3 17.9Approach LOS C C
Intersection SummaryAverage Delay 3.4Intersection Capacity Utilization 55.2% ICU Level of Service BAnalysis Period (min) 15
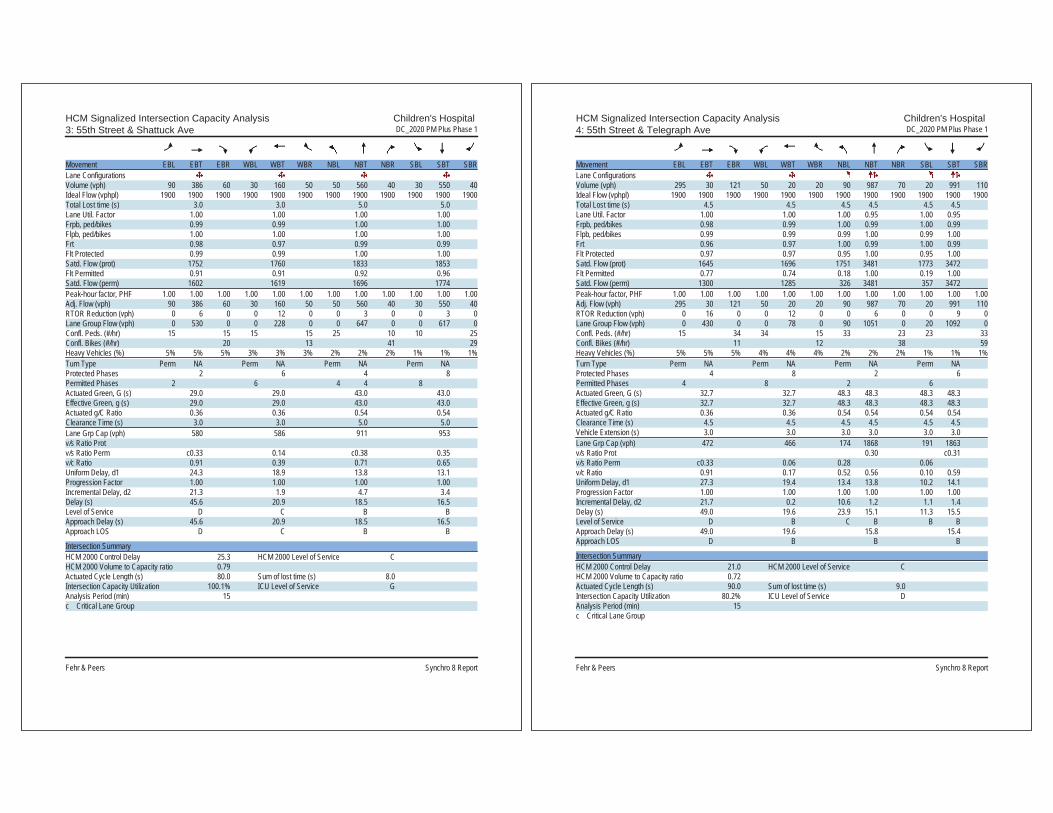
HCM Signalized Intersection Capacity Analysis Children's Hospital 3: 55th Street & Shattuck Ave DC_2020 PM Plus Phase 1
Fehr & Peers Synchro 8 Report
Movement EBL EBT EBR WBL WBT WBR NBL NBT NBR SBL SBT SBRLane ConfigurationsVolume (vph) 90 386 60 30 160 50 50 560 40 30 550 40Ideal Flow (vphpl) 1900 1900 1900 1900 1900 1900 1900 1900 1900 1900 1900 1900Total Lost time (s) 3.0 3.0 5.0 5.0Lane Util. Factor 1.00 1.00 1.00 1.00Frpb, ped/bikes 0.99 0.99 1.00 1.00Flpb, ped/bikes 1.00 1.00 1.00 1.00Frt 0.98 0.97 0.99 0.99Flt Protected 0.99 0.99 1.00 1.00Satd. Flow (prot) 1752 1760 1833 1853Flt Permitted 0.91 0.91 0.92 0.96Satd. Flow (perm) 1602 1619 1696 1774Peak-hour factor, PHF 1.00 1.00 1.00 1.00 1.00 1.00 1.00 1.00 1.00 1.00 1.00 1.00Adj. Flow (vph) 90 386 60 30 160 50 50 560 40 30 550 40RTOR Reduction (vph) 0 6 0 0 12 0 0 3 0 0 3 0Lane Group Flow (vph) 0 530 0 0 228 0 0 647 0 0 617 0Confl. Peds. (#/hr) 15 15 15 15 25 10 10 25Confl. Bikes (#/hr) 20 13 41 29Heavy Vehicles (%) 5% 5% 5% 3% 3% 3% 2% 2% 2% 1% 1% 1%Turn Type Perm NA Perm NA Perm NA Perm NAProtected Phases 2 6 4 8Permitted Phases 2 6 4 4 8Actuated Green, G (s) 29.0 29.0 43.0 43.0Effective Green, g (s) 29.0 29.0 43.0 43.0Actuated g/C Ratio 0.36 0.36 0.54 0.54Clearance Time (s) 3.0 3.0 5.0 5.0Lane Grp Cap (vph) 580 586 911 953v/s Ratio Protv/s Ratio Perm c0.33 0.14 c0.38 0.35v/c Ratio 0.91 0.39 0.71 0.65Uniform Delay, d1 24.3 18.9 13.8 13.1Progression Factor 1.00 1.00 1.00 1.00Incremental Delay, d2 21.3 1.9 4.7 3.4Delay (s) 45.6 20.9 18.5 16.5Level of Service D C B BApproach Delay (s) 45.6 20.9 18.5 16.5Approach LOS D C B B
Intersection SummaryHCM 2000 Control Delay 25.3 HCM 2000 Level of Service CHCM 2000 Volume to Capacity ratio 0.79Actuated Cycle Length (s) 80.0 Sum of lost time (s) 8.0Intersection Capacity Utilization 100.1% ICU Level of Service GAnalysis Period (min) 15c Critical Lane Group
HCM Signalized Intersection Capacity Analysis Children's Hospital 4: 55th Street & Telegraph Ave DC_2020 PM Plus Phase 1
Fehr & Peers Synchro 8 Report
Movement EBL EBT EBR WBL WBT WBR NBL NBT NBR SBL SBT SBRLane ConfigurationsVolume (vph) 295 30 121 50 20 20 90 987 70 20 991 110Ideal Flow (vphpl) 1900 1900 1900 1900 1900 1900 1900 1900 1900 1900 1900 1900Total Lost time (s) 4.5 4.5 4.5 4.5 4.5 4.5Lane Util. Factor 1.00 1.00 1.00 0.95 1.00 0.95Frpb, ped/bikes 0.98 0.99 1.00 0.99 1.00 0.99Flpb, ped/bikes 0.99 0.99 0.99 1.00 0.99 1.00Frt 0.96 0.97 1.00 0.99 1.00 0.99Flt Protected 0.97 0.97 0.95 1.00 0.95 1.00Satd. Flow (prot) 1645 1696 1751 3481 1773 3472Flt Permitted 0.77 0.74 0.18 1.00 0.19 1.00Satd. Flow (perm) 1300 1285 326 3481 357 3472Peak-hour factor, PHF 1.00 1.00 1.00 1.00 1.00 1.00 1.00 1.00 1.00 1.00 1.00 1.00Adj. Flow (vph) 295 30 121 50 20 20 90 987 70 20 991 110RTOR Reduction (vph) 0 16 0 0 12 0 0 6 0 0 9 0Lane Group Flow (vph) 0 430 0 0 78 0 90 1051 0 20 1092 0Confl. Peds. (#/hr) 15 34 34 15 33 23 23 33Confl. Bikes (#/hr) 11 12 38 59Heavy Vehicles (%) 5% 5% 5% 4% 4% 4% 2% 2% 2% 1% 1% 1%Turn Type Perm NA Perm NA Perm NA Perm NAProtected Phases 4 8 2 6Permitted Phases 4 8 2 6Actuated Green, G (s) 32.7 32.7 48.3 48.3 48.3 48.3Effective Green, g (s) 32.7 32.7 48.3 48.3 48.3 48.3Actuated g/C Ratio 0.36 0.36 0.54 0.54 0.54 0.54Clearance Time (s) 4.5 4.5 4.5 4.5 4.5 4.5Vehicle Extension (s) 3.0 3.0 3.0 3.0 3.0 3.0Lane Grp Cap (vph) 472 466 174 1868 191 1863v/s Ratio Prot 0.30 c0.31v/s Ratio Perm c0.33 0.06 0.28 0.06v/c Ratio 0.91 0.17 0.52 0.56 0.10 0.59Uniform Delay, d1 27.3 19.4 13.4 13.8 10.2 14.1Progression Factor 1.00 1.00 1.00 1.00 1.00 1.00Incremental Delay, d2 21.7 0.2 10.6 1.2 1.1 1.4Delay (s) 49.0 19.6 23.9 15.1 11.3 15.5Level of Service D B C B B BApproach Delay (s) 49.0 19.6 15.8 15.4Approach LOS D B B B
Intersection SummaryHCM 2000 Control Delay 21.0 HCM 2000 Level of Service CHCM 2000 Volume to Capacity ratio 0.72Actuated Cycle Length (s) 90.0 Sum of lost time (s) 9.0Intersection Capacity Utilization 80.2% ICU Level of Service DAnalysis Period (min) 15c Critical Lane Group

HCM Unsignalized Intersection Capacity Analysis Children's Hospital 5: MLK Way & 54th Street DC_2020 PM Plus Phase 1
Fehr & Peers Synchro 8 Report
Movement EBL EBT EBR WBL WBT WBR NBU NBL NBT NBR SBU SBLLane ConfigurationsVolume (veh/h) 10 10 50 20 10 10 13 40 1990 48 10 20Sign Control Stop Stop FreeGrade 0% 0% 0%Peak Hour Factor 1.00 1.00 1.00 1.00 1.00 1.00 1.00 1.00 1.00 1.00 1.00 1.00Hourly flow rate (vph) 10 10 50 20 10 10 0 40 1990 48 0 20Pedestrians 7 25 15Lane Width (ft) 12.0 12.0 12.0Walking Speed (ft/s) 4.0 4.0 4.0Percent Blockage 1 2 1Right turn flare (veh)Median type NoneMedian storage veh)Upstream signal (ft) 299pX, platoon unblocked 0.88 0.88 0.76 0.88 0.88 0.76 0.00 0.76 0.00 0.76vC, conflicting volume 2365 3750 549 2746 3736 712 0 1577 0 2063vC1, stage 1 conf volvC2, stage 2 conf volvCu, unblocked vol 204 1785 0 638 1769 0 0 647 0 1274tC, single (s) 7.5 6.5 6.9 7.5 6.5 6.9 0.0 4.1 0.0 4.1tC, 2 stage (s)tF (s) *5.0 *5.0 *5.0 *5.0 *5.0 *5.0 0.0 2.2 0.0 2.2p0 queue free % 97 83 91 88 84 98 0 94 0 95cM capacity (veh/h) 365 59 536 174 61 533 0 705 0 404
Direction, Lane # EB 1 WB 1 NB 1 NB 2 NB 3 SB 1 SB 2 SB 3Volume Total 70 40 538 995 546 408 775 408Volume Left 10 20 40 0 0 20 0 0Volume Right 50 10 0 0 48 0 0 20cSH 242 134 705 1700 1700 404 1700 1700Volume to Capacity 0.29 0.30 0.06 0.59 0.32 0.05 0.46 0.24Queue Length 95th (ft) 29 29 5 0 0 4 0 0Control Delay (s) 25.8 42.9 1.5 0.0 0.0 1.6 0.0 0.0Lane LOS D E A AApproach Delay (s) 25.8 42.9 0.4 0.4Approach LOS D E
Intersection SummaryAverage Delay 1.3Intersection Capacity Utilization 90.1% ICU Level of Service EAnalysis Period (min) 15
* User Entered Value
HCM Unsignalized Intersection Capacity Analysis Children's Hospital 5: MLK Way & 54th Street DC_2020 PM Plus Phase 1
Fehr & Peers Synchro 8 Report
Movement SBT SBRLane ConfigurationsVolume (veh/h) 1550 20Sign Control FreeGrade 0%Peak Hour Factor 1.00 1.00Hourly flow rate (vph) 1550 20PedestriansLane Width (ft)Walking Speed (ft/s)Percent BlockageRight turn flare (veh)Median type NoneMedian storage veh)Upstream signal (ft) 294pX, platoon unblockedvC, conflicting volumevC1, stage 1 conf volvC2, stage 2 conf volvCu, unblocked voltC, single (s)tC, 2 stage (s)tF (s)p0 queue free %cM capacity (veh/h)
Direction, Lane #

HCM Unsignalized Intersection Capacity Analysis Children's Hospital 6: Dover Street & 54th Street DC_2020 PM Plus Phase 1
Fehr & Peers Synchro 8 Report
Movement EBL EBT EBR WBL WBT WBR NBL NBT NBR SBL SBT SBRLane ConfigurationsVolume (veh/h) 10 48 10 10 10 20 10 40 10 10 30 10Sign Control Stop Stop Free FreeGrade 0% 0% 0% 0%Peak Hour Factor 1.00 1.00 1.00 1.00 1.00 1.00 1.00 1.00 1.00 1.00 1.00 1.00Hourly flow rate (vph) 10 48 10 10 10 20 10 40 10 10 30 10Pedestrians 16 11 8 4Lane Width (ft) 12.0 12.0 12.0 12.0Walking Speed (ft/s) 4.0 4.0 4.0 4.0Percent Blockage 1 1 1 0Right turn flare (veh)Median type None NoneMedian storage veh)Upstream signal (ft)pX, platoon unblockedvC, conflicting volume 165 152 59 173 152 60 56 61vC1, stage 1 conf volvC2, stage 2 conf volvCu, unblocked vol 165 152 59 173 152 60 56 61tC, single (s) 7.1 6.5 6.2 7.1 6.5 6.2 4.1 4.1tC, 2 stage (s)tF (s) 3.5 4.0 3.3 3.5 4.0 3.3 2.2 2.2p0 queue free % 99 93 99 99 99 98 99 99cM capacity (veh/h) 746 717 992 715 717 999 1541 1541
Direction, Lane # EB 1 WB 1 NB 1 SB 1Volume Total 68 40 60 50Volume Left 10 10 10 10Volume Right 10 20 10 10cSH 752 834 1541 1541Volume to Capacity 0.09 0.05 0.01 0.01Queue Length 95th (ft) 7 4 0 0Control Delay (s) 10.3 9.5 1.3 1.5Lane LOS B A A AApproach Delay (s) 10.3 9.5 1.3 1.5Approach LOS B A
Intersection SummaryAverage Delay 5.6Intersection Capacity Utilization 21.2% ICU Level of Service AAnalysis Period (min) 15
HCM Unsignalized Intersection Capacity Analysis Children's Hospital 7: Shattuck Ave & 54th Street DC_2020 PM Plus Phase 1
Fehr & Peers Synchro 8 Report
Movement EBL EBR NBL NBT SBT SBRLane ConfigurationsVolume (veh/h) 10 48 20 660 650 10Sign Control Stop Free FreeGrade 0% 0% 0%Peak Hour Factor 1.00 1.00 1.00 1.00 1.00 1.00Hourly flow rate (vph) 10 48 20 660 650 10Pedestrians 33 2Lane Width (ft) 12.0 12.0Walking Speed (ft/s) 4.0 4.0Percent Blockage 3 0Right turn flare (veh)Median type None NoneMedian storage veh)Upstream signal (ft) 550 282pX, platoon unblocked 0.82 0.77 0.77vC, conflicting volume 1390 688 693vC1, stage 1 conf volvC2, stage 2 conf volvCu, unblocked vol 1087 444 450tC, single (s) 6.4 6.2 4.1tC, 2 stage (s)tF (s) 3.5 3.3 2.2p0 queue free % 95 90 98cM capacity (veh/h) 187 462 830
Direction, Lane # EB 1 NB 1 SB 1Volume Total 58 680 660Volume Left 10 20 0Volume Right 48 0 10cSH 369 830 1700Volume to Capacity 0.16 0.02 0.39Queue Length 95th (ft) 14 2 0Control Delay (s) 16.6 0.6 0.0Lane LOS C AApproach Delay (s) 16.6 0.6 0.0Approach LOS C
Intersection SummaryAverage Delay 1.0Intersection Capacity Utilization 61.0% ICU Level of Service BAnalysis Period (min) 15

HCM Signalized Intersection Capacity Analysis Children's Hospital 8: MLK Way & 53rd Street DC_2020 PM Plus Phase 1
Fehr & Peers Synchro 8 Report
Movement EBL EBT EBR WBL WBT WBR NBU NBL NBT NBR SBL SBTLane ConfigurationsVolume (vph) 10 4 69 70 10 8 10 10 2073 105 4 1644Ideal Flow (vphpl) 1900 1900 1900 1900 1900 1900 1900 1900 1900 1900 1900 1900Total Lost time (s) 5.0 5.0 4.0 3.5 4.0 3.5Lane Util. Factor 1.00 1.00 1.00 0.91 1.00 0.91Frpb, ped/bikes 0.98 1.00 1.00 0.99 1.00 1.00Flpb, ped/bikes 1.00 1.00 1.00 1.00 1.00 1.00Frt 0.89 0.99 1.00 0.99 1.00 1.00Flt Protected 0.99 0.96 0.95 1.00 0.95 1.00Satd. Flow (prot) 1610 1795 1770 5012 1787 5128Flt Permitted 0.96 0.73 0.95 1.00 0.95 1.00Satd. Flow (perm) 1562 1361 1770 5012 1787 5128Peak-hour factor, PHF 1.00 1.00 1.00 1.00 1.00 1.00 1.00 1.00 1.00 1.00 1.00 1.00Adj. Flow (vph) 10 4 69 70 10 8 10 10 2073 105 4 1644RTOR Reduction (vph) 0 57 0 0 4 0 0 0 3 0 0 0Lane Group Flow (vph) 0 26 0 0 84 0 0 20 2175 0 4 1654Confl. Peds. (#/hr) 11 6 6 11 42Confl. Bikes (#/hr) 6 3 17Heavy Vehicles (%) 2% 2% 2% 0% 0% 0% 2% 2% 2% 2% 1% 1%Turn Type Perm NA Perm NA Prot Prot NA Prot NAProtected Phases 4 8 5 5 2 1 6Permitted Phases 4 8Actuated Green, G (s) 17.3 17.3 3.1 68.4 1.8 67.1Effective Green, g (s) 17.3 17.3 3.1 68.4 1.8 67.1Actuated g/C Ratio 0.17 0.17 0.03 0.68 0.02 0.67Clearance Time (s) 5.0 5.0 4.0 3.5 4.0 3.5Vehicle Extension (s) 3.0 3.0 3.0 3.0 3.0 3.0Lane Grp Cap (vph) 270 235 54 3428 32 3440v/s Ratio Prot 0.01 c0.43 0.00 c0.32v/s Ratio Perm 0.02 c0.06v/c Ratio 0.10 0.36 0.37 0.63 0.12 0.48Uniform Delay, d1 34.8 36.4 47.5 8.8 48.3 8.0Progression Factor 1.00 1.02 1.44 0.24 0.78 0.48Incremental Delay, d2 0.2 0.9 3.0 0.6 1.2 0.3Delay (s) 34.9 38.0 71.2 2.7 38.7 4.2Level of Service C D E A D AApproach Delay (s) 34.9 38.0 3.4 4.3Approach LOS C D A A
Intersection SummaryHCM 2000 Control Delay 5.1 HCM 2000 Level of Service AHCM 2000 Volume to Capacity ratio 0.59Actuated Cycle Length (s) 100.0 Sum of lost time (s) 12.5Intersection Capacity Utilization 68.4% ICU Level of Service CAnalysis Period (min) 15c Critical Lane Group
HCM Signalized Intersection Capacity Analysis Children's Hospital 8: MLK Way & 53rd Street DC_2020 PM Plus Phase 1
Fehr & Peers Synchro 8 Report
Movement SBRLane ConfigurationsVolume (vph) 10Ideal Flow (vphpl) 1900Total Lost time (s)Lane Util. FactorFrpb, ped/bikesFlpb, ped/bikesFrtFlt ProtectedSatd. Flow (prot)Flt PermittedSatd. Flow (perm)Peak-hour factor, PHF 1.00Adj. Flow (vph) 10RTOR Reduction (vph) 0Lane Group Flow (vph) 0Confl. Peds. (#/hr) 19Confl. Bikes (#/hr) 21Heavy Vehicles (%) 1%Turn TypeProtected PhasesPermitted PhasesActuated Green, G (s)Effective Green, g (s)Actuated g/C RatioClearance Time (s)Vehicle Extension (s)Lane Grp Cap (vph)v/s Ratio Protv/s Ratio Permv/c RatioUniform Delay, d1Progression FactorIncremental Delay, d2Delay (s)Level of ServiceApproach Delay (s)Approach LOS
Intersection Summary

HCM Unsignalized Intersection Capacity Analysis Children's Hospital 9: Dover Street & 53rd Street DC_2020 PM Plus Phase 1
Fehr & Peers Synchro 8 Report
Movement EBL EBT EBR WBL WBT WBR NBL NBT NBR SBL SBT SBRLane ConfigurationsVolume (veh/h) 60 20 0 0 20 10 0 0 0 10 0 40Sign Control Stop Stop Free FreeGrade 0% 0% 0% 0%Peak Hour Factor 1.00 1.00 1.00 1.00 1.00 1.00 1.00 1.00 1.00 1.00 1.00 1.00Hourly flow rate (vph) 60 20 0 0 20 10 0 0 0 10 0 40Pedestrians 33 13 6 6Lane Width (ft) 12.0 12.0 12.0 12.0Walking Speed (ft/s) 4.0 4.0 4.0 4.0Percent Blockage 3 1 1 1Right turn flare (veh)Median type None NoneMedian storage veh)Upstream signal (ft)pX, platoon unblockedvC, conflicting volume 99 86 59 69 106 19 73 13vC1, stage 1 conf volvC2, stage 2 conf volvCu, unblocked vol 99 86 59 69 106 19 73 13tC, single (s) 7.1 6.5 6.2 7.1 6.5 6.2 4.1 4.1tC, 2 stage (s)tF (s) 3.5 4.0 3.3 3.5 4.0 3.3 2.2 2.2p0 queue free % 93 97 100 100 97 99 100 99cM capacity (veh/h) 805 772 980 865 753 1048 1497 1601
Direction, Lane # EB 1 WB 1 NB 1 SB 1Volume Total 80 30 0 50Volume Left 60 0 0 10Volume Right 0 10 0 40cSH 797 831 1700 1601Volume to Capacity 0.10 0.04 0.00 0.01Queue Length 95th (ft) 8 3 0 0Control Delay (s) 10.0 9.5 0.0 1.5Lane LOS B A AApproach Delay (s) 10.0 9.5 0.0 1.5Approach LOS B A
Intersection SummaryAverage Delay 7.3Intersection Capacity Utilization 28.8% ICU Level of Service AAnalysis Period (min) 15
HCM Signalized Intersection Capacity Analysis Children's Hospital 10: MLK Way & 52nd Street DC_2020 PM Plus Phase 1
Fehr & Peers Synchro 8 Report
Movement EBL EBT EBR WBL WBT WBR NBU NBL NBT NBR SBU SBLLane ConfigurationsVolume (vph) 88 112 100 112 95 261 50 90 1757 75 4 207Ideal Flow (vphpl) 1900 1900 1900 1900 1900 1900 1900 1900 1900 1900 1900 1900Total Lost time (s) 5.0 5.0 5.0 5.0 4.5 4.5 4.0Lane Util. Factor 1.00 1.00 1.00 1.00 1.00 0.91 1.00Frpb, ped/bikes 1.00 0.95 1.00 0.96 1.00 1.00 1.00Flpb, ped/bikes 0.99 1.00 0.97 1.00 1.00 1.00 1.00Frt 1.00 0.93 1.00 0.85 1.00 0.99 1.00Flt Protected 0.95 1.00 0.97 1.00 0.95 1.00 0.95Satd. Flow (prot) 1762 1668 1762 1525 1787 5095 1787Flt Permitted 0.51 1.00 0.57 1.00 0.95 1.00 0.95Satd. Flow (perm) 942 1668 1039 1525 1787 5095 1787Peak-hour factor, PHF 1.00 1.00 1.00 1.00 1.00 1.00 1.00 1.00 1.00 1.00 1.00 1.00Adj. Flow (vph) 88 112 100 112 95 261 50 90 1757 75 4 207RTOR Reduction (vph) 0 35 0 0 0 196 0 0 4 0 0 0Lane Group Flow (vph) 88 177 0 0 207 65 0 140 1828 0 0 211Confl. Peds. (#/hr) 21 80 80 21 13Confl. Bikes (#/hr) 12 6 20Heavy Vehicles (%) 1% 1% 1% 2% 2% 2% 1% 1% 1% 1% 1% 1%Turn Type Perm NA Perm NA Perm Prot Prot NA Prot ProtProtected Phases 4 8 5 5 2 1 1Permitted Phases 4 8 8Actuated Green, G (s) 24.9 24.9 24.9 24.9 12.0 44.1 17.5Effective Green, g (s) 24.9 24.9 24.9 24.9 12.0 44.1 17.5Actuated g/C Ratio 0.25 0.25 0.25 0.25 0.12 0.44 0.18Clearance Time (s) 5.0 5.0 5.0 5.0 4.5 4.5 4.0Vehicle Extension (s) 2.0 2.0 2.0 2.0 2.0 2.0 2.0Lane Grp Cap (vph) 234 415 258 379 214 2246 312v/s Ratio Prot 0.11 0.08 c0.36 0.12v/s Ratio Perm 0.09 c0.20 0.04v/c Ratio 0.38 0.43 0.80 0.17 0.65 0.81 0.68Uniform Delay, d1 31.1 31.5 35.2 29.5 42.0 24.4 38.6Progression Factor 1.00 1.00 0.93 2.51 0.98 1.06 0.62Incremental Delay, d2 0.4 0.3 14.9 0.1 2.1 1.3 4.2Delay (s) 31.5 31.8 47.8 74.0 43.5 27.2 28.2Level of Service C C D E D C CApproach Delay (s) 31.7 62.4 28.3Approach LOS C E C
Intersection SummaryHCM 2000 Control Delay 24.6 HCM 2000 Level of Service CHCM 2000 Volume to Capacity ratio 0.79Actuated Cycle Length (s) 100.0 Sum of lost time (s) 14.0Intersection Capacity Utilization 109.9% ICU Level of Service HAnalysis Period (min) 15c Critical Lane Group

HCM Signalized Intersection Capacity Analysis Children's Hospital 10: MLK Way & 52nd Street DC_2020 PM Plus Phase 1
Fehr & Peers Synchro 8 Report
Movement SBT SBRLane ConfigurationsVolume (vph) 1568 14Ideal Flow (vphpl) 1900 1900Total Lost time (s) 4.5Lane Util. Factor 0.91Frpb, ped/bikes 1.00Flpb, ped/bikes 1.00Frt 1.00Flt Protected 1.00Satd. Flow (prot) 5125Flt Permitted 1.00Satd. Flow (perm) 5125Peak-hour factor, PHF 1.00 1.00Adj. Flow (vph) 1568 14RTOR Reduction (vph) 1 0Lane Group Flow (vph) 1581 0Confl. Peds. (#/hr) 17Confl. Bikes (#/hr) 23Heavy Vehicles (%) 1% 1%Turn Type NAProtected Phases 6Permitted PhasesActuated Green, G (s) 49.1Effective Green, g (s) 49.1Actuated g/C Ratio 0.49Clearance Time (s) 4.5Vehicle Extension (s) 2.0Lane Grp Cap (vph) 2516v/s Ratio Prot c0.31v/s Ratio Permv/c Ratio 0.63Uniform Delay, d1 18.7Progression Factor 0.31Incremental Delay, d2 1.1Delay (s) 6.9Level of Service AApproach Delay (s) 9.4Approach LOS A
Intersection Summary
HCM Signalized Intersection Capacity Analysis Children's Hospital 11: 52nd Street & Garage DC_2020 PM Plus Phase 1
Fehr & Peers Synchro 8 Report
Movement EBL EBT EBR WBL WBT WBR NBL NBT NBR SBL SBT SBRLane ConfigurationsVolume (vph) 3 375 8 8 372 2 25 3 13 0 4 59Ideal Flow (vphpl) 1900 1900 1900 1900 1900 1900 1900 1900 1900 1900 1900 1900Total Lost time (s) 3.0 3.0 3.0 3.0Lane Util. Factor 0.95 0.95 1.00 1.00Frpb, ped/bikes 1.00 1.00 0.94 0.99Flpb, ped/bikes 1.00 1.00 1.00 1.00Frt 1.00 1.00 0.96 0.87Flt Protected 1.00 1.00 0.97 1.00Satd. Flow (prot) 3515 3596 1432 1640Flt Permitted 0.95 0.95 0.89 1.00Satd. Flow (perm) 3357 3409 1315 1640Peak-hour factor, PHF 1.00 1.00 1.00 1.00 1.00 1.00 1.00 1.00 1.00 1.00 1.00 1.00Adj. Flow (vph) 3 375 8 8 372 2 25 3 13 0 4 59RTOR Reduction (vph) 0 3 0 0 1 0 0 7 0 0 32 0Lane Group Flow (vph) 0 383 0 0 381 0 0 34 0 0 31 0Confl. Peds. (#/hr) 77 77 33 271 271Confl. Bikes (#/hr) 13 8 2Heavy Vehicles (%) 2% 2% 2% 0% 0% 0% 16% 16% 16% 0% 0% 0%Turn Type Prot NA Perm NA Perm NA NAProtected Phases 5 2 6 4 8Permitted Phases 6 4 8Actuated Green, G (s) 21.0 14.0 23.0 23.0Effective Green, g (s) 21.0 14.0 23.0 23.0Actuated g/C Ratio 0.42 0.28 0.46 0.46Clearance Time (s) 3.0 3.0 3.0 3.0Lane Grp Cap (vph) 1422 954 604 754v/s Ratio Prot c0.02 0.02v/s Ratio Perm 0.09 c0.11 c0.03v/c Ratio 0.27 0.40 0.06 0.04Uniform Delay, d1 9.5 14.6 7.5 7.4Progression Factor 1.91 1.00 1.00 1.00Incremental Delay, d2 0.4 1.3 0.2 0.1Delay (s) 18.5 15.8 7.7 7.5Level of Service B B A AApproach Delay (s) 18.5 15.8 7.7 7.5Approach LOS B B A A
Intersection SummaryHCM 2000 Control Delay 16.0 HCM 2000 Level of Service BHCM 2000 Volume to Capacity ratio 0.20Actuated Cycle Length (s) 50.0 Sum of lost time (s) 9.0Intersection Capacity Utilization 41.9% ICU Level of Service AAnalysis Period (min) 15c Critical Lane Group
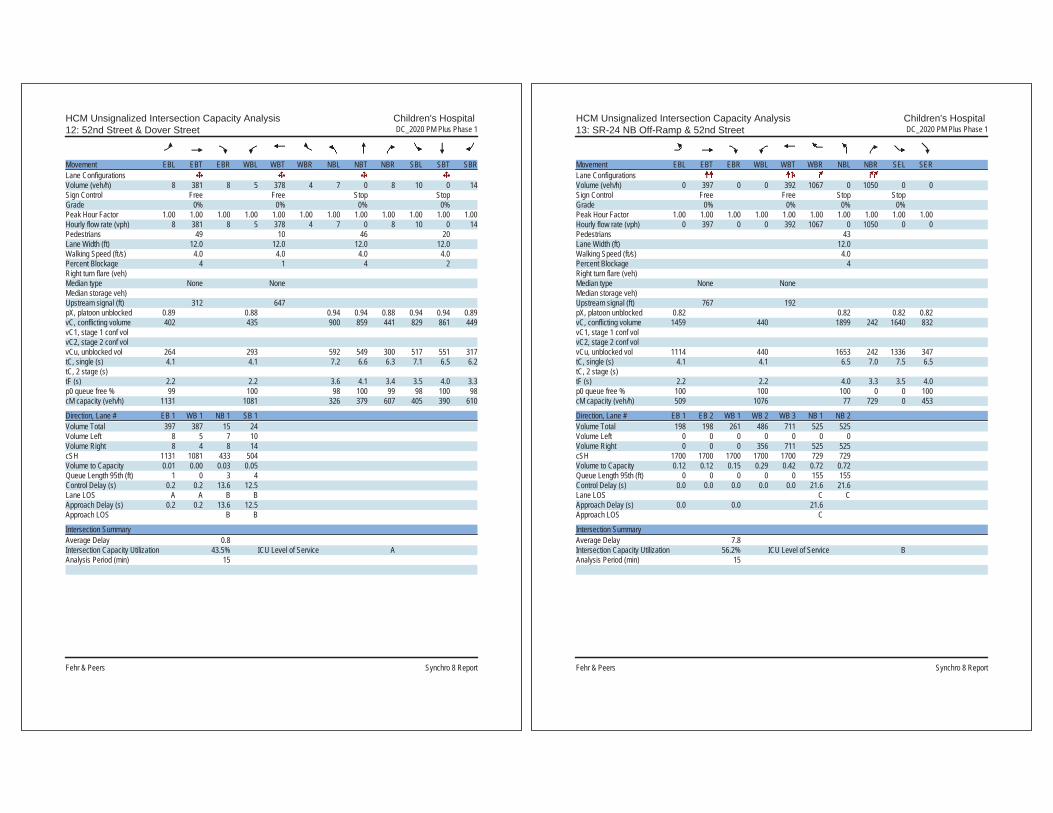
HCM Unsignalized Intersection Capacity Analysis Children's Hospital 12: 52nd Street & Dover Street DC_2020 PM Plus Phase 1
Fehr & Peers Synchro 8 Report
Movement EBL EBT EBR WBL WBT WBR NBL NBT NBR SBL SBT SBRLane ConfigurationsVolume (veh/h) 8 381 8 5 378 4 7 0 8 10 0 14Sign Control Free Free Stop StopGrade 0% 0% 0% 0%Peak Hour Factor 1.00 1.00 1.00 1.00 1.00 1.00 1.00 1.00 1.00 1.00 1.00 1.00Hourly flow rate (vph) 8 381 8 5 378 4 7 0 8 10 0 14Pedestrians 49 10 46 20Lane Width (ft) 12.0 12.0 12.0 12.0Walking Speed (ft/s) 4.0 4.0 4.0 4.0Percent Blockage 4 1 4 2Right turn flare (veh)Median type None NoneMedian storage veh)Upstream signal (ft) 312 647pX, platoon unblocked 0.89 0.88 0.94 0.94 0.88 0.94 0.94 0.89vC, conflicting volume 402 435 900 859 441 829 861 449vC1, stage 1 conf volvC2, stage 2 conf volvCu, unblocked vol 264 293 592 549 300 517 551 317tC, single (s) 4.1 4.1 7.2 6.6 6.3 7.1 6.5 6.2tC, 2 stage (s)tF (s) 2.2 2.2 3.6 4.1 3.4 3.5 4.0 3.3p0 queue free % 99 100 98 100 99 98 100 98cM capacity (veh/h) 1131 1081 326 379 607 405 390 610
Direction, Lane # EB 1 WB 1 NB 1 SB 1Volume Total 397 387 15 24Volume Left 8 5 7 10Volume Right 8 4 8 14cSH 1131 1081 433 504Volume to Capacity 0.01 0.00 0.03 0.05Queue Length 95th (ft) 1 0 3 4Control Delay (s) 0.2 0.2 13.6 12.5Lane LOS A A B BApproach Delay (s) 0.2 0.2 13.6 12.5Approach LOS B B
Intersection SummaryAverage Delay 0.8Intersection Capacity Utilization 43.5% ICU Level of Service AAnalysis Period (min) 15
HCM Unsignalized Intersection Capacity Analysis Children's Hospital 13: SR-24 NB Off-Ramp & 52nd Street DC_2020 PM Plus Phase 1
Fehr & Peers Synchro 8 Report
Movement EBL EBT EBR WBL WBT WBR NBL NBR SEL SERLane ConfigurationsVolume (veh/h) 0 397 0 0 392 1067 0 1050 0 0Sign Control Free Free Stop StopGrade 0% 0% 0% 0%Peak Hour Factor 1.00 1.00 1.00 1.00 1.00 1.00 1.00 1.00 1.00 1.00Hourly flow rate (vph) 0 397 0 0 392 1067 0 1050 0 0Pedestrians 43Lane Width (ft) 12.0Walking Speed (ft/s) 4.0Percent Blockage 4Right turn flare (veh)Median type None NoneMedian storage veh)Upstream signal (ft) 767 192pX, platoon unblocked 0.82 0.82 0.82 0.82vC, conflicting volume 1459 440 1899 242 1640 832vC1, stage 1 conf volvC2, stage 2 conf volvCu, unblocked vol 1114 440 1653 242 1336 347tC, single (s) 4.1 4.1 6.5 7.0 7.5 6.5tC, 2 stage (s)tF (s) 2.2 2.2 4.0 3.3 3.5 4.0p0 queue free % 100 100 100 0 0 100cM capacity (veh/h) 509 1076 77 729 0 453
Direction, Lane # EB 1 EB 2 WB 1 WB 2 WB 3 NB 1 NB 2Volume Total 198 198 261 486 711 525 525Volume Left 0 0 0 0 0 0 0Volume Right 0 0 0 356 711 525 525cSH 1700 1700 1700 1700 1700 729 729Volume to Capacity 0.12 0.12 0.15 0.29 0.42 0.72 0.72Queue Length 95th (ft) 0 0 0 0 0 155 155Control Delay (s) 0.0 0.0 0.0 0.0 0.0 21.6 21.6Lane LOS C CApproach Delay (s) 0.0 0.0 21.6Approach LOS C
Intersection SummaryAverage Delay 7.8Intersection Capacity Utilization 56.2% ICU Level of Service BAnalysis Period (min) 15

HCM Signalized Intersection Capacity Analysis Children's Hospital 14: 52nd Street & Shattuck Ave DC_2020 PM Plus Phase 1
Fehr & Peers Synchro 8 Report
Movement EBU EBL EBT EBR WBL WBT WBR NBL NBT NBR SBL SBTLane ConfigurationsVolume (vph) 50 320 887 190 60 882 150 160 240 60 171 150Ideal Flow (vphpl) 1900 1900 1900 1900 1900 1900 1900 1900 1900 1900 1900 1900Total Lost time (s) 4.0 4.5 4.0 4.5 4.0 5.5 5.5Lane Util. Factor 1.00 0.91 1.00 0.91 1.00 1.00 1.00Frpb, ped/bikes 1.00 0.98 1.00 0.99 1.00 0.99 1.00Flpb, ped/bikes 1.00 1.00 1.00 1.00 1.00 1.00 0.99Frt 1.00 0.97 1.00 0.98 1.00 0.97 1.00Flt Protected 0.95 1.00 0.95 1.00 0.95 1.00 0.97Satd. Flow (prot) 1787 4919 1805 5012 1752 1764 1708Flt Permitted 0.95 1.00 0.95 1.00 0.25 1.00 0.68Satd. Flow (perm) 1787 4919 1805 5012 467 1764 1193Peak-hour factor, PHF 1.00 1.00 1.00 1.00 1.00 1.00 1.00 1.00 1.00 1.00 1.00 1.00Adj. Flow (vph) 50 320 887 190 60 882 150 160 240 60 171 150RTOR Reduction (vph) 0 0 29 0 0 21 0 0 8 0 0 0Lane Group Flow (vph) 0 370 1048 0 60 1011 0 160 292 0 0 321Confl. Peds. (#/hr) 19 19 15 29 29Confl. Bikes (#/hr) 17 11 39Heavy Vehicles (%) 1% 1% 1% 1% 0% 0% 0% 3% 3% 3% 7% 7%Turn Type Prot Prot NA Prot NA pm+pt NA Perm NAProtected Phases 7 7 4 3 8 5 2 6Permitted Phases 2 6Actuated Green, G (s) 33.5 55.1 5.2 26.8 35.7 35.7 26.2Effective Green, g (s) 33.5 55.1 5.2 26.8 35.7 35.7 26.2Actuated g/C Ratio 0.30 0.50 0.05 0.24 0.32 0.32 0.24Clearance Time (s) 4.0 4.5 4.0 4.5 4.0 5.5 5.5Vehicle Extension (s) 3.0 3.0 3.0 3.0 3.0 3.0 3.0Lane Grp Cap (vph) 544 2463 85 1221 215 572 284v/s Ratio Prot c0.21 0.21 0.03 c0.20 c0.04 0.17v/s Ratio Perm 0.20 c0.27v/c Ratio 0.68 0.43 0.71 0.83 0.74 0.51 1.13Uniform Delay, d1 33.6 17.4 51.6 39.4 32.8 30.1 41.9Progression Factor 1.00 1.00 1.00 1.00 1.00 1.00 1.00Incremental Delay, d2 6.7 0.5 23.3 6.5 13.0 3.2 93.2Delay (s) 40.3 17.9 75.0 46.0 45.8 33.3 135.1Level of Service D B E D D C FApproach Delay (s) 23.7 47.5 37.6 82.2Approach LOS C D D F
Intersection SummaryHCM 2000 Control Delay 43.4 HCM 2000 Level of Service DHCM 2000 Volume to Capacity ratio 0.86Actuated Cycle Length (s) 110.0 Sum of lost time (s) 18.0Intersection Capacity Utilization 104.8% ICU Level of Service GAnalysis Period (min) 15c Critical Lane Group
HCM Signalized Intersection Capacity Analysis Children's Hospital 14: 52nd Street & Shattuck Ave DC_2020 PM Plus Phase 1
Fehr & Peers Synchro 8 Report
Movement SBRLane ConfigurationsVolume (vph) 367Ideal Flow (vphpl) 1900Total Lost time (s) 5.5Lane Util. Factor 1.00Frpb, ped/bikes 0.93Flpb, ped/bikes 1.00Frt 0.85Flt Protected 1.00Satd. Flow (prot) 1400Flt Permitted 1.00Satd. Flow (perm) 1400Peak-hour factor, PHF 1.00Adj. Flow (vph) 367RTOR Reduction (vph) 280Lane Group Flow (vph) 87Confl. Peds. (#/hr) 24Confl. Bikes (#/hr) 36Heavy Vehicles (%) 7%Turn Type PermProtected PhasesPermitted Phases 6Actuated Green, G (s) 26.2Effective Green, g (s) 26.2Actuated g/C Ratio 0.24Clearance Time (s) 5.5Vehicle Extension (s) 3.0Lane Grp Cap (vph) 333v/s Ratio Protv/s Ratio Perm 0.06v/c Ratio 0.26Uniform Delay, d1 34.0Progression Factor 1.00Incremental Delay, d2 1.9Delay (s) 36.0Level of Service DApproach Delay (s)Approach LOS
Intersection Summary

HCM Signalized Intersection Capacity Analysis Children's Hospital 15: Telegraph Ave & 52nd Street/Claremont Ave DC_2020 PM Plus Phase 1
Fehr & Peers Synchro 8 Report
Movement EBL EBT EBR WBL WBT WBR NBL NBT NBR SBL SBT SBRLane ConfigurationsVolume (vph) 20 20 20 140 80 180 20 957 270 140 721 301Ideal Flow (vphpl) 1900 1900 1900 1900 1900 1900 1900 1900 1900 1900 1900 1900Lane Width 12 12 12 12 12 12 12 16 12 12 12 12Total Lost time (s) 4.5 4.5 4.5 4.5 4.5 4.5Lane Util. Factor 1.00 0.95 0.95 0.95 1.00 0.95Frpb, ped/bikes 0.99 1.00 0.94 0.98 1.00 0.91Flpb, ped/bikes 1.00 1.00 1.00 1.00 1.00 1.00Frt 0.95 1.00 0.90 0.97 1.00 0.96Flt Protected 0.98 0.95 1.00 1.00 0.95 1.00Satd. Flow (prot) 1642 1698 1513 3770 1770 3088Flt Permitted 0.98 0.95 1.00 0.93 0.95 1.00Satd. Flow (perm) 1642 1698 1513 3496 1770 3088Peak-hour factor, PHF 1.00 1.00 1.00 1.00 1.00 1.00 1.00 1.00 1.00 1.00 1.00 1.00Adj. Flow (vph) 20 20 20 140 80 180 20 957 270 140 721 301RTOR Reduction (vph) 0 19 0 0 73 0 0 22 0 0 39 0Lane Group Flow (vph) 0 41 0 126 201 0 0 1225 0 140 983 0Confl. Peds. (#/hr) 45 45 91 29 91Confl. Bikes (#/hr) 2 13 46 63Heavy Vehicles (%) 8% 8% 8% 1% 1% 1% 3% 3% 3% 2% 2% 2%Turn Type Split NA Split NA Perm NA Prot NAProtected Phases 4 4 8 8 2 1 6Permitted Phases 2Actuated Green, G (s) 6.2 18.0 18.0 45.9 11.9 62.3Effective Green, g (s) 6.2 18.0 18.0 45.9 11.9 62.3Actuated g/C Ratio 0.06 0.18 0.18 0.46 0.12 0.62Clearance Time (s) 4.5 4.5 4.5 4.5 4.5 4.5Vehicle Extension (s) 3.0 3.0 3.0 3.0 3.0 3.0Lane Grp Cap (vph) 101 305 272 1604 210 1923v/s Ratio Prot c0.03 0.07 c0.13 c0.08 0.32v/s Ratio Perm c0.35v/c Ratio 0.41 0.41 0.74 0.76 0.67 0.51Uniform Delay, d1 45.1 36.3 38.8 22.5 42.2 10.4Progression Factor 1.81 1.00 1.00 0.57 1.00 1.00Incremental Delay, d2 1.2 0.9 10.0 2.4 7.8 1.0Delay (s) 82.8 37.2 48.8 15.3 49.9 11.4Level of Service F D D B D BApproach Delay (s) 82.8 45.2 15.3 16.0Approach LOS F D B B
Intersection SummaryHCM 2000 Control Delay 21.2 HCM 2000 Level of Service CHCM 2000 Volume to Capacity ratio 0.72Actuated Cycle Length (s) 100.0 Sum of lost time (s) 18.0Intersection Capacity Utilization 99.6% ICU Level of Service FAnalysis Period (min) 15c Critical Lane Group
HCM Signalized Intersection Capacity Analysis Children's Hospital 16: Telegraph Ave & 51St Street DC_2020 PM Plus Phase 1
Fehr & Peers Synchro 8 Report
Movement EBL EBT EBR WBL WBT WBR NBL NBT NBR SBL SBT SBRLane ConfigurationsVolume (vph) 317 660 101 70 520 240 101 690 120 280 541 60Ideal Flow (vphpl) 1900 1900 1900 1900 1900 1900 1900 1900 1900 1900 1900 1900Total Lost time (s) 4.0 4.0 4.0 3.5 4.0 4.5 4.0 3.5Lane Util. Factor 0.97 0.95 1.00 0.95 1.00 0.95 1.00 0.95Frpb, ped/bikes 1.00 0.98 1.00 0.97 1.00 0.98 1.00 0.97Flpb, ped/bikes 1.00 1.00 1.00 1.00 1.00 1.00 1.00 1.00Frt 1.00 0.98 1.00 0.95 1.00 0.98 1.00 0.99Flt Protected 0.95 1.00 0.95 1.00 0.95 1.00 0.95 1.00Satd. Flow (prot) 3400 3383 1787 3299 1719 3293 1752 3363Flt Permitted 0.95 1.00 0.95 1.00 0.95 1.00 0.95 1.00Satd. Flow (perm) 3400 3383 1787 3299 1719 3293 1752 3363Peak-hour factor, PHF 1.00 1.00 1.00 1.00 1.00 1.00 1.00 1.00 1.00 1.00 1.00 1.00Adj. Flow (vph) 317 660 101 70 520 240 101 690 120 280 541 60RTOR Reduction (vph) 0 12 0 0 54 0 0 14 0 0 9 0Lane Group Flow (vph) 317 749 0 70 706 0 101 796 0 280 592 0Confl. Peds. (#/hr) 68 50 75 120Confl. Bikes (#/hr) 11 20 45 71Heavy Vehicles (%) 3% 3% 3% 1% 1% 1% 5% 5% 5% 3% 3% 3%Turn Type Prot NA Prot NA Prot NA Prot NAProtected Phases 7 4 3 8 5 2 1 6Permitted PhasesActuated Green, G (s) 14.2 29.1 8.0 23.4 8.5 33.4 13.0 38.9Effective Green, g (s) 14.2 29.1 8.0 23.4 8.5 33.4 13.0 38.9Actuated g/C Ratio 0.14 0.29 0.08 0.23 0.08 0.33 0.13 0.39Clearance Time (s) 4.0 4.0 4.0 3.5 4.0 4.5 4.0 3.5Vehicle Extension (s) 3.0 3.0 3.0 3.0 3.0 3.0 3.0 3.0Lane Grp Cap (vph) 482 984 142 771 146 1099 227 1308v/s Ratio Prot c0.09 0.22 0.04 c0.21 0.06 c0.24 c0.16 0.18v/s Ratio Permv/c Ratio 0.66 0.76 0.49 0.92 0.69 0.72 1.23 0.45Uniform Delay, d1 40.6 32.3 44.1 37.3 44.5 29.3 43.5 22.7Progression Factor 1.00 1.00 1.00 1.00 1.00 1.00 1.21 0.70Incremental Delay, d2 3.2 5.5 2.7 17.4 13.2 4.2 134.2 1.0Delay (s) 43.8 37.8 46.7 54.8 57.7 33.4 186.8 16.8Level of Service D D D D E C F BApproach Delay (s) 39.6 54.1 36.1 70.8Approach LOS D D D E
Intersection SummaryHCM 2000 Control Delay 49.4 HCM 2000 Level of Service DHCM 2000 Volume to Capacity ratio 0.85Actuated Cycle Length (s) 100.0 Sum of lost time (s) 16.5Intersection Capacity Utilization 85.3% ICU Level of Service EAnalysis Period (min) 15c Critical Lane Group

HCM Signalized Intersection Capacity Analysis Children's Hospital 17: SB SR-24 On-Ramp & MLK Way & NB SR-24 Off-Ramp DC_2020 PM Plus Phase 1
Fehr & Peers Synchro 8 Report
Movement EBL EBT EBR WBL WBT WBR NBL NBT NBR SBL SBT SBRLane ConfigurationsVolume (vph) 300 0 0 0 0 1672 0 0 0 0 1620 240Ideal Flow (vphpl) 1900 1900 1900 1900 1900 1900 1900 1900 1900 1900 1900 1900Total Lost time (s) 4.0 4.0 4.0 4.0Lane Util. Factor 0.97 1.00 0.95 0.88Frpb, ped/bikes 1.00 1.00 1.00 1.00Flpb, ped/bikes 1.00 1.00 1.00 1.00Frt 1.00 0.86 1.00 0.85Flt Protected 0.95 1.00 1.00 1.00Satd. Flow (prot) 3273 1627 3574 2814Flt Permitted 0.95 1.00 1.00 1.00Satd. Flow (perm) 3273 1627 3574 2814Peak-hour factor, PHF 1.00 1.00 1.00 1.00 1.00 1.00 1.00 1.00 1.00 1.00 1.00 1.00Adj. Flow (vph) 300 0 0 0 0 1672 0 0 0 0 1620 240RTOR Reduction (vph) 0 0 0 0 0 0 0 0 0 0 0 0Lane Group Flow (vph) 300 0 0 0 0 1672 0 0 0 0 1620 240Confl. Peds. (#/hr) 3Confl. Bikes (#/hr) 12Heavy Vehicles (%) 7% 7% 2% 2% 1% 1% 2% 2% 2% 2% 1% 1%Turn Type Prot Free NA customProtected Phases 2 6 FreePermitted Phases FreeActuated Green, G (s) 13.0 50.0 29.0 50.0Effective Green, g (s) 13.0 50.0 29.0 50.0Actuated g/C Ratio 0.26 1.00 0.58 1.00Clearance Time (s) 4.0 4.0Lane Grp Cap (vph) 850 1627 2072 2814v/s Ratio Prot 0.09 0.45 0.09v/s Ratio Perm c1.03v/c Ratio 0.35 1.03 0.78 0.09Uniform Delay, d1 15.1 25.0 8.1 0.0Progression Factor 1.00 1.00 2.61 1.00Incremental Delay, d2 1.2 29.7 2.4 0.0Delay (s) 16.2 54.7 23.5 0.0Level of Service B D C AApproach Delay (s) 16.2 54.7 0.0 20.4Approach LOS B D A C
Intersection SummaryHCM 2000 Control Delay 35.1 HCM 2000 Level of Service DHCM 2000 Volume to Capacity ratio 1.22Actuated Cycle Length (s) 50.0 Sum of lost time (s) 8.0Intersection Capacity Utilization 60.0% ICU Level of Service BAnalysis Period (min) 15c Critical Lane Group
HCM Unsignalized Intersection Capacity Analysis Children's Hospital 18: West Street & 52nd Street DC_2020 PM Plus Phase 1
Fehr & Peers Synchro 8 Report
Movement EBL EBT EBR WBL WBT WBR NBL NBT NBR SBL SBT SBRLane ConfigurationsSign Control Stop Stop Stop StopVolume (vph) 0 140 10 90 109 0 50 0 140 10 60 10Peak Hour Factor 1.00 1.00 1.00 1.00 1.00 1.00 1.00 1.00 1.00 1.00 1.00 1.00Hourly flow rate (vph) 0 140 10 90 109 0 50 0 140 10 60 10
Direction, Lane # EB 1 WB 1 NB 1 NB 2 SB 1Volume Total (vph) 150 199 50 140 80Volume Left (vph) 0 90 50 0 10Volume Right (vph) 10 0 0 140 10Hadj (s) -0.02 0.12 0.50 -0.70 -0.02Departure Headway (s) 4.8 4.9 6.0 4.8 5.1Degree Utilization, x 0.20 0.27 0.08 0.19 0.11Capacity (veh/h) 696 693 568 704 641Control Delay (s) 9.0 9.7 8.3 7.6 8.8Approach Delay (s) 9.0 9.7 7.8 8.8Approach LOS A A A A
Intersection SummaryDelay 8.8Level of Service AIntersection Capacity Utilization 42.7% ICU Level of Service AAnalysis Period (min) 15

HCM Unsignalized Intersection Capacity Analysis Children's Hospital 19: Genoa Street & 52nd Street DC_2020 PM Plus Phase 1
Fehr & Peers Synchro 8 Report
Movement EBL EBT EBR WBL WBT WBR NBL NBT NBR SBL SBT SBRLane ConfigurationsSign Control Stop Stop Stop StopVolume (vph) 10 130 10 10 109 50 10 10 10 20 10 10Peak Hour Factor 1.00 1.00 1.00 1.00 1.00 1.00 1.00 1.00 1.00 1.00 1.00 1.00Hourly flow rate (vph) 10 130 10 10 109 50 10 10 10 20 10 10
Direction, Lane # EB 1 WB 1 NB 1 SB 1Volume Total (vph) 150 169 30 40Volume Left (vph) 10 10 10 20Volume Right (vph) 10 50 10 10Hadj (s) -0.01 -0.17 -0.13 -0.05Departure Headway (s) 4.2 4.1 4.5 4.6Degree Utilization, x 0.18 0.19 0.04 0.05Capacity (veh/h) 830 867 738 724Control Delay (s) 8.1 8.0 7.7 7.8Approach Delay (s) 8.1 8.0 7.7 7.8Approach LOS A A A A
Intersection SummaryDelay 8.0Level of Service AIntersection Capacity Utilization 23.7% ICU Level of Service AAnalysis Period (min) 15
HCM Unsignalized Intersection Capacity Analysis Children's Hospital 20: Genoa Street & 55th Street DC_2020 PM Plus Phase 1
Fehr & Peers Synchro 8 Report
Movement EBL EBT EBR WBL WBT WBR NBL NBT NBR SBL SBT SBRLane ConfigurationsVolume (veh/h) 20 380 10 20 381 40 10 20 40 40 10 20Sign Control Free Free Stop StopGrade 0% 0% 0% 0%Peak Hour Factor 1.00 1.00 1.00 1.00 1.00 1.00 1.00 1.00 1.00 1.00 1.00 1.00Hourly flow rate (vph) 20 380 10 20 381 40 10 20 40 40 10 20Pedestrians 7 10 4Lane Width (ft) 12.0 12.0 12.0Walking Speed (ft/s) 4.0 4.0 4.0Percent Blockage 1 1 0Right turn flare (veh)Median type None NoneMedian storage veh)Upstream signal (ft) 721pX, platoon unblockedvC, conflicting volume 425 400 908 900 395 920 885 412vC1, stage 1 conf volvC2, stage 2 conf volvCu, unblocked vol 425 400 908 900 395 920 885 412tC, single (s) 4.1 4.1 7.1 6.5 6.2 7.1 6.5 6.2tC, 2 stage (s)tF (s) 2.2 2.2 3.5 4.0 3.3 3.5 4.0 3.3p0 queue free % 98 98 96 93 94 81 96 97cM capacity (veh/h) 1136 1160 231 268 653 214 271 634
Direction, Lane # EB 1 WB 1 NB 1 SB 1Volume Total 410 441 70 70Volume Left 20 20 10 40Volume Right 10 40 40 20cSH 1136 1160 391 274Volume to Capacity 0.02 0.02 0.18 0.26Queue Length 95th (ft) 1 1 16 25Control Delay (s) 0.6 0.5 16.2 22.6Lane LOS A A C CApproach Delay (s) 0.6 0.5 16.2 22.6Approach LOS C C
Intersection SummaryAverage Delay 3.2Intersection Capacity Utilization 47.4% ICU Level of Service AAnalysis Period (min) 15

HCM Unsignalized Intersection Capacity Analysis Children's Hospital 21: MLK Way & RIRO Main Garage DC_2020 PM Plus Phase 1
Fehr & Peers Synchro 8 Report
Movement WBL WBR NBT NBR SBL SBTLane ConfigurationsVolume (veh/h) 0 123 2076 34 0 1793Sign Control Stop Free FreeGrade 0% 0% 0%Peak Hour Factor 1.00 1.00 1.00 1.00 1.00 1.00Hourly flow rate (vph) 0 123 2076 34 0 1793PedestriansLane Width (ft)Walking Speed (ft/s)Percent BlockageRight turn flare (veh)Median type None NoneMedian storage veh)Upstream signal (ft) 154 137pX, platoon unblocked 0.77 0.69 0.69vC, conflicting volume 2691 709 2110vC1, stage 1 conf volvC2, stage 2 conf volvCu, unblocked vol 749 0 1019tC, single (s) 6.8 6.9 4.1tC, 2 stage (s)tF (s) 3.5 3.3 2.2p0 queue free % 100 83 100cM capacity (veh/h) 266 745 465
Direction, Lane # WB 1 NB 1 NB 2 NB 3 SB 1 SB 2 SB 3Volume Total 123 830 830 449 598 598 598Volume Left 0 0 0 0 0 0 0Volume Right 123 0 0 34 0 0 0cSH 745 1700 1700 1700 1700 1700 1700Volume to Capacity 0.17 0.49 0.49 0.26 0.35 0.35 0.35Queue Length 95th (ft) 15 0 0 0 0 0 0Control Delay (s) 10.8 0.0 0.0 0.0 0.0 0.0 0.0Lane LOS BApproach Delay (s) 10.8 0.0 0.0Approach LOS B
Intersection SummaryAverage Delay 0.3Intersection Capacity Utilization 55.1% ICU Level of Service BAnalysis Period (min) 15
HCM Unsignalized Intersection Capacity Analysis Children's Hospital 22: MLK Way & RIRO Main Plaza DC_2020 PM Plus Phase 1
Fehr & Peers Synchro 8 Report
Movement WBL WBR NBT NBR SBL SBTLane ConfigurationsVolume (veh/h) 0 0 1952 20 0 1830Sign Control Stop Free FreeGrade 0% 0% 0%Peak Hour Factor 1.00 1.00 1.00 1.00 1.00 1.00Hourly flow rate (vph) 0 0 1952 20 0 1830PedestriansLane Width (ft)Walking Speed (ft/s)Percent BlockageRight turn flare (veh)Median type None NoneMedian storage veh)Upstream signal (ft) 424 204pX, platoon unblocked 0.77vC, conflicting volume 2572 661 1972vC1, stage 1 conf volvC2, stage 2 conf volvCu, unblocked vol 2005 661 1972tC, single (s) 6.8 6.9 4.1tC, 2 stage (s)tF (s) 3.5 3.3 2.2p0 queue free % 100 100 100cM capacity (veh/h) 40 405 290
Direction, Lane # WB 1 NB 1 NB 2 NB 3 SB 1 SB 2 SB 3Volume Total 0 781 781 410 610 610 610Volume Left 0 0 0 0 0 0 0Volume Right 0 0 0 20 0 0 0cSH 1700 1700 1700 1700 1700 1700 1700Volume to Capacity 0.00 0.46 0.46 0.24 0.36 0.36 0.36Queue Length 95th (ft) 0 0 0 0 0 0 0Control Delay (s) 0.0 0.0 0.0 0.0 0.0 0.0 0.0Lane LOS AApproach Delay (s) 0.0 0.0 0.0Approach LOS A
Intersection SummaryAverage Delay 0.0Intersection Capacity Utilization 41.5% ICU Level of Service AAnalysis Period (min) 15

HCM Unsignalized Intersection Capacity Analysis Children's Hospital 24: 51St Street & 52nd Street DC_2020 PM Plus Phase 1
Fehr & Peers Synchro 8 Report
Intersection Sign configuration not allowed in HCM analysis.
HCM Signalized Intersection Capacity Analysis Children's Hospital1: MLK Way & 55th Street DC_2020 AM Plus Phase 2
Fehr & Peers Synchro 8 Report
Movement EBL EBT EBR WBL WBT WBR NBU NBL NBT NBR SBL SBTLane ConfigurationsVolume (vph) 20 180 230 60 240 80 21 150 1386 72 90 1341Ideal Flow (vphpl) 1900 1900 1900 1900 1900 1900 1900 1900 1900 1900 1900 1900Total Lost time (s) 5.0 5.0 4.5 5.0 4.5 5.0Lane Util. Factor 1.00 1.00 1.00 0.91 1.00 0.91Frpb, ped/bikes 0.98 0.99 1.00 1.00 1.00 1.00Flpb, ped/bikes 1.00 1.00 1.00 1.00 1.00 1.00Frt 0.93 0.97 1.00 0.99 1.00 0.99Flt Protected 1.00 0.99 0.95 1.00 0.95 1.00Satd. Flow (prot) 1703 1747 1770 5027 1770 5047Flt Permitted 0.98 0.77 0.95 1.00 0.95 1.00Satd. Flow (perm) 1664 1360 1770 5027 1770 5047Peak-hour factor, PHF 1.00 1.00 1.00 1.00 1.00 1.00 1.00 1.00 1.00 1.00 1.00 1.00Adj. Flow (vph) 20 180 230 60 240 80 21 150 1386 72 90 1341RTOR Reduction (vph) 0 52 0 0 12 0 0 0 5 0 0 4Lane Group Flow (vph) 0 378 0 0 368 0 0 171 1453 0 90 1387Confl. Peds. (#/hr) 10 19 19 10 28Confl. Bikes (#/hr) 21 20 8Heavy Vehicles (%) 1% 1% 1% 4% 4% 4% 2% 2% 2% 2% 2% 2%Turn Type Perm NA Perm NA Prot Prot NA Prot NAProtected Phases 4 8 5 5 2 1 6Permitted Phases 4 8Actuated Green, G (s) 27.7 27.7 14.4 41.8 6.0 33.4Effective Green, g (s) 27.7 27.7 14.4 41.8 6.0 33.4Actuated g/C Ratio 0.31 0.31 0.16 0.46 0.07 0.37Clearance Time (s) 5.0 5.0 4.5 5.0 4.5 5.0Vehicle Extension (s) 3.0 3.0 3.0 3.0 3.0 3.0Lane Grp Cap (vph) 512 418 283 2334 118 1872v/s Ratio Prot 0.10 c0.29 0.05 c0.27v/s Ratio Perm 0.23 c0.27v/c Ratio 0.74 0.88 0.60 0.62 0.76 0.74Uniform Delay, d1 27.9 29.6 35.2 18.2 41.3 24.5Progression Factor 1.00 1.00 0.55 0.25 1.00 1.00Incremental Delay, d2 5.5 19.0 3.3 1.1 24.8 2.7Delay (s) 33.4 48.6 22.5 5.7 66.1 27.2Level of Service C D C A E CApproach Delay (s) 33.4 48.6 7.5 29.6Approach LOS C D A C
Intersection SummaryHCM 2000 Control Delay 22.7 HCM 2000 Level of Service CHCM 2000 Volume to Capacity ratio 0.79Actuated Cycle Length (s) 90.0 Sum of lost time (s) 14.5Intersection Capacity Utilization 90.3% ICU Level of Service EAnalysis Period (min) 15c Critical Lane Group

HCM Signalized Intersection Capacity Analysis Children's Hospital1: MLK Way & 55th Street DC_2020 AM Plus Phase 2
Fehr & Peers Synchro 8 Report
Movement SBRLane ConfigurationsVolume (vph) 50Ideal Flow (vphpl) 1900Total Lost time (s)Lane Util. FactorFrpb, ped/bikesFlpb, ped/bikesFrtFlt ProtectedSatd. Flow (prot)Flt PermittedSatd. Flow (perm)Peak-hour factor, PHF 1.00Adj. Flow (vph) 50RTOR Reduction (vph) 0Lane Group Flow (vph) 0Confl. Peds. (#/hr) 16Confl. Bikes (#/hr) 10Heavy Vehicles (%) 2%Turn TypeProtected PhasesPermitted PhasesActuated Green, G (s)Effective Green, g (s)Actuated g/C RatioClearance Time (s)Vehicle Extension (s)Lane Grp Cap (vph)v/s Ratio Protv/s Ratio Permv/c RatioUniform Delay, d1Progression FactorIncremental Delay, d2Delay (s)Level of ServiceApproach Delay (s)Approach LOS
Intersection Summary
HCM Unsignalized Intersection Capacity Analysis Children's Hospital2: Dover Street & 55th Street DC_2020 AM Plus Phase 2
Fehr & Peers Synchro 8 Report
Movement EBL EBT EBR WBL WBT WBR NBL NBT NBR SBL SBT SBRLane ConfigurationsVolume (veh/h) 30 302 10 30 320 10 10 10 20 10 10 30Sign Control Free Free Stop StopGrade 0% 0% 0% 0%Peak Hour Factor 1.00 1.00 1.00 1.00 1.00 1.00 1.00 1.00 1.00 1.00 1.00 1.00Hourly flow rate (vph) 30 302 10 30 320 10 10 10 20 10 10 30Pedestrians 12 26 20 8Lane Width (ft) 12.0 12.0 12.0 12.0Walking Speed (ft/s) 4.0 4.0 4.0 4.0Percent Blockage 1 2 2 1Right turn flare (veh)Median type None NoneMedian storage veh)Upstream signal (ft) 641 677pX, platoon unblocked 0.89 0.89 0.89 0.89 0.89 0.89vC, conflicting volume 338 332 819 785 353 811 785 345vC1, stage 1 conf volvC2, stage 2 conf volvCu, unblocked vol 196 332 736 698 353 727 698 204tC, single (s) 4.1 4.1 7.1 6.5 6.2 7.1 6.5 6.2tC, 2 stage (s)tF (s) 2.2 2.2 3.5 4.0 3.3 3.5 4.0 3.3p0 queue free % 98 97 96 97 97 96 97 96cM capacity (veh/h) 1203 1196 259 304 669 262 301 731
Direction, Lane # EB 1 WB 1 NB 1 SB 1Volume Total 342 360 40 50Volume Left 30 30 10 10Volume Right 10 10 20 30cSH 1203 1196 394 445Volume to Capacity 0.02 0.03 0.10 0.11Queue Length 95th (ft) 2 2 8 9Control Delay (s) 0.9 0.9 15.2 14.1Lane LOS A A C BApproach Delay (s) 0.9 0.9 15.2 14.1Approach LOS C B
Intersection SummaryAverage Delay 2.5Intersection Capacity Utilization 41.1% ICU Level of Service AAnalysis Period (min) 15
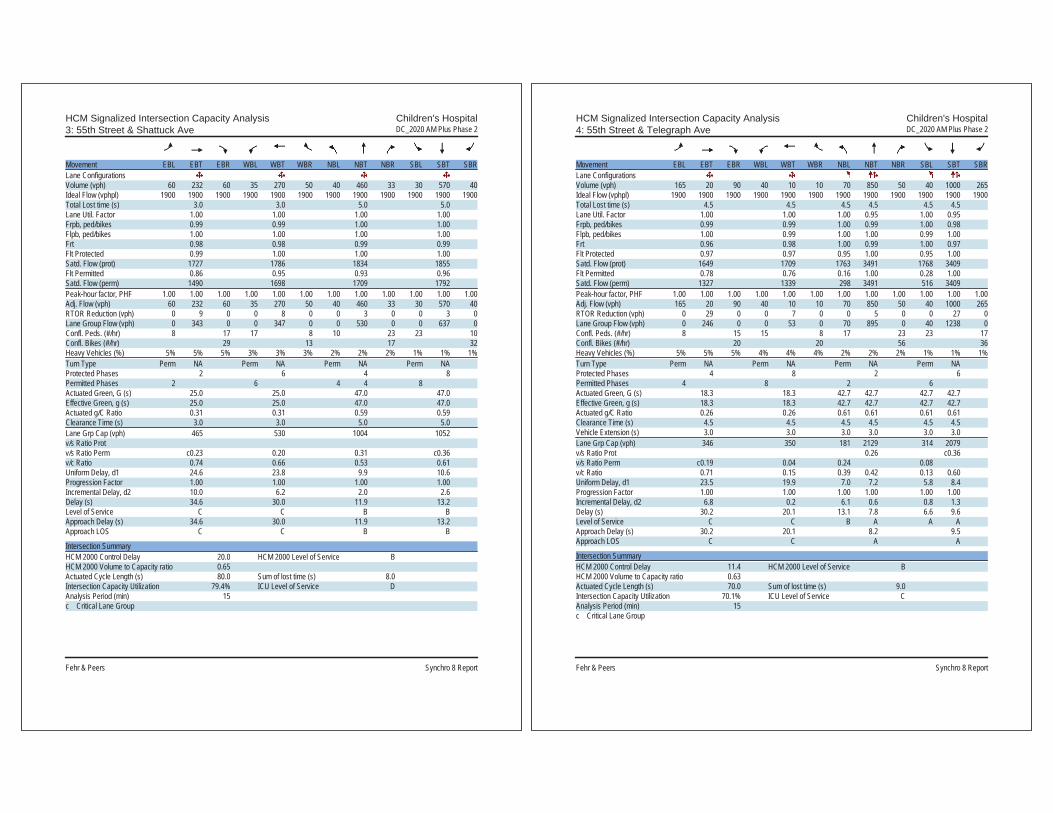
HCM Signalized Intersection Capacity Analysis Children's Hospital3: 55th Street & Shattuck Ave DC_2020 AM Plus Phase 2
Fehr & Peers Synchro 8 Report
Movement EBL EBT EBR WBL WBT WBR NBL NBT NBR SBL SBT SBRLane ConfigurationsVolume (vph) 60 232 60 35 270 50 40 460 33 30 570 40Ideal Flow (vphpl) 1900 1900 1900 1900 1900 1900 1900 1900 1900 1900 1900 1900Total Lost time (s) 3.0 3.0 5.0 5.0Lane Util. Factor 1.00 1.00 1.00 1.00Frpb, ped/bikes 0.99 0.99 1.00 1.00Flpb, ped/bikes 1.00 1.00 1.00 1.00Frt 0.98 0.98 0.99 0.99Flt Protected 0.99 1.00 1.00 1.00Satd. Flow (prot) 1727 1786 1834 1855Flt Permitted 0.86 0.95 0.93 0.96Satd. Flow (perm) 1490 1698 1709 1792Peak-hour factor, PHF 1.00 1.00 1.00 1.00 1.00 1.00 1.00 1.00 1.00 1.00 1.00 1.00Adj. Flow (vph) 60 232 60 35 270 50 40 460 33 30 570 40RTOR Reduction (vph) 0 9 0 0 8 0 0 3 0 0 3 0Lane Group Flow (vph) 0 343 0 0 347 0 0 530 0 0 637 0Confl. Peds. (#/hr) 8 17 17 8 10 23 23 10Confl. Bikes (#/hr) 29 13 17 32Heavy Vehicles (%) 5% 5% 5% 3% 3% 3% 2% 2% 2% 1% 1% 1%Turn Type Perm NA Perm NA Perm NA Perm NAProtected Phases 2 6 4 8Permitted Phases 2 6 4 4 8Actuated Green, G (s) 25.0 25.0 47.0 47.0Effective Green, g (s) 25.0 25.0 47.0 47.0Actuated g/C Ratio 0.31 0.31 0.59 0.59Clearance Time (s) 3.0 3.0 5.0 5.0Lane Grp Cap (vph) 465 530 1004 1052v/s Ratio Protv/s Ratio Perm c0.23 0.20 0.31 c0.36v/c Ratio 0.74 0.66 0.53 0.61Uniform Delay, d1 24.6 23.8 9.9 10.6Progression Factor 1.00 1.00 1.00 1.00Incremental Delay, d2 10.0 6.2 2.0 2.6Delay (s) 34.6 30.0 11.9 13.2Level of Service C C B BApproach Delay (s) 34.6 30.0 11.9 13.2Approach LOS C C B B
Intersection SummaryHCM 2000 Control Delay 20.0 HCM 2000 Level of Service BHCM 2000 Volume to Capacity ratio 0.65Actuated Cycle Length (s) 80.0 Sum of lost time (s) 8.0Intersection Capacity Utilization 79.4% ICU Level of Service DAnalysis Period (min) 15c Critical Lane Group
HCM Signalized Intersection Capacity Analysis Children's Hospital4: 55th Street & Telegraph Ave DC_2020 AM Plus Phase 2
Fehr & Peers Synchro 8 Report
Movement EBL EBT EBR WBL WBT WBR NBL NBT NBR SBL SBT SBRLane ConfigurationsVolume (vph) 165 20 90 40 10 10 70 850 50 40 1000 265Ideal Flow (vphpl) 1900 1900 1900 1900 1900 1900 1900 1900 1900 1900 1900 1900Total Lost time (s) 4.5 4.5 4.5 4.5 4.5 4.5Lane Util. Factor 1.00 1.00 1.00 0.95 1.00 0.95Frpb, ped/bikes 0.99 0.99 1.00 0.99 1.00 0.98Flpb, ped/bikes 1.00 0.99 1.00 1.00 0.99 1.00Frt 0.96 0.98 1.00 0.99 1.00 0.97Flt Protected 0.97 0.97 0.95 1.00 0.95 1.00Satd. Flow (prot) 1649 1709 1763 3491 1768 3409Flt Permitted 0.78 0.76 0.16 1.00 0.28 1.00Satd. Flow (perm) 1327 1339 298 3491 516 3409Peak-hour factor, PHF 1.00 1.00 1.00 1.00 1.00 1.00 1.00 1.00 1.00 1.00 1.00 1.00Adj. Flow (vph) 165 20 90 40 10 10 70 850 50 40 1000 265RTOR Reduction (vph) 0 29 0 0 7 0 0 5 0 0 27 0Lane Group Flow (vph) 0 246 0 0 53 0 70 895 0 40 1238 0Confl. Peds. (#/hr) 8 15 15 8 17 23 23 17Confl. Bikes (#/hr) 20 20 56 36Heavy Vehicles (%) 5% 5% 5% 4% 4% 4% 2% 2% 2% 1% 1% 1%Turn Type Perm NA Perm NA Perm NA Perm NAProtected Phases 4 8 2 6Permitted Phases 4 8 2 6Actuated Green, G (s) 18.3 18.3 42.7 42.7 42.7 42.7Effective Green, g (s) 18.3 18.3 42.7 42.7 42.7 42.7Actuated g/C Ratio 0.26 0.26 0.61 0.61 0.61 0.61Clearance Time (s) 4.5 4.5 4.5 4.5 4.5 4.5Vehicle Extension (s) 3.0 3.0 3.0 3.0 3.0 3.0Lane Grp Cap (vph) 346 350 181 2129 314 2079v/s Ratio Prot 0.26 c0.36v/s Ratio Perm c0.19 0.04 0.24 0.08v/c Ratio 0.71 0.15 0.39 0.42 0.13 0.60Uniform Delay, d1 23.5 19.9 7.0 7.2 5.8 8.4Progression Factor 1.00 1.00 1.00 1.00 1.00 1.00Incremental Delay, d2 6.8 0.2 6.1 0.6 0.8 1.3Delay (s) 30.2 20.1 13.1 7.8 6.6 9.6Level of Service C C B A A AApproach Delay (s) 30.2 20.1 8.2 9.5Approach LOS C C A A
Intersection SummaryHCM 2000 Control Delay 11.4 HCM 2000 Level of Service BHCM 2000 Volume to Capacity ratio 0.63Actuated Cycle Length (s) 70.0 Sum of lost time (s) 9.0Intersection Capacity Utilization 70.1% ICU Level of Service CAnalysis Period (min) 15c Critical Lane Group

HCM Unsignalized Intersection Capacity Analysis Children's Hospital5: MLK Way & 54th Street DC_2020 AM Plus Phase 2
Fehr & Peers Synchro 8 Report
Movement EBL EBT EBR WBL WBT WBR NBU NBL NBT NBR SBL SBTLane ConfigurationsVolume (veh/h) 10 10 50 10 10 10 11 20 1577 26 20 1602Sign Control Stop Stop Free FreeGrade 0% 0% 0% 0%Peak Hour Factor 1.00 1.00 1.00 1.00 1.00 1.00 1.00 1.00 1.00 1.00 1.00 1.00Hourly flow rate (vph) 10 10 50 10 10 10 0 20 1577 26 20 1602Pedestrians 10 8 11Lane Width (ft) 12.0 12.0 12.0Walking Speed (ft/s) 4.0 4.0 4.0Percent Blockage 1 1 1Right turn flare (veh)Median type None NoneMedian storage veh)Upstream signal (ft) 299 294pX, platoon unblocked 0.85 0.85 0.77 0.85 0.85 0.83 0.00 0.77 0.83vC, conflicting volume 2238 3308 560 2278 3300 547 0 1622 1611vC1, stage 1 conf volvC2, stage 2 conf volvCu, unblocked vol 483 1738 0 531 1729 0 0 747 1009tC, single (s) 7.5 6.5 6.9 7.5 6.5 6.9 0.0 4.1 4.1tC, 2 stage (s)tF (s) *5.0 *5.0 *5.0 *5.0 *5.0 *5.0 0.0 2.2 2.2p0 queue free % 96 85 91 95 85 98 0 97 96cM capacity (veh/h) 250 65 542 213 66 592 0 652 566
Direction, Lane # EB 1 WB 1 NB 1 NB 2 NB 3 SB 1 SB 2 SB 3Volume Total 70 30 414 788 420 420 801 410Volume Left 10 10 20 0 0 20 0 0Volume Right 50 10 0 0 26 0 0 10cSH 245 139 652 1700 1700 566 1700 1700Volume to Capacity 0.29 0.22 0.03 0.46 0.25 0.04 0.47 0.24Queue Length 95th (ft) 29 20 2 0 0 3 0 0Control Delay (s) 25.5 37.8 0.9 0.0 0.0 1.1 0.0 0.0Lane LOS D E A AApproach Delay (s) 25.5 37.8 0.2 0.3Approach LOS D E
Intersection SummaryAverage Delay 1.1Intersection Capacity Utilization 67.5% ICU Level of Service CAnalysis Period (min) 15
* User Entered Value
HCM Unsignalized Intersection Capacity Analysis Children's Hospital5: MLK Way & 54th Street DC_2020 AM Plus Phase 2
Fehr & Peers Synchro 8 Report
Movement SBRLane ConfigurationsVolume (veh/h) 10Sign ControlGradePeak Hour Factor 1.00Hourly flow rate (vph) 10PedestriansLane Width (ft)Walking Speed (ft/s)Percent BlockageRight turn flare (veh)Median typeMedian storage veh)Upstream signal (ft)pX, platoon unblockedvC, conflicting volumevC1, stage 1 conf volvC2, stage 2 conf volvCu, unblocked voltC, single (s)tC, 2 stage (s)tF (s)p0 queue free %cM capacity (veh/h)
Direction, Lane #

HCM Unsignalized Intersection Capacity Analysis Children's Hospital6: Dover Street & 54th Street DC_2020 AM Plus Phase 2
Fehr & Peers Synchro 8 Report
Movement EBL EBT EBR WBL WBT WBR NBL NBT NBR SBL SBT SBRLane ConfigurationsVolume (veh/h) 10 16 10 10 10 10 10 20 20 10 40 10Sign Control Stop Stop Free FreeGrade 0% 0% 0% 0%Peak Hour Factor 1.00 1.00 1.00 1.00 1.00 1.00 1.00 1.00 1.00 1.00 1.00 1.00Hourly flow rate (vph) 10 16 10 10 10 10 10 20 20 10 40 10Pedestrians 13 19 3 8Lane Width (ft) 12.0 12.0 12.0 12.0Walking Speed (ft/s) 4.0 4.0 4.0 4.0Percent Blockage 1 2 0 1Right turn flare (veh)Median type None NoneMedian storage veh)Upstream signal (ft)pX, platoon unblockedvC, conflicting volume 151 157 61 155 152 57 63 59vC1, stage 1 conf volvC2, stage 2 conf volvCu, unblocked vol 151 157 61 155 152 57 63 59tC, single (s) 7.1 6.5 6.2 7.1 6.5 6.2 4.1 4.1tC, 2 stage (s)tF (s) 3.5 4.0 3.3 3.5 4.0 3.3 2.2 2.2p0 queue free % 99 98 99 99 99 99 99 99cM capacity (veh/h) 767 710 996 756 714 992 1536 1533
Direction, Lane # EB 1 WB 1 NB 1 SB 1Volume Total 36 30 50 60Volume Left 10 10 10 10Volume Right 10 10 20 10cSH 789 804 1536 1533Volume to Capacity 0.05 0.04 0.01 0.01Queue Length 95th (ft) 4 3 0 0Control Delay (s) 9.8 9.6 1.5 1.3Lane LOS A A A AApproach Delay (s) 9.8 9.6 1.5 1.3Approach LOS A A
Intersection SummaryAverage Delay 4.5Intersection Capacity Utilization 21.1% ICU Level of Service AAnalysis Period (min) 15
HCM Unsignalized Intersection Capacity Analysis Children's Hospital7: Shattuck Ave & 54th Street DC_2020 AM Plus Phase 2
Fehr & Peers Synchro 8 Report
Movement EBL EBR NBL NBT SBT SBRLane ConfigurationsVolume (veh/h) 10 26 20 523 635 10Sign Control Stop Free FreeGrade 0% 0% 0%Peak Hour Factor 1.00 1.00 1.00 1.00 1.00 1.00Hourly flow rate (vph) 10 26 20 523 635 10Pedestrians 12 3 2Lane Width (ft) 12.0 12.0 12.0Walking Speed (ft/s) 4.0 4.0 4.0Percent Blockage 1 0 0Right turn flare (veh)Median type None NoneMedian storage veh)Upstream signal (ft) 550 282pX, platoon unblocked 0.79 0.79 0.79vC, conflicting volume 1217 655 657vC1, stage 1 conf volvC2, stage 2 conf volvCu, unblocked vol 1128 426 428tC, single (s) 6.4 6.2 4.1tC, 2 stage (s)tF (s) 3.5 3.3 2.2p0 queue free % 94 95 98cM capacity (veh/h) 174 492 881
Direction, Lane # EB 1 NB 1 SB 1Volume Total 36 543 645Volume Left 10 20 0Volume Right 26 0 10cSH 326 881 1700Volume to Capacity 0.11 0.02 0.38Queue Length 95th (ft) 9 2 0Control Delay (s) 17.4 0.6 0.0Lane LOS C AApproach Delay (s) 17.4 0.6 0.0Approach LOS C
Intersection SummaryAverage Delay 0.8Intersection Capacity Utilization 54.7% ICU Level of Service AAnalysis Period (min) 15

HCM Signalized Intersection Capacity Analysis Children's Hospital8: MLK Way & 53rd Street DC_2020 AM Plus Phase 2
Fehr & Peers Synchro 8 Report
Movement EBL EBT EBR WBL WBT WBR NBL NBT NBR SBL SBT SBRLane ConfigurationsVolume (vph) 10 1 49 60 10 18 30 1616 93 4 1684 10Ideal Flow (vphpl) 1900 1900 1900 1900 1900 1900 1900 1900 1900 1900 1900 1900Total Lost time (s) 5.0 5.0 4.0 3.5 4.0 3.5Lane Util. Factor 1.00 1.00 1.00 0.91 1.00 0.91Frpb, ped/bikes 0.98 1.00 1.00 1.00 1.00 1.00Flpb, ped/bikes 1.00 0.99 1.00 1.00 1.00 1.00Frt 0.89 0.97 1.00 0.99 1.00 1.00Flt Protected 0.99 0.97 0.95 1.00 0.95 1.00Satd. Flow (prot) 1611 1767 1770 5025 1787 5128Flt Permitted 0.95 0.77 0.95 1.00 0.95 1.00Satd. Flow (perm) 1548 1400 1770 5025 1787 5128Peak-hour factor, PHF 1.00 1.00 1.00 1.00 1.00 1.00 1.00 1.00 1.00 1.00 1.00 1.00Adj. Flow (vph) 10 1 49 60 10 18 30 1616 93 4 1684 10RTOR Reduction (vph) 0 40 0 0 13 0 0 4 0 0 0 0Lane Group Flow (vph) 0 20 0 0 75 0 30 1705 0 4 1694 0Confl. Peds. (#/hr) 10 17 17 10 17 26Confl. Bikes (#/hr) 7 17Heavy Vehicles (%) 2% 2% 2% 0% 0% 0% 2% 2% 2% 1% 1% 1%Turn Type Perm NA Perm NA Prot NA Prot NAProtected Phases 4 8 5 2 1 6Permitted Phases 4 8Actuated Green, G (s) 16.7 16.7 4.5 59.0 1.8 56.3Effective Green, g (s) 16.7 16.7 4.5 59.0 1.8 56.3Actuated g/C Ratio 0.19 0.19 0.05 0.66 0.02 0.63Clearance Time (s) 5.0 5.0 4.0 3.5 4.0 3.5Vehicle Extension (s) 3.0 3.0 3.0 3.0 3.0 3.0Lane Grp Cap (vph) 287 259 88 3294 35 3207v/s Ratio Prot 0.02 c0.34 0.00 c0.33v/s Ratio Perm 0.01 c0.05v/c Ratio 0.07 0.29 0.34 0.52 0.11 0.53Uniform Delay, d1 30.2 31.5 41.3 8.1 43.3 9.4Progression Factor 1.00 1.00 1.18 0.55 0.51 0.26Incremental Delay, d2 0.1 0.6 1.8 0.4 1.1 0.5Delay (s) 30.3 32.2 50.3 4.9 23.0 2.9Level of Service C C D A C AApproach Delay (s) 30.3 32.2 5.7 3.0Approach LOS C C A A
Intersection SummaryHCM 2000 Control Delay 5.5 HCM 2000 Level of Service AHCM 2000 Volume to Capacity ratio 0.49Actuated Cycle Length (s) 90.0 Sum of lost time (s) 12.5Intersection Capacity Utilization 58.8% ICU Level of Service BAnalysis Period (min) 15c Critical Lane Group
HCM Unsignalized Intersection Capacity Analysis Children's Hospital9: Dover Street & 53rd Street DC_2020 AM Plus Phase 2
Fehr & Peers Synchro 8 Report
Movement EBL EBT EBR WBL WBT WBR NBL NBT NBR SBL SBT SBRLane ConfigurationsVolume (veh/h) 50 30 0 0 20 10 0 0 0 10 0 50Sign Control Stop Stop Free FreeGrade 0% 0% 0% 0%Peak Hour Factor 1.00 1.00 1.00 1.00 1.00 1.00 1.00 1.00 1.00 1.00 1.00 1.00Hourly flow rate (vph) 50 30 0 0 20 10 0 0 0 10 0 50Pedestrians 29 28 3 3Lane Width (ft) 12.0 12.0 12.0 12.0Walking Speed (ft/s) 4.0 4.0 4.0 4.0Percent Blockage 2 2 0 0Right turn flare (veh)Median type None NoneMedian storage veh)Upstream signal (ft)pX, platoon unblockedvC, conflicting volume 97 102 57 91 127 31 79 28vC1, stage 1 conf volvC2, stage 2 conf volvCu, unblocked vol 97 102 57 91 127 31 79 28tC, single (s) 7.1 6.5 6.2 7.1 6.5 6.2 4.1 4.1tC, 2 stage (s)tF (s) 3.5 4.0 3.3 3.5 4.0 3.3 2.2 2.2p0 queue free % 94 96 100 100 97 99 100 99cM capacity (veh/h) 806 750 988 814 727 1022 1495 1561
Direction, Lane # EB 1 WB 1 NB 1 SB 1Volume Total 80 30 0 60Volume Left 50 0 0 10Volume Right 0 10 0 50cSH 784 804 1700 1561Volume to Capacity 0.10 0.04 0.00 0.01Queue Length 95th (ft) 8 3 0 0Control Delay (s) 10.1 9.7 0.0 1.3Lane LOS B A AApproach Delay (s) 10.1 9.7 0.0 1.3Approach LOS B A
Intersection SummaryAverage Delay 6.9Intersection Capacity Utilization 28.4% ICU Level of Service AAnalysis Period (min) 15

HCM Signalized Intersection Capacity Analysis Children's Hospital10: MLK Way & 52nd Street DC_2020 AM Plus Phase 2
Fehr & Peers Synchro 8 Report
Movement EBL EBT EBR WBL WBT WBR NBU NBL NBT NBR SBU SBLLane ConfigurationsVolume (vph) 59 84 110 91 85 288 60 80 1540 101 36 162Ideal Flow (vphpl) 1900 1900 1900 1900 1900 1900 1900 1900 1900 1900 1900 1900Total Lost time (s) 5.0 5.0 5.0 5.0 4.5 4.5 4.0Lane Util. Factor 1.00 1.00 1.00 1.00 1.00 0.91 1.00Frpb, ped/bikes 1.00 0.96 1.00 0.97 1.00 1.00 1.00Flpb, ped/bikes 0.99 1.00 0.98 1.00 1.00 1.00 1.00Frt 1.00 0.91 1.00 0.85 1.00 0.99 1.00Flt Protected 0.95 1.00 0.97 1.00 0.95 1.00 0.95Satd. Flow (prot) 1772 1650 1778 1537 1787 5074 1787Flt Permitted 0.58 1.00 0.66 1.00 0.95 1.00 0.95Satd. Flow (perm) 1087 1650 1199 1537 1787 5074 1787Peak-hour factor, PHF 1.00 1.00 1.00 1.00 1.00 1.00 1.00 1.00 1.00 1.00 1.00 1.00Adj. Flow (vph) 59 84 110 91 85 288 60 80 1540 101 36 162RTOR Reduction (vph) 0 60 0 0 0 174 0 0 7 0 0 0Lane Group Flow (vph) 59 134 0 0 176 114 0 140 1634 0 0 198Confl. Peds. (#/hr) 13 64 64 13 10Confl. Bikes (#/hr) 8 7 2Heavy Vehicles (%) 1% 1% 1% 2% 2% 2% 1% 1% 1% 1% 1% 1%Turn Type Perm NA Perm NA Perm Prot Prot NA Prot ProtProtected Phases 4 8 5 5 2 1 1Permitted Phases 4 8 8Actuated Green, G (s) 23.0 23.0 23.0 23.0 7.5 41.0 12.5Effective Green, g (s) 23.0 23.0 23.0 23.0 7.5 41.0 12.5Actuated g/C Ratio 0.26 0.26 0.26 0.26 0.08 0.46 0.14Clearance Time (s) 5.0 5.0 5.0 5.0 4.5 4.5 4.0Vehicle Extension (s) 2.0 2.0 2.0 2.0 2.0 2.0 2.0Lane Grp Cap (vph) 277 421 306 392 148 2311 248v/s Ratio Prot 0.08 c0.08 c0.32 c0.11v/s Ratio Perm 0.05 c0.15 0.07v/c Ratio 0.21 0.32 0.58 0.29 0.95 0.71 0.80Uniform Delay, d1 26.4 27.2 29.2 26.9 41.0 19.7 37.5Progression Factor 1.00 1.00 1.00 1.00 1.00 1.07 0.78Incremental Delay, d2 0.1 0.2 1.6 0.2 33.1 0.8 13.8Delay (s) 26.5 27.3 30.9 27.1 74.0 21.8 43.2Level of Service C C C C E C DApproach Delay (s) 27.1 28.5 25.9Approach LOS C C C
Intersection SummaryHCM 2000 Control Delay 22.5 HCM 2000 Level of Service CHCM 2000 Volume to Capacity ratio 0.69Actuated Cycle Length (s) 90.0 Sum of lost time (s) 14.0Intersection Capacity Utilization 104.4% ICU Level of Service GAnalysis Period (min) 15c Critical Lane Group
HCM Signalized Intersection Capacity Analysis Children's Hospital10: MLK Way & 52nd Street DC_2020 AM Plus Phase 2
Fehr & Peers Synchro 8 Report
Movement SBT SBRLane ConfigurationsVolume (vph) 1578 7Ideal Flow (vphpl) 1900 1900Total Lost time (s) 4.5Lane Util. Factor 0.91Frpb, ped/bikes 1.00Flpb, ped/bikes 1.00Frt 1.00Flt Protected 1.00Satd. Flow (prot) 5131Flt Permitted 1.00Satd. Flow (perm) 5131Peak-hour factor, PHF 1.00 1.00Adj. Flow (vph) 1578 7RTOR Reduction (vph) 0 0Lane Group Flow (vph) 1585 0Confl. Peds. (#/hr) 13Confl. Bikes (#/hr) 13Heavy Vehicles (%) 1% 1%Turn Type NAProtected Phases 6Permitted PhasesActuated Green, G (s) 45.5Effective Green, g (s) 45.5Actuated g/C Ratio 0.51Clearance Time (s) 4.5Vehicle Extension (s) 2.0Lane Grp Cap (vph) 2594v/s Ratio Prot 0.31v/s Ratio Permv/c Ratio 0.61Uniform Delay, d1 15.9Progression Factor 0.79Incremental Delay, d2 1.0Delay (s) 13.5Level of Service BApproach Delay (s) 16.8Approach LOS B
Intersection Summary
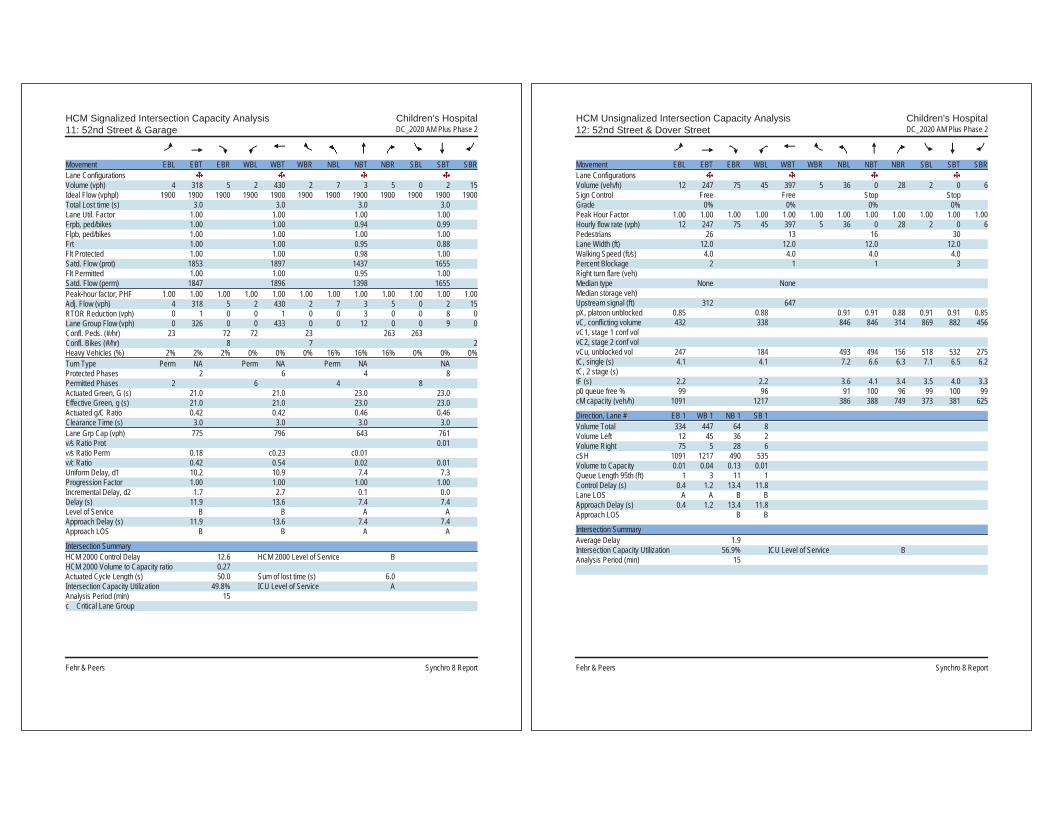
HCM Signalized Intersection Capacity Analysis Children's Hospital11: 52nd Street & Garage DC_2020 AM Plus Phase 2
Fehr & Peers Synchro 8 Report
Movement EBL EBT EBR WBL WBT WBR NBL NBT NBR SBL SBT SBRLane ConfigurationsVolume (vph) 4 318 5 2 430 2 7 3 5 0 2 15Ideal Flow (vphpl) 1900 1900 1900 1900 1900 1900 1900 1900 1900 1900 1900 1900Total Lost time (s) 3.0 3.0 3.0 3.0Lane Util. Factor 1.00 1.00 1.00 1.00Frpb, ped/bikes 1.00 1.00 0.94 0.99Flpb, ped/bikes 1.00 1.00 1.00 1.00Frt 1.00 1.00 0.95 0.88Flt Protected 1.00 1.00 0.98 1.00Satd. Flow (prot) 1853 1897 1437 1655Flt Permitted 1.00 1.00 0.95 1.00Satd. Flow (perm) 1847 1896 1398 1655Peak-hour factor, PHF 1.00 1.00 1.00 1.00 1.00 1.00 1.00 1.00 1.00 1.00 1.00 1.00Adj. Flow (vph) 4 318 5 2 430 2 7 3 5 0 2 15RTOR Reduction (vph) 0 1 0 0 1 0 0 3 0 0 8 0Lane Group Flow (vph) 0 326 0 0 433 0 0 12 0 0 9 0Confl. Peds. (#/hr) 23 72 72 23 263 263Confl. Bikes (#/hr) 8 7 2Heavy Vehicles (%) 2% 2% 2% 0% 0% 0% 16% 16% 16% 0% 0% 0%Turn Type Perm NA Perm NA Perm NA NAProtected Phases 2 6 4 8Permitted Phases 2 6 4 8Actuated Green, G (s) 21.0 21.0 23.0 23.0Effective Green, g (s) 21.0 21.0 23.0 23.0Actuated g/C Ratio 0.42 0.42 0.46 0.46Clearance Time (s) 3.0 3.0 3.0 3.0Lane Grp Cap (vph) 775 796 643 761v/s Ratio Prot 0.01v/s Ratio Perm 0.18 c0.23 c0.01v/c Ratio 0.42 0.54 0.02 0.01Uniform Delay, d1 10.2 10.9 7.4 7.3Progression Factor 1.00 1.00 1.00 1.00Incremental Delay, d2 1.7 2.7 0.1 0.0Delay (s) 11.9 13.6 7.4 7.4Level of Service B B A AApproach Delay (s) 11.9 13.6 7.4 7.4Approach LOS B B A A
Intersection SummaryHCM 2000 Control Delay 12.6 HCM 2000 Level of Service BHCM 2000 Volume to Capacity ratio 0.27Actuated Cycle Length (s) 50.0 Sum of lost time (s) 6.0Intersection Capacity Utilization 49.8% ICU Level of Service AAnalysis Period (min) 15c Critical Lane Group
HCM Unsignalized Intersection Capacity Analysis Children's Hospital12: 52nd Street & Dover Street DC_2020 AM Plus Phase 2
Fehr & Peers Synchro 8 Report
Movement EBL EBT EBR WBL WBT WBR NBL NBT NBR SBL SBT SBRLane ConfigurationsVolume (veh/h) 12 247 75 45 397 5 36 0 28 2 0 6Sign Control Free Free Stop StopGrade 0% 0% 0% 0%Peak Hour Factor 1.00 1.00 1.00 1.00 1.00 1.00 1.00 1.00 1.00 1.00 1.00 1.00Hourly flow rate (vph) 12 247 75 45 397 5 36 0 28 2 0 6Pedestrians 26 13 16 30Lane Width (ft) 12.0 12.0 12.0 12.0Walking Speed (ft/s) 4.0 4.0 4.0 4.0Percent Blockage 2 1 1 3Right turn flare (veh)Median type None NoneMedian storage veh)Upstream signal (ft) 312 647pX, platoon unblocked 0.85 0.88 0.91 0.91 0.88 0.91 0.91 0.85vC, conflicting volume 432 338 846 846 314 869 882 456vC1, stage 1 conf volvC2, stage 2 conf volvCu, unblocked vol 247 184 493 494 156 518 532 275tC, single (s) 4.1 4.1 7.2 6.6 6.3 7.1 6.5 6.2tC, 2 stage (s)tF (s) 2.2 2.2 3.6 4.1 3.4 3.5 4.0 3.3p0 queue free % 99 96 91 100 96 99 100 99cM capacity (veh/h) 1091 1217 386 388 749 373 381 625
Direction, Lane # EB 1 WB 1 NB 1 SB 1Volume Total 334 447 64 8Volume Left 12 45 36 2Volume Right 75 5 28 6cSH 1091 1217 490 535Volume to Capacity 0.01 0.04 0.13 0.01Queue Length 95th (ft) 1 3 11 1Control Delay (s) 0.4 1.2 13.4 11.8Lane LOS A A B BApproach Delay (s) 0.4 1.2 13.4 11.8Approach LOS B B
Intersection SummaryAverage Delay 1.9Intersection Capacity Utilization 56.9% ICU Level of Service BAnalysis Period (min) 15

HCM Unsignalized Intersection Capacity Analysis Children's Hospital13: SR-24 NB Off-Ramp & 52nd Street DC_2020 AM Plus Phase 2
Fehr & Peers Synchro 8 Report
Movement EBL EBT EBR WBL WBT WBR NBL NBR SEL SERLane ConfigurationsVolume (veh/h) 0 283 0 0 456 1141 0 970 0 0Sign Control Free Free Stop StopGrade 0% 0% 0% 0%Peak Hour Factor 1.00 1.00 1.00 1.00 1.00 1.00 1.00 1.00 1.00 1.00Hourly flow rate (vph) 0 283 0 0 456 1141 0 970 0 0Pedestrians 32Lane Width (ft) 12.0Walking Speed (ft/s) 4.0Percent Blockage 3Right turn flare (veh)Median type None NoneMedian storage veh)Upstream signal (ft) 767 192pX, platoon unblocked 0.80 0.80 0.80 0.80vC, conflicting volume 1597 315 1912 174 1568 771vC1, stage 1 conf volvC2, stage 2 conf volvCu, unblocked vol 1256 315 1648 174 1220 230tC, single (s) 4.1 4.1 6.5 7.0 7.5 6.5tC, 2 stage (s)tF (s) 2.2 2.2 4.0 3.3 3.5 4.0p0 queue free % 100 100 100 0 0 100cM capacity (veh/h) 442 1209 77 814 0 524
Direction, Lane # EB 1 EB 2 WB 1 WB 2 WB 3 NB 1 NB 2Volume Total 142 142 304 532 761 485 485Volume Left 0 0 0 0 0 0 0Volume Right 0 0 0 380 761 485 485cSH 1700 1700 1700 1700 1700 814 814Volume to Capacity 0.08 0.08 0.18 0.31 0.45 0.60 0.60Queue Length 95th (ft) 0 0 0 0 0 101 101Control Delay (s) 0.0 0.0 0.0 0.0 0.0 15.7 15.7Lane LOS C CApproach Delay (s) 0.0 0.0 15.7Approach LOS C
Intersection SummaryAverage Delay 5.3Intersection Capacity Utilization 52.0% ICU Level of Service AAnalysis Period (min) 15
HCM Signalized Intersection Capacity Analysis Children's Hospital14: 52nd Street & Shattuck Ave DC_2020 AM Plus Phase 2
Fehr & Peers Synchro 8 Report
Movement EBU EBL EBT EBR WBL WBT WBR NBL NBT NBR SBL SBTLane ConfigurationsVolume (vph) 50 293 750 160 40 981 110 170 130 40 115 160Ideal Flow (vphpl) 1900 1900 1900 1900 1900 1900 1900 1900 1900 1900 1900 1900Total Lost time (s) 4.0 4.5 4.0 4.5 4.0 5.5 5.5Lane Util. Factor 1.00 0.91 1.00 0.91 1.00 1.00 1.00Frpb, ped/bikes 1.00 0.99 1.00 1.00 1.00 0.99 1.00Flpb, ped/bikes 1.00 1.00 1.00 1.00 1.00 1.00 1.00Frt 1.00 0.97 1.00 0.98 1.00 0.96 1.00Flt Protected 0.95 1.00 0.95 1.00 0.95 1.00 0.98Satd. Flow (prot) 1787 4933 1805 5087 1752 1766 1732Flt Permitted 0.95 1.00 0.95 1.00 0.39 1.00 0.79Satd. Flow (perm) 1787 4933 1805 5087 713 1766 1392Peak-hour factor, PHF 1.00 1.00 1.00 1.00 1.00 1.00 1.00 1.00 1.00 1.00 1.00 1.00Adj. Flow (vph) 50 293 750 160 40 981 110 170 130 40 115 160RTOR Reduction (vph) 0 0 32 0 0 15 0 0 13 0 0 0Lane Group Flow (vph) 0 343 878 0 40 1076 0 170 157 0 0 275Confl. Peds. (#/hr) 16 7 13 13Confl. Bikes (#/hr) 16 2 13Heavy Vehicles (%) 1% 1% 1% 1% 0% 0% 0% 3% 3% 3% 7% 7%Turn Type Prot Prot NA Prot NA pm+pt NA Perm NAProtected Phases 7 7 4 3 8 5 2 6Permitted Phases 2 6Actuated Green, G (s) 21.5 35.0 5.1 18.6 35.9 35.9 25.4Effective Green, g (s) 21.5 35.0 5.1 18.6 35.9 35.9 25.4Actuated g/C Ratio 0.24 0.39 0.06 0.21 0.40 0.40 0.28Clearance Time (s) 4.0 4.5 4.0 4.5 4.0 5.5 5.5Vehicle Extension (s) 3.0 3.0 3.0 3.0 3.0 3.0 3.0Lane Grp Cap (vph) 426 1918 102 1051 359 704 392v/s Ratio Prot c0.19 0.18 0.02 c0.21 c0.03 0.09v/s Ratio Perm 0.15 c0.20v/c Ratio 0.81 0.46 0.39 1.02 0.47 0.22 0.70Uniform Delay, d1 32.3 20.4 41.0 35.7 18.7 17.9 28.9Progression Factor 1.00 1.00 1.14 0.86 1.00 1.00 1.00Incremental Delay, d2 14.9 0.8 1.9 30.6 1.0 0.7 10.0Delay (s) 47.2 21.2 48.5 61.1 19.7 18.6 38.9Level of Service D C D E B B DApproach Delay (s) 28.3 60.7 19.1 31.9Approach LOS C E B C
Intersection SummaryHCM 2000 Control Delay 38.9 HCM 2000 Level of Service DHCM 2000 Volume to Capacity ratio 0.80Actuated Cycle Length (s) 90.0 Sum of lost time (s) 18.0Intersection Capacity Utilization 105.8% ICU Level of Service GAnalysis Period (min) 15c Critical Lane Group

HCM Signalized Intersection Capacity Analysis Children's Hospital14: 52nd Street & Shattuck Ave DC_2020 AM Plus Phase 2
Fehr & Peers Synchro 8 Report
Movement SBRLane ConfigurationsVolume (vph) 396Ideal Flow (vphpl) 1900Total Lost time (s) 5.5Lane Util. Factor 1.00Frpb, ped/bikes 0.93Flpb, ped/bikes 1.00Frt 0.85Flt Protected 1.00Satd. Flow (prot) 1398Flt Permitted 1.00Satd. Flow (perm) 1398Peak-hour factor, PHF 1.00Adj. Flow (vph) 396RTOR Reduction (vph) 284Lane Group Flow (vph) 112Confl. Peds. (#/hr) 21Confl. Bikes (#/hr) 54Heavy Vehicles (%) 7%Turn Type PermProtected PhasesPermitted Phases 6Actuated Green, G (s) 25.4Effective Green, g (s) 25.4Actuated g/C Ratio 0.28Clearance Time (s) 5.5Vehicle Extension (s) 3.0Lane Grp Cap (vph) 394v/s Ratio Protv/s Ratio Perm 0.08v/c Ratio 0.28Uniform Delay, d1 25.2Progression Factor 1.00Incremental Delay, d2 1.8Delay (s) 27.0Level of Service CApproach Delay (s)Approach LOS
Intersection Summary
HCM Signalized Intersection Capacity Analysis Children's Hospital15: Telegraph Ave & 52nd Street/Claremont Ave DC_2020 AM Plus Phase 2
Fehr & Peers Synchro 8 Report
Movement EBL EBT EBR WBL WBT WBR NBL NBT NBR SBL SBT SBRLane ConfigurationsVolume (vph) 10 10 10 110 60 180 10 780 130 90 700 360Ideal Flow (vphpl) 1900 1900 1900 1900 1900 1900 1900 1900 1900 1900 1900 1900Lane Width 12 12 12 12 12 12 12 16 12 12 12 12Total Lost time (s) 4.5 4.5 4.5 4.5 4.5 4.5Lane Util. Factor 1.00 0.95 0.95 0.95 1.00 0.95Frpb, ped/bikes 0.99 1.00 0.98 0.99 1.00 0.96Flpb, ped/bikes 1.00 1.00 1.00 1.00 1.00 1.00Frt 0.95 1.00 0.89 0.98 1.00 0.95Flt Protected 0.98 0.95 1.00 1.00 0.95 1.00Satd. Flow (prot) 1641 1698 1565 3849 1770 3232Flt Permitted 0.98 0.95 1.00 0.94 0.95 1.00Satd. Flow (perm) 1641 1698 1565 3625 1770 3232Peak-hour factor, PHF 1.00 1.00 1.00 1.00 1.00 1.00 1.00 1.00 1.00 1.00 1.00 1.00Adj. Flow (vph) 10 10 10 110 60 180 10 780 130 90 700 360RTOR Reduction (vph) 0 10 0 0 119 0 0 11 0 0 51 0Lane Group Flow (vph) 0 21 0 99 132 0 0 909 0 90 1009 0Confl. Peds. (#/hr) 6 6 29 24 29Confl. Bikes (#/hr) 2 3 43 36Heavy Vehicles (%) 8% 8% 8% 1% 1% 1% 3% 3% 3% 2% 2% 2%Turn Type Split NA Split NA Perm NA Prot NAProtected Phases 4 4 8 8 2 1 6Permitted Phases 2Actuated Green, G (s) 4.5 15.7 15.7 43.9 7.9 56.3Effective Green, g (s) 4.5 15.7 15.7 43.9 7.9 56.3Actuated g/C Ratio 0.05 0.17 0.17 0.49 0.09 0.63Clearance Time (s) 4.5 4.5 4.5 4.5 4.5 4.5Vehicle Extension (s) 3.0 3.0 3.0 3.0 3.0 3.0Lane Grp Cap (vph) 82 296 273 1768 155 2021v/s Ratio Prot c0.01 0.06 c0.08 0.05 c0.31v/s Ratio Perm 0.25v/c Ratio 0.25 0.33 0.48 0.51 0.58 0.50Uniform Delay, d1 41.1 32.6 33.5 15.8 39.5 9.2Progression Factor 1.56 1.00 1.00 0.97 1.00 1.00Incremental Delay, d2 1.0 0.7 1.4 0.9 5.4 0.9Delay (s) 65.3 33.2 34.8 16.1 44.9 10.1Level of Service E C C B D BApproach Delay (s) 65.3 34.4 16.1 12.8Approach LOS E C B B
Intersection SummaryHCM 2000 Control Delay 17.8 HCM 2000 Level of Service BHCM 2000 Volume to Capacity ratio 0.51Actuated Cycle Length (s) 90.0 Sum of lost time (s) 18.0Intersection Capacity Utilization 83.5% ICU Level of Service EAnalysis Period (min) 15c Critical Lane Group

HCM Signalized Intersection Capacity Analysis Children's Hospital16: Telegraph Ave & 51St Street DC_2020 AM Plus Phase 2
Fehr & Peers Synchro 8 Report
Movement EBL EBT EBR WBL WBT WBR NBL NBT NBR SBL SBT SBRLane ConfigurationsVolume (vph) 270 532 83 120 564 270 117 380 70 180 590 50Ideal Flow (vphpl) 1900 1900 1900 1900 1900 1900 1900 1900 1900 1900 1900 1900Total Lost time (s) 4.0 4.0 4.0 3.5 4.0 4.5 4.0 3.5Lane Util. Factor 0.97 0.95 1.00 0.95 1.00 0.95 1.00 0.95Frpb, ped/bikes 1.00 0.99 1.00 0.98 1.00 0.99 1.00 0.99Flpb, ped/bikes 1.00 1.00 1.00 1.00 1.00 1.00 1.00 1.00Frt 1.00 0.98 1.00 0.95 1.00 0.98 1.00 0.99Flt Protected 0.95 1.00 0.95 1.00 0.95 1.00 0.95 1.00Satd. Flow (prot) 3400 3401 1787 3323 1719 3313 1752 3433Flt Permitted 0.95 1.00 0.95 1.00 0.95 1.00 0.95 1.00Satd. Flow (perm) 3400 3401 1787 3323 1719 3313 1752 3433Peak-hour factor, PHF 1.00 1.00 1.00 1.00 1.00 1.00 1.00 1.00 1.00 1.00 1.00 1.00Adj. Flow (vph) 270 532 83 120 564 270 117 380 70 180 590 50RTOR Reduction (vph) 0 14 0 0 63 0 0 16 0 0 6 0Lane Group Flow (vph) 270 601 0 120 771 0 117 434 0 180 634 0Confl. Peds. (#/hr) 41 41 39 49Confl. Bikes (#/hr) 12 10 36 36Heavy Vehicles (%) 3% 3% 3% 1% 1% 1% 5% 5% 5% 3% 3% 3%Turn Type Prot NA Prot NA Prot NA Prot NAProtected Phases 7 4 3 8 5 2 1 6Permitted PhasesActuated Green, G (s) 12.0 27.0 10.4 25.9 9.0 24.5 11.6 28.1Effective Green, g (s) 12.0 27.0 10.4 25.9 9.0 24.5 11.6 28.1Actuated g/C Ratio 0.13 0.30 0.12 0.29 0.10 0.27 0.13 0.31Clearance Time (s) 4.0 4.0 4.0 3.5 4.0 4.5 4.0 3.5Vehicle Extension (s) 3.0 3.0 3.0 3.0 3.0 3.0 3.0 3.0Lane Grp Cap (vph) 453 1020 206 956 171 901 225 1071v/s Ratio Prot c0.08 0.18 0.07 c0.23 0.07 0.13 c0.10 c0.18v/s Ratio Permv/c Ratio 0.60 0.59 0.58 0.81 0.68 0.48 0.80 0.59Uniform Delay, d1 36.7 26.8 37.7 29.7 39.1 27.4 38.1 26.1Progression Factor 1.24 0.93 1.00 1.00 1.00 1.00 1.29 0.74Incremental Delay, d2 1.9 2.2 4.2 7.2 10.8 1.8 16.6 2.2Delay (s) 47.3 27.1 41.9 36.9 49.9 29.3 65.5 21.4Level of Service D C D D D C E CApproach Delay (s) 33.3 37.6 33.5 31.1Approach LOS C D C C
Intersection SummaryHCM 2000 Control Delay 34.0 HCM 2000 Level of Service CHCM 2000 Volume to Capacity ratio 0.72Actuated Cycle Length (s) 90.0 Sum of lost time (s) 16.5Intersection Capacity Utilization 75.1% ICU Level of Service DAnalysis Period (min) 15c Critical Lane Group
HCM Signalized Intersection Capacity Analysis Children's Hospital17: SB SR-24 On-Ramp & MLK Way & NB SR-24 Off-Ramp DC_2020 AM Plus Phase 2
Fehr & Peers Synchro 8 Report
Movement EBL EBT EBR WBL WBT WBR NBL NBT NBR SBL SBT SBRLane ConfigurationsVolume (vph) 193 0 0 0 0 1584 0 0 0 0 1537 252Ideal Flow (vphpl) 1900 1900 1900 1900 1900 1900 1900 1900 1900 1900 1900 1900Total Lost time (s) 4.0 4.0 4.0 4.0Lane Util. Factor 0.97 1.00 0.95 0.88Frpb, ped/bikes 1.00 1.00 1.00 1.00Flpb, ped/bikes 1.00 1.00 1.00 1.00Frt 1.00 0.86 1.00 0.85Flt Protected 0.95 1.00 1.00 1.00Satd. Flow (prot) 3273 1627 3574 2814Flt Permitted 0.95 1.00 1.00 1.00Satd. Flow (perm) 3273 1627 3574 2814Peak-hour factor, PHF 1.00 1.00 1.00 1.00 1.00 1.00 1.00 1.00 1.00 1.00 1.00 1.00Adj. Flow (vph) 193 0 0 0 0 1584 0 0 0 0 1537 252RTOR Reduction (vph) 0 0 0 0 0 0 0 0 0 0 0 0Lane Group Flow (vph) 193 0 0 0 0 1584 0 0 0 0 1537 252Confl. Peds. (#/hr) 8Confl. Bikes (#/hr) 3Heavy Vehicles (%) 7% 7% 2% 2% 1% 1% 2% 2% 2% 2% 1% 1%Turn Type Prot Free NA customProtected Phases 2 6 FreePermitted Phases FreeActuated Green, G (s) 8.0 45.0 29.0 45.0Effective Green, g (s) 8.0 45.0 29.0 45.0Actuated g/C Ratio 0.18 1.00 0.64 1.00Clearance Time (s) 4.0 4.0Lane Grp Cap (vph) 581 1627 2303 2814v/s Ratio Prot 0.06 0.43 0.09v/s Ratio Perm c0.97v/c Ratio 0.33 0.97 0.67 0.09Uniform Delay, d1 16.2 0.0 5.0 0.0Progression Factor 1.00 1.00 1.79 1.00Incremental Delay, d2 1.5 16.9 1.3 0.1Delay (s) 17.7 16.9 10.2 0.1Level of Service B B B AApproach Delay (s) 17.7 16.9 0.0 8.8Approach LOS B B A A
Intersection SummaryHCM 2000 Control Delay 12.8 HCM 2000 Level of Service BHCM 2000 Volume to Capacity ratio 1.18Actuated Cycle Length (s) 45.0 Sum of lost time (s) 8.0Intersection Capacity Utilization 54.7% ICU Level of Service AAnalysis Period (min) 15c Critical Lane Group

HCM Unsignalized Intersection Capacity Analysis Children's Hospital18: West Street & 52nd Street DC_2020 AM Plus Phase 2
Fehr & Peers Synchro 8 Report
Movement EBL EBT EBR WBL WBT WBR NBL NBT NBR SBL SBT SBRLane ConfigurationsSign Control Stop Stop Stop StopVolume (vph) 0 173 20 70 102 0 30 0 80 10 50 10Peak Hour Factor 1.00 1.00 1.00 1.00 1.00 1.00 1.00 1.00 1.00 1.00 1.00 1.00Hourly flow rate (vph) 0 173 20 70 102 0 30 0 80 10 50 10
Direction, Lane # EB 1 WB 1 NB 1 NB 2 SB 1Volume Total (vph) 193 172 30 80 70Volume Left (vph) 0 70 30 0 10Volume Right (vph) 20 0 0 80 10Hadj (s) -0.05 0.12 0.50 -0.70 -0.02Departure Headway (s) 4.5 4.7 6.0 4.7 5.0Degree Utilization, x 0.24 0.22 0.05 0.11 0.10Capacity (veh/h) 763 727 565 700 658Control Delay (s) 9.0 9.1 8.1 7.1 8.5Approach Delay (s) 9.0 9.1 7.4 8.5Approach LOS A A A A
Intersection SummaryDelay 8.6Level of Service AIntersection Capacity Utilization 41.6% ICU Level of Service AAnalysis Period (min) 15
HCM Unsignalized Intersection Capacity Analysis Children's Hospital19: Genoa Street & 52nd Street DC_2020 AM Plus Phase 2
Fehr & Peers Synchro 8 Report
Movement EBL EBT EBR WBL WBT WBR NBL NBT NBR SBL SBT SBRLane ConfigurationsSign Control Stop Stop Stop StopVolume (vph) 10 163 10 10 102 30 10 10 10 20 10 10Peak Hour Factor 1.00 1.00 1.00 1.00 1.00 1.00 1.00 1.00 1.00 1.00 1.00 1.00Hourly flow rate (vph) 10 163 10 10 102 30 10 10 10 20 10 10
Direction, Lane # EB 1 WB 1 NB 1 SB 1Volume Total (vph) 183 142 30 40Volume Left (vph) 10 10 10 20Volume Right (vph) 10 30 10 10Hadj (s) 0.00 -0.11 -0.13 -0.05Departure Headway (s) 4.2 4.1 4.5 4.6Degree Utilization, x 0.21 0.16 0.04 0.05Capacity (veh/h) 835 847 734 720Control Delay (s) 8.3 7.9 7.7 7.8Approach Delay (s) 8.3 7.9 7.7 7.8Approach LOS A A A A
Intersection SummaryDelay 8.1Level of Service AIntersection Capacity Utilization 24.2% ICU Level of Service AAnalysis Period (min) 15
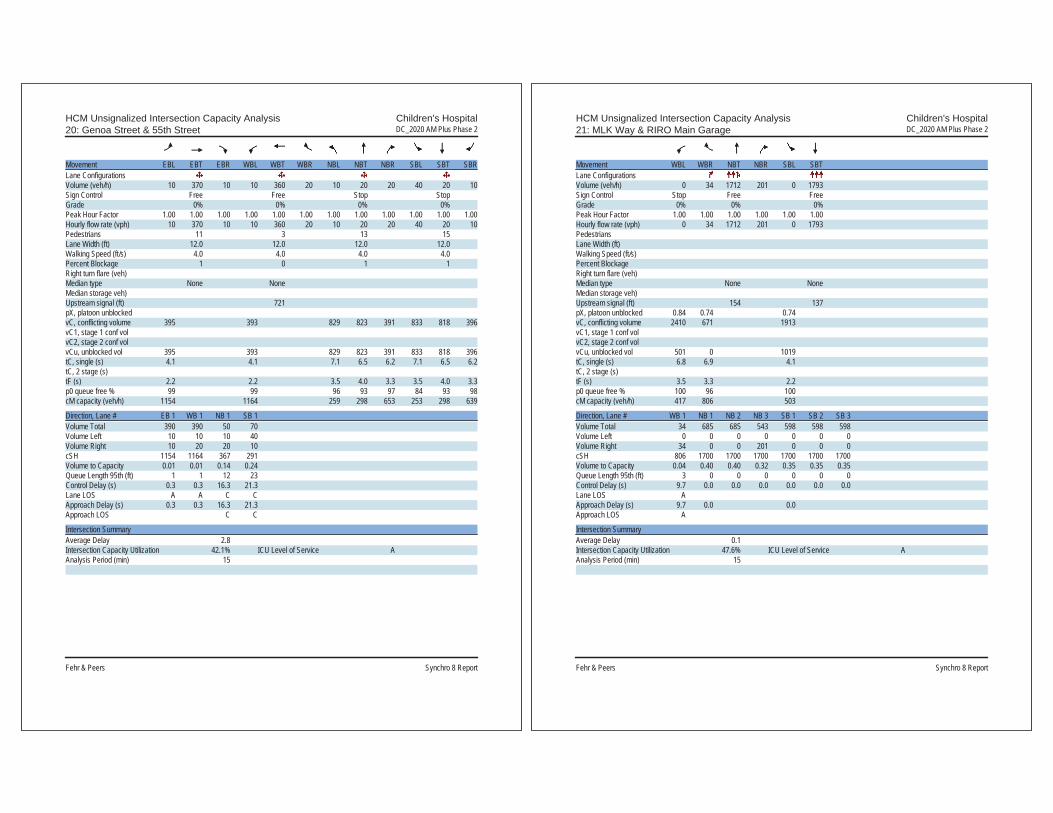
HCM Unsignalized Intersection Capacity Analysis Children's Hospital20: Genoa Street & 55th Street DC_2020 AM Plus Phase 2
Fehr & Peers Synchro 8 Report
Movement EBL EBT EBR WBL WBT WBR NBL NBT NBR SBL SBT SBRLane ConfigurationsVolume (veh/h) 10 370 10 10 360 20 10 20 20 40 20 10Sign Control Free Free Stop StopGrade 0% 0% 0% 0%Peak Hour Factor 1.00 1.00 1.00 1.00 1.00 1.00 1.00 1.00 1.00 1.00 1.00 1.00Hourly flow rate (vph) 10 370 10 10 360 20 10 20 20 40 20 10Pedestrians 11 3 13 15Lane Width (ft) 12.0 12.0 12.0 12.0Walking Speed (ft/s) 4.0 4.0 4.0 4.0Percent Blockage 1 0 1 1Right turn flare (veh)Median type None NoneMedian storage veh)Upstream signal (ft) 721pX, platoon unblockedvC, conflicting volume 395 393 829 823 391 833 818 396vC1, stage 1 conf volvC2, stage 2 conf volvCu, unblocked vol 395 393 829 823 391 833 818 396tC, single (s) 4.1 4.1 7.1 6.5 6.2 7.1 6.5 6.2tC, 2 stage (s)tF (s) 2.2 2.2 3.5 4.0 3.3 3.5 4.0 3.3p0 queue free % 99 99 96 93 97 84 93 98cM capacity (veh/h) 1154 1164 259 298 653 253 298 639
Direction, Lane # EB 1 WB 1 NB 1 SB 1Volume Total 390 390 50 70Volume Left 10 10 10 40Volume Right 10 20 20 10cSH 1154 1164 367 291Volume to Capacity 0.01 0.01 0.14 0.24Queue Length 95th (ft) 1 1 12 23Control Delay (s) 0.3 0.3 16.3 21.3Lane LOS A A C CApproach Delay (s) 0.3 0.3 16.3 21.3Approach LOS C C
Intersection SummaryAverage Delay 2.8Intersection Capacity Utilization 42.1% ICU Level of Service AAnalysis Period (min) 15
HCM Unsignalized Intersection Capacity Analysis Children's Hospital21: MLK Way & RIRO Main Garage DC_2020 AM Plus Phase 2
Fehr & Peers Synchro 8 Report
Movement WBL WBR NBT NBR SBL SBTLane ConfigurationsVolume (veh/h) 0 34 1712 201 0 1793Sign Control Stop Free FreeGrade 0% 0% 0%Peak Hour Factor 1.00 1.00 1.00 1.00 1.00 1.00Hourly flow rate (vph) 0 34 1712 201 0 1793PedestriansLane Width (ft)Walking Speed (ft/s)Percent BlockageRight turn flare (veh)Median type None NoneMedian storage veh)Upstream signal (ft) 154 137pX, platoon unblocked 0.84 0.74 0.74vC, conflicting volume 2410 671 1913vC1, stage 1 conf volvC2, stage 2 conf volvCu, unblocked vol 501 0 1019tC, single (s) 6.8 6.9 4.1tC, 2 stage (s)tF (s) 3.5 3.3 2.2p0 queue free % 100 96 100cM capacity (veh/h) 417 806 503
Direction, Lane # WB 1 NB 1 NB 2 NB 3 SB 1 SB 2 SB 3Volume Total 34 685 685 543 598 598 598Volume Left 0 0 0 0 0 0 0Volume Right 34 0 0 201 0 0 0cSH 806 1700 1700 1700 1700 1700 1700Volume to Capacity 0.04 0.40 0.40 0.32 0.35 0.35 0.35Queue Length 95th (ft) 3 0 0 0 0 0 0Control Delay (s) 9.7 0.0 0.0 0.0 0.0 0.0 0.0Lane LOS AApproach Delay (s) 9.7 0.0 0.0Approach LOS A
Intersection SummaryAverage Delay 0.1Intersection Capacity Utilization 47.6% ICU Level of Service AAnalysis Period (min) 15

HCM Unsignalized Intersection Capacity Analysis Children's Hospital22: MLK Way & RIRO Main Plaza DC_2020 AM Plus Phase 2
Fehr & Peers Synchro 8 Report
Movement WBL WBR NBT NBR SBL SBTLane ConfigurationsVolume (veh/h) 0 0 1777 0 0 1839Sign Control Stop Free FreeGrade 0% 0% 0%Peak Hour Factor 1.00 1.00 1.00 1.00 1.00 1.00Hourly flow rate (vph) 0 0 1777 0 0 1839PedestriansLane Width (ft)Walking Speed (ft/s)Percent BlockageRight turn flare (veh)Median type None NoneMedian storage veh)Upstream signal (ft) 424 204pX, platoon unblocked 0.78vC, conflicting volume 2390 592 1777vC1, stage 1 conf volvC2, stage 2 conf volvCu, unblocked vol 1789 592 1777tC, single (s) 6.8 6.9 4.1tC, 2 stage (s)tF (s) 3.5 3.3 2.2p0 queue free % 100 100 100cM capacity (veh/h) 56 449 346
Direction, Lane # WB 1 NB 1 NB 2 NB 3 SB 1 SB 2 SB 3Volume Total 0 711 711 355 613 613 613Volume Left 0 0 0 0 0 0 0Volume Right 0 0 0 0 0 0 0cSH 1700 1700 1700 1700 1700 1700 1700Volume to Capacity 0.00 0.42 0.42 0.21 0.36 0.36 0.36Queue Length 95th (ft) 0 0 0 0 0 0 0Control Delay (s) 0.0 0.0 0.0 0.0 0.0 0.0 0.0Lane LOS AApproach Delay (s) 0.0 0.0 0.0Approach LOS A
Intersection SummaryAverage Delay 0.0Intersection Capacity Utilization 38.9% ICU Level of Service AAnalysis Period (min) 15
HCM Unsignalized Intersection Capacity Analysis Children's Hospital24: 51St Street & 52nd Street DC_2020 AM Plus Phase 2
Fehr & Peers Synchro 8 Report
Intersection Sign configuration not allowed in HCM analysis.

HCM Signalized Intersection Capacity Analysis Children's Hospital 1: MLK Way & 55th Street DC_2020 PM Plus Phase 2
Fehr & Peers Synchro 8 Report
Movement EBL EBT EBR WBL WBT WBR NBU NBL NBT NBR SBL SBTLane ConfigurationsVolume (vph) 20 260 170 60 170 70 29 211 1663 156 130 1354Ideal Flow (vphpl) 1900 1900 1900 1900 1900 1900 1900 1900 1900 1900 1900 1900Total Lost time (s) 5.0 5.0 4.5 5.0 4.5 5.0Lane Util. Factor 1.00 1.00 1.00 0.91 1.00 0.91Frpb, ped/bikes 0.98 0.99 1.00 0.99 1.00 1.00Flpb, ped/bikes 1.00 1.00 1.00 1.00 1.00 1.00Frt 0.95 0.97 1.00 0.99 1.00 1.00Flt Protected 1.00 0.99 0.95 1.00 0.95 1.00Satd. Flow (prot) 1751 1735 1770 4980 1770 5060Flt Permitted 0.98 0.67 0.95 1.00 0.95 1.00Satd. Flow (perm) 1718 1181 1770 4980 1770 5060Peak-hour factor, PHF 1.00 1.00 1.00 1.00 1.00 1.00 1.00 1.00 1.00 1.00 1.00 1.00Adj. Flow (vph) 20 260 170 60 170 70 29 211 1663 156 130 1354RTOR Reduction (vph) 0 24 0 0 12 0 0 0 10 0 0 2Lane Group Flow (vph) 0 426 0 0 288 0 0 240 1809 0 130 1382Confl. Peds. (#/hr) 15 20 20 15 26Confl. Bikes (#/hr) 21 16 20Heavy Vehicles (%) 1% 1% 1% 4% 4% 4% 2% 2% 2% 2% 2% 2%Turn Type Perm NA Perm NA Prot Prot NA Prot NAProtected Phases 4 8 5 5 2 1 6Permitted Phases 4 8Actuated Green, G (s) 29.3 29.3 21.5 45.5 10.7 34.7Effective Green, g (s) 29.3 29.3 21.5 45.5 10.7 34.7Actuated g/C Ratio 0.29 0.29 0.22 0.46 0.11 0.35Clearance Time (s) 5.0 5.0 4.5 5.0 4.5 5.0Vehicle Extension (s) 3.0 3.0 3.0 3.0 3.0 3.0Lane Grp Cap (vph) 503 346 380 2265 189 1755v/s Ratio Prot 0.14 c0.36 0.07 c0.27v/s Ratio Perm c0.25 0.24v/c Ratio 0.85 0.83 0.63 0.80 0.69 0.79Uniform Delay, d1 33.2 33.1 35.7 23.3 43.0 29.3Progression Factor 1.00 1.00 0.55 0.40 1.00 1.00Incremental Delay, d2 12.5 15.6 2.8 2.5 10.0 3.7Delay (s) 45.7 48.6 22.3 11.9 53.0 33.0Level of Service D D C B D CApproach Delay (s) 45.7 48.6 13.1 34.7Approach LOS D D B C
Intersection SummaryHCM 2000 Control Delay 26.5 HCM 2000 Level of Service CHCM 2000 Volume to Capacity ratio 0.83Actuated Cycle Length (s) 100.0 Sum of lost time (s) 14.5Intersection Capacity Utilization 94.0% ICU Level of Service FAnalysis Period (min) 15c Critical Lane Group
HCM Signalized Intersection Capacity Analysis Children's Hospital 1: MLK Way & 55th Street DC_2020 PM Plus Phase 2
Fehr & Peers Synchro 8 Report
Movement SBRLane ConfigurationsVolume (vph) 30Ideal Flow (vphpl) 1900Total Lost time (s)Lane Util. FactorFrpb, ped/bikesFlpb, ped/bikesFrtFlt ProtectedSatd. Flow (prot)Flt PermittedSatd. Flow (perm)Peak-hour factor, PHF 1.00Adj. Flow (vph) 30RTOR Reduction (vph) 0Lane Group Flow (vph) 0Confl. Peds. (#/hr) 16Confl. Bikes (#/hr) 20Heavy Vehicles (%) 2%Turn TypeProtected PhasesPermitted PhasesActuated Green, G (s)Effective Green, g (s)Actuated g/C RatioClearance Time (s)Vehicle Extension (s)Lane Grp Cap (vph)v/s Ratio Protv/s Ratio Permv/c RatioUniform Delay, d1Progression FactorIncremental Delay, d2Delay (s)Level of ServiceApproach Delay (s)Approach LOS
Intersection Summary

HCM Unsignalized Intersection Capacity Analysis Children's Hospital 2: Dover Street & 55th Street DC_2020 PM Plus Phase 2
Fehr & Peers Synchro 8 Report
Movement EBL EBT EBR WBL WBT WBR NBL NBT NBR SBL SBT SBRLane ConfigurationsVolume (veh/h) 30 496 20 10 230 20 20 20 30 20 20 40Sign Control Free Free Stop StopGrade 0% 0% 0% 0%Peak Hour Factor 1.00 1.00 1.00 1.00 1.00 1.00 1.00 1.00 1.00 1.00 1.00 1.00Hourly flow rate (vph) 30 496 20 10 230 20 20 20 30 20 20 40Pedestrians 6 17 10 23Lane Width (ft) 12.0 12.0 12.0 12.0Walking Speed (ft/s) 4.0 4.0 4.0 4.0Percent Blockage 1 1 1 2Right turn flare (veh)Median type None NoneMedian storage veh)Upstream signal (ft) 641 677pX, platoon unblocked 0.96 0.96 0.96 0.96 0.96 0.96vC, conflicting volume 273 526 892 869 533 906 869 269vC1, stage 1 conf volvC2, stage 2 conf volvCu, unblocked vol 273 482 864 840 489 879 840 269tC, single (s) 4.1 4.1 7.1 6.5 6.2 7.1 6.5 6.2tC, 2 stage (s)tF (s) 2.2 2.2 3.5 4.0 3.3 3.5 4.0 3.3p0 queue free % 98 99 91 93 94 90 93 95cM capacity (veh/h) 1249 1015 222 273 545 210 270 749
Direction, Lane # EB 1 WB 1 NB 1 SB 1Volume Total 546 260 70 80Volume Left 30 10 20 20Volume Right 20 20 30 40cSH 1249 1015 321 359Volume to Capacity 0.02 0.01 0.22 0.22Queue Length 95th (ft) 2 1 20 21Control Delay (s) 0.7 0.4 19.3 17.9Lane LOS A A C CApproach Delay (s) 0.7 0.4 19.3 17.9Approach LOS C C
Intersection SummaryAverage Delay 3.4Intersection Capacity Utilization 55.2% ICU Level of Service BAnalysis Period (min) 15
HCM Signalized Intersection Capacity Analysis Children's Hospital 3: 55th Street & Shattuck Ave DC_2020 PM Plus Phase 2
Fehr & Peers Synchro 8 Report
Movement EBL EBT EBR WBL WBT WBR NBL NBT NBR SBL SBT SBRLane ConfigurationsVolume (vph) 90 386 60 32 160 50 50 560 46 30 550 40Ideal Flow (vphpl) 1900 1900 1900 1900 1900 1900 1900 1900 1900 1900 1900 1900Total Lost time (s) 3.0 3.0 5.0 5.0Lane Util. Factor 1.00 1.00 1.00 1.00Frpb, ped/bikes 0.99 0.99 1.00 1.00Flpb, ped/bikes 1.00 1.00 1.00 1.00Frt 0.98 0.97 0.99 0.99Flt Protected 0.99 0.99 1.00 1.00Satd. Flow (prot) 1752 1760 1830 1853Flt Permitted 0.91 0.91 0.92 0.95Satd. Flow (perm) 1601 1604 1694 1773Peak-hour factor, PHF 1.00 1.00 1.00 1.00 1.00 1.00 1.00 1.00 1.00 1.00 1.00 1.00Adj. Flow (vph) 90 386 60 32 160 50 50 560 46 30 550 40RTOR Reduction (vph) 0 6 0 0 11 0 0 3 0 0 3 0Lane Group Flow (vph) 0 530 0 0 231 0 0 653 0 0 617 0Confl. Peds. (#/hr) 15 15 15 15 25 10 10 25Confl. Bikes (#/hr) 20 13 41 29Heavy Vehicles (%) 5% 5% 5% 3% 3% 3% 2% 2% 2% 1% 1% 1%Turn Type Perm NA Perm NA Perm NA Perm NAProtected Phases 2 6 4 8Permitted Phases 2 6 4 4 8Actuated Green, G (s) 29.0 29.0 43.0 43.0Effective Green, g (s) 29.0 29.0 43.0 43.0Actuated g/C Ratio 0.36 0.36 0.54 0.54Clearance Time (s) 3.0 3.0 5.0 5.0Lane Grp Cap (vph) 580 581 910 952v/s Ratio Protv/s Ratio Perm c0.33 0.14 c0.39 0.35v/c Ratio 0.91 0.40 0.72 0.65Uniform Delay, d1 24.3 19.0 13.9 13.1Progression Factor 1.00 1.00 1.00 1.00Incremental Delay, d2 21.3 2.0 4.8 3.4Delay (s) 45.6 21.0 18.8 16.5Level of Service D C B BApproach Delay (s) 45.6 21.0 18.8 16.5Approach LOS D C B B
Intersection SummaryHCM 2000 Control Delay 25.4 HCM 2000 Level of Service CHCM 2000 Volume to Capacity ratio 0.80Actuated Cycle Length (s) 80.0 Sum of lost time (s) 8.0Intersection Capacity Utilization 99.7% ICU Level of Service FAnalysis Period (min) 15c Critical Lane Group

HCM Signalized Intersection Capacity Analysis Children's Hospital 4: 55th Street & Telegraph Ave DC_2020 PM Plus Phase 2
Fehr & Peers Synchro 8 Report
Movement EBL EBT EBR WBL WBT WBR NBL NBT NBR SBL SBT SBRLane ConfigurationsVolume (vph) 301 30 121 50 20 20 90 1006 70 20 996 112Ideal Flow (vphpl) 1900 1900 1900 1900 1900 1900 1900 1900 1900 1900 1900 1900Total Lost time (s) 4.5 4.5 4.5 4.5 4.5 4.5Lane Util. Factor 1.00 1.00 1.00 0.95 1.00 0.95Frpb, ped/bikes 0.98 0.99 1.00 0.99 1.00 0.99Flpb, ped/bikes 0.99 0.99 0.99 1.00 0.99 1.00Frt 0.96 0.97 1.00 0.99 1.00 0.98Flt Protected 0.97 0.97 0.95 1.00 0.95 1.00Satd. Flow (prot) 1645 1697 1752 3482 1774 3471Flt Permitted 0.76 0.74 0.17 1.00 0.18 1.00Satd. Flow (perm) 1298 1284 320 3482 343 3471Peak-hour factor, PHF 1.00 1.00 1.00 1.00 1.00 1.00 1.00 1.00 1.00 1.00 1.00 1.00Adj. Flow (vph) 301 30 121 50 20 20 90 1006 70 20 996 112RTOR Reduction (vph) 0 15 0 0 12 0 0 5 0 0 9 0Lane Group Flow (vph) 0 437 0 0 78 0 90 1071 0 20 1099 0Confl. Peds. (#/hr) 15 34 34 15 33 23 23 33Confl. Bikes (#/hr) 11 12 38 59Heavy Vehicles (%) 5% 5% 5% 4% 4% 4% 2% 2% 2% 1% 1% 1%Turn Type Perm NA Perm NA Perm NA Perm NAProtected Phases 4 8 2 6Permitted Phases 4 8 2 6Actuated Green, G (s) 33.0 33.0 48.0 48.0 48.0 48.0Effective Green, g (s) 33.0 33.0 48.0 48.0 48.0 48.0Actuated g/C Ratio 0.37 0.37 0.53 0.53 0.53 0.53Clearance Time (s) 4.5 4.5 4.5 4.5 4.5 4.5Vehicle Extension (s) 3.0 3.0 3.0 3.0 3.0 3.0Lane Grp Cap (vph) 475 470 170 1857 182 1851v/s Ratio Prot 0.31 c0.32v/s Ratio Perm c0.34 0.06 0.28 0.06v/c Ratio 0.92 0.17 0.53 0.58 0.11 0.59Uniform Delay, d1 27.2 19.2 13.7 14.2 10.4 14.3Progression Factor 1.00 1.00 1.00 1.00 1.00 1.00Incremental Delay, d2 22.8 0.2 11.3 1.3 1.2 1.4Delay (s) 50.0 19.4 25.0 15.5 11.6 15.8Level of Service D B C B B BApproach Delay (s) 50.0 19.4 16.2 15.7Approach LOS D B B B
Intersection SummaryHCM 2000 Control Delay 21.5 HCM 2000 Level of Service CHCM 2000 Volume to Capacity ratio 0.73Actuated Cycle Length (s) 90.0 Sum of lost time (s) 9.0Intersection Capacity Utilization 80.7% ICU Level of Service DAnalysis Period (min) 15c Critical Lane Group
HCM Unsignalized Intersection Capacity Analysis Children's Hospital 5: MLK Way & 54th Street DC_2020 PM Plus Phase 2
Fehr & Peers Synchro 8 Report
Movement EBL EBT EBR WBL WBT WBR NBU NBL NBT NBR SBU SBLLane ConfigurationsVolume (veh/h) 10 10 50 20 10 10 13 40 2001 48 10 20Sign Control Stop Stop FreeGrade 0% 0% 0%Peak Hour Factor 1.00 1.00 1.00 1.00 1.00 1.00 1.00 1.00 1.00 1.00 1.00 1.00Hourly flow rate (vph) 10 10 50 20 10 10 0 40 2001 48 0 20Pedestrians 7 25 15Lane Width (ft) 12.0 12.0 12.0Walking Speed (ft/s) 4.0 4.0 4.0Percent Blockage 1 2 1Right turn flare (veh)Median type NoneMedian storage veh)Upstream signal (ft) 299pX, platoon unblocked 0.87 0.87 0.76 0.87 0.87 0.75 0.00 0.76 0.00 0.75vC, conflicting volume 2372 3764 550 2758 3750 716 0 1580 0 2074vC1, stage 1 conf volvC2, stage 2 conf volvCu, unblocked vol 197 1789 0 638 1773 0 0 648 0 1279tC, single (s) 7.5 6.5 6.9 7.5 6.5 6.9 0.0 4.1 0.0 4.1tC, 2 stage (s)tF (s) *5.0 *5.0 *5.0 *5.0 *5.0 *5.0 0.0 2.2 0.0 2.2p0 queue free % 97 83 91 88 83 98 0 94 0 95cM capacity (veh/h) 368 59 536 173 60 531 0 704 0 401
Direction, Lane # EB 1 WB 1 NB 1 NB 2 NB 3 SB 1 SB 2 SB 3Volume Total 70 40 540 1000 548 408 776 408Volume Left 10 20 40 0 0 20 0 0Volume Right 50 10 0 0 48 0 0 20cSH 241 133 704 1700 1700 401 1700 1700Volume to Capacity 0.29 0.30 0.06 0.59 0.32 0.05 0.46 0.24Queue Length 95th (ft) 29 29 5 0 0 4 0 0Control Delay (s) 25.9 43.3 1.5 0.0 0.0 1.6 0.0 0.0Lane LOS D E A AApproach Delay (s) 25.9 43.3 0.4 0.4Approach LOS D E
Intersection SummaryAverage Delay 1.3Intersection Capacity Utilization 90.4% ICU Level of Service EAnalysis Period (min) 15
* User Entered Value

HCM Unsignalized Intersection Capacity Analysis Children's Hospital 5: MLK Way & 54th Street DC_2020 PM Plus Phase 2
Fehr & Peers Synchro 8 Report
Movement SBT SBRLane ConfigurationsVolume (veh/h) 1553 20Sign Control FreeGrade 0%Peak Hour Factor 1.00 1.00Hourly flow rate (vph) 1553 20PedestriansLane Width (ft)Walking Speed (ft/s)Percent BlockageRight turn flare (veh)Median type NoneMedian storage veh)Upstream signal (ft) 294pX, platoon unblockedvC, conflicting volumevC1, stage 1 conf volvC2, stage 2 conf volvCu, unblocked voltC, single (s)tC, 2 stage (s)tF (s)p0 queue free %cM capacity (veh/h)
Direction, Lane #
HCM Unsignalized Intersection Capacity Analysis Children's Hospital 6: Dover Street & 54th Street DC_2020 PM Plus Phase 2
Fehr & Peers Synchro 8 Report
Movement EBL EBT EBR WBL WBT WBR NBL NBT NBR SBL SBT SBRLane ConfigurationsVolume (veh/h) 10 48 10 10 10 20 10 40 10 10 30 10Sign Control Stop Stop Free FreeGrade 0% 0% 0% 0%Peak Hour Factor 1.00 1.00 1.00 1.00 1.00 1.00 1.00 1.00 1.00 1.00 1.00 1.00Hourly flow rate (vph) 10 48 10 10 10 20 10 40 10 10 30 10Pedestrians 16 11 8 4Lane Width (ft) 12.0 12.0 12.0 12.0Walking Speed (ft/s) 4.0 4.0 4.0 4.0Percent Blockage 1 1 1 0Right turn flare (veh)Median type None NoneMedian storage veh)Upstream signal (ft)pX, platoon unblockedvC, conflicting volume 165 152 59 173 152 60 56 61vC1, stage 1 conf volvC2, stage 2 conf volvCu, unblocked vol 165 152 59 173 152 60 56 61tC, single (s) 7.1 6.5 6.2 7.1 6.5 6.2 4.1 4.1tC, 2 stage (s)tF (s) 3.5 4.0 3.3 3.5 4.0 3.3 2.2 2.2p0 queue free % 99 93 99 99 99 98 99 99cM capacity (veh/h) 746 717 992 715 717 999 1541 1541
Direction, Lane # EB 1 WB 1 NB 1 SB 1Volume Total 68 40 60 50Volume Left 10 10 10 10Volume Right 10 20 10 10cSH 752 834 1541 1541Volume to Capacity 0.09 0.05 0.01 0.01Queue Length 95th (ft) 7 4 0 0Control Delay (s) 10.3 9.5 1.3 1.5Lane LOS B A A AApproach Delay (s) 10.3 9.5 1.3 1.5Approach LOS B A
Intersection SummaryAverage Delay 5.6Intersection Capacity Utilization 21.2% ICU Level of Service AAnalysis Period (min) 15

HCM Unsignalized Intersection Capacity Analysis Children's Hospital 7: Shattuck Ave & 54th Street DC_2020 PM Plus Phase 2
Fehr & Peers Synchro 8 Report
Movement EBL EBR NBL NBT SBT SBRLane ConfigurationsVolume (veh/h) 10 48 20 666 652 10Sign Control Stop Free FreeGrade 0% 0% 0%Peak Hour Factor 1.00 1.00 1.00 1.00 1.00 1.00Hourly flow rate (vph) 10 48 20 666 652 10Pedestrians 33 2Lane Width (ft) 12.0 12.0Walking Speed (ft/s) 4.0 4.0Percent Blockage 3 0Right turn flare (veh)Median type None NoneMedian storage veh)Upstream signal (ft) 550 282pX, platoon unblocked 0.82 0.77 0.77vC, conflicting volume 1398 690 695vC1, stage 1 conf volvC2, stage 2 conf volvCu, unblocked vol 1096 446 453tC, single (s) 6.4 6.2 4.1tC, 2 stage (s)tF (s) 3.5 3.3 2.2p0 queue free % 95 90 98cM capacity (veh/h) 185 461 828
Direction, Lane # EB 1 NB 1 SB 1Volume Total 58 686 662Volume Left 10 20 0Volume Right 48 0 10cSH 366 828 1700Volume to Capacity 0.16 0.02 0.39Queue Length 95th (ft) 14 2 0Control Delay (s) 16.7 0.6 0.0Lane LOS C AApproach Delay (s) 16.7 0.6 0.0Approach LOS C
Intersection SummaryAverage Delay 1.0Intersection Capacity Utilization 61.4% ICU Level of Service BAnalysis Period (min) 15
HCM Signalized Intersection Capacity Analysis Children's Hospital 8: MLK Way & 53rd Street DC_2020 PM Plus Phase 2
Fehr & Peers Synchro 8 Report
Movement EBL EBT EBR WBL WBT WBR NBU NBL NBT NBR SBL SBTLane ConfigurationsVolume (vph) 10 4 69 70 10 8 10 10 2084 105 4 1647Ideal Flow (vphpl) 1900 1900 1900 1900 1900 1900 1900 1900 1900 1900 1900 1900Total Lost time (s) 5.0 5.0 4.0 3.5 4.0 3.5Lane Util. Factor 1.00 1.00 1.00 0.91 1.00 0.91Frpb, ped/bikes 0.98 1.00 1.00 0.99 1.00 1.00Flpb, ped/bikes 1.00 1.00 1.00 1.00 1.00 1.00Frt 0.89 0.99 1.00 0.99 1.00 1.00Flt Protected 0.99 0.96 0.95 1.00 0.95 1.00Satd. Flow (prot) 1610 1795 1770 5013 1787 5128Flt Permitted 0.96 0.73 0.95 1.00 0.95 1.00Satd. Flow (perm) 1562 1361 1770 5013 1787 5128Peak-hour factor, PHF 1.00 1.00 1.00 1.00 1.00 1.00 1.00 1.00 1.00 1.00 1.00 1.00Adj. Flow (vph) 10 4 69 70 10 8 10 10 2084 105 4 1647RTOR Reduction (vph) 0 57 0 0 4 0 0 0 3 0 0 0Lane Group Flow (vph) 0 26 0 0 84 0 0 20 2186 0 4 1657Confl. Peds. (#/hr) 11 6 6 11 42Confl. Bikes (#/hr) 6 3 17Heavy Vehicles (%) 2% 2% 2% 0% 0% 0% 2% 2% 2% 2% 1% 1%Turn Type Perm NA Perm NA Prot Prot NA Prot NAProtected Phases 4 8 5 5 2 1 6Permitted Phases 4 8Actuated Green, G (s) 17.3 17.3 3.1 68.4 1.8 67.1Effective Green, g (s) 17.3 17.3 3.1 68.4 1.8 67.1Actuated g/C Ratio 0.17 0.17 0.03 0.68 0.02 0.67Clearance Time (s) 5.0 5.0 4.0 3.5 4.0 3.5Vehicle Extension (s) 3.0 3.0 3.0 3.0 3.0 3.0Lane Grp Cap (vph) 270 235 54 3428 32 3440v/s Ratio Prot 0.01 c0.44 0.00 c0.32v/s Ratio Perm 0.02 c0.06v/c Ratio 0.10 0.36 0.37 0.64 0.12 0.48Uniform Delay, d1 34.8 36.4 47.5 8.9 48.3 8.0Progression Factor 1.00 1.02 1.43 0.23 0.78 0.48Incremental Delay, d2 0.2 0.9 2.8 0.6 1.2 0.3Delay (s) 34.9 38.0 70.7 2.7 38.7 4.2Level of Service C D E A D AApproach Delay (s) 34.9 38.0 3.3 4.3Approach LOS C D A A
Intersection SummaryHCM 2000 Control Delay 5.1 HCM 2000 Level of Service AHCM 2000 Volume to Capacity ratio 0.60Actuated Cycle Length (s) 100.0 Sum of lost time (s) 12.5Intersection Capacity Utilization 68.6% ICU Level of Service CAnalysis Period (min) 15c Critical Lane Group

HCM Signalized Intersection Capacity Analysis Children's Hospital 8: MLK Way & 53rd Street DC_2020 PM Plus Phase 2
Fehr & Peers Synchro 8 Report
Movement SBRLane ConfigurationsVolume (vph) 10Ideal Flow (vphpl) 1900Total Lost time (s)Lane Util. FactorFrpb, ped/bikesFlpb, ped/bikesFrtFlt ProtectedSatd. Flow (prot)Flt PermittedSatd. Flow (perm)Peak-hour factor, PHF 1.00Adj. Flow (vph) 10RTOR Reduction (vph) 0Lane Group Flow (vph) 0Confl. Peds. (#/hr) 19Confl. Bikes (#/hr) 21Heavy Vehicles (%) 1%Turn TypeProtected PhasesPermitted PhasesActuated Green, G (s)Effective Green, g (s)Actuated g/C RatioClearance Time (s)Vehicle Extension (s)Lane Grp Cap (vph)v/s Ratio Protv/s Ratio Permv/c RatioUniform Delay, d1Progression FactorIncremental Delay, d2Delay (s)Level of ServiceApproach Delay (s)Approach LOS
Intersection Summary
HCM Unsignalized Intersection Capacity Analysis Children's Hospital 9: Dover Street & 53rd Street DC_2020 PM Plus Phase 2
Fehr & Peers Synchro 8 Report
Movement EBL EBT EBR WBL WBT WBR NBL NBT NBR SBL SBT SBRLane ConfigurationsVolume (veh/h) 60 20 0 0 20 10 0 0 0 10 0 40Sign Control Stop Stop Free FreeGrade 0% 0% 0% 0%Peak Hour Factor 1.00 1.00 1.00 1.00 1.00 1.00 1.00 1.00 1.00 1.00 1.00 1.00Hourly flow rate (vph) 60 20 0 0 20 10 0 0 0 10 0 40Pedestrians 33 13 6 6Lane Width (ft) 12.0 12.0 12.0 12.0Walking Speed (ft/s) 4.0 4.0 4.0 4.0Percent Blockage 3 1 1 1Right turn flare (veh)Median type None NoneMedian storage veh)Upstream signal (ft)pX, platoon unblockedvC, conflicting volume 99 86 59 69 106 19 73 13vC1, stage 1 conf volvC2, stage 2 conf volvCu, unblocked vol 99 86 59 69 106 19 73 13tC, single (s) 7.1 6.5 6.2 7.1 6.5 6.2 4.1 4.1tC, 2 stage (s)tF (s) 3.5 4.0 3.3 3.5 4.0 3.3 2.2 2.2p0 queue free % 93 97 100 100 97 99 100 99cM capacity (veh/h) 805 772 980 865 753 1048 1497 1601
Direction, Lane # EB 1 WB 1 NB 1 SB 1Volume Total 80 30 0 50Volume Left 60 0 0 10Volume Right 0 10 0 40cSH 797 831 1700 1601Volume to Capacity 0.10 0.04 0.00 0.01Queue Length 95th (ft) 8 3 0 0Control Delay (s) 10.0 9.5 0.0 1.5Lane LOS B A AApproach Delay (s) 10.0 9.5 0.0 1.5Approach LOS B A
Intersection SummaryAverage Delay 7.3Intersection Capacity Utilization 28.8% ICU Level of Service AAnalysis Period (min) 15

HCM Signalized Intersection Capacity Analysis Children's Hospital 10: MLK Way & 52nd Street DC_2020 PM Plus Phase 2
Fehr & Peers Synchro 8 Report
Movement EBL EBT EBR WBL WBT WBR NBU NBL NBT NBR SBU SBLLane ConfigurationsVolume (vph) 88 113 100 149 99 272 50 90 1757 106 4 210Ideal Flow (vphpl) 1900 1900 1900 1900 1900 1900 1900 1900 1900 1900 1900 1900Total Lost time (s) 5.0 5.0 5.0 5.0 4.5 4.5 4.0Lane Util. Factor 1.00 1.00 1.00 1.00 1.00 0.91 1.00Frpb, ped/bikes 1.00 0.95 1.00 0.96 1.00 1.00 1.00Flpb, ped/bikes 0.99 1.00 0.97 1.00 1.00 1.00 1.00Frt 1.00 0.93 1.00 0.85 1.00 0.99 1.00Flt Protected 0.95 1.00 0.97 1.00 0.95 1.00 0.95Satd. Flow (prot) 1764 1669 1751 1525 1787 5071 1787Flt Permitted 0.45 1.00 0.57 1.00 0.95 1.00 0.95Satd. Flow (perm) 841 1669 1030 1525 1787 5071 1787Peak-hour factor, PHF 1.00 1.00 1.00 1.00 1.00 1.00 1.00 1.00 1.00 1.00 1.00 1.00Adj. Flow (vph) 88 113 100 149 99 272 50 90 1757 106 4 210RTOR Reduction (vph) 0 34 0 0 0 199 0 0 6 0 0 0Lane Group Flow (vph) 88 179 0 0 248 73 0 140 1857 0 0 214Confl. Peds. (#/hr) 21 80 80 21 13Confl. Bikes (#/hr) 12 6 20Heavy Vehicles (%) 1% 1% 1% 2% 2% 2% 1% 1% 1% 1% 1% 1%Turn Type Perm NA Perm NA Perm Prot Prot NA Prot ProtProtected Phases 4 8 5 5 2 1 1Permitted Phases 4 8 8Actuated Green, G (s) 26.7 26.7 26.7 26.7 12.0 42.3 17.5Effective Green, g (s) 26.7 26.7 26.7 26.7 12.0 42.3 17.5Actuated g/C Ratio 0.27 0.27 0.27 0.27 0.12 0.42 0.18Clearance Time (s) 5.0 5.0 5.0 5.0 4.5 4.5 4.0Vehicle Extension (s) 2.0 2.0 2.0 2.0 2.0 2.0 2.0Lane Grp Cap (vph) 224 445 275 407 214 2145 312v/s Ratio Prot 0.11 0.08 c0.37 0.12v/s Ratio Perm 0.10 c0.24 0.05v/c Ratio 0.39 0.40 0.90 0.18 0.65 0.87 0.69Uniform Delay, d1 30.0 30.1 35.4 28.2 42.0 26.3 38.7Progression Factor 1.00 1.00 0.90 2.07 0.97 1.06 0.62Incremental Delay, d2 0.4 0.2 27.3 0.1 2.1 2.0 4.5Delay (s) 30.4 30.3 59.0 58.3 42.6 29.8 28.6Level of Service C C E E D C CApproach Delay (s) 30.4 58.6 30.7Approach LOS C E C
Intersection SummaryHCM 2000 Control Delay 25.9 HCM 2000 Level of Service CHCM 2000 Volume to Capacity ratio 0.85Actuated Cycle Length (s) 100.0 Sum of lost time (s) 14.0Intersection Capacity Utilization 111.1% ICU Level of Service HAnalysis Period (min) 15c Critical Lane Group
HCM Signalized Intersection Capacity Analysis Children's Hospital 10: MLK Way & 52nd Street DC_2020 PM Plus Phase 2
Fehr & Peers Synchro 8 Report
Movement SBT SBRLane ConfigurationsVolume (vph) 1568 14Ideal Flow (vphpl) 1900 1900Total Lost time (s) 4.5Lane Util. Factor 0.91Frpb, ped/bikes 1.00Flpb, ped/bikes 1.00Frt 1.00Flt Protected 1.00Satd. Flow (prot) 5125Flt Permitted 1.00Satd. Flow (perm) 5125Peak-hour factor, PHF 1.00 1.00Adj. Flow (vph) 1568 14RTOR Reduction (vph) 1 0Lane Group Flow (vph) 1581 0Confl. Peds. (#/hr) 17Confl. Bikes (#/hr) 23Heavy Vehicles (%) 1% 1%Turn Type NAProtected Phases 6Permitted PhasesActuated Green, G (s) 47.3Effective Green, g (s) 47.3Actuated g/C Ratio 0.47Clearance Time (s) 4.5Vehicle Extension (s) 2.0Lane Grp Cap (vph) 2424v/s Ratio Prot c0.31v/s Ratio Permv/c Ratio 0.65Uniform Delay, d1 20.1Progression Factor 0.33Incremental Delay, d2 1.3Delay (s) 7.9Level of Service AApproach Delay (s) 10.3Approach LOS B
Intersection Summary

HCM Signalized Intersection Capacity Analysis Children's Hospital 11: 52nd Street & Garage DC_2020 PM Plus Phase 2
Fehr & Peers Synchro 8 Report
Movement EBL EBT EBR WBL WBT WBR NBL NBT NBR SBL SBT SBRLane ConfigurationsVolume (vph) 3 413 5 2 437 2 12 1 7 0 4 59Ideal Flow (vphpl) 1900 1900 1900 1900 1900 1900 1900 1900 1900 1900 1900 1900Total Lost time (s) 3.0 3.0 3.0 3.0Lane Util. Factor 1.00 1.00 1.00 1.00Frpb, ped/bikes 1.00 1.00 0.94 0.99Flpb, ped/bikes 1.00 1.00 1.00 1.00Frt 1.00 1.00 0.95 0.87Flt Protected 1.00 1.00 0.97 1.00Satd. Flow (prot) 1855 1897 1417 1640Flt Permitted 1.00 1.00 0.92 1.00Satd. Flow (perm) 1852 1895 1339 1640Peak-hour factor, PHF 1.00 1.00 1.00 1.00 1.00 1.00 1.00 1.00 1.00 1.00 1.00 1.00Adj. Flow (vph) 3 413 5 2 437 2 12 1 7 0 4 59RTOR Reduction (vph) 0 1 0 0 1 0 0 4 0 0 32 0Lane Group Flow (vph) 0 420 0 0 440 0 0 16 0 0 31 0Confl. Peds. (#/hr) 77 77 33 271 271Confl. Bikes (#/hr) 13 8 2Heavy Vehicles (%) 2% 2% 2% 0% 0% 0% 16% 16% 16% 0% 0% 0%Turn Type Perm NA Perm NA Perm NA NAProtected Phases 2 6 4 8Permitted Phases 2 6 4 8Actuated Green, G (s) 21.0 21.0 23.0 23.0Effective Green, g (s) 21.0 21.0 23.0 23.0Actuated g/C Ratio 0.42 0.42 0.46 0.46Clearance Time (s) 3.0 3.0 3.0 3.0Lane Grp Cap (vph) 777 795 615 754v/s Ratio Prot c0.02v/s Ratio Perm 0.23 c0.23 0.01v/c Ratio 0.54 0.55 0.03 0.04Uniform Delay, d1 10.9 11.0 7.4 7.4Progression Factor 1.49 1.00 1.00 1.00Incremental Delay, d2 2.0 2.8 0.1 0.1Delay (s) 18.2 13.7 7.5 7.5Level of Service B B A AApproach Delay (s) 18.2 13.7 7.5 7.5Approach LOS B B A A
Intersection SummaryHCM 2000 Control Delay 15.2 HCM 2000 Level of Service BHCM 2000 Volume to Capacity ratio 0.29Actuated Cycle Length (s) 50.0 Sum of lost time (s) 6.0Intersection Capacity Utilization 50.3% ICU Level of Service AAnalysis Period (min) 15c Critical Lane Group
HCM Unsignalized Intersection Capacity Analysis Children's Hospital 12: 52nd Street & Dover Street DC_2020 PM Plus Phase 2
Fehr & Peers Synchro 8 Report
Movement EBL EBT EBR WBL WBT WBR NBL NBT NBR SBL SBT SBRLane ConfigurationsVolume (veh/h) 8 375 46 21 372 4 72 0 50 10 0 14Sign Control Free Free Stop StopGrade 0% 0% 0% 0%Peak Hour Factor 1.00 1.00 1.00 1.00 1.00 1.00 1.00 1.00 1.00 1.00 1.00 1.00Hourly flow rate (vph) 8 375 46 21 372 4 72 0 50 10 0 14Pedestrians 49 10 46 20Lane Width (ft) 12.0 12.0 12.0 12.0Walking Speed (ft/s) 4.0 4.0 4.0 4.0Percent Blockage 4 1 4 2Right turn flare (veh)Median type None NoneMedian storage veh)Upstream signal (ft) 312 647pX, platoon unblocked 0.88 0.83 0.89 0.89 0.83 0.89 0.89 0.88vC, conflicting volume 396 467 939 898 454 910 919 443vC1, stage 1 conf volvC2, stage 2 conf volvCu, unblocked vol 245 253 563 517 237 530 541 298tC, single (s) 4.1 4.1 7.2 6.6 6.3 7.1 6.5 6.2tC, 2 stage (s)tF (s) 2.2 2.2 3.6 4.1 3.4 3.5 4.0 3.3p0 queue free % 99 98 77 100 92 97 100 98cM capacity (veh/h) 1138 1050 320 369 618 346 369 619
Direction, Lane # EB 1 WB 1 NB 1 SB 1Volume Total 429 397 122 24Volume Left 8 21 72 10Volume Right 46 4 50 14cSH 1138 1050 398 466Volume to Capacity 0.01 0.02 0.31 0.05Queue Length 95th (ft) 1 2 32 4Control Delay (s) 0.2 0.7 18.0 13.2Lane LOS A A C BApproach Delay (s) 0.2 0.7 18.0 13.2Approach LOS C B
Intersection SummaryAverage Delay 2.9Intersection Capacity Utilization 49.4% ICU Level of Service AAnalysis Period (min) 15

HCM Unsignalized Intersection Capacity Analysis Children's Hospital 13: SR-24 NB Off-Ramp & 52nd Street DC_2020 PM Plus Phase 2
Fehr & Peers Synchro 8 Report
Movement EBL EBT EBR WBL WBT WBR NBL NBR SEL SERLane ConfigurationsVolume (veh/h) 0 433 0 0 402 1067 0 1050 0 0Sign Control Free Free Stop StopGrade 0% 0% 0% 0%Peak Hour Factor 1.00 1.00 1.00 1.00 1.00 1.00 1.00 1.00 1.00 1.00Hourly flow rate (vph) 0 433 0 0 402 1067 0 1050 0 0Pedestrians 43Lane Width (ft) 12.0Walking Speed (ft/s) 4.0Percent Blockage 4Right turn flare (veh)Median type None NoneMedian storage veh)Upstream signal (ft) 767 192pX, platoon unblocked 0.81 0.81 0.81 0.81vC, conflicting volume 1469 476 1945 260 1668 878vC1, stage 1 conf volvC2, stage 2 conf volvCu, unblocked vol 1121 476 1705 260 1366 396tC, single (s) 4.1 4.1 6.5 7.0 7.5 6.5tC, 2 stage (s)tF (s) 2.2 2.2 4.0 3.3 3.5 4.0p0 queue free % 100 100 100 0 0 100cM capacity (veh/h) 504 1044 71 710 0 424
Direction, Lane # EB 1 EB 2 WB 1 WB 2 WB 3 NB 1 NB 2Volume Total 216 216 268 490 711 525 525Volume Left 0 0 0 0 0 0 0Volume Right 0 0 0 356 711 525 525cSH 1700 1700 1700 1700 1700 710 710Volume to Capacity 0.13 0.13 0.16 0.29 0.42 0.74 0.74Queue Length 95th (ft) 0 0 0 0 0 166 166Control Delay (s) 0.0 0.0 0.0 0.0 0.0 23.0 23.0Lane LOS C CApproach Delay (s) 0.0 0.0 23.0Approach LOS C
Intersection SummaryAverage Delay 8.2Intersection Capacity Utilization 56.4% ICU Level of Service BAnalysis Period (min) 15
HCM Signalized Intersection Capacity Analysis Children's Hospital 14: 52nd Street & Shattuck Ave DC_2020 PM Plus Phase 2
Fehr & Peers Synchro 8 Report
Movement EBU EBL EBT EBR WBL WBT WBR NBL NBT NBR SBL SBTLane ConfigurationsVolume (vph) 50 326 917 190 60 890 150 160 240 60 171 150Ideal Flow (vphpl) 1900 1900 1900 1900 1900 1900 1900 1900 1900 1900 1900 1900Total Lost time (s) 4.0 4.5 4.0 4.5 4.0 5.5 5.5Lane Util. Factor 1.00 0.91 1.00 0.91 1.00 1.00 1.00Frpb, ped/bikes 1.00 0.98 1.00 0.99 1.00 0.99 1.00Flpb, ped/bikes 1.00 1.00 1.00 1.00 1.00 1.00 0.99Frt 1.00 0.97 1.00 0.98 1.00 0.97 1.00Flt Protected 0.95 1.00 0.95 1.00 0.95 1.00 0.97Satd. Flow (prot) 1787 4924 1805 5014 1752 1764 1708Flt Permitted 0.95 1.00 0.95 1.00 0.25 1.00 0.68Satd. Flow (perm) 1787 4924 1805 5014 467 1764 1193Peak-hour factor, PHF 1.00 1.00 1.00 1.00 1.00 1.00 1.00 1.00 1.00 1.00 1.00 1.00Adj. Flow (vph) 50 326 917 190 60 890 150 160 240 60 171 150RTOR Reduction (vph) 0 0 28 0 0 21 0 0 8 0 0 0Lane Group Flow (vph) 0 376 1079 0 60 1019 0 160 292 0 0 321Confl. Peds. (#/hr) 19 19 15 29 29Confl. Bikes (#/hr) 17 11 39Heavy Vehicles (%) 1% 1% 1% 1% 0% 0% 0% 3% 3% 3% 7% 7%Turn Type Prot Prot NA Prot NA pm+pt NA Perm NAProtected Phases 7 7 4 3 8 5 2 6Permitted Phases 2 6Actuated Green, G (s) 33.5 55.1 5.2 26.8 35.7 35.7 26.2Effective Green, g (s) 33.5 55.1 5.2 26.8 35.7 35.7 26.2Actuated g/C Ratio 0.30 0.50 0.05 0.24 0.32 0.32 0.24Clearance Time (s) 4.0 4.5 4.0 4.5 4.0 5.5 5.5Vehicle Extension (s) 3.0 3.0 3.0 3.0 3.0 3.0 3.0Lane Grp Cap (vph) 544 2466 85 1221 215 572 284v/s Ratio Prot c0.21 0.22 0.03 c0.20 c0.04 0.17v/s Ratio Perm 0.20 c0.27v/c Ratio 0.69 0.44 0.71 0.83 0.74 0.51 1.13Uniform Delay, d1 33.7 17.5 51.6 39.5 32.8 30.1 41.9Progression Factor 1.00 1.00 1.00 1.00 1.00 1.00 1.00Incremental Delay, d2 7.0 0.6 23.3 6.8 13.0 3.2 93.2Delay (s) 40.7 18.1 75.0 46.3 45.8 33.3 135.1Level of Service D B E D D C FApproach Delay (s) 23.8 47.9 37.6 82.1Approach LOS C D D F
Intersection SummaryHCM 2000 Control Delay 43.4 HCM 2000 Level of Service DHCM 2000 Volume to Capacity ratio 0.86Actuated Cycle Length (s) 110.0 Sum of lost time (s) 18.0Intersection Capacity Utilization 105.4% ICU Level of Service GAnalysis Period (min) 15c Critical Lane Group

HCM Signalized Intersection Capacity Analysis Children's Hospital 14: 52nd Street & Shattuck Ave DC_2020 PM Plus Phase 2
Fehr & Peers Synchro 8 Report
Movement SBRLane ConfigurationsVolume (vph) 369Ideal Flow (vphpl) 1900Total Lost time (s) 5.5Lane Util. Factor 1.00Frpb, ped/bikes 0.93Flpb, ped/bikes 1.00Frt 0.85Flt Protected 1.00Satd. Flow (prot) 1400Flt Permitted 1.00Satd. Flow (perm) 1400Peak-hour factor, PHF 1.00Adj. Flow (vph) 369RTOR Reduction (vph) 281Lane Group Flow (vph) 88Confl. Peds. (#/hr) 24Confl. Bikes (#/hr) 36Heavy Vehicles (%) 7%Turn Type PermProtected PhasesPermitted Phases 6Actuated Green, G (s) 26.2Effective Green, g (s) 26.2Actuated g/C Ratio 0.24Clearance Time (s) 5.5Vehicle Extension (s) 3.0Lane Grp Cap (vph) 333v/s Ratio Protv/s Ratio Perm 0.06v/c Ratio 0.26Uniform Delay, d1 34.1Progression Factor 1.00Incremental Delay, d2 1.9Delay (s) 36.0Level of Service DApproach Delay (s)Approach LOS
Intersection Summary
HCM Signalized Intersection Capacity Analysis Children's Hospital 15: Telegraph Ave & 52nd Street/Claremont Ave DC_2020 PM Plus Phase 2
Fehr & Peers Synchro 8 Report
Movement EBL EBT EBR WBL WBT WBR NBL NBT NBR SBL SBT SBRLane ConfigurationsVolume (vph) 20 20 20 140 80 180 20 976 270 140 721 306Ideal Flow (vphpl) 1900 1900 1900 1900 1900 1900 1900 1900 1900 1900 1900 1900Lane Width 12 12 12 12 12 12 12 16 12 12 12 12Total Lost time (s) 4.5 4.5 4.5 4.5 4.5 4.5Lane Util. Factor 1.00 0.95 0.95 0.95 1.00 0.95Frpb, ped/bikes 0.99 1.00 0.94 0.98 1.00 0.91Flpb, ped/bikes 1.00 1.00 1.00 1.00 1.00 1.00Frt 0.95 1.00 0.90 0.97 1.00 0.96Flt Protected 0.98 0.95 1.00 1.00 0.95 1.00Satd. Flow (prot) 1642 1698 1513 3773 1770 3083Flt Permitted 0.98 0.95 1.00 0.93 0.95 1.00Satd. Flow (perm) 1642 1698 1513 3499 1770 3083Peak-hour factor, PHF 1.00 1.00 1.00 1.00 1.00 1.00 1.00 1.00 1.00 1.00 1.00 1.00Adj. Flow (vph) 20 20 20 140 80 180 20 976 270 140 721 306RTOR Reduction (vph) 0 19 0 0 73 0 0 21 0 0 40 0Lane Group Flow (vph) 0 41 0 126 201 0 0 1245 0 140 987 0Confl. Peds. (#/hr) 45 45 91 29 91Confl. Bikes (#/hr) 2 13 46 63Heavy Vehicles (%) 8% 8% 8% 1% 1% 1% 3% 3% 3% 2% 2% 2%Turn Type Split NA Split NA Perm NA Prot NAProtected Phases 4 4 8 8 2 1 6Permitted Phases 2Actuated Green, G (s) 6.2 18.0 18.0 45.9 11.9 62.3Effective Green, g (s) 6.2 18.0 18.0 45.9 11.9 62.3Actuated g/C Ratio 0.06 0.18 0.18 0.46 0.12 0.62Clearance Time (s) 4.5 4.5 4.5 4.5 4.5 4.5Vehicle Extension (s) 3.0 3.0 3.0 3.0 3.0 3.0Lane Grp Cap (vph) 101 305 272 1606 210 1920v/s Ratio Prot c0.03 0.07 c0.13 c0.08 0.32v/s Ratio Perm c0.36v/c Ratio 0.41 0.41 0.74 0.78 0.67 0.51Uniform Delay, d1 45.1 36.3 38.8 22.7 42.2 10.5Progression Factor 1.80 1.00 1.00 0.57 1.00 1.00Incremental Delay, d2 1.2 0.9 10.0 2.5 7.8 1.0Delay (s) 82.7 37.2 48.8 15.4 49.9 11.4Level of Service F D D B D BApproach Delay (s) 82.7 45.2 15.4 16.1Approach LOS F D B B
Intersection SummaryHCM 2000 Control Delay 21.2 HCM 2000 Level of Service CHCM 2000 Volume to Capacity ratio 0.72Actuated Cycle Length (s) 100.0 Sum of lost time (s) 18.0Intersection Capacity Utilization 100.3% ICU Level of Service GAnalysis Period (min) 15c Critical Lane Group

HCM Signalized Intersection Capacity Analysis Children's Hospital 16: Telegraph Ave & 51St Street DC_2020 PM Plus Phase 2
Fehr & Peers Synchro 8 Report
Movement EBL EBT EBR WBL WBT WBR NBL NBT NBR SBL SBT SBRLane ConfigurationsVolume (vph) 336 664 108 70 521 240 103 690 120 280 541 60Ideal Flow (vphpl) 1900 1900 1900 1900 1900 1900 1900 1900 1900 1900 1900 1900Total Lost time (s) 4.0 4.0 4.0 3.5 4.0 4.5 4.0 3.5Lane Util. Factor 0.97 0.95 1.00 0.95 1.00 0.95 1.00 0.95Frpb, ped/bikes 1.00 0.98 1.00 0.97 1.00 0.98 1.00 0.97Flpb, ped/bikes 1.00 1.00 1.00 1.00 1.00 1.00 1.00 1.00Frt 1.00 0.98 1.00 0.95 1.00 0.98 1.00 0.99Flt Protected 0.95 1.00 0.95 1.00 0.95 1.00 0.95 1.00Satd. Flow (prot) 3400 3377 1787 3299 1719 3293 1752 3363Flt Permitted 0.95 1.00 0.95 1.00 0.95 1.00 0.95 1.00Satd. Flow (perm) 3400 3377 1787 3299 1719 3293 1752 3363Peak-hour factor, PHF 1.00 1.00 1.00 1.00 1.00 1.00 1.00 1.00 1.00 1.00 1.00 1.00Adj. Flow (vph) 336 664 108 70 521 240 103 690 120 280 541 60RTOR Reduction (vph) 0 13 0 0 53 0 0 14 0 0 9 0Lane Group Flow (vph) 336 759 0 70 708 0 103 796 0 280 592 0Confl. Peds. (#/hr) 68 50 75 120Confl. Bikes (#/hr) 11 20 45 71Heavy Vehicles (%) 3% 3% 3% 1% 1% 1% 5% 5% 5% 3% 3% 3%Turn Type Prot NA Prot NA Prot NA Prot NAProtected Phases 7 4 3 8 5 2 1 6Permitted PhasesActuated Green, G (s) 14.6 29.5 8.0 23.4 8.2 33.0 13.0 38.8Effective Green, g (s) 14.6 29.5 8.0 23.4 8.2 33.0 13.0 38.8Actuated g/C Ratio 0.15 0.29 0.08 0.23 0.08 0.33 0.13 0.39Clearance Time (s) 4.0 4.0 4.0 3.5 4.0 4.5 4.0 3.5Vehicle Extension (s) 3.0 3.0 3.0 3.0 3.0 3.0 3.0 3.0Lane Grp Cap (vph) 496 996 142 771 140 1086 227 1304v/s Ratio Prot c0.10 0.22 0.04 c0.21 0.06 c0.24 c0.16 0.18v/s Ratio Permv/c Ratio 0.68 0.76 0.49 0.92 0.74 0.73 1.23 0.45Uniform Delay, d1 40.5 32.1 44.1 37.4 44.8 29.6 43.5 22.7Progression Factor 1.00 1.00 1.00 1.00 1.00 1.00 1.22 0.70Incremental Delay, d2 3.7 5.5 2.7 17.7 18.1 4.4 134.1 1.0Delay (s) 44.1 37.6 46.7 55.1 62.9 34.0 187.0 16.9Level of Service D D D E E C F BApproach Delay (s) 39.6 54.4 37.3 71.0Approach LOS D D D E
Intersection SummaryHCM 2000 Control Delay 49.7 HCM 2000 Level of Service DHCM 2000 Volume to Capacity ratio 0.86Actuated Cycle Length (s) 100.0 Sum of lost time (s) 16.5Intersection Capacity Utilization 85.8% ICU Level of Service EAnalysis Period (min) 15c Critical Lane Group
HCM Signalized Intersection Capacity Analysis Children's Hospital 17: SB SR-24 On-Ramp & MLK Way & NB SR-24 Off-Ramp DC_2020 PM Plus Phase 2
Fehr & Peers Synchro 8 Report
Movement EBL EBT EBR WBL WBT WBR NBL NBT NBR SBL SBT SBRLane ConfigurationsVolume (vph) 301 0 0 0 0 1682 0 0 0 0 1654 243Ideal Flow (vphpl) 1900 1900 1900 1900 1900 1900 1900 1900 1900 1900 1900 1900Total Lost time (s) 4.0 4.0 4.0 4.0Lane Util. Factor 0.97 1.00 0.95 0.88Frpb, ped/bikes 1.00 1.00 1.00 1.00Flpb, ped/bikes 1.00 1.00 1.00 1.00Frt 1.00 0.86 1.00 0.85Flt Protected 0.95 1.00 1.00 1.00Satd. Flow (prot) 3273 1627 3574 2814Flt Permitted 0.95 1.00 1.00 1.00Satd. Flow (perm) 3273 1627 3574 2814Peak-hour factor, PHF 1.00 1.00 1.00 1.00 1.00 1.00 1.00 1.00 1.00 1.00 1.00 1.00Adj. Flow (vph) 301 0 0 0 0 1682 0 0 0 0 1654 243RTOR Reduction (vph) 0 0 0 0 0 0 0 0 0 0 0 0Lane Group Flow (vph) 301 0 0 0 0 1682 0 0 0 0 1654 243Confl. Peds. (#/hr) 3Confl. Bikes (#/hr) 12Heavy Vehicles (%) 7% 7% 2% 2% 1% 1% 2% 2% 2% 2% 1% 1%Turn Type Prot Free NA customProtected Phases 2 6 FreePermitted Phases FreeActuated Green, G (s) 13.0 50.0 29.0 50.0Effective Green, g (s) 13.0 50.0 29.0 50.0Actuated g/C Ratio 0.26 1.00 0.58 1.00Clearance Time (s) 4.0 4.0Lane Grp Cap (vph) 850 1627 2072 2814v/s Ratio Prot 0.09 0.46 0.09v/s Ratio Perm c1.03v/c Ratio 0.35 1.03 0.80 0.09Uniform Delay, d1 15.1 25.0 8.2 0.0Progression Factor 1.00 1.00 2.66 1.00Incremental Delay, d2 1.2 31.5 2.6 0.0Delay (s) 16.2 56.5 24.5 0.0Level of Service B E C AApproach Delay (s) 16.2 56.5 0.0 21.3Approach LOS B E A C
Intersection SummaryHCM 2000 Control Delay 36.2 HCM 2000 Level of Service DHCM 2000 Volume to Capacity ratio 1.23Actuated Cycle Length (s) 50.0 Sum of lost time (s) 8.0Intersection Capacity Utilization 61.0% ICU Level of Service BAnalysis Period (min) 15c Critical Lane Group

HCM Unsignalized Intersection Capacity Analysis Children's Hospital 18: West Street & 52nd Street DC_2020 PM Plus Phase 2
Fehr & Peers Synchro 8 Report
Movement EBL EBT EBR WBL WBT WBR NBL NBT NBR SBL SBT SBRLane ConfigurationsSign Control Stop Stop Stop StopVolume (vph) 0 141 10 90 113 0 50 0 140 10 60 10Peak Hour Factor 1.00 1.00 1.00 1.00 1.00 1.00 1.00 1.00 1.00 1.00 1.00 1.00Hourly flow rate (vph) 0 141 10 90 113 0 50 0 140 10 60 10
Direction, Lane # EB 1 WB 1 NB 1 NB 2 SB 1Volume Total (vph) 151 203 50 140 80Volume Left (vph) 0 90 50 0 10Volume Right (vph) 10 0 0 140 10Hadj (s) -0.02 0.12 0.50 -0.70 -0.02Departure Headway (s) 4.8 4.9 6.0 4.8 5.1Degree Utilization, x 0.20 0.28 0.08 0.19 0.11Capacity (veh/h) 694 693 566 702 638Control Delay (s) 9.0 9.7 8.3 7.7 8.8Approach Delay (s) 9.0 9.7 7.8 8.8Approach LOS A A A A
Intersection SummaryDelay 8.9Level of Service AIntersection Capacity Utilization 42.9% ICU Level of Service AAnalysis Period (min) 15
HCM Unsignalized Intersection Capacity Analysis Children's Hospital 19: Genoa Street & 52nd Street DC_2020 PM Plus Phase 2
Fehr & Peers Synchro 8 Report
Movement EBL EBT EBR WBL WBT WBR NBL NBT NBR SBL SBT SBRLane ConfigurationsSign Control Stop Stop Stop StopVolume (vph) 10 131 10 10 113 50 10 10 10 20 10 10Peak Hour Factor 1.00 1.00 1.00 1.00 1.00 1.00 1.00 1.00 1.00 1.00 1.00 1.00Hourly flow rate (vph) 10 131 10 10 113 50 10 10 10 20 10 10
Direction, Lane # EB 1 WB 1 NB 1 SB 1Volume Total (vph) 151 173 30 40Volume Left (vph) 10 10 10 20Volume Right (vph) 10 50 10 10Hadj (s) -0.01 -0.16 -0.13 -0.05Departure Headway (s) 4.2 4.1 4.5 4.6Degree Utilization, x 0.18 0.20 0.04 0.05Capacity (veh/h) 829 865 736 722Control Delay (s) 8.1 8.0 7.7 7.8Approach Delay (s) 8.1 8.0 7.7 7.8Approach LOS A A A A
Intersection SummaryDelay 8.0Level of Service AIntersection Capacity Utilization 23.9% ICU Level of Service AAnalysis Period (min) 15

HCM Unsignalized Intersection Capacity Analysis Children's Hospital 20: Genoa Street & 55th Street DC_2020 PM Plus Phase 2
Fehr & Peers Synchro 8 Report
Movement EBL EBT EBR WBL WBT WBR NBL NBT NBR SBL SBT SBRLane ConfigurationsVolume (veh/h) 20 380 10 20 381 40 10 20 40 40 10 20Sign Control Free Free Stop StopGrade 0% 0% 0% 0%Peak Hour Factor 1.00 1.00 1.00 1.00 1.00 1.00 1.00 1.00 1.00 1.00 1.00 1.00Hourly flow rate (vph) 20 380 10 20 381 40 10 20 40 40 10 20Pedestrians 7 10 4Lane Width (ft) 12.0 12.0 12.0Walking Speed (ft/s) 4.0 4.0 4.0Percent Blockage 1 1 0Right turn flare (veh)Median type None NoneMedian storage veh)Upstream signal (ft) 721pX, platoon unblockedvC, conflicting volume 425 400 908 900 395 920 885 412vC1, stage 1 conf volvC2, stage 2 conf volvCu, unblocked vol 425 400 908 900 395 920 885 412tC, single (s) 4.1 4.1 7.1 6.5 6.2 7.1 6.5 6.2tC, 2 stage (s)tF (s) 2.2 2.2 3.5 4.0 3.3 3.5 4.0 3.3p0 queue free % 98 98 96 93 94 81 96 97cM capacity (veh/h) 1136 1160 231 268 653 214 271 634
Direction, Lane # EB 1 WB 1 NB 1 SB 1Volume Total 410 441 70 70Volume Left 20 20 10 40Volume Right 10 40 40 20cSH 1136 1160 391 274Volume to Capacity 0.02 0.02 0.18 0.26Queue Length 95th (ft) 1 1 16 25Control Delay (s) 0.6 0.5 16.2 22.6Lane LOS A A C CApproach Delay (s) 0.6 0.5 16.2 22.6Approach LOS C C
Intersection SummaryAverage Delay 3.2Intersection Capacity Utilization 47.4% ICU Level of Service AAnalysis Period (min) 15
HCM Unsignalized Intersection Capacity Analysis Children's Hospital 21: MLK Way & RIRO Main Garage DC_2020 PM Plus Phase 2
Fehr & Peers Synchro 8 Report
Movement WBL WBR NBT NBR SBL SBTLane ConfigurationsVolume (veh/h) 0 123 2087 34 0 1796Sign Control Stop Free FreeGrade 0% 0% 0%Peak Hour Factor 1.00 1.00 1.00 1.00 1.00 1.00Hourly flow rate (vph) 0 123 2087 34 0 1796PedestriansLane Width (ft)Walking Speed (ft/s)Percent BlockageRight turn flare (veh)Median type None NoneMedian storage veh)Upstream signal (ft) 154 137pX, platoon unblocked 0.74 0.67 0.67vC, conflicting volume 2703 713 2121vC1, stage 1 conf volvC2, stage 2 conf volvCu, unblocked vol 658 0 928tC, single (s) 6.8 6.9 4.1tC, 2 stage (s)tF (s) 3.5 3.3 2.2p0 queue free % 100 83 100cM capacity (veh/h) 296 722 488
Direction, Lane # WB 1 NB 1 NB 2 NB 3 SB 1 SB 2 SB 3Volume Total 123 835 835 451 599 599 599Volume Left 0 0 0 0 0 0 0Volume Right 123 0 0 34 0 0 0cSH 722 1700 1700 1700 1700 1700 1700Volume to Capacity 0.17 0.49 0.49 0.27 0.35 0.35 0.35Queue Length 95th (ft) 15 0 0 0 0 0 0Control Delay (s) 11.0 0.0 0.0 0.0 0.0 0.0 0.0Lane LOS BApproach Delay (s) 11.0 0.0 0.0Approach LOS B
Intersection SummaryAverage Delay 0.3Intersection Capacity Utilization 55.4% ICU Level of Service BAnalysis Period (min) 15

HCM Unsignalized Intersection Capacity Analysis Children's Hospital 22: MLK Way & RIRO Main Plaza DC_2020 PM Plus Phase 2
Fehr & Peers Synchro 8 Report
Movement WBL WBR NBT NBR SBL SBTLane ConfigurationsVolume (veh/h) 0 0 1983 0 0 1867Sign Control Stop Free FreeGrade 0% 0% 0%Peak Hour Factor 1.00 1.00 1.00 1.00 1.00 1.00Hourly flow rate (vph) 0 0 1983 0 0 1867PedestriansLane Width (ft)Walking Speed (ft/s)Percent BlockageRight turn flare (veh)Median type None NoneMedian storage veh)Upstream signal (ft) 424 204pX, platoon unblocked 0.76vC, conflicting volume 2605 661 1983vC1, stage 1 conf volvC2, stage 2 conf volvCu, unblocked vol 2022 661 1983tC, single (s) 6.8 6.9 4.1tC, 2 stage (s)tF (s) 3.5 3.3 2.2p0 queue free % 100 100 100cM capacity (veh/h) 38 405 287
Direction, Lane # WB 1 NB 1 NB 2 NB 3 SB 1 SB 2 SB 3Volume Total 0 793 793 397 622 622 622Volume Left 0 0 0 0 0 0 0Volume Right 0 0 0 0 0 0 0cSH 1700 1700 1700 1700 1700 1700 1700Volume to Capacity 0.00 0.47 0.47 0.23 0.37 0.37 0.37Queue Length 95th (ft) 0 0 0 0 0 0 0Control Delay (s) 0.0 0.0 0.0 0.0 0.0 0.0 0.0Lane LOS AApproach Delay (s) 0.0 0.0 0.0Approach LOS A
Intersection SummaryAverage Delay 0.0Intersection Capacity Utilization 41.6% ICU Level of Service AAnalysis Period (min) 15
HCM Unsignalized Intersection Capacity Analysis Children's Hospital 24: 51St Street & 52nd Street DC_2020 PM Plus Phase 2
Fehr & Peers Synchro 8 Report
Intersection Sign configuration not allowed in HCM analysis.

HCM Signalized Intersection Capacity Analysis Children's Hospital1: MLK Way & 55th Street DC_2035 AM Plus Phase 1
Fehr & Peers Synchro 8 Report
Movement EBL EBT EBR WBL WBT WBR NBU NBL NBT NBR SBL SBTLane ConfigurationsVolume (vph) 20 200 250 60 270 100 21 180 1441 72 160 1522Ideal Flow (vphpl) 1900 1900 1900 1900 1900 1900 1900 1900 1900 1900 1900 1900Total Lost time (s) 5.0 5.0 4.5 5.0 4.5 5.0Lane Util. Factor 1.00 1.00 1.00 0.91 1.00 0.91Frpb, ped/bikes 0.98 0.99 1.00 1.00 1.00 1.00Flpb, ped/bikes 1.00 1.00 1.00 1.00 1.00 1.00Frt 0.93 0.97 1.00 0.99 1.00 0.99Flt Protected 1.00 0.99 0.95 1.00 0.95 1.00Satd. Flow (prot) 1702 1741 1770 5027 1770 5037Flt Permitted 0.98 0.79 0.95 1.00 0.95 1.00Satd. Flow (perm) 1663 1383 1770 5027 1770 5037Peak-hour factor, PHF 1.00 1.00 1.00 1.00 1.00 1.00 1.00 1.00 1.00 1.00 1.00 1.00Adj. Flow (vph) 20 200 250 60 270 100 21 180 1441 72 160 1522RTOR Reduction (vph) 0 50 0 0 13 0 0 0 5 0 0 5Lane Group Flow (vph) 0 420 0 0 417 0 0 201 1508 0 160 1587Confl. Peds. (#/hr) 11 21 21 11 32Confl. Bikes (#/hr) 24 23 9Heavy Vehicles (%) 1% 1% 1% 4% 4% 4% 2% 2% 2% 2% 2% 2%Turn Type Perm NA Perm NA Prot Prot NA Prot NAProtected Phases 4 8 5 5 2 1 6Permitted Phases 4 8Actuated Green, G (s) 29.4 29.4 13.5 38.6 7.5 32.6Effective Green, g (s) 29.4 29.4 13.5 38.6 7.5 32.6Actuated g/C Ratio 0.33 0.33 0.15 0.43 0.08 0.36Clearance Time (s) 5.0 5.0 4.5 5.0 4.5 5.0Vehicle Extension (s) 3.0 3.0 3.0 3.0 3.0 3.0Lane Grp Cap (vph) 543 451 265 2156 147 1824v/s Ratio Prot 0.11 c0.30 0.09 c0.32v/s Ratio Perm 0.25 c0.30v/c Ratio 0.77 0.92 0.76 0.70 1.09 0.87Uniform Delay, d1 27.3 29.2 36.7 21.0 41.2 26.7Progression Factor 1.00 1.00 0.56 0.33 1.00 1.00Incremental Delay, d2 6.8 24.5 10.4 1.7 99.9 6.0Delay (s) 34.1 53.8 31.0 8.6 141.1 32.7Level of Service C D C A F CApproach Delay (s) 34.1 53.8 11.3 42.6Approach LOS C D B D
Intersection SummaryHCM 2000 Control Delay 30.5 HCM 2000 Level of Service CHCM 2000 Volume to Capacity ratio 0.88Actuated Cycle Length (s) 90.0 Sum of lost time (s) 14.5Intersection Capacity Utilization 99.6% ICU Level of Service FAnalysis Period (min) 15c Critical Lane Group
HCM Signalized Intersection Capacity Analysis Children's Hospital1: MLK Way & 55th Street DC_2035 AM Plus Phase 1
Fehr & Peers Synchro 8 Report
Movement SBRLane ConfigurationsVolume (vph) 70Ideal Flow (vphpl) 1900Total Lost time (s)Lane Util. FactorFrpb, ped/bikesFlpb, ped/bikesFrtFlt ProtectedSatd. Flow (prot)Flt PermittedSatd. Flow (perm)Peak-hour factor, PHF 1.00Adj. Flow (vph) 70RTOR Reduction (vph) 0Lane Group Flow (vph) 0Confl. Peds. (#/hr) 18Confl. Bikes (#/hr) 11Heavy Vehicles (%) 2%Turn TypeProtected PhasesPermitted PhasesActuated Green, G (s)Effective Green, g (s)Actuated g/C RatioClearance Time (s)Vehicle Extension (s)Lane Grp Cap (vph)v/s Ratio Protv/s Ratio Permv/c RatioUniform Delay, d1Progression FactorIncremental Delay, d2Delay (s)Level of ServiceApproach Delay (s)Approach LOS
Intersection Summary

HCM Unsignalized Intersection Capacity Analysis Children's Hospital2: Dover Street & 55th Street DC_2035 AM Plus Phase 1
Fehr & Peers Synchro 8 Report
Movement EBL EBT EBR WBL WBT WBR NBL NBT NBR SBL SBT SBRLane ConfigurationsVolume (veh/h) 30 382 10 30 370 10 10 10 20 10 10 30Sign Control Free Free Stop StopGrade 0% 0% 0% 0%Peak Hour Factor 1.00 1.00 1.00 1.00 1.00 1.00 1.00 1.00 1.00 1.00 1.00 1.00Hourly flow rate (vph) 30 382 10 30 370 10 10 10 20 10 10 30Pedestrians 14 30 23 9Lane Width (ft) 12.0 12.0 12.0 12.0Walking Speed (ft/s) 4.0 4.0 4.0 4.0Percent Blockage 1 3 2 1Right turn flare (veh)Median type None NoneMedian storage veh)Upstream signal (ft) 641 677pX, platoon unblocked 0.87 0.87 0.87 0.87 0.87 0.87vC, conflicting volume 389 415 954 919 440 946 919 398vC1, stage 1 conf volvC2, stage 2 conf volvCu, unblocked vol 229 415 875 835 440 866 835 239tC, single (s) 4.1 4.1 7.1 6.5 6.2 7.1 6.5 6.2tC, 2 stage (s)tF (s) 2.2 2.2 3.5 4.0 3.3 3.5 4.0 3.3p0 queue free % 97 97 95 96 97 95 96 96cM capacity (veh/h) 1147 1112 201 246 594 203 244 684
Direction, Lane # EB 1 WB 1 NB 1 SB 1Volume Total 422 410 40 50Volume Left 30 30 10 10Volume Right 10 10 20 30cSH 1147 1112 322 373Volume to Capacity 0.03 0.03 0.12 0.13Queue Length 95th (ft) 2 2 10 11Control Delay (s) 0.8 0.9 17.7 16.2Lane LOS A A C CApproach Delay (s) 0.8 0.9 17.7 16.2Approach LOS C C
Intersection SummaryAverage Delay 2.4Intersection Capacity Utilization 45.8% ICU Level of Service AAnalysis Period (min) 15
HCM Signalized Intersection Capacity Analysis Children's Hospital3: 55th Street & Shattuck Ave DC_2035 AM Plus Phase 1
Fehr & Peers Synchro 8 Report
Movement EBL EBT EBR WBL WBT WBR NBL NBT NBR SBL SBT SBRLane ConfigurationsVolume (vph) 80 272 80 40 290 70 50 520 30 30 620 50Ideal Flow (vphpl) 1900 1900 1900 1900 1900 1900 1900 1900 1900 1900 1900 1900Total Lost time (s) 3.0 3.0 5.0 5.0Lane Util. Factor 1.00 1.00 1.00 1.00Frpb, ped/bikes 0.98 0.99 1.00 1.00Flpb, ped/bikes 1.00 1.00 1.00 1.00Frt 0.97 0.98 0.99 0.99Flt Protected 0.99 1.00 1.00 1.00Satd. Flow (prot) 1717 1774 1837 1852Flt Permitted 0.78 0.92 0.91 0.96Satd. Flow (perm) 1348 1631 1675 1787Peak-hour factor, PHF 1.00 1.00 1.00 1.00 1.00 1.00 1.00 1.00 1.00 1.00 1.00 1.00Adj. Flow (vph) 80 272 80 40 290 70 50 520 30 30 620 50RTOR Reduction (vph) 0 10 0 0 10 0 0 2 0 0 3 0Lane Group Flow (vph) 0 422 0 0 390 0 0 598 0 0 697 0Confl. Peds. (#/hr) 9 20 20 9 11 26 26 11Confl. Bikes (#/hr) 33 15 20 36Heavy Vehicles (%) 5% 5% 5% 3% 3% 3% 2% 2% 2% 1% 1% 1%Turn Type Perm NA Perm NA Perm NA Perm NAProtected Phases 2 6 4 8Permitted Phases 2 6 4 4 8Actuated Green, G (s) 25.0 25.0 47.0 47.0Effective Green, g (s) 25.0 25.0 47.0 47.0Actuated g/C Ratio 0.31 0.31 0.59 0.59Clearance Time (s) 3.0 3.0 5.0 5.0Lane Grp Cap (vph) 421 509 984 1049v/s Ratio Protv/s Ratio Perm c0.31 0.24 0.36 c0.39v/c Ratio 1.00 0.77 0.61 0.66Uniform Delay, d1 27.5 24.9 10.6 11.2Progression Factor 1.00 1.00 1.00 1.00Incremental Delay, d2 44.3 10.6 2.8 3.3Delay (s) 71.8 35.4 13.4 14.5Level of Service E D B BApproach Delay (s) 71.8 35.4 13.4 14.5Approach LOS E D B B
Intersection SummaryHCM 2000 Control Delay 29.7 HCM 2000 Level of Service CHCM 2000 Volume to Capacity ratio 0.78Actuated Cycle Length (s) 80.0 Sum of lost time (s) 8.0Intersection Capacity Utilization 95.5% ICU Level of Service FAnalysis Period (min) 15c Critical Lane Group

HCM Signalized Intersection Capacity Analysis Children's Hospital4: 55th Street & Telegraph Ave DC_2035 AM Plus Phase 1
Fehr & Peers Synchro 8 Report
Movement EBL EBT EBR WBL WBT WBR NBL NBT NBR SBL SBT SBRLane ConfigurationsVolume (vph) 192 20 100 50 10 10 80 1122 60 40 1344 300Ideal Flow (vphpl) 1900 1900 1900 1900 1900 1900 1900 1900 1900 1900 1900 1900Total Lost time (s) 4.5 4.5 4.5 4.5 4.5 4.5Lane Util. Factor 1.00 1.00 1.00 0.95 1.00 0.95Frpb, ped/bikes 0.99 0.99 1.00 0.99 1.00 0.98Flpb, ped/bikes 1.00 0.99 1.00 1.00 0.99 1.00Frt 0.96 0.98 1.00 0.99 1.00 0.97Flt Protected 0.97 0.97 0.95 1.00 0.95 1.00Satd. Flow (prot) 1648 1711 1770 3493 1775 3424Flt Permitted 0.77 0.72 0.10 1.00 0.18 1.00Satd. Flow (perm) 1310 1280 181 3493 330 3424Peak-hour factor, PHF 1.00 1.00 1.00 1.00 1.00 1.00 1.00 1.00 1.00 1.00 1.00 1.00Adj. Flow (vph) 192 20 100 50 10 10 80 1122 60 40 1344 300RTOR Reduction (vph) 0 19 0 0 7 0 0 5 0 0 23 0Lane Group Flow (vph) 0 293 0 0 63 0 80 1177 0 40 1621 0Confl. Peds. (#/hr) 9 17 17 9 20 26 26 20Confl. Bikes (#/hr) 23 23 65 41Heavy Vehicles (%) 5% 5% 5% 4% 4% 4% 2% 2% 2% 1% 1% 1%Turn Type Perm NA Perm NA Perm NA Perm NAProtected Phases 4 8 2 6Permitted Phases 4 8 2 6Actuated Green, G (s) 19.9 19.9 41.1 41.1 41.1 41.1Effective Green, g (s) 19.9 19.9 41.1 41.1 41.1 41.1Actuated g/C Ratio 0.28 0.28 0.59 0.59 0.59 0.59Clearance Time (s) 4.5 4.5 4.5 4.5 4.5 4.5Vehicle Extension (s) 3.0 3.0 3.0 3.0 3.0 3.0Lane Grp Cap (vph) 372 363 106 2050 193 2010v/s Ratio Prot 0.34 c0.47v/s Ratio Perm c0.22 0.05 0.44 0.12v/c Ratio 0.79 0.17 0.75 0.57 0.21 0.81Uniform Delay, d1 23.1 18.9 10.7 9.0 6.8 11.3Progression Factor 1.00 1.00 1.00 1.00 1.00 1.00Incremental Delay, d2 10.5 0.2 38.7 1.2 2.4 3.6Delay (s) 33.6 19.1 49.4 10.2 9.2 14.9Level of Service C B D B A BApproach Delay (s) 33.6 19.1 12.7 14.8Approach LOS C B B B
Intersection SummaryHCM 2000 Control Delay 15.8 HCM 2000 Level of Service BHCM 2000 Volume to Capacity ratio 0.80Actuated Cycle Length (s) 70.0 Sum of lost time (s) 9.0Intersection Capacity Utilization 82.7% ICU Level of Service EAnalysis Period (min) 15c Critical Lane Group
HCM Unsignalized Intersection Capacity Analysis Children's Hospital5: MLK Way & 54th Street DC_2035 AM Plus Phase 1
Fehr & Peers Synchro 8 Report
Movement EBL EBT EBR WBL WBT WBR NBU NBL NBT NBR SBL SBTLane ConfigurationsVolume (veh/h) 10 10 60 10 10 10 11 30 1682 26 10 1793Sign Control Stop Stop Free FreeGrade 0% 0% 0% 0%Peak Hour Factor 1.00 1.00 1.00 1.00 1.00 1.00 1.00 1.00 1.00 1.00 1.00 1.00Hourly flow rate (vph) 10 10 60 10 10 10 0 30 1682 26 10 1793Pedestrians 11 9 12Lane Width (ft) 12.0 12.0 12.0Walking Speed (ft/s) 4.0 4.0 4.0Percent Blockage 1 1 1Right turn flare (veh)Median type None NoneMedian storage veh)Upstream signal (ft) 299 294pX, platoon unblocked 0.81 0.81 0.71 0.81 0.81 0.80 0.00 0.71 0.80vC, conflicting volume 2465 3606 626 2459 3598 583 0 1814 1717vC1, stage 1 conf volvC2, stage 2 conf volvCu, unblocked vol 356 1767 0 348 1757 0 0 724 1042tC, single (s) 7.5 6.5 6.9 7.5 6.5 6.9 0.0 4.1 4.1tC, 2 stage (s)tF (s) *5.0 *5.0 *5.0 *5.0 *5.0 *5.0 0.0 2.2 2.2p0 queue free % 96 83 88 96 83 98 0 95 98cM capacity (veh/h) 280 59 502 251 60 575 0 616 534
Direction, Lane # EB 1 WB 1 NB 1 NB 2 NB 3 SB 1 SB 2 SB 3Volume Total 80 30 450 841 446 458 896 458Volume Left 10 10 30 0 0 10 0 0Volume Right 60 10 0 0 26 0 0 10cSH 247 134 616 1700 1700 534 1700 1700Volume to Capacity 0.32 0.22 0.05 0.49 0.26 0.02 0.53 0.27Queue Length 95th (ft) 34 20 4 0 0 1 0 0Control Delay (s) 26.4 39.5 1.4 0.0 0.0 0.6 0.0 0.0Lane LOS D E A AApproach Delay (s) 26.4 39.5 0.4 0.1Approach LOS D E
Intersection SummaryAverage Delay 1.1Intersection Capacity Utilization 77.6% ICU Level of Service DAnalysis Period (min) 15
* User Entered Value

HCM Unsignalized Intersection Capacity Analysis Children's Hospital5: MLK Way & 54th Street DC_2035 AM Plus Phase 1
Fehr & Peers Synchro 8 Report
Movement SBRLane ConfigurationsVolume (veh/h) 10Sign ControlGradePeak Hour Factor 1.00Hourly flow rate (vph) 10PedestriansLane Width (ft)Walking Speed (ft/s)Percent BlockageRight turn flare (veh)Median typeMedian storage veh)Upstream signal (ft)pX, platoon unblockedvC, conflicting volumevC1, stage 1 conf volvC2, stage 2 conf volvCu, unblocked voltC, single (s)tC, 2 stage (s)tF (s)p0 queue free %cM capacity (veh/h)
Direction, Lane #
HCM Unsignalized Intersection Capacity Analysis Children's Hospital6: Dover Street & 54th Street DC_2035 AM Plus Phase 1
Fehr & Peers Synchro 8 Report
Movement EBL EBT EBR WBL WBT WBR NBL NBT NBR SBL SBT SBRLane ConfigurationsVolume (veh/h) 10 16 10 10 10 10 10 20 20 10 40 10Sign Control Stop Stop Free FreeGrade 0% 0% 0% 0%Peak Hour Factor 1.00 1.00 1.00 1.00 1.00 1.00 1.00 1.00 1.00 1.00 1.00 1.00Hourly flow rate (vph) 10 16 10 10 10 10 10 20 20 10 40 10Pedestrians 15 21 3 9Lane Width (ft) 12.0 12.0 12.0 12.0Walking Speed (ft/s) 4.0 4.0 4.0 4.0Percent Blockage 1 2 0 1Right turn flare (veh)Median type None NoneMedian storage veh)Upstream signal (ft)pX, platoon unblockedvC, conflicting volume 154 161 63 157 156 60 65 61vC1, stage 1 conf volvC2, stage 2 conf volvCu, unblocked vol 154 161 63 157 156 60 65 61tC, single (s) 7.1 6.5 6.2 7.1 6.5 6.2 4.1 4.1tC, 2 stage (s)tF (s) 3.5 4.0 3.3 3.5 4.0 3.3 2.2 2.2p0 queue free % 99 98 99 99 99 99 99 99cM capacity (veh/h) 759 704 992 751 708 986 1531 1528
Direction, Lane # EB 1 WB 1 NB 1 SB 1Volume Total 36 30 50 60Volume Left 10 10 10 10Volume Right 10 10 20 10cSH 783 798 1531 1528Volume to Capacity 0.05 0.04 0.01 0.01Queue Length 95th (ft) 4 3 0 0Control Delay (s) 9.8 9.7 1.5 1.3Lane LOS A A A AApproach Delay (s) 9.8 9.7 1.5 1.3Approach LOS A A
Intersection SummaryAverage Delay 4.5Intersection Capacity Utilization 21.7% ICU Level of Service AAnalysis Period (min) 15

HCM Unsignalized Intersection Capacity Analysis Children's Hospital7: Shattuck Ave & 54th Street DC_2035 AM Plus Phase 1
Fehr & Peers Synchro 8 Report
Movement EBL EBR NBL NBT SBT SBRLane ConfigurationsVolume (veh/h) 10 26 20 590 710 10Sign Control Stop Free FreeGrade 0% 0% 0%Peak Hour Factor 1.00 1.00 1.00 1.00 1.00 1.00Hourly flow rate (vph) 10 26 20 590 710 10Pedestrians 14 3 2Lane Width (ft) 12.0 12.0 12.0Walking Speed (ft/s) 4.0 4.0 4.0Percent Blockage 1 0 0Right turn flare (veh)Median type None NoneMedian storage veh)Upstream signal (ft) 550 282pX, platoon unblocked 0.76 0.75 0.75vC, conflicting volume 1361 732 734vC1, stage 1 conf volvC2, stage 2 conf volvCu, unblocked vol 1276 478 480tC, single (s) 6.4 6.2 4.1tC, 2 stage (s)tF (s) 3.5 3.3 2.2p0 queue free % 93 94 98cM capacity (veh/h) 135 438 803
Direction, Lane # EB 1 NB 1 SB 1Volume Total 36 610 720Volume Left 10 20 0Volume Right 26 0 10cSH 270 803 1700Volume to Capacity 0.13 0.02 0.42Queue Length 95th (ft) 11 2 0Control Delay (s) 20.3 0.7 0.0Lane LOS C AApproach Delay (s) 20.3 0.7 0.0Approach LOS C
Intersection SummaryAverage Delay 0.8Intersection Capacity Utilization 58.2% ICU Level of Service BAnalysis Period (min) 15
HCM Signalized Intersection Capacity Analysis Children's Hospital8: MLK Way & 53rd Street DC_2035 AM Plus Phase 1
Fehr & Peers Synchro 8 Report
Movement EBL EBT EBR WBL WBT WBR NBL NBT NBR SBL SBT SBRLane ConfigurationsVolume (vph) 10 1 59 60 10 18 30 1721 113 4 1875 10Ideal Flow (vphpl) 1900 1900 1900 1900 1900 1900 1900 1900 1900 1900 1900 1900Total Lost time (s) 5.0 5.0 4.0 3.5 4.0 3.5Lane Util. Factor 1.00 1.00 1.00 0.91 1.00 0.91Frpb, ped/bikes 0.98 1.00 1.00 1.00 1.00 1.00Flpb, ped/bikes 1.00 0.99 1.00 1.00 1.00 1.00Frt 0.89 0.97 1.00 0.99 1.00 1.00Flt Protected 0.99 0.97 0.95 1.00 0.95 1.00Satd. Flow (prot) 1603 1765 1770 5015 1787 5129Flt Permitted 0.96 0.80 0.95 1.00 0.95 1.00Satd. Flow (perm) 1548 1459 1770 5015 1787 5129Peak-hour factor, PHF 1.00 1.00 1.00 1.00 1.00 1.00 1.00 1.00 1.00 1.00 1.00 1.00Adj. Flow (vph) 10 1 59 60 10 18 30 1721 113 4 1875 10RTOR Reduction (vph) 0 48 0 0 13 0 0 4 0 0 0 0Lane Group Flow (vph) 0 22 0 0 75 0 30 1830 0 4 1885 0Confl. Peds. (#/hr) 11 20 20 11 20 30Confl. Bikes (#/hr) 8 20Heavy Vehicles (%) 2% 2% 2% 0% 0% 0% 2% 2% 2% 1% 1% 1%Turn Type Perm NA Perm NA Prot NA Prot NAProtected Phases 4 8 5 2 1 6Permitted Phases 4 8Actuated Green, G (s) 16.8 16.8 4.5 58.9 1.8 56.2Effective Green, g (s) 16.8 16.8 4.5 58.9 1.8 56.2Actuated g/C Ratio 0.19 0.19 0.05 0.65 0.02 0.62Clearance Time (s) 5.0 5.0 4.0 3.5 4.0 3.5Vehicle Extension (s) 3.0 3.0 3.0 3.0 3.0 3.0Lane Grp Cap (vph) 288 272 88 3282 35 3202v/s Ratio Prot 0.02 c0.36 0.00 c0.37v/s Ratio Perm 0.01 c0.05v/c Ratio 0.08 0.28 0.34 0.56 0.11 0.59Uniform Delay, d1 30.2 31.4 41.3 8.5 43.3 10.0Progression Factor 1.00 0.99 1.16 0.60 0.47 0.26Incremental Delay, d2 0.1 0.6 1.7 0.5 0.8 0.5Delay (s) 30.3 31.7 49.8 5.6 21.3 3.1Level of Service C C D A C AApproach Delay (s) 30.3 31.7 6.3 3.1Approach LOS C C A A
Intersection SummaryHCM 2000 Control Delay 5.8 HCM 2000 Level of Service AHCM 2000 Volume to Capacity ratio 0.53Actuated Cycle Length (s) 90.0 Sum of lost time (s) 12.5Intersection Capacity Utilization 63.2% ICU Level of Service BAnalysis Period (min) 15c Critical Lane Group

HCM Unsignalized Intersection Capacity Analysis Children's Hospital9: Dover Street & 53rd Street DC_2035 AM Plus Phase 1
Fehr & Peers Synchro 8 Report
Movement EBL EBT EBR WBL WBT WBR NBL NBT NBR SBL SBT SBRLane ConfigurationsVolume (veh/h) 50 30 0 0 20 10 0 0 0 10 0 50Sign Control Stop Stop Free FreeGrade 0% 0% 0% 0%Peak Hour Factor 1.00 1.00 1.00 1.00 1.00 1.00 1.00 1.00 1.00 1.00 1.00 1.00Hourly flow rate (vph) 50 30 0 0 20 10 0 0 0 10 0 50Pedestrians 33 32 3 3Lane Width (ft) 12.0 12.0 12.0 12.0Walking Speed (ft/s) 4.0 4.0 4.0 4.0Percent Blockage 3 3 0 0Right turn flare (veh)Median type None NoneMedian storage veh)Upstream signal (ft)pX, platoon unblockedvC, conflicting volume 101 110 61 95 135 35 83 32vC1, stage 1 conf volvC2, stage 2 conf volvCu, unblocked vol 101 110 61 95 135 35 83 32tC, single (s) 7.1 6.5 6.2 7.1 6.5 6.2 4.1 4.1tC, 2 stage (s)tF (s) 3.5 4.0 3.3 3.5 4.0 3.3 2.2 2.2p0 queue free % 94 96 100 100 97 99 100 99cM capacity (veh/h) 794 737 980 802 714 1013 1485 1551
Direction, Lane # EB 1 WB 1 NB 1 SB 1Volume Total 80 30 0 60Volume Left 50 0 0 10Volume Right 0 10 0 50cSH 772 792 1700 1551Volume to Capacity 0.10 0.04 0.00 0.01Queue Length 95th (ft) 9 3 0 0Control Delay (s) 10.2 9.7 0.0 1.3Lane LOS B A AApproach Delay (s) 10.2 9.7 0.0 1.3Approach LOS B A
Intersection SummaryAverage Delay 7.0Intersection Capacity Utilization 28.8% ICU Level of Service AAnalysis Period (min) 15
HCM Signalized Intersection Capacity Analysis Children's Hospital10: MLK Way & 52nd Street DC_2035 AM Plus Phase 1
Fehr & Peers Synchro 8 Report
Movement EBL EBT EBR WBL WBT WBR NBU NBL NBT NBR SBU SBLLane ConfigurationsVolume (vph) 68 82 120 84 103 332 60 110 1612 74 36 173Ideal Flow (vphpl) 1900 1900 1900 1900 1900 1900 1900 1900 1900 1900 1900 1900Total Lost time (s) 5.0 5.0 5.0 5.0 4.5 4.5 4.0Lane Util. Factor 1.00 1.00 1.00 1.00 1.00 0.91 1.00Frpb, ped/bikes 1.00 0.95 1.00 0.97 1.00 1.00 1.00Flpb, ped/bikes 0.99 1.00 0.98 1.00 1.00 1.00 1.00Frt 1.00 0.91 1.00 0.85 1.00 0.99 1.00Flt Protected 0.95 1.00 0.98 1.00 0.95 1.00 0.95Satd. Flow (prot) 1770 1630 1784 1533 1787 5096 1787Flt Permitted 0.56 1.00 0.68 1.00 0.95 1.00 0.95Satd. Flow (perm) 1050 1630 1248 1533 1787 5096 1787Peak-hour factor, PHF 1.00 1.00 1.00 1.00 1.00 1.00 1.00 1.00 1.00 1.00 1.00 1.00Adj. Flow (vph) 68 82 120 84 103 332 60 110 1612 74 36 173RTOR Reduction (vph) 0 61 0 0 0 174 0 0 5 0 0 0Lane Group Flow (vph) 68 141 0 0 187 158 0 170 1681 0 0 209Confl. Peds. (#/hr) 15 74 74 15 11Confl. Bikes (#/hr) 9 8 2Heavy Vehicles (%) 1% 1% 1% 2% 2% 2% 1% 1% 1% 1% 1% 1%Turn Type Perm NA Perm NA Perm Prot Prot NA Prot ProtProtected Phases 4 8 5 5 2 1 1Permitted Phases 4 8 8Actuated Green, G (s) 23.1 23.1 23.1 23.1 7.5 40.9 12.5Effective Green, g (s) 23.1 23.1 23.1 23.1 7.5 40.9 12.5Actuated g/C Ratio 0.26 0.26 0.26 0.26 0.08 0.45 0.14Clearance Time (s) 5.0 5.0 5.0 5.0 4.5 4.5 4.0Vehicle Extension (s) 2.0 2.0 2.0 2.0 2.0 2.0 2.0Lane Grp Cap (vph) 269 418 320 393 148 2315 248v/s Ratio Prot 0.09 c0.10 c0.33 c0.12v/s Ratio Perm 0.06 c0.15 0.10v/c Ratio 0.25 0.34 0.58 0.40 1.15 0.73 0.84Uniform Delay, d1 26.6 27.2 29.3 27.7 41.2 20.0 37.8Progression Factor 1.00 1.00 1.00 1.00 1.00 1.09 0.85Incremental Delay, d2 0.2 0.2 1.8 0.2 93.1 0.8 18.8Delay (s) 26.8 27.4 31.0 28.0 134.4 22.5 50.7Level of Service C C C C F C DApproach Delay (s) 27.2 29.1 32.8Approach LOS C C C
Intersection SummaryHCM 2000 Control Delay 26.5 HCM 2000 Level of Service CHCM 2000 Volume to Capacity ratio 0.73Actuated Cycle Length (s) 90.0 Sum of lost time (s) 14.0Intersection Capacity Utilization 108.3% ICU Level of Service GAnalysis Period (min) 15c Critical Lane Group

HCM Signalized Intersection Capacity Analysis Children's Hospital10: MLK Way & 52nd Street DC_2035 AM Plus Phase 1
Fehr & Peers Synchro 8 Report
Movement SBT SBRLane ConfigurationsVolume (vph) 1768 7Ideal Flow (vphpl) 1900 1900Total Lost time (s) 4.5Lane Util. Factor 0.91Frpb, ped/bikes 1.00Flpb, ped/bikes 1.00Frt 1.00Flt Protected 1.00Satd. Flow (prot) 5131Flt Permitted 1.00Satd. Flow (perm) 5131Peak-hour factor, PHF 1.00 1.00Adj. Flow (vph) 1768 7RTOR Reduction (vph) 0 0Lane Group Flow (vph) 1775 0Confl. Peds. (#/hr) 15Confl. Bikes (#/hr) 15Heavy Vehicles (%) 1% 1%Turn Type NAProtected Phases 6Permitted PhasesActuated Green, G (s) 45.4Effective Green, g (s) 45.4Actuated g/C Ratio 0.50Clearance Time (s) 4.5Vehicle Extension (s) 2.0Lane Grp Cap (vph) 2588v/s Ratio Prot 0.35v/s Ratio Permv/c Ratio 0.69Uniform Delay, d1 16.9Progression Factor 0.89Incremental Delay, d2 1.3Delay (s) 16.3Level of Service BApproach Delay (s) 19.9Approach LOS B
Intersection Summary
HCM Signalized Intersection Capacity Analysis Children's Hospital11: 52nd Street & Garage DC_2035 AM Plus Phase 1
Fehr & Peers Synchro 8 Report
Movement EBL EBT EBR WBL WBT WBR NBL NBT NBR SBL SBT SBRLane ConfigurationsVolume (vph) 4 296 9 5 477 2 15 7 10 0 2 15Ideal Flow (vphpl) 1900 1900 1900 1900 1900 1900 1900 1900 1900 1900 1900 1900Total Lost time (s) 3.0 3.0 3.0 3.0Lane Util. Factor 0.95 0.95 1.00 1.00Frpb, ped/bikes 0.99 1.00 0.94 0.99Flpb, ped/bikes 1.00 1.00 1.00 1.00Frt 1.00 1.00 0.96 0.88Flt Protected 1.00 1.00 0.98 1.00Satd. Flow (prot) 3503 3601 1434 1655Flt Permitted 0.95 0.95 0.94 1.00Satd. Flow (perm) 3344 3430 1374 1655Peak-hour factor, PHF 1.00 1.00 1.00 1.00 1.00 1.00 1.00 1.00 1.00 1.00 1.00 1.00Adj. Flow (vph) 4 296 9 5 477 2 15 7 10 0 2 15RTOR Reduction (vph) 0 4 0 0 1 0 0 5 0 0 8 0Lane Group Flow (vph) 0 305 0 0 483 0 0 27 0 0 9 0Confl. Peds. (#/hr) 26 83 83 26 303 303Confl. Bikes (#/hr) 9 8 2Heavy Vehicles (%) 2% 2% 2% 0% 0% 0% 16% 16% 16% 0% 0% 0%Turn Type Prot NA Perm NA Perm NA NAProtected Phases 5 2 6 4 8Permitted Phases 6 4 8Actuated Green, G (s) 21.0 14.0 23.0 23.0Effective Green, g (s) 21.0 14.0 23.0 23.0Actuated g/C Ratio 0.42 0.28 0.46 0.46Clearance Time (s) 3.0 3.0 3.0 3.0Lane Grp Cap (vph) 1417 960 632 761v/s Ratio Prot c0.02 0.01v/s Ratio Perm 0.07 c0.14 c0.02v/c Ratio 0.22 0.50 0.04 0.01Uniform Delay, d1 9.2 15.1 7.4 7.3Progression Factor 1.00 1.00 1.00 1.00Incremental Delay, d2 0.3 1.9 0.1 0.0Delay (s) 9.6 17.0 7.6 7.4Level of Service A B A AApproach Delay (s) 9.6 17.0 7.6 7.4Approach LOS A B A A
Intersection SummaryHCM 2000 Control Delay 13.7 HCM 2000 Level of Service BHCM 2000 Volume to Capacity ratio 0.22Actuated Cycle Length (s) 50.0 Sum of lost time (s) 9.0Intersection Capacity Utilization 42.6% ICU Level of Service AAnalysis Period (min) 15c Critical Lane Group

HCM Unsignalized Intersection Capacity Analysis Children's Hospital12: 52nd Street & Dover Street DC_2035 AM Plus Phase 1
Fehr & Peers Synchro 8 Report
Movement EBL EBT EBR WBL WBT WBR NBL NBT NBR SBL SBT SBRLane ConfigurationsVolume (veh/h) 12 302 3 11 480 5 3 0 7 2 0 6Sign Control Free Free Stop StopGrade 0% 0% 0% 0%Peak Hour Factor 1.00 1.00 1.00 1.00 1.00 1.00 1.00 1.00 1.00 1.00 1.00 1.00Hourly flow rate (vph) 12 302 3 11 480 5 3 0 7 2 0 6Pedestrians 30 15 18 35Lane Width (ft) 12.0 12.0 12.0 12.0Walking Speed (ft/s) 4.0 4.0 4.0 4.0Percent Blockage 3 1 1 3Right turn flare (veh)Median type None NoneMedian storage veh)Upstream signal (ft) 312 647pX, platoon unblocked 0.82 0.91 0.87 0.87 0.91 0.87 0.87 0.82vC, conflicting volume 520 323 886 888 336 889 886 548vC1, stage 1 conf volvC2, stage 2 conf volvCu, unblocked vol 306 207 557 559 222 561 558 340tC, single (s) 4.1 4.1 7.2 6.6 6.3 7.1 6.5 6.2tC, 2 stage (s)tF (s) 2.2 2.2 3.6 4.1 3.4 3.5 4.0 3.3p0 queue free % 99 99 99 100 99 99 100 99cM capacity (veh/h) 995 1229 335 346 707 345 357 550
Direction, Lane # EB 1 WB 1 NB 1 SB 1Volume Total 317 496 10 8Volume Left 12 11 3 2Volume Right 3 5 7 6cSH 995 1229 531 479Volume to Capacity 0.01 0.01 0.02 0.02Queue Length 95th (ft) 1 1 1 1Control Delay (s) 0.5 0.3 11.9 12.6Lane LOS A A B BApproach Delay (s) 0.5 0.3 11.9 12.6Approach LOS B B
Intersection SummaryAverage Delay 0.6Intersection Capacity Utilization 46.1% ICU Level of Service AAnalysis Period (min) 15
HCM Unsignalized Intersection Capacity Analysis Children's Hospital13: SR-24 NB Off-Ramp & 52nd Street DC_2035 AM Plus Phase 1
Fehr & Peers Synchro 8 Report
Movement EBL EBT EBR WBL WBT WBR NBL NBR SEL SERLane ConfigurationsVolume (veh/h) 0 317 0 0 505 1271 0 1100 0 0Sign Control Free Free Stop StopGrade 0% 0% 0% 0%Peak Hour Factor 1.00 1.00 1.00 1.00 1.00 1.00 1.00 1.00 1.00 1.00Hourly flow rate (vph) 0 317 0 0 505 1271 0 1100 0 0Pedestrians 36Lane Width (ft) 12.0Walking Speed (ft/s) 4.0Percent Blockage 3Right turn flare (veh)Median type None NoneMedian storage veh)Upstream signal (ft) 767 192pX, platoon unblocked 0.78 0.78 0.78 0.78vC, conflicting volume 1776 353 2129 194 1764 858vC1, stage 1 conf volvC2, stage 2 conf volvCu, unblocked vol 1423 353 1877 194 1406 239tC, single (s) 4.1 4.1 6.5 7.0 7.5 6.5tC, 2 stage (s)tF (s) 2.2 2.2 4.0 3.3 3.5 4.0p0 queue free % 100 100 100 0 0 100cM capacity (veh/h) 368 1166 53 787 0 497
Direction, Lane # EB 1 EB 2 WB 1 WB 2 WB 3 NB 1 NB 2Volume Total 158 158 337 592 847 550 550Volume Left 0 0 0 0 0 0 0Volume Right 0 0 0 424 847 550 550cSH 1700 1700 1700 1700 1700 787 787Volume to Capacity 0.09 0.09 0.20 0.35 0.50 0.70 0.70Queue Length 95th (ft) 0 0 0 0 0 146 146Control Delay (s) 0.0 0.0 0.0 0.0 0.0 19.5 19.5Lane LOS C CApproach Delay (s) 0.0 0.0 19.5Approach LOS C
Intersection SummaryAverage Delay 6.7Intersection Capacity Utilization 57.1% ICU Level of Service BAnalysis Period (min) 15

HCM Signalized Intersection Capacity Analysis Children's Hospital14: 52nd Street & Shattuck Ave DC_2035 AM Plus Phase 1
Fehr & Peers Synchro 8 Report
Movement EBU EBL EBT EBR WBL WBT WBR NBL NBT NBR SBL SBTLane ConfigurationsVolume (vph) 50 300 907 160 50 1135 150 180 150 60 145 190Ideal Flow (vphpl) 1900 1900 1900 1900 1900 1900 1900 1900 1900 1900 1900 1900Total Lost time (s) 4.0 4.5 4.0 4.5 4.0 5.5 5.5Lane Util. Factor 1.00 0.91 1.00 0.91 1.00 1.00 1.00Frpb, ped/bikes 1.00 0.99 1.00 0.99 1.00 0.99 1.00Flpb, ped/bikes 1.00 1.00 1.00 1.00 1.00 1.00 1.00Frt 1.00 0.98 1.00 0.98 1.00 0.96 1.00Flt Protected 0.95 1.00 0.95 1.00 0.95 1.00 0.98Satd. Flow (prot) 1787 4958 1805 5070 1752 1748 1730Flt Permitted 0.95 1.00 0.95 1.00 0.31 1.00 0.76Satd. Flow (perm) 1787 4958 1805 5070 577 1748 1349Peak-hour factor, PHF 1.00 1.00 1.00 1.00 1.00 1.00 1.00 1.00 1.00 1.00 1.00 1.00Adj. Flow (vph) 50 300 907 160 50 1135 150 180 150 60 145 190RTOR Reduction (vph) 0 0 26 0 0 18 0 0 17 0 0 0Lane Group Flow (vph) 0 350 1041 0 50 1267 0 180 193 0 0 335Confl. Peds. (#/hr) 18 8 15 15Confl. Bikes (#/hr) 18 2 15Heavy Vehicles (%) 1% 1% 1% 1% 0% 0% 0% 3% 3% 3% 7% 7%Turn Type Prot Prot NA Prot NA pm+pt NA Perm NAProtected Phases 7 7 4 3 8 5 2 6Permitted Phases 2 6Actuated Green, G (s) 20.0 37.5 3.6 21.1 34.9 34.9 25.9Effective Green, g (s) 20.0 37.5 3.6 21.1 34.9 34.9 25.9Actuated g/C Ratio 0.22 0.42 0.04 0.23 0.39 0.39 0.29Clearance Time (s) 4.0 4.5 4.0 4.5 4.0 5.5 5.5Vehicle Extension (s) 3.0 3.0 3.0 3.0 3.0 3.0 3.0Lane Grp Cap (vph) 397 2065 72 1188 289 677 388v/s Ratio Prot c0.20 0.21 0.03 c0.25 c0.03 0.11v/s Ratio Perm 0.21 c0.25v/c Ratio 0.88 0.50 0.69 1.07 0.62 0.29 0.86Uniform Delay, d1 33.9 19.4 42.7 34.5 22.1 19.0 30.4Progression Factor 1.00 1.00 1.02 0.87 1.00 1.00 1.00Incremental Delay, d2 23.4 0.9 17.1 41.2 4.1 1.1 21.7Delay (s) 57.3 20.3 60.5 71.3 26.2 20.0 52.1Level of Service E C E E C C DApproach Delay (s) 29.4 70.9 22.9 39.1Approach LOS C E C D
Intersection SummaryHCM 2000 Control Delay 44.9 HCM 2000 Level of Service DHCM 2000 Volume to Capacity ratio 0.92Actuated Cycle Length (s) 90.0 Sum of lost time (s) 18.0Intersection Capacity Utilization 111.2% ICU Level of Service HAnalysis Period (min) 15c Critical Lane Group
HCM Signalized Intersection Capacity Analysis Children's Hospital14: 52nd Street & Shattuck Ave DC_2035 AM Plus Phase 1
Fehr & Peers Synchro 8 Report
Movement SBRLane ConfigurationsVolume (vph) 411Ideal Flow (vphpl) 1900Total Lost time (s) 5.5Lane Util. Factor 1.00Frpb, ped/bikes 0.92Flpb, ped/bikes 1.00Frt 0.85Flt Protected 1.00Satd. Flow (prot) 1386Flt Permitted 1.00Satd. Flow (perm) 1386Peak-hour factor, PHF 1.00Adj. Flow (vph) 411RTOR Reduction (vph) 256Lane Group Flow (vph) 155Confl. Peds. (#/hr) 24Confl. Bikes (#/hr) 62Heavy Vehicles (%) 7%Turn Type PermProtected PhasesPermitted Phases 6Actuated Green, G (s) 25.9Effective Green, g (s) 25.9Actuated g/C Ratio 0.29Clearance Time (s) 5.5Vehicle Extension (s) 3.0Lane Grp Cap (vph) 398v/s Ratio Protv/s Ratio Perm 0.11v/c Ratio 0.39Uniform Delay, d1 25.7Progression Factor 1.00Incremental Delay, d2 2.8Delay (s) 28.5Level of Service CApproach Delay (s)Approach LOS
Intersection Summary
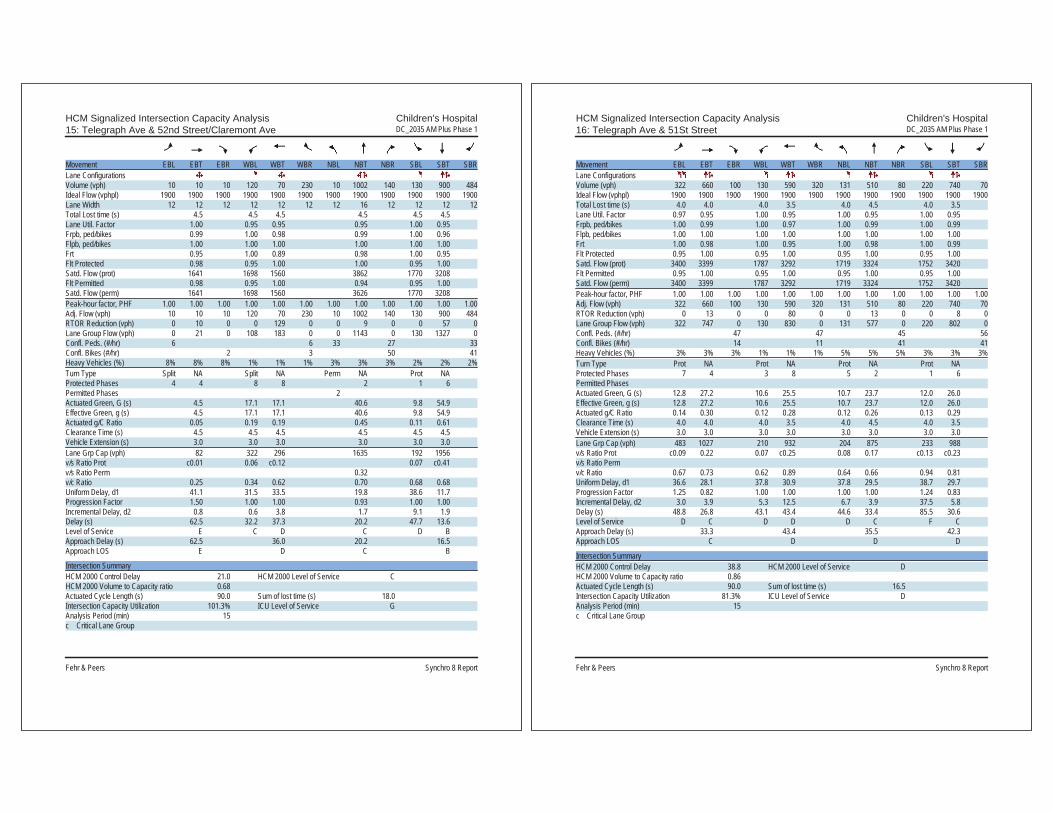
HCM Signalized Intersection Capacity Analysis Children's Hospital15: Telegraph Ave & 52nd Street/Claremont Ave DC_2035 AM Plus Phase 1
Fehr & Peers Synchro 8 Report
Movement EBL EBT EBR WBL WBT WBR NBL NBT NBR SBL SBT SBRLane ConfigurationsVolume (vph) 10 10 10 120 70 230 10 1002 140 130 900 484Ideal Flow (vphpl) 1900 1900 1900 1900 1900 1900 1900 1900 1900 1900 1900 1900Lane Width 12 12 12 12 12 12 12 16 12 12 12 12Total Lost time (s) 4.5 4.5 4.5 4.5 4.5 4.5Lane Util. Factor 1.00 0.95 0.95 0.95 1.00 0.95Frpb, ped/bikes 0.99 1.00 0.98 0.99 1.00 0.96Flpb, ped/bikes 1.00 1.00 1.00 1.00 1.00 1.00Frt 0.95 1.00 0.89 0.98 1.00 0.95Flt Protected 0.98 0.95 1.00 1.00 0.95 1.00Satd. Flow (prot) 1641 1698 1560 3862 1770 3208Flt Permitted 0.98 0.95 1.00 0.94 0.95 1.00Satd. Flow (perm) 1641 1698 1560 3626 1770 3208Peak-hour factor, PHF 1.00 1.00 1.00 1.00 1.00 1.00 1.00 1.00 1.00 1.00 1.00 1.00Adj. Flow (vph) 10 10 10 120 70 230 10 1002 140 130 900 484RTOR Reduction (vph) 0 10 0 0 129 0 0 9 0 0 57 0Lane Group Flow (vph) 0 21 0 108 183 0 0 1143 0 130 1327 0Confl. Peds. (#/hr) 6 6 33 27 33Confl. Bikes (#/hr) 2 3 50 41Heavy Vehicles (%) 8% 8% 8% 1% 1% 1% 3% 3% 3% 2% 2% 2%Turn Type Split NA Split NA Perm NA Prot NAProtected Phases 4 4 8 8 2 1 6Permitted Phases 2Actuated Green, G (s) 4.5 17.1 17.1 40.6 9.8 54.9Effective Green, g (s) 4.5 17.1 17.1 40.6 9.8 54.9Actuated g/C Ratio 0.05 0.19 0.19 0.45 0.11 0.61Clearance Time (s) 4.5 4.5 4.5 4.5 4.5 4.5Vehicle Extension (s) 3.0 3.0 3.0 3.0 3.0 3.0Lane Grp Cap (vph) 82 322 296 1635 192 1956v/s Ratio Prot c0.01 0.06 c0.12 0.07 c0.41v/s Ratio Perm 0.32v/c Ratio 0.25 0.34 0.62 0.70 0.68 0.68Uniform Delay, d1 41.1 31.5 33.5 19.8 38.6 11.7Progression Factor 1.50 1.00 1.00 0.93 1.00 1.00Incremental Delay, d2 0.8 0.6 3.8 1.7 9.1 1.9Delay (s) 62.5 32.2 37.3 20.2 47.7 13.6Level of Service E C D C D BApproach Delay (s) 62.5 36.0 20.2 16.5Approach LOS E D C B
Intersection SummaryHCM 2000 Control Delay 21.0 HCM 2000 Level of Service CHCM 2000 Volume to Capacity ratio 0.68Actuated Cycle Length (s) 90.0 Sum of lost time (s) 18.0Intersection Capacity Utilization 101.3% ICU Level of Service GAnalysis Period (min) 15c Critical Lane Group
HCM Signalized Intersection Capacity Analysis Children's Hospital16: Telegraph Ave & 51St Street DC_2035 AM Plus Phase 1
Fehr & Peers Synchro 8 Report
Movement EBL EBT EBR WBL WBT WBR NBL NBT NBR SBL SBT SBRLane ConfigurationsVolume (vph) 322 660 100 130 590 320 131 510 80 220 740 70Ideal Flow (vphpl) 1900 1900 1900 1900 1900 1900 1900 1900 1900 1900 1900 1900Total Lost time (s) 4.0 4.0 4.0 3.5 4.0 4.5 4.0 3.5Lane Util. Factor 0.97 0.95 1.00 0.95 1.00 0.95 1.00 0.95Frpb, ped/bikes 1.00 0.99 1.00 0.97 1.00 0.99 1.00 0.99Flpb, ped/bikes 1.00 1.00 1.00 1.00 1.00 1.00 1.00 1.00Frt 1.00 0.98 1.00 0.95 1.00 0.98 1.00 0.99Flt Protected 0.95 1.00 0.95 1.00 0.95 1.00 0.95 1.00Satd. Flow (prot) 3400 3399 1787 3292 1719 3324 1752 3420Flt Permitted 0.95 1.00 0.95 1.00 0.95 1.00 0.95 1.00Satd. Flow (perm) 3400 3399 1787 3292 1719 3324 1752 3420Peak-hour factor, PHF 1.00 1.00 1.00 1.00 1.00 1.00 1.00 1.00 1.00 1.00 1.00 1.00Adj. Flow (vph) 322 660 100 130 590 320 131 510 80 220 740 70RTOR Reduction (vph) 0 13 0 0 80 0 0 13 0 0 8 0Lane Group Flow (vph) 322 747 0 130 830 0 131 577 0 220 802 0Confl. Peds. (#/hr) 47 47 45 56Confl. Bikes (#/hr) 14 11 41 41Heavy Vehicles (%) 3% 3% 3% 1% 1% 1% 5% 5% 5% 3% 3% 3%Turn Type Prot NA Prot NA Prot NA Prot NAProtected Phases 7 4 3 8 5 2 1 6Permitted PhasesActuated Green, G (s) 12.8 27.2 10.6 25.5 10.7 23.7 12.0 26.0Effective Green, g (s) 12.8 27.2 10.6 25.5 10.7 23.7 12.0 26.0Actuated g/C Ratio 0.14 0.30 0.12 0.28 0.12 0.26 0.13 0.29Clearance Time (s) 4.0 4.0 4.0 3.5 4.0 4.5 4.0 3.5Vehicle Extension (s) 3.0 3.0 3.0 3.0 3.0 3.0 3.0 3.0Lane Grp Cap (vph) 483 1027 210 932 204 875 233 988v/s Ratio Prot c0.09 0.22 0.07 c0.25 0.08 0.17 c0.13 c0.23v/s Ratio Permv/c Ratio 0.67 0.73 0.62 0.89 0.64 0.66 0.94 0.81Uniform Delay, d1 36.6 28.1 37.8 30.9 37.8 29.5 38.7 29.7Progression Factor 1.25 0.82 1.00 1.00 1.00 1.00 1.24 0.83Incremental Delay, d2 3.0 3.9 5.3 12.5 6.7 3.9 37.5 5.8Delay (s) 48.8 26.8 43.1 43.4 44.6 33.4 85.5 30.6Level of Service D C D D D C F CApproach Delay (s) 33.3 43.4 35.5 42.3Approach LOS C D D D
Intersection SummaryHCM 2000 Control Delay 38.8 HCM 2000 Level of Service DHCM 2000 Volume to Capacity ratio 0.86Actuated Cycle Length (s) 90.0 Sum of lost time (s) 16.5Intersection Capacity Utilization 81.3% ICU Level of Service DAnalysis Period (min) 15c Critical Lane Group

HCM Signalized Intersection Capacity Analysis Children's Hospital17: SB SR-24 On-Ramp & MLK Way & NB SR-24 Off-Ramp DC_2035 AM Plus Phase 1
Fehr & Peers Synchro 8 Report
Movement EBL EBT EBR WBL WBT WBR NBL NBT NBR SBL SBT SBRLane ConfigurationsVolume (vph) 261 0 0 0 0 1615 0 0 0 0 1721 261Ideal Flow (vphpl) 1900 1900 1900 1900 1900 1900 1900 1900 1900 1900 1900 1900Total Lost time (s) 4.0 4.0 4.0 4.0Lane Util. Factor 0.97 1.00 0.95 0.88Frpb, ped/bikes 1.00 1.00 1.00 1.00Flpb, ped/bikes 1.00 1.00 1.00 1.00Frt 1.00 0.86 1.00 0.85Flt Protected 0.95 1.00 1.00 1.00Satd. Flow (prot) 3273 1627 3574 2814Flt Permitted 0.95 1.00 1.00 1.00Satd. Flow (perm) 3273 1627 3574 2814Peak-hour factor, PHF 1.00 1.00 1.00 1.00 1.00 1.00 1.00 1.00 1.00 1.00 1.00 1.00Adj. Flow (vph) 261 0 0 0 0 1615 0 0 0 0 1721 261RTOR Reduction (vph) 0 0 0 0 0 0 0 0 0 0 0 0Lane Group Flow (vph) 261 0 0 0 0 1615 0 0 0 0 1721 261Confl. Peds. (#/hr) 9Confl. Bikes (#/hr) 3Heavy Vehicles (%) 7% 7% 2% 2% 1% 1% 2% 2% 2% 2% 1% 1%Turn Type Prot Free NA customProtected Phases 2 6 FreePermitted Phases FreeActuated Green, G (s) 8.0 45.0 29.0 45.0Effective Green, g (s) 8.0 45.0 29.0 45.0Actuated g/C Ratio 0.18 1.00 0.64 1.00Clearance Time (s) 4.0 4.0Lane Grp Cap (vph) 581 1627 2303 2814v/s Ratio Prot 0.08 0.48 0.09v/s Ratio Perm c0.99v/c Ratio 0.45 0.99 0.75 0.09Uniform Delay, d1 16.5 0.0 5.5 0.0Progression Factor 1.00 1.00 2.07 1.00Incremental Delay, d2 2.5 20.6 1.7 0.0Delay (s) 19.0 20.6 13.1 0.0Level of Service B C B AApproach Delay (s) 19.0 20.6 0.0 11.3Approach LOS B C A B
Intersection SummaryHCM 2000 Control Delay 15.8 HCM 2000 Level of Service BHCM 2000 Volume to Capacity ratio 1.21Actuated Cycle Length (s) 45.0 Sum of lost time (s) 8.0Intersection Capacity Utilization 61.7% ICU Level of Service BAnalysis Period (min) 15c Critical Lane Group
HCM Unsignalized Intersection Capacity Analysis Children's Hospital18: West Street & 52nd Street DC_2035 AM Plus Phase 1
Fehr & Peers Synchro 8 Report
Movement EBL EBT EBR WBL WBT WBR NBL NBT NBR SBL SBT SBRLane ConfigurationsSign Control Stop Stop Stop StopVolume (vph) 0 190 20 80 130 0 40 0 80 10 60 10Peak Hour Factor 1.00 1.00 1.00 1.00 1.00 1.00 1.00 1.00 1.00 1.00 1.00 1.00Hourly flow rate (vph) 0 190 20 80 130 0 40 0 80 10 60 10
Direction, Lane # EB 1 WB 1 NB 1 NB 2 SB 1Volume Total (vph) 210 210 40 80 80Volume Left (vph) 0 80 40 0 10Volume Right (vph) 20 0 0 80 10Hadj (s) -0.04 0.11 0.50 -0.70 -0.02Departure Headway (s) 4.6 4.8 6.1 4.9 5.2Degree Utilization, x 0.27 0.28 0.07 0.11 0.12Capacity (veh/h) 730 712 545 669 628Control Delay (s) 9.4 9.6 8.4 7.3 8.9Approach Delay (s) 9.4 9.6 7.7 8.9Approach LOS A A A A
Intersection SummaryDelay 9.1Level of Service AIntersection Capacity Utilization 44.7% ICU Level of Service AAnalysis Period (min) 15

HCM Unsignalized Intersection Capacity Analysis Children's Hospital19: Genoa Street & 52nd Street DC_2035 AM Plus Phase 1
Fehr & Peers Synchro 8 Report
Movement EBL EBT EBR WBL WBT WBR NBL NBT NBR SBL SBT SBRLane ConfigurationsSign Control Stop Stop Stop StopVolume (vph) 20 170 10 10 140 30 10 10 10 30 10 10Peak Hour Factor 1.00 1.00 1.00 1.00 1.00 1.00 1.00 1.00 1.00 1.00 1.00 1.00Hourly flow rate (vph) 20 170 10 10 140 30 10 10 10 30 10 10
Direction, Lane # EB 1 WB 1 NB 1 SB 1Volume Total (vph) 200 180 30 50Volume Left (vph) 20 10 10 30Volume Right (vph) 10 30 10 10Hadj (s) 0.01 -0.09 -0.13 0.00Departure Headway (s) 4.3 4.2 4.7 4.8Degree Utilization, x 0.24 0.21 0.04 0.07Capacity (veh/h) 816 820 704 688Control Delay (s) 8.6 8.3 7.9 8.1Approach Delay (s) 8.6 8.3 7.9 8.1Approach LOS A A A A
Intersection SummaryDelay 8.4Level of Service AIntersection Capacity Utilization 28.6% ICU Level of Service AAnalysis Period (min) 15
HCM Unsignalized Intersection Capacity Analysis Children's Hospital20: Genoa Street & 55th Street DC_2035 AM Plus Phase 1
Fehr & Peers Synchro 8 Report
Movement EBL EBT EBR WBL WBT WBR NBL NBT NBR SBL SBT SBRLane ConfigurationsVolume (veh/h) 10 400 10 10 440 20 10 20 20 40 20 10Sign Control Free Free Stop StopGrade 0% 0% 0% 0%Peak Hour Factor 1.00 1.00 1.00 1.00 1.00 1.00 1.00 1.00 1.00 1.00 1.00 1.00Hourly flow rate (vph) 10 400 10 10 440 20 10 20 20 40 20 10Pedestrians 12 3 15 17Lane Width (ft) 12.0 12.0 12.0 12.0Walking Speed (ft/s) 4.0 4.0 4.0 4.0Percent Blockage 1 0 1 1Right turn flare (veh)Median type None NoneMedian storage veh)Upstream signal (ft) 721pX, platoon unblockedvC, conflicting volume 477 425 942 937 423 945 932 479vC1, stage 1 conf volvC2, stage 2 conf volvCu, unblocked vol 477 425 942 937 423 945 932 479tC, single (s) 4.1 4.1 7.1 6.5 6.2 7.1 6.5 6.2tC, 2 stage (s)tF (s) 2.2 2.2 3.5 4.0 3.3 3.5 4.0 3.3p0 queue free % 99 99 95 92 97 81 92 98cM capacity (veh/h) 1075 1131 214 255 626 209 255 573
Direction, Lane # EB 1 WB 1 NB 1 SB 1Volume Total 420 470 50 70Volume Left 10 10 10 40Volume Right 10 20 20 10cSH 1075 1131 318 244Volume to Capacity 0.01 0.01 0.16 0.29Queue Length 95th (ft) 1 1 14 29Control Delay (s) 0.3 0.3 18.4 25.6Lane LOS A A C DApproach Delay (s) 0.3 0.3 18.4 25.6Approach LOS C D
Intersection SummaryAverage Delay 2.9Intersection Capacity Utilization 46.5% ICU Level of Service AAnalysis Period (min) 15

HCM Unsignalized Intersection Capacity Analysis Children's Hospital21: MLK Way & RIRO Main Garage DC_2035 AM Plus Phase 1
Fehr & Peers Synchro 8 Report
Movement WBL WBR NBT NBR SBL SBTLane ConfigurationsVolume (veh/h) 0 34 1837 201 0 1994Sign Control Stop Free FreeGrade 0% 0% 0%Peak Hour Factor 1.00 1.00 1.00 1.00 1.00 1.00Hourly flow rate (vph) 0 34 1837 201 0 1994PedestriansLane Width (ft)Walking Speed (ft/s)Percent BlockageRight turn flare (veh)Median type None NoneMedian storage veh)Upstream signal (ft) 154 137pX, platoon unblocked 0.84 0.73 0.73vC, conflicting volume 2602 713 2038vC1, stage 1 conf volvC2, stage 2 conf volvCu, unblocked vol 478 0 1136tC, single (s) 6.8 6.9 4.1tC, 2 stage (s)tF (s) 3.5 3.3 2.2p0 queue free % 100 96 100cM capacity (veh/h) 435 794 447
Direction, Lane # WB 1 NB 1 NB 2 NB 3 SB 1 SB 2 SB 3Volume Total 34 735 735 568 665 665 665Volume Left 0 0 0 0 0 0 0Volume Right 34 0 0 201 0 0 0cSH 794 1700 1700 1700 1700 1700 1700Volume to Capacity 0.04 0.43 0.43 0.33 0.39 0.39 0.39Queue Length 95th (ft) 3 0 0 0 0 0 0Control Delay (s) 9.7 0.0 0.0 0.0 0.0 0.0 0.0Lane LOS AApproach Delay (s) 9.7 0.0 0.0Approach LOS A
Intersection SummaryAverage Delay 0.1Intersection Capacity Utilization 50.0% ICU Level of Service AAnalysis Period (min) 15
HCM Unsignalized Intersection Capacity Analysis Children's Hospital22: MLK Way & RIRO Main Plaza DC_2035 AM Plus Phase 1
Fehr & Peers Synchro 8 Report
Movement WBL WBR NBT NBR SBL SBTLane ConfigurationsVolume (veh/h) 0 1 1851 25 0 2032Sign Control Stop Free FreeGrade 0% 0% 0%Peak Hour Factor 1.00 1.00 1.00 1.00 1.00 1.00Hourly flow rate (vph) 0 1 1851 25 0 2032PedestriansLane Width (ft)Walking Speed (ft/s)Percent BlockageRight turn flare (veh)Median type None NoneMedian storage veh)Upstream signal (ft) 424 204pX, platoon unblocked 0.74vC, conflicting volume 2541 630 1876vC1, stage 1 conf volvC2, stage 2 conf volvCu, unblocked vol 1837 630 1876tC, single (s) 6.8 6.9 4.1tC, 2 stage (s)tF (s) 3.5 3.3 2.2p0 queue free % 100 100 100cM capacity (veh/h) 49 425 316
Direction, Lane # WB 1 NB 1 NB 2 NB 3 SB 1 SB 2 SB 3Volume Total 1 740 740 395 677 677 677Volume Left 0 0 0 0 0 0 0Volume Right 1 0 0 25 0 0 0cSH 425 1700 1700 1700 1700 1700 1700Volume to Capacity 0.00 0.44 0.44 0.23 0.40 0.40 0.40Queue Length 95th (ft) 0 0 0 0 0 0 0Control Delay (s) 13.5 0.0 0.0 0.0 0.0 0.0 0.0Lane LOS BApproach Delay (s) 13.5 0.0 0.0Approach LOS B
Intersection SummaryAverage Delay 0.0Intersection Capacity Utilization 46.3% ICU Level of Service AAnalysis Period (min) 15

HCM Unsignalized Intersection Capacity Analysis Children's Hospital24: 51St Street & 52nd Street DC_2035 AM Plus Phase 1
Fehr & Peers Synchro 8 Report
Intersection Sign configuration not allowed in HCM analysis.
HCM Signalized Intersection Capacity Analysis Children's Hospital 1: MLK Way & 55th Street DC_2035 PM Plus Phase 1
Fehr & Peers Synchro 8 Report
Movement EBL EBT EBR WBL WBT WBR NBU NBL NBT NBR SBL SBTLane ConfigurationsVolume (vph) 20 270 180 60 240 110 29 211 1772 166 200 1471Ideal Flow (vphpl) 1900 1900 1900 1900 1900 1900 1900 1900 1900 1900 1900 1900Total Lost time (s) 5.0 5.0 4.5 5.0 4.5 5.0Lane Util. Factor 1.00 1.00 1.00 0.91 1.00 0.91Frpb, ped/bikes 0.98 0.99 1.00 0.99 1.00 1.00Flpb, ped/bikes 1.00 1.00 1.00 1.00 1.00 1.00Frt 0.95 0.96 1.00 0.99 1.00 1.00Flt Protected 1.00 0.99 0.95 1.00 0.95 1.00Satd. Flow (prot) 1747 1728 1770 4975 1770 5054Flt Permitted 0.97 0.75 0.95 1.00 0.95 1.00Satd. Flow (perm) 1707 1310 1770 4975 1770 5054Peak-hour factor, PHF 1.00 1.00 1.00 1.00 1.00 1.00 1.00 1.00 1.00 1.00 1.00 1.00Adj. Flow (vph) 20 270 180 60 240 110 29 211 1772 166 200 1471RTOR Reduction (vph) 0 23 0 0 14 0 0 0 10 0 0 3Lane Group Flow (vph) 0 447 0 0 396 0 0 240 1928 0 200 1508Confl. Peds. (#/hr) 17 23 23 17 30Confl. Bikes (#/hr) 24 18 23Heavy Vehicles (%) 1% 1% 1% 4% 4% 4% 2% 2% 2% 2% 2% 2%Turn Type Perm NA Perm NA Prot Prot NA Prot NAProtected Phases 4 8 5 5 2 1 6Permitted Phases 4 8Actuated Green, G (s) 31.7 31.7 21.5 42.3 11.5 32.3Effective Green, g (s) 31.7 31.7 21.5 42.3 11.5 32.3Actuated g/C Ratio 0.32 0.32 0.22 0.42 0.12 0.32Clearance Time (s) 5.0 5.0 4.5 5.0 4.5 5.0Vehicle Extension (s) 3.0 3.0 3.0 3.0 3.0 3.0Lane Grp Cap (vph) 541 415 380 2104 203 1632v/s Ratio Prot 0.14 c0.39 0.11 c0.30v/s Ratio Perm 0.26 c0.30v/c Ratio 0.83 0.96 0.63 0.92 0.99 0.92Uniform Delay, d1 31.6 33.5 35.7 27.2 44.2 32.7Progression Factor 1.00 1.00 0.57 0.44 1.00 1.00Incremental Delay, d2 10.0 32.5 2.7 6.4 58.5 10.3Delay (s) 41.6 66.0 23.1 18.3 102.6 43.0Level of Service D E C B F DApproach Delay (s) 41.6 66.0 18.8 50.0Approach LOS D E B D
Intersection SummaryHCM 2000 Control Delay 36.3 HCM 2000 Level of Service DHCM 2000 Volume to Capacity ratio 0.95Actuated Cycle Length (s) 100.0 Sum of lost time (s) 14.5Intersection Capacity Utilization 106.2% ICU Level of Service GAnalysis Period (min) 15c Critical Lane Group

HCM Signalized Intersection Capacity Analysis Children's Hospital 1: MLK Way & 55th Street DC_2035 PM Plus Phase 1
Fehr & Peers Synchro 8 Report
Movement SBRLane ConfigurationsVolume (vph) 40Ideal Flow (vphpl) 1900Total Lost time (s)Lane Util. FactorFrpb, ped/bikesFlpb, ped/bikesFrtFlt ProtectedSatd. Flow (prot)Flt PermittedSatd. Flow (perm)Peak-hour factor, PHF 1.00Adj. Flow (vph) 40RTOR Reduction (vph) 0Lane Group Flow (vph) 0Confl. Peds. (#/hr) 18Confl. Bikes (#/hr) 23Heavy Vehicles (%) 2%Turn TypeProtected PhasesPermitted PhasesActuated Green, G (s)Effective Green, g (s)Actuated g/C RatioClearance Time (s)Vehicle Extension (s)Lane Grp Cap (vph)v/s Ratio Protv/s Ratio Permv/c RatioUniform Delay, d1Progression FactorIncremental Delay, d2Delay (s)Level of ServiceApproach Delay (s)Approach LOS
Intersection Summary
HCM Unsignalized Intersection Capacity Analysis Children's Hospital 2: Dover Street & 55th Street DC_2035 PM Plus Phase 1
Fehr & Peers Synchro 8 Report
Movement EBL EBT EBR WBL WBT WBR NBL NBT NBR SBL SBT SBRLane ConfigurationsVolume (veh/h) 30 586 20 10 330 20 20 20 30 20 20 40Sign Control Free Free Stop StopGrade 0% 0% 0% 0%Peak Hour Factor 1.00 1.00 1.00 1.00 1.00 1.00 1.00 1.00 1.00 1.00 1.00 1.00Hourly flow rate (vph) 30 586 20 10 330 20 20 20 30 20 20 40Pedestrians 6 20 11 26Lane Width (ft) 12.0 12.0 12.0 12.0Walking Speed (ft/s) 4.0 4.0 4.0 4.0Percent Blockage 1 2 1 2Right turn flare (veh)Median type None NoneMedian storage veh)Upstream signal (ft) 641 677pX, platoon unblocked 0.96 0.96 0.96 0.96 0.96 0.96vC, conflicting volume 376 617 1083 1063 627 1102 1063 372vC1, stage 1 conf volvC2, stage 2 conf volvCu, unblocked vol 328 617 1065 1044 627 1085 1044 324tC, single (s) 4.1 4.1 7.1 6.5 6.2 7.1 6.5 6.2tC, 2 stage (s)tF (s) 2.2 2.2 3.5 4.0 3.3 3.5 4.0 3.3p0 queue free % 97 99 87 90 94 86 90 94cM capacity (veh/h) 1140 945 158 207 475 147 204 667
Direction, Lane # EB 1 WB 1 NB 1 SB 1Volume Total 636 360 70 80Volume Left 30 10 20 20Volume Right 20 20 30 40cSH 1140 945 244 272Volume to Capacity 0.03 0.01 0.29 0.29Queue Length 95th (ft) 2 1 29 30Control Delay (s) 0.7 0.4 25.6 23.6Lane LOS A A D CApproach Delay (s) 0.7 0.4 25.6 23.6Approach LOS D C
Intersection SummaryAverage Delay 3.7Intersection Capacity Utilization 62.2% ICU Level of Service BAnalysis Period (min) 15

HCM Signalized Intersection Capacity Analysis Children's Hospital 3: 55th Street & Shattuck Ave DC_2035 PM Plus Phase 1
Fehr & Peers Synchro 8 Report
Movement EBL EBT EBR WBL WBT WBR NBL NBT NBR SBL SBT SBRLane ConfigurationsVolume (vph) 110 446 70 30 210 50 80 630 50 30 580 60Ideal Flow (vphpl) 1900 1900 1900 1900 1900 1900 1900 1900 1900 1900 1900 1900Total Lost time (s) 3.0 3.0 5.0 5.0Lane Util. Factor 1.00 1.00 1.00 1.00Frpb, ped/bikes 0.99 0.99 1.00 0.99Flpb, ped/bikes 1.00 1.00 1.00 1.00Frt 0.98 0.98 0.99 0.99Flt Protected 0.99 0.99 0.99 1.00Satd. Flow (prot) 1750 1773 1827 1843Flt Permitted 0.86 0.91 0.88 0.95Satd. Flow (perm) 1519 1618 1613 1757Peak-hour factor, PHF 1.00 1.00 1.00 1.00 1.00 1.00 1.00 1.00 1.00 1.00 1.00 1.00Adj. Flow (vph) 110 446 70 30 210 50 80 630 50 30 580 60RTOR Reduction (vph) 0 6 0 0 10 0 0 3 0 0 5 0Lane Group Flow (vph) 0 620 0 0 280 0 0 757 0 0 665 0Confl. Peds. (#/hr) 17 17 17 17 29 11 11 29Confl. Bikes (#/hr) 23 15 47 33Heavy Vehicles (%) 5% 5% 5% 3% 3% 3% 2% 2% 2% 1% 1% 1%Turn Type Perm NA Perm NA Perm NA Perm NAProtected Phases 2 6 4 8Permitted Phases 2 6 4 4 8Actuated Green, G (s) 29.0 29.0 43.0 43.0Effective Green, g (s) 29.0 29.0 43.0 43.0Actuated g/C Ratio 0.36 0.36 0.54 0.54Clearance Time (s) 3.0 3.0 5.0 5.0Lane Grp Cap (vph) 550 586 866 944v/s Ratio Protv/s Ratio Perm c0.41 0.17 c0.47 0.38v/c Ratio 1.13 0.48 0.87 0.70Uniform Delay, d1 25.5 19.7 16.1 13.8Progression Factor 1.00 1.00 1.00 1.00Incremental Delay, d2 78.6 2.8 11.9 4.4Delay (s) 104.1 22.5 28.0 18.2Level of Service F C C BApproach Delay (s) 104.1 22.5 28.0 18.2Approach LOS F C C B
Intersection SummaryHCM 2000 Control Delay 44.8 HCM 2000 Level of Service DHCM 2000 Volume to Capacity ratio 0.98Actuated Cycle Length (s) 80.0 Sum of lost time (s) 8.0Intersection Capacity Utilization 128.7% ICU Level of Service HAnalysis Period (min) 15c Critical Lane Group
HCM Signalized Intersection Capacity Analysis Children's Hospital 4: 55th Street & Telegraph Ave DC_2035 PM Plus Phase 1
Fehr & Peers Synchro 8 Report
Movement EBL EBT EBR WBL WBT WBR NBL NBT NBR SBL SBT SBRLane ConfigurationsVolume (vph) 315 30 171 50 20 20 130 1197 70 20 1131 120Ideal Flow (vphpl) 1900 1900 1900 1900 1900 1900 1900 1900 1900 1900 1900 1900Total Lost time (s) 4.5 4.5 4.5 4.5 4.5 4.5Lane Util. Factor 1.00 1.00 1.00 0.95 1.00 0.95Frpb, ped/bikes 0.98 0.99 1.00 0.99 1.00 0.98Flpb, ped/bikes 0.99 0.99 1.00 1.00 1.00 1.00Frt 0.96 0.97 1.00 0.99 1.00 0.99Flt Protected 0.97 0.97 0.95 1.00 0.95 1.00Satd. Flow (prot) 1625 1695 1770 3488 1787 3469Flt Permitted 0.78 0.72 0.12 1.00 0.12 1.00Satd. Flow (perm) 1301 1247 224 3488 218 3469Peak-hour factor, PHF 1.00 1.00 1.00 1.00 1.00 1.00 1.00 1.00 1.00 1.00 1.00 1.00Adj. Flow (vph) 315 30 171 50 20 20 130 1197 70 20 1131 120RTOR Reduction (vph) 0 20 0 0 12 0 0 4 0 0 9 0Lane Group Flow (vph) 0 496 0 0 78 0 130 1263 0 20 1242 0Confl. Peds. (#/hr) 17 39 39 17 38 26 26 38Confl. Bikes (#/hr) 12 14 44 68Heavy Vehicles (%) 5% 5% 5% 4% 4% 4% 2% 2% 2% 1% 1% 1%Turn Type Perm NA Perm NA Perm NA Perm NAProtected Phases 4 8 2 6Permitted Phases 4 8 2 6Actuated Green, G (s) 35.3 35.3 45.7 45.7 45.7 45.7Effective Green, g (s) 35.3 35.3 45.7 45.7 45.7 45.7Actuated g/C Ratio 0.39 0.39 0.51 0.51 0.51 0.51Clearance Time (s) 4.5 4.5 4.5 4.5 4.5 4.5Vehicle Extension (s) 3.0 3.0 3.0 3.0 3.0 3.0Lane Grp Cap (vph) 510 489 113 1771 110 1761v/s Ratio Prot 0.36 0.36v/s Ratio Perm c0.38 0.06 c0.58 0.09v/c Ratio 0.97 0.16 1.15 0.71 0.18 0.71Uniform Delay, d1 26.9 17.7 22.1 17.1 12.0 17.0Progression Factor 1.00 1.00 1.00 1.00 1.00 1.00Incremental Delay, d2 32.6 0.2 130.8 2.5 3.6 2.4Delay (s) 59.5 17.9 152.9 19.6 15.6 19.4Level of Service E B F B B BApproach Delay (s) 59.5 17.9 32.0 19.3Approach LOS E B C B
Intersection SummaryHCM 2000 Control Delay 31.0 HCM 2000 Level of Service CHCM 2000 Volume to Capacity ratio 1.07Actuated Cycle Length (s) 90.0 Sum of lost time (s) 9.0Intersection Capacity Utilization 91.1% ICU Level of Service FAnalysis Period (min) 15c Critical Lane Group

HCM Unsignalized Intersection Capacity Analysis Children's Hospital 5: MLK Way & 54th Street DC_2035 PM Plus Phase 1
Fehr & Peers Synchro 8 Report
Movement EBL EBT EBR WBL WBT WBR NBU NBL NBT NBR SBU SBLLane ConfigurationsVolume (veh/h) 10 10 50 20 10 10 13 40 2120 48 10 20Sign Control Stop Stop FreeGrade 0% 0% 0%Peak Hour Factor 1.00 1.00 1.00 1.00 1.00 1.00 1.00 1.00 1.00 1.00 1.00 1.00Hourly flow rate (vph) 10 10 50 20 10 10 0 40 2120 48 0 20Pedestrians 8 29 17Lane Width (ft) 12.0 12.0 12.0Walking Speed (ft/s) 4.0 4.0 4.0Percent Blockage 1 2 1Right turn flare (veh)Median type NoneMedian storage veh)Upstream signal (ft) 299pX, platoon unblocked 0.85 0.85 0.71 0.85 0.85 0.72 0.00 0.71 0.00 0.72vC, conflicting volume 2530 4005 592 2922 3991 760 0 1698 0 2197vC1, stage 1 conf volvC2, stage 2 conf volvCu, unblocked vol 2 1731 0 462 1715 0 0 581 0 1316tC, single (s) 7.5 6.5 6.9 7.5 6.5 6.9 0.0 4.1 0.0 4.1tC, 2 stage (s)tF (s) *7.0 *7.0 *7.0 *7.0 *7.0 *7.0 0.0 2.2 0.0 2.2p0 queue free % 97 83 86 88 83 97 0 94 0 95cM capacity (veh/h) 331 58 360 164 59 363 0 703 0 372
Direction, Lane # EB 1 WB 1 NB 1 NB 2 NB 3 SB 1 SB 2 SB 3Volume Total 70 40 570 1060 578 438 835 438Volume Left 10 20 40 0 0 20 0 0Volume Right 50 10 0 0 48 0 0 20cSH 205 126 703 1700 1700 372 1700 1700Volume to Capacity 0.34 0.32 0.06 0.62 0.34 0.05 0.49 0.26Queue Length 95th (ft) 36 31 5 0 0 4 0 0Control Delay (s) 31.4 46.4 1.5 0.0 0.0 1.7 0.0 0.0Lane LOS D E A AApproach Delay (s) 31.4 46.4 0.4 0.4Approach LOS D E
Intersection SummaryAverage Delay 1.4Intersection Capacity Utilization 95.3% ICU Level of Service FAnalysis Period (min) 15
* User Entered Value
HCM Unsignalized Intersection Capacity Analysis Children's Hospital 5: MLK Way & 54th Street DC_2035 PM Plus Phase 1
Fehr & Peers Synchro 8 Report
Movement SBT SBRLane ConfigurationsVolume (veh/h) 1670 20Sign Control FreeGrade 0%Peak Hour Factor 1.00 1.00Hourly flow rate (vph) 1670 20PedestriansLane Width (ft)Walking Speed (ft/s)Percent BlockageRight turn flare (veh)Median type NoneMedian storage veh)Upstream signal (ft) 294pX, platoon unblockedvC, conflicting volumevC1, stage 1 conf volvC2, stage 2 conf volvCu, unblocked voltC, single (s)tC, 2 stage (s)tF (s)p0 queue free %cM capacity (veh/h)
Direction, Lane #

HCM Unsignalized Intersection Capacity Analysis Children's Hospital 6: Dover Street & 54th Street DC_2035 PM Plus Phase 1
Fehr & Peers Synchro 8 Report
Movement EBL EBT EBR WBL WBT WBR NBL NBT NBR SBL SBT SBRLane ConfigurationsVolume (veh/h) 10 48 10 10 10 20 10 50 10 10 30 10Sign Control Stop Stop Free FreeGrade 0% 0% 0% 0%Peak Hour Factor 1.00 1.00 1.00 1.00 1.00 1.00 1.00 1.00 1.00 1.00 1.00 1.00Hourly flow rate (vph) 10 48 10 10 10 20 10 50 10 10 30 10Pedestrians 18 12 9 5Lane Width (ft) 12.0 12.0 12.0 12.0Walking Speed (ft/s) 4.0 4.0 4.0 4.0Percent Blockage 1 1 1 0Right turn flare (veh)Median type None NoneMedian storage veh)Upstream signal (ft)pX, platoon unblockedvC, conflicting volume 178 165 62 185 165 72 58 72vC1, stage 1 conf volvC2, stage 2 conf volvCu, unblocked vol 178 165 62 185 165 72 58 72tC, single (s) 7.1 6.5 6.2 7.1 6.5 6.2 4.1 4.1tC, 2 stage (s)tF (s) 3.5 4.0 3.3 3.5 4.0 3.3 2.2 2.2p0 queue free % 99 93 99 99 99 98 99 99cM capacity (veh/h) 728 704 986 699 704 982 1536 1526
Direction, Lane # EB 1 WB 1 NB 1 SB 1Volume Total 68 40 70 50Volume Left 10 10 10 10Volume Right 10 20 10 10cSH 738 818 1536 1526Volume to Capacity 0.09 0.05 0.01 0.01Queue Length 95th (ft) 8 4 0 0Control Delay (s) 10.4 9.6 1.1 1.5Lane LOS B A A AApproach Delay (s) 10.4 9.6 1.1 1.5Approach LOS B A
Intersection SummaryAverage Delay 5.4Intersection Capacity Utilization 21.9% ICU Level of Service AAnalysis Period (min) 15
HCM Unsignalized Intersection Capacity Analysis Children's Hospital 7: Shattuck Ave & 54th Street DC_2035 PM Plus Phase 1
Fehr & Peers Synchro 8 Report
Movement EBL EBR NBL NBT SBT SBRLane ConfigurationsVolume (veh/h) 10 48 20 770 700 10Sign Control Stop Free FreeGrade 0% 0% 0%Peak Hour Factor 1.00 1.00 1.00 1.00 1.00 1.00Hourly flow rate (vph) 10 48 20 770 700 10Pedestrians 38 2Lane Width (ft) 12.0 12.0Walking Speed (ft/s) 4.0 4.0Percent Blockage 3 0Right turn flare (veh)Median type None NoneMedian storage veh)Upstream signal (ft) 550 282pX, platoon unblocked 0.80 0.74 0.74vC, conflicting volume 1555 743 748vC1, stage 1 conf volvC2, stage 2 conf volvCu, unblocked vol 1242 476 482tC, single (s) 6.4 6.2 4.1tC, 2 stage (s)tF (s) 3.5 3.3 2.2p0 queue free % 93 89 97cM capacity (veh/h) 146 425 773
Direction, Lane # EB 1 NB 1 SB 1Volume Total 58 790 710Volume Left 10 20 0Volume Right 48 0 10cSH 320 773 1700Volume to Capacity 0.18 0.03 0.42Queue Length 95th (ft) 16 2 0Control Delay (s) 18.7 0.7 0.0Lane LOS C AApproach Delay (s) 18.7 0.7 0.0Approach LOS C
Intersection SummaryAverage Delay 1.1Intersection Capacity Utilization 66.8% ICU Level of Service CAnalysis Period (min) 15

HCM Signalized Intersection Capacity Analysis Children's Hospital 8: MLK Way & 53rd Street DC_2035 PM Plus Phase 1
Fehr & Peers Synchro 8 Report
Movement EBL EBT EBR WBL WBT WBR NBU NBL NBT NBR SBL SBTLane ConfigurationsVolume (vph) 10 6 67 80 10 8 10 10 2203 105 7 1756Ideal Flow (vphpl) 1900 1900 1900 1900 1900 1900 1900 1900 1900 1900 1900 1900Total Lost time (s) 5.0 5.0 4.0 3.5 4.0 3.5Lane Util. Factor 1.00 1.00 1.00 0.91 1.00 0.91Frpb, ped/bikes 0.98 1.00 1.00 0.99 1.00 1.00Flpb, ped/bikes 1.00 1.00 1.00 1.00 1.00 1.00Frt 0.89 0.99 1.00 0.99 1.00 1.00Flt Protected 0.99 0.96 0.95 1.00 0.95 1.00Satd. Flow (prot) 1616 1796 1770 5012 1787 5129Flt Permitted 0.96 0.72 0.95 1.00 0.95 1.00Satd. Flow (perm) 1568 1355 1770 5012 1787 5129Peak-hour factor, PHF 1.00 1.00 1.00 1.00 1.00 1.00 1.00 1.00 1.00 1.00 1.00 1.00Adj. Flow (vph) 10 6 67 80 10 8 10 10 2203 105 7 1756RTOR Reduction (vph) 0 55 0 0 4 0 0 0 3 0 0 0Lane Group Flow (vph) 0 28 0 0 94 0 0 20 2305 0 7 1766Confl. Peds. (#/hr) 12 6 6 12 48Confl. Bikes (#/hr) 6 3 20Heavy Vehicles (%) 2% 2% 2% 0% 0% 0% 2% 2% 2% 2% 1% 1%Turn Type Perm NA Perm NA Prot Prot NA Prot NAProtected Phases 4 8 5 5 2 1 6Permitted Phases 4 8Actuated Green, G (s) 17.6 17.6 3.1 68.1 1.8 66.8Effective Green, g (s) 17.6 17.6 3.1 68.1 1.8 66.8Actuated g/C Ratio 0.18 0.18 0.03 0.68 0.02 0.67Clearance Time (s) 5.0 5.0 4.0 3.5 4.0 3.5Vehicle Extension (s) 3.0 3.0 3.0 3.0 3.0 3.0Lane Grp Cap (vph) 275 238 54 3413 32 3426v/s Ratio Prot 0.01 c0.46 0.00 c0.34v/s Ratio Perm 0.02 c0.07v/c Ratio 0.10 0.39 0.37 0.68 0.22 0.52Uniform Delay, d1 34.6 36.5 47.5 9.4 48.4 8.4Progression Factor 1.00 1.01 1.42 0.26 0.75 0.49Incremental Delay, d2 0.2 1.1 2.7 0.7 1.7 0.3Delay (s) 34.7 38.0 70.3 3.2 38.1 4.4Level of Service C D E A D AApproach Delay (s) 34.7 38.0 3.8 4.6Approach LOS C D A A
Intersection SummaryHCM 2000 Control Delay 5.5 HCM 2000 Level of Service AHCM 2000 Volume to Capacity ratio 0.63Actuated Cycle Length (s) 100.0 Sum of lost time (s) 12.5Intersection Capacity Utilization 71.8% ICU Level of Service CAnalysis Period (min) 15c Critical Lane Group
HCM Signalized Intersection Capacity Analysis Children's Hospital 8: MLK Way & 53rd Street DC_2035 PM Plus Phase 1
Fehr & Peers Synchro 8 Report
Movement SBRLane ConfigurationsVolume (vph) 10Ideal Flow (vphpl) 1900Total Lost time (s)Lane Util. FactorFrpb, ped/bikesFlpb, ped/bikesFrtFlt ProtectedSatd. Flow (prot)Flt PermittedSatd. Flow (perm)Peak-hour factor, PHF 1.00Adj. Flow (vph) 10RTOR Reduction (vph) 0Lane Group Flow (vph) 0Confl. Peds. (#/hr) 21Confl. Bikes (#/hr) 24Heavy Vehicles (%) 1%Turn TypeProtected PhasesPermitted PhasesActuated Green, G (s)Effective Green, g (s)Actuated g/C RatioClearance Time (s)Vehicle Extension (s)Lane Grp Cap (vph)v/s Ratio Protv/s Ratio Permv/c RatioUniform Delay, d1Progression FactorIncremental Delay, d2Delay (s)Level of ServiceApproach Delay (s)Approach LOS
Intersection Summary

HCM Unsignalized Intersection Capacity Analysis Children's Hospital 9: Dover Street & 53rd Street DC_2035 PM Plus Phase 1
Fehr & Peers Synchro 8 Report
Movement EBL EBT EBR WBL WBT WBR NBL NBT NBR SBL SBT SBRLane ConfigurationsVolume (veh/h) 70 20 0 0 20 10 0 0 0 10 0 40Sign Control Stop Stop Free FreeGrade 0% 0% 0% 0%Peak Hour Factor 1.00 1.00 1.00 1.00 1.00 1.00 1.00 1.00 1.00 1.00 1.00 1.00Hourly flow rate (vph) 70 20 0 0 20 10 0 0 0 10 0 40Pedestrians 38 15 6 6Lane Width (ft) 12.0 12.0 12.0 12.0Walking Speed (ft/s) 4.0 4.0 4.0 4.0Percent Blockage 3 1 1 1Right turn flare (veh)Median type None NoneMedian storage veh)Upstream signal (ft)pX, platoon unblockedvC, conflicting volume 104 93 64 71 113 21 78 15vC1, stage 1 conf volvC2, stage 2 conf volvCu, unblocked vol 104 93 64 71 113 21 78 15tC, single (s) 7.1 6.5 6.2 7.1 6.5 6.2 4.1 4.1tC, 2 stage (s)tF (s) 3.5 4.0 3.3 3.5 4.0 3.3 2.2 2.2p0 queue free % 91 97 100 100 97 99 100 99cM capacity (veh/h) 792 761 969 857 742 1044 1485 1596
Direction, Lane # EB 1 WB 1 NB 1 SB 1Volume Total 90 30 0 50Volume Left 70 0 0 10Volume Right 0 10 0 40cSH 785 821 1700 1596Volume to Capacity 0.11 0.04 0.00 0.01Queue Length 95th (ft) 10 3 0 0Control Delay (s) 10.2 9.6 0.0 1.5Lane LOS B A AApproach Delay (s) 10.2 9.6 0.0 1.5Approach LOS B A
Intersection SummaryAverage Delay 7.5Intersection Capacity Utilization 29.8% ICU Level of Service AAnalysis Period (min) 15
HCM Signalized Intersection Capacity Analysis Children's Hospital 10: MLK Way & 52nd Street DC_2035 PM Plus Phase 1
Fehr & Peers Synchro 8 Report
Movement EBL EBT EBR WBL WBT WBR NBU NBL NBT NBR SBU SBLLane ConfigurationsVolume (vph) 98 122 110 122 95 271 60 120 1867 75 4 217Ideal Flow (vphpl) 1900 1900 1900 1900 1900 1900 1900 1900 1900 1900 1900 1900Total Lost time (s) 5.0 5.0 5.0 5.0 4.5 4.5 4.0Lane Util. Factor 1.00 1.00 1.00 1.00 1.00 0.91 1.00Frpb, ped/bikes 1.00 0.95 1.00 0.96 1.00 1.00 1.00Flpb, ped/bikes 0.98 1.00 0.97 1.00 1.00 1.00 1.00Frt 1.00 0.93 1.00 0.85 1.00 0.99 1.00Flt Protected 0.95 1.00 0.97 1.00 0.95 1.00 0.95Satd. Flow (prot) 1759 1657 1752 1520 1787 5097 1787Flt Permitted 0.50 1.00 0.54 1.00 0.95 1.00 0.95Satd. Flow (perm) 920 1657 970 1520 1787 5097 1787Peak-hour factor, PHF 1.00 1.00 1.00 1.00 1.00 1.00 1.00 1.00 1.00 1.00 1.00 1.00Adj. Flow (vph) 98 122 110 122 95 271 60 120 1867 75 4 217RTOR Reduction (vph) 0 35 0 0 0 201 0 0 4 0 0 0Lane Group Flow (vph) 98 197 0 0 217 70 0 180 1938 0 0 221Confl. Peds. (#/hr) 24 92 92 24 15Confl. Bikes (#/hr) 14 6 23Heavy Vehicles (%) 1% 1% 1% 2% 2% 2% 1% 1% 1% 1% 1% 1%Turn Type Perm NA Perm NA Perm Prot Prot NA Prot ProtProtected Phases 4 8 5 5 2 1 1Permitted Phases 4 8 8Actuated Green, G (s) 25.7 25.7 25.7 25.7 13.6 43.3 17.5Effective Green, g (s) 25.7 25.7 25.7 25.7 13.6 43.3 17.5Actuated g/C Ratio 0.26 0.26 0.26 0.26 0.14 0.43 0.18Clearance Time (s) 5.0 5.0 5.0 5.0 4.5 4.5 4.0Vehicle Extension (s) 2.0 2.0 2.0 2.0 2.0 2.0 2.0Lane Grp Cap (vph) 236 425 249 390 243 2207 312v/s Ratio Prot 0.12 0.10 c0.38 0.12v/s Ratio Perm 0.11 c0.22 0.05v/c Ratio 0.42 0.46 0.87 0.18 0.74 0.88 0.71Uniform Delay, d1 30.9 31.3 35.6 28.9 41.5 25.9 38.8Progression Factor 1.00 1.00 0.96 2.56 0.97 1.06 0.57Incremental Delay, d2 0.4 0.3 25.0 0.1 3.0 1.6 5.3Delay (s) 31.3 31.6 59.0 74.2 43.1 29.1 27.6Level of Service C C E E D C CApproach Delay (s) 31.5 67.5 30.3Approach LOS C E C
Intersection SummaryHCM 2000 Control Delay 26.2 HCM 2000 Level of Service CHCM 2000 Volume to Capacity ratio 0.86Actuated Cycle Length (s) 100.0 Sum of lost time (s) 14.0Intersection Capacity Utilization 113.6% ICU Level of Service HAnalysis Period (min) 15c Critical Lane Group

HCM Signalized Intersection Capacity Analysis Children's Hospital 10: MLK Way & 52nd Street DC_2035 PM Plus Phase 1
Fehr & Peers Synchro 8 Report
Movement SBT SBRLane ConfigurationsVolume (vph) 1678 4Ideal Flow (vphpl) 1900 1900Total Lost time (s) 4.5Lane Util. Factor 0.91Frpb, ped/bikes 1.00Flpb, ped/bikes 1.00Frt 1.00Flt Protected 1.00Satd. Flow (prot) 5133Flt Permitted 1.00Satd. Flow (perm) 5133Peak-hour factor, PHF 1.00 1.00Adj. Flow (vph) 1678 4RTOR Reduction (vph) 0 0Lane Group Flow (vph) 1682 0Confl. Peds. (#/hr) 20Confl. Bikes (#/hr) 26Heavy Vehicles (%) 1% 1%Turn Type NAProtected Phases 6Permitted PhasesActuated Green, G (s) 46.7Effective Green, g (s) 46.7Actuated g/C Ratio 0.47Clearance Time (s) 4.5Vehicle Extension (s) 2.0Lane Grp Cap (vph) 2397v/s Ratio Prot c0.33v/s Ratio Permv/c Ratio 0.70Uniform Delay, d1 21.1Progression Factor 0.30Incremental Delay, d2 1.6Delay (s) 7.9Level of Service AApproach Delay (s) 10.2Approach LOS B
Intersection Summary
HCM Signalized Intersection Capacity Analysis Children's Hospital 11: 52nd Street & Garage DC_2035 PM Plus Phase 1
Fehr & Peers Synchro 8 Report
Movement EBL EBT EBR WBL WBT WBR NBL NBT NBR SBL SBT SBRLane ConfigurationsVolume (vph) 3 395 8 8 392 2 25 3 13 0 4 59Ideal Flow (vphpl) 1900 1900 1900 1900 1900 1900 1900 1900 1900 1900 1900 1900Total Lost time (s) 3.0 3.0 3.0 3.0Lane Util. Factor 0.95 0.95 1.00 1.00Frpb, ped/bikes 1.00 1.00 0.93 0.99Flpb, ped/bikes 1.00 1.00 1.00 1.00Frt 1.00 1.00 0.96 0.87Flt Protected 1.00 1.00 0.97 1.00Satd. Flow (prot) 3514 3595 1419 1640Flt Permitted 0.95 0.95 0.89 1.00Satd. Flow (perm) 3356 3409 1304 1640Peak-hour factor, PHF 1.00 1.00 1.00 1.00 1.00 1.00 1.00 1.00 1.00 1.00 1.00 1.00Adj. Flow (vph) 3 395 8 8 392 2 25 3 13 0 4 59RTOR Reduction (vph) 0 3 0 0 1 0 0 7 0 0 32 0Lane Group Flow (vph) 0 403 0 0 401 0 0 34 0 0 31 0Confl. Peds. (#/hr) 89 89 38 312 312Confl. Bikes (#/hr) 15 9 2Heavy Vehicles (%) 2% 2% 2% 0% 0% 0% 16% 16% 16% 0% 0% 0%Turn Type Prot NA Perm NA Perm NA NAProtected Phases 5 2 6 4 8Permitted Phases 6 4 8Actuated Green, G (s) 21.0 14.0 23.0 23.0Effective Green, g (s) 21.0 14.0 23.0 23.0Actuated g/C Ratio 0.42 0.28 0.46 0.46Clearance Time (s) 3.0 3.0 3.0 3.0Lane Grp Cap (vph) 1422 954 599 754v/s Ratio Prot c0.02 0.02v/s Ratio Perm 0.10 c0.12 c0.03v/c Ratio 0.28 0.42 0.06 0.04Uniform Delay, d1 9.5 14.7 7.5 7.4Progression Factor 1.95 1.00 1.00 1.00Incremental Delay, d2 0.4 1.4 0.2 0.1Delay (s) 19.0 16.1 7.7 7.5Level of Service B B A AApproach Delay (s) 19.0 16.1 7.7 7.5Approach LOS B B A A
Intersection SummaryHCM 2000 Control Delay 16.4 HCM 2000 Level of Service BHCM 2000 Volume to Capacity ratio 0.21Actuated Cycle Length (s) 50.0 Sum of lost time (s) 9.0Intersection Capacity Utilization 42.5% ICU Level of Service AAnalysis Period (min) 15c Critical Lane Group

HCM Unsignalized Intersection Capacity Analysis Children's Hospital 12: 52nd Street & Dover Street DC_2035 PM Plus Phase 1
Fehr & Peers Synchro 8 Report
Movement EBL EBT EBR WBL WBT WBR NBL NBT NBR SBL SBT SBRLane ConfigurationsVolume (veh/h) 8 401 8 5 398 4 7 0 8 10 0 14Sign Control Free Free Stop StopGrade 0% 0% 0% 0%Peak Hour Factor 1.00 1.00 1.00 1.00 1.00 1.00 1.00 1.00 1.00 1.00 1.00 1.00Hourly flow rate (vph) 8 401 8 5 398 4 7 0 8 10 0 14Pedestrians 56 11 53 23Lane Width (ft) 12.0 12.0 12.0 12.0Walking Speed (ft/s) 4.0 4.0 4.0 4.0Percent Blockage 5 1 4 2Right turn flare (veh)Median type None NoneMedian storage veh)Upstream signal (ft) 312 647pX, platoon unblocked 0.86 0.88 0.93 0.93 0.88 0.93 0.93 0.86vC, conflicting volume 425 462 954 909 469 873 911 479vC1, stage 1 conf volvC2, stage 2 conf volvCu, unblocked vol 257 314 608 560 322 521 562 319tC, single (s) 4.1 4.1 7.2 6.6 6.3 7.1 6.5 6.2tC, 2 stage (s)tF (s) 2.2 2.2 3.6 4.1 3.4 3.5 4.0 3.3p0 queue free % 99 100 98 100 99 97 100 98cM capacity (veh/h) 1104 1047 308 366 581 394 377 587
Direction, Lane # EB 1 WB 1 NB 1 SB 1Volume Total 417 407 15 24Volume Left 8 5 7 10Volume Right 8 4 8 14cSH 1104 1047 411 487Volume to Capacity 0.01 0.00 0.04 0.05Queue Length 95th (ft) 1 0 3 4Control Delay (s) 0.2 0.2 14.1 12.8Lane LOS A A B BApproach Delay (s) 0.2 0.2 14.1 12.8Approach LOS B B
Intersection SummaryAverage Delay 0.8Intersection Capacity Utilization 45.0% ICU Level of Service AAnalysis Period (min) 15
HCM Unsignalized Intersection Capacity Analysis Children's Hospital 13: SR-24 NB Off-Ramp & 52nd Street DC_2035 PM Plus Phase 1
Fehr & Peers Synchro 8 Report
Movement EBL EBT EBR WBL WBT WBR NBL NBR SEL SERLane ConfigurationsVolume (veh/h) 0 417 0 0 412 1157 0 1140 0 0Sign Control Free Free Stop StopGrade 0% 0% 0% 0%Peak Hour Factor 1.00 1.00 1.00 1.00 1.00 1.00 1.00 1.00 1.00 1.00Hourly flow rate (vph) 0 417 0 0 412 1157 0 1140 0 0Pedestrians 50Lane Width (ft) 12.0Walking Speed (ft/s) 4.0Percent Blockage 4Right turn flare (veh)Median type None NoneMedian storage veh)Upstream signal (ft) 767 192pX, platoon unblocked 0.80 0.80 0.80 0.80vC, conflicting volume 1569 467 2036 258 1760 879vC1, stage 1 conf volvC2, stage 2 conf volvCu, unblocked vol 1202 467 1789 258 1443 336tC, single (s) 4.1 4.1 6.5 7.0 7.5 6.5tC, 2 stage (s)tF (s) 2.2 2.2 4.0 3.3 3.5 4.0p0 queue free % 100 100 100 0 0 100cM capacity (veh/h) 459 1045 61 707 0 445
Direction, Lane # EB 1 EB 2 WB 1 WB 2 WB 3 NB 1 NB 2Volume Total 208 208 275 523 771 570 570Volume Left 0 0 0 0 0 0 0Volume Right 0 0 0 386 771 570 570cSH 1700 1700 1700 1700 1700 707 707Volume to Capacity 0.12 0.12 0.16 0.31 0.45 0.81 0.81Queue Length 95th (ft) 0 0 0 0 0 210 210Control Delay (s) 0.0 0.0 0.0 0.0 0.0 27.8 27.8Lane LOS D DApproach Delay (s) 0.0 0.0 27.8Approach LOS D
Intersection SummaryAverage Delay 10.1Intersection Capacity Utilization 59.5% ICU Level of Service BAnalysis Period (min) 15

HCM Signalized Intersection Capacity Analysis Children's Hospital 14: 52nd Street & Shattuck Ave DC_2035 PM Plus Phase 1
Fehr & Peers Synchro 8 Report
Movement EBU EBL EBT EBR WBL WBT WBR NBL NBT NBR SBL SBTLane ConfigurationsVolume (vph) 50 350 957 200 90 962 180 170 290 100 191 170Ideal Flow (vphpl) 1900 1900 1900 1900 1900 1900 1900 1900 1900 1900 1900 1900Total Lost time (s) 4.0 4.5 4.0 4.5 4.0 5.5 5.5Lane Util. Factor 1.00 0.91 1.00 0.91 1.00 1.00 1.00Frpb, ped/bikes 1.00 0.98 1.00 0.99 1.00 0.98 1.00Flpb, ped/bikes 1.00 1.00 1.00 1.00 1.00 1.00 0.99Frt 1.00 0.97 1.00 0.98 1.00 0.96 1.00Flt Protected 0.95 1.00 0.95 1.00 0.95 1.00 0.97Satd. Flow (prot) 1787 4911 1805 4990 1752 1740 1710Flt Permitted 0.95 1.00 0.95 1.00 0.33 1.00 0.59Satd. Flow (perm) 1787 4911 1805 4990 611 1740 1039Peak-hour factor, PHF 1.00 1.00 1.00 1.00 1.00 1.00 1.00 1.00 1.00 1.00 1.00 1.00Adj. Flow (vph) 50 350 957 200 90 962 180 170 290 100 191 170RTOR Reduction (vph) 0 0 28 0 0 24 0 0 11 0 0 0Lane Group Flow (vph) 0 400 1129 0 90 1118 0 170 379 0 0 361Confl. Peds. (#/hr) 21 21 17 33 33Confl. Bikes (#/hr) 20 12 45Heavy Vehicles (%) 1% 1% 1% 1% 0% 0% 0% 3% 3% 3% 7% 7%Turn Type Prot Prot NA Prot NA pm+pt NA Perm NAProtected Phases 7 7 4 3 8 5 2 6Permitted Phases 2 6Actuated Green, G (s) 25.0 40.5 8.4 23.9 47.1 47.1 38.1Effective Green, g (s) 25.0 40.5 8.4 23.9 47.1 47.1 38.1Actuated g/C Ratio 0.23 0.37 0.08 0.22 0.43 0.43 0.35Clearance Time (s) 4.0 4.5 4.0 4.5 4.0 5.5 5.5Vehicle Extension (s) 3.0 3.0 3.0 3.0 3.0 3.0 3.0Lane Grp Cap (vph) 406 1808 137 1084 313 745 359v/s Ratio Prot c0.22 0.23 0.05 c0.22 0.02 c0.22v/s Ratio Perm 0.21 c0.35v/c Ratio 0.99 0.62 0.66 1.03 0.54 0.51 1.01Uniform Delay, d1 42.3 28.5 49.4 43.0 24.5 23.0 36.0Progression Factor 1.00 1.00 1.00 1.00 1.00 1.00 1.00Incremental Delay, d2 41.1 1.6 10.8 35.6 1.9 2.5 48.9Delay (s) 83.5 30.2 60.2 78.7 26.4 25.5 84.9Level of Service F C E E C C FApproach Delay (s) 43.8 77.3 25.7 55.1Approach LOS D E C E
Intersection SummaryHCM 2000 Control Delay 53.5 HCM 2000 Level of Service DHCM 2000 Volume to Capacity ratio 0.99Actuated Cycle Length (s) 110.0 Sum of lost time (s) 18.0Intersection Capacity Utilization 110.2% ICU Level of Service HAnalysis Period (min) 15c Critical Lane Group
HCM Signalized Intersection Capacity Analysis Children's Hospital 14: 52nd Street & Shattuck Ave DC_2035 PM Plus Phase 1
Fehr & Peers Synchro 8 Report
Movement SBRLane ConfigurationsVolume (vph) 387Ideal Flow (vphpl) 1900Total Lost time (s) 5.5Lane Util. Factor 1.00Frpb, ped/bikes 0.93Flpb, ped/bikes 1.00Frt 0.85Flt Protected 1.00Satd. Flow (prot) 1405Flt Permitted 1.00Satd. Flow (perm) 1405Peak-hour factor, PHF 1.00Adj. Flow (vph) 387RTOR Reduction (vph) 253Lane Group Flow (vph) 134Confl. Peds. (#/hr) 27Confl. Bikes (#/hr) 41Heavy Vehicles (%) 7%Turn Type PermProtected PhasesPermitted Phases 6Actuated Green, G (s) 38.1Effective Green, g (s) 38.1Actuated g/C Ratio 0.35Clearance Time (s) 5.5Vehicle Extension (s) 3.0Lane Grp Cap (vph) 486v/s Ratio Protv/s Ratio Perm 0.10v/c Ratio 0.28Uniform Delay, d1 26.0Progression Factor 1.00Incremental Delay, d2 1.4Delay (s) 27.4Level of Service CApproach Delay (s)Approach LOS
Intersection Summary

HCM Signalized Intersection Capacity Analysis Children's Hospital 15: Telegraph Ave & 52nd Street/Claremont Ave DC_2035 PM Plus Phase 1
Fehr & Peers Synchro 8 Report
Movement EBL EBT EBR WBL WBT WBR NBL NBT NBR SBL SBT SBRLane ConfigurationsVolume (vph) 20 20 20 210 90 200 30 1177 340 200 831 321Ideal Flow (vphpl) 1900 1900 1900 1900 1900 1900 1900 1900 1900 1900 1900 1900Lane Width 12 12 12 12 12 12 12 16 12 12 12 12Total Lost time (s) 4.5 4.5 4.5 4.5 4.5 4.5Lane Util. Factor 1.00 0.95 0.95 0.95 1.00 0.95Frpb, ped/bikes 0.99 1.00 0.94 0.98 1.00 0.91Flpb, ped/bikes 1.00 1.00 1.00 1.00 1.00 1.00Frt 0.95 1.00 0.90 0.97 1.00 0.96Flt Protected 0.98 0.95 1.00 1.00 0.95 1.00Satd. Flow (prot) 1642 1698 1508 3757 1770 3073Flt Permitted 0.98 0.95 1.00 0.90 0.95 1.00Satd. Flow (perm) 1642 1698 1508 3402 1770 3073Peak-hour factor, PHF 1.00 1.00 1.00 1.00 1.00 1.00 1.00 1.00 1.00 1.00 1.00 1.00Adj. Flow (vph) 20 20 20 210 90 200 30 1177 340 200 831 321RTOR Reduction (vph) 0 19 0 0 68 0 0 23 0 0 36 0Lane Group Flow (vph) 0 41 0 189 243 0 0 1524 0 200 1116 0Confl. Peds. (#/hr) 51 51 105 33 105Confl. Bikes (#/hr) 2 15 53 72Heavy Vehicles (%) 8% 8% 8% 1% 1% 1% 3% 3% 3% 2% 2% 2%Turn Type Split NA Split NA Perm NA Prot NAProtected Phases 4 4 8 8 2 1 6Permitted Phases 2Actuated Green, G (s) 6.2 19.6 19.6 43.0 13.2 60.7Effective Green, g (s) 6.2 19.6 19.6 43.0 13.2 60.7Actuated g/C Ratio 0.06 0.20 0.20 0.43 0.13 0.61Clearance Time (s) 4.5 4.5 4.5 4.5 4.5 4.5Vehicle Extension (s) 3.0 3.0 3.0 3.0 3.0 3.0Lane Grp Cap (vph) 101 332 295 1462 233 1865v/s Ratio Prot c0.03 0.11 c0.16 c0.11 0.36v/s Ratio Perm c0.45v/c Ratio 0.41 0.57 0.83 1.04 0.86 0.60Uniform Delay, d1 45.1 36.4 38.6 28.5 42.5 12.1Progression Factor 1.81 1.00 1.00 0.50 1.00 1.00Incremental Delay, d2 0.8 2.2 16.9 26.5 25.4 1.4Delay (s) 82.5 38.6 55.5 40.7 67.9 13.6Level of Service F D E D E BApproach Delay (s) 82.5 49.1 40.7 21.6Approach LOS F D D C
Intersection SummaryHCM 2000 Control Delay 35.2 HCM 2000 Level of Service DHCM 2000 Volume to Capacity ratio 0.91Actuated Cycle Length (s) 100.0 Sum of lost time (s) 18.0Intersection Capacity Utilization 113.3% ICU Level of Service HAnalysis Period (min) 15c Critical Lane Group
HCM Signalized Intersection Capacity Analysis Children's Hospital 16: Telegraph Ave & 51St Street DC_2035 PM Plus Phase 1
Fehr & Peers Synchro 8 Report
Movement EBL EBT EBR WBL WBT WBR NBL NBT NBR SBL SBT SBRLane ConfigurationsVolume (vph) 327 750 111 80 580 240 121 980 190 310 681 70Ideal Flow (vphpl) 1900 1900 1900 1900 1900 1900 1900 1900 1900 1900 1900 1900Total Lost time (s) 4.0 4.0 4.0 3.5 4.0 4.5 4.0 3.5Lane Util. Factor 0.97 0.95 1.00 0.95 1.00 0.95 1.00 0.95Frpb, ped/bikes 1.00 0.98 1.00 0.97 1.00 0.97 1.00 0.97Flpb, ped/bikes 1.00 1.00 1.00 1.00 1.00 1.00 1.00 1.00Frt 1.00 0.98 1.00 0.96 1.00 0.98 1.00 0.99Flt Protected 0.95 1.00 0.95 1.00 0.95 1.00 0.95 1.00Satd. Flow (prot) 3400 3380 1787 3307 1719 3270 1752 3362Flt Permitted 0.95 1.00 0.95 1.00 0.95 1.00 0.95 1.00Satd. Flow (perm) 3400 3380 1787 3307 1719 3270 1752 3362Peak-hour factor, PHF 1.00 1.00 1.00 1.00 1.00 1.00 1.00 1.00 1.00 1.00 1.00 1.00Adj. Flow (vph) 327 750 111 80 580 240 121 980 190 310 681 70RTOR Reduction (vph) 0 11 0 0 44 0 0 15 0 0 8 0Lane Group Flow (vph) 327 850 0 80 776 0 121 1155 0 310 743 0Confl. Peds. (#/hr) 78 57 86 138Confl. Bikes (#/hr) 12 23 51 81Heavy Vehicles (%) 3% 3% 3% 1% 1% 1% 5% 5% 5% 3% 3% 3%Turn Type Prot NA Prot NA Prot NA Prot NAProtected Phases 7 4 3 8 5 2 1 6Permitted PhasesActuated Green, G (s) 14.4 29.0 8.3 23.4 8.5 33.2 13.0 38.7Effective Green, g (s) 14.4 29.0 8.3 23.4 8.5 33.2 13.0 38.7Actuated g/C Ratio 0.14 0.29 0.08 0.23 0.08 0.33 0.13 0.39Clearance Time (s) 4.0 4.0 4.0 3.5 4.0 4.5 4.0 3.5Vehicle Extension (s) 3.0 3.0 3.0 3.0 3.0 3.0 3.0 3.0Lane Grp Cap (vph) 489 980 148 773 146 1085 227 1301v/s Ratio Prot c0.10 c0.25 0.04 c0.23 0.07 c0.35 c0.18 0.22v/s Ratio Permv/c Ratio 0.67 0.87 0.54 1.00 0.83 1.06 1.37 0.57Uniform Delay, d1 40.5 33.7 44.0 38.3 45.0 33.4 43.5 24.1Progression Factor 1.00 1.00 1.00 1.00 1.00 1.00 1.14 0.71Incremental Delay, d2 3.5 10.2 4.0 33.2 30.5 46.1 186.0 1.5Delay (s) 44.0 43.9 48.0 71.5 75.5 79.5 235.5 18.7Level of Service D D D E E E F BApproach Delay (s) 43.9 69.4 79.1 82.1Approach LOS D E E F
Intersection SummaryHCM 2000 Control Delay 68.4 HCM 2000 Level of Service EHCM 2000 Volume to Capacity ratio 1.03Actuated Cycle Length (s) 100.0 Sum of lost time (s) 16.5Intersection Capacity Utilization 99.3% ICU Level of Service FAnalysis Period (min) 15c Critical Lane Group

HCM Signalized Intersection Capacity Analysis Children's Hospital 17: SB SR-24 On-Ramp & MLK Way & NB SR-24 Off-Ramp DC_2035 PM Plus Phase 1
Fehr & Peers Synchro 8 Report
Movement EBL EBT EBR WBL WBT WBR NBL NBT NBR SBL SBT SBRLane ConfigurationsVolume (vph) 340 0 0 0 0 1782 0 0 0 0 1750 250Ideal Flow (vphpl) 1900 1900 1900 1900 1900 1900 1900 1900 1900 1900 1900 1900Total Lost time (s) 4.0 4.0 4.0 4.0Lane Util. Factor 0.97 1.00 0.95 0.88Frpb, ped/bikes 1.00 1.00 1.00 1.00Flpb, ped/bikes 1.00 1.00 1.00 1.00Frt 1.00 0.86 1.00 0.85Flt Protected 0.95 1.00 1.00 1.00Satd. Flow (prot) 3273 1627 3574 2814Flt Permitted 0.95 1.00 1.00 1.00Satd. Flow (perm) 3273 1627 3574 2814Peak-hour factor, PHF 1.00 1.00 1.00 1.00 1.00 1.00 1.00 1.00 1.00 1.00 1.00 1.00Adj. Flow (vph) 340 0 0 0 0 1782 0 0 0 0 1750 250RTOR Reduction (vph) 0 0 0 0 0 0 0 0 0 0 0 0Lane Group Flow (vph) 340 0 0 0 0 1782 0 0 0 0 1750 250Confl. Peds. (#/hr) 3Confl. Bikes (#/hr) 14Heavy Vehicles (%) 7% 7% 2% 2% 1% 1% 2% 2% 2% 2% 1% 1%Turn Type Prot Free NA customProtected Phases 2 6 FreePermitted Phases FreeActuated Green, G (s) 13.0 50.0 29.0 50.0Effective Green, g (s) 13.0 50.0 29.0 50.0Actuated g/C Ratio 0.26 1.00 0.58 1.00Clearance Time (s) 4.0 4.0Lane Grp Cap (vph) 850 1627 2072 2814v/s Ratio Prot 0.10 0.49 0.09v/s Ratio Perm c1.10v/c Ratio 0.40 1.10 0.84 0.09Uniform Delay, d1 15.3 25.0 8.6 0.0Progression Factor 1.00 1.00 2.61 1.00Incremental Delay, d2 1.4 53.1 3.3 0.0Delay (s) 16.7 78.1 25.8 0.0Level of Service B E C AApproach Delay (s) 16.7 78.1 0.0 22.6Approach LOS B E A C
Intersection SummaryHCM 2000 Control Delay 46.1 HCM 2000 Level of Service DHCM 2000 Volume to Capacity ratio 1.30Actuated Cycle Length (s) 50.0 Sum of lost time (s) 8.0Intersection Capacity Utilization 64.7% ICU Level of Service CAnalysis Period (min) 15c Critical Lane Group
HCM Unsignalized Intersection Capacity Analysis Children's Hospital 18: West Street & 52nd Street DC_2035 PM Plus Phase 1
Fehr & Peers Synchro 8 Report
Movement EBL EBT EBR WBL WBT WBR NBL NBT NBR SBL SBT SBRLane ConfigurationsSign Control Stop Stop Stop StopVolume (vph) 0 160 10 100 139 0 60 0 150 10 70 10Peak Hour Factor 1.00 1.00 1.00 1.00 1.00 1.00 1.00 1.00 1.00 1.00 1.00 1.00Hourly flow rate (vph) 0 160 10 100 139 0 60 0 150 10 70 10
Direction, Lane # EB 1 WB 1 NB 1 NB 2 SB 1Volume Total (vph) 170 239 60 150 90Volume Left (vph) 0 100 60 0 10Volume Right (vph) 10 0 0 150 10Hadj (s) -0.02 0.12 0.50 -0.70 -0.01Departure Headway (s) 5.0 5.0 6.2 5.0 5.4Degree Utilization, x 0.24 0.33 0.10 0.21 0.13Capacity (veh/h) 668 675 547 671 606Control Delay (s) 9.5 10.5 8.7 8.0 9.2Approach Delay (s) 9.5 10.5 8.2 9.2Approach LOS A B A A
Intersection SummaryDelay 9.4Level of Service AIntersection Capacity Utilization 46.0% ICU Level of Service AAnalysis Period (min) 15

HCM Unsignalized Intersection Capacity Analysis Children's Hospital 19: Genoa Street & 52nd Street DC_2035 PM Plus Phase 1
Fehr & Peers Synchro 8 Report
Movement EBL EBT EBR WBL WBT WBR NBL NBT NBR SBL SBT SBRLane ConfigurationsSign Control Stop Stop Stop StopVolume (vph) 10 150 10 20 129 50 10 10 10 20 10 10Peak Hour Factor 1.00 1.00 1.00 1.00 1.00 1.00 1.00 1.00 1.00 1.00 1.00 1.00Hourly flow rate (vph) 10 150 10 20 129 50 10 10 10 20 10 10
Direction, Lane # EB 1 WB 1 NB 1 SB 1Volume Total (vph) 170 199 30 40Volume Left (vph) 10 20 10 20Volume Right (vph) 10 50 10 10Hadj (s) -0.01 -0.13 -0.13 -0.05Departure Headway (s) 4.3 4.1 4.6 4.7Degree Utilization, x 0.20 0.23 0.04 0.05Capacity (veh/h) 822 854 714 701Control Delay (s) 8.3 8.3 7.8 7.9Approach Delay (s) 8.3 8.3 7.8 7.9Approach LOS A A A A
Intersection SummaryDelay 8.3Level of Service AIntersection Capacity Utilization 28.5% ICU Level of Service AAnalysis Period (min) 15
HCM Unsignalized Intersection Capacity Analysis Children's Hospital 20: Genoa Street & 55th Street DC_2035 PM Plus Phase 1
Fehr & Peers Synchro 8 Report
Movement EBL EBT EBR WBL WBT WBR NBL NBT NBR SBL SBT SBRLane ConfigurationsVolume (veh/h) 20 390 10 20 451 40 10 20 40 40 10 20Sign Control Free Free Stop StopGrade 0% 0% 0% 0%Peak Hour Factor 1.00 1.00 1.00 1.00 1.00 1.00 1.00 1.00 1.00 1.00 1.00 1.00Hourly flow rate (vph) 20 390 10 20 451 40 10 20 40 40 10 20Pedestrians 8 11 5Lane Width (ft) 12.0 12.0 12.0Walking Speed (ft/s) 4.0 4.0 4.0Percent Blockage 1 1 0Right turn flare (veh)Median type None NoneMedian storage veh)Upstream signal (ft) 721pX, platoon unblockedvC, conflicting volume 496 411 990 982 406 1001 967 484vC1, stage 1 conf volvC2, stage 2 conf volvCu, unblocked vol 496 411 990 982 406 1001 967 484tC, single (s) 4.1 4.1 7.1 6.5 6.2 7.1 6.5 6.2tC, 2 stage (s)tF (s) 2.2 2.2 3.5 4.0 3.3 3.5 4.0 3.3p0 queue free % 98 98 95 92 94 79 96 97cM capacity (veh/h) 1069 1148 201 239 643 187 242 577
Direction, Lane # EB 1 WB 1 NB 1 SB 1Volume Total 420 511 70 70Volume Left 20 20 10 40Volume Right 10 40 40 20cSH 1069 1148 358 241Volume to Capacity 0.02 0.02 0.20 0.29Queue Length 95th (ft) 1 1 18 29Control Delay (s) 0.6 0.5 17.5 25.9Lane LOS A A C DApproach Delay (s) 0.6 0.5 17.5 25.9Approach LOS C D
Intersection SummaryAverage Delay 3.3Intersection Capacity Utilization 51.2% ICU Level of Service AAnalysis Period (min) 15

HCM Unsignalized Intersection Capacity Analysis Children's Hospital 21: MLK Way & RIRO Main Garage DC_2035 PM Plus Phase 1
Fehr & Peers Synchro 8 Report
Movement WBL WBR NBT NBR SBL SBTLane ConfigurationsVolume (veh/h) 0 123 2206 34 0 1913Sign Control Stop Free FreeGrade 0% 0% 0%Peak Hour Factor 1.00 1.00 1.00 1.00 1.00 1.00Hourly flow rate (vph) 0 123 2206 34 0 1913PedestriansLane Width (ft)Walking Speed (ft/s)Percent BlockageRight turn flare (veh)Median type None NoneMedian storage veh)Upstream signal (ft) 154 137pX, platoon unblocked 0.74 0.65 0.65vC, conflicting volume 2861 752 2240vC1, stage 1 conf volvC2, stage 2 conf volvCu, unblocked vol 673 0 1025tC, single (s) 6.8 6.9 4.1tC, 2 stage (s)tF (s) 3.5 3.3 2.2p0 queue free % 100 83 100cM capacity (veh/h) 287 705 438
Direction, Lane # WB 1 NB 1 NB 2 NB 3 SB 1 SB 2 SB 3Volume Total 123 882 882 475 638 638 638Volume Left 0 0 0 0 0 0 0Volume Right 123 0 0 34 0 0 0cSH 705 1700 1700 1700 1700 1700 1700Volume to Capacity 0.17 0.52 0.52 0.28 0.38 0.38 0.38Queue Length 95th (ft) 16 0 0 0 0 0 0Control Delay (s) 11.2 0.0 0.0 0.0 0.0 0.0 0.0Lane LOS BApproach Delay (s) 11.2 0.0 0.0Approach LOS B
Intersection SummaryAverage Delay 0.3Intersection Capacity Utilization 57.7% ICU Level of Service BAnalysis Period (min) 15
HCM Unsignalized Intersection Capacity Analysis Children's Hospital 22: MLK Way & RIRO Main Plaza DC_2035 PM Plus Phase 1
Fehr & Peers Synchro 8 Report
Movement WBL WBR NBT NBR SBL SBTLane ConfigurationsVolume (veh/h) 0 0 2102 20 0 1970Sign Control Stop Free FreeGrade 0% 0% 0%Peak Hour Factor 1.00 1.00 1.00 1.00 1.00 1.00Hourly flow rate (vph) 0 0 2102 20 0 1970PedestriansLane Width (ft)Walking Speed (ft/s)Percent BlockageRight turn flare (veh)Median type None NoneMedian storage veh)Upstream signal (ft) 424 204pX, platoon unblocked 0.74vC, conflicting volume 2769 711 2122vC1, stage 1 conf volvC2, stage 2 conf volvCu, unblocked vol 2157 711 2122tC, single (s) 6.8 6.9 4.1tC, 2 stage (s)tF (s) 3.5 3.3 2.2p0 queue free % 100 100 100cM capacity (veh/h) 30 376 253
Direction, Lane # WB 1 NB 1 NB 2 NB 3 SB 1 SB 2 SB 3Volume Total 0 841 841 440 657 657 657Volume Left 0 0 0 0 0 0 0Volume Right 0 0 0 20 0 0 0cSH 1700 1700 1700 1700 1700 1700 1700Volume to Capacity 0.00 0.49 0.49 0.26 0.39 0.39 0.39Queue Length 95th (ft) 0 0 0 0 0 0 0Control Delay (s) 0.0 0.0 0.0 0.0 0.0 0.0 0.0Lane LOS AApproach Delay (s) 0.0 0.0 0.0Approach LOS A
Intersection SummaryAverage Delay 0.0Intersection Capacity Utilization 44.4% ICU Level of Service AAnalysis Period (min) 15

HCM Unsignalized Intersection Capacity Analysis Children's Hospital 24: 51St Street & 52nd Street DC_2035 PM Plus Phase 1
Fehr & Peers Synchro 8 Report
Intersection Sign configuration not allowed in HCM analysis.
HCM Signalized Intersection Capacity Analysis Children's Hospital1: MLK Way & 55th Street DC_2035 AM Plus Phase 2
Fehr & Peers Synchro 8 Report
Movement EBL EBT EBR WBL WBT WBR NBU NBL NBT NBR SBL SBTLane ConfigurationsVolume (vph) 20 200 250 60 270 100 21 180 1446 72 160 1531Ideal Flow (vphpl) 1900 1900 1900 1900 1900 1900 1900 1900 1900 1900 1900 1900Total Lost time (s) 5.0 5.0 4.5 5.0 4.5 5.0Lane Util. Factor 1.00 1.00 1.00 0.91 1.00 0.91Frpb, ped/bikes 0.98 0.99 1.00 1.00 1.00 1.00Flpb, ped/bikes 1.00 1.00 1.00 1.00 1.00 1.00Frt 0.93 0.97 1.00 0.99 1.00 0.99Flt Protected 1.00 0.99 0.95 1.00 0.95 1.00Satd. Flow (prot) 1702 1741 1770 5027 1770 5037Flt Permitted 0.98 0.79 0.95 1.00 0.95 1.00Satd. Flow (perm) 1663 1383 1770 5027 1770 5037Peak-hour factor, PHF 1.00 1.00 1.00 1.00 1.00 1.00 1.00 1.00 1.00 1.00 1.00 1.00Adj. Flow (vph) 20 200 250 60 270 100 21 180 1446 72 160 1531RTOR Reduction (vph) 0 50 0 0 13 0 0 0 5 0 0 5Lane Group Flow (vph) 0 420 0 0 417 0 0 201 1513 0 160 1596Confl. Peds. (#/hr) 11 21 21 11 32Confl. Bikes (#/hr) 24 23 9Heavy Vehicles (%) 1% 1% 1% 4% 4% 4% 2% 2% 2% 2% 2% 2%Turn Type Perm NA Perm NA Prot Prot NA Prot NAProtected Phases 4 8 5 5 2 1 6Permitted Phases 4 8Actuated Green, G (s) 29.4 29.4 13.5 38.6 7.5 32.6Effective Green, g (s) 29.4 29.4 13.5 38.6 7.5 32.6Actuated g/C Ratio 0.33 0.33 0.15 0.43 0.08 0.36Clearance Time (s) 5.0 5.0 4.5 5.0 4.5 5.0Vehicle Extension (s) 3.0 3.0 3.0 3.0 3.0 3.0Lane Grp Cap (vph) 543 451 265 2156 147 1824v/s Ratio Prot 0.11 c0.30 0.09 c0.32v/s Ratio Perm 0.25 c0.30v/c Ratio 0.77 0.92 0.76 0.70 1.09 0.87Uniform Delay, d1 27.3 29.2 36.7 21.0 41.2 26.8Progression Factor 1.00 1.00 0.55 0.32 1.00 1.00Incremental Delay, d2 6.8 24.5 10.4 1.7 99.9 6.2Delay (s) 34.1 53.8 30.8 8.3 141.1 33.0Level of Service C D C A F CApproach Delay (s) 34.1 53.8 11.0 42.8Approach LOS C D B D
Intersection SummaryHCM 2000 Control Delay 30.5 HCM 2000 Level of Service CHCM 2000 Volume to Capacity ratio 0.88Actuated Cycle Length (s) 90.0 Sum of lost time (s) 14.5Intersection Capacity Utilization 99.8% ICU Level of Service FAnalysis Period (min) 15c Critical Lane Group

HCM Signalized Intersection Capacity Analysis Children's Hospital1: MLK Way & 55th Street DC_2035 AM Plus Phase 2
Fehr & Peers Synchro 8 Report
Movement SBRLane ConfigurationsVolume (vph) 70Ideal Flow (vphpl) 1900Total Lost time (s)Lane Util. FactorFrpb, ped/bikesFlpb, ped/bikesFrtFlt ProtectedSatd. Flow (prot)Flt PermittedSatd. Flow (perm)Peak-hour factor, PHF 1.00Adj. Flow (vph) 70RTOR Reduction (vph) 0Lane Group Flow (vph) 0Confl. Peds. (#/hr) 18Confl. Bikes (#/hr) 11Heavy Vehicles (%) 2%Turn TypeProtected PhasesPermitted PhasesActuated Green, G (s)Effective Green, g (s)Actuated g/C RatioClearance Time (s)Vehicle Extension (s)Lane Grp Cap (vph)v/s Ratio Protv/s Ratio Permv/c RatioUniform Delay, d1Progression FactorIncremental Delay, d2Delay (s)Level of ServiceApproach Delay (s)Approach LOS
Intersection Summary
HCM Unsignalized Intersection Capacity Analysis Children's Hospital2: Dover Street & 55th Street DC_2035 AM Plus Phase 2
Fehr & Peers Synchro 8 Report
Movement EBL EBT EBR WBL WBT WBR NBL NBT NBR SBL SBT SBRLane ConfigurationsVolume (veh/h) 30 382 10 30 370 10 10 10 20 10 10 30Sign Control Free Free Stop StopGrade 0% 0% 0% 0%Peak Hour Factor 1.00 1.00 1.00 1.00 1.00 1.00 1.00 1.00 1.00 1.00 1.00 1.00Hourly flow rate (vph) 30 382 10 30 370 10 10 10 20 10 10 30Pedestrians 14 30 23 9Lane Width (ft) 12.0 12.0 12.0 12.0Walking Speed (ft/s) 4.0 4.0 4.0 4.0Percent Blockage 1 3 2 1Right turn flare (veh)Median type None NoneMedian storage veh)Upstream signal (ft) 641 677pX, platoon unblocked 0.87 0.87 0.87 0.87 0.87 0.87vC, conflicting volume 389 415 954 919 440 946 919 398vC1, stage 1 conf volvC2, stage 2 conf volvCu, unblocked vol 229 415 875 835 440 866 835 240tC, single (s) 4.1 4.1 7.1 6.5 6.2 7.1 6.5 6.2tC, 2 stage (s)tF (s) 2.2 2.2 3.5 4.0 3.3 3.5 4.0 3.3p0 queue free % 97 97 95 96 97 95 96 96cM capacity (veh/h) 1146 1112 201 246 594 203 244 683
Direction, Lane # EB 1 WB 1 NB 1 SB 1Volume Total 422 410 40 50Volume Left 30 30 10 10Volume Right 10 10 20 30cSH 1146 1112 322 373Volume to Capacity 0.03 0.03 0.12 0.13Queue Length 95th (ft) 2 2 10 11Control Delay (s) 0.8 0.9 17.7 16.2Lane LOS A A C CApproach Delay (s) 0.8 0.9 17.7 16.2Approach LOS C C
Intersection SummaryAverage Delay 2.4Intersection Capacity Utilization 45.8% ICU Level of Service AAnalysis Period (min) 15
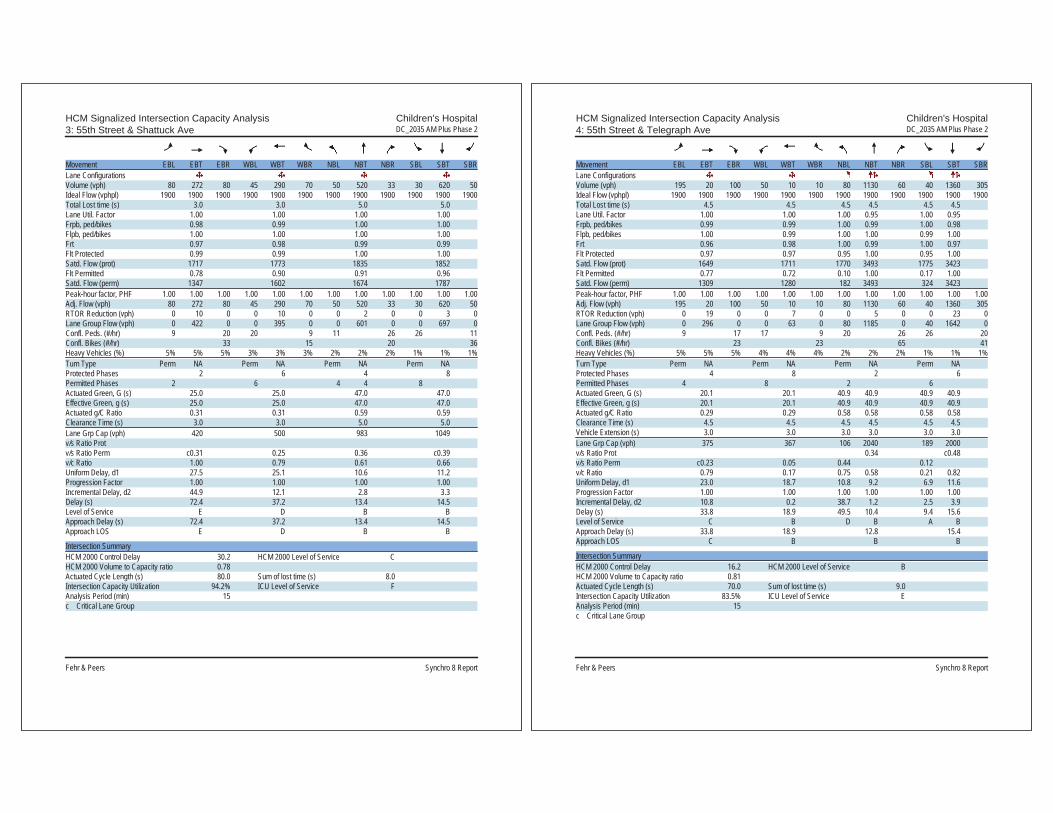
HCM Signalized Intersection Capacity Analysis Children's Hospital3: 55th Street & Shattuck Ave DC_2035 AM Plus Phase 2
Fehr & Peers Synchro 8 Report
Movement EBL EBT EBR WBL WBT WBR NBL NBT NBR SBL SBT SBRLane ConfigurationsVolume (vph) 80 272 80 45 290 70 50 520 33 30 620 50Ideal Flow (vphpl) 1900 1900 1900 1900 1900 1900 1900 1900 1900 1900 1900 1900Total Lost time (s) 3.0 3.0 5.0 5.0Lane Util. Factor 1.00 1.00 1.00 1.00Frpb, ped/bikes 0.98 0.99 1.00 1.00Flpb, ped/bikes 1.00 1.00 1.00 1.00Frt 0.97 0.98 0.99 0.99Flt Protected 0.99 0.99 1.00 1.00Satd. Flow (prot) 1717 1773 1835 1852Flt Permitted 0.78 0.90 0.91 0.96Satd. Flow (perm) 1347 1602 1674 1787Peak-hour factor, PHF 1.00 1.00 1.00 1.00 1.00 1.00 1.00 1.00 1.00 1.00 1.00 1.00Adj. Flow (vph) 80 272 80 45 290 70 50 520 33 30 620 50RTOR Reduction (vph) 0 10 0 0 10 0 0 2 0 0 3 0Lane Group Flow (vph) 0 422 0 0 395 0 0 601 0 0 697 0Confl. Peds. (#/hr) 9 20 20 9 11 26 26 11Confl. Bikes (#/hr) 33 15 20 36Heavy Vehicles (%) 5% 5% 5% 3% 3% 3% 2% 2% 2% 1% 1% 1%Turn Type Perm NA Perm NA Perm NA Perm NAProtected Phases 2 6 4 8Permitted Phases 2 6 4 4 8Actuated Green, G (s) 25.0 25.0 47.0 47.0Effective Green, g (s) 25.0 25.0 47.0 47.0Actuated g/C Ratio 0.31 0.31 0.59 0.59Clearance Time (s) 3.0 3.0 5.0 5.0Lane Grp Cap (vph) 420 500 983 1049v/s Ratio Protv/s Ratio Perm c0.31 0.25 0.36 c0.39v/c Ratio 1.00 0.79 0.61 0.66Uniform Delay, d1 27.5 25.1 10.6 11.2Progression Factor 1.00 1.00 1.00 1.00Incremental Delay, d2 44.9 12.1 2.8 3.3Delay (s) 72.4 37.2 13.4 14.5Level of Service E D B BApproach Delay (s) 72.4 37.2 13.4 14.5Approach LOS E D B B
Intersection SummaryHCM 2000 Control Delay 30.2 HCM 2000 Level of Service CHCM 2000 Volume to Capacity ratio 0.78Actuated Cycle Length (s) 80.0 Sum of lost time (s) 8.0Intersection Capacity Utilization 94.2% ICU Level of Service FAnalysis Period (min) 15c Critical Lane Group
HCM Signalized Intersection Capacity Analysis Children's Hospital4: 55th Street & Telegraph Ave DC_2035 AM Plus Phase 2
Fehr & Peers Synchro 8 Report
Movement EBL EBT EBR WBL WBT WBR NBL NBT NBR SBL SBT SBRLane ConfigurationsVolume (vph) 195 20 100 50 10 10 80 1130 60 40 1360 305Ideal Flow (vphpl) 1900 1900 1900 1900 1900 1900 1900 1900 1900 1900 1900 1900Total Lost time (s) 4.5 4.5 4.5 4.5 4.5 4.5Lane Util. Factor 1.00 1.00 1.00 0.95 1.00 0.95Frpb, ped/bikes 0.99 0.99 1.00 0.99 1.00 0.98Flpb, ped/bikes 1.00 0.99 1.00 1.00 0.99 1.00Frt 0.96 0.98 1.00 0.99 1.00 0.97Flt Protected 0.97 0.97 0.95 1.00 0.95 1.00Satd. Flow (prot) 1649 1711 1770 3493 1775 3423Flt Permitted 0.77 0.72 0.10 1.00 0.17 1.00Satd. Flow (perm) 1309 1280 182 3493 324 3423Peak-hour factor, PHF 1.00 1.00 1.00 1.00 1.00 1.00 1.00 1.00 1.00 1.00 1.00 1.00Adj. Flow (vph) 195 20 100 50 10 10 80 1130 60 40 1360 305RTOR Reduction (vph) 0 19 0 0 7 0 0 5 0 0 23 0Lane Group Flow (vph) 0 296 0 0 63 0 80 1185 0 40 1642 0Confl. Peds. (#/hr) 9 17 17 9 20 26 26 20Confl. Bikes (#/hr) 23 23 65 41Heavy Vehicles (%) 5% 5% 5% 4% 4% 4% 2% 2% 2% 1% 1% 1%Turn Type Perm NA Perm NA Perm NA Perm NAProtected Phases 4 8 2 6Permitted Phases 4 8 2 6Actuated Green, G (s) 20.1 20.1 40.9 40.9 40.9 40.9Effective Green, g (s) 20.1 20.1 40.9 40.9 40.9 40.9Actuated g/C Ratio 0.29 0.29 0.58 0.58 0.58 0.58Clearance Time (s) 4.5 4.5 4.5 4.5 4.5 4.5Vehicle Extension (s) 3.0 3.0 3.0 3.0 3.0 3.0Lane Grp Cap (vph) 375 367 106 2040 189 2000v/s Ratio Prot 0.34 c0.48v/s Ratio Perm c0.23 0.05 0.44 0.12v/c Ratio 0.79 0.17 0.75 0.58 0.21 0.82Uniform Delay, d1 23.0 18.7 10.8 9.2 6.9 11.6Progression Factor 1.00 1.00 1.00 1.00 1.00 1.00Incremental Delay, d2 10.8 0.2 38.7 1.2 2.5 3.9Delay (s) 33.8 18.9 49.5 10.4 9.4 15.6Level of Service C B D B A BApproach Delay (s) 33.8 18.9 12.8 15.4Approach LOS C B B B
Intersection SummaryHCM 2000 Control Delay 16.2 HCM 2000 Level of Service BHCM 2000 Volume to Capacity ratio 0.81Actuated Cycle Length (s) 70.0 Sum of lost time (s) 9.0Intersection Capacity Utilization 83.5% ICU Level of Service EAnalysis Period (min) 15c Critical Lane Group

HCM Unsignalized Intersection Capacity Analysis Children's Hospital5: MLK Way & 54th Street DC_2035 AM Plus Phase 2
Fehr & Peers Synchro 8 Report
Movement EBL EBT EBR WBL WBT WBR NBU NBL NBT NBR SBL SBTLane ConfigurationsVolume (veh/h) 10 10 60 10 10 10 11 30 1687 26 10 1802Sign Control Stop Stop Free FreeGrade 0% 0% 0% 0%Peak Hour Factor 1.00 1.00 1.00 1.00 1.00 1.00 1.00 1.00 1.00 1.00 1.00 1.00Hourly flow rate (vph) 10 10 60 10 10 10 0 30 1687 26 10 1802Pedestrians 11 9 12Lane Width (ft) 12.0 12.0 12.0Walking Speed (ft/s) 4.0 4.0 4.0Percent Blockage 1 1 1Right turn flare (veh)Median type None NoneMedian storage veh)Upstream signal (ft) 299 294pX, platoon unblocked 0.81 0.81 0.71 0.81 0.81 0.80 0.00 0.71 0.80vC, conflicting volume 2475 3620 629 2467 3612 584 0 1823 1722vC1, stage 1 conf volvC2, stage 2 conf volvCu, unblocked vol 350 1769 0 340 1759 0 0 723 1045tC, single (s) 7.5 6.5 6.9 7.5 6.5 6.9 0.0 4.1 4.1tC, 2 stage (s)tF (s) *5.0 *5.0 *5.0 *5.0 *5.0 *5.0 0.0 2.2 2.2p0 queue free % 96 83 88 96 83 98 0 95 98cM capacity (veh/h) 282 59 501 253 60 575 0 615 533
Direction, Lane # EB 1 WB 1 NB 1 NB 2 NB 3 SB 1 SB 2 SB 3Volume Total 80 30 452 844 448 460 901 460Volume Left 10 10 30 0 0 10 0 0Volume Right 60 10 0 0 26 0 0 10cSH 246 133 615 1700 1700 533 1700 1700Volume to Capacity 0.33 0.22 0.05 0.50 0.26 0.02 0.53 0.27Queue Length 95th (ft) 34 20 4 0 0 1 0 0Control Delay (s) 26.6 39.6 1.4 0.0 0.0 0.6 0.0 0.0Lane LOS D E A AApproach Delay (s) 26.6 39.6 0.4 0.1Approach LOS D E
Intersection SummaryAverage Delay 1.1Intersection Capacity Utilization 77.7% ICU Level of Service DAnalysis Period (min) 15
* User Entered Value
HCM Unsignalized Intersection Capacity Analysis Children's Hospital5: MLK Way & 54th Street DC_2035 AM Plus Phase 2
Fehr & Peers Synchro 8 Report
Movement SBRLane ConfigurationsVolume (veh/h) 10Sign ControlGradePeak Hour Factor 1.00Hourly flow rate (vph) 10PedestriansLane Width (ft)Walking Speed (ft/s)Percent BlockageRight turn flare (veh)Median typeMedian storage veh)Upstream signal (ft)pX, platoon unblockedvC, conflicting volumevC1, stage 1 conf volvC2, stage 2 conf volvCu, unblocked voltC, single (s)tC, 2 stage (s)tF (s)p0 queue free %cM capacity (veh/h)
Direction, Lane #

HCM Unsignalized Intersection Capacity Analysis Children's Hospital6: Dover Street & 54th Street DC_2035 AM Plus Phase 2
Fehr & Peers Synchro 8 Report
Movement EBL EBT EBR WBL WBT WBR NBL NBT NBR SBL SBT SBRLane ConfigurationsVolume (veh/h) 10 16 10 10 10 10 10 20 20 10 40 10Sign Control Stop Stop Free FreeGrade 0% 0% 0% 0%Peak Hour Factor 1.00 1.00 1.00 1.00 1.00 1.00 1.00 1.00 1.00 1.00 1.00 1.00Hourly flow rate (vph) 10 16 10 10 10 10 10 20 20 10 40 10Pedestrians 15 21 3 9Lane Width (ft) 12.0 12.0 12.0 12.0Walking Speed (ft/s) 4.0 4.0 4.0 4.0Percent Blockage 1 2 0 1Right turn flare (veh)Median type None NoneMedian storage veh)Upstream signal (ft)pX, platoon unblockedvC, conflicting volume 154 161 63 157 156 60 65 61vC1, stage 1 conf volvC2, stage 2 conf volvCu, unblocked vol 154 161 63 157 156 60 65 61tC, single (s) 7.1 6.5 6.2 7.1 6.5 6.2 4.1 4.1tC, 2 stage (s)tF (s) 3.5 4.0 3.3 3.5 4.0 3.3 2.2 2.2p0 queue free % 99 98 99 99 99 99 99 99cM capacity (veh/h) 759 704 992 751 708 986 1531 1528
Direction, Lane # EB 1 WB 1 NB 1 SB 1Volume Total 36 30 50 60Volume Left 10 10 10 10Volume Right 10 10 20 10cSH 783 798 1531 1528Volume to Capacity 0.05 0.04 0.01 0.01Queue Length 95th (ft) 4 3 0 0Control Delay (s) 9.8 9.7 1.5 1.3Lane LOS A A A AApproach Delay (s) 9.8 9.7 1.5 1.3Approach LOS A A
Intersection SummaryAverage Delay 4.5Intersection Capacity Utilization 21.7% ICU Level of Service AAnalysis Period (min) 15
HCM Unsignalized Intersection Capacity Analysis Children's Hospital7: Shattuck Ave & 54th Street DC_2035 AM Plus Phase 2
Fehr & Peers Synchro 8 Report
Movement EBL EBR NBL NBT SBT SBRLane ConfigurationsVolume (veh/h) 10 26 20 593 715 10Sign Control Stop Free FreeGrade 0% 0% 0%Peak Hour Factor 1.00 1.00 1.00 1.00 1.00 1.00Hourly flow rate (vph) 10 26 20 593 715 10Pedestrians 14 3 2Lane Width (ft) 12.0 12.0 12.0Walking Speed (ft/s) 4.0 4.0 4.0Percent Blockage 1 0 0Right turn flare (veh)Median type None NoneMedian storage veh)Upstream signal (ft) 550 282pX, platoon unblocked 0.76 0.75 0.75vC, conflicting volume 1369 737 739vC1, stage 1 conf volvC2, stage 2 conf volvCu, unblocked vol 1289 484 487tC, single (s) 6.4 6.2 4.1tC, 2 stage (s)tF (s) 3.5 3.3 2.2p0 queue free % 92 94 97cM capacity (veh/h) 133 434 799
Direction, Lane # EB 1 NB 1 SB 1Volume Total 36 613 725Volume Left 10 20 0Volume Right 26 0 10cSH 267 799 1700Volume to Capacity 0.14 0.03 0.43Queue Length 95th (ft) 12 2 0Control Delay (s) 20.6 0.7 0.0Lane LOS C AApproach Delay (s) 20.6 0.7 0.0Approach LOS C
Intersection SummaryAverage Delay 0.8Intersection Capacity Utilization 58.3% ICU Level of Service BAnalysis Period (min) 15

HCM Signalized Intersection Capacity Analysis Children's Hospital8: MLK Way & 53rd Street DC_2035 AM Plus Phase 2
Fehr & Peers Synchro 8 Report
Movement EBL EBT EBR WBL WBT WBR NBL NBT NBR SBL SBT SBRLane ConfigurationsVolume (vph) 10 1 59 60 10 18 30 1726 113 4 1884 10Ideal Flow (vphpl) 1900 1900 1900 1900 1900 1900 1900 1900 1900 1900 1900 1900Total Lost time (s) 5.0 5.0 4.0 3.5 4.0 3.5Lane Util. Factor 1.00 1.00 1.00 0.91 1.00 0.91Frpb, ped/bikes 0.98 1.00 1.00 1.00 1.00 1.00Flpb, ped/bikes 1.00 0.99 1.00 1.00 1.00 1.00Frt 0.89 0.97 1.00 0.99 1.00 1.00Flt Protected 0.99 0.97 0.95 1.00 0.95 1.00Satd. Flow (prot) 1603 1765 1770 5015 1787 5129Flt Permitted 0.96 0.80 0.95 1.00 0.95 1.00Satd. Flow (perm) 1548 1459 1770 5015 1787 5129Peak-hour factor, PHF 1.00 1.00 1.00 1.00 1.00 1.00 1.00 1.00 1.00 1.00 1.00 1.00Adj. Flow (vph) 10 1 59 60 10 18 30 1726 113 4 1884 10RTOR Reduction (vph) 0 48 0 0 13 0 0 4 0 0 0 0Lane Group Flow (vph) 0 22 0 0 75 0 30 1835 0 4 1894 0Confl. Peds. (#/hr) 11 20 20 11 20 30Confl. Bikes (#/hr) 8 20Heavy Vehicles (%) 2% 2% 2% 0% 0% 0% 2% 2% 2% 1% 1% 1%Turn Type Perm NA Perm NA Prot NA Prot NAProtected Phases 4 8 5 2 1 6Permitted Phases 4 8Actuated Green, G (s) 16.8 16.8 4.5 58.9 1.8 56.2Effective Green, g (s) 16.8 16.8 4.5 58.9 1.8 56.2Actuated g/C Ratio 0.19 0.19 0.05 0.65 0.02 0.62Clearance Time (s) 5.0 5.0 4.0 3.5 4.0 3.5Vehicle Extension (s) 3.0 3.0 3.0 3.0 3.0 3.0Lane Grp Cap (vph) 288 272 88 3282 35 3202v/s Ratio Prot 0.02 c0.37 0.00 c0.37v/s Ratio Perm 0.01 c0.05v/c Ratio 0.08 0.28 0.34 0.56 0.11 0.59Uniform Delay, d1 30.2 31.4 41.3 8.5 43.3 10.1Progression Factor 1.00 0.99 1.18 0.60 0.47 0.26Incremental Delay, d2 0.1 0.6 1.6 0.5 0.8 0.5Delay (s) 30.3 31.7 50.3 5.6 21.4 3.1Level of Service C C D A C AApproach Delay (s) 30.3 31.7 6.3 3.1Approach LOS C C A A
Intersection SummaryHCM 2000 Control Delay 5.8 HCM 2000 Level of Service AHCM 2000 Volume to Capacity ratio 0.53Actuated Cycle Length (s) 90.0 Sum of lost time (s) 12.5Intersection Capacity Utilization 63.3% ICU Level of Service BAnalysis Period (min) 15c Critical Lane Group
HCM Unsignalized Intersection Capacity Analysis Children's Hospital9: Dover Street & 53rd Street DC_2035 AM Plus Phase 2
Fehr & Peers Synchro 8 Report
Movement EBL EBT EBR WBL WBT WBR NBL NBT NBR SBL SBT SBRLane ConfigurationsVolume (veh/h) 50 30 0 0 20 10 0 0 0 10 0 50Sign Control Stop Stop Free FreeGrade 0% 0% 0% 0%Peak Hour Factor 1.00 1.00 1.00 1.00 1.00 1.00 1.00 1.00 1.00 1.00 1.00 1.00Hourly flow rate (vph) 50 30 0 0 20 10 0 0 0 10 0 50Pedestrians 33 32 3 3Lane Width (ft) 12.0 12.0 12.0 12.0Walking Speed (ft/s) 4.0 4.0 4.0 4.0Percent Blockage 3 3 0 0Right turn flare (veh)Median type None NoneMedian storage veh)Upstream signal (ft)pX, platoon unblockedvC, conflicting volume 101 110 61 95 135 35 83 32vC1, stage 1 conf volvC2, stage 2 conf volvCu, unblocked vol 101 110 61 95 135 35 83 32tC, single (s) 7.1 6.5 6.2 7.1 6.5 6.2 4.1 4.1tC, 2 stage (s)tF (s) 3.5 4.0 3.3 3.5 4.0 3.3 2.2 2.2p0 queue free % 94 96 100 100 97 99 100 99cM capacity (veh/h) 794 737 980 802 714 1013 1485 1551
Direction, Lane # EB 1 WB 1 NB 1 SB 1Volume Total 80 30 0 60Volume Left 50 0 0 10Volume Right 0 10 0 50cSH 772 792 1700 1551Volume to Capacity 0.10 0.04 0.00 0.01Queue Length 95th (ft) 9 3 0 0Control Delay (s) 10.2 9.7 0.0 1.3Lane LOS B A AApproach Delay (s) 10.2 9.7 0.0 1.3Approach LOS B A
Intersection SummaryAverage Delay 7.0Intersection Capacity Utilization 28.8% ICU Level of Service AAnalysis Period (min) 15

HCM Signalized Intersection Capacity Analysis Children's Hospital10: MLK Way & 52nd Street DC_2035 AM Plus Phase 2
Fehr & Peers Synchro 8 Report
Movement EBL EBT EBR WBL WBT WBR NBU NBL NBT NBR SBU SBLLane ConfigurationsVolume (vph) 68 85 120 101 105 338 60 110 1611 130 36 182Ideal Flow (vphpl) 1900 1900 1900 1900 1900 1900 1900 1900 1900 1900 1900 1900Total Lost time (s) 5.0 5.0 5.0 5.0 4.5 4.5 4.0Lane Util. Factor 1.00 1.00 1.00 1.00 1.00 0.91 1.00Frpb, ped/bikes 1.00 0.95 1.00 0.97 1.00 1.00 1.00Flpb, ped/bikes 0.99 1.00 0.98 1.00 1.00 1.00 1.00Frt 1.00 0.91 1.00 0.85 1.00 0.99 1.00Flt Protected 0.95 1.00 0.98 1.00 0.95 1.00 0.95Satd. Flow (prot) 1771 1634 1777 1534 1787 5060 1787Flt Permitted 0.53 1.00 0.64 1.00 0.95 1.00 0.95Satd. Flow (perm) 995 1634 1158 1534 1787 5060 1787Peak-hour factor, PHF 1.00 1.00 1.00 1.00 1.00 1.00 1.00 1.00 1.00 1.00 1.00 1.00Adj. Flow (vph) 68 85 120 101 105 338 60 110 1611 130 36 182RTOR Reduction (vph) 0 60 0 0 0 172 0 0 9 0 0 0Lane Group Flow (vph) 68 145 0 0 206 166 0 170 1732 0 0 218Confl. Peds. (#/hr) 15 74 74 15 11Confl. Bikes (#/hr) 9 8 2Heavy Vehicles (%) 1% 1% 1% 2% 2% 2% 1% 1% 1% 1% 1% 1%Turn Type Perm NA Perm NA Perm Prot Prot NA Prot ProtProtected Phases 4 8 5 5 2 1 1Permitted Phases 4 8 8Actuated Green, G (s) 23.7 23.7 23.7 23.7 7.5 40.3 12.5Effective Green, g (s) 23.7 23.7 23.7 23.7 7.5 40.3 12.5Actuated g/C Ratio 0.26 0.26 0.26 0.26 0.08 0.45 0.14Clearance Time (s) 5.0 5.0 5.0 5.0 4.5 4.5 4.0Vehicle Extension (s) 2.0 2.0 2.0 2.0 2.0 2.0 2.0Lane Grp Cap (vph) 262 430 304 403 148 2265 248v/s Ratio Prot 0.09 c0.10 c0.34 c0.12v/s Ratio Perm 0.07 c0.18 0.11v/c Ratio 0.26 0.34 0.68 0.41 1.15 0.76 0.88Uniform Delay, d1 26.2 26.8 29.7 27.4 41.2 20.9 38.0Progression Factor 1.00 1.00 1.00 1.00 1.00 1.09 0.84Incremental Delay, d2 0.2 0.2 4.7 0.2 91.5 0.9 24.0Delay (s) 26.4 27.0 34.4 27.6 132.8 23.6 56.1Level of Service C C C C F C EApproach Delay (s) 26.8 30.2 33.3Approach LOS C C C
Intersection SummaryHCM 2000 Control Delay 27.4 HCM 2000 Level of Service CHCM 2000 Volume to Capacity ratio 0.78Actuated Cycle Length (s) 90.0 Sum of lost time (s) 14.0Intersection Capacity Utilization 110.3% ICU Level of Service HAnalysis Period (min) 15c Critical Lane Group
HCM Signalized Intersection Capacity Analysis Children's Hospital10: MLK Way & 52nd Street DC_2035 AM Plus Phase 2
Fehr & Peers Synchro 8 Report
Movement SBT SBRLane ConfigurationsVolume (vph) 1768 7Ideal Flow (vphpl) 1900 1900Total Lost time (s) 4.5Lane Util. Factor 0.91Frpb, ped/bikes 1.00Flpb, ped/bikes 1.00Frt 1.00Flt Protected 1.00Satd. Flow (prot) 5131Flt Permitted 1.00Satd. Flow (perm) 5131Peak-hour factor, PHF 1.00 1.00Adj. Flow (vph) 1768 7RTOR Reduction (vph) 1 0Lane Group Flow (vph) 1774 0Confl. Peds. (#/hr) 15Confl. Bikes (#/hr) 15Heavy Vehicles (%) 1% 1%Turn Type NAProtected Phases 6Permitted PhasesActuated Green, G (s) 44.8Effective Green, g (s) 44.8Actuated g/C Ratio 0.50Clearance Time (s) 4.5Vehicle Extension (s) 2.0Lane Grp Cap (vph) 2554v/s Ratio Prot 0.35v/s Ratio Permv/c Ratio 0.69Uniform Delay, d1 17.4Progression Factor 0.88Incremental Delay, d2 1.4Delay (s) 16.6Level of Service BApproach Delay (s) 21.0Approach LOS C
Intersection Summary

HCM Signalized Intersection Capacity Analysis Children's Hospital11: 52nd Street & Garage DC_2035 AM Plus Phase 2
Fehr & Peers Synchro 8 Report
Movement EBL EBT EBR WBL WBT WBR NBL NBT NBR SBL SBT SBRLane ConfigurationsVolume (vph) 4 368 5 2 510 2 7 3 5 0 2 15Ideal Flow (vphpl) 1900 1900 1900 1900 1900 1900 1900 1900 1900 1900 1900 1900Total Lost time (s) 3.0 3.0 3.0 3.0Lane Util. Factor 1.00 1.00 1.00 1.00Frpb, ped/bikes 1.00 1.00 0.93 0.99Flpb, ped/bikes 1.00 1.00 1.00 1.00Frt 1.00 1.00 0.95 0.88Flt Protected 1.00 1.00 0.98 1.00Satd. Flow (prot) 1854 1898 1424 1655Flt Permitted 1.00 1.00 0.95 1.00Satd. Flow (perm) 1848 1896 1386 1655Peak-hour factor, PHF 1.00 1.00 1.00 1.00 1.00 1.00 1.00 1.00 1.00 1.00 1.00 1.00Adj. Flow (vph) 4 368 5 2 510 2 7 3 5 0 2 15RTOR Reduction (vph) 0 1 0 0 0 0 0 3 0 0 8 0Lane Group Flow (vph) 0 376 0 0 514 0 0 12 0 0 9 0Confl. Peds. (#/hr) 26 83 83 26 303 303Confl. Bikes (#/hr) 9 8 2Heavy Vehicles (%) 2% 2% 2% 0% 0% 0% 16% 16% 16% 0% 0% 0%Turn Type Perm NA Perm NA Perm NA NAProtected Phases 2 6 4 8Permitted Phases 2 6 4 8Actuated Green, G (s) 21.0 21.0 23.0 23.0Effective Green, g (s) 21.0 21.0 23.0 23.0Actuated g/C Ratio 0.42 0.42 0.46 0.46Clearance Time (s) 3.0 3.0 3.0 3.0Lane Grp Cap (vph) 776 796 637 761v/s Ratio Prot 0.01v/s Ratio Perm 0.20 c0.27 c0.01v/c Ratio 0.48 0.65 0.02 0.01Uniform Delay, d1 10.6 11.5 7.4 7.3Progression Factor 1.00 1.00 1.00 1.00Incremental Delay, d2 2.2 4.0 0.1 0.0Delay (s) 12.7 15.6 7.4 7.4Level of Service B B A AApproach Delay (s) 12.7 15.6 7.4 7.4Approach LOS B B A A
Intersection SummaryHCM 2000 Control Delay 14.1 HCM 2000 Level of Service BHCM 2000 Volume to Capacity ratio 0.32Actuated Cycle Length (s) 50.0 Sum of lost time (s) 6.0Intersection Capacity Utilization 54.0% ICU Level of Service AAnalysis Period (min) 15c Critical Lane Group
HCM Unsignalized Intersection Capacity Analysis Children's Hospital12: 52nd Street & Dover Street DC_2035 AM Plus Phase 2
Fehr & Peers Synchro 8 Report
Movement EBL EBT EBR WBL WBT WBR NBL NBT NBR SBL SBT SBRLane ConfigurationsVolume (veh/h) 12 297 75 45 477 5 36 0 28 2 0 6Sign Control Free Free Stop StopGrade 0% 0% 0% 0%Peak Hour Factor 1.00 1.00 1.00 1.00 1.00 1.00 1.00 1.00 1.00 1.00 1.00 1.00Hourly flow rate (vph) 12 297 75 45 477 5 36 0 28 2 0 6Pedestrians 30 15 18 35Lane Width (ft) 12.0 12.0 12.0 12.0Walking Speed (ft/s) 4.0 4.0 4.0 4.0Percent Blockage 3 1 1 3Right turn flare (veh)Median type None NoneMedian storage veh)Upstream signal (ft) 312 647pX, platoon unblocked 0.81 0.85 0.88 0.88 0.85 0.88 0.88 0.81vC, conflicting volume 517 390 982 984 368 1006 1018 544vC1, stage 1 conf volvC2, stage 2 conf volvCu, unblocked vol 282 201 539 540 174 566 580 316tC, single (s) 4.1 4.1 7.2 6.6 6.3 7.1 6.5 6.2tC, 2 stage (s)tF (s) 2.2 2.2 3.6 4.1 3.4 3.5 4.0 3.3p0 queue free % 99 96 90 100 96 99 100 99cM capacity (veh/h) 999 1159 343 349 705 330 342 557
Direction, Lane # EB 1 WB 1 NB 1 SB 1Volume Total 384 527 64 8Volume Left 12 45 36 2Volume Right 75 5 28 6cSH 999 1159 442 475Volume to Capacity 0.01 0.04 0.14 0.02Queue Length 95th (ft) 1 3 13 1Control Delay (s) 0.4 1.1 14.5 12.7Lane LOS A A B BApproach Delay (s) 0.4 1.1 14.5 12.7Approach LOS B B
Intersection SummaryAverage Delay 1.8Intersection Capacity Utilization 62.4% ICU Level of Service BAnalysis Period (min) 15

HCM Unsignalized Intersection Capacity Analysis Children's Hospital13: SR-24 NB Off-Ramp & 52nd Street DC_2035 AM Plus Phase 2
Fehr & Peers Synchro 8 Report
Movement EBL EBT EBR WBL WBT WBR NBL NBR SEL SERLane ConfigurationsVolume (veh/h) 0 333 0 0 536 1271 0 1100 0 0Sign Control Free Free Stop StopGrade 0% 0% 0% 0%Peak Hour Factor 1.00 1.00 1.00 1.00 1.00 1.00 1.00 1.00 1.00 1.00Hourly flow rate (vph) 0 333 0 0 536 1271 0 1100 0 0Pedestrians 36Lane Width (ft) 12.0Walking Speed (ft/s) 4.0Percent Blockage 3Right turn flare (veh)Median type None NoneMedian storage veh)Upstream signal (ft) 767 192pX, platoon unblocked 0.77 0.77 0.77 0.77vC, conflicting volume 1807 369 2176 202 1802 905vC1, stage 1 conf volvC2, stage 2 conf volvCu, unblocked vol 1449 369 1929 202 1443 276tC, single (s) 4.1 4.1 6.5 7.0 7.5 6.5tC, 2 stage (s)tF (s) 2.2 2.2 4.0 3.3 3.5 4.0p0 queue free % 100 100 100 0 0 100cM capacity (veh/h) 356 1151 49 777 0 470
Direction, Lane # EB 1 EB 2 WB 1 WB 2 WB 3 NB 1 NB 2Volume Total 166 166 357 602 847 550 550Volume Left 0 0 0 0 0 0 0Volume Right 0 0 0 424 847 550 550cSH 1700 1700 1700 1700 1700 777 777Volume to Capacity 0.10 0.10 0.21 0.35 0.50 0.71 0.71Queue Length 95th (ft) 0 0 0 0 0 150 150Control Delay (s) 0.0 0.0 0.0 0.0 0.0 20.0 20.0Lane LOS C CApproach Delay (s) 0.0 0.0 20.0Approach LOS C
Intersection SummaryAverage Delay 6.8Intersection Capacity Utilization 57.2% ICU Level of Service BAnalysis Period (min) 15
HCM Signalized Intersection Capacity Analysis Children's Hospital14: 52nd Street & Shattuck Ave DC_2035 AM Plus Phase 2
Fehr & Peers Synchro 8 Report
Movement EBU EBL EBT EBR WBL WBT WBR NBL NBT NBR SBL SBTLane ConfigurationsVolume (vph) 50 303 920 160 50 1161 150 180 150 60 145 190Ideal Flow (vphpl) 1900 1900 1900 1900 1900 1900 1900 1900 1900 1900 1900 1900Total Lost time (s) 4.0 4.5 4.0 4.5 4.0 5.5 5.5Lane Util. Factor 1.00 0.91 1.00 0.91 1.00 1.00 1.00Frpb, ped/bikes 1.00 0.99 1.00 0.99 1.00 0.99 1.00Flpb, ped/bikes 1.00 1.00 1.00 1.00 1.00 1.00 1.00Frt 1.00 0.98 1.00 0.98 1.00 0.96 1.00Flt Protected 0.95 1.00 0.95 1.00 0.95 1.00 0.98Satd. Flow (prot) 1787 4960 1805 5072 1752 1748 1730Flt Permitted 0.95 1.00 0.95 1.00 0.32 1.00 0.76Satd. Flow (perm) 1787 4960 1805 5072 586 1748 1349Peak-hour factor, PHF 1.00 1.00 1.00 1.00 1.00 1.00 1.00 1.00 1.00 1.00 1.00 1.00Adj. Flow (vph) 50 303 920 160 50 1161 150 180 150 60 145 190RTOR Reduction (vph) 0 0 25 0 0 17 0 0 16 0 0 0Lane Group Flow (vph) 0 353 1055 0 50 1294 0 180 194 0 0 335Confl. Peds. (#/hr) 18 8 15 15Confl. Bikes (#/hr) 18 2 15Heavy Vehicles (%) 1% 1% 1% 1% 0% 0% 0% 3% 3% 3% 7% 7%Turn Type Prot Prot NA Prot NA pm+pt NA Perm NAProtected Phases 7 7 4 3 8 5 2 6Permitted Phases 2 6Actuated Green, G (s) 19.0 37.1 3.6 21.7 35.3 35.3 26.3Effective Green, g (s) 19.0 37.1 3.6 21.7 35.3 35.3 26.3Actuated g/C Ratio 0.21 0.41 0.04 0.24 0.39 0.39 0.29Clearance Time (s) 4.0 4.5 4.0 4.5 4.0 5.5 5.5Vehicle Extension (s) 3.0 3.0 3.0 3.0 3.0 3.0 3.0Lane Grp Cap (vph) 377 2044 72 1222 294 685 394v/s Ratio Prot c0.20 0.21 0.03 c0.26 c0.03 0.11v/s Ratio Perm 0.21 c0.25v/c Ratio 0.94 0.52 0.69 1.06 0.61 0.28 0.85Uniform Delay, d1 34.9 19.7 42.7 34.1 21.7 18.7 30.0Progression Factor 1.00 1.00 1.01 0.88 1.00 1.00 1.00Incremental Delay, d2 32.8 0.9 17.3 38.3 3.7 1.0 20.0Delay (s) 67.7 20.7 60.6 68.4 25.4 19.7 50.0Level of Service E C E E C B DApproach Delay (s) 32.3 68.2 22.4 38.5Approach LOS C E C D
Intersection SummaryHCM 2000 Control Delay 44.9 HCM 2000 Level of Service DHCM 2000 Volume to Capacity ratio 0.92Actuated Cycle Length (s) 90.0 Sum of lost time (s) 18.0Intersection Capacity Utilization 112.2% ICU Level of Service HAnalysis Period (min) 15c Critical Lane Group

HCM Signalized Intersection Capacity Analysis Children's Hospital14: 52nd Street & Shattuck Ave DC_2035 AM Plus Phase 2
Fehr & Peers Synchro 8 Report
Movement SBRLane ConfigurationsVolume (vph) 416Ideal Flow (vphpl) 1900Total Lost time (s) 5.5Lane Util. Factor 1.00Frpb, ped/bikes 0.92Flpb, ped/bikes 1.00Frt 0.85Flt Protected 1.00Satd. Flow (prot) 1387Flt Permitted 1.00Satd. Flow (perm) 1387Peak-hour factor, PHF 1.00Adj. Flow (vph) 416RTOR Reduction (vph) 240Lane Group Flow (vph) 176Confl. Peds. (#/hr) 24Confl. Bikes (#/hr) 62Heavy Vehicles (%) 7%Turn Type PermProtected PhasesPermitted Phases 6Actuated Green, G (s) 26.3Effective Green, g (s) 26.3Actuated g/C Ratio 0.29Clearance Time (s) 5.5Vehicle Extension (s) 3.0Lane Grp Cap (vph) 405v/s Ratio Protv/s Ratio Perm 0.13v/c Ratio 0.43Uniform Delay, d1 25.8Progression Factor 1.00Incremental Delay, d2 3.4Delay (s) 29.2Level of Service CApproach Delay (s)Approach LOS
Intersection Summary
HCM Signalized Intersection Capacity Analysis Children's Hospital15: Telegraph Ave & 52nd Street/Claremont Ave DC_2035 AM Plus Phase 2
Fehr & Peers Synchro 8 Report
Movement EBL EBT EBR WBL WBT WBR NBL NBT NBR SBL SBT SBRLane ConfigurationsVolume (vph) 10 10 10 120 70 230 10 1010 140 130 900 500Ideal Flow (vphpl) 1900 1900 1900 1900 1900 1900 1900 1900 1900 1900 1900 1900Lane Width 12 12 12 12 12 12 12 16 12 12 12 12Total Lost time (s) 4.5 4.5 4.5 4.5 4.5 4.5Lane Util. Factor 1.00 0.95 0.95 0.95 1.00 0.95Frpb, ped/bikes 0.99 1.00 0.98 0.99 1.00 0.96Flpb, ped/bikes 1.00 1.00 1.00 1.00 1.00 1.00Frt 0.95 1.00 0.89 0.98 1.00 0.95Flt Protected 0.98 0.95 1.00 1.00 0.95 1.00Satd. Flow (prot) 1641 1698 1560 3863 1770 3202Flt Permitted 0.98 0.95 1.00 0.94 0.95 1.00Satd. Flow (perm) 1641 1698 1560 3625 1770 3202Peak-hour factor, PHF 1.00 1.00 1.00 1.00 1.00 1.00 1.00 1.00 1.00 1.00 1.00 1.00Adj. Flow (vph) 10 10 10 120 70 230 10 1010 140 130 900 500RTOR Reduction (vph) 0 10 0 0 129 0 0 9 0 0 61 0Lane Group Flow (vph) 0 21 0 108 183 0 0 1151 0 130 1339 0Confl. Peds. (#/hr) 6 6 33 27 33Confl. Bikes (#/hr) 2 3 50 41Heavy Vehicles (%) 8% 8% 8% 1% 1% 1% 3% 3% 3% 2% 2% 2%Turn Type Split NA Split NA Perm NA Prot NAProtected Phases 4 4 8 8 2 1 6Permitted Phases 2Actuated Green, G (s) 4.5 17.1 17.1 40.6 9.8 54.9Effective Green, g (s) 4.5 17.1 17.1 40.6 9.8 54.9Actuated g/C Ratio 0.05 0.19 0.19 0.45 0.11 0.61Clearance Time (s) 4.5 4.5 4.5 4.5 4.5 4.5Vehicle Extension (s) 3.0 3.0 3.0 3.0 3.0 3.0Lane Grp Cap (vph) 82 322 296 1635 192 1953v/s Ratio Prot c0.01 0.06 c0.12 0.07 c0.42v/s Ratio Perm 0.32v/c Ratio 0.25 0.34 0.62 0.70 0.68 0.69Uniform Delay, d1 41.1 31.5 33.5 19.9 38.6 11.8Progression Factor 1.49 1.00 1.00 0.94 1.00 1.00Incremental Delay, d2 0.8 0.6 3.8 1.8 9.1 2.0Delay (s) 62.0 32.2 37.3 20.5 47.7 13.7Level of Service E C D C D BApproach Delay (s) 62.0 36.0 20.5 16.6Approach LOS E D C B
Intersection SummaryHCM 2000 Control Delay 21.1 HCM 2000 Level of Service CHCM 2000 Volume to Capacity ratio 0.69Actuated Cycle Length (s) 90.0 Sum of lost time (s) 18.0Intersection Capacity Utilization 102.1% ICU Level of Service GAnalysis Period (min) 15c Critical Lane Group

HCM Signalized Intersection Capacity Analysis Children's Hospital16: Telegraph Ave & 51St Street DC_2035 AM Plus Phase 2
Fehr & Peers Synchro 8 Report
Movement EBL EBT EBR WBL WBT WBR NBL NBT NBR SBL SBT SBRLane ConfigurationsVolume (vph) 330 662 103 130 594 320 137 510 80 220 740 70Ideal Flow (vphpl) 1900 1900 1900 1900 1900 1900 1900 1900 1900 1900 1900 1900Total Lost time (s) 4.0 4.0 4.0 3.5 4.0 4.5 4.0 3.5Lane Util. Factor 0.97 0.95 1.00 0.95 1.00 0.95 1.00 0.95Frpb, ped/bikes 1.00 0.99 1.00 0.97 1.00 0.99 1.00 0.99Flpb, ped/bikes 1.00 1.00 1.00 1.00 1.00 1.00 1.00 1.00Frt 1.00 0.98 1.00 0.95 1.00 0.98 1.00 0.99Flt Protected 0.95 1.00 0.95 1.00 0.95 1.00 0.95 1.00Satd. Flow (prot) 3400 3397 1787 3293 1719 3324 1752 3420Flt Permitted 0.95 1.00 0.95 1.00 0.95 1.00 0.95 1.00Satd. Flow (perm) 3400 3397 1787 3293 1719 3324 1752 3420Peak-hour factor, PHF 1.00 1.00 1.00 1.00 1.00 1.00 1.00 1.00 1.00 1.00 1.00 1.00Adj. Flow (vph) 330 662 103 130 594 320 137 510 80 220 740 70RTOR Reduction (vph) 0 14 0 0 80 0 0 13 0 0 8 0Lane Group Flow (vph) 330 751 0 130 834 0 137 577 0 220 802 0Confl. Peds. (#/hr) 47 47 45 56Confl. Bikes (#/hr) 14 11 41 41Heavy Vehicles (%) 3% 3% 3% 1% 1% 1% 5% 5% 5% 3% 3% 3%Turn Type Prot NA Prot NA Prot NA Prot NAProtected Phases 7 4 3 8 5 2 1 6Permitted PhasesActuated Green, G (s) 12.9 27.3 10.6 25.5 10.8 23.6 12.0 25.8Effective Green, g (s) 12.9 27.3 10.6 25.5 10.8 23.6 12.0 25.8Actuated g/C Ratio 0.14 0.30 0.12 0.28 0.12 0.26 0.13 0.29Clearance Time (s) 4.0 4.0 4.0 3.5 4.0 4.5 4.0 3.5Vehicle Extension (s) 3.0 3.0 3.0 3.0 3.0 3.0 3.0 3.0Lane Grp Cap (vph) 487 1030 210 933 206 871 233 980v/s Ratio Prot c0.10 0.22 0.07 c0.25 0.08 0.17 c0.13 c0.23v/s Ratio Permv/c Ratio 0.68 0.73 0.62 0.89 0.67 0.66 0.94 0.82Uniform Delay, d1 36.6 28.0 37.8 31.0 37.9 29.6 38.7 29.9Progression Factor 1.26 0.82 1.00 1.00 1.00 1.00 1.24 0.84Incremental Delay, d2 3.2 3.9 5.3 12.9 7.8 3.9 37.3 6.0Delay (s) 49.3 26.9 43.1 43.8 45.7 33.6 85.2 31.1Level of Service D C D D D C F CApproach Delay (s) 33.7 43.7 35.9 42.7Approach LOS C D D D
Intersection SummaryHCM 2000 Control Delay 39.2 HCM 2000 Level of Service DHCM 2000 Volume to Capacity ratio 0.86Actuated Cycle Length (s) 90.0 Sum of lost time (s) 16.5Intersection Capacity Utilization 81.7% ICU Level of Service DAnalysis Period (min) 15c Critical Lane Group
HCM Signalized Intersection Capacity Analysis Children's Hospital17: SB SR-24 On-Ramp & MLK Way & NB SR-24 Off-Ramp DC_2035 AM Plus Phase 2
Fehr & Peers Synchro 8 Report
Movement EBL EBT EBR WBL WBT WBR NBL NBT NBR SBL SBT SBRLane ConfigurationsVolume (vph) 263 0 0 0 0 1644 0 0 0 0 1737 262Ideal Flow (vphpl) 1900 1900 1900 1900 1900 1900 1900 1900 1900 1900 1900 1900Total Lost time (s) 4.0 4.0 4.0 4.0Lane Util. Factor 0.97 1.00 0.95 0.88Frpb, ped/bikes 1.00 1.00 1.00 1.00Flpb, ped/bikes 1.00 1.00 1.00 1.00Frt 1.00 0.86 1.00 0.85Flt Protected 0.95 1.00 1.00 1.00Satd. Flow (prot) 3273 1627 3574 2814Flt Permitted 0.95 1.00 1.00 1.00Satd. Flow (perm) 3273 1627 3574 2814Peak-hour factor, PHF 1.00 1.00 1.00 1.00 1.00 1.00 1.00 1.00 1.00 1.00 1.00 1.00Adj. Flow (vph) 263 0 0 0 0 1644 0 0 0 0 1737 262RTOR Reduction (vph) 0 0 0 0 0 0 0 0 0 0 0 0Lane Group Flow (vph) 263 0 0 0 0 1644 0 0 0 0 1737 262Confl. Peds. (#/hr) 9Confl. Bikes (#/hr) 3Heavy Vehicles (%) 7% 7% 2% 2% 1% 1% 2% 2% 2% 2% 1% 1%Turn Type Prot Free NA customProtected Phases 2 6 FreePermitted Phases FreeActuated Green, G (s) 8.0 45.0 29.0 45.0Effective Green, g (s) 8.0 45.0 29.0 45.0Actuated g/C Ratio 0.18 1.00 0.64 1.00Clearance Time (s) 4.0 4.0Lane Grp Cap (vph) 581 1627 2303 2814v/s Ratio Prot 0.08 0.49 0.09v/s Ratio Perm c1.01v/c Ratio 0.45 1.01 0.75 0.09Uniform Delay, d1 16.5 22.5 5.5 0.0Progression Factor 1.00 1.00 2.06 1.00Incremental Delay, d2 2.5 24.9 1.7 0.0Delay (s) 19.1 47.4 13.1 0.0Level of Service B D B AApproach Delay (s) 19.1 47.4 0.0 11.4Approach LOS B D A B
Intersection SummaryHCM 2000 Control Delay 27.1 HCM 2000 Level of Service CHCM 2000 Volume to Capacity ratio 1.23Actuated Cycle Length (s) 45.0 Sum of lost time (s) 8.0Intersection Capacity Utilization 62.2% ICU Level of Service BAnalysis Period (min) 15c Critical Lane Group

HCM Unsignalized Intersection Capacity Analysis Children's Hospital18: West Street & 52nd Street DC_2035 AM Plus Phase 2
Fehr & Peers Synchro 8 Report
Movement EBL EBT EBR WBL WBT WBR NBL NBT NBR SBL SBT SBRLane ConfigurationsSign Control Stop Stop Stop StopVolume (vph) 0 193 20 80 132 0 40 0 80 10 60 10Peak Hour Factor 1.00 1.00 1.00 1.00 1.00 1.00 1.00 1.00 1.00 1.00 1.00 1.00Hourly flow rate (vph) 0 193 20 80 132 0 40 0 80 10 60 10
Direction, Lane # EB 1 WB 1 NB 1 NB 2 SB 1Volume Total (vph) 213 212 40 80 80Volume Left (vph) 0 80 40 0 10Volume Right (vph) 20 0 0 80 10Hadj (s) -0.04 0.11 0.50 -0.70 -0.02Departure Headway (s) 4.7 4.8 6.1 4.9 5.2Degree Utilization, x 0.28 0.28 0.07 0.11 0.12Capacity (veh/h) 729 712 544 667 626Control Delay (s) 9.4 9.7 8.4 7.3 8.9Approach Delay (s) 9.4 9.7 7.7 8.9Approach LOS A A A A
Intersection SummaryDelay 9.1Level of Service AIntersection Capacity Utilization 44.9% ICU Level of Service AAnalysis Period (min) 15
HCM Unsignalized Intersection Capacity Analysis Children's Hospital19: Genoa Street & 52nd Street DC_2035 AM Plus Phase 2
Fehr & Peers Synchro 8 Report
Movement EBL EBT EBR WBL WBT WBR NBL NBT NBR SBL SBT SBRLane ConfigurationsSign Control Stop Stop Stop StopVolume (vph) 20 173 10 10 142 30 10 10 10 30 10 10Peak Hour Factor 1.00 1.00 1.00 1.00 1.00 1.00 1.00 1.00 1.00 1.00 1.00 1.00Hourly flow rate (vph) 20 173 10 10 142 30 10 10 10 30 10 10
Direction, Lane # EB 1 WB 1 NB 1 SB 1Volume Total (vph) 203 182 30 50Volume Left (vph) 20 10 10 30Volume Right (vph) 10 30 10 10Hadj (s) 0.01 -0.09 -0.13 0.00Departure Headway (s) 4.3 4.2 4.7 4.8Degree Utilization, x 0.24 0.21 0.04 0.07Capacity (veh/h) 816 819 702 686Control Delay (s) 8.7 8.4 7.9 8.1Approach Delay (s) 8.7 8.4 7.9 8.1Approach LOS A A A A
Intersection SummaryDelay 8.4Level of Service AIntersection Capacity Utilization 28.8% ICU Level of Service AAnalysis Period (min) 15
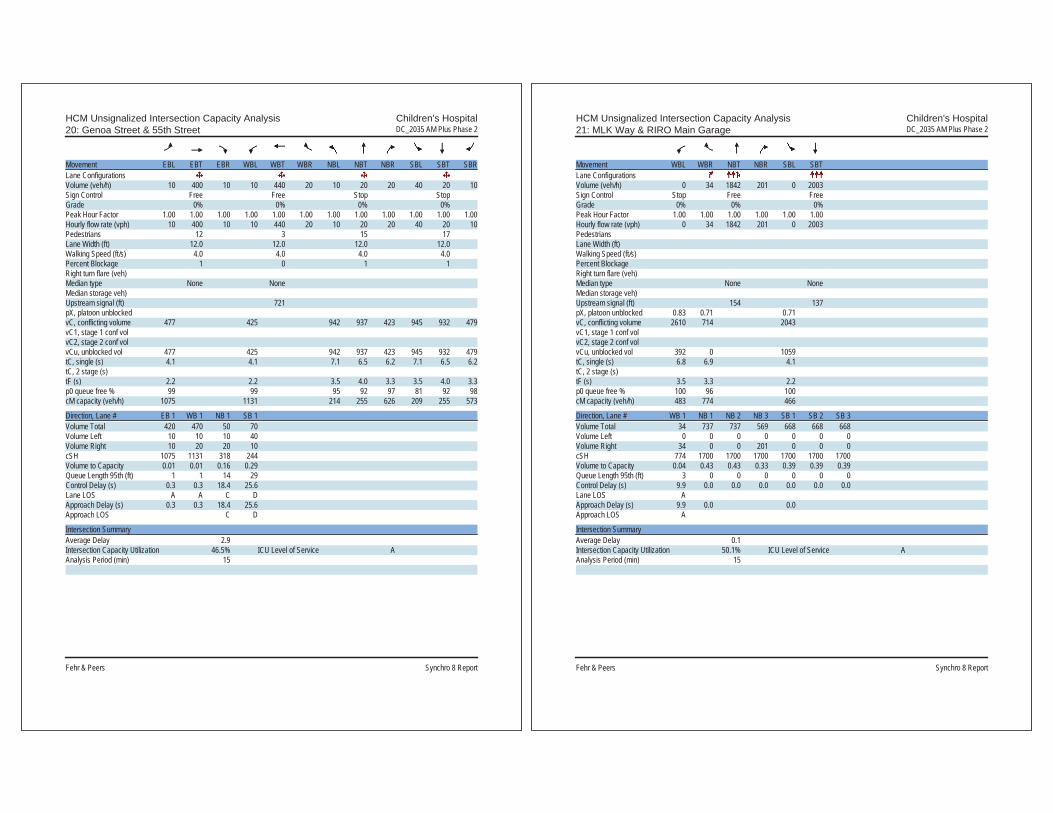
HCM Unsignalized Intersection Capacity Analysis Children's Hospital20: Genoa Street & 55th Street DC_2035 AM Plus Phase 2
Fehr & Peers Synchro 8 Report
Movement EBL EBT EBR WBL WBT WBR NBL NBT NBR SBL SBT SBRLane ConfigurationsVolume (veh/h) 10 400 10 10 440 20 10 20 20 40 20 10Sign Control Free Free Stop StopGrade 0% 0% 0% 0%Peak Hour Factor 1.00 1.00 1.00 1.00 1.00 1.00 1.00 1.00 1.00 1.00 1.00 1.00Hourly flow rate (vph) 10 400 10 10 440 20 10 20 20 40 20 10Pedestrians 12 3 15 17Lane Width (ft) 12.0 12.0 12.0 12.0Walking Speed (ft/s) 4.0 4.0 4.0 4.0Percent Blockage 1 0 1 1Right turn flare (veh)Median type None NoneMedian storage veh)Upstream signal (ft) 721pX, platoon unblockedvC, conflicting volume 477 425 942 937 423 945 932 479vC1, stage 1 conf volvC2, stage 2 conf volvCu, unblocked vol 477 425 942 937 423 945 932 479tC, single (s) 4.1 4.1 7.1 6.5 6.2 7.1 6.5 6.2tC, 2 stage (s)tF (s) 2.2 2.2 3.5 4.0 3.3 3.5 4.0 3.3p0 queue free % 99 99 95 92 97 81 92 98cM capacity (veh/h) 1075 1131 214 255 626 209 255 573
Direction, Lane # EB 1 WB 1 NB 1 SB 1Volume Total 420 470 50 70Volume Left 10 10 10 40Volume Right 10 20 20 10cSH 1075 1131 318 244Volume to Capacity 0.01 0.01 0.16 0.29Queue Length 95th (ft) 1 1 14 29Control Delay (s) 0.3 0.3 18.4 25.6Lane LOS A A C DApproach Delay (s) 0.3 0.3 18.4 25.6Approach LOS C D
Intersection SummaryAverage Delay 2.9Intersection Capacity Utilization 46.5% ICU Level of Service AAnalysis Period (min) 15
HCM Unsignalized Intersection Capacity Analysis Children's Hospital21: MLK Way & RIRO Main Garage DC_2035 AM Plus Phase 2
Fehr & Peers Synchro 8 Report
Movement WBL WBR NBT NBR SBL SBTLane ConfigurationsVolume (veh/h) 0 34 1842 201 0 2003Sign Control Stop Free FreeGrade 0% 0% 0%Peak Hour Factor 1.00 1.00 1.00 1.00 1.00 1.00Hourly flow rate (vph) 0 34 1842 201 0 2003PedestriansLane Width (ft)Walking Speed (ft/s)Percent BlockageRight turn flare (veh)Median type None NoneMedian storage veh)Upstream signal (ft) 154 137pX, platoon unblocked 0.83 0.71 0.71vC, conflicting volume 2610 714 2043vC1, stage 1 conf volvC2, stage 2 conf volvCu, unblocked vol 392 0 1059tC, single (s) 6.8 6.9 4.1tC, 2 stage (s)tF (s) 3.5 3.3 2.2p0 queue free % 100 96 100cM capacity (veh/h) 483 774 466
Direction, Lane # WB 1 NB 1 NB 2 NB 3 SB 1 SB 2 SB 3Volume Total 34 737 737 569 668 668 668Volume Left 0 0 0 0 0 0 0Volume Right 34 0 0 201 0 0 0cSH 774 1700 1700 1700 1700 1700 1700Volume to Capacity 0.04 0.43 0.43 0.33 0.39 0.39 0.39Queue Length 95th (ft) 3 0 0 0 0 0 0Control Delay (s) 9.9 0.0 0.0 0.0 0.0 0.0 0.0Lane LOS AApproach Delay (s) 9.9 0.0 0.0Approach LOS A
Intersection SummaryAverage Delay 0.1Intersection Capacity Utilization 50.1% ICU Level of Service AAnalysis Period (min) 15
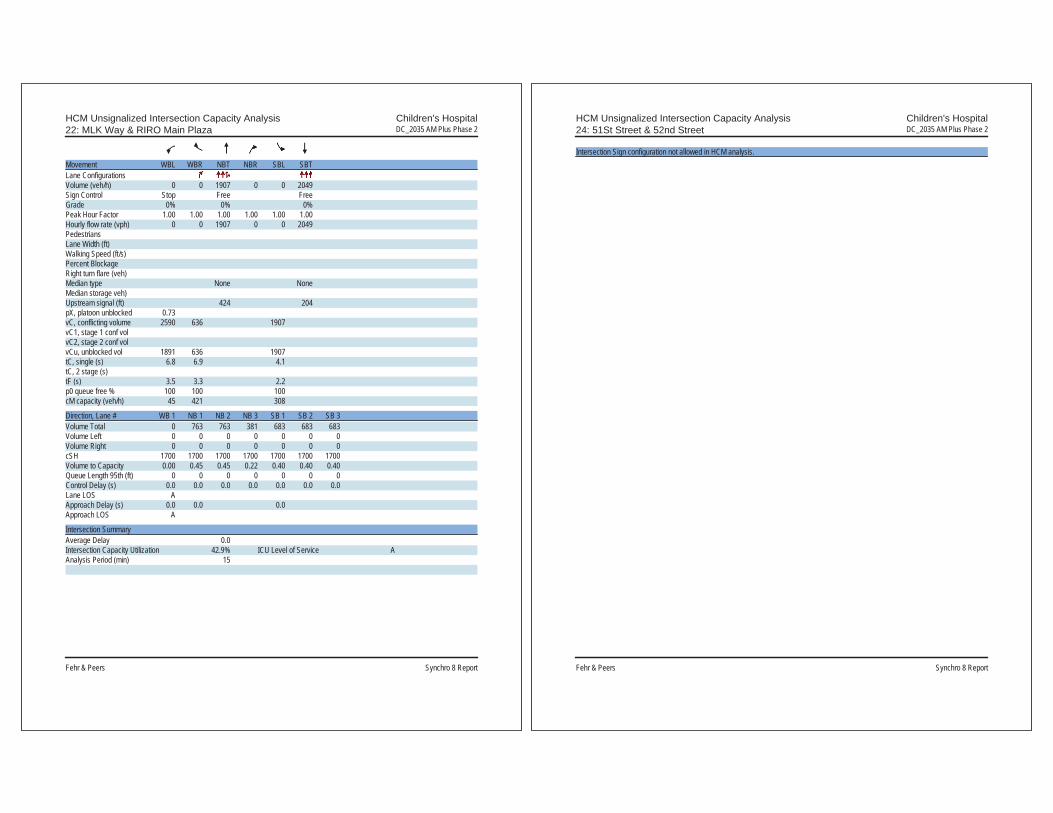
HCM Unsignalized Intersection Capacity Analysis Children's Hospital22: MLK Way & RIRO Main Plaza DC_2035 AM Plus Phase 2
Fehr & Peers Synchro 8 Report
Movement WBL WBR NBT NBR SBL SBTLane ConfigurationsVolume (veh/h) 0 0 1907 0 0 2049Sign Control Stop Free FreeGrade 0% 0% 0%Peak Hour Factor 1.00 1.00 1.00 1.00 1.00 1.00Hourly flow rate (vph) 0 0 1907 0 0 2049PedestriansLane Width (ft)Walking Speed (ft/s)Percent BlockageRight turn flare (veh)Median type None NoneMedian storage veh)Upstream signal (ft) 424 204pX, platoon unblocked 0.73vC, conflicting volume 2590 636 1907vC1, stage 1 conf volvC2, stage 2 conf volvCu, unblocked vol 1891 636 1907tC, single (s) 6.8 6.9 4.1tC, 2 stage (s)tF (s) 3.5 3.3 2.2p0 queue free % 100 100 100cM capacity (veh/h) 45 421 308
Direction, Lane # WB 1 NB 1 NB 2 NB 3 SB 1 SB 2 SB 3Volume Total 0 763 763 381 683 683 683Volume Left 0 0 0 0 0 0 0Volume Right 0 0 0 0 0 0 0cSH 1700 1700 1700 1700 1700 1700 1700Volume to Capacity 0.00 0.45 0.45 0.22 0.40 0.40 0.40Queue Length 95th (ft) 0 0 0 0 0 0 0Control Delay (s) 0.0 0.0 0.0 0.0 0.0 0.0 0.0Lane LOS AApproach Delay (s) 0.0 0.0 0.0Approach LOS A
Intersection SummaryAverage Delay 0.0Intersection Capacity Utilization 42.9% ICU Level of Service AAnalysis Period (min) 15
HCM Unsignalized Intersection Capacity Analysis Children's Hospital24: 51St Street & 52nd Street DC_2035 AM Plus Phase 2
Fehr & Peers Synchro 8 Report
Intersection Sign configuration not allowed in HCM analysis.

HCM Signalized Intersection Capacity Analysis Children's Hospital 1: MLK Way & 55th Street DC_2035 PM Plus Phase 2
Fehr & Peers Synchro 8 Report
Movement EBL EBT EBR WBL WBT WBR NBU NBL NBT NBR SBL SBTLane ConfigurationsVolume (vph) 20 270 180 60 240 110 29 211 1783 166 200 1474Ideal Flow (vphpl) 1900 1900 1900 1900 1900 1900 1900 1900 1900 1900 1900 1900Total Lost time (s) 5.0 5.0 4.5 5.0 4.5 5.0Lane Util. Factor 1.00 1.00 1.00 0.91 1.00 0.91Frpb, ped/bikes 0.98 0.99 1.00 0.99 1.00 1.00Flpb, ped/bikes 1.00 1.00 1.00 1.00 1.00 1.00Frt 0.95 0.96 1.00 0.99 1.00 1.00Flt Protected 1.00 0.99 0.95 1.00 0.95 1.00Satd. Flow (prot) 1747 1728 1770 4975 1770 5054Flt Permitted 0.97 0.75 0.95 1.00 0.95 1.00Satd. Flow (perm) 1707 1310 1770 4975 1770 5054Peak-hour factor, PHF 1.00 1.00 1.00 1.00 1.00 1.00 1.00 1.00 1.00 1.00 1.00 1.00Adj. Flow (vph) 20 270 180 60 240 110 29 211 1783 166 200 1474RTOR Reduction (vph) 0 23 0 0 14 0 0 0 10 0 0 3Lane Group Flow (vph) 0 447 0 0 396 0 0 240 1939 0 200 1511Confl. Peds. (#/hr) 17 23 23 17 30Confl. Bikes (#/hr) 24 18 23Heavy Vehicles (%) 1% 1% 1% 4% 4% 4% 2% 2% 2% 2% 2% 2%Turn Type Perm NA Perm NA Prot Prot NA Prot NAProtected Phases 4 8 5 5 2 1 6Permitted Phases 4 8Actuated Green, G (s) 31.7 31.7 21.5 42.3 11.5 32.3Effective Green, g (s) 31.7 31.7 21.5 42.3 11.5 32.3Actuated g/C Ratio 0.32 0.32 0.22 0.42 0.12 0.32Clearance Time (s) 5.0 5.0 4.5 5.0 4.5 5.0Vehicle Extension (s) 3.0 3.0 3.0 3.0 3.0 3.0Lane Grp Cap (vph) 541 415 380 2104 203 1632v/s Ratio Prot 0.14 c0.39 0.11 c0.30v/s Ratio Perm 0.26 c0.30v/c Ratio 0.83 0.96 0.63 0.92 0.99 0.93Uniform Delay, d1 31.6 33.5 35.7 27.3 44.2 32.7Progression Factor 1.00 1.00 0.56 0.43 1.00 1.00Incremental Delay, d2 10.0 32.5 2.7 6.7 58.5 10.5Delay (s) 41.6 66.0 22.6 18.4 102.6 43.2Level of Service D E C B F DApproach Delay (s) 41.6 66.0 18.9 50.1Approach LOS D E B D
Intersection SummaryHCM 2000 Control Delay 36.3 HCM 2000 Level of Service DHCM 2000 Volume to Capacity ratio 0.96Actuated Cycle Length (s) 100.0 Sum of lost time (s) 14.5Intersection Capacity Utilization 106.4% ICU Level of Service GAnalysis Period (min) 15c Critical Lane Group
HCM Signalized Intersection Capacity Analysis Children's Hospital 1: MLK Way & 55th Street DC_2035 PM Plus Phase 2
Fehr & Peers Synchro 8 Report
Movement SBRLane ConfigurationsVolume (vph) 40Ideal Flow (vphpl) 1900Total Lost time (s)Lane Util. FactorFrpb, ped/bikesFlpb, ped/bikesFrtFlt ProtectedSatd. Flow (prot)Flt PermittedSatd. Flow (perm)Peak-hour factor, PHF 1.00Adj. Flow (vph) 40RTOR Reduction (vph) 0Lane Group Flow (vph) 0Confl. Peds. (#/hr) 18Confl. Bikes (#/hr) 23Heavy Vehicles (%) 2%Turn TypeProtected PhasesPermitted PhasesActuated Green, G (s)Effective Green, g (s)Actuated g/C RatioClearance Time (s)Vehicle Extension (s)Lane Grp Cap (vph)v/s Ratio Protv/s Ratio Permv/c RatioUniform Delay, d1Progression FactorIncremental Delay, d2Delay (s)Level of ServiceApproach Delay (s)Approach LOS
Intersection Summary

HCM Unsignalized Intersection Capacity Analysis Children's Hospital 2: Dover Street & 55th Street DC_2035 PM Plus Phase 2
Fehr & Peers Synchro 8 Report
Movement EBL EBT EBR WBL WBT WBR NBL NBT NBR SBL SBT SBRLane ConfigurationsVolume (veh/h) 30 586 20 10 330 20 20 20 30 20 20 40Sign Control Free Free Stop StopGrade 0% 0% 0% 0%Peak Hour Factor 1.00 1.00 1.00 1.00 1.00 1.00 1.00 1.00 1.00 1.00 1.00 1.00Hourly flow rate (vph) 30 586 20 10 330 20 20 20 30 20 20 40Pedestrians 6 20 11 26Lane Width (ft) 12.0 12.0 12.0 12.0Walking Speed (ft/s) 4.0 4.0 4.0 4.0Percent Blockage 1 2 1 2Right turn flare (veh)Median type None NoneMedian storage veh)Upstream signal (ft) 641 677pX, platoon unblocked 0.96 0.96 0.96 0.96 0.96 0.96vC, conflicting volume 376 617 1083 1063 627 1102 1063 372vC1, stage 1 conf volvC2, stage 2 conf volvCu, unblocked vol 329 617 1065 1045 627 1085 1045 325tC, single (s) 4.1 4.1 7.1 6.5 6.2 7.1 6.5 6.2tC, 2 stage (s)tF (s) 2.2 2.2 3.5 4.0 3.3 3.5 4.0 3.3p0 queue free % 97 99 87 90 94 86 90 94cM capacity (veh/h) 1140 945 158 207 475 147 204 667
Direction, Lane # EB 1 WB 1 NB 1 SB 1Volume Total 636 360 70 80Volume Left 30 10 20 20Volume Right 20 20 30 40cSH 1140 945 244 272Volume to Capacity 0.03 0.01 0.29 0.29Queue Length 95th (ft) 2 1 29 30Control Delay (s) 0.7 0.4 25.6 23.6Lane LOS A A D CApproach Delay (s) 0.7 0.4 25.6 23.6Approach LOS D C
Intersection SummaryAverage Delay 3.7Intersection Capacity Utilization 62.2% ICU Level of Service BAnalysis Period (min) 15
HCM Signalized Intersection Capacity Analysis Children's Hospital 3: 55th Street & Shattuck Ave DC_2035 PM Plus Phase 2
Fehr & Peers Synchro 8 Report
Movement EBL EBT EBR WBL WBT WBR NBL NBT NBR SBL SBT SBRLane ConfigurationsVolume (vph) 110 446 70 32 210 50 80 630 56 30 580 60Ideal Flow (vphpl) 1900 1900 1900 1900 1900 1900 1900 1900 1900 1900 1900 1900Total Lost time (s) 3.0 3.0 5.0 5.0Lane Util. Factor 1.00 1.00 1.00 1.00Frpb, ped/bikes 0.99 0.99 1.00 0.99Flpb, ped/bikes 1.00 1.00 1.00 1.00Frt 0.98 0.98 0.99 0.99Flt Protected 0.99 0.99 0.99 1.00Satd. Flow (prot) 1750 1773 1825 1843Flt Permitted 0.86 0.90 0.88 0.95Satd. Flow (perm) 1517 1601 1612 1756Peak-hour factor, PHF 1.00 1.00 1.00 1.00 1.00 1.00 1.00 1.00 1.00 1.00 1.00 1.00Adj. Flow (vph) 110 446 70 32 210 50 80 630 56 30 580 60RTOR Reduction (vph) 0 6 0 0 10 0 0 4 0 0 5 0Lane Group Flow (vph) 0 620 0 0 282 0 0 762 0 0 665 0Confl. Peds. (#/hr) 17 17 17 17 29 11 11 29Confl. Bikes (#/hr) 23 15 47 33Heavy Vehicles (%) 5% 5% 5% 3% 3% 3% 2% 2% 2% 1% 1% 1%Turn Type Perm NA Perm NA Perm NA Perm NAProtected Phases 2 6 4 8Permitted Phases 2 6 4 4 8Actuated Green, G (s) 29.0 29.0 43.0 43.0Effective Green, g (s) 29.0 29.0 43.0 43.0Actuated g/C Ratio 0.36 0.36 0.54 0.54Clearance Time (s) 3.0 3.0 5.0 5.0Lane Grp Cap (vph) 549 580 866 943v/s Ratio Protv/s Ratio Perm c0.41 0.18 c0.47 0.38v/c Ratio 1.13 0.49 0.88 0.71Uniform Delay, d1 25.5 19.7 16.2 13.8Progression Factor 1.00 1.00 1.00 1.00Incremental Delay, d2 79.4 2.9 12.4 4.4Delay (s) 104.9 22.7 28.7 18.2Level of Service F C C BApproach Delay (s) 104.9 22.7 28.7 18.2Approach LOS F C C B
Intersection SummaryHCM 2000 Control Delay 45.2 HCM 2000 Level of Service DHCM 2000 Volume to Capacity ratio 0.98Actuated Cycle Length (s) 80.0 Sum of lost time (s) 8.0Intersection Capacity Utilization 128.0% ICU Level of Service HAnalysis Period (min) 15c Critical Lane Group

HCM Signalized Intersection Capacity Analysis Children's Hospital 4: 55th Street & Telegraph Ave DC_2035 PM Plus Phase 2
Fehr & Peers Synchro 8 Report
Movement EBL EBT EBR WBL WBT WBR NBL NBT NBR SBL SBT SBRLane ConfigurationsVolume (vph) 321 30 171 50 20 20 130 1216 70 20 1136 122Ideal Flow (vphpl) 1900 1900 1900 1900 1900 1900 1900 1900 1900 1900 1900 1900Total Lost time (s) 4.5 4.5 4.5 4.5 4.5 4.5Lane Util. Factor 1.00 1.00 1.00 0.95 1.00 0.95Frpb, ped/bikes 0.98 0.99 1.00 0.99 1.00 0.98Flpb, ped/bikes 0.99 0.99 1.00 1.00 1.00 1.00Frt 0.96 0.97 1.00 0.99 1.00 0.99Flt Protected 0.97 0.97 0.95 1.00 0.95 1.00Satd. Flow (prot) 1626 1696 1770 3489 1787 3468Flt Permitted 0.78 0.71 0.12 1.00 0.11 1.00Satd. Flow (perm) 1300 1246 219 3489 206 3468Peak-hour factor, PHF 1.00 1.00 1.00 1.00 1.00 1.00 1.00 1.00 1.00 1.00 1.00 1.00Adj. Flow (vph) 321 30 171 50 20 20 130 1216 70 20 1136 122RTOR Reduction (vph) 0 19 0 0 12 0 0 4 0 0 9 0Lane Group Flow (vph) 0 503 0 0 78 0 130 1282 0 20 1249 0Confl. Peds. (#/hr) 17 39 39 17 38 26 26 38Confl. Bikes (#/hr) 12 14 44 68Heavy Vehicles (%) 5% 5% 5% 4% 4% 4% 2% 2% 2% 1% 1% 1%Turn Type Perm NA Perm NA Perm NA Perm NAProtected Phases 4 8 2 6Permitted Phases 4 8 2 6Actuated Green, G (s) 35.5 35.5 45.5 45.5 45.5 45.5Effective Green, g (s) 35.5 35.5 45.5 45.5 45.5 45.5Actuated g/C Ratio 0.39 0.39 0.51 0.51 0.51 0.51Clearance Time (s) 4.5 4.5 4.5 4.5 4.5 4.5Vehicle Extension (s) 3.0 3.0 3.0 3.0 3.0 3.0Lane Grp Cap (vph) 512 491 110 1763 104 1753v/s Ratio Prot 0.37 0.36v/s Ratio Perm c0.39 0.06 c0.59 0.10v/c Ratio 0.98 0.16 1.18 0.73 0.19 0.71Uniform Delay, d1 26.9 17.6 22.2 17.4 12.2 17.2Progression Factor 1.00 1.00 1.00 1.00 1.00 1.00Incremental Delay, d2 34.9 0.2 142.8 2.7 4.1 2.5Delay (s) 61.8 17.8 165.0 20.1 16.3 19.7Level of Service E B F C B BApproach Delay (s) 61.8 17.8 33.4 19.6Approach LOS E B C B
Intersection SummaryHCM 2000 Control Delay 32.1 HCM 2000 Level of Service CHCM 2000 Volume to Capacity ratio 1.09Actuated Cycle Length (s) 90.0 Sum of lost time (s) 9.0Intersection Capacity Utilization 91.6% ICU Level of Service FAnalysis Period (min) 15c Critical Lane Group
HCM Unsignalized Intersection Capacity Analysis Children's Hospital 5: MLK Way & 54th Street DC_2035 PM Plus Phase 2
Fehr & Peers Synchro 8 Report
Movement EBL EBT EBR WBL WBT WBR NBU NBL NBT NBR SBU SBLLane ConfigurationsVolume (veh/h) 10 10 50 20 10 10 13 40 2131 48 10 20Sign Control Stop Stop FreeGrade 0% 0% 0%Peak Hour Factor 1.00 1.00 1.00 1.00 1.00 1.00 1.00 1.00 1.00 1.00 1.00 1.00Hourly flow rate (vph) 10 10 50 20 10 10 0 40 2131 48 0 20Pedestrians 8 29 17Lane Width (ft) 12.0 12.0 12.0Walking Speed (ft/s) 4.0 4.0 4.0Percent Blockage 1 2 1Right turn flare (veh)Median type NoneMedian storage veh)Upstream signal (ft) 299pX, platoon unblocked 0.85 0.85 0.71 0.85 0.85 0.72 0.00 0.71 0.00 0.72vC, conflicting volume 2536 4019 593 2934 4005 763 0 1701 0 2208vC1, stage 1 conf volvC2, stage 2 conf volvCu, unblocked vol 0 1728 0 457 1712 0 0 580 0 1320tC, single (s) 7.5 6.5 6.9 7.5 6.5 6.9 0.0 4.1 0.0 4.1tC, 2 stage (s)tF (s) *7.5 *7.5 *7.5 *7.5 *7.5 *7.5 0.0 2.2 0.0 2.2p0 queue free % 97 83 85 87 83 97 0 94 0 95cM capacity (veh/h) 309 58 336 157 59 338 0 702 0 369
Direction, Lane # EB 1 WB 1 NB 1 NB 2 NB 3 SB 1 SB 2 SB 3Volume Total 70 40 573 1066 581 438 836 438Volume Left 10 20 40 0 0 20 0 0Volume Right 50 10 0 0 48 0 0 20cSH 198 122 702 1700 1700 369 1700 1700Volume to Capacity 0.35 0.33 0.06 0.63 0.34 0.05 0.49 0.26Queue Length 95th (ft) 38 32 5 0 0 4 0 0Control Delay (s) 32.9 48.0 1.5 0.0 0.0 1.7 0.0 0.0Lane LOS D E A AApproach Delay (s) 32.9 48.0 0.4 0.4Approach LOS D E
Intersection SummaryAverage Delay 1.5Intersection Capacity Utilization 95.6% ICU Level of Service FAnalysis Period (min) 15
* User Entered Value
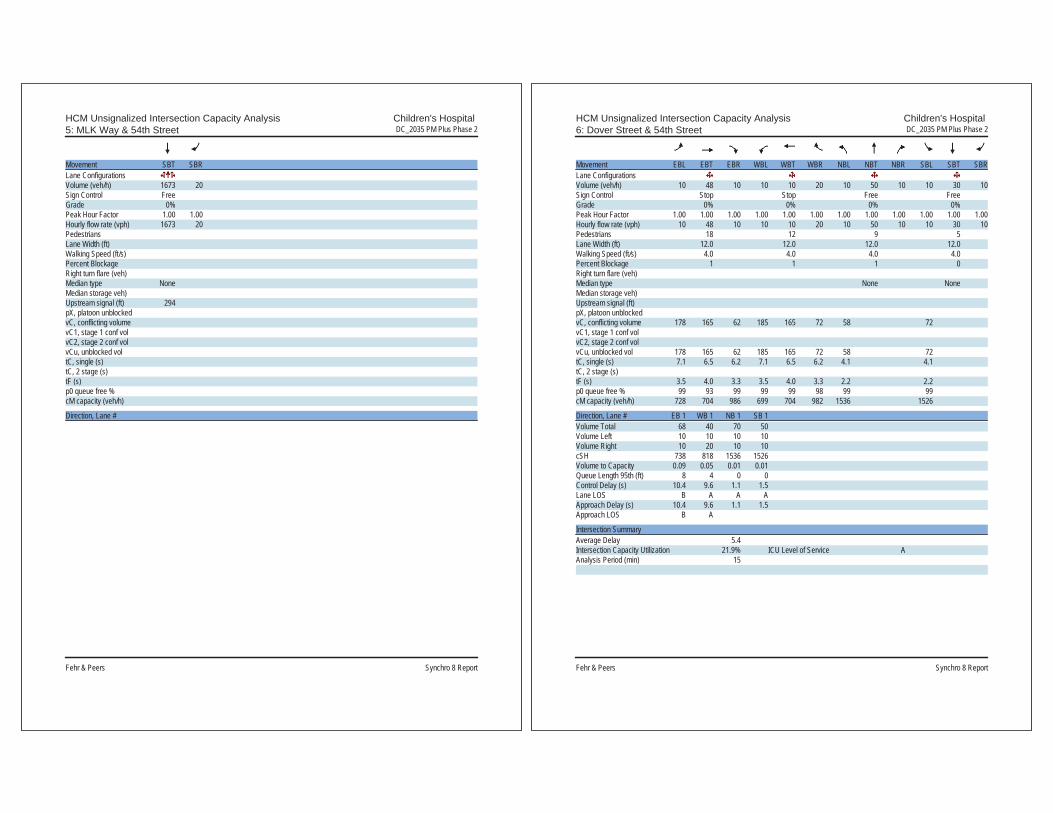
HCM Unsignalized Intersection Capacity Analysis Children's Hospital 5: MLK Way & 54th Street DC_2035 PM Plus Phase 2
Fehr & Peers Synchro 8 Report
Movement SBT SBRLane ConfigurationsVolume (veh/h) 1673 20Sign Control FreeGrade 0%Peak Hour Factor 1.00 1.00Hourly flow rate (vph) 1673 20PedestriansLane Width (ft)Walking Speed (ft/s)Percent BlockageRight turn flare (veh)Median type NoneMedian storage veh)Upstream signal (ft) 294pX, platoon unblockedvC, conflicting volumevC1, stage 1 conf volvC2, stage 2 conf volvCu, unblocked voltC, single (s)tC, 2 stage (s)tF (s)p0 queue free %cM capacity (veh/h)
Direction, Lane #
HCM Unsignalized Intersection Capacity Analysis Children's Hospital 6: Dover Street & 54th Street DC_2035 PM Plus Phase 2
Fehr & Peers Synchro 8 Report
Movement EBL EBT EBR WBL WBT WBR NBL NBT NBR SBL SBT SBRLane ConfigurationsVolume (veh/h) 10 48 10 10 10 20 10 50 10 10 30 10Sign Control Stop Stop Free FreeGrade 0% 0% 0% 0%Peak Hour Factor 1.00 1.00 1.00 1.00 1.00 1.00 1.00 1.00 1.00 1.00 1.00 1.00Hourly flow rate (vph) 10 48 10 10 10 20 10 50 10 10 30 10Pedestrians 18 12 9 5Lane Width (ft) 12.0 12.0 12.0 12.0Walking Speed (ft/s) 4.0 4.0 4.0 4.0Percent Blockage 1 1 1 0Right turn flare (veh)Median type None NoneMedian storage veh)Upstream signal (ft)pX, platoon unblockedvC, conflicting volume 178 165 62 185 165 72 58 72vC1, stage 1 conf volvC2, stage 2 conf volvCu, unblocked vol 178 165 62 185 165 72 58 72tC, single (s) 7.1 6.5 6.2 7.1 6.5 6.2 4.1 4.1tC, 2 stage (s)tF (s) 3.5 4.0 3.3 3.5 4.0 3.3 2.2 2.2p0 queue free % 99 93 99 99 99 98 99 99cM capacity (veh/h) 728 704 986 699 704 982 1536 1526
Direction, Lane # EB 1 WB 1 NB 1 SB 1Volume Total 68 40 70 50Volume Left 10 10 10 10Volume Right 10 20 10 10cSH 738 818 1536 1526Volume to Capacity 0.09 0.05 0.01 0.01Queue Length 95th (ft) 8 4 0 0Control Delay (s) 10.4 9.6 1.1 1.5Lane LOS B A A AApproach Delay (s) 10.4 9.6 1.1 1.5Approach LOS B A
Intersection SummaryAverage Delay 5.4Intersection Capacity Utilization 21.9% ICU Level of Service AAnalysis Period (min) 15
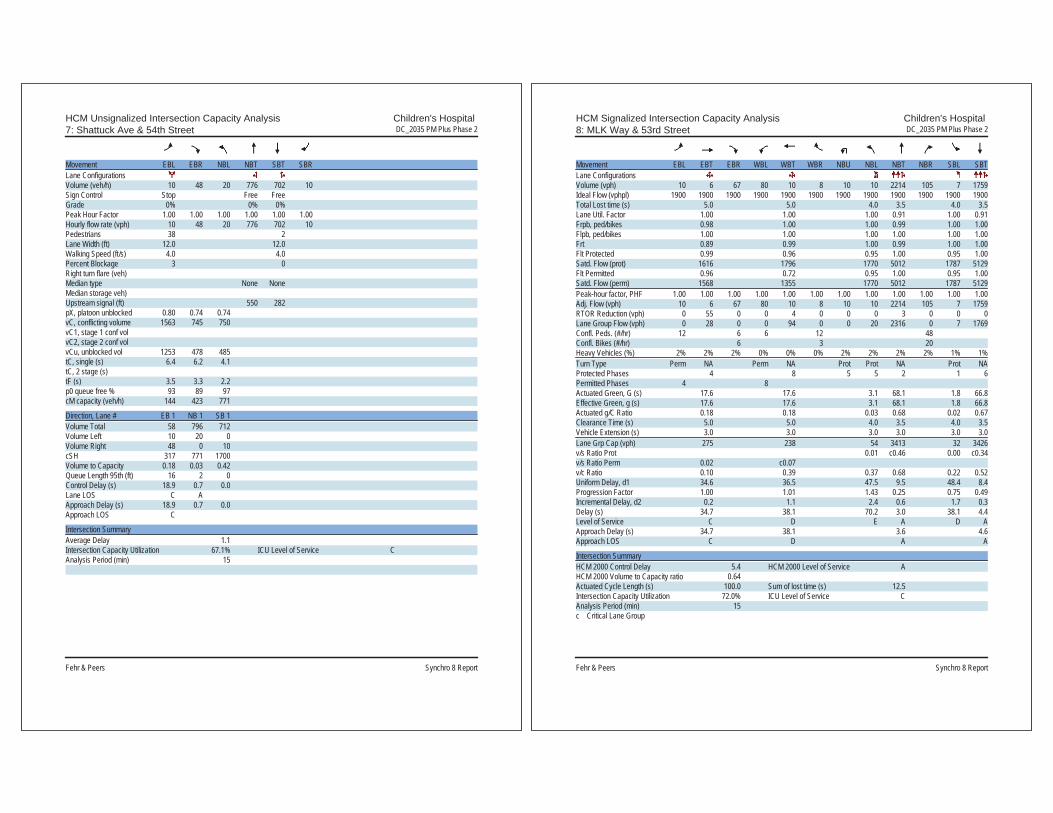
HCM Unsignalized Intersection Capacity Analysis Children's Hospital 7: Shattuck Ave & 54th Street DC_2035 PM Plus Phase 2
Fehr & Peers Synchro 8 Report
Movement EBL EBR NBL NBT SBT SBRLane ConfigurationsVolume (veh/h) 10 48 20 776 702 10Sign Control Stop Free FreeGrade 0% 0% 0%Peak Hour Factor 1.00 1.00 1.00 1.00 1.00 1.00Hourly flow rate (vph) 10 48 20 776 702 10Pedestrians 38 2Lane Width (ft) 12.0 12.0Walking Speed (ft/s) 4.0 4.0Percent Blockage 3 0Right turn flare (veh)Median type None NoneMedian storage veh)Upstream signal (ft) 550 282pX, platoon unblocked 0.80 0.74 0.74vC, conflicting volume 1563 745 750vC1, stage 1 conf volvC2, stage 2 conf volvCu, unblocked vol 1253 478 485tC, single (s) 6.4 6.2 4.1tC, 2 stage (s)tF (s) 3.5 3.3 2.2p0 queue free % 93 89 97cM capacity (veh/h) 144 423 771
Direction, Lane # EB 1 NB 1 SB 1Volume Total 58 796 712Volume Left 10 20 0Volume Right 48 0 10cSH 317 771 1700Volume to Capacity 0.18 0.03 0.42Queue Length 95th (ft) 16 2 0Control Delay (s) 18.9 0.7 0.0Lane LOS C AApproach Delay (s) 18.9 0.7 0.0Approach LOS C
Intersection SummaryAverage Delay 1.1Intersection Capacity Utilization 67.1% ICU Level of Service CAnalysis Period (min) 15
HCM Signalized Intersection Capacity Analysis Children's Hospital 8: MLK Way & 53rd Street DC_2035 PM Plus Phase 2
Fehr & Peers Synchro 8 Report
Movement EBL EBT EBR WBL WBT WBR NBU NBL NBT NBR SBL SBTLane ConfigurationsVolume (vph) 10 6 67 80 10 8 10 10 2214 105 7 1759Ideal Flow (vphpl) 1900 1900 1900 1900 1900 1900 1900 1900 1900 1900 1900 1900Total Lost time (s) 5.0 5.0 4.0 3.5 4.0 3.5Lane Util. Factor 1.00 1.00 1.00 0.91 1.00 0.91Frpb, ped/bikes 0.98 1.00 1.00 0.99 1.00 1.00Flpb, ped/bikes 1.00 1.00 1.00 1.00 1.00 1.00Frt 0.89 0.99 1.00 0.99 1.00 1.00Flt Protected 0.99 0.96 0.95 1.00 0.95 1.00Satd. Flow (prot) 1616 1796 1770 5012 1787 5129Flt Permitted 0.96 0.72 0.95 1.00 0.95 1.00Satd. Flow (perm) 1568 1355 1770 5012 1787 5129Peak-hour factor, PHF 1.00 1.00 1.00 1.00 1.00 1.00 1.00 1.00 1.00 1.00 1.00 1.00Adj. Flow (vph) 10 6 67 80 10 8 10 10 2214 105 7 1759RTOR Reduction (vph) 0 55 0 0 4 0 0 0 3 0 0 0Lane Group Flow (vph) 0 28 0 0 94 0 0 20 2316 0 7 1769Confl. Peds. (#/hr) 12 6 6 12 48Confl. Bikes (#/hr) 6 3 20Heavy Vehicles (%) 2% 2% 2% 0% 0% 0% 2% 2% 2% 2% 1% 1%Turn Type Perm NA Perm NA Prot Prot NA Prot NAProtected Phases 4 8 5 5 2 1 6Permitted Phases 4 8Actuated Green, G (s) 17.6 17.6 3.1 68.1 1.8 66.8Effective Green, g (s) 17.6 17.6 3.1 68.1 1.8 66.8Actuated g/C Ratio 0.18 0.18 0.03 0.68 0.02 0.67Clearance Time (s) 5.0 5.0 4.0 3.5 4.0 3.5Vehicle Extension (s) 3.0 3.0 3.0 3.0 3.0 3.0Lane Grp Cap (vph) 275 238 54 3413 32 3426v/s Ratio Prot 0.01 c0.46 0.00 c0.34v/s Ratio Perm 0.02 c0.07v/c Ratio 0.10 0.39 0.37 0.68 0.22 0.52Uniform Delay, d1 34.6 36.5 47.5 9.5 48.4 8.4Progression Factor 1.00 1.01 1.43 0.25 0.75 0.49Incremental Delay, d2 0.2 1.1 2.4 0.6 1.7 0.3Delay (s) 34.7 38.1 70.2 3.0 38.1 4.4Level of Service C D E A D AApproach Delay (s) 34.7 38.1 3.6 4.6Approach LOS C D A A
Intersection SummaryHCM 2000 Control Delay 5.4 HCM 2000 Level of Service AHCM 2000 Volume to Capacity ratio 0.64Actuated Cycle Length (s) 100.0 Sum of lost time (s) 12.5Intersection Capacity Utilization 72.0% ICU Level of Service CAnalysis Period (min) 15c Critical Lane Group

HCM Signalized Intersection Capacity Analysis Children's Hospital 8: MLK Way & 53rd Street DC_2035 PM Plus Phase 2
Fehr & Peers Synchro 8 Report
Movement SBRLane ConfigurationsVolume (vph) 10Ideal Flow (vphpl) 1900Total Lost time (s)Lane Util. FactorFrpb, ped/bikesFlpb, ped/bikesFrtFlt ProtectedSatd. Flow (prot)Flt PermittedSatd. Flow (perm)Peak-hour factor, PHF 1.00Adj. Flow (vph) 10RTOR Reduction (vph) 0Lane Group Flow (vph) 0Confl. Peds. (#/hr) 21Confl. Bikes (#/hr) 24Heavy Vehicles (%) 1%Turn TypeProtected PhasesPermitted PhasesActuated Green, G (s)Effective Green, g (s)Actuated g/C RatioClearance Time (s)Vehicle Extension (s)Lane Grp Cap (vph)v/s Ratio Protv/s Ratio Permv/c RatioUniform Delay, d1Progression FactorIncremental Delay, d2Delay (s)Level of ServiceApproach Delay (s)Approach LOS
Intersection Summary
HCM Unsignalized Intersection Capacity Analysis Children's Hospital 9: Dover Street & 53rd Street DC_2035 PM Plus Phase 2
Fehr & Peers Synchro 8 Report
Movement EBL EBT EBR WBL WBT WBR NBL NBT NBR SBL SBT SBRLane ConfigurationsVolume (veh/h) 70 20 0 0 20 10 0 0 0 10 0 40Sign Control Stop Stop Free FreeGrade 0% 0% 0% 0%Peak Hour Factor 1.00 1.00 1.00 1.00 1.00 1.00 1.00 1.00 1.00 1.00 1.00 1.00Hourly flow rate (vph) 70 20 0 0 20 10 0 0 0 10 0 40Pedestrians 38 15 6 6Lane Width (ft) 12.0 12.0 12.0 12.0Walking Speed (ft/s) 4.0 4.0 4.0 4.0Percent Blockage 3 1 1 1Right turn flare (veh)Median type None NoneMedian storage veh)Upstream signal (ft)pX, platoon unblockedvC, conflicting volume 104 93 64 71 113 21 78 15vC1, stage 1 conf volvC2, stage 2 conf volvCu, unblocked vol 104 93 64 71 113 21 78 15tC, single (s) 7.1 6.5 6.2 7.1 6.5 6.2 4.1 4.1tC, 2 stage (s)tF (s) 3.5 4.0 3.3 3.5 4.0 3.3 2.2 2.2p0 queue free % 91 97 100 100 97 99 100 99cM capacity (veh/h) 792 761 969 857 742 1044 1485 1596
Direction, Lane # EB 1 WB 1 NB 1 SB 1Volume Total 90 30 0 50Volume Left 70 0 0 10Volume Right 0 10 0 40cSH 785 821 1700 1596Volume to Capacity 0.11 0.04 0.00 0.01Queue Length 95th (ft) 10 3 0 0Control Delay (s) 10.2 9.6 0.0 1.5Lane LOS B A AApproach Delay (s) 10.2 9.6 0.0 1.5Approach LOS B A
Intersection SummaryAverage Delay 7.5Intersection Capacity Utilization 29.8% ICU Level of Service AAnalysis Period (min) 15
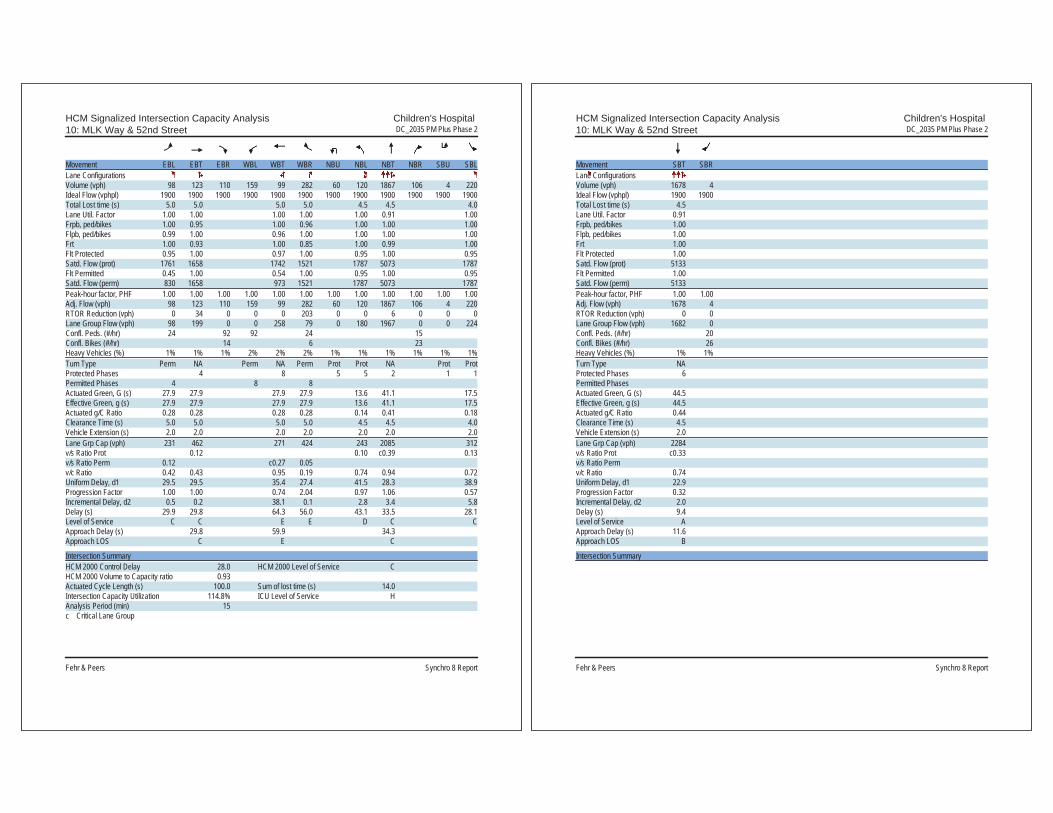
HCM Signalized Intersection Capacity Analysis Children's Hospital 10: MLK Way & 52nd Street DC_2035 PM Plus Phase 2
Fehr & Peers Synchro 8 Report
Movement EBL EBT EBR WBL WBT WBR NBU NBL NBT NBR SBU SBLLane ConfigurationsVolume (vph) 98 123 110 159 99 282 60 120 1867 106 4 220Ideal Flow (vphpl) 1900 1900 1900 1900 1900 1900 1900 1900 1900 1900 1900 1900Total Lost time (s) 5.0 5.0 5.0 5.0 4.5 4.5 4.0Lane Util. Factor 1.00 1.00 1.00 1.00 1.00 0.91 1.00Frpb, ped/bikes 1.00 0.95 1.00 0.96 1.00 1.00 1.00Flpb, ped/bikes 0.99 1.00 0.96 1.00 1.00 1.00 1.00Frt 1.00 0.93 1.00 0.85 1.00 0.99 1.00Flt Protected 0.95 1.00 0.97 1.00 0.95 1.00 0.95Satd. Flow (prot) 1761 1658 1742 1521 1787 5073 1787Flt Permitted 0.45 1.00 0.54 1.00 0.95 1.00 0.95Satd. Flow (perm) 830 1658 973 1521 1787 5073 1787Peak-hour factor, PHF 1.00 1.00 1.00 1.00 1.00 1.00 1.00 1.00 1.00 1.00 1.00 1.00Adj. Flow (vph) 98 123 110 159 99 282 60 120 1867 106 4 220RTOR Reduction (vph) 0 34 0 0 0 203 0 0 6 0 0 0Lane Group Flow (vph) 98 199 0 0 258 79 0 180 1967 0 0 224Confl. Peds. (#/hr) 24 92 92 24 15Confl. Bikes (#/hr) 14 6 23Heavy Vehicles (%) 1% 1% 1% 2% 2% 2% 1% 1% 1% 1% 1% 1%Turn Type Perm NA Perm NA Perm Prot Prot NA Prot ProtProtected Phases 4 8 5 5 2 1 1Permitted Phases 4 8 8Actuated Green, G (s) 27.9 27.9 27.9 27.9 13.6 41.1 17.5Effective Green, g (s) 27.9 27.9 27.9 27.9 13.6 41.1 17.5Actuated g/C Ratio 0.28 0.28 0.28 0.28 0.14 0.41 0.18Clearance Time (s) 5.0 5.0 5.0 5.0 4.5 4.5 4.0Vehicle Extension (s) 2.0 2.0 2.0 2.0 2.0 2.0 2.0Lane Grp Cap (vph) 231 462 271 424 243 2085 312v/s Ratio Prot 0.12 0.10 c0.39 0.13v/s Ratio Perm 0.12 c0.27 0.05v/c Ratio 0.42 0.43 0.95 0.19 0.74 0.94 0.72Uniform Delay, d1 29.5 29.5 35.4 27.4 41.5 28.3 38.9Progression Factor 1.00 1.00 0.74 2.04 0.97 1.06 0.57Incremental Delay, d2 0.5 0.2 38.1 0.1 2.8 3.4 5.8Delay (s) 29.9 29.8 64.3 56.0 43.1 33.5 28.1Level of Service C C E E D C CApproach Delay (s) 29.8 59.9 34.3Approach LOS C E C
Intersection SummaryHCM 2000 Control Delay 28.0 HCM 2000 Level of Service CHCM 2000 Volume to Capacity ratio 0.93Actuated Cycle Length (s) 100.0 Sum of lost time (s) 14.0Intersection Capacity Utilization 114.8% ICU Level of Service HAnalysis Period (min) 15c Critical Lane Group
HCM Signalized Intersection Capacity Analysis Children's Hospital 10: MLK Way & 52nd Street DC_2035 PM Plus Phase 2
Fehr & Peers Synchro 8 Report
Movement SBT SBRLane ConfigurationsVolume (vph) 1678 4Ideal Flow (vphpl) 1900 1900Total Lost time (s) 4.5Lane Util. Factor 0.91Frpb, ped/bikes 1.00Flpb, ped/bikes 1.00Frt 1.00Flt Protected 1.00Satd. Flow (prot) 5133Flt Permitted 1.00Satd. Flow (perm) 5133Peak-hour factor, PHF 1.00 1.00Adj. Flow (vph) 1678 4RTOR Reduction (vph) 0 0Lane Group Flow (vph) 1682 0Confl. Peds. (#/hr) 20Confl. Bikes (#/hr) 26Heavy Vehicles (%) 1% 1%Turn Type NAProtected Phases 6Permitted PhasesActuated Green, G (s) 44.5Effective Green, g (s) 44.5Actuated g/C Ratio 0.44Clearance Time (s) 4.5Vehicle Extension (s) 2.0Lane Grp Cap (vph) 2284v/s Ratio Prot c0.33v/s Ratio Permv/c Ratio 0.74Uniform Delay, d1 22.9Progression Factor 0.32Incremental Delay, d2 2.0Delay (s) 9.4Level of Service AApproach Delay (s) 11.6Approach LOS B
Intersection Summary

HCM Signalized Intersection Capacity Analysis Children's Hospital 11: 52nd Street & Garage DC_2035 PM Plus Phase 2
Fehr & Peers Synchro 8 Report
Movement EBL EBT EBR WBL WBT WBR NBL NBT NBR SBL SBT SBRLane ConfigurationsVolume (vph) 3 433 5 2 457 2 12 1 7 0 4 59Ideal Flow (vphpl) 1900 1900 1900 1900 1900 1900 1900 1900 1900 1900 1900 1900Total Lost time (s) 3.0 3.0 3.0 3.0Lane Util. Factor 1.00 1.00 1.00 1.00Frpb, ped/bikes 1.00 1.00 0.93 0.99Flpb, ped/bikes 1.00 1.00 1.00 1.00Frt 1.00 1.00 0.95 0.87Flt Protected 1.00 1.00 0.97 1.00Satd. Flow (prot) 1855 1897 1403 1640Flt Permitted 1.00 1.00 0.92 1.00Satd. Flow (perm) 1852 1895 1326 1640Peak-hour factor, PHF 1.00 1.00 1.00 1.00 1.00 1.00 1.00 1.00 1.00 1.00 1.00 1.00Adj. Flow (vph) 3 433 5 2 457 2 12 1 7 0 4 59RTOR Reduction (vph) 0 1 0 0 1 0 0 4 0 0 32 0Lane Group Flow (vph) 0 440 0 0 460 0 0 16 0 0 31 0Confl. Peds. (#/hr) 89 89 38 312 312Confl. Bikes (#/hr) 15 9 2Heavy Vehicles (%) 2% 2% 2% 0% 0% 0% 16% 16% 16% 0% 0% 0%Turn Type Perm NA Perm NA Perm NA NAProtected Phases 2 6 4 8Permitted Phases 2 6 4 8Actuated Green, G (s) 21.0 21.0 23.0 23.0Effective Green, g (s) 21.0 21.0 23.0 23.0Actuated g/C Ratio 0.42 0.42 0.46 0.46Clearance Time (s) 3.0 3.0 3.0 3.0Lane Grp Cap (vph) 777 795 609 754v/s Ratio Prot c0.02v/s Ratio Perm 0.24 c0.24 0.01v/c Ratio 0.57 0.58 0.03 0.04Uniform Delay, d1 11.0 11.1 7.4 7.4Progression Factor 1.78 1.00 1.00 1.00Incremental Delay, d2 2.1 3.1 0.1 0.1Delay (s) 21.8 14.2 7.5 7.5Level of Service C B A AApproach Delay (s) 21.8 14.2 7.5 7.5Approach LOS C B A A
Intersection SummaryHCM 2000 Control Delay 17.0 HCM 2000 Level of Service BHCM 2000 Volume to Capacity ratio 0.30Actuated Cycle Length (s) 50.0 Sum of lost time (s) 6.0Intersection Capacity Utilization 51.3% ICU Level of Service AAnalysis Period (min) 15c Critical Lane Group
HCM Unsignalized Intersection Capacity Analysis Children's Hospital 12: 52nd Street & Dover Street DC_2035 PM Plus Phase 2
Fehr & Peers Synchro 8 Report
Movement EBL EBT EBR WBL WBT WBR NBL NBT NBR SBL SBT SBRLane ConfigurationsVolume (veh/h) 8 395 46 21 392 4 72 0 50 10 0 14Sign Control Free Free Stop StopGrade 0% 0% 0% 0%Peak Hour Factor 1.00 1.00 1.00 1.00 1.00 1.00 1.00 1.00 1.00 1.00 1.00 1.00Hourly flow rate (vph) 8 395 46 21 392 4 72 0 50 10 0 14Pedestrians 56 11 53 23Lane Width (ft) 12.0 12.0 12.0 12.0Walking Speed (ft/s) 4.0 4.0 4.0 4.0Percent Blockage 5 1 4 2Right turn flare (veh)Median type None NoneMedian storage veh)Upstream signal (ft) 312 647pX, platoon unblocked 0.86 0.82 0.89 0.89 0.82 0.89 0.89 0.86vC, conflicting volume 419 494 993 948 482 954 969 473vC1, stage 1 conf volvC2, stage 2 conf volvCu, unblocked vol 238 267 565 514 252 521 538 301tC, single (s) 4.1 4.1 7.2 6.6 6.3 7.1 6.5 6.2tC, 2 stage (s)tF (s) 2.2 2.2 3.6 4.1 3.4 3.5 4.0 3.3p0 queue free % 99 98 77 100 92 97 100 98cM capacity (veh/h) 1112 1016 312 366 593 346 366 595
Direction, Lane # EB 1 WB 1 NB 1 SB 1Volume Total 449 417 122 24Volume Left 8 21 72 10Volume Right 46 4 50 14cSH 1112 1016 387 458Volume to Capacity 0.01 0.02 0.32 0.05Queue Length 95th (ft) 1 2 33 4Control Delay (s) 0.2 0.7 18.5 13.3Lane LOS A A C BApproach Delay (s) 0.2 0.7 18.5 13.3Approach LOS C B
Intersection SummaryAverage Delay 2.9Intersection Capacity Utilization 50.8% ICU Level of Service AAnalysis Period (min) 15
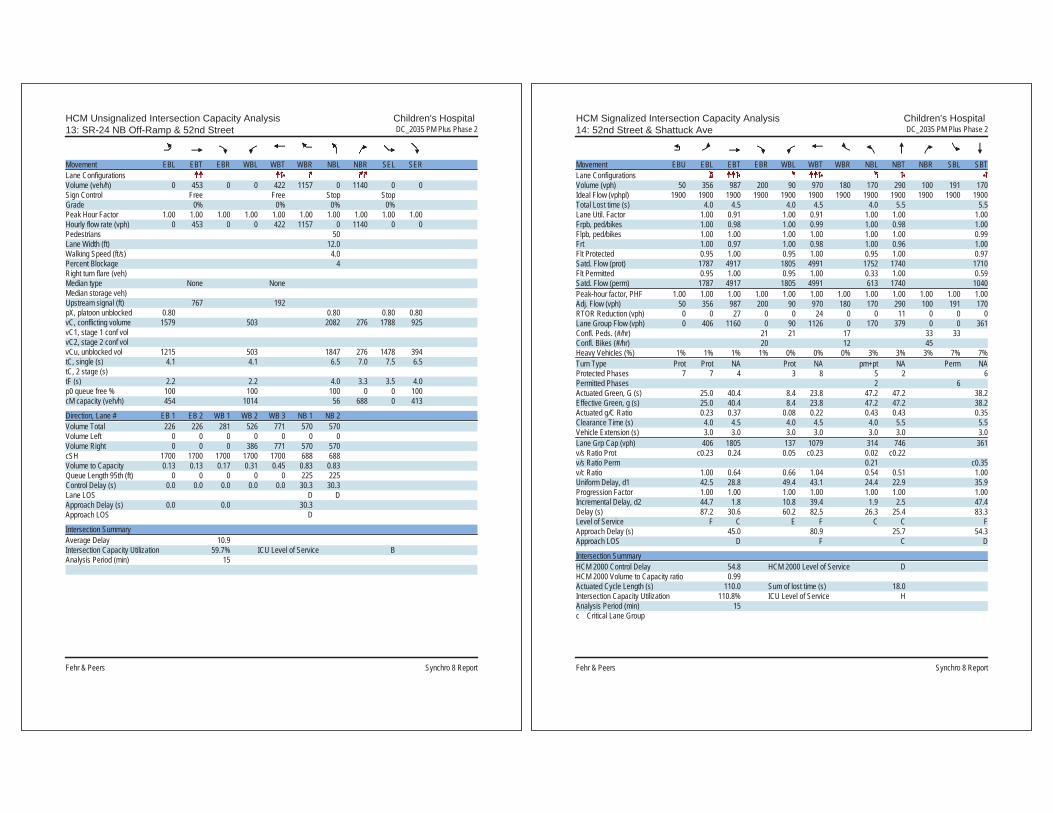
HCM Unsignalized Intersection Capacity Analysis Children's Hospital 13: SR-24 NB Off-Ramp & 52nd Street DC_2035 PM Plus Phase 2
Fehr & Peers Synchro 8 Report
Movement EBL EBT EBR WBL WBT WBR NBL NBR SEL SERLane ConfigurationsVolume (veh/h) 0 453 0 0 422 1157 0 1140 0 0Sign Control Free Free Stop StopGrade 0% 0% 0% 0%Peak Hour Factor 1.00 1.00 1.00 1.00 1.00 1.00 1.00 1.00 1.00 1.00Hourly flow rate (vph) 0 453 0 0 422 1157 0 1140 0 0Pedestrians 50Lane Width (ft) 12.0Walking Speed (ft/s) 4.0Percent Blockage 4Right turn flare (veh)Median type None NoneMedian storage veh)Upstream signal (ft) 767 192pX, platoon unblocked 0.80 0.80 0.80 0.80vC, conflicting volume 1579 503 2082 276 1788 925vC1, stage 1 conf volvC2, stage 2 conf volvCu, unblocked vol 1215 503 1847 276 1478 394tC, single (s) 4.1 4.1 6.5 7.0 7.5 6.5tC, 2 stage (s)tF (s) 2.2 2.2 4.0 3.3 3.5 4.0p0 queue free % 100 100 100 0 0 100cM capacity (veh/h) 454 1014 56 688 0 413
Direction, Lane # EB 1 EB 2 WB 1 WB 2 WB 3 NB 1 NB 2Volume Total 226 226 281 526 771 570 570Volume Left 0 0 0 0 0 0 0Volume Right 0 0 0 386 771 570 570cSH 1700 1700 1700 1700 1700 688 688Volume to Capacity 0.13 0.13 0.17 0.31 0.45 0.83 0.83Queue Length 95th (ft) 0 0 0 0 0 225 225Control Delay (s) 0.0 0.0 0.0 0.0 0.0 30.3 30.3Lane LOS D DApproach Delay (s) 0.0 0.0 30.3Approach LOS D
Intersection SummaryAverage Delay 10.9Intersection Capacity Utilization 59.7% ICU Level of Service BAnalysis Period (min) 15
HCM Signalized Intersection Capacity Analysis Children's Hospital 14: 52nd Street & Shattuck Ave DC_2035 PM Plus Phase 2
Fehr & Peers Synchro 8 Report
Movement EBU EBL EBT EBR WBL WBT WBR NBL NBT NBR SBL SBTLane ConfigurationsVolume (vph) 50 356 987 200 90 970 180 170 290 100 191 170Ideal Flow (vphpl) 1900 1900 1900 1900 1900 1900 1900 1900 1900 1900 1900 1900Total Lost time (s) 4.0 4.5 4.0 4.5 4.0 5.5 5.5Lane Util. Factor 1.00 0.91 1.00 0.91 1.00 1.00 1.00Frpb, ped/bikes 1.00 0.98 1.00 0.99 1.00 0.98 1.00Flpb, ped/bikes 1.00 1.00 1.00 1.00 1.00 1.00 0.99Frt 1.00 0.97 1.00 0.98 1.00 0.96 1.00Flt Protected 0.95 1.00 0.95 1.00 0.95 1.00 0.97Satd. Flow (prot) 1787 4917 1805 4991 1752 1740 1710Flt Permitted 0.95 1.00 0.95 1.00 0.33 1.00 0.59Satd. Flow (perm) 1787 4917 1805 4991 613 1740 1040Peak-hour factor, PHF 1.00 1.00 1.00 1.00 1.00 1.00 1.00 1.00 1.00 1.00 1.00 1.00Adj. Flow (vph) 50 356 987 200 90 970 180 170 290 100 191 170RTOR Reduction (vph) 0 0 27 0 0 24 0 0 11 0 0 0Lane Group Flow (vph) 0 406 1160 0 90 1126 0 170 379 0 0 361Confl. Peds. (#/hr) 21 21 17 33 33Confl. Bikes (#/hr) 20 12 45Heavy Vehicles (%) 1% 1% 1% 1% 0% 0% 0% 3% 3% 3% 7% 7%Turn Type Prot Prot NA Prot NA pm+pt NA Perm NAProtected Phases 7 7 4 3 8 5 2 6Permitted Phases 2 6Actuated Green, G (s) 25.0 40.4 8.4 23.8 47.2 47.2 38.2Effective Green, g (s) 25.0 40.4 8.4 23.8 47.2 47.2 38.2Actuated g/C Ratio 0.23 0.37 0.08 0.22 0.43 0.43 0.35Clearance Time (s) 4.0 4.5 4.0 4.5 4.0 5.5 5.5Vehicle Extension (s) 3.0 3.0 3.0 3.0 3.0 3.0 3.0Lane Grp Cap (vph) 406 1805 137 1079 314 746 361v/s Ratio Prot c0.23 0.24 0.05 c0.23 0.02 c0.22v/s Ratio Perm 0.21 c0.35v/c Ratio 1.00 0.64 0.66 1.04 0.54 0.51 1.00Uniform Delay, d1 42.5 28.8 49.4 43.1 24.4 22.9 35.9Progression Factor 1.00 1.00 1.00 1.00 1.00 1.00 1.00Incremental Delay, d2 44.7 1.8 10.8 39.4 1.9 2.5 47.4Delay (s) 87.2 30.6 60.2 82.5 26.3 25.4 83.3Level of Service F C E F C C FApproach Delay (s) 45.0 80.9 25.7 54.3Approach LOS D F C D
Intersection SummaryHCM 2000 Control Delay 54.8 HCM 2000 Level of Service DHCM 2000 Volume to Capacity ratio 0.99Actuated Cycle Length (s) 110.0 Sum of lost time (s) 18.0Intersection Capacity Utilization 110.8% ICU Level of Service HAnalysis Period (min) 15c Critical Lane Group

HCM Signalized Intersection Capacity Analysis Children's Hospital 14: 52nd Street & Shattuck Ave DC_2035 PM Plus Phase 2
Fehr & Peers Synchro 8 Report
Movement SBRLane ConfigurationsVolume (vph) 389Ideal Flow (vphpl) 1900Total Lost time (s) 5.5Lane Util. Factor 1.00Frpb, ped/bikes 0.93Flpb, ped/bikes 1.00Frt 0.85Flt Protected 1.00Satd. Flow (prot) 1405Flt Permitted 1.00Satd. Flow (perm) 1405Peak-hour factor, PHF 1.00Adj. Flow (vph) 389RTOR Reduction (vph) 253Lane Group Flow (vph) 136Confl. Peds. (#/hr) 27Confl. Bikes (#/hr) 41Heavy Vehicles (%) 7%Turn Type PermProtected PhasesPermitted Phases 6Actuated Green, G (s) 38.2Effective Green, g (s) 38.2Actuated g/C Ratio 0.35Clearance Time (s) 5.5Vehicle Extension (s) 3.0Lane Grp Cap (vph) 487v/s Ratio Protv/s Ratio Perm 0.10v/c Ratio 0.28Uniform Delay, d1 25.9Progression Factor 1.00Incremental Delay, d2 1.4Delay (s) 27.4Level of Service CApproach Delay (s)Approach LOS
Intersection Summary
HCM Signalized Intersection Capacity Analysis Children's Hospital 15: Telegraph Ave & 52nd Street/Claremont Ave DC_2035 PM Plus Phase 2
Fehr & Peers Synchro 8 Report
Movement EBL EBT EBR WBL WBT WBR NBL NBT NBR SBL SBT SBRLane ConfigurationsVolume (vph) 20 20 20 210 90 200 30 1196 340 200 831 326Ideal Flow (vphpl) 1900 1900 1900 1900 1900 1900 1900 1900 1900 1900 1900 1900Lane Width 12 12 12 12 12 12 12 16 12 12 12 12Total Lost time (s) 4.5 4.5 4.5 4.5 4.5 4.5Lane Util. Factor 1.00 0.95 0.95 0.95 1.00 0.95Frpb, ped/bikes 0.99 1.00 0.94 0.98 1.00 0.91Flpb, ped/bikes 1.00 1.00 1.00 1.00 1.00 1.00Frt 0.95 1.00 0.90 0.97 1.00 0.96Flt Protected 0.98 0.95 1.00 1.00 0.95 1.00Satd. Flow (prot) 1642 1698 1508 3759 1770 3068Flt Permitted 0.98 0.95 1.00 0.90 0.95 1.00Satd. Flow (perm) 1642 1698 1508 3405 1770 3068Peak-hour factor, PHF 1.00 1.00 1.00 1.00 1.00 1.00 1.00 1.00 1.00 1.00 1.00 1.00Adj. Flow (vph) 20 20 20 210 90 200 30 1196 340 200 831 326RTOR Reduction (vph) 0 19 0 0 68 0 0 23 0 0 37 0Lane Group Flow (vph) 0 41 0 189 243 0 0 1543 0 200 1120 0Confl. Peds. (#/hr) 51 51 105 33 105Confl. Bikes (#/hr) 2 15 53 72Heavy Vehicles (%) 8% 8% 8% 1% 1% 1% 3% 3% 3% 2% 2% 2%Turn Type Split NA Split NA Perm NA Prot NAProtected Phases 4 4 8 8 2 1 6Permitted Phases 2Actuated Green, G (s) 6.2 19.6 19.6 43.0 13.2 60.7Effective Green, g (s) 6.2 19.6 19.6 43.0 13.2 60.7Actuated g/C Ratio 0.06 0.20 0.20 0.43 0.13 0.61Clearance Time (s) 4.5 4.5 4.5 4.5 4.5 4.5Vehicle Extension (s) 3.0 3.0 3.0 3.0 3.0 3.0Lane Grp Cap (vph) 101 332 295 1464 233 1862v/s Ratio Prot c0.03 0.11 c0.16 c0.11 0.37v/s Ratio Perm c0.45v/c Ratio 0.41 0.57 0.83 1.05 0.86 0.60Uniform Delay, d1 45.1 36.4 38.6 28.5 42.5 12.2Progression Factor 1.80 1.00 1.00 0.50 1.00 1.00Incremental Delay, d2 0.8 2.2 16.9 30.6 25.4 1.4Delay (s) 82.0 38.6 55.5 44.7 67.9 13.6Level of Service F D E D E BApproach Delay (s) 82.0 49.1 44.7 21.6Approach LOS F D D C
Intersection SummaryHCM 2000 Control Delay 37.0 HCM 2000 Level of Service DHCM 2000 Volume to Capacity ratio 0.92Actuated Cycle Length (s) 100.0 Sum of lost time (s) 18.0Intersection Capacity Utilization 114.0% ICU Level of Service HAnalysis Period (min) 15c Critical Lane Group
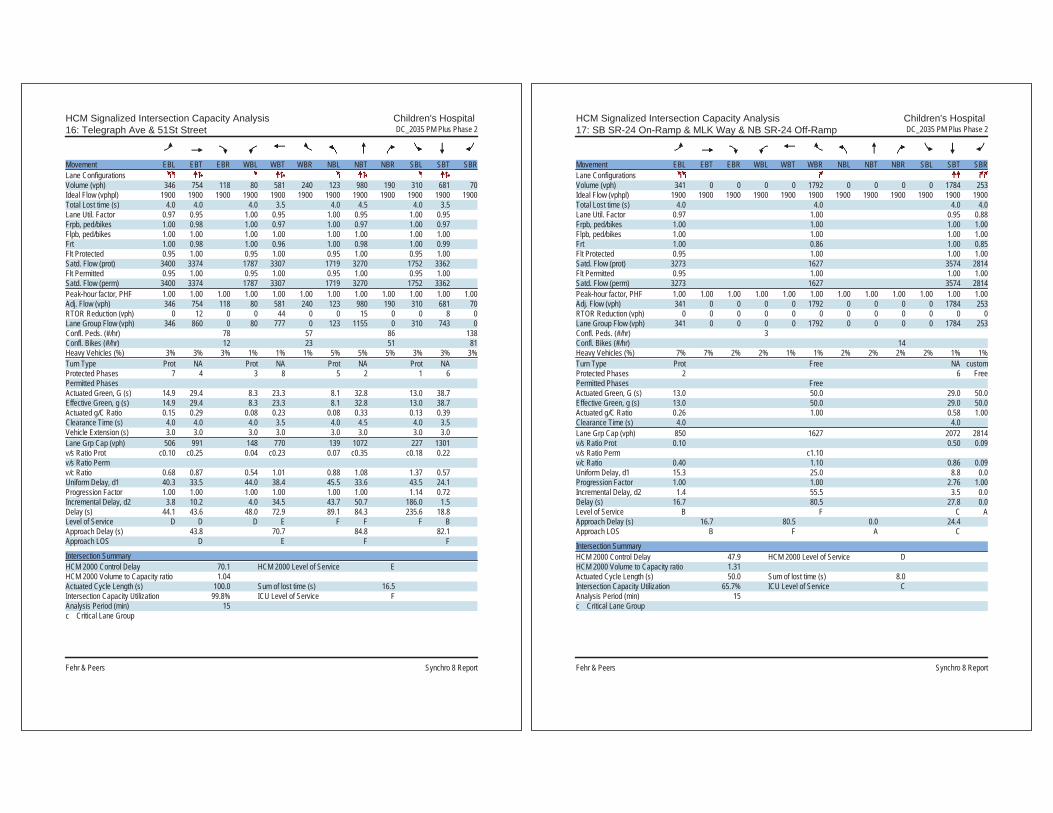
HCM Signalized Intersection Capacity Analysis Children's Hospital 16: Telegraph Ave & 51St Street DC_2035 PM Plus Phase 2
Fehr & Peers Synchro 8 Report
Movement EBL EBT EBR WBL WBT WBR NBL NBT NBR SBL SBT SBRLane ConfigurationsVolume (vph) 346 754 118 80 581 240 123 980 190 310 681 70Ideal Flow (vphpl) 1900 1900 1900 1900 1900 1900 1900 1900 1900 1900 1900 1900Total Lost time (s) 4.0 4.0 4.0 3.5 4.0 4.5 4.0 3.5Lane Util. Factor 0.97 0.95 1.00 0.95 1.00 0.95 1.00 0.95Frpb, ped/bikes 1.00 0.98 1.00 0.97 1.00 0.97 1.00 0.97Flpb, ped/bikes 1.00 1.00 1.00 1.00 1.00 1.00 1.00 1.00Frt 1.00 0.98 1.00 0.96 1.00 0.98 1.00 0.99Flt Protected 0.95 1.00 0.95 1.00 0.95 1.00 0.95 1.00Satd. Flow (prot) 3400 3374 1787 3307 1719 3270 1752 3362Flt Permitted 0.95 1.00 0.95 1.00 0.95 1.00 0.95 1.00Satd. Flow (perm) 3400 3374 1787 3307 1719 3270 1752 3362Peak-hour factor, PHF 1.00 1.00 1.00 1.00 1.00 1.00 1.00 1.00 1.00 1.00 1.00 1.00Adj. Flow (vph) 346 754 118 80 581 240 123 980 190 310 681 70RTOR Reduction (vph) 0 12 0 0 44 0 0 15 0 0 8 0Lane Group Flow (vph) 346 860 0 80 777 0 123 1155 0 310 743 0Confl. Peds. (#/hr) 78 57 86 138Confl. Bikes (#/hr) 12 23 51 81Heavy Vehicles (%) 3% 3% 3% 1% 1% 1% 5% 5% 5% 3% 3% 3%Turn Type Prot NA Prot NA Prot NA Prot NAProtected Phases 7 4 3 8 5 2 1 6Permitted PhasesActuated Green, G (s) 14.9 29.4 8.3 23.3 8.1 32.8 13.0 38.7Effective Green, g (s) 14.9 29.4 8.3 23.3 8.1 32.8 13.0 38.7Actuated g/C Ratio 0.15 0.29 0.08 0.23 0.08 0.33 0.13 0.39Clearance Time (s) 4.0 4.0 4.0 3.5 4.0 4.5 4.0 3.5Vehicle Extension (s) 3.0 3.0 3.0 3.0 3.0 3.0 3.0 3.0Lane Grp Cap (vph) 506 991 148 770 139 1072 227 1301v/s Ratio Prot c0.10 c0.25 0.04 c0.23 0.07 c0.35 c0.18 0.22v/s Ratio Permv/c Ratio 0.68 0.87 0.54 1.01 0.88 1.08 1.37 0.57Uniform Delay, d1 40.3 33.5 44.0 38.4 45.5 33.6 43.5 24.1Progression Factor 1.00 1.00 1.00 1.00 1.00 1.00 1.14 0.72Incremental Delay, d2 3.8 10.2 4.0 34.5 43.7 50.7 186.0 1.5Delay (s) 44.1 43.6 48.0 72.9 89.1 84.3 235.6 18.8Level of Service D D D E F F F BApproach Delay (s) 43.8 70.7 84.8 82.1Approach LOS D E F F
Intersection SummaryHCM 2000 Control Delay 70.1 HCM 2000 Level of Service EHCM 2000 Volume to Capacity ratio 1.04Actuated Cycle Length (s) 100.0 Sum of lost time (s) 16.5Intersection Capacity Utilization 99.8% ICU Level of Service FAnalysis Period (min) 15c Critical Lane Group
HCM Signalized Intersection Capacity Analysis Children's Hospital 17: SB SR-24 On-Ramp & MLK Way & NB SR-24 Off-Ramp DC_2035 PM Plus Phase 2
Fehr & Peers Synchro 8 Report
Movement EBL EBT EBR WBL WBT WBR NBL NBT NBR SBL SBT SBRLane ConfigurationsVolume (vph) 341 0 0 0 0 1792 0 0 0 0 1784 253Ideal Flow (vphpl) 1900 1900 1900 1900 1900 1900 1900 1900 1900 1900 1900 1900Total Lost time (s) 4.0 4.0 4.0 4.0Lane Util. Factor 0.97 1.00 0.95 0.88Frpb, ped/bikes 1.00 1.00 1.00 1.00Flpb, ped/bikes 1.00 1.00 1.00 1.00Frt 1.00 0.86 1.00 0.85Flt Protected 0.95 1.00 1.00 1.00Satd. Flow (prot) 3273 1627 3574 2814Flt Permitted 0.95 1.00 1.00 1.00Satd. Flow (perm) 3273 1627 3574 2814Peak-hour factor, PHF 1.00 1.00 1.00 1.00 1.00 1.00 1.00 1.00 1.00 1.00 1.00 1.00Adj. Flow (vph) 341 0 0 0 0 1792 0 0 0 0 1784 253RTOR Reduction (vph) 0 0 0 0 0 0 0 0 0 0 0 0Lane Group Flow (vph) 341 0 0 0 0 1792 0 0 0 0 1784 253Confl. Peds. (#/hr) 3Confl. Bikes (#/hr) 14Heavy Vehicles (%) 7% 7% 2% 2% 1% 1% 2% 2% 2% 2% 1% 1%Turn Type Prot Free NA customProtected Phases 2 6 FreePermitted Phases FreeActuated Green, G (s) 13.0 50.0 29.0 50.0Effective Green, g (s) 13.0 50.0 29.0 50.0Actuated g/C Ratio 0.26 1.00 0.58 1.00Clearance Time (s) 4.0 4.0Lane Grp Cap (vph) 850 1627 2072 2814v/s Ratio Prot 0.10 0.50 0.09v/s Ratio Perm c1.10v/c Ratio 0.40 1.10 0.86 0.09Uniform Delay, d1 15.3 25.0 8.8 0.0Progression Factor 1.00 1.00 2.76 1.00Incremental Delay, d2 1.4 55.5 3.5 0.0Delay (s) 16.7 80.5 27.8 0.0Level of Service B F C AApproach Delay (s) 16.7 80.5 0.0 24.4Approach LOS B F A C
Intersection SummaryHCM 2000 Control Delay 47.9 HCM 2000 Level of Service DHCM 2000 Volume to Capacity ratio 1.31Actuated Cycle Length (s) 50.0 Sum of lost time (s) 8.0Intersection Capacity Utilization 65.7% ICU Level of Service CAnalysis Period (min) 15c Critical Lane Group

HCM Unsignalized Intersection Capacity Analysis Children's Hospital 18: West Street & 52nd Street DC_2035 PM Plus Phase 2
Fehr & Peers Synchro 8 Report
Movement EBL EBT EBR WBL WBT WBR NBL NBT NBR SBL SBT SBRLane ConfigurationsSign Control Stop Stop Stop StopVolume (vph) 0 161 10 100 143 0 60 0 150 10 70 10Peak Hour Factor 1.00 1.00 1.00 1.00 1.00 1.00 1.00 1.00 1.00 1.00 1.00 1.00Hourly flow rate (vph) 0 161 10 100 143 0 60 0 150 10 70 10
Direction, Lane # EB 1 WB 1 NB 1 NB 2 SB 1Volume Total (vph) 171 243 60 150 90Volume Left (vph) 0 100 60 0 10Volume Right (vph) 10 0 0 150 10Hadj (s) -0.02 0.12 0.50 -0.70 -0.01Departure Headway (s) 5.0 5.0 6.2 5.0 5.4Degree Utilization, x 0.24 0.34 0.10 0.21 0.13Capacity (veh/h) 666 675 545 668 604Control Delay (s) 9.5 10.6 8.7 8.1 9.2Approach Delay (s) 9.5 10.6 8.3 9.2Approach LOS A B A A
Intersection SummaryDelay 9.5Level of Service AIntersection Capacity Utilization 46.2% ICU Level of Service AAnalysis Period (min) 15
HCM Unsignalized Intersection Capacity Analysis Children's Hospital 19: Genoa Street & 52nd Street DC_2035 PM Plus Phase 2
Fehr & Peers Synchro 8 Report
Movement EBL EBT EBR WBL WBT WBR NBL NBT NBR SBL SBT SBRLane ConfigurationsSign Control Stop Stop Stop StopVolume (vph) 10 151 10 20 133 50 10 10 10 20 10 10Peak Hour Factor 1.00 1.00 1.00 1.00 1.00 1.00 1.00 1.00 1.00 1.00 1.00 1.00Hourly flow rate (vph) 10 151 10 20 133 50 10 10 10 20 10 10
Direction, Lane # EB 1 WB 1 NB 1 SB 1Volume Total (vph) 171 203 30 40Volume Left (vph) 10 20 10 20Volume Right (vph) 10 50 10 10Hadj (s) -0.01 -0.13 -0.13 -0.05Departure Headway (s) 4.3 4.1 4.6 4.7Degree Utilization, x 0.20 0.23 0.04 0.05Capacity (veh/h) 821 853 712 699Control Delay (s) 8.4 8.4 7.8 8.0Approach Delay (s) 8.4 8.4 7.8 8.0Approach LOS A A A A
Intersection SummaryDelay 8.3Level of Service AIntersection Capacity Utilization 28.7% ICU Level of Service AAnalysis Period (min) 15

HCM Unsignalized Intersection Capacity Analysis Children's Hospital 20: Genoa Street & 55th Street DC_2035 PM Plus Phase 2
Fehr & Peers Synchro 8 Report
Movement EBL EBT EBR WBL WBT WBR NBL NBT NBR SBL SBT SBRLane ConfigurationsVolume (veh/h) 20 390 10 20 451 40 10 20 40 40 10 20Sign Control Free Free Stop StopGrade 0% 0% 0% 0%Peak Hour Factor 1.00 1.00 1.00 1.00 1.00 1.00 1.00 1.00 1.00 1.00 1.00 1.00Hourly flow rate (vph) 20 390 10 20 451 40 10 20 40 40 10 20Pedestrians 8 11 5Lane Width (ft) 12.0 12.0 12.0Walking Speed (ft/s) 4.0 4.0 4.0Percent Blockage 1 1 0Right turn flare (veh)Median type None NoneMedian storage veh)Upstream signal (ft) 721pX, platoon unblockedvC, conflicting volume 496 411 990 982 406 1001 967 484vC1, stage 1 conf volvC2, stage 2 conf volvCu, unblocked vol 496 411 990 982 406 1001 967 484tC, single (s) 4.1 4.1 7.1 6.5 6.2 7.1 6.5 6.2tC, 2 stage (s)tF (s) 2.2 2.2 3.5 4.0 3.3 3.5 4.0 3.3p0 queue free % 98 98 95 92 94 79 96 97cM capacity (veh/h) 1069 1148 201 239 643 187 242 577
Direction, Lane # EB 1 WB 1 NB 1 SB 1Volume Total 420 511 70 70Volume Left 20 20 10 40Volume Right 10 40 40 20cSH 1069 1148 358 241Volume to Capacity 0.02 0.02 0.20 0.29Queue Length 95th (ft) 1 1 18 29Control Delay (s) 0.6 0.5 17.5 25.9Lane LOS A A C DApproach Delay (s) 0.6 0.5 17.5 25.9Approach LOS C D
Intersection SummaryAverage Delay 3.3Intersection Capacity Utilization 51.2% ICU Level of Service AAnalysis Period (min) 15
HCM Unsignalized Intersection Capacity Analysis Children's Hospital 21: MLK Way & RIRO Main Garage DC_2035 PM Plus Phase 2
Fehr & Peers Synchro 8 Report
Movement WBL WBR NBT NBR SBL SBTLane ConfigurationsVolume (veh/h) 0 123 2217 34 0 1916Sign Control Stop Free FreeGrade 0% 0% 0%Peak Hour Factor 1.00 1.00 1.00 1.00 1.00 1.00Hourly flow rate (vph) 0 123 2217 34 0 1916PedestriansLane Width (ft)Walking Speed (ft/s)Percent BlockageRight turn flare (veh)Median type None NoneMedian storage veh)Upstream signal (ft) 154 137pX, platoon unblocked 0.71 0.63 0.63vC, conflicting volume 2873 756 2251vC1, stage 1 conf volvC2, stage 2 conf volvCu, unblocked vol 554 0 905tC, single (s) 6.8 6.9 4.1tC, 2 stage (s)tF (s) 3.5 3.3 2.2p0 queue free % 100 82 100cM capacity (veh/h) 330 678 468
Direction, Lane # WB 1 NB 1 NB 2 NB 3 SB 1 SB 2 SB 3Volume Total 123 887 887 477 639 639 639Volume Left 0 0 0 0 0 0 0Volume Right 123 0 0 34 0 0 0cSH 678 1700 1700 1700 1700 1700 1700Volume to Capacity 0.18 0.52 0.52 0.28 0.38 0.38 0.38Queue Length 95th (ft) 16 0 0 0 0 0 0Control Delay (s) 11.5 0.0 0.0 0.0 0.0 0.0 0.0Lane LOS BApproach Delay (s) 11.5 0.0 0.0Approach LOS B
Intersection SummaryAverage Delay 0.3Intersection Capacity Utilization 57.9% ICU Level of Service BAnalysis Period (min) 15
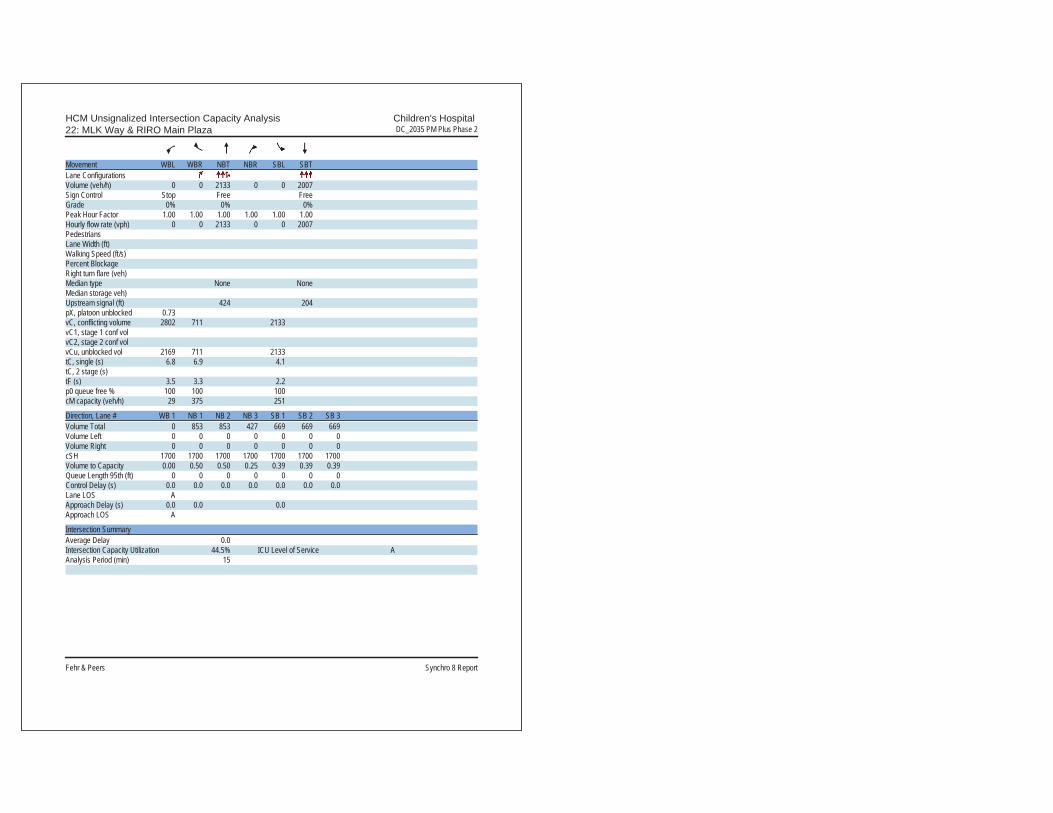
HCM Unsignalized Intersection Capacity Analysis Children's Hospital 22: MLK Way & RIRO Main Plaza DC_2035 PM Plus Phase 2
Fehr & Peers Synchro 8 Report
Movement WBL WBR NBT NBR SBL SBTLane ConfigurationsVolume (veh/h) 0 0 2133 0 0 2007Sign Control Stop Free FreeGrade 0% 0% 0%Peak Hour Factor 1.00 1.00 1.00 1.00 1.00 1.00Hourly flow rate (vph) 0 0 2133 0 0 2007PedestriansLane Width (ft)Walking Speed (ft/s)Percent BlockageRight turn flare (veh)Median type None NoneMedian storage veh)Upstream signal (ft) 424 204pX, platoon unblocked 0.73vC, conflicting volume 2802 711 2133vC1, stage 1 conf volvC2, stage 2 conf volvCu, unblocked vol 2169 711 2133tC, single (s) 6.8 6.9 4.1tC, 2 stage (s)tF (s) 3.5 3.3 2.2p0 queue free % 100 100 100cM capacity (veh/h) 29 375 251
Direction, Lane # WB 1 NB 1 NB 2 NB 3 SB 1 SB 2 SB 3Volume Total 0 853 853 427 669 669 669Volume Left 0 0 0 0 0 0 0Volume Right 0 0 0 0 0 0 0cSH 1700 1700 1700 1700 1700 1700 1700Volume to Capacity 0.00 0.50 0.50 0.25 0.39 0.39 0.39Queue Length 95th (ft) 0 0 0 0 0 0 0Control Delay (s) 0.0 0.0 0.0 0.0 0.0 0.0 0.0Lane LOS AApproach Delay (s) 0.0 0.0 0.0Approach LOS A
Intersection SummaryAverage Delay 0.0Intersection Capacity Utilization 44.5% ICU Level of Service AAnalysis Period (min) 15