Embed Size (px)
Citation preview
C1
Appendix C Data Tables by Ethnicity
Appendix C – Data Tables by Ethnicity
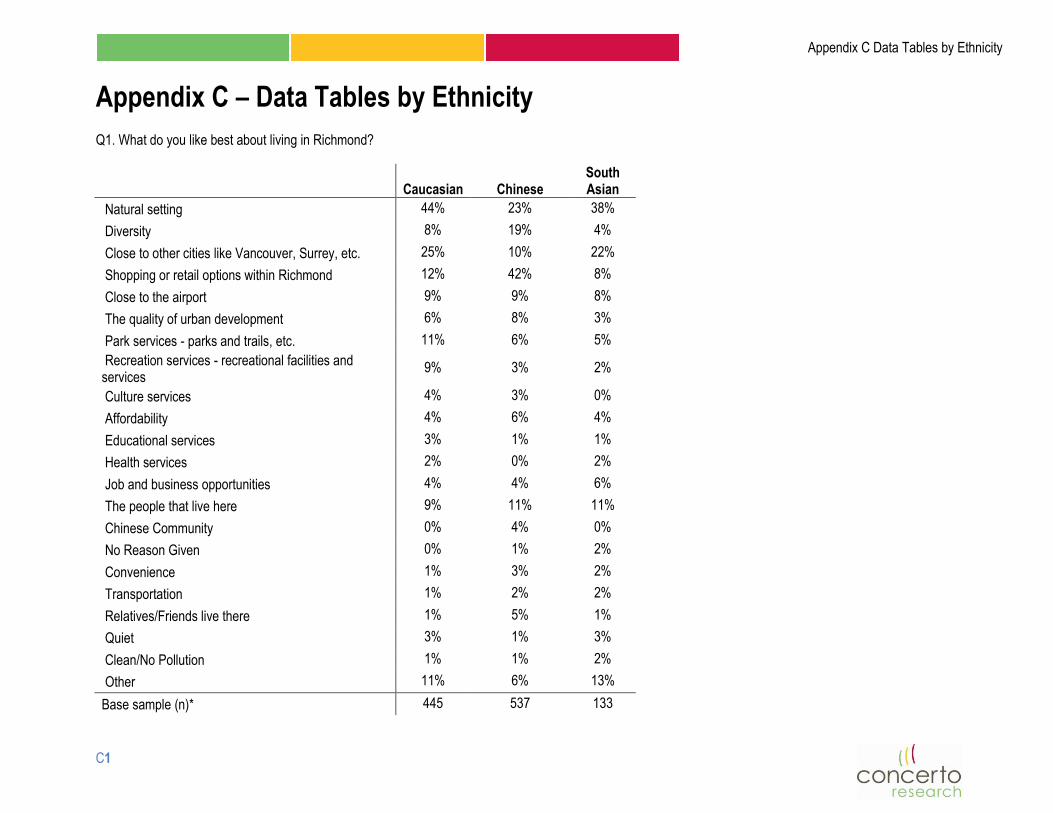
Q1. What do you like best about living in Richmond?
Caucasian Chinese South Asian
Natural setting 44% 23% 38%
Diversity 8% 19% 4%
Close to other cities like Vancouver, Surrey, etc. 25% 10% 22%
Shopping or retail options within Richmond 12% 42% 8%
Close to the airport 9% 9% 8%
The quality of urban development 6% 8% 3%
Park services - parks and trails, etc. 11% 6% 5%
Recreation services - recreational facilities and services
9% 3% 2%
Culture services 4% 3% 0%
Affordability 4% 6% 4%
Educational services 3% 1% 1%
Health services 2% 0% 2%
Job and business opportunities 4% 4% 6%
The people that live here 9% 11% 11%
Chinese Community 0% 4% 0%
No Reason Given 0% 1% 2%
Convenience 1% 3% 2%
Transportation 1% 2% 2%
Relatives/Friends live there 1% 5% 1%
Quiet 3% 1% 3%
Clean/No Pollution 1% 1% 2%
Other 11% 6% 13%
Base sample (n)* 445 537 133

C2
Appendix C Data Tables by Ethnicity
*The base sample is based on total counts less any „refused‟ or „don‟t know‟. Respondents could provide more than one response to this question
In this section of the survey we would like to focus on some of Richmond's public outdoor areas - such as parks, playgrounds, and nature trails. In the next few
questions, I would like to ask you about some of the activities you or members in your household may do in these areas.
Q2. For the following activities, please indicate how often you or members of your household do this activity in one of Richmond's public parks, playgrounds, or
nature trails.
Caucasian Frequently Occasionally Hardly Ever Never Base sample (n)
Walk or run 59% 28% 7% 7% 458
Cycling for recreation or exercise 31% 24% 9% 35% 458
Socialize outdoors 29% 38% 13% 20% 458
Play organized or informal outdoor sports 19% 22% 13% 45% 458
Play at a public children's playground outside of school play time in Richmond 19% 17% 12% 51% 455
Visit Richmond Nature Park, an interpretative and educational park in Richmond 11% 42% 26% 21% 457
Attend outdoor community events in one of Richmond's public parks 17% 47% 18% 18% 457
Chinese Frequently Occasionally Hardly Ever Never Base sample (n)
Walk or run 41% 38% 16% 6% 565
Cycling for recreation or exercise 12% 30% 23% 35% 563
Socialize outdoors 12% 35% 28% 25% 563
Play organized or informal outdoor sports 10% 24% 29% 36% 561
Play at a public children's playground outside of school play time in Richmond 15% 22% 25% 38% 564
Visit Richmond Nature Park, an interpretative and educational park in Richmond 7% 27% 33% 33% 554
Attend outdoor community events in one of Richmond's public parks 9% 28% 31% 33% 563

C3
Appendix C Data Tables by Ethnicity
Q2 continued
South Asian Frequently Occasionally Hardly Ever Never Base sample (n)
Walk or run 49% 33% 8% 10% 132
Cycling for recreation or exercise 18% 29% 15% 38% 132
Socialize outdoors 27% 34% 21% 17% 132
Play organized or informal outdoor sports 20% 28% 17% 35% 132
Play at a public children's playground outside of school play time in Richmond 30% 28% 14% 28% 131
Visit Richmond Nature Park, an interpretative and educational park in Richmond 15% 43% 19% 24% 131
Attend outdoor community events in one of Richmond's public parks 15% 46% 20% 19% 132

C4
Appendix C Data Tables by Ethnicity
IF „FREQUENTLY‟ OR „OCCASSIONALLY‟ IN Q2: Q3. For those activities that you or members in your household do frequently or occasionally, where do you typically go to do this activity?
* Respondents could provide more than one response to this question
Walk or Run Caucasian Chinese
South Asian
At a major park 35% 21% 35%
At a neighbourhood park 45% 78% 58%
At a trail 37% 21% 10%
Somewhere else (other) 3% 1% 2%
Base sample (n)* 391 439 105
Cycling for Recreation or Exercise Caucasian Chinese
South Asian
At a major park 19% 19% 21%
At a neighbourhood park 39% 67% 60%
At a trail 54% 30% 22%
Somewhere else (other) 4% 2% 3%
Base sample (n)* 244 226 58
Socialize Outdoors Caucasian Chinese
South Asian
At a major park 44% 31% 34%
At a neighbourhood park 54% 67% 66%
At a trail 15% 11% 4%
Somewhere else (other) 2% 3% 1%
Base sample (n)* 287 250 76

C5
Appendix C Data Tables by Ethnicity
Play organized or informal outdoor sports Caucasian Chinese
South Asian
At a major park 43% 32% 34%
At a neighbourhood park 57% 67% 63%
At a trail 7% 8% 6%
Somewhere else (other) 2% 2% 3%
Base sample (n)* 174 177 62
Play at a public children's playground outside of school play time Caucasian Chinese
South Asian
At a major park 26% 19% 30%
At a neighbourhood park 77% 79% 70%
At a trail 5% 10% 4%
Somewhere else (other) 3% 2% 0%
Base sample (n)* 159 198 73
Attend outdoor community events Caucasian Chinese
South Asian
At a major park 57% 41% 42%
At a neighbourhood park 47% 63% 58%
At a trail 8% 6% 4%
Somewhere else (other) 1% 0% 0%
Base sample (n)* 268 185 77

C6
Appendix C Data Tables by Ethnicity
Q4. And is there anything that prevents or discourages you or anyone else in your household from doing the following more often?
Table shows % answering „Yes‟ Caucasian Chinese
South Asian
Walking or running in one of Richmond's public parks or trails 19% 22% 19%
Cycling for recreation or exercise in one of Richmond's public parks or trails 15% 17% 12%
Socializing outdoors in one of Richmond's public parks, playgrounds, or trails 10% 16% 9%
Playing organized or informal outdoor sports in one of Richmond's public parks 10% 15% 8%
Playing at a public children's playground outside of school play time in Richmond 6% 13% 7%
Visiting Richmond Nature Park, an interpretive and educational park in Richmond 9% 22% 11%
Attending outdoor community events in one of Richmond's public parks 10% 20% 6%
Base sample (n)* 451-457 544-562 130-132
*The base sample varies slightly within each region due to „refused‟ and „don‟t know‟ responses being excluded

C7
Appendix C Data Tables by Ethnicity
IF „YES‟ IN Q4: Q5. What prevents you or anyone else in your household from doing this more often?
Walking or Running Caucasian Chinese
South Asian
Not enough time 17% 42% 56%
Awareness 2% 1% 0%
Distance or transportation 11% 17% 4%
Accessibility or mobility 21% 6% 4%
Lack of facilities 3% 6% 0%
Cost - too expensive 1% 2% 0%
Preference 0% 2% 0%
Comfort level 17% 18% 8%
Language is a barrier 0% 1% 0%
Dogs 13% 4% 8%
Cleanliness 1% 9% 4%
Other 17% 10% 12%
Nothing/ Don't know 0% 2% 4%
Base sample (n)* 89 125 25
* Respondents could provide more than one response to this question

C8
Appendix C Data Tables by Ethnicity
Q5 continued
Cycling for Recreation or Exercise Caucasian Chinese
South Asian
Not enough time 13% 40% 44%
Awareness 0% 2% 0%
Distance or transportation 13% 13% 0%
Accessibility or mobility 12% 2% 19%
Lack of facilities 1% 2% 0%
Cost - too expensive 0% 0% 0%
Preference 1% 4% 0%
Comfort level 10% 9% 6%
Language is a barrier 0% 1% 0%
Dogs 3% 0% 13%
Health/Age 18% 7% 0%
Other 28% 23% 13%
Nothing/ Don't know 1% 0% 6%
Base sample (n)* 68 97 16

C9
Appendix C Data Tables by Ethnicity
Q5 continued
Socializing Outdoors Caucasian Chinese
South Asian
Not enough time 32% 47% 75%
Awareness 2% 1% 0%
Distance or transportation 9% 20% 0%
Accessibility or mobility 0% 1% 8%
Lack of facilities 7% 2% 0%
Cost - too expensive 0% 1% 0%
Preference 7% 7% 8%
Comfort level 16% 5% 8%
Language is a barrier 2% 3% 0%
Cleanliness 2% 3% 0%
Other 27% 19% 8%
Nothing/ Don't know 2% 2% 0%
Base sample (n)* 44 91 12
C10
Appendix C Data Tables by Ethnicity
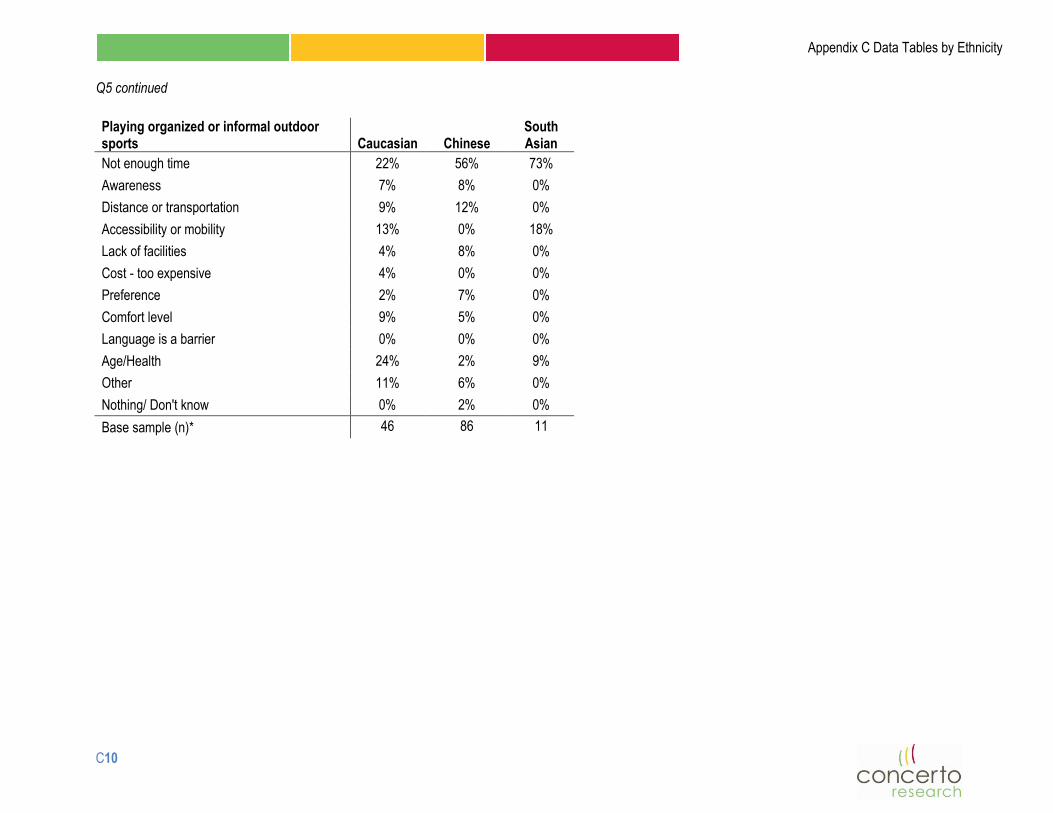
Q5 continued
Playing organized or informal outdoor sports Caucasian Chinese
South Asian
Not enough time 22% 56% 73%
Awareness 7% 8% 0%
Distance or transportation 9% 12% 0%
Accessibility or mobility 13% 0% 18%
Lack of facilities 4% 8% 0%
Cost - too expensive 4% 0% 0%
Preference 2% 7% 0%
Comfort level 9% 5% 0%
Language is a barrier 0% 0% 0%
Age/Health 24% 2% 9%
Other 11% 6% 0%
Nothing/ Don't know 0% 2% 0%
Base sample (n)* 46 86 11

C11
Appendix C Data Tables by Ethnicity
Q5 continued
Playing at a public children's playground Caucasian Chinese
South Asian
Not enough time 34% 59% 78%
Awareness 7% 0% 0%
Distance or transportation 10% 11% 0%
Accessibility or mobility 14% 0% 11%
Lack of facilities 0% 6% 0%
Cost - too expensive 0% 4% 0%
Preference 0% 7% 0%
Comfort level 10% 10% 0%
Language is a barrier 0% 0% 11%
Other 21% 11% 0%
Nothing/ Don't know 7% 1% 0%
Base sample (n)* 29 70 9

C12
Appendix C Data Tables by Ethnicity
Q5 continued
Visiting Richmond Nature Park Caucasian Chinese
South Asian
Not enough time 33% 53% 64%
Awareness 5% 9% 7%
Distance or transportation 42% 29% 0%
Accessibility or mobility 12% 1% 7%
Lack of facilities 0% 3% 0%
Cost - too expensive 2% 3% 7%
Preference 0% 5% 0%
Comfort level 5% 1% 7%
Language is a barrier 0% 2% 0%
Other 9% 7% 7%
Nothing/ Don't know 2% 3% 0%
Base sample (n)* 43 119 14

C13
Appendix C Data Tables by Ethnicity
Attending outdoor community events Caucasian Chinese
South Asian
Not enough time 43% 55% 75%
Awareness 11% 21% 0%
Distance or transportation 20% 6% 0%
Accessibility or mobility 7% 3% 0%
Lack of facilities 0% 4% 0%
Cost - too expensive 2% 0% 0%
Preference 0% 5% 13%
Comfort level 5% 6% 13%
Language is a barrier 0% 5% 0%
Other 20% 7% 0%
Nothing/ Don't know 0% 4% 0%
Base sample (n)* 44 111 8

C14
Appendix C Data Tables by Ethnicity
Q6. Do you think that the City of Richmond currently offers enough and adequate parks, playgrounds, and trails for you or members in your household?
Caucasian Chinese South Asian
Yes 82% 82% 91%
No 18% 18% 9%
Base sample (n) 443 511 129
In this section of the survey we would like to focus on some of Richmond's recreational and cultural facilities and how often or little you or members in your
household make use these facilities.
Q7. For the following activities, please indicate how often you or members in your household do this activity. You may choose between “frequently”, “occasionally”,
“hardly ever”, and “never” for each activity.
Caucasian Frequently Occasionally Hardly Ever Never Base
sample (n)
Visit Richmond's Arts Centre and/or Richmond Art Gallery
7% 37% 24% 33% 458
Visit Richmond Museum, Steveston Museum, or one of Richmond heritage sites
11% 45% 23% 20% 457
Visit one of Richmond's indoor or outdoor public swimming pools
25% 31% 18% 26% 459
Visit one of Richmond's ice arenas 13% 29% 20% 38% 458
Visit one of Richmond's public libraries 47% 32% 10% 11% 460
Visit Gateway Theatre 9% 37% 24% 30% 459
Visit Minoru Place Seniors Activity Centre 9% 13% 12% 67% 460
Visit one of Richmond's eight Community Centres 38% 33% 9% 19% 458

C15
Appendix C Data Tables by Ethnicity
Q7 continued
Chinese Frequently Occasionally Hardly Ever Never Base
sample (n)
Visit Richmond's Arts Centre and/or Richmond Art Gallery
4% 27% 27% 42% 548
Visit Richmond Museum, Steveston Museum, or one of Richmond heritage sites
2% 23% 35% 41% 556
Visit one of Richmond's indoor or outdoor public swimming pools
22% 35% 22% 21% 567
Visit one of Richmond's ice arenas 7% 27% 26% 40% 563
Visit one of Richmond's public libraries 46% 36% 11% 7% 566
Visit Gateway Theatre 3% 28% 29% 40% 552
Visit Minoru Place Seniors Activity Centre 6% 14% 18% 63% 561
Visit one of Richmond's eight Community Centres 19% 33% 20% 28% 555
South Asian Frequently Occasionally Hardly Ever Never Base
sample (n)
Visit Richmond's Arts Centre and/or Richmond Art Gallery
6% 21% 26% 47% 136
Visit Richmond Museum, Steveston Museum, or one of Richmond heritage sites
9% 26% 22% 43% 136
Visit one of Richmond's indoor or outdoor public swimming pools
23% 40% 14% 23% 136
Visit one of Richmond's ice arenas 19% 27% 16% 39% 135
Visit one of Richmond's public libraries 52% 28% 9% 10% 137
Visit Gateway Theatre 7% 28% 15% 49% 137
Visit Minoru Place Seniors Activity Centre 10% 21% 16% 52% 136
Visit one of Richmond's eight Community Centres 20% 29% 15% 37% 139

C16
Appendix C Data Tables by Ethnicity
IF „FREQUENTLY‟ OR „OCCASSIONALLY‟ IN Q7 „VISIT ONE OF RICHMOND‟S EIGHT COMMUNITY CENTRES‟:
Q8. And which of the following things do you or members in your household typically do at a community centre?
Table shows % answering „Yes‟ Caucasian Chinese
South Asian
Use the fitness facility 59% 38% 55%
Go to a drop-in program 50% 34% 35%
Go to a registered program 53% 37% 40%
Use licensed preschool or out-of-school care 14% 10% 20%
Hang out or gather or socialize with friends 40% 40% 58%
Attend meetings or functions of other community organizations
44% 17% 39%
Book a room or attend a private function 36% 17% 24%
To use the washroom 79% 82% 73%
Other 7% 3% 11%
Base sample (n)* 324 285 66
*The base sample varies slightly within each region due to „refused‟ and „don‟t know‟ responses being excluded

C17
Appendix C Data Tables by Ethnicity
Q9. And is there anything that prevents or discourages you or anyone in your household from doing the following more often?
Table shows % answering „Yes‟ Caucasian Chinese
South Asian
Visiting Richmond's Arts Centre or Richmond Art Gallery
16% 37% 17%
Visiting Richmond Museum, Steveston Museum, or one of Richmond's heritage sites
12% 33% 17%
Visiting one of Richmond's indoor or outdoor public swimming pools
19% 29% 14%
Visiting one of Richmond's ice arenas 9% 20% 10%
Visiting one of Richmond's public libraries 11% 15% 15%
Visiting Gateway Theatre 12% 24% 15%
Visiting Minoru Place Seniors Activity Centre 5% 18% 10%
Visiting one of Richmond's eight Community Centres 7% 23% 14%
Base sample (n)* 454-458 534-567 131-137
*The base sample varies slightly within each region due to „refused‟ and „don‟t know‟ responses being excluded

C18
Appendix C Data Tables by Ethnicity
IF „YES‟ TO Q9: Q10. If yes, probe for reason(s)
Visiting Richmond‟s Arts Centre and/ or Richmond Art Gallery Caucasian Chinese
South Asian
Not enough time 35% 40% 65%
Awareness 9% 19% 13%
Distance or transportation 19% 12% 9%
Accessibility or mobility 4% 2% 0%
Lack of facilities 1% 0% 0%
Cost - too expensive 3% 7% 9%
Preference - prefer to go elsewhere 15% 12% 0%
Comfort level 3% 1% 0%
Language is a barrier 0% 8% 0%
Other 18% 12% 4%
None/Don't know 0% 3% 4%
Base sample (n)* 74 201 23
* Respondents could provide more than one response to this question

C19
Appendix C Data Tables by Ethnicity
Q10 continued
Visiting Richmond Museum, Steveston Museum, or one of Richmond's heritage sites Caucasian Chinese
South Asian
Not enough time 36% 36% 74%
Awareness 7% 22% 13%
Distance or transportation 16% 14% 9%
Accessibility or mobility 7% 2% 0%
Lack of facilities 0% 2% 0%
Cost - too expensive 5% 7% 4%
Preference - prefer to go elsewhere 9% 9% 0%
Comfort level 4% 1% 4%
Language is a barrier 0% 10% 0%
Other 16% 11% 0%
None/Don't know 0% 2% 0%
Base sample (n)* 55 181 23

C20
Appendix C Data Tables by Ethnicity
Q10 continued
Visiting one of Richmond's indoor and/or outdoor public swimming pools Caucasian Chinese
South Asian
Not enough time 18% 35% 68%
Awareness 0% 4% 5%
Distance or transportation 7% 9% 11%
Accessibility or mobility 2% 1% 0%
Lack of facilities 5% 4% 0%
Cost - too expensive 5% 3% 5%
Preference - prefer to go elsewhere 19% 12% 0%
Comfort level 8% 4% 5%
Language is a barrier 0% 4% 0%
Do not swim 2% 7% 0%
Pools cleanliness 19% 12% 0%
Health and age 8% 6% 0%
Pools are crowded 8% 6% 0%
Other 8% 6% 5%
None/Don't know 1% 1% 0%
Base sample (n)* 85 162 19

C21
Appendix C Data Tables by Ethnicity
Q10 continued
Visiting one of Richmond's ice arenas Caucasian Chinese South Asian
Not enough time 36% 53% 71%
Awareness 0% 4% 7%
Distance or transportation 10% 4% 7%
Accessibility or mobility 8% 0% 0%
Lack of facilities 0% 0% 0%
Cost - too expensive 0% 3% 7%
Preference - prefer to go elsewhere 13% 12% 7%
Comfort level 3% 2% 0%
Language is a barrier 0% 6% 0%
Do not skate 18% 5% 0%
Health and age 8% 4% 0%
Other 5% 7% 0%
None/Don't know 0% 3% 0%
Base sample (n)* 39 112 14

C22
Appendix C Data Tables by Ethnicity
Q10 continued
Visiting one of Richmond's public libraries Caucasian Chinese South Asian
Not enough time 33% 46% 60%
Awareness 0% 2% 10%
Distance or transportation 18% 13% 20%
Accessibility or mobility 6% 1% 0%
Lack of facilities 0% 3% 5%
Cost - too expensive 0% 1% 0%
Preference - prefer to go elsewhere 4% 3% 5%
Comfort level 2% 1% 0%
Language is a barrier 0% 9% 0%
Libraries are crowded 10% 7% 0%
Libraries are lacking books 12% 5% 0%
Other 24% 17% 0%
None/Don't know 0% 1% 0%
Base sample (n)* 51 87 20

C23
Appendix C Data Tables by Ethnicity
Q10 continued
Visiting Gateway Theatre Caucasian Chinese
South Asian
Not enough time 23% 43% 57%
Awareness 4% 19% 10%
Distance or transportation 18% 11% 10%
Accessibility or mobility 4% 1% 5%
Lack of facilities 2% 1% 0%
Cost - too expensive 30% 10% 10%
Preference - prefer to go elsewhere 11% 6% 0%
Comfort level 2% 1% 0%
Language is a barrier 0% 6% 0%
Other 18% 7% 10%
None/Don't know 4% 3% 0%
Base sample (n)* 56 134 21

C24
Appendix C Data Tables by Ethnicity
Q10 continued
Visiting Minoru Place Seniors Activity Centre Caucasian Chinese South Asian
Not enough time 21% 47% 77%
Awareness 0% 24% 15%
Distance or transportation 21% 10% 8%
Accessibility or mobility 0% 1% 0%
Lack of facilities 4% 1% 0%
Cost - too expensive 4% 0% 0%
Preference - prefer to go elsewhere 25% 7% 0%
Comfort level 8% 1% 0%
Language is a barrier 0% 7% 0%
Other 17% 3% 0%
None/Don't know 0% 4% 0%
Base sample (n)* 24 94 13

C25
Appendix C Data Tables by Ethnicity
Q10 continued
Visiting one of Richmond's eight Community Centres Caucasian Chinese South Asian
Not enough time 50% 54% 78%
Awareness 0% 10% 6%
Distance or transportation 18% 8% 17%
Accessibility or mobility 0% 1% 0%
Lack of facilities 0% 2% 6%
Cost - too expensive 3% 1% 0%
Preference - prefer to go elsewhere 6% 11% 0%
Comfort level 3% 2% 0%
Language is a barrier 0% 6% 0%
Other 29% 7% 6%
None/Don't know 0% 7% 0%
Base sample (n)* 34 126 18
Q11. Do you think that the City of Richmond currently offers enough and adequate public facilities such as community centres, arenas, pools, museums, libraries,
etc. for you or members in your household?
Caucasian Chinese South Asian
Yes 82% 77% 87%
No 18% 23% 13%
Base sample (n) 447 514 130

C26
Appendix C Data Tables by Ethnicity
In this section we would like to focus on the types of recreational, cultural, and instructional programs that are available at public facilities in Richmond.
Q12. For the following activities and programs, please indicate whether or not you or members in your household actively participated in any one of these in the
past two years at a public facility in Richmond.
Table shows % answering „Yes‟ Caucasian Chinese
South Asian
Performing arts programs or drop-ins 27% 16% 15%
Visual arts or crafts programs or drop-ins 19% 16% 20%
Sports programs 34% 25% 35%
Fitness, wellness, or health programs or drop-ins 55% 23% 40%
Instructional programs 24% 17% 20%
Nature or outdoor programs or drop-ins 30% 15% 39%
Heritage programs or drop-ins 27% 13% 21%
Special events 61% 32% 31%
Casual physical activities 55% 38% 50%
Base sample (n)* 452 536 121
*The base sample varies slightly within each region due to „refused‟ and „don‟t know‟ responses being excluded

C27
Appendix C Data Tables by Ethnicity
Q13. And is there anything that prevents or discourages you or anyone in your household from participating in the following activities more often?
Table shows % answering „Yes‟ Caucasian Chinese
South Asian
Performing arts programs or drop-ins 16% 36% 18%
Visual arts or crafts programs or drop-ins 12% 30% 11%
Sports programs 12% 27% 11%
Fitness, wellness, or health programs or drop-ins 13% 29% 12%
Instructional programs 9% 29% 9%
Nature or Outdoor programs or drop-ins 11% 27% 10%
Heritage programs or drop-ins 10% 27% 12%
Special events in Richmond 10% 30% 16%
Casual physical activities 8% 25% 11%
Base sample (n)* 449-461 499-553 116-133
*The base sample varies slightly within each region due to „refused‟ and „don‟t know‟ responses being excluded

C28
Appendix C Data Tables by Ethnicity
IF „YES‟ TO Q13: Q14. If yes, probe for reason(s)
Performing arts programs or drop-ins at a public facility in Richmond Caucasian Chinese
South Asian
Not enough time 38% 59% 71%
Awareness 4% 14% 8%
Distance or transportation 14% 6% 4%
Accessibility or mobility 7% 1% 0%
Lack of facilities 0% 0% 0%
Cost - too expensive 14% 3% 0%
Preference 6% 12% 4%
Comfort level 4% 1% 4%
Language is a barrier 1% 7% 0%
Availability - programs were full or unavailable 7% 2% 0%
Lack of programs - no programs of interest are offered
3% 4% 0%
Timing 1% 3% 0%
Lack of info 4% 2% 0%
Performing arts are crowded 1% 0% 4%
Health and age 3% 3% 4%
Other 7% 3% 0%
None/Don't know 3% 2% 0%
Base sample (n)* 72 195 24
* Respondents could provide more than one response to this question

C29
Appendix C Data Tables by Ethnicity
Q14 continued
Visual arts or crafts program or drop-ins at a public facility in Richmond Caucasian Chinese
South Asian
Not enough time 44% 59% 73%
Awareness 4% 18% 13%
Distance or transportation 17% 5% 7%
Accessibility or mobility 4% 2% 0%
Lack of facilities 2% 1% 0%
Cost - too expensive 9% 3% 0%
Preference 4% 9% 0%
Comfort level 2% 0% 0%
Language is a barrier 0% 9% 0%
Availability - programs were full or unavailable 4% 3% 0%
Lack of programs - no programs of interest are offered
0% 1% 7%
Timing 4% 4% 0%
Other 9% 4% 7%
None/Don't know 2% 2% 0%
Base sample (n)* 54 163 15

C30
Appendix C Data Tables by Ethnicity
Q14 continued
Sports programs at a public facility in Richmond Caucasian Chinese South Asian
Not enough time 39% 56% 67%
Awareness 2% 9% 7%
Distance or transportation 9% 5% 7%
Accessibility or mobility 7% 0% 7%
Lack of facilities 4% 2% 0%
Cost - too expensive 5% 2% 0%
Preference 7% 11% 0%
Comfort level 0% 1% 0%
Language is a barrier 0% 6% 0%
Availability - programs were full or unavailable 5% 4% 0%
Lack of programs - no programs of interest are offered
9% 2% 7%
Timing 0% 3% 0%
Health and age 14% 3% 13%
Other 7% 3% 0%
None/Don't know 0% 3% 0%
Base sample (n)* 56 149 15
C31
Appendix C Data Tables by Ethnicity
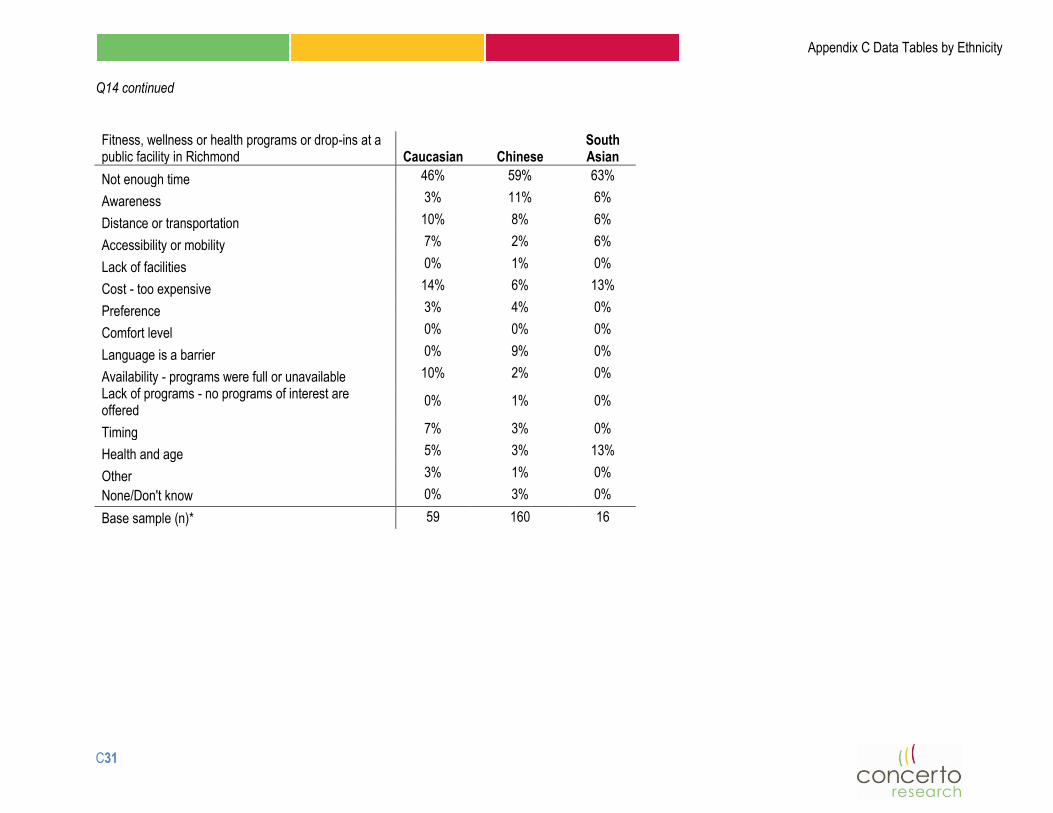
Q14 continued
Fitness, wellness or health programs or drop-ins at a public facility in Richmond Caucasian Chinese
South Asian
Not enough time 46% 59% 63%
Awareness 3% 11% 6%
Distance or transportation 10% 8% 6%
Accessibility or mobility 7% 2% 6%
Lack of facilities 0% 1% 0%
Cost - too expensive 14% 6% 13%
Preference 3% 4% 0%
Comfort level 0% 0% 0%
Language is a barrier 0% 9% 0%
Availability - programs were full or unavailable 10% 2% 0%
Lack of programs - no programs of interest are offered
0% 1% 0%
Timing 7% 3% 0%
Health and age 5% 3% 13%
Other 3% 1% 0%
None/Don't know 0% 3% 0%
Base sample (n)* 59 160 16

C32
Appendix C Data Tables by Ethnicity
Q14 continued
Instructional programs at a public facility in Richmond Caucasian Chinese South Asian
Not enough time 47% 56% 50%
Awareness 7% 15% 8%
Distance or transportation 9% 9% 8%
Accessibility or mobility 0% 1% 8%
Lack of facilities 2% 0% 0%
Cost - too expensive 14% 2% 8%
Preference 2% 8% 0%
Comfort level 0% 0% 0%
Language is a barrier 0% 9% 8%
Availability - programs were full or unavailable 2% 2% 0%
Lack of programs - no programs of interest are offered
2% 2% 0%
Timing 16% 4% 0%
Other 2% 6% 8%
None/Don't know 0% 2% 0%
Base sample (n)* 43 163 12

C33
Appendix C Data Tables by Ethnicity
Q14 continued
Nature or outdoor programs or drop-ins at a public facility in Richmond Caucasian Chinese
South Asian
Not enough time 53% 61% 54%
Awareness 4% 17% 8%
Distance or transportation 16% 5% 8%
Accessibility or mobility 4% 1% 8%
Lack of facilities 2% 0% 8%
Cost - too expensive 8% 1% 8%
Preference 0% 8% 0%
Comfort level 4% 0% 0%
Language is a barrier 0% 7% 0%
Availability - programs were full or unavailable 6% 0% 0%
Lack of programs - no programs of interest are offered
0% 1% 0%
Timing 0% 4% 0%
Other 10% 2% 8%
None/Don't know 0% 2% 0%
Base sample (n)* 49 146 13

C34
Appendix C Data Tables by Ethnicity
Q14 continued
Heritage programs or drop-ins Caucasian Chinese South Asian
Not enough time 59% 57% 50%
Awareness 5% 27% 6%
Distance or transportation 9% 5% 13%
Accessibility or mobility 2% 1% 6%
Lack of facilities 2% 0% 0%
Cost - too expensive 7% 1% 25%
Preference 7% 6% 0%
Comfort level 0% 1% 0%
Language is a barrier 5% 8% 0%
Availability - programs were full or unavailable 0% 0% 0%
Lack of programs - no programs of interest are offered
0% 2% 0%
Timing 0% 1% 0%
Other 5% 1% 6%
None/Don't know 0% 5% 0%
Base sample (n)* 44 145 16

C35
Appendix C Data Tables by Ethnicity
Q14 continued
Special events in Richmond Caucasian Chinese South Asian
Not enough time 40% 53% 55%
Awareness 16% 24% 14%
Distance or transportation 18% 9% 9%
Accessibility or mobility 0% 1% 0%
Lack of facilities 13% 3% 0%
Cost - too expensive 9% 0% 14%
Preference 0% 2% 0%
Comfort level 0% 0% 0%
Language is a barrier 0% 5% 5%
Availability - programs were full or unavailable 2% 1% 0%
Lack of programs - no programs of interest are offered
0% 2% 0%
Timing 2% 1% 0%
Other 11% 7% 9%
None/Don't know 0% 4% 0%
Base sample (n)* 45 164 22

C36
Appendix C Data Tables by Ethnicity
Q14 continued
Casual physical activities Caucasian Chinese South Asian
Not enough time 45% 58% 69%
Awareness 3% 10% 0%
Distance or transportation 5% 8% 8%
Accessibility or mobility 18% 2% 0%
Lack of facilities 0% 0% 0%
Cost - too expensive 5% 0% 15%
Preference 3% 8% 0%
Comfort level 0% 1% 0%
Language is a barrier 0% 5% 8%
Availability - programs were full or unavailable 0% 3% 0%
Lack of programs - no programs of interest are offered
3% 2% 0%
Timing 0% 6% 0%
Physical health and age 24% 4% 0%
Other 3% 2% 8%
None/Don't know 3% 4% 0%
Base sample (n)* 38 124 13
Q15. Do you think that the City of Richmond currently offers enough and adequate public programs and drop- in activities for you or members in your household?
Caucasian Chinese South Asian
Yes 88% 78% 91%
No 12% 22% 9%
Base sample (n) 432 408 122

C37
Appendix C Data Tables by Ethnicity
Q16. In your opinion and experience, does the City of Richmond currently offer enough facilities, activities, or programs for the following groups?
Table shows % answering „Yes‟ Caucasian Chinese
South Asian
Preschoolers 71% 64% 80%
School aged children 77% 77% 80%
Teenagers 63% 68% 78%
Young adults 67% 64% 76%
Adults 86% 66% 85%
Seniors 85% 69% 81%
Families 75% 59% 79%
People with disabilities 64% 65% 70%
New immigrants 77% 62% 77%
Base sample (n)* 99-184 113-187 37-57
*The base sample varies slightly within each region due to „refused‟ and „don‟t know‟ responses being excluded
Q17. Do you or anyone in your household currently volunteer in Richmond, for instance for a religious organization, a community organization, a charity
organization, a sports/recreational organization, etc?
Caucasian Chinese South Asian
Yes 41% 34% 37%
No 59% 66% 63%
Base sample (n)* 236 274 65
*Note: This question was posed to only 50% of the entire survey sample

C38
Appendix C Data Tables by Ethnicity
Q17a. What, if anything, prevents or discourages you or members in your household from volunteering more of your time?
Table shows % answering „Yes‟ Caucasian Chinese
South Asian
Nothing - I or we volunteer as much or as little of our time as we would like
44% 30% 45%
I or we don't have enough time 46% 61% 58%
I or we are unable to make a long-term commitment 1% 1% 2%
I or we have given enough time already 2% 1% 0%
No one has asked me or us 1% 3% 0%
I or we have given enough money already 0% 0% 0%
I or we have no interest in volunteering 1% 1% 2%
I or we are physically unable to volunteer 5% 5% 0%
I or we don't know how to get involved 0% 3% 0%
I or we can't afford to volunteer (cost) 1% 2% 0%
I or we are dissatisfied through a previous experience 0% 0% 0%
Volunteer Language 0% 3% 0%
Other 4% 2% 0%
Don‟t know/ rather not say 6% 8% 6%
Base sample (n)* 222 258 62
*Note: This question was posed to only 50% of the entire survey sample

C39
Appendix C Data Tables by Ethnicity
Q18. If you were to be looking for information about parks, recreation, and cultural facilities and services in Richmond, which of the following sources of
information would you most likely turn to?
Table shows % answering „Yes‟ Caucasian Chinese
South Asian
Local newspapers 64% 50% 64%
Ethnic newspapers 17% 53% 28%
The City of Richmond website 70% 48% 58%
The City of Richmond Parks, Recreation, and Culture Guide
75% 47% 63%
A community centre, pool, or arena 61% 50% 55%
Ask a friend or relative 52% 57% 60%
The library 47% 55% 63%
A school 28% 24% 43%
Elsewhere (other) 7% 4% 2%
Base sample (n)* 216-219 243-249 63-67
*Note: This question was posed to only 50% of the entire survey sample. The base sample varies slightly within each region due to „refused‟ and „don‟t know‟
responses being excluded

C40
Appendix C Data Tables by Ethnicity
Q19. In the past 3 months, have you seen or heard any information about parks, recreation, and cultural facilities and services in Richmond in any of the following
ways?
Table shows % answering „Yes‟ Caucasian Chinese
South Asian
In the news (radio, newspaper, or television) 67% 49% 40%
Advertising (newspaper) 67% 42% 47%
In ethnic media (newspapers) 26% 44% 30%
On the City of Richmond website 32% 28% 24%
At a City of Richmond facility 63% 38% 37%
At a school 22% 21% 32%
Through word-of-mouth 55% 37% 39%
Elsewhere 5% 3% 6%
Base sample (n)* 218-236 275-294 62-68
*Note: This question was posed to only 50% of the entire survey sample. The base sample varies slightly within each region due to „refused‟ and „don‟t know‟
responses being excluded

C41
Appendix C Data Tables by Ethnicity
Finally, we would like to ask you a few questions about you and your household that will help us better understand the results. Please rest assured that the survey
is completely anonymous and we will not share any of your specific information with our client.
Q20. Which of the following best describes your household?
Caucasian Chinese South Asian
Single, no dependent children 22% 9% 6%
Single, with dependent children 7% 4% 6%
Couple, no dependent children 34% 20% 24%
Couple, with dependent children 37% 65% 62%
Live with roommate(s) 0% 0% 1%
Living with extended family or adult children 0% 1% 1%
Other 0% 0% 0%
Base sample (n) 454 562 133
IF „WITH DEPENDENT CHILDREN‟ IN Q20: Q20b. Which of the following best describes your children‟s age or ages?
Caucasian Chinese South Asian
Preschooler 19% 14% 23%
School aged 55% 38% 49%
Teenager 32% 38% 36%
Young adult 32% 47% 39%
Base sample (n)* 196 382 87
*Respondents could provide more than one response to this question

C42
Appendix C Data Tables by Ethnicity
Q21. Is there currently anyone in your household who is in any way restricted in their physical mobility?
Caucasian Chinese South Asian
Yes 12% 6% 6%
No 88% 94% 94%
Base sample (n) 461 564 133
Q22. What type of home do you currently live in?
Caucasian Chinese South Asian
House 57% 59% 73%
Duplex 3% 0% 7%
Townhouse 21% 24% 11%
Apartment or condominium 17% 17% 8%
Basement suite 0% 0% 2%
Other 1% 0% 0%
Base sample (n) 457 551 131

C43
Appendix C Data Tables by Ethnicity
Q23. Do you own or rent the residence you currently live in?
Caucasian Chinese South Asian
Own 83% 91% 77%
Rent 17% 9% 23%
Base sample (n) 453 533 128
Q24. Which of the following categories does your annual, pre-tax household income fall into?
Caucasian Chinese South Asian
Less than $25,000 6% 33% 8%
Between $25,000 and $50,000 19% 34% 39%
Between $50,000 and $75,000 25% 14% 26%
Between $75,000 and $100,000 24% 10% 20%
Between $100,000 and $125,000 14% 4% 2%
Between $125,000 and $150,000 5% 1% 2%
More than $150,000 7% 3% 3%
Base sample (n) 313 335 96

C44
Appendix C Data Tables by Ethnicity
Q25. Which of the following does your age fall into?
Q26. How long have you lived in Canada?
Caucasian Chinese South Asian
18 to 24 years old 1% 6% 10%
25 to 34 years old 5% 8% 16%
35 to 44 years old 21% 22% 24%
45 to 54 years old 25% 31% 25%
55 to 64 years old 27% 19% 14%
65 to 74 years old 14% 10% 9%
75 or older 7% 5% 3%
Base sample (n) 453 553 126
Caucasian Chinese South Asian
Whole life 72% 2% 7%
More than 20 years 21% 15% 43%
Between 10 and 20 years 3% 55% 25%
Between 5 and 10 years 1% 16% 18%
Less than 5 years 2% 11% 8%
Base sample (n) 458 559 130
C45
Appendix C Data Tables by Ethnicity
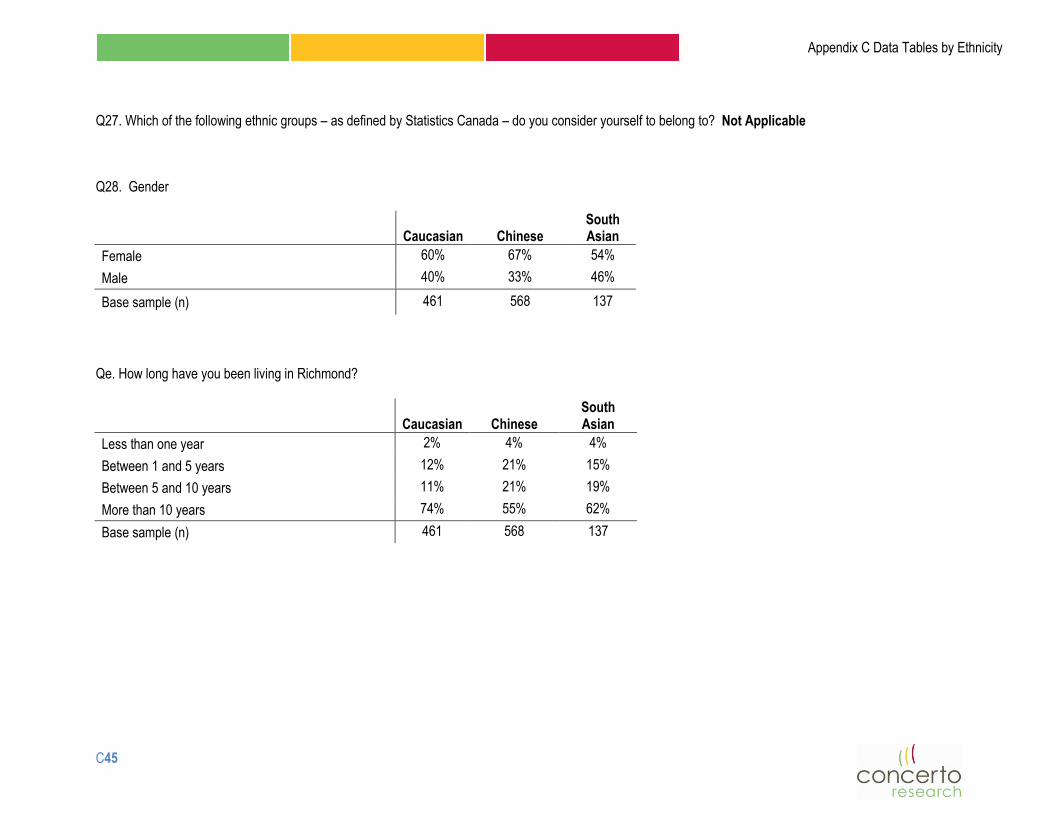
Q27. Which of the following ethnic groups – as defined by Statistics Canada – do you consider yourself to belong to? Not Applicable
Q28. Gender
Caucasian Chinese South Asian
Female 60% 67% 54%
Male 40% 33% 46%
Base sample (n) 461 568 137
Qe. How long have you been living in Richmond?
Caucasian Chinese
South Asian
Less than one year 2% 4% 4%
Between 1 and 5 years 12% 21% 15%
Between 5 and 10 years 11% 21% 19%
More than 10 years 74% 55% 62%
Base sample (n) 461 568 137