Embed Size (px)
Citation preview

APPENDIX B
COASTAL PROCESSES

Broad Beach Restoration Project
Coastal Engineering Report
Exhibit L to CDP Application 4-12-043
PREPARED FOR:
BROAD BEACH GEOLOGIC HAZARD ABATEMENT DISTRICT
PREPARED BY:
3780 KILROY AIRPORT WAY, SUITE 600, LONG BEACH, CA 90806
OCTOBER 2013
M&N FILE: 6935

Broad Beach Restoration Project, Coastal Engineering Report
Moffatt & Nichol i
Contents 1. Introduction ...................................................................................................................... 1 2. Goals and Scope of Study ................................................................................................... 2
2.1 Study Goals ........................................................................................................................ 2 2.2 Scope of Work ................................................................................................................... 2
3. Problem Description .......................................................................................................... 4 3.1 Broad Beach Erosion ......................................................................................................... 4 3.2 Homeowners Take Action ................................................................................................. 7 3.3 Emergency Temporary Revetment Permits and Conditions ........................................... 10
4. Project Background .......................................................................................................... 13 4.1 Regional Coastal Setting .................................................................................................. 13 4.2 Previous Relevant Studies ............................................................................................... 16
4.2.1 Draft USACE Coast of California Storm and Tidal Waves Study (Noble Consultants, May 2009) ................................................................................................. 16
4.2.2 Shoreline Stabilization Study, 31302 to 31340 Broad Beach Road (TerraCosta, 2008) .............................................................................................................................. 18
4.2.3 Development of Sand Budgets for California’s Major Littoral Cells (Patsch and Griggs, 2007) .................................................................................................................. 19
4.2.4 National Assessment of Shoreline Change Part 3: Historical Change and Associated Coastal Land Loss along Sandy Shorelines of the California Coast (USGS, OFR 2006-1219) ................................................................................................. 20
4.2.5 Summary of Broad Beach Erosion and Beach Nourishment Investigation and Responses to Proposed Nourishment Plan (Griggs, August 2012) ................................ 22
4.2.6 Sediment Transport Along the Malibu Coast (Everts, 2012) ......................................... 24 4.3 Existing Conditions .......................................................................................................... 25
4.3.1 Existing Biological Resources at Broad Beach ............................................................... 25 4.3.2 Discussion of Baseline Condition ................................................................................... 30
4.4 Existing Broad Beach Coastal Development.................................................................... 33 4.5 Public Access ................................................................................................................... 36
5. Oceanographic Site Conditions ......................................................................................... 38 5.1 Water Levels .................................................................................................................... 38
5.1.1 Tides ............................................................................................................................... 38 5.1.2 Extreme Water Level Statistics ...................................................................................... 38 5.1.3 Sea Level Rise ................................................................................................................. 39
5.2 Waves .............................................................................................................................. 43 5.2.1 Wave Exposure .............................................................................................................. 43 5.2.2 Wave Data Sources ........................................................................................................ 46 5.2.3 Extreme Waves .............................................................................................................. 48 5.2.4 Design Wave for Shoreline Structures ........................................................................... 50
6. Sediment Transport Analysis ............................................................................................ 52 6.1 Study Methodology ......................................................................................................... 52
6.1.1 Historic Shoreline Position Data .................................................................................... 53 6.1.2 Volumetric Shoreline Change Rates .............................................................................. 54 6.1.3 Sediment Bypass Data ................................................................................................... 54

Broad Beach Restoration Project, Coastal Engineering Report
Moffatt & Nichol ii
6.1.4 Wave Data ..................................................................................................................... 55 6.2 Sediment Transport within ZLC (Everts Coastal, 2009) ................................................... 55
6.2.1 Shoreline Changes ......................................................................................................... 55 6.2.2 Analysis of Historical Shoreline Positions within the ZLC .............................................. 62 6.2.3 Broad Beach Sediment Transport Rates ........................................................................ 65 6.2.4 Broad Beach and Zuma Beach Sediment Transport Interaction ................................... 69 6.2.5 Potential Causes of Sand Loss at Broad Beach .............................................................. 70 6.2.6 ZLC Sediment Transport Analysis Summary .................................................................. 72
6.3 Analysis of Sediment Transport Within Broader MMLC ................................................. 73 6.3.1 Shoreline Changes ......................................................................................................... 76 6.3.2 Sediment Volume Changes ............................................................................................ 78 6.3.3 Causes of Beach Change ................................................................................................ 80 6.3.4 Past Beach Performance Summary ............................................................................... 87 6.3.5 Beach Change Causes Summary .................................................................................... 87
6.4 Discussion of Variability in Shoreline Change Rates ....................................................... 88 7. Engineering Analysis of Baseline “No Project” Conditions ................................................. 90
7.1 Seasonal Changes in Beach Width .................................................................................. 90 7.1.1 Historic Beach Profiles ................................................................................................... 90 7.1.2 Fugro West, Inc. Beach Profile Surveys (2004-2005)..................................................... 93 7.1.3 Coastal Frontiers Beach Profile Surveys (2009-2013) ................................................... 94
7.2 Sand Loss Estimates from CFC Profile Surveys (2009 – 2013) ........................................ 99 7.3 Long-Term Beach Profile Changes Due to SLR .............................................................. 101 7.4 Numerical Modeling of Storm-Related Erosion & Runup ............................................. 102
7.4.1 X-BEACH Model Overview ........................................................................................... 103 7.4.2 CoSMoS Overview ....................................................................................................... 103 7.4.3 XBeach Model Development ....................................................................................... 104 7.4.4 XBeach Model Validation ............................................................................................ 109 7.4.5 Modeled 100-Year Storm Event Erosion ..................................................................... 110
7.5 Wave Uprush Limits – Baseline “No Project” Conditions ............................................. 114 7.6 Wave Uprush Impacts to Existing Development ........................................................... 121
8. Description of Proposed Project ...................................................................................... 124 8.1 Project Objectives.......................................................................................................... 124 8.2 Summary of Project Elements ....................................................................................... 124 8.3 Maintain Existing Emergency Revetment at Present Location ..................................... 126 8.4 Beach Nourishment and Dune Restoration Design and Construction .......................... 129
8.4.1 Sand Sources ................................................................................................................ 135 8.4.2 Dune Habitat Restoration ............................................................................................ 141 8.4.3 Beach Fill Construction ................................................................................................ 142 8.4.4 Future Beach Management Activities ......................................................................... 147
9. Engineering Analysis of Proposed Project ........................................................................ 149 9.1 Analysis of Temporary Emergency Revetment as Permanent Shoreline
Protective Device ........................................................................................................... 149 9.1.1 Project Examples – Buried Shore Protection with Beach & Dune Restoration ........... 150 9.1.2 Ability of Temporary Emergency Revetment to Provide Long-Term Protection ........ 153
9.2 Numerical Modeling of Shoreline Evolution ................................................................. 155
Broad Beach Restoration Project, Coastal Engineering Report
Moffatt & Nichol iii
9.2.1 Model Selection and Description ................................................................................ 155 9.2.2 Model Study Area ........................................................................................................ 156 9.2.3 Model Configuration.................................................................................................... 157 9.2.4 Wave Transformation .................................................................................................. 158 9.2.5 Model Calibration and Verification ............................................................................. 160 9.2.6 GENESIS Beach Nourishment Modeling ...................................................................... 165 9.2.7 GENESIS Backpass Modeling ........................................................................................ 169 9.2.8 GENESIS Results Discussion ......................................................................................... 172
9.3 Influence of Sand Source Grain Size on Project Longevity ............................................ 173 9.3.1 Diffusion Method to Estimate Project Longevity ........................................................ 176 9.3.2 Diffusion Method Results ............................................................................................ 178
9.4 Numerical Modeling of 100-Year Storm Erosion .......................................................... 181 9.4.1 Boundary Conditions ................................................................................................... 181 9.4.2 Model Parameters ....................................................................................................... 182 9.4.3 100-Year Storm Simulation .......................................................................................... 182
9.5 Wave Runup & Overtopping ......................................................................................... 186 9.6 Wave Uprush Limits – Proposed Project ....................................................................... 190 9.7 Beach Nourishment Impact Analysis ............................................................................. 197
9.7.1 Impacts of Beach Nourishment on Littoral Processes ................................................. 197 9.7.2 Depth of Sand Cover .................................................................................................... 203 9.7.3 Potential Impacts to Surfing Conditions ...................................................................... 213 9.7.4 Potential Impacts of Backpassing Operations ............................................................. 213
9.8 Revetment Impact Analysis ........................................................................................... 214 9.8.1 Impacts of Revetment on Littoral Processes ............................................................... 215 9.8.2 Impacts of Sea Level Rise on Temporary Emergency Revetment ............................... 216 9.8.3 Restored Dune Ecosystem ........................................................................................... 217 9.8.4 Public Access and Recreation ...................................................................................... 217
10. Description and Analysis of Project Alternatives ............................................................ 219 10.1 Alternatives Eliminated from Full Evaluation ................................................................ 219
10.1.1 Retention of Temporary Emergency Revetment in its Current Location; No Beach Nourishment ..................................................................................................... 219
10.1.2 Augment Temporary Revetment in its Current Location; No Beach Nourishment ................................................................................................................ 220
10.1.3 Construction of Vertical Seawall in Place of Emergency Revetment with Beach Nourishment ................................................................................................................ 220
10.1.4 Landward Relocation of All or a Portion of the Revetment; No Beach Nourishment ................................................................................................................ 220
10.1.5 Elimination of Septic Systems and Connection to a Common Treatment Facility; No Beach Nourishment .................................................................................. 221
10.1.6 Reduced Project – Exclusion of Little Broad Beach ..................................................... 221 10.1.7 Managed Retreat; No Beach Nourishment ................................................................. 222 10.1.8 Placement of Sand into an Upcoast Offshore Cell and Reliance on Natural
Littoral Patterns for Sand Distribution to Broad Beach ............................................... 222 10.1.9 Construction of Groins for Sand Retention, With Beach Nourishment and Dune
Restoration .................................................................................................................. 222

Broad Beach Restoration Project, Coastal Engineering Report
Moffatt & Nichol iv
10.1.10 Construction of Offshore Sand Retention Reefs with Beach Nourishment, Dune Restoration and Revetment Removal ................................................................ 223
10.2 Alternatives identified for Full Evaluation ..................................................................... 223 10.2.1 Relocation of a More Robust Revetment Landward of the Mean High Tide Line
with Beach Nourishment and Dune Restoration ......................................................... 224 10.2.2 Landward Relocation of Revetment off of Public Land and Easements with
Beach Nourishment and Dune Restoration ................................................................. 240 10.2.3 Replacement of Revetment with Landward-Located Seawall with Beach
Nourishment and Dune Restoration ........................................................................... 247 10.2.4 Alternative 4 - Reduced Beach Nourishment Volume ................................................. 264 10.2.5 Alternative 5 - Beach Nourishment and Dune Restoration with Removal of
Revetment ................................................................................................................... 272 10.2.6 Landward Relocation of More Robust Revetment Along the Downcoast
Portion of the Project with Beach Nourishment and Dune Restoration ..................... 278 11. References .................................................................................................................... 294
List of Figures Figure 4-1. Vicinity Map .......................................................................................................... 14 Figure 4-2. Location Map, MMLC ............................................................................................ 15 Figure 4-3. Shoreline Change Rates for Santa Monica Region (USGS, 2006) ......................... 21 Figure 4-4. Temporary Broad Beach Revetment .................................................................... 35 Figure 5-1. SLR at LA Outer Harbor Buoy ................................................................................ 39 Figure 5-2. Range of Global SLR Projections (NRC, 2012) ....................................................... 42 Figure 5-3. Wave Exposure Windows at Broad Beach ............................................................ 43 Figure 5-4. Significant Wave Height (Wave Rose) Offshore of Point Dume (CDIP,
2010) ..................................................................................................................... 45 Figure 5-5. Peak Wave Period (Period Rose) Offshore of Point Dume (CDIP, 2010) .............. 46 Figure 5-6. Buoy Locations ...................................................................................................... 48 Figure 6-1. Beach Bins within the MMLC ................................................................................ 53 Figure 6-2. ZLC and Beach Bin Definition ................................................................................ 56 Figure 6-3. Historical Shoreline Positions – 1940s/1950s ....................................................... 58 Figure 6-4. Historical Shoreline Positions – 1960s/1970s ....................................................... 59 Figure 6-5. Historical Shoreline Positions – 1980s/1990s ....................................................... 60 Figure 6-6. Historical Shoreline Positions – 2000s .................................................................. 61 Figure 6-7. Average Broad Beach Shoreline Change ............................................................... 62 Figure 6-8. Broad Beach Shoreline Position and Trends, 1970s-2000s .................................. 63 Figure 6-9. Broad Beach Shoreline Positions by Subcell ......................................................... 64 Figure 6-10. Broad Beach and Zuma Beach Average Shoreline Positions ................................ 65 Figure 6-11. Volumetric Changes, 1946-2009 ........................................................................... 66 Figure 6-12. Volumetric Changes, 1968-2009 ........................................................................... 67 Figure 6-13. Volumetric Changes, 1986-2009 ........................................................................... 67 Figure 6-14. Volumetric Changes, 2001-2009 ........................................................................... 68

Broad Beach Restoration Project, Coastal Engineering Report
Moffatt & Nichol v
Figure 6-15. Volumetric Changes, 2006-2009 ........................................................................... 68 Figure 6-16. Comparative Sand Volumes between Broad Beach, Zuma Beach, and
Westward Beach ................................................................................................... 69 Figure 6-17. Alongshore Distribution of Volumetric Change for Different Time Intervals ....... 70 Figure 6-18. Beach Bins within the MMLC ................................................................................ 73 Figure 6-19. Net Shoreline Change Rates in the MMLC ............................................................ 77 Figure 6-20. Shoreline Change Rates West of Point Dume....................................................... 77 Figure 6-21. Cumulative Sediment Volume Changes in the MMLC .......................................... 78 Figure 6-22. Cumulative Sediment Volume Changes in the ZLC ............................................... 79 Figure 6-23. Sediment Volume Changes at Broad Beach ......................................................... 79 Figure 6-24. Cumulative Residual Annual Values of Climate Indices ........................................ 83 Figure 6-25. Cumulative Residual Winter Wave Characteristics (Adams et al, 2008) .............. 84 Figure 6-26. Residual Bypass Rates for Channel Islands, Ventura, and Santa Barbara
Harbors .................................................................................................................. 85 Figure 7-1. Beach Profile Transect Locations .......................................................................... 91 Figure 7-2. Historic Beach Profiles at Broad Beach (Station 165+00) ..................................... 92 Figure 7-3. Historic Beach Profiles at Broad Beach (Station 190+00) ..................................... 92 Figure 7-4. Beach Profiles at Station 160+00 .......................................................................... 93 Figure 7-5. Seasonal Shift of Mean Sea Level (MSL) Position at Station 160+00 ................... 94 Figure 7-6. Broad Beach Transect Locations (Coastal Frontiers, 2011) .................................. 95 Figure 7-7. Additional Transect Locations (Coastal Frontiers, 2013) ...................................... 95 Figure 7-8. Beach Profiles at Transect 410 (Coastal Frontiers, 2013) ..................................... 97 Figure 7-9. Beach Profiles at Transect 402 (Coastal Frontiers, 2013) ..................................... 98 Figure 7-10. Recent Sand Loss Rate at Broad Beach (Coastal Frontiers, 2013) ........................ 99 Figure 7-11. Recent Sand Loss at Profiles 409 and 411 .......................................................... 100 Figure 7-12. Sketch of Bruun Rule Variables ........................................................................... 101 Figure 7-13. CoSMoS Modeling Flow Chart ............................................................................ 104 Figure 7-14. CoSMoS SWAN and XBeach Grids ....................................................................... 104 Figure 7-15. Wave Watch III versus NDBC Buoy Measurements ............................................ 107 Figure 7-16. WW3 Snapshot with NDBC Wave Buoys ............................................................ 108 Figure 7-17. XBeach Boundary Conditions for January 2010 Simulation ............................... 108 Figure 7-18. XBeach Boundary Conditions for 100-Year Storm Simulation............................ 109 Figure 7-19. XBeach Results at Profile 412 for the 100-Year Storm Event ............................. 111 Figure 7-20. XBeach Results at Profile 411 for the 100-Year Storm Event ............................. 112 Figure 7-21. XBeach Results at Profile 410 for the 100-Year Storm Event ............................. 112 Figure 7-22. XBeach Results at Profile 409 for the 100-Year Storm Event ............................. 113 Figure 7-23. XBeach Results at Profile 408 for the 100-Year Storm Event ............................. 113 Figure 7-24. Beach Erosion for 100-Year Storm Event ............................................................ 114 Figure 7-25. No Project Wave Uprush Limits – Transects 412 ................................................ 116 Figure 7-26. No Project Wave Uprush Limits – Transects 411 and 410 .................................. 117 Figure 7-27. No Project Wave Uprush Limits – Transects 409 and 408 .................................. 118 Figure 7-28. No Project Wave Uprush Limits – West Broad Beach ........................................ 119

Broad Beach Restoration Project, Coastal Engineering Report
Moffatt & Nichol vi
Figure 7-29. No Project Wave Uprush Limits – East Broad Beach .......................................... 120 Figure 8-1. Existing Revetment Section A ............................................................................. 127 Figure 8-2. Existing Revetment Section B ............................................................................. 128 Figure 8-3. Reach A - Typical Beach Nourishment & Dune Restoration Section .................. 131 Figure 8-4. Reach B - Typical Beach Nourishment & Dune Restoration Section .................. 132 Figure 8-5. Reach C - Typical Beach Nourishment & Dune Restoration Section .................. 133 Figure 8-6. Overall Plan for Beach Nourishment & Dune Restoration ................................. 134 Figure 8-7. Initial Potential Sand Source Locations ............................................................... 136 Figure 8-8. Broad Beach Restoration Project – Upland Quarry Sand Source Area ............... 137 Figure 8-9. Geology Strata of the Quarries as Sandstone ..................................................... 138 Figure 8-10. Conceptual Rendering of Dune Restoration ....................................................... 142 Figure 8-11. Construction Staging Area .................................................................................. 144 Figure 8-12. Proposed Haul Routes from Local Inland Sand Sources ..................................... 146 Figure 9-1. Typical Cross section for the Dam Neck shore protection project (Basco
2000) ................................................................................................................... 151 Figure 9-2. Construction of the Dam Neck project (Basco, 2000) ........................................ 151 Figure 9-3. Pre- and Post-Sandy Aerials of a stretch of Bay Head (Google) ......................... 152 Figure 9-4. Schematic for boulder wall repair project at a Gold Coast park (Gold Coast
2013) ................................................................................................................... 152 Figure 9-5. Geotube Installation with Dune Restoration (Gibeaut et al., 2003)................... 153 Figure 9-6. Cobble Berm and Reinforced Dune at Cape Lookout State Park (Komar &
Allan, 2010) ......................................................................................................... 153 Figure 9-7. GENESIS Model Study Area ................................................................................. 156 Figure 9-8. RCPWAVE Model Study Area .............................................................................. 159 Figure 9-9. GENESIS Calibration Results ................................................................................ 162 Figure 9-10. GENESIS Verification Results ............................................................................... 163 Figure 9-11. GENESIS Results – Proposed Project with 150 ft Equilibrium Beach Width,
D50 = 0.50 mm ..................................................................................................... 167 Figure 9-12. GENESIS Results – Proposed Project with 110 ft Equilibrium Beach Width,
D50 = 0.25 mm ..................................................................................................... 168 Figure 9-13. GENESIS Results - Initial Backpass at Year 2 ....................................................... 170 Figure 9-14. GENESIS Results – Third Backpass at Year 4 ....................................................... 171 Figure 9-15. Influence of Grain Size on Beach Nourishment Profile (CEM, Figure III-3-
21) ....................................................................................................................... 174 Figure 9-16. Equilibrium Beach Nourishment Profiles ............................................................ 175 Figure 9-17. Beach Width Added Versus Median Grain Size .................................................. 175 Figure 9-18. Planform Evolution Assuming One Way Dispersion, D50 = 0.25 mm .................. 179 Figure 9-19. Beach Nourishment Project Longevity, D50 = 0.25mm ....................................... 179 Figure 9-20. Planform Evolution Assuming One Way Dispersion, D50 = 0.85 mm .................. 180 Figure 9-21. Beach Nourishment Project Longevity, D50 = 0.85 mm ...................................... 180 Figure 9-22. XBeach Boundary Conditions for 100-Year Storm Simulation............................ 181 Figure 9-23. XBeach Results at Profile 412 for the 100-Year Storm Event ............................. 183
Broad Beach Restoration Project, Coastal Engineering Report
Moffatt & Nichol vii
Figure 9-24. XBeach Results at Profile 411 for the 100-Year Storm Event ............................. 183 Figure 9-25. XBeach Results at Profile 410 for the 100-Year Storm Event ............................. 184 Figure 9-26. XBeach Results at Profile 409 for the 100-Year Storm Event ............................. 184 Figure 9-27. XBeach Results at Profile 408 for the 100-Year Storm Event ............................. 185 Figure 9-28. Predicted Profile Response to 100-Year Storm Event ........................................ 185 Figure 9-29. Sketch of Wave Runup Variables ........................................................................ 186 Figure 9-30. Overtopping Rate vs Crest Width ....................................................................... 188 Figure 9-31. Critical Values of Average Overtopping Rate (CEM Table VI-5-6) ...................... 189 Figure 9-32. Proposed Project Wave Uprush Limits – Transect 412 ...................................... 192 Figure 9-33. Proposed Project Wave Uprush Limits – Transects 411 and 410 ....................... 193 Figure 9-34. Proposed Project Wave Uprush Limits – Transects 409 and 408 ....................... 194 Figure 9-35. Proposed Project Wave Uprush Limits – West Broad Beach .............................. 195 Figure 9-36. Proposed Project Wave Uprush Limits – East Broad Beach ............................... 196 Figure 9-37. Beach Width Trend at South Oceanside after the 2001 RBSP, D50 = 0.62
mm (CFC 2011) .................................................................................................... 198 Figure 9-38. Sand Volume Trend at South Oceanside after the 2001 RBSP, D50 = 0.62
mm (CFC 2011) .................................................................................................... 198 Figure 9-39. Beach Slope Changes at South Oceanside Placement Site (CFC 2012b) ............ 201 Figure 9-40. Beach Slope Changes at Beach Downdrift of Placement Site (CFC 2012b) ........ 202 Figure 9-41. Average Seasonal Depth of Cover - Transect 411............................................... 204 Figure 9-42. Predicted Depth of Cover at Transect 411 – Year 1 ........................................... 205 Figure 9-43. Predicted Depth of Cover at Transect 411 – Year 3 ........................................... 206 Figure 9-44. Average Seasonal Depth of Cover - Transect 408............................................... 207 Figure 9-45. Predicted Depth of Cover at Transect 408 – Year 1 ........................................... 209 Figure 9-46. Predicted Depth of Cover at Transect 408 – Year 3 ........................................... 210 Figure 9-47. Predicted Depth of Cover at Transect 408 – Year 5 ........................................... 211 Figure 9-48. Predicted Depth of Cover at Transect 408 – Year 7 ........................................... 212 Figure 10-1. Alternative 1A– Rebuilt Revetment Section ....................................................... 226 Figure 10-2. Alternative 1A– West Broad Beach .................................................................... 227 Figure 10-3. Alternative 1A– East Broad Beach ...................................................................... 228 Figure 10-4. Typical Cross Section of Improved Revetment ................................................... 233 Figure 10-5. Alternative 1B– West Broad Beach ..................................................................... 234 Figure 10-6. Alternative 1B– East Broad Beach ...................................................................... 235 Figure 10-7. Alternative 2– West Broad Beach ....................................................................... 241 Figure 10-8. Alternative 2– East Broad Beach......................................................................... 242 Figure 10-9. Alternative 3A– West Broad Beach .................................................................... 249 Figure 10-10. Alternative 3A– East Broad Beach ...................................................................... 250 Figure 10-11. Alternative 3B– West Broad Beach ..................................................................... 257 Figure 10-12. Alternative 3B– East Broad Beach ...................................................................... 258 Figure 10-13. Alternative 4 – West Broad Beach ...................................................................... 265 Figure 10-14. Alternative 4 – East Broad Beach ........................................................................ 266 Figure 10-15. Alternative 4 – GENESIS Results.......................................................................... 269

Broad Beach Restoration Project, Coastal Engineering Report
Moffatt & Nichol viii
Figure 10-16. Alternative 5 – West Broad Beach ...................................................................... 273 Figure 10-17. Alternative 5 – East Broad Beach ........................................................................ 274 Figure 10-18. Typical Cross Section of Relocated Revetment .................................................. 278 Figure 10-19. Alternative 6A– West Broad Beach .................................................................... 281 Figure 10-20. Alternative 6A– East Broad Beach ...................................................................... 282 Figure 10-21. Alternative 6B– West Broad Beach ..................................................................... 288 Figure 10-22. Alternative 6B– East Broad Beach ...................................................................... 289
List of Photos Photo 3-1. 1972 Aerial Photo (California Coastal Records, 2009) ............................................ 4 Photo 3-2. 2009 Aerial Photo (California Coastal Records, 2009) ............................................ 5 Photo 3-3. Temporary Sandbag Revetment (May 2009) .......................................................... 6 Photo 3-4. Temporary Sandbag Revetment (December 2009) ................................................ 6 Photo 3-5. Severe Erosion and Dune Damage at West Broad Beach (January 2010) .............. 7 Photo 3-6. Temporary Sandbag Revetment Failure and Dune Damage (January 2010) ......... 8 Photo 3-7. Emergency Revetment (February 2010) ................................................................ 9 Photo 3-8. Emergency Revetment (February 2010) ............................................................... 10 Photo 4-1. Broad Beach with Temporary Revetment (California Coastal Record
Project) .................................................................................................................. 34 Photo 4-2. Vertical Beach Access at 31344 Broad Beach Rd .................................................. 37 Photo 4-3. Vertical Beach Access at 31200 Broad Beach Rd .................................................. 37 Photo 8-1. Sand Stockpile at the Grimes Rock Quarry ......................................................... 139 Photo 8-2. Sand Stockpile at the CEMEX Quarry .................................................................. 140 Photo 8-3. Sand Stockpile at the P.W. Gillibrand Quarry ..................................................... 140
List of Tables Table 5-1. Water Levels at Broad Beach, Based on LA Outer Harbor Tide Station
(NOAA/NOS, 2008) ................................................................................................ 38 Table 5-2. Extreme Water Levels versus Recurrence Interval ............................................... 39 Table 5-3: Regional SLR Projections for Los Angeles ............................................................. 40 Table 5-4: Projected Federal SLR Rates ................................................................................. 41 Table 5-5. Wave Data Sources ............................................................................................... 47 Table 5-6: Extreme Wave Height versus Recurrence Interval – Zuma Beach (USACE,
2009 Draft) ............................................................................................................ 49 Table 5-7. Broad Beach Breaking Wave Heights Range ......................................................... 51 Table 6-1. Description of ZLC Beach Bins ............................................................................... 56 Table 6-2. Aerial Imagery Used to Create Shoreline Positions for the ZLC ........................... 57 Table 6-3. Description of MMLC Beach Bins .......................................................................... 74 Table 6-4. Aerial Imagery Used to Create Shoreline Positions for the MMLC ...................... 75 Table 6-5. Sediment Transport Parameters of the MMLC and ZLC ....................................... 81
Broad Beach Restoration Project, Coastal Engineering Report
Moffatt & Nichol ix
Table 7-1. Seasonal Changes (Coastal Frontiers, 2013) ......................................................... 96 Table 7-2. Coastal Recession Due to SLR Predicted by Bruun Rule ..................................... 102 Table 7-3. Beach Profile Origin and Azimuth ....................................................................... 102 Table 7-4. CoSMoS Results1 - January 2010 with 0.4 m SLR ................................................ 110 Table 7-5. M&N Results - January 2010 with 0.4 m SLR ...................................................... 110 Table 7-6. Beach Loss Estimates for “No Project” Wave Uprush Analysis .......................... 115 Table 7-7. Existing Development Threatened by “No Project” Wave Uprush Limits .......... 123 Table 8-1. Preliminary List of Construction Equipment ....................................................... 143 Table 9-1. Predicted Wave Runup Results ........................................................................... 187 Table 9-2. Predicted Overtopping at Revetment Crest ....................................................... 188 Table 9-3. Beach Loss Estimates for Proposed Project Wave Uprush Analysis ................... 191 Table 9-4. GENESIS Predicted Beach Width Post-Nourishment .......................................... 203 Table 10-1. Alternative 1A – Risk to Existing Development Relative to Baseline
Condition ............................................................................................................. 229 Table 10-2. Alternative 1A – Summary of Potential Impacts ................................................ 231 Table 10-3. Alternative 1B – Risk to Existing Development Relative to Baseline
Condition ............................................................................................................. 236 Table 10-4. Alternative 1B – Summary of Potential Impacts ................................................. 239 Table 10-5. Alternative 2 – Risk to Existing Development Relative to Baseline
Condition ............................................................................................................. 243 Table 10-6. Alternative 2 – Summary of Potential Impacts ................................................... 246 Table 10-7. Alternative 3A – Risk to Existing Development Relative to Baseline
Condition ............................................................................................................. 251 Table 10-8. Alternative 3A – Summary of Potential Impacts ................................................ 255 Table 10-9. Alternative 3B – Risk to Existing Development Relative to Baseline
Condition ............................................................................................................. 259 Table 10-10. Alternative 3B – Summary of Potential Impacts ................................................. 263 Table 10-11. Alternative 4 – Risk to Existing Development Relative to Baseline
Condition ............................................................................................................. 267 Table 10-12. Alternative 4 – Summary of Potential Impacts ................................................... 271 Table 10-13. Alternative 5 – Risk to Existing Development Relative to Baseline
Condition ............................................................................................................. 275 Table 10-14. Alternative 5 – Summary of Potential Impacts ................................................... 277 Table 10-15. Alternative 6A – Risk to Existing Development Relative to Baseline
Condition ............................................................................................................. 283 Table 10-16. Alternative 6A – Summary of Potential Impacts ................................................ 286 Table 10-17. Alternative 6B – Risk to Existing Development Relative to Baseline
Condition ............................................................................................................. 290 Table 10-18. Alternative 6B – Summary of Potential Impacts ................................................. 293

Broad Beach Restoration Project, Coastal Engineering Report
Moffatt & Nichol x
APPENDICES Appendix 1 – Existing Biological and Cultural Resource Findings
1A Snowy Plover Monitoring Report (Revetment Construction) by Chambers Group, Inc.
1B Snowy Plover and Grunion Monitoring Report (Revetment Toe Survey) by Chambers Group, Inc.
1C Reconnaissance Survey of Marine Biological Resources at Broad Beach by Chambers Group, Inc.
1D City of Malibu Local Coastal Plan - Land Use Plan Section 3 describing ESHA designation and ESHA Overlay Map 1: Nicholas Canyon to Trancas Beach
1E Broad Beach Dune and Habitat Assessment by WRA Environmental Consultants
1F Broad Beach Special Status Plant Survey by WRA Environmental Consultants
Appendix 2 – Coastal Geomorphology Studies by Everts Coastal 2A Sediment Transport Along the Malibu Coast, December 2012 2B Sand Loss Estimates if Artificial Beach Fill is Placed at Broad Beach,
Malibu, California, December 2009 2C Historic Beach Performance, Causes of Beach Change, and Estimates of
Future Beach Fill Nourishment Requirements at Broad Beach, Malibu, California (Broad Beach Phase 2), July 2011
Appendix 3 – Beach Profile Surveys by Coastal Frontiers Corporation Appendix 4 – Wave Uprush Analysis Calculations Appendix 5 – Seasonal & Interannual Beach Profiles Changes Appendix 6 – Surfing Impacts Analysis Appendix 7 – Septic System Relocation Analysis by Ensitu Engineering, Inc. Appendix 8 – Broad Beach Erosion and Beach Nourishment Investigation and Responses to
Proposed Nourishment Plan by Gary Griggs, August 2012

Broad Beach Restoration Project, Coastal Engineering Report
Moffatt & Nichol xi
EXHIBITS TO CDP APPLICATION 4-12-043 REFERENCED IN REPORT 4TH SUBMITTAL, OCTOBER 2013: Exhibit D – As-Built Drawings Exhibit E – Proposed Project – 60% Plan Set Exhibit F – Project Alternative Design Drawings Exhibit G – Inland Materials Analysis
a) Revised Sampling and Analysis Plan b) Upland Sand Source: Coarser than Native Grain Size Impacts Analysis
Exhibit K – Updated Dune Restoration Design, (WRA Consultants, September 2013) Exhibit O – Adaptive Management Plan

Broad Beach Restoration Project, Coastal Engineering Report
Moffatt & Nichol 1
1. INTRODUCTION
Broad Beach was a wide sandy beach from the 1960s into the early 1990s. Development on the shoreline came to depend on that wide beach for natural shore protection. However, since the 1970s, the beach has gradually narrowed, thereby exposing the shoreline development to flooding and damage during winter storms and high tides occurring over the past 15-20 years. The public benefit of the historically wide beach has also diminished to a narrow strip of sand at low tide.
In 2009, Broad Beach property owners decided to take action and develop a long-term project to restore the beach to its 1970s era width and the former dune system. The project initiated with planning studies in mid-2009. A narrow beach and active winter season in early 2010 prompted construction of an emergency, temporary revetment to protect a majority of the residences and numerous septic systems and leach fields located seaward of the residences that became perilously close to being undermined. The revetment construction was completed in the spring of 2010 and has provided temporary shore protection during this interim period of development of the long-term restoration project.
Technical studies and baseline environmental assessments in support of the long-term project proceeded throughout 2010 and 2011. In September 2011, the property owners formed a geologic hazard abatement district (GHAD), the Broad Beach Geologic Hazard Abatement District (BBGHAD), to formally address this geologic hazard, and restore the dry sand beach and dune system. As part of the BBGHAD formation, a Plan of Control was developed and implemented to describe the present geologic hazards and present a plan for the prevention, mitigation, abatement, and control of the hazards. A separate Engineer’s Report was prepared and implemented to develop the technical basis and specific hazard abatement plan for the monetary assessment for the project. The studies described in this report provided the technical basis for the BBGHAD's proposed development. This technical report serves two purposes. First, it serves as the Coastal Engineering Report in support of the Coastal Development Permit application to the California Coastal Commission (CDP Application 4-12-043) for the Broad Beach Restoration Project. Supporting biological, economic, and related technical studies are appended to this document.
The second purpose of this report is to support the amended Analysis of Impacts to Public Trust Resources and Values (APTR) commissioned by the California State Lands Commission (CSLC) to assess the impacts of the proposed project on environmental resources. While GHAD-related activities are exempt from the California Environmental Quality Act (CEQA), the APTR is anticipated to reflect a level of technical effort and rigor in addressing environmental impact concerns comparable to CEQA.

Broad Beach Restoration Project, Coastal Engineering Report
Moffatt & Nichol 2
2. GOALS AND SCOPE OF STUDY
2.1 STUDY GOALS
The objective of the Broad Beach Restoration Project is to design, permit, and implement a shoreline restoration program balancing erosion control, property protection, improved recreation and public access opportunities, aesthetics, and environmental stewardship. This study provides sufficient project background, technical data, analyses, and design information to supplement the environmental review, entitlement, and permitting process.
Specific study goals include:
Provide a better understanding of the causes of erosion, both locally and regionally;
Perform field investigations to evaluate biological habitat quality in support of project impact assessment;
Investigate sand sources for beach nourishment;
Assess ability of the temporary emergency revetment to provide sufficient shore protection during storm events;
Investigate opportunities to provide dune restoration with high ecological value, and the ancillary benefit of added “soft” shore protection;
Estimate the economic costs and benefits of the proposed project to the public; and
Evaluate a range of project alternatives in order to minimize adverse impacts to coastal resources.
2.2 SCOPE OF WORK
Numerous meetings and discussions were held with California Coastal Commission staff to refine the study scope to meet the technical requirements of the CDP application. Similarly, significant coordination with the California State Lands Commission, their environmental consultants, and the project design team was required to provide a focused study in sufficient detail to meet the goals of APTR. To the maximum extent practical, this study was prepared in general conformance with Guidelines for Engineering Geologic Reports prepared by the State Board of Geologists and Geophysicists (1998).

Broad Beach Restoration Project, Coastal Engineering Report
Moffatt & Nichol 3
Specific items within this study scope include:
Gather regional historic aerial photographs and other sources of historic shoreline data. Digitize the shorelines and create a graphic representation of the historical shoreline positions.
Assemble regional shoreline profile information for each historical time period based on photographs, surveys and anecdotal information for purposes of estimating historic sand volume changes based on changes in shoreline position.
Perform a regional and local assessment of historic shoreline change in the Modern Malibu Littoral Cell (MMCL) that extends from Port Hueneme to Marina del Rey.
Develop a long-term assessment of wave direction and the potential correlation between wave direction and alongshore transport rates.
Evaluate various sea level rise (SLR) scenarios and assess potential impacts of these scenarios on the project.
Conduct sand source investigations to determine sediment characteristics and the suitability for use as beach nourishment.
Perform a biological habitat survey of potential borrow sites as well as the fill site at Broad Beach to identify potential project-related impacts.
Continue beach profile surveys along the project reach and adjacent downdrift beach to monitor changes in beach sand volume over space and time.
Analyze ability of temporary emergency revetment to provide long-term shore protection – by itself and in concert with various degrees of sand nourishment.
Prepare 60% design drawings that illustrate the vertical and horizontal extents of the proposed project.
Conduct robust analysis of potential alternatives in order to minimize adverse impacts to coastal resources.
Perform numerical modeling of the proposed beach nourishment project and alternatives to estimate the future performance.
Estimate likely range of re-nourishment rates and frequencies.
Estimate the economic benefits and costs to the public associated with the project, including project alternatives.

Broad Beach Restoration Project, Coastal Engineering Report
Moffatt & Nichol 4
3. PROBLEM DESCRIPTION
Broad Beach is located in the northwest portion of the County of Los Angeles, and within the City of Malibu, California. The project area is comprised of the shoreline area fronting approximately 124 legal parcels, 114 residences, and a beach club spanning approximately from Point Lechuza to Trancas Creek.
Development along Broad Beach began in the 1930s, consisting of small beach cottages. Given the limited infrastructure available, septic systems and leach fields were typically installed close to the sand dunes seaward of the residences. As construction continued and the site was further developed, most leach fields continued to remain.
3.1 BROAD BEACH EROSION
As discussed further in this report, Broad Beach was a relatively wide beach from the latter 1960s through the early 1970s, and well into the 1980s. Residential development continued during this time period and most lots were developed by the late 1980s, when the beach was considerably wider than it is today. An aerial photograph from 1972 (Photo 3-1) provides a clear illustration of a very large sand volume on the beach. Presently, Broad Beach is a very narrow ribbon of sand visible primarily at low tide, but inundated at high tide (Photo 3-2).
Photo 3-1. 1972 Aerial Photo (California Coastal Records, 2009)

Broad Beach Restoration Project, Coastal Engineering Report
Moffatt & Nichol 5
Photo 3-2. 2009 Aerial Photo (California Coastal Records, 2009)
Several recent studies of the coastal region encompassing Broad Beach have identified a trend of continued erosion without any significant recovery in beach width since the early 1970s. The beach is narrowing due to a negative sand balance caused by a reduction in sand supply entering around Point Lechuza, and/or a change in the magnitude and/or direction of the wave energy that transports the amount of sand leaving Broad Beach. Between 1974 and 2009, approximately 600,000 cubic yards (cy) of sand was lost at Broad Beach, a majority of which has moved east toward Zuma Beach and beyond. Studies conclude that this trend of erosion appears to have accelerated in the last two decades. Recent El Niño storm seasons have exacerbated the shoreline recession, resulting in structural damage and further beach erosion.
The 1997-1998 El Niño storms caused considerable shoreline erosion and related storm wave damage along the California coastline. Many Broad Beach homes were threatened, causing many homeowners to construct an emergency rock revetment or a temporary sand bag revetment to protect residential structures and leach fields. One residence suffered major structural damage, which resulted in its complete destruction. During one particularly severe storm in early February 1998, with sand bags already in place, the active beach scarp retreated more than 30 feet in the course of two days (TerraCosta, 2008). Some of the emergency shore protection work was either not permitted or the permit processes were not completed.
The 2007-2008 winter season, though milder than the 1997-1998 winter, also resulted in significant retreat of the beach. Many of the homeowners responded with construction of more substantial sand bag revetments, most of which were authorized through Emergency Coastal Development Permits (ECDPs) issued by the City of Malibu. Examples of these revetments are shown in Photo 3-3 and Photo 3-4. In addition to these structures, there are timber and concrete seawalls and rock revetments at various residences along the west end of Broad

Broad Beach Restoration Project, Coastal Engineering Report
Moffatt & Nichol 6
Beach. Waves and higher tides ran up to and eroded portions of the historically wide dunes along the east end of Broad Beach.
Photo 3-3. Temporary Sandbag Revetment (May 2009)
Photo 3-4. Temporary Sandbag Revetment (December 2009)

Broad Beach Restoration Project, Coastal Engineering Report
Moffatt & Nichol 7
3.2 HOMEOWNERS TAKE ACTION
The Trancas Property Owner’s Association (TPOA), representing most of the property owners along the Broad Beach shoreline, elected in mid-2009 to take action to develop a long-term solution to protect against shoreline erosion, improve the quality of public beach access, and reduce the threat to private property.
During preparation of the initial planning studies for restoration of Broad Beach, a large El Niño winter was forecast for the 2009/2010 winter season. In December 2009, a significant narrowing of the beach occurred due to storm wave attack resulting in widespread failure of the existing temporary emergency sandbag revetments, especially at the west end of the beach. Photo 3-5 illustrates the eroded shoreline condition near the west end of Broad Beach; Photo 3-6 shows conditions toward the east. It became evident that these temporary structures would not provide sufficient shore protection for the upcoming winter. Acute and significant erosion was proceeding, resulting in significant loss of dune habitat and damage to residential structures. Two homes at the west end of the beach incurred significant property damage in late January 2010 and early February 2010 due to the combination of high surf and tides. Undermining and failure of several “on-site wastewater treatment systems” (OWTS) was also imminent without immediate action. Combined with the prediction of moderate to severe El Niño conditions for the upcoming winter, the need for immediate emergency action became apparent. As a result, the TPOA was forced to seek an ECDP to implement an interim shore protection measure to halt the critical erosion until the longer term project is in place.
Photo 3-5. Severe Erosion and Dune Damage at West Broad Beach (January 2010)

Broad Beach Restoration Project, Coastal Engineering Report
Moffatt & Nichol 8
Photo 3-6. Temporary Sandbag Revetment Failure and Dune Damage (January 2010)
Under the emergency situation, a temporary rock revetment was considered the minimum action necessary, and the least environmentally damaging alternative. The temporary rock revetment design was developed to stabilize the shoreline against further erosion for the 2009-2010 El Niño season. Other temporary revetment alternatives consisting of geotextile bags were providing a clear demonstration that they were inadequate to provide reliable shore protection and were providing a false sense of security. In addition to their lack of hydraulic stability, the failed geo-bag (sandbag) system was proving to be a source of debris and litter on the beach.
The 4,100 foot long temporary rock revetment was constructed along a reach that extends from 30760 Broad Beach Road, located approximately 600 feet west of Trancas Creek, to 31346 Broad Beach Road, just west of the western public access point for Broad Beach1. The design was developed to provide the minimum necessary protection while allowing for rapid construction. Specific elements of the temporary revetment include:
1 The property owner at 30822 Broad Beach Road did not participate in the revetment project, thereby leaving a 120 foot gap in the revetment.

Broad Beach Restoration Project, Coastal Engineering Report
Moffatt & Nichol 9
Filter fabric to eliminate loss of dune material through voids in the stone matrix;
Approximately 36,000 tons of armor stone – the armor size (1/2 to 3 ton) was smaller than a typical southern California revetment to allow for faster construction using readily available, stockpiled stone;
Reduced revetment volume to allow for faster construction and lateral beach access; and
Shallower toe elevation for improved constructability.
A more permanent revetment design was implemented along the western 450 feet of revetment due to the severity of erosion at that location.
Photo 3-7. Emergency Revetment (February 2010)

Broad Beach Restoration Project, Coastal Engineering Report
Moffatt & Nichol 10
Photo 3-8. Emergency Revetment (February 2010)
The as-built plans for the emergency revetment are provided in Exhibit D. In addition to the details of the as-built revetment, the drawings include the following:
Other unpermitted development including sand-bag revetment and rock revetment existing prior to construction of the 2010 emergency revetment;
Property boundaries;
Surveyed mean high tide lines (MHTLs);
Wave uprush limit lines (see Section 7 this report);
Existing septic systems;
Existing residential structures (primary and secondary); and
Easements and deed restricted areas.
3.3 EMERGENCY TEMPORARY REVETMENT PERMITS AND CONDITIONS
Recent history clearly demonstrates why a long-term beach restoration plan, with permits from appropriate agencies, needs to be implemented along Broad Beach. The trend of shoreline recession along Broad Beach over the last decades dramatically increased the level of exposure to residents and structures. In response, many residents took action to protect their property under emergency permits using various combinations of sandbag berms, seawalls, and rock

Broad Beach Restoration Project, Coastal Engineering Report
Moffatt & Nichol 11
revetments. The result of these “single lot” protection measures was a non-uniform combination of devices with widely varying levels of protection against significant winter storm waves. Most of the sand bag berms were washed away quickly, leaving large gaps in the shoreline – allowing flanking of rock revetments and other structures. Many of the rock revetments were undersized or poorly designed and easily scattered during the winter storms. The lack of viability of this “single lot” approach to shoreline protection has been clearly demonstrated by the requirement for the construction of an emergency revetment.
Construction of the temporary Broad Beach revetment required the following permits:
City of Malibu Coastal Development Permit (CDP) No. 09-021;
City of Malibu Engineering Permit No. 10-002;
California Coastal Commission (CCC): ECDP No. 4-10-003-G;
U.S. Army Corps of Engineers (USACE): Sections 10 and 404 Permit File No. SPL-2009-00979-PHT;
Regional Water Quality Control Board (RWQCA). LA Region: Section 401C Water Quality Certification No. 10-003;
Los Angeles County Dept. of Beaches and Harbors: Permit #s: RE-043-09; RE-029-10;
Caltrans: Encroachment Permit No. 710-6TK-0146;
City of Malibu: Encroachment Permit No. 10-002; and
City of Malibu: Administrative Plan Review No. 11-012.
The ECDP was issued by the CCC on January 21, 2010, and it authorized placement of the revetment subject to a list of conditions, one of which requires the completion of a regular CDP process within 3 years in order for the temporary revetment to be considered permanent. The following are some excerpts from the most significant ECDP conditions:
Condition 5: “Within eighteen (18) months of the date of this emergency permit, the permittee shall either: (a) submit a COMPLETE application for a regular CDP to have the emergency structure be considered permanent or (b) remove the emergency structure in its entirety. The Executive Director may grant additional time for good cause.”
Condition 6: “If, within 36 months (3 years) of the date of this emergency permit, a regular CDP authorizing retention of the structure authorized by this emergency permit or alternative development has not been issued, or such permit has been issued but work required by such a permit…has not commenced, the applicant shall, by that date, have the entire emergency structure….and all related materials removed and the beach

Broad Beach Restoration Project, Coastal Engineering Report
Moffatt & Nichol 12
restored to its natural elevation. The Executive Director may grant an additional two years to remove the emergency structure and related materials for good cause.”
These conditions of the ECDP have initiated preparation of a regular CDP from the CCC. This Coastal Engineering Report, which will accompany the forthcoming amended Analysis of Impacts to Public Trust Resources and Values, will also provide the technical basis for a thorough evaluation of project alternatives, impacts related to these alternatives, a complete project description, and plans showing the location and limits of the proposed work.
In addition to the CDP issued by the CCC, permits will be required from the CSSLC, the City of Malibu, Los Angeles County, United States Army Corps of Engineers (USACE), Regional Water Quality Control Board (RWQCB), California Department of Fish & Game (CDFG), and Caltrans.

Broad Beach Restoration Project, Coastal Engineering Report
Moffatt & Nichol 13
4. PROJECT BACKGROUND
4.1 REGIONAL COASTAL SETTING
The Southern California coast is a complex, tectonically-active region and is characterized as a collision coast wherein the Pacific Ocean plate subducts on contact with the North American plate. From a geologic time perspective, the process manifests itself in the form of narrow offshore shelves cut by submarine canyons, uplifted by coastal mountains and coastal erosion.
Broad Beach exemplifies a typical Southern California stretch of coastline, comprising a sandy beach backed by coastal bluffs. Broad Beach is located at the western (upcoast) end of a 4-mile long hook-shaped beach between Point Lechuza and Point Dume, as shown in Figure 4-1. With a total length of just over one mile, Broad Beach is bounded by Point Lechuza to the west and Trancas Creek to the east. Zuma Beach and Point Dume State Beach make up the remainder of the hook-shaped beach. This hook-shaped beach is referred to as the Zuma Littoral Subcell (ZLS) throughout this report. Broad Beach and the ZLS lie within the MMLC shown in Figure 4-2. The MMLC is bounded by Point Hueneme to the north and Marina del Rey to the south.
Littoral cells are defined as essentially self-contained beach compartments bounded by geographic features such as headlands or submarine canyons that limit the movement of sand between cells. Each compartment consists of sand sources (such as rivers, streams, and coastal bluff erosion), sand sinks (such as coastal dunes and submarine canyons), and beaches, which provide pathways for wave-driven sand movement within a littoral cell (Patsch & Griggs, 2006).
The south-southwest facing MMLC coastline is directly exposed to swells generated in the southern hemisphere. These swells approach Malibu from the southwest, south, and southeast, but the great decay distances typically result in waves of low heights and long periods. Despite sheltering from the Channel Islands, the Broad Beach area is exposed to North Pacific swells through the Santa Barbara Channel. North Pacific generated swells are the most energetic source of waves in the region and the north-westerly approach angle results in a predominant longshore sand transport direction from the west to east in the MMLC.
Due to the wave climate and predominant longshore sand transport direction, Broad Beach and the ZLS depend on sand delivered from upcoast sources, including fluvial discharges from coastal watersheds of the Santa Monica Mountains and erosion of coastal bluffs. Mugu Submarine Canyon captures almost all of the longshore sand supply and represents the upcoast limit of potential sand sources for the ZLS.
A detailed analysis of local and regional sediment transport is presented in Section 6.

Broad Beach Restoration Project, Coastal Engineering Report
Moffatt & Nichol 14
Figure 4-1. Vicinity Map

Broad Beach Restoration Project, Coastal Engineering Report
Moffatt & Nichol 15
Figure 4-2. Location Map, MMLC
Marina Del Rey
Port Hueneme
Zuma Littoral Subcell (ZLS)
Modern Malibu Littoral Cell (MMLC)

Broad Beach Restoration Project, Coastal Engineering Report
Moffatt & Nichol 16
4.2 PREVIOUS RELEVANT STUDIES
There are several studies of the regional and local shoreline morphology within the region that are relevant at Broad Beach, including the following:
Draft Coast of California Storm and Tidal Waves Study, Los Angeles Region, Noble Consultants, Inc. for USACE. May 2009.
Shoreline Stabilization Study, 31302 to 31340 Broad Beach Road, Malibu, Ca. TerraCosta Consulting Group, Inc. December 2008.
Development of Sand Budgets for California’s Major Littoral Cells (Eureka, Santa Cruz, Southern Monterey Bay, etc). Patsch, Kiki and Griggs, Gary. January 2007.
National Assessment of Shoreline Change Part 3: Historical Change and Associated Coastal Land Loss Along Sandy Shorelines of the California Coast. USGS, OFR 2006-1219.
Summary of Broad Beach Erosion and Beach Nourishment Investigation and Responses to Proposed Nourishment Plan. Griggs, Gary. August 2012.
Sediment Study Along the Malibu Coast. Everts Coastal. December 2012.
These studies are briefly summarized below.
4.2.1 Draft USACE Coast of California Storm and Tidal Waves Study (Noble Consultants, May 2009)
The Draft Coast of California Storm and Tidal Waves Study (CCSTWS), Los Angeles Region is a major source of regional sediment budget and longshore transport data for the MMLC and provides valuable background information and corroborates many of the findings from the present study. The purpose of the report was to:
“…establish a better understanding of the County’s past and present coastal processes and further to predict the future shoreline evolution whether it is an eroding, accreting or stable trend. In so doing, it is intended that the knowledge gained under this CCSTWS study will contribute to formulation of more intelligent planning and thorough management strategies for providing better protection against storm wave attack as well as enhancing recreational benefits within this coastal region. The 7-year study program, consisting of field data collection, data reduction, oceanographic characterization, coastal processes analyses and formulation of a sand management plan, was directed toward developing an adequate database for improving coastal planning, design and comprehensive

Broad Beach Restoration Project, Coastal Engineering Report
Moffatt & Nichol 17
management of this coastal zone. This report presents, herein, the entire study results including four years of field data collection, followed by a 3-year data analysis effort.”
The following list summarizes key findings of the report. Note that Broad Beach is generally included in the report as a part of the “Zuma Beach Reach.”
The CCSTWS noted that the wave climate is strongly influenced by not only the El Niño Southern Oscillation (ENSO) but also the Pacific Decadal Oscillation (PDO). During a warm PDO as well as during El Niño seasons, storm waves are higher, wave periods are longer, and approach from a more westerly direction.
The CCSTWS evaluated six sets of beach profile surveys from 1951 to 2002 in the Broad Beach vicinity. The study found that the shoreline segment between Point Dume State Beach and Zuma County Beach is quasi-stable and that an overall slight erosion trend was occurring upcoast of Trancas Creek. Specific analysis at Broad Beach (i.e., Sta. 150+00 to 204+00) indicates that there was an initial shoreline advance during the 1951-1970 period followed by an erosion rate of approximately -2.0 ft/yr between 1970 and 2005. Field observations have indicated that the erosion rate has recently accelerated.
After an initial gain between 1951 and 1962, the subject beach has continuously eroded since the 1960s, particularly during the latest period from 1970 to 2005. A total of 381,000 cy was lost in the shore zone with the subaerial loss of 237,000 cy during 1970-2005 period. Recent field observations after 2005 indicate that the erosion at Broad Beach has accelerated, which results in private beach-front dwellings being severely exposed to storm wave attack.
The advanced berm position in 1970 at Broad Beach is probably a direct consequence of the major flood event of 1969, during which substantial fluvial sediment supply from the Trancas Creek watershed. (sic)
Analysis shows a general increase of sand volume at Point Dume and Zuma Beach, but a volume reduction trend from 1970 at Broad Beach. It is postulated that the eroded subaerial and surfzone volume at Broad Beach may have moved further downcoast toward Point Dume.
At Broad Beach and Trancas Beach, residences are generally located behind a low-crested protective sand dune except for a small number at the west end where the dwellings are directly built on the narrow beach. Historically, the area has experienced periods of beach recession and recovery. However, recent field observations indicate an acceleration of beach erosion without any recovering cycles. The residences that encroach on the beach without any low-dune protection on the west end of Broad

Broad Beach Restoration Project, Coastal Engineering Report
Moffatt & Nichol 18
Beach are extremely vulnerable to storm wave attack. Several dwellings have either been destroyed or severely damaged during recent storm seasons, as waves undermined the dwellings’ footings that were directly built on the beach grade. Shore protective measures, either hard structures or sand replenishment, combined with sand retention features are vital to provide protection for these private dwellings.
4.2.2 Shoreline Stabilization Study, 31302 to 31340 Broad Beach Road (TerraCosta, 2008)
In many ways, the objective of the TerraCosta study was similar to the objective of the Broad Beach restoration project, except on a smaller scale. The shoreline stabilization study was prepared for eight properties near the west end of Broad Beach seeking a long-term solution for shoreline stabilization. The study involved an overview of the history and likely causes of shoreline erosion at Broad Beach, a discussion of the relevant shoreline processes, a geotechnical assessment of the properties, and a discussion of available shoreline protection alternatives.
The following excerpts summarize the findings of the TerraCosta study:
Because of the coastal setting in the relatively small and isolated Zuma littoral cell (ZLC), the area’s beaches are even more dependent on the steady supply of sand from the limited local sand sources than are most other Southern California beaches that exist in much longer cells. The study included a sediment budget for the eastern portion of the ZLC and suggested that under natural conditions, an estimated 65,000 cubic yards per year (cyy) of sand was provided on average to the shoreline of the Zuma cell by the small streams and canyons between Point Mugu and Point Dume, and also from erosion of the coastal cliffs in the past half century. Human intervention in the cell resulted in a reduction of sand supply by 25% from 65,000 cy to 50,000 cy. It was also noted that these reductions happened many years ago (i.e., 25 to 75 years ago).
The south facing orientation of the ZLC has two important consequences as far as wave-driven sand transport is concerned: 1) it exaggerates the importance of alongshore sand transport in this cell since the most energetic Pacific Ocean waves during winter arrive from the west at relatively large angles to the coast; and 2) this increases the longshore sand transport rate and makes the transport direction essentially all one way: from west to east.
During the 1997-1998 El Niño storm season, Broad Beach experienced significant erosion of both the beach face and the back dunes, and by mid-January 1998 homeowners were sandbagging the back beach scarp to protect their existing improvements and, in particular, their rear-yard septic leach fields. During one particularly severe storm in early February 1998, with sand bags already in place, the active beach scarp retreated more than 30 feet in the course of two days.

Broad Beach Restoration Project, Coastal Engineering Report
Moffatt & Nichol 19
The elevation of the Tertiary Trancas Formation bedrock shore platform along this section of Broad Beach is approximately four feet below mean sea level (-4 feet MSL), in the vicinity of the existing rock revetment…the presence of this shore platform, which today has as little as 4 feet of sand cover, suggests that a reasonable worst case design scour elevation is this bedrock platform near elevation -4 feet MSL.
In the absence of any proposed stabilization measures, the existing leach fields for the OWTS are in imminent danger, posing an immediate health risk if these fields are breached. Although the subject properties [certain west Broad Beach homes] are partially protected by the rock revetment installed in 1998, this revetment is now failing as storm waves continue to sluice fines out of its face.
The existing OWTS requires a sand bedding to treat and otherwise disinfect effluent. The close proximity of bedrock in the vicinity of and underlying most of the leach fields precludes the use of a conventional vertical seawall immediately seaward of these structures. Since a seawall is relatively impermeable, it would inhibit the lateral, shoreward migration of effluent through the natural sand filtration. This would cause ponding of effluent below the leach fields producing large hydrostatic pressure forces behind the wall likely leading to failure, and would compromise the leach fields’ ability to function as designed.
A properly engineered rock revetment is proposed to be built along a smooth curvilinear line immediately seaward of the existing leach fields. In addition to the rock revetment, a privately-funded beach nourishment and dune restoration project is proposed to bury the proposed revetment and rebuild the sand beach by up to 200 feet seaward of the existing active beach scarp.
4.2.3 Development of Sand Budgets for California’s Major Littoral Cells (Patsch and Griggs, 2007)
Patsch and Griggs (2007) found that bluff erosion contributed an average of 8,000 cyy of sand between Point Mugu and Point Dume. This sand contribution has been reduced by approximately 12% (approximately 1,000 cyy) from the natural contribution due to armoring of approximately 3,500 feet of bluffs in this stretch of coast.
The report summarizes studies regarding sediment transport (i.e., loss) to the Point Dume Submarine Canyon located at the eastern terminus of the ZLS. There is disagreement among experts as to the rate of sand captured by Dume Canyon. Inman (1986) estimates that 90% of longshore transport bypasses the canyon, while Orme (1991) estimates that only 10% bypasses the canyon. A recent study by Knur and Kim (1999), estimated that 70% of the littoral drift enters the canyon, meaning 30% of the littoral sediment bypass the canyon. A detailed investigation into previous studies and existing data on this topic was recently performed by

Broad Beach Restoration Project, Coastal Engineering Report
Moffatt & Nichol 20
Everts Coastal and is summarized in Section 4.2.6. The conclusion of this investigation is that almost all longshore transport bypasses the canyon with only minor losses to the canyon during major storm events.
4.2.4 National Assessment of Shoreline Change Part 3: Historical Change and Associated Coastal Land Loss along Sandy Shorelines of the California Coast (USGS, OFR 2006-1219)
This study of the California coast developed estimates of short-term and long-term historical shoreline change for the Santa Monica Region that includes the ZLS. This study evaluated shoreline trends by comparing three historical shorelines digitized to represent general shoreline position in the 1800s, 1920s-1930s, and the 1950s-1970s and a recent shoreline position from LIDAR topography between 1998 and 2002. The long-term rates of shoreline change were calculated using all four shorelines while short-term rates were developed by comparing the two recent shorelines. The results of this study are shown in Figure 4-3. Within the Santa Monica region, Leo Carillo Beach, upcoast of Broad Beach, had the highest rate of long-term erosion at -0.3m/yr. The maximum short-term (1998-2002) shoreline change rate of -2.2m/yr occurred at Trancas Beach, the eastern end of Broad beach.

Broad Beach Restoration Project, Coastal Engineering Report
Moffatt & Nichol 21
Figure 4-3. Shoreline Change Rates for Santa Monica Region (USGS, 2006)

Broad Beach Restoration Project, Coastal Engineering Report
Moffatt & Nichol 22
4.2.5 Summary of Broad Beach Erosion and Beach Nourishment Investigation and Responses to Proposed Nourishment Plan (Griggs, August 2012)
Gary Griggs was consulted recently to provide an independent assessment of the erosion problem at Broad Beach and the proposed beach restoration project. The assessment was based on his review of the following documents:
Moffatt & Nichol (2012) Broad Beach Restoration Project Public Resource Environmental Impact Analysis and its Appendices, including two extensive reports by Everts Coastal;
Coastal Erosion Study for Broad Beach by TerraCosta (2008) including the reports by O’Reilly and Flick on Waves, and the Long and Short-Term Beach Changes Along Broad Beach, Malibu by Griggs & Associates;
Beach Changes Along the Southern California Coast During the 20th Century: A Comparison of Natural and Human Forcing Factors, Shore and Beach (2011) by A. Orme, G. Griggs, D. Revell and J. Zoulas;
Sea Level Rise Along the Coasts of California, Oregon and Washington: Past, Present and Future, National Research Council (2012).
Adapting to Sea-Level Rise: A Guide for California’s Coastal Communities (2012) by N.L. Russell and G. Griggs, California Ocean Sciences Trust.
The complete summary report is attached as Appendix 8 to this report. The following are some excerpts from his assessment:
Several investigations into the narrowing and loss of the western end of Broad Beach strongly suggest that a combination of at least two coincident factors have led to progressive beach loss:
o Reduction in sand supply: A significant portion of the littoral sand moving downcoast, or from west to east along Broad Beach, and which built the beach over time, has come from the upcoast Santa Barbara littoral cell and historically was able to bypass the head of Mugu Canyon and continue to the west. One to two million cubic yards of sand is dredged on average every other year and bypassed across the entrances of Channel Islands and Port Hueneme harbors. Everts Coastal estimates that the canyon formerly trapped about 60% of the littoral sand, which meant that about 400,000 yds3/yr would have continued downcoast towards Broad Beach. The head of Mugu Canyon head has progressively migrated landward as sea level slowly rose, however, as did the shoreline. A revetment was constructed along the shoreline near the canyon head in the mid-1970s, which stopped the shoreline from retreating but led to a narrowing of the zone of littoral sand transport. By the mid-1990s, about
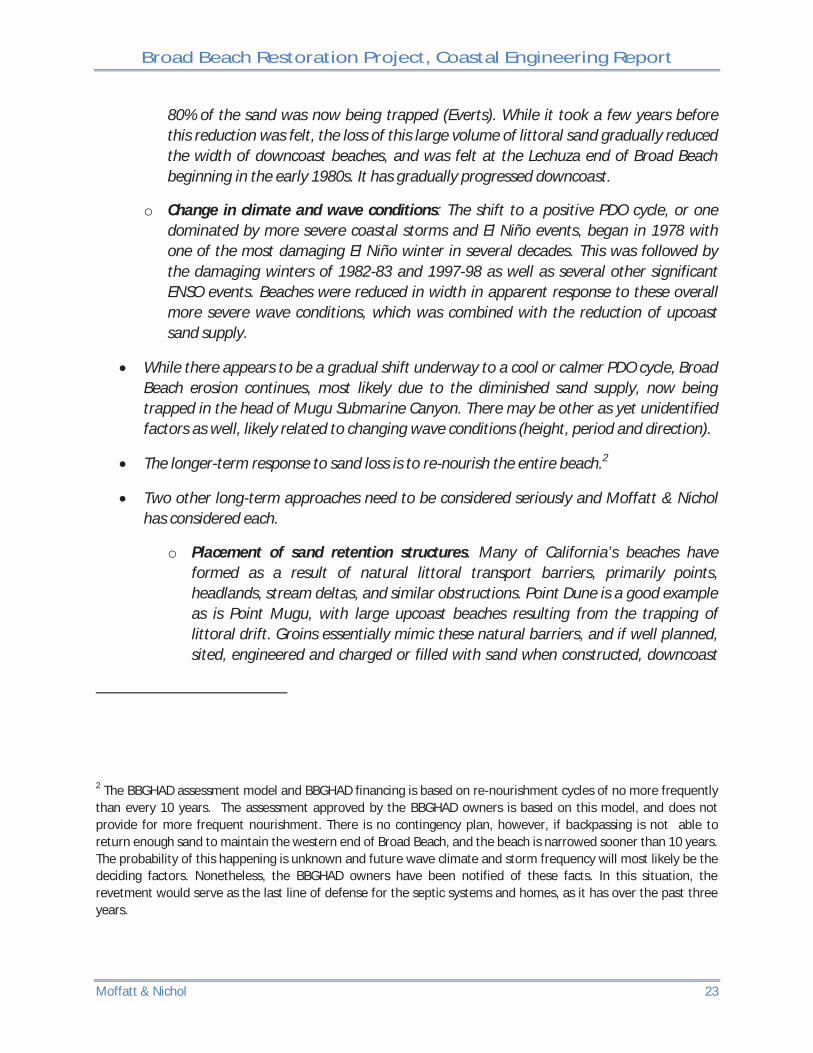
Broad Beach Restoration Project, Coastal Engineering Report
Moffatt & Nichol 23
80% of the sand was now being trapped (Everts). While it took a few years before this reduction was felt, the loss of this large volume of littoral sand gradually reduced the width of downcoast beaches, and was felt at the Lechuza end of Broad Beach beginning in the early 1980s. It has gradually progressed downcoast.
o Change in climate and wave conditions: The shift to a positive PDO cycle, or one dominated by more severe coastal storms and El Niño events, began in 1978 with one of the most damaging El Niño winter in several decades. This was followed by the damaging winters of 1982-83 and 1997-98 as well as several other significant ENSO events. Beaches were reduced in width in apparent response to these overall more severe wave conditions, which was combined with the reduction of upcoast sand supply.
While there appears to be a gradual shift underway to a cool or calmer PDO cycle, Broad Beach erosion continues, most likely due to the diminished sand supply, now being trapped in the head of Mugu Submarine Canyon. There may be other as yet unidentified factors as well, likely related to changing wave conditions (height, period and direction).
The longer-term response to sand loss is to re-nourish the entire beach.2
Two other long-term approaches need to be considered seriously and Moffatt & Nichol has considered each.
o Placement of sand retention structures. Many of California’s beaches have formed as a result of natural littoral transport barriers, primarily points, headlands, stream deltas, and similar obstructions. Point Dune is a good example as is Point Mugu, with large upcoast beaches resulting from the trapping of littoral drift. Groins essentially mimic these natural barriers, and if well planned, sited, engineered and charged or filled with sand when constructed, downcoast
2 The BBGHAD assessment model and BBGHAD financing is based on re-nourishment cycles of no more frequently than every 10 years. The assessment approved by the BBGHAD owners is based on this model, and does not provide for more frequent nourishment. There is no contingency plan, however, if backpassing is not able to return enough sand to maintain the western end of Broad Beach, and the beach is narrowed sooner than 10 years. The probability of this happening is unknown and future wave climate and storm frequency will most likely be the deciding factors. Nonetheless, the BBGHAD owners have been notified of these facts. In this situation, the revetment would serve as the last line of defense for the septic systems and homes, as it has over the past three years.

Broad Beach Restoration Project, Coastal Engineering Report
Moffatt & Nichol 24
impacts can be reduced or mitigated. The groins at Will Rogers State Beach in the Santa Monica Cell are good examples, as are those at Ventura and Newport Beach, which have helped to build and stabilize wide beaches for public use. With all of the effort and expense involved in nourishing Broad Beach with 600,000 yds3 of sand, it makes no practical or environmental sense not to retain the sand that has been deposited on the beach. Without question, there are issues to be resolved, and more than one approach exists, but retention is strongly recommended as a consideration at the front end of the project.
o Develop a sand bypass system for the head of Mugu Canyon. The sand historically provided to the Zuma Cell and Broad Beach was carried around the head of Mugu Canyon and then continued on downcoast. This is the natural sand that was provided for centuries and that built the historically wide Broad Beach as well as the beaches between Pt. Mugu and Lechuza Point. All evidence today indicates that due to shoreline armoring at the head of the canyon that the zone of littoral transport has been pinched down or squeezed so that most of the approximately one million cubic yards of sand approaching the end of the Santa Barbara Littoral Cell on average each year, now enters the Mugu Canyon system and is no longer carried downcoast into the Zuma Cell. One to two million cubic yards are dredged bi-annually from the upcoast side of Channel Islands harbor, pumped across the entrance, then across the entrance of Port Hueneme and finally discharged in the littoral zone. Littoral drift moves the sand 6.5 miles downcoast to the head of Mugu Canyon. A sand bypassing system that moved some portion of the sand across the canyon head and deposited it on the downcoast beach would allow this sand (which is otherwise lost permanently to Mugu Canyon and the deep-sea floor) to continue into the Zuma Cell and then nourish beaches, including Broad and Zuma Beaches, along the Santa Monica shoreline, and all the way to Hermosa Beach and the Redondo Submarine Canyon, a huge public benefit.
4.2.6 Sediment Transport Along the Malibu Coast (Everts, 2012)
The purpose of this study was to summarize and synthesize existing data to estimate the amount of sediment transported to Point Dume, the amount deflected seaward into Dume Submarine Canyon, and the amount that passed Point Dume and was deposited at Santa Monica and Venice. The complete study is provided in Appendix 2 to this report. The following are some brief excerpts from the report:
Since at least the last two-thirds of the 20th Century, about 250,000 cubic yards of sand were annually transported in a west-to-east direction to Point Dume. Less than 1,000 cubic yards per year (cyy) were deflected into Dume Submarine Canyon. Added to the large amount that moved around the headland was sand discharged from the Santa

Broad Beach Restoration Project, Coastal Engineering Report
Moffatt & Nichol 25
Monica Mountains and sand freed as sea cliffs eroded. In total, about 300,000 cyy reached Santa Monica and Venice.
A balanced sediment budget provides the most direct and convincing proof of this continuum of sand movement. A compelling line of evidence that Dume Submarine Canyon is not a significant sink for littoral sand is based on the large separation distance between the canyon and Point Dume, the water depth at the canyon rim, the characteristics of the infill deposit in the head of the canyon, the usually smooth sediment transport surface between the canyon rim and Point Dume, and the small offset between Westward Beach and Point Dume.
If artificially placed at Broad Beach, sand, with the appropriate size distribution (and, of course, taken from outside any littoral zone) will initially benefit Broad Beach. Over time, it will move east thereby temporarily benefiting Zuma and Westward Beaches. But in due course, almost all of it will pass Point Dume and most of it will pass Malibu. It will eventually end up at Santa Monica and Venice. Its behavior as it moves east will be the same as that of sand that entered the coastal stream in the past from as far away as Port Hueneme.
4.3 EXISTING CONDITIONS
This section summarizes the findings of various assessments (attached in Appendix 2) which examine the biological and cultural resources located both at the Broad Beach fill site and vicinity, as well as at the proposed borrow sites.
4.3.1 Existing Biological Resources at Broad Beach
4.3.1.1 Existing Marine Biological Resources at Broad Beach
Chambers Group, Inc. conducted a reconnaissance survey of marine biological resources at Broad Beach in the fall of 2010. The biologists identified surfgrass, rocky intertidal and subtidal reef areas in the west end of the project site, primarily off Point Lechuza, which becomes more scattered and patchy to the east. Kelp and eelgrass resources are located further offshore at an estimated distance of 1,000 feet from the proposed project’s seaward limit. The eelgrass bed occurs just east of Lechuza Point at depths of about 24 to 47 feet. As a result of these findings, the project footprint design in the west end was separated into reaches and customized to minimize impacts to sensitive resources while seeking to nourish the beach and approach its 1970’s width. The Chambers Group, Inc. report is provided in Appendix 1. Field mapping of marine bio resources was updated by Chambers Group, Inc. on April 10, 2012 and a results report submitted to the CCC in BBGHAD submittal no. 3 in January 2013. Additional surveys

Broad Beach Restoration Project, Coastal Engineering Report
Moffatt & Nichol 26
conducted of the site include mapping and quantitative winter and summer surveys of the intertidal, subtidal eelgrass, kelp and sandy beach habitats. Data from these surveys are included in Exhibit I to the current BBGHAD CDP submittal. A full analysis of possible impacts to existing marine biological resources posed by the proposed project as well as the various project alternatives is also provided in Exhibit I.
4.3.1.2 Dune Habitat and Environmentally Sensitive Area (ESHA)
Section 30107.5 of the 1976 Coastal Act defines ESHA as an "Environmentally sensitive habitat area.” The City of Malibu Local Coastal Program’s (LCP) Land Use Plan (LUP) dated September 2002 outlines programs and policies by which the Coastal Act will be implemented in Malibu. The LUP replicates the Coastal Act language in its description of ESHAs as
“areas in which plant or animal life or their habitats are either rare or especially valuable because of their special nature or role in an ecosystem and which could be easily disturbed or degraded by human activities and developments.”
Malibu’s LUP specifically designates the following areas as ESHA:
“The ESHAs in the City of Malibu are riparian areas, streams, native woodlands, native grasslands/savannas, chaparral, coastal sage scrub, dunes, bluffs, and wetlands...” (LCP Land Use Plan, C. Land Use Plan Policies, 1. Land Resources, a. ESHA Designation, section 3.1, p. 48)
ESHAs are “protected against significant disruption of habitat values and only uses dependent on such resources shall be allowed within such areas.” Accordingly, development within the City of Malibu must consider a range of conditions aimed at ensuring ESHA protection.
The City of Malibu’s LUP includes a series of overlay maps to depict areas defined as ESHA. Although the ESHA map depicting the project area (ESHA Overlay Map 1: Nicholas Canyon to Trancas Beach) does not label the dune areas on Broad Beach as ESHA, the City of Malibu LCP LUP does classify dunes as ESHA, as follows:
“Any area not designated on the LUP ESHA Map that meets the ESHA criteria is ESHA and shall be accorded all the protection provided for ESHA in the LCP.” (LCP Land Use Plan, C. Land Use Plan Policies, 1. Land Resources, a. ESHA Designation, section 3.4, p. 49).
Furthermore, the LUP states that:
“any area mapped as ESHA shall not be deprived of protection as ESHA, as required by the policies and provisions of the LCP, on the basis that habitat has

Broad Beach Restoration Project, Coastal Engineering Report
Moffatt & Nichol 27
been illegally removed, degraded, or species that are rare or especially valuable because of their nature or role in an ecosystem have been eliminated.”
In other words, LUP guidelines classify all dune features, regardless of dominant species or condition, as ESHA.
A dune and habitat assessment was conducted for the proposed Broad Beach project area in August 2011 by WRA Environmental Consultants (WRA). This assessment determined that “the study area supports minimal cover of native dune species, a limited area of remnant dune formations and is dominated by invasive species.” The assessment determined the total remnant dune formation area at the project site measures 0.04 acre with the remaining planted relic dune area containing a range of invasive, native, and non-native species. The majority of the dune habitat within the study area, 1.73 acres, was defined in the assessment as unvegetated sand. An analysis of ESHA impacts for project alternatives involving revetment realignment or seawall creation was conducted by WRA, Inc.
The WRA Dune Report and Section 3 of the City of Malibu’s LUP describing ESHA designation are provided in Appendix 2. A quantitative survey of the summer dune condition was conducted by WRA in June 2013 and the results of the survey are provided as Exhibit K(e) to the current BBGHAD CDP submittal.
(1) Special Status Plant Survey
A protocol-level special status plant survey was conducted for the Broad Beach site by WRA, Inc. on November 30 and December 1, 2010 and May 24 and August 23, 2011. The primary purpose of the survey was to determine the presence/absence of all special status plant species and natural communities. Special status plants were defined by the survey to include: 1) all plants that are federal- or state-listed as rare, threatened or endangered; 2) all federal and state candidates for listing; 3) all plants listed in Lists 1 and 2 of the California Native Plant Society (CNPS) Inventory; and 4) plants that qualify under the definition of “rare” in the California Environmental Quality Act (CEQA).
A WRA, Inc. botanist familiar with the flora of South Coast California coastal dunes conducted three protocol-level special status plant surveys within the project study area that coincided with the blooming period of all three species. Of the 50 plant species observed in the study area, none were identified as constituting special status plants. Based upon a review of California Natural Diversity Database (CNDDB) (CDFG, 2011), California Native Plant Society (CNPS) Electronic Inventory (CNPS, 2011) United States Fish and Wildlife Service (USFWS) Species List (USFWS, 2011) and Consortium of California Herbaria (CCH, 2011) resources and databases, 36 special status plant species have been documented in the greater vicinity of the study area. In conclusion, a total of three species – none of which were observed in the area during the surveys – were determined to have a moderate or high potential to occur in the

Broad Beach Restoration Project, Coastal Engineering Report
Moffatt & Nichol 28
study area: Coulter’s Saltbush, Orcutt’s pincushion and Dune Larkspur. Although red sand verbena was observed in the study area, it is a CNPS List 4 species which are afforded little or no protection under CEQA and is not considered an ESHA under the Malibu LCP. The survey concluded that the 0.04 acre of natural dune mat community comprises a fraction of the overall vegetation and that the post dune restoration dune mat community acreage and species richness will likely improve substantially compared with existing conditions.
The WRA, Inc. Special Status Plant Survey is included in Appendix 2.
4.3.1.3 Trancas Creek
Trancas Lagoon, located three miles west of Point Dume in the City of Malibu, is fed by Trancas Creek. As concluded in the Santa Monica Bay Restoration Plan (2008), “[T]he mouth of the creek is often blocked by a sand berm which prevents tidal exchange and causes the creek water to pond during seasonal high flows.”
Section 3.2.5 of The Malibu General Plan states that the lagoon is “permanently flooded ….exposed to marine tidal influences during the winter months but …isolated from the Ocean as stream flows decline and sand barriers develop.” Accordingly, the plan concludes that “[D]espite the periodic influences of salt water, these habitats are characterized as predominately freshwater habitats.”
Trancas Creek is defined as a seasonal creek, running only after heavy rains; in drier years, it does not run at all. The proposed project’s beachfill footprint will taper off at the east end of Broad Beach and will not extend all the way to Trancas Creek or Trancas Lagoon; thus, it will not fill it. Therefore, it is anticipated that the proposed project will not interfere with the natural functioning of the creek. Beach nourishment will eventually result in a variable widening of the beach in front of the creek mouth but will not change the existing elevation of the barrier beach. Overtopping of the beach by impounded lagoon water is the cause of barrier breaching. Maintaining the same elevation of the barrier beach after project implementation should maintain the existing condition of episodic breaching as part of lagoon processes.
In August 2013, Chambers Group Incorporated conducted a survey of Trancas Lagoon and creek mouth. Vegetation communities within the lagoon downstream of the Pacific Coast Highway (PCH) bridge and immediately upstream of the lagoon were mapped on a geo-referenced aerial photograph from the summer of 2011. The perimeter of the lagoon was mapped by walking the outer boundary of the area where visual evidence of water (drift deposits, salt marsh vegetation) occurred. The boundary was delineated with a Trimble GeoXH 6000 sub-decimeter GPS unit using Arc GIS Mobile for the mapping. The boundary of open water on the day of the survey also was mapped. Observations were made of plant species and wildlife present at the time of the survey. The results of this survey are provided in Exhibit I(a) to the current BBGHAD CDP submittal.

Broad Beach Restoration Project, Coastal Engineering Report
Moffatt & Nichol 29
During construction, earthmoving equipment will be staged at Zuma Beach parking lot (County Lot 12) and will need to cross the area at the unbreached creek mouth to access the project site. Equipment anticipated to be crossing the area include two bulldozers, delivery trucks, front end loaders and scrapers. The Chambers survey report in Exhibit I(a) addresses proposed crossing alternatives to avoid impacts to Trancas Lagoon and creek mouth should breaching occur during proposed project activities. Any methods to facilitate crossing the lagoon should the mouth open during project activities will be designed not to impede fish passage.
The BBGHAD will contact CDFG personnel in the event that the Creek mouth is breached during the construction period.
It could be argued that, if nourishment was not to occur at Broad Beach, the beach would eventually retreat back to a point where the lagoon would breach more often and thus modify the existing habitat to be more salt marsh and less freshwater/brackish marsh and may be less suitable for existing sensitive species.
4.3.1.4 Western Snowy Plover and Grunion
Western Snowy Plover
Unit CA-43, Zuma Beach, has been designated by the Fish & Wildlife Service as critical habitat (criticalhabitat.fws.gov) for the federal threatened Pacific Coast Western Snowy Plover (Charadrius alexandrinus nivosus). The western-most edge of this critical habitat unit overlaps with the eastern most edge of the proposed project site. Biologists with the Chambers Group, Inc. analyzed the position of the emergency revetment in relation to this critical habitat unit and concluded that the amount of plover habitat located seaward of the revetment is 0.24 acres, or 0.3 percent of the total snowy plover critical habitat within the Zuma Beach unit.
Biological monitors from Chambers Group, Inc. observed snowy plover activity throughout the Broad Beach area before, during, and after construction of the revetment. Plovers were observed primarily foraging along the edge of the water with very limited presence in the upper intertidal area even before revetment construction. This is largely due to the narrow beach along the majority of the project site prior to installation of the revetment and following its installation resulting in a very limited upper wrack line. Moving further southeast to the mouth of Trancas Creek, where there is no restriction to the waves at high tide, snowy plovers were observed foraging higher on the beach where wrack was much more abundant. Biologists were on site to ensure that the movement of equipment across the mouth of Trancas Creek going towards the western beach during revetment construction did not disturb snowy plovers. They concluded that this movement had no adverse impacts to the plovers and only a brief transitory impact on the critical habitat.
Special Condition 9 of the USACE permit for the emergency revetment construction required submittal of the biologist’s monitoring report to both the Corps Regulatory Division and the

Broad Beach Restoration Project, Coastal Engineering Report
Moffatt & Nichol 30
CDFG within 60 days of ceasing authorized activities. Accordingly, the snowy plover monitoring results report compiled by Chambers Group, Inc. during the revetment and public access way stages of the project was submitted to satisfy this condition. This report is included in Appendix 2.
It is anticipated that the monitoring plan developed for the proposed long term project will require a snowy plover avoidance and monitoring approach for beach activities. It is likely that, following beach restoration, the widened Broad Beach will increase the area of wrack line and provide more conducive habitat to the western snowy plover.
Grunion Monitoring
Qualified Chambers Group, Inc. monitors were on-site to monitor both grunion and snowy plover from March 19 to 22, 2011 during a survey of the revetment toe by KDM Meridian. The grunion monitoring periods occurred over two hour time periods between the hours of 10:00 p.m. and 2:00 a.m., based on predicted grunion runs set forth by the CDFG. Monitoring began at least 15 minutes before the anticipated start of the run, and continued until the end of the run; during that period, monitors did not observe any grunion wash up or spawn at the project site. The monitoring report stated that the tide was so high along the majority of the project site that the waves crashed onto the riprap leaving very little exposed beach available for grunion spawning. The narrow beach condition at Broad Beach existed prior to installation of the revetment and grunion were not observed historically at this site. Biologists deemed the only area of the project suitable for grunion spawning to be located near the southeast end of the project area by the Trancas Creek outlet and Zuma Beach. However, grunion were not observed in this area during the survey period. A report detailing the results of both snowy plover and grunion monitoring during the revetment toe survey period is included in Appendix 2.
Due to the absence of grunion on Broad Beach, construction will not require any special consideration for grunion. However, it is anticipated that, following beach restoration, the widened Broad Beach and resultant increase of exposed sandy beach will provide more conducive habitat to spawning grunion. Therefore, future restoration activities, such as sand backpassing and possible future re-nourishment, may need to consider grunion if they are then shown to exist at Broad Beach.
4.3.2 Discussion of Baseline Condition
The California Coastal Commission (CCC) has requested that the BBGHAD analyze all habitat impacts of project components in relation to a baseline condition that predates all project components, including the placement of temporary sandbag revetments. All available and relevant materials were reviewed as part of the requested analysis including photographs, mean high tide line surveys, oblique offshore photographs and beach profile data. The year

Broad Beach Restoration Project, Coastal Engineering Report
Moffatt & Nichol 31
2005 was selected as an accurate pre-project condition, as this year predates the placement of the sandbag revetments, most of which were installed in 2007-08 and are now located behind and immediately inland of the 2010 emergency rock revetment. While a baseline date closer to the 2007-08 sandbag revetment construction would be preferable, insufficient quality of aerial photographs and a lack of beach profile surveys exist directly from 2005 to 2008 to allow for a reasonable representation of existing beach habitat conditions during that period. As discussed below, analysis of oblique aerial photographs, mean high tide line surveys from 2005-07, and the BBGHAD's shoreline change analysis show that the Broad Beach shoreline remained relatively stable from 2005 to 2007.
For the year 2005, a sufficient range of both aerial and beach profile data for the Broad Beach site were available to estimate baseline conditions requested by the CCC. The 2005 aerial image view had the further benefit of being corroborated with oblique offshore photographs of each property courtesy of 2005 California Coastal Records Project images. In addition, beach profile surveys of the site were conducted in 2005 and were used to linearly interpolate the location of the +7 ft MLLW line, which is the upper limit of the intertidal zone. Below is an account of how the baseline condition was assembled to facilitate the most reliable estimation of the 2005 baseline condition.
Approach to Digitization of 2005 Baseline Condition
Coastal features were digitized to establish pre-project conditions. The beach features of interest for the baseline establishment were: foredune line (seaward limit of dune), wetted bound/approximate high tide line, +7 ft MLLW contour (upper extent of intertidal zone), and +0 MLLW (lower extent of Intertidal). Given these features, the following approach was to identify the baseline conditions:
1. Identification of the foredune was a straightforward process as a pronounced steep dune face/escarpment was seen in the aerial photograph. Digitization of the foredune line was aided using the June 9, 2005 California Coastal Records Project oblique photographs. This approach relies on subjective interpretation of aerial photographs as a best effort, and, very likely, over-estimates impacts to sand dunes; thus resulting in conservatively high numbers.
2. “The wetted-bound shoreline is a line of color change near the landward limit of high water wave uprush found on almost all aerial photographs of the beach,” (Everts 1993). On a local scale, the wetted bound will mark the same elevation over the entire beach. This elevation is usually higher than MHHW due to wave action. The wetted bound on the 2005 USDA aerial is easily identified for digitization.
3. Identification of the +7 ft contour requires a little more information. On June 11, 2005, Fugro West performed transect surveys of Broad Beach at four (4) locations. Using this survey data, the location of +7 ft MLLW was linearly interpolated. For the four (4) transects, the +7-ft point was on average 7.11 feet landward of the wetted bound. The

Broad Beach Restoration Project, Coastal Engineering Report
Moffatt & Nichol 32
digitized +7-ft contour was then created by offsetting the wetted bound 7.11 feet landward.
4. Digitization of the 2005 MLLW contour was digitized in the same manner as the +7-ft contour. On average, the MLLW contour (0’) was 144 feet seaward of the wetted bound.
Consequences of Habitat Impact Analysis When Compared with the 2005 Condition.
It is important to understand the changing shoreline conditions during the period immediately preceding the construction of the sandbag revetments in 2007-08 and the emergency rock revetment in 2010. Review of oblique aerial photographs in 2006 and 2007 show the shoreline remained relatively stable in terms of location of mean high tide line as approximated by the wetted bound shoreline location. This finding is corroborated in our shoreline change analysis illustrated in Figure 6-8 of this report. The shoreline was erosive during the latter 1990s until 2002 and leveled off until 2007, when it began to retreat again in the winter of that year, necessitating placement of the sandbag revetments.
From 2007 to 2010, both the approximated foredune limit line and beach had receded significantly. Sandbag revetments that were constructed in 2007-2008 were in response to the erosion. The emergency rock revetment was placed in early 2010, again in response to the erosion. The rock revetment's installation required more time for planning, budgeting and approvals due to its more substantial material composition. Analyses of the shoreline changes that occurred during this period indicate that temporary and permanent impacts occurred to what has been approximated as foredune habitat. The data indicate that this is the case even though sandbag and revetment installation occurred seaward of the visible remnant sand dune area in an effort to minimize dune impact. Some measure of subjectivity exists in the data and analyses. Therefore, impacts to dunes may again be over-estimated by the method. Finally, conditions at the site during construction of the rock revetment dictated that impacts were primarily limited to the upper sand beach (toward the revetment’s east end) and within the middle of the sandy beach (toward the revetment’s western end).
In addition to being compared to the estimated 2005 condition, the impacts of primary project components (nourishment, permanent retention of 2010 rock revetment, and pre-2010 sandbags) for the proposed project and all project alternatives are compared against the surveyed 2009 condition. This comparison provides a realistic assessment of overall project impacts to all key habitats. Comparing against the 2009 condition avoids assigning pre-2009 erosion to the emergency rock revetment. Impacts are quantified in marine biological and dune impacts analyses conducted by Chambers Group Inc. and WRA and summarized in a habitat impacts summary table.
In summary, this comparison to the 2005 condition is provided to facilitate the Commission’s request that all habitat impacts of project components be made against a baseline condition that predates all project components, including the placement of sandbags and revetment.

Broad Beach Restoration Project, Coastal Engineering Report
Moffatt & Nichol 33
Data shows the shoreline was already eroding in a significant manner prior to the period when the sandbag and rock revetments were constructed, and they were constructed in response to these conditions.
4.4 EXISTING BROAD BEACH COASTAL DEVELOPMENT
Broad Beach currently has a narrow “low tide beach” backed by the existing emergency revetment and existing single family homes. In the east-central and eastern sections of the beach, homes are relatively well set back from the beach and revetment, and are backed by a steep coastal bluff. Broad Beach Road, which provides direct access to most of the homes, is located at the toe of the bluff and Pacific Coast Highway runs along the top of the bluff. Most septic systems are located in the remnant dunes located between the homes and revetment. Historically, each home had its own coastal access path across the dunes; currently informal access down the revetment is often shared.
The temporary emergency rock revetment, shown in Photo 4-1 and Figure 4-4, is approximately 4,100 feet in length, extending from the residence immediately west of the western public access (31346 Broad Beach Road) to just west of the Malibu West Beach Club (30760 Broad Beach Road). The revetment is comprised of two different cross sections, described in more detail in Section 8.3. The western 400 feet of revetment, from about 31340 to 31302 Broad Beach Road, was constructed with 4-ton armor stone and represents a more robust design typical of a permanent coastal revetment in Southern California. The remaining 3,700 feet of temporary emergency revetment was constructed against an existing sandbag revetment using 0.5 to 3 ton armor stone Shore protective devices west of 31346 Broad Beach Road consist of individual measures constructed for one or two lots. These measures include rock revetments, concrete vertical seawalls, and timber seawalls. Several properties do not have any shore protective structure in place and some are supported by piles which are currently exposed.
The as-built temporary revetment drawings, included in Exhibit D, provide an accurate representation of current site conditions along the Broad Beach coastal development. Although the revetment is not considered part of the baseline existing condition, these plans also include relevant information such as site topography, at-risk structures, other permitted and unpermitted development including pre-existing rock and sand bag revetment, mean high tide line (MHTL) surveys, public access locations, easements and deed restricted areas, and existing OWTS.

Broad Beach Restoration Project, Coastal Engineering Report
Moffatt & Nichol 34
Photo 4-1. Broad Beach with Temporary Revetment (California Coastal Record Project)
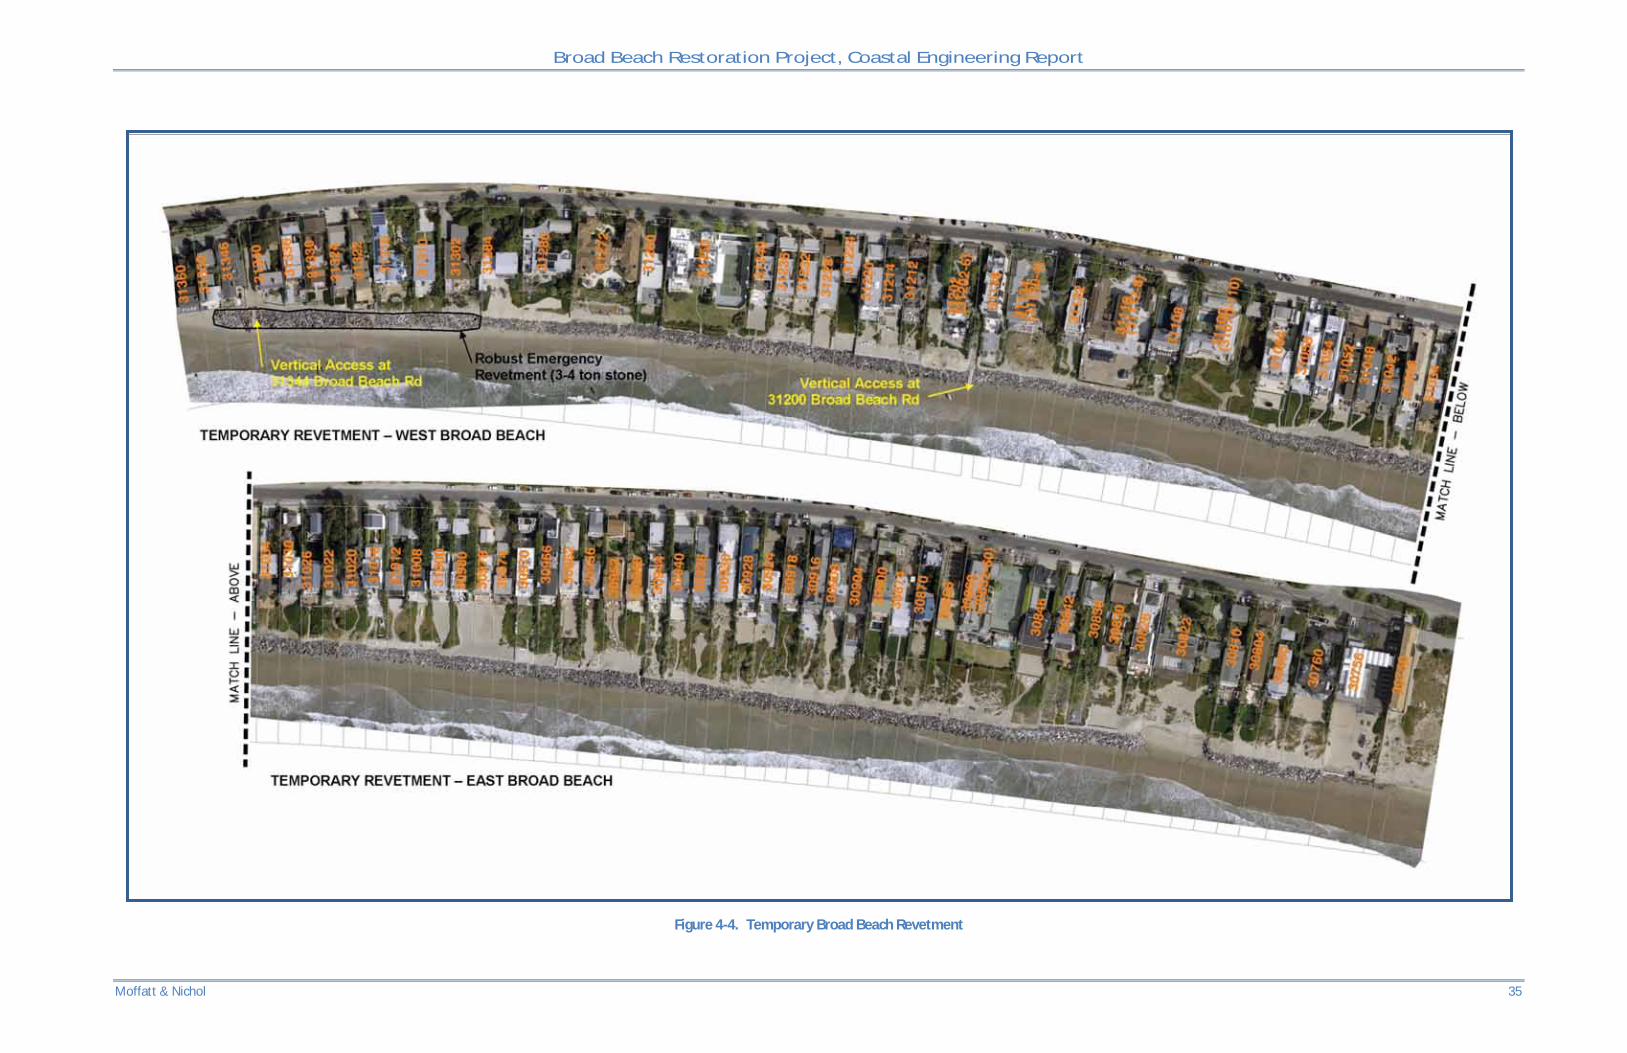
Broad Beach Restoration Project, Coastal Engineering Report
Moffatt & Nichol 35
Figure 4-4. Temporary Broad Beach Revetment

Broad Beach Restoration Project, Coastal Engineering Report
Moffatt & Nichol 36
4.5 PUBLIC ACCESS
Public access to Broad Beach is available via lateral access from Zuma Beach County Park and two vertical access points from Broad Beach Road. Ample parking is available at Zuma Beach, but is somewhat limited at the vertical access points.
Vertical access to Broad Beach is provided in two locations at 31344 and 31200 Broad Beach Road via real property owned by Los Angeles County between private properties as shown in Figure 4-4. A component of the emergency revetment project was the improvement of these vertical public access paths (access stairs over the revetment), which are operated and maintained by Los Angeles County Department of Beaches and Harbors. A concrete walkway and steps to the beach, shown in Photo 4-2 and Photo 4-3, were constructed over the temporary revetment to maintain vertical access at these locations.
The eroded shoreline along Broad Beach has significantly limited the recreational beach area and lateral access. There is essentially no dry beach available along most of the beach during even moderate high tides (3 to 4 feet). Most of the beach is submerged with waves breaking directly onto the temporary revetment. The eroded beach and temporary revetment restrict lateral access along most of Broad Beach except at low tides. Prior to the installation of the temporary emergency revetment, lateral access was equally limited by the sandbags placed along the beach scarp to resist erosion and protect the OWTS leach fields.
In addition to existing physical limitations, lateral access along Broad Beach is affected by a complicated mix of public land, access and recreational use easements (AREs) and private property. Land seaward the MHTL is considered public land. Approximately 35% of the parcels within the BBGHAD have granted some form of lateral access easements to the state of California; the remainder of the parcels has not granted any such access. The existing easements along Broad Beach vary from one property to the next according to the recorded grants, and in some areas may influence lateral access available to the public. Some recorded grants provide for a designated “buffer” seaward from authorized development on a property and the portion available for public access. The buffer typically varies from 5-feet to 50-feet wide along Broad Beach.
Exhibit D contains detailed information regarding existing ARE’s and other deed restrictions by parcel.

Broad Beach Restoration Project, Coastal Engineering Report
Moffatt & Nichol 37
Photo 4-2. Vertical Beach Access at 31344 Broad Beach Rd
Photo 4-3. Vertical Beach Access at 31200 Broad Beach Rd

Broad Beach Restoration Project, Coastal Engineering Report
Moffatt & Nichol 38
5. OCEANOGRAPHIC SITE CONDITIONS
5.1 Water Levels
Water levels and elevations on land throughout this study are referenced to the Mean Lower Low Water (MLLW) datum for the 1983-2001 tidal epoch. The following sections discuss the processes that influence water levels with a focus on those causing elevated water levels that are most often contributors to coastal-related flooding and damage.
5.1.1 Tides
The tides at Broad Beach are classified as mixed semidiurnal (two unequal highs and lows per day). Tide characteristics from the Los Angeles tide gage nearest the project site are shown in Table 5-1.
Table 5-1. Water Levels at Broad Beach, Based on LA Outer Harbor Tide Station (NOAA/NOS, 2008)
Water Level Elevation to MLLW Vertical Datum
Extreme High (Observed January 27, 1983) +7.8 feet Mean Higher High Water (MHHW) +5.5 feet Mean High Water (MHW) +4.7 feet Mean Sea Level (MSL), 1983-2001 Epoch +2.8 feet National Geodetic Vertical Datum -1929 (NGVD29) +2.6 feet Mean Low Water (MLW) +0.9 feet North American Vertical Datum – 1988 (NAVD88) +0.2 feet Mean Lower Low Water (MLLW) 0.0 feet Extreme Low (Observed December 17, 1933) -2.7 feet
5.1.2 Extreme Water Level Statistics
In Southern California, the highest tides of the year typically occur in the winter months. Wave overtopping and wave-related coastal damage often occurs when an extremely high tide coincides with high storm waves. A statistical analysis of extreme water elevations was developed based on recorded annual extreme high water elevations obtained from the National Ocean Service for the outer Los Angeles Harbor reference tide station. Water elevation records were available from 1923 to 2002. Table 5-2 shows the annual extreme high water elevation versus recurrence interval. The extreme still water levels combined with SLR projections provide the basis for estimating a design water depth for coastal engineering analyses.

Broad Beach Restoration Project, Coastal Engineering Report
Moffatt & Nichol 39
Table 5-2. Extreme Water Levels versus Recurrence Interval
Recurrence Interval (Years)
Extreme Still Water Elevation (Feet,
MLLW) 5 7.4
10 7.6 25 7.7 50 7.9
100 8.0
5.1.3 Sea Level Rise
Sea level is rising as the result of general global warming that melts ice caps and expands the water column through heating. At a given coastal site, the rate of eustatic (global) sea level rise (SLR) is of less practical importance than the local rate of SLR relative to the land. This rate is known as the relative SLR rate and is the net sum of the global SLR rate with addition or subtraction of local land uplift or subsidence. SLR rates experienced at a specific location can also be influenced by shorter time-scale climatological effects such as the El Niño Southern Oscillation and the Pacific Decadal Oscillation.
In the Los Angeles area, long-term tide records (1924 to present) at the NOAA LA Outer Harbor station indicates a water level change of 3.3 ±1.1 inches per century, as shown in Figure 5-1. This is significantly lower than (half) the historic eustatic average SLR rate of 6.6 ±2 inches per century (IPCC, 2007), which suggests that land uplift accounts for the difference (3.3 inches per century) at this location.
Figure 5-1. SLR at LA Outer Harbor Buoy

Broad Beach Restoration Project, Coastal Engineering Report
Moffatt & Nichol 40
5.1.3.1 State of California SLR Guidance
The latest state guidance is provided in a document titled “State of California Sea-level Rise Guidance Document” (CO-CAT, 2013), that was released in March 2013 for state agencies to incorporate SLR projections into planning decisions. The document recommends using the range of SLR projections presented in the June 2012 National Research Council (NRC) report on Sea-Level Rise for the Coasts of California, Oregon, and Washington. Selection of SLR values for design and planning should also account for time horizon, risk tolerance, and adaptive capacity.
The NRC 2012 SLR projections for 2030 and 2050 are summarized in Table 5-3. SLR projections for the year 2040 were interpolated between published values for 2030 and 2050 in the NRC report (2012). Linear interpolation results in a slight overestimation of SLR since the models generally predict an exponential increase in SLR. Over the relatively short time period between 2030 and 2050, this provides a reasonable estimate to use for the proposed project time horizon.
Table 5-3: Regional SLR Projections for Los Angeles
Year Projection inches (cm)
Potential Range inches (cm)
2000 - 2030 5.9 (15) 5 - 8 (4-30)
2000 – 2040* 8.5 (21.5)* 3.2 - 18 (8-46)*
2000 - 2050 11 (28) 4.7 - 24 (12-61)
SLR projections from 2000 baseline. Source: NRC, June 2012 * SLR projections interpolated for year 2040
5.1.3.2 Federal SLR Guidance
The USACE released Engineering Circular (EC) No. 1165-2-212 in October 2011, which updated their prior EC (No.1165-2-211) released in 2009 on the same topic. The EC provides guidance on the consideration of the direct and indirect physical effects of SLR across the project life cycle for civil works projects. Specifically, projects must consider how sensitive and adaptable are: 1) natural and managed ecosystems; and 2) human and engineered systems to climate change and other related global changes.
The EC recommends consideration of three SLR scenarios (low, intermediate, and high) over the project life-cycle. These scenarios are as follows:
“Low” rate – the historic rate of SLR extrapolated over the project life;
“Intermediate” rate – the modified NRC Curve I and Equations 1 and 2 added to the local rate of vertical land movement:
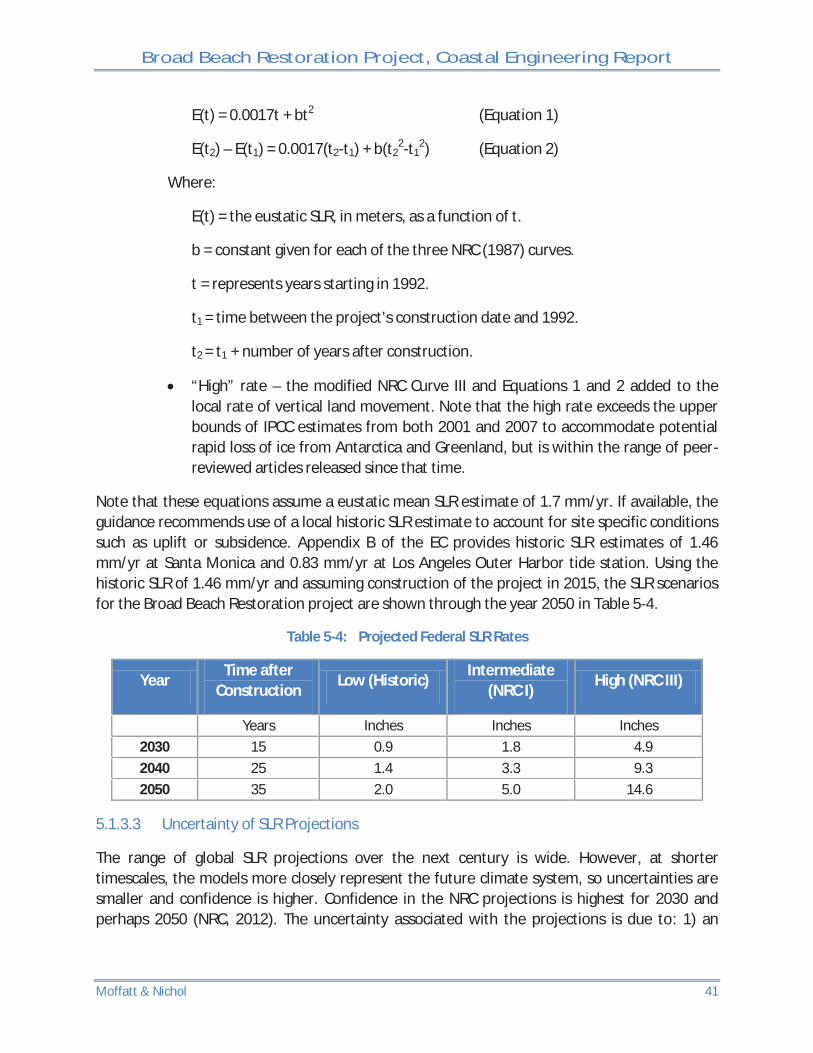
Broad Beach Restoration Project, Coastal Engineering Report
Moffatt & Nichol 41
E(t) = 0.0017t + bt2 (Equation 1)
E(t2) – E(t1) = 0.0017(t2-t1) + b(t22-t1
2) (Equation 2)
Where:
E(t) = the eustatic SLR, in meters, as a function of t.
b = constant given for each of the three NRC (1987) curves.
t = represents years starting in 1992.
t1 = time between the project’s construction date and 1992.
t2 = t1 + number of years after construction.
“High” rate – the modified NRC Curve III and Equations 1 and 2 added to the local rate of vertical land movement. Note that the high rate exceeds the upper bounds of IPCC estimates from both 2001 and 2007 to accommodate potential rapid loss of ice from Antarctica and Greenland, but is within the range of peer-reviewed articles released since that time.
Note that these equations assume a eustatic mean SLR estimate of 1.7 mm/yr. If available, the guidance recommends use of a local historic SLR estimate to account for site specific conditions such as uplift or subsidence. Appendix B of the EC provides historic SLR estimates of 1.46 mm/yr at Santa Monica and 0.83 mm/yr at Los Angeles Outer Harbor tide station. Using the historic SLR of 1.46 mm/yr and assuming construction of the project in 2015, the SLR scenarios for the Broad Beach Restoration project are shown through the year 2050 in Table 5-4.
Table 5-4: Projected Federal SLR Rates
Year Time after Construction Low (Historic) Intermediate
(NRC I) High (NRC III)
Years Inches Inches Inches 2030 15 0.9 1.8 4.9 2040 25 1.4 3.3 9.3 2050 35 2.0 5.0 14.6
5.1.3.3 Uncertainty of SLR Projections
The range of global SLR projections over the next century is wide. However, at shorter timescales, the models more closely represent the future climate system, so uncertainties are smaller and confidence is higher. Confidence in the NRC projections is highest for 2030 and perhaps 2050 (NRC, 2012). The uncertainty associated with the projections is due to: 1) an

Broad Beach Restoration Project, Coastal Engineering Report
Moffatt & Nichol 42
incomplete understanding of the global climate system; and 2) the inability of global climate models to accurately represent all components of the climate system. There is also a need to make assumptions about future conditions (e.g. population growth, technological developments, large volcanic eruptions, etc.) that drive the climate system by influencing the concentration of greenhouse gases and sulfate aerosol. To account for this uncertainty, the SLR projections are often accompanied by a potential range of values as shown in Figure 5-2.
Figure 5-2. Range of Global SLR Projections (NRC, 2012)
5.1.3.4 Recommended SLR Rates
The life span of the proposed Broad Beach Restoration Project is 20 years and assumes an initial project completion in 2015. SLR estimates for a 25-year time horizon (2040) will be accounted for in design and analysis of the proposed project and alternatives. A comparison of the guidance documents indicates the SLR estimates listed in the state guidance document are higher than projections following Federal guidance (USACE, 2011). The design and analysis of the proposed project will utilize the projected SLR values in the year 2040 following state guidance. Quantitative analyses will be based on the projected values interpolated for the year 2040 while qualitative analyses will include discussion of the project’s adaptability to the upper-end estimates of potential SLR.

Broad Beach Restoration Project, Coastal Engineering Report
Moffatt & Nichol 43
5.2 WAVES
Wave climate is the primary force for generating alongshore sediment transport and is therefore a critical element of any study aiming to evaluate and quantify sediment transport rates and associated change in beach sand volume and shoreline position. This section provides a summary of the wave climate along Broad Beach and discusses the wave data sources used to evaluate the regional and local historic beach performance and predict future project performance.
5.2.1 Wave Exposure
The southern exposure of Malibu and the proximity of the Channel Islands offshore limit the direction from which potentially destructive storm waves can reach the area. The islands block, dissipate, refract, and reflect wave energy – thereby modifying the wave conditions along the mainland shoreline. Upcoast shoreline features also serve to create wave exposure windows and refract waves before they reach the Malibu area. Wave exposure windows for the Malibu shoreline are illustrated Figure 5-3.
Figure 5-3. Wave Exposure Windows at Broad Beach

Broad Beach Restoration Project, Coastal Engineering Report
Moffatt & Nichol 44
In general, there are three main types of waves that occur along the Southern California coast and that could occur through the Broad Beach wave exposure windows: North Pacific swell, southern swell, and locally generated seas.
The North Pacific swell events are the most significant source of extreme waves in the region. The Broad Beach area is exposed to North Pacific swell through the Santa Barbara Channel. Swell from the winter storms in the southern hemisphere reach California during the months of May through October. These swells approach Broad Beach from the southwest, south, and southeast, but are partially blocked by the Channel Islands. Additionally, the great decay distances result in waves of low heights and long periods. Swell generated from tropical storms that develop off the coast of Mexico can also generate high waves, though extreme events in Southern California are rare.
Locally-generated seas are predominantly from the west and southwest, except for pre-frontal wind-generated seas from the southeast, which occur in winter. Locally-generated seas in this area are usually less than 6 feet in height with wave periods less than 10 seconds.
Wave direction affects how the sand moves along the shoreline. Waves that travel through the Santa Barbara Channel to Malibu from the west (North Pacific swell waves) are especially effective at moving sand alongshore from west to east. South swell arriving nearly straight onto the shore of Malibu is more effective at moving sand in a cross-shore direction, either offshore to deeper water or onshore from deeper water.
Scripps Institution of Oceanography operates and maintains ocean monitoring stations through the Coastal Data Information Program (CDIP). The closest CDIP monitoring station to Broad Beach is CDIP Buoy 102, offshore of Point Dume in 365 meter water depth. Wave roses of significant wave height and wave periods at this buoy are shown in Figure 5-4 and Figure 5-5 respectively. These figures indicate the majority of wave energy arrives from directions between 180° and 270° with significant wave heights of 1 to 3 feet. Figure 5-5 indicates wave periods from the west include both short period and long period swell, whereas waves from the south include mostly long period swell.

Broad Beach Restoration Project, Coastal Engineering Report
Moffatt & Nichol 45
Figure 5-4. Significant Wave Height (Wave Rose) Offshore of Point Dume (CDIP, 2010)

Broad Beach Restoration Project, Coastal Engineering Report
Moffatt & Nichol 46
Figure 5-5. Peak Wave Period (Period Rose) Offshore of Point Dume (CDIP, 2010)
CDIP Buoy 102 provides an accurate wave data source for the project location and illustrates the wave exposure windows of the project coastline. However, with only three years of available data (2001 – 2004) the gauge does not provide a long enough record for the purpose of estimating historic trends in sediment budget and shoreline change.
5.2.2 Wave Data Sources
Wave data was gathered from several different sources and included both measured and hindcast data from several locations. Table 5-5 lists the location, type and use for the various data sets. A more detailed description of how each data set was used in the analyses is provided below.

Broad Beach Restoration Project, Coastal Engineering Report
Moffatt & Nichol 47
Table 5-5. Wave Data Sources
Location Type Period of Record
Wave Data Use
Ht. Per. Dir. Pt Dume (CDIP Buoy
102) Gauged 2001-2004 Representative local
wave climate Santa Monica Bay
(46025) Gauged 1982 - Present Historic shoreline assessment
West Santa Barbara Channel (46054) Gauged 1994 – Present Historic shoreline
assessment West of Channel
Islands (Adams, et. al.)
Hindcast 1948 – 1998 Historic shoreline
assessment
Pt Dume (CCSTWS, NS#260) Hindcast 1970 – 2005 Numerical modeling
Zuma Beach (CCSTWS, NS#265) Hindcast 1970 – 2005 Numerical modeling
Santa Monica Bay (GROW, 14549) Hindcast 1980 – 2009 Numerical modeling
WaveWatch III Hindcast Jan 2010 Numerical modeling
A combination of gauged wave data and hindcast wave data were used for the technical studies prepared by Everts Coastal and discussed in Section 6. Two deep water gauges, west of Santa Barbara (Station 46054) and in Santa Monica Bay (Station 46025), provide measured significant wave height and peak period data (no directions) for the past 16 and 27 years respectively. Because of the lack of directional information, this data was used primarily to investigate possible wave height correlation to the climate indices (PDO, MEI, SOI).
Hindcast wave conditions were modeled by Adams et. al. (2008) at a location west of San Clemente Island. The location was considered a “pure” deepwater site since it was positioned far enough offshore to remove it from effects of island blocking or shoaling. This data set was used primarily for analysis of long-term trends in wave direction. The locations of each buoy are shown in Figure 5-6.

Broad Beach Restoration Project, Coastal Engineering Report
Moffatt & Nichol 48
Figure 5-6. Buoy Locations
For numerical modeling of the proposed project, additional wave information was needed beyond what was used for the historic shoreline assessment study. For purposes of numerical modeling, the dominant wave height, period, and direction were needed as close to Broad Beach as possible. This information was available from the Global Reanalysis of Ocean Waves Fine Northeast Pacific (GROW-FINE NEPAC) hindcast model that characterized the long-term wave climate in deep water off the Los Angeles coastline. Two nearshore transformations of this wave data were used in an effort to improve modeling results. There will be more discussion on this topic later in the report. One transformation was performed for the CCSTWS (USACE, 2009 Draft) and generated nearshore wave data at Point Dume and Zuma Beach. The other transformation was done using RCPWAVE and generated nearshore wave data for input directly into the GENESIS shoreline model.
5.2.3 Extreme Waves
Extreme wave events have historically caused coastal flooding and erosion-related damage to infrastructure along the Southern California coast. These extreme wave events are typically associated with large winter storm systems in the Gulf of Alaska that direct significantly sized swells toward Southern California from a west to northwest direction. Individual storms can last several days and consecutive storms can generate large waves for a week or more. In addition

Broad Beach Restoration Project, Coastal Engineering Report
Moffatt & Nichol 49
to the large wave heights, the direction of approach and duration of these events influence the extent of damage along the coast. Using transformed (nearshore) wave conditions over a 36-year time period the CCSTWS (USACE, 2009 Draft) performed an analysis to determine recurrence intervals for wave heights associated with extreme events. The extreme wave height recurrence intervals for the Zuma Beach nearshore station are listed in Table 5-6.
Table 5-6: Extreme Wave Height versus Recurrence Interval – Zuma Beach (USACE, 2009 Draft)
Recurrence Interval, years
Wave Height, feet (meters)
5 10.8 (3.3) 10 12.5 (3.8) 25 14.4 (4.4) 50 15.7 (4.8)
100 17.4 (5.3)
Historically, the most damaging extreme wave events to affect the Southern California coast and Broad Beach have occurred during El Niño-Southern Oscillation (ENSO) events. ENSO events represent global scale climatic variations which tend to occur every 2 to 7 years. During strong ENSO events, sea level along the California coast is elevated by 0.5-0.7 feet for a year or two at a time (TerraCosta, 2008). During these events, storms approach from a more westerly direction and typically generate larger waves with longer periods that increase the amount of energy reaching the Southern California coast (USACE, 2009 Draft). Some of the most damaging extreme wave events at Broad Beach occurred during the recent El Niño events of 1997-1998 and 2009-2010.
The 1997-1998 El Niño storms caused considerable shoreline erosion and related storm wave damage along the California coastline. Many Broad Beach homes were threatened, causing many homeowners to construct temporary sand bag revetments to protect residential structures and leach fields. One residence suffered major structural damage and was destroyed. During one particularly severe storm in early February 1998, with sand bags already in place, the active beach scarp retreated more than 30 feet in the course of two days (TerraCosta, 2008). The peak wave heights during this event were estimated to be 15.5 feet at the Zuma Beach nearshore startion, equivalent to a recurrence interval of about 50-years.
The most recent extreme wave event occurred during the El Niño season of 2009-2010. In December 2009, there was a significant narrowing of the beach due to storm wave attack resulting in widespread failure of the existing temporary emergency sandbag revetments, especially at the west end of the beach. Two west end homes incurred significant damage. It became evident that these temporary structures would not provide sufficient shore protection for the upcoming winter. To stabilize the eroding shoreline, a temporary rock revetment was constructed along Broad Beach.

Broad Beach Restoration Project, Coastal Engineering Report
Moffatt & Nichol 50
Elevated water levels, increased storm intensity, and westerly approach direction all combine to enhance the sediment transport rates along the coast during these extreme wave events. As evidenced by the recent ENSO events, the effect on Broad Beach is an increase in shoreline erosion and the potential for damage to property from wave uprush and overtopping of shoreline protection structures. Although the frequency and intensity of these events cannot be predicted, there is certainly the potential for multiple extreme events to occur during the design life of the proposed project.
The planning and design of the proposed project has, therefore, taken into account the potential impacts related to these extreme wave events. A synthetic storm event with 100-year extreme wave heights was developed to evaluate the storm erosion potential and wave uprush limits along Broad Beach for the baseline conditions, proposed project and alternatives. Please refer to Section 7.4 for a discussion of how the 100-year time series was developed and applied using the XBeach morphological model.
5.2.4 Design Wave for Shoreline Structures
The large wave heights produced by extreme wave events typically break further offshore and dissipate much of their energy before reaching shoreline protection structures. The critical design case for shallow water shoreline structures is when wave breaking takes place in front of the structure (USACE, 2003). The maximum height of waves that can break upon a shoreline structure is limited by the water depth fronting the structure. The water depth varies over time based on tide levels and will increase with future SLR. This analysis was based on the maximum depth-limited breaking wave height defined as the “design wave height.” Deep water waves exceeding the design wave height will break offshore and dissipate much of their energy before they reach the shoreline structure.
A statistical evaluation of extreme high water elevations was developed based on the recorded annual extreme high water elevations obtained from the NOAA/NOS Los Angeles Outer Harbor reference tide station (Table 5-1). The effect of future relative SLR was also included in the determination of the design water depth. The design life of the proposed project will be 20 years. Assuming the proposed project is completed in 2015 and has a 20 year design life, SLR projections in the year 2040 were added to the design water depth.
The extreme scour elevation is also a factor in determining the design water depth at the toe of a shore protection device. Due to the variability of the sand elevations from seasonal changes and storm events, it is difficult to predict with great accuracy the depth of scour. The maximum scour depth is limited by the presence of bedrock along Broad Beach. TerraCosta (2008) describes the bedrock surface elevation along the shoreline at approximately -4 feet MSL, which corresponds to approximately -1 foot MLLW. The Broad Beach revetment will be fronted by a restored sandy beach maintained by backpassing and re-nourishment activities. The restored beach will provide a buffer against wave attack and reduce the likelihood of revetment

Broad Beach Restoration Project, Coastal Engineering Report
Moffatt & Nichol 51
exposure. By reducing the frequency and duration of direct revetment exposure, the potential for scour is also reduced. A scour depth of 0 feet MLLW was assumed for the design water depth.
Based on the probabilistic extreme high water elevations, SLR, and assumed scour elevation, a range of potential design water depths was calculated. The low end of the range was calculated based on a projection of the historic rate of SLR over the life of the project. The upper end of potential design water depth includes projected SLR in the year 2040 based on the NRC report (2012).
Factors other than water depth which affect the maximum wave height are the incident wave period and nearshore beach slope. Longer period waves will result in higher design breaking waves (USACE, 1984). A design wave period, T, of 16 seconds represents the average of the most frequently occurring storm-generated swell in this region. A longer wave period of 20 seconds was also evaluated to represent a more conservative estimate of breaking wave heights. Based on available beach profiles in the Broad Beach area, nearshore slopes ranged from approximately 25:1 to 30:1 (horizontal:vertical).
Estimates of breaking wave heights were developed using methods described in the Shore Protection Manual (USACE, 1984) and Coastal Engineering Manual (USACE, 2003), for the range of potential design water depths. The results (range of potential breaking wave heights) are shown in Table 5-7.
Table 5-7. Broad Beach Breaking Wave Heights Range
Surge Event Scour
Elevation (ft, MLLW)
2040 SLR Scenario
Design Water Depth, ds
(feet)
Wave Period
(Seconds)
Breaking Wave
Height, Hd (feet)
Recurrence Interval (Years)
Extreme Still Water Elevation
(ft, MLLW)
100 8.0 0 Low/Historic
8.1 16 8.9 8.1 20 9.0
NRC 2012 Projection
8.8 16 9.6 8.8 20 9.6

Broad Beach Restoration Project, Coastal Engineering Report
Moffatt & Nichol 52
6. SEDIMENT TRANSPORT ANALYSIS
This section summarizes two technical studies completed for this project by Everts Coastal. Goals of these studies were to estimate the recent annual rate of sand loss at Broad Beach, determine the cause of the change, predict how it is likely to behave in the future, and predict the loss rate if beach fill is artificially added to Broad Beach.
Section 6.1 describes the study methodology including discussion of the data sources which include:
Historic shoreline position data; Sediment bypassing records (Santa Barbara, Ventura and Channel Islands Harbor
dredging records); Wave data (i.e. buoys) and hindcast wave data; and Beach profile data.
Section 6.2 summarizes the findings of the first study titled “Sand Loss Estimates if Artificial Beach Fill is Placed at Broad Beach, Malibu, California” (Everts Coastal 2009). This initial study focused specifically at the ZLC, which includes Broad Beach and adjacent beaches (i.e. Zuma and Westward Beaches). This study is referred to as the Broad Beach Study for simplicity within this report.
Section 6.3 summarizes the second study titled “Historic Beach Performance, Causes of Beach Change, and Estimates of Future Beach Fill Nourishment Requirements at Broad Beach, Malibu, California” (Everts Coastal 2011). This latter study built on the results of the Broad Beach Study and evaluated the performance of beaches within the MMLC, which spans from Port Hueneme to Marina del Rey and includes several littoral sub-cells (including the ZLC). The purpose of investigating this larger reach of shoreline was to determine whether shoreline erosion at Broad Beach was a local or regional problem. This study is referred to as the Historical Performance Study for simplicity within this report. Both Everts Coastal studies along with supporting graphics and worksheets are included within Appendix 2 of this report.
6.1 STUDY METHODOLOGY
Information regarding sediment transport rates within each littoral cell was evaluated based on shoreline position analysis, profile change analysis, and evaluation of previously published sediment transport rates in the region. A littoral cell is a segment of coast along which sediment moves relatively unrestrained from one longshore sediment transport barrier to another. The location and extents of the MMLC and the ZLC are shown in Figure 6-1.

Broad Beach Restoration Project, Coastal Engineering Report
Moffatt & Nichol 53
Figure 6-1. Beach Bins within the MMLC
The littoral cells were further divided into beach “bins,” which were approximately equidistant linear reaches of coastline within the littoral cell. This allowed for the evaluation of trends in one bin versus another to determine the potential locations of changes in transport patterns and to help explain longer-term trends.
6.1.1 Historic Shoreline Position Data
The two studies are based on shoreline positions extracted from historic aerial images of beaches gathered from various sources. Since many of these aerial photographs were in hardcopy format, the aerials were first geo-rectified (brought into a known geographic coordinate system with appropriate scale) with the use of a Geographic Information System (GIS) using common physical reference points (e.g. property corners, street intersections, unique geologic feature, etc.). A minimum of three landmark points were used to spatially rectify the image. The years and dates of the aerial imagery differed per beach bin and data source.
Once a historic aerial image was geo-rectified, a polyline was drawn along the wetted line of the beach to depict the shoreline position. The date of the aerial image was applied to the polyline to represent the shoreline position at that time. An arbitrary baseline was set landward of all shoreline positions. GIS was then used to calculate the historical beach areas relative to

Broad Beach Restoration Project, Coastal Engineering Report
Moffatt & Nichol 54
the baseline for each of the available dates. Beach change was generated by comparing these shoreline positions to one another.
6.1.2 Volumetric Shoreline Change Rates
Given the historic shoreline position data, the next critical step in estimating sediment transport rates is the application of a relationship between shoreline position and sand volume. For example, if a beach retreats a certain distance landward, it is correlated with an estimate of the amount of reduction in sand volume. This information can then be applied to estimate necessary volumes and rates of beach nourishment for a shoreline restoration project.
The standard practice to relate shoreline position change and volume change is based on a relationship between long-term (net) change in beach plan area, Ab, (or in shoreline position where Ab = Scxc, where Sc = mean shoreline position, and xc = alongshore length of cell) and the volume of the littoral sediment lens, Vl, when the profile is displaced without a change in form, which is expressed as:
Vl = Ab (hb + zs)
where:
hb = height of berm above a designated sea level datum; and
zs = depth of closure boundary below that sea level datum.
For Broad Beach, the typical height of the berm, hb, is about 12 feet above mean sea level (MSL) or 14.8 feet above mean lower low water (MLLW). The depth of closure boundary, zs, which can be described as the average depth limit of the active beach profile, is about 27 feet below MSL (24.2 feet below MLLW), based on review of historic beach profile data and inspection of recent beach profiles measured by Coastal Frontiers Corporation (CFC) (2011) as part of this investigation. These berm height and closure depth values result in an average ratio of sediment volume change to shoreline position change is 1.44 cy per alongshore foot of coast per foot of net shoreline movement, either landward or seaward.
6.1.3 Sediment Bypass Data
The amount of sand reaching the MMLC is highly dependent on the amount of sand bypassed around the upcoast harbors. Port Hueneme, Channel Islands Harbor, and Ventura Harbor all impede the natural flow of sediments due to the jetties, groins and breakwaters designed to limit shoaling of their entrance channels. Sand bypassing programs are in place to maintain a supply of sediment to downcoast beaches. Sand bypassing is the act of removing (via dredge) this deposited sand from sand traps (i.e., constructed sediment deposition areas) or navigation channels within the harbor and placing the material downcoast of the structure. The amount of sand artificially bypassed from one side to the other of a small craft harbor is likely to be nearly

Broad Beach Restoration Project, Coastal Engineering Report
Moffatt & Nichol 55
equal to the net longshore sediment transport (LST) reaching the barrier, when averaged over a substantially long period of time. If this were not the case, the trap from which sand was bypassed would either have filled or continually expanded.
Sand bypass data was acquired from the USACE, LA District (Channel Islands Harbor Dredging History 1990-2011) and the Coastal San Management Plan (BEACON, 1989) for the Ventura, Santa Barbara and Channel Islands Harbors for this study. The sand bypassing programs for these harbors began in the 1970s.
6.1.4 Wave Data
Gauged wave data was acquired through NOAA for two deep water sites west of Santa Barbara and in Santa Monica Bay. Wave period and height data were analyzed from these buoys to determine correlation with climate indices. Since the gauged wave data started in the mid-1980s, a wave hindcast study that spanned back to 1948 was reviewed to get a sense of the wave behavior over the entire shoreline position analysis period. The hindcast study was conducted by Adams et al. (2008) and is discussed in more detail below. Wave data sources are summarized in Table 5-5.
6.2 SEDIMENT TRANSPORT WITHIN ZLC (EVERTS COASTAL, 2009)
6.2.1 Shoreline Changes
This study focused on the ZLC, which includes Broad Beach. The ZLC was divided into 11 separate beach bins for analysis, as shown in Figure 6-2. The Broad Beach project area is covered by Bins 2 through 5 of the ZLC. Table 6-1 provides a description of all ZLC beach bins including the location, bin length and distance from Point Lechuza. Table 6-2 lists the historical aerial images used to create the shoreline position database for this study. A total of 20 historical shorelines were analyzed between the 1946 and 2009.

Broad Beach Restoration Project, Coastal Engineering Report
Moffatt & Nichol 56
Figure 6-2. ZLC and Beach Bin Definition
Table 6-1. Description of ZLC Beach Bins
BIN BEACH DESCRIPTION BIN LENGTH, FEET DISTANCE FROM PT LECHUZA, FEET (MILES)
1 Pt Lechuza_west 3,295 -3,295 (-0.6) 2 West Broad Beach_1 1,420 1,420 (0.3) 3 West Broad Beach_2 1,500 2,920 (0.6) 4 East Broad Beach_1 1,450 4,370 (0.8) 5 East Broad Beach_2 1,945 6,315 (1.2) 6 West Zuma Beach 2,000 8,315 (1.6) 7 Central Zuma Beach 3,000 11,315 (2.1) 8 East Zuma Beach 2,970 14,285 (2.7) 9 Westward Beach 2,005 16,290 (3.1)
10 Point Dume Beach 3,945 20,235 (3.8) 11 Point Dume 390 20,625 (3.9)

Broad Beach Restoration Project, Coastal Engineering Report
Moffatt & Nichol 57
Table 6-2. Aerial Imagery Used to Create Shoreline Positions for the ZLC
TIMEFRAME YEAR AERIAL IMAGE DATE
DATA SOURCE
Pre-1974
1946 1/22/1946 EM USACE 1955 9/30/1955 LA USACE 1959 9/1/1959 LA USACE 1964 3/28/1964 LA USACE 1968 4/3/1968 LA USACE 1974 6/19/1974 LA USACE
Post-1974
1984 8/30/1984 EM USACE 1986 5/10/1986 EM USACE 1988 1/25/1988 California Coastal Records Project*** 1990 9/6/1990 LA USACE 1994 5/31/1994 Google Earth 2001 4/24/2001 Google Earth 2002 6/11/2002 LA County 2004 12/24/2004 Google Earth 2006 1/7/2006 Google Earth 2006 1/26/2006 Google Earth 2006 3/15/2006 LAR-IAC 2007 2/15/2007 Google Earth 2007 10/22/2007 Google Earth 2009 10/2/2009 I-Cubed
*** Copyright © 2002-2009 Kenneth & Gabrielle Adelman, California Coastal Records Project
Shoreline positions on Broad Beach from the various historical time periods were organized into individual figures as outlined below:
1940s/1950s - Figure 6-3 1960s/1970s – Figure 6-4 1980s/1990s – Figure 6-5 2000s – Figure 6-6

Broad Beach Restoration Project, Coastal Engineering Report
Moffatt & Nichol 58
Aerial photograph taken on March 11, 2008 (LAR-IAC2)
Figure 6-3. Historical Shoreline Positions – 1940s/1950s

Broad Beach Restoration Project, Coastal Engineering Report
Moffatt & Nichol 59
Aerial photograph taken on March 11, 2008 (LAR-IAC2)
Figure 6-4. Historical Shoreline Positions – 1960s/1970s

Broad Beach Restoration Project, Coastal Engineering Report
Moffatt & Nichol 60
Aerial photograph taken on March 11, 2008 (LAR-IAC2)
Figure 6-5. Historical Shoreline Positions – 1980s/1990s

Broad Beach Restoration Project, Coastal Engineering Report
Moffatt & Nichol 61
Aerial photograph taken on March 11, 2008 (LAR-IAC2)
Figure 6-6. Historical Shoreline Positions – 2000s

Broad Beach Restoration Project, Coastal Engineering Report
Moffatt & Nichol 62
6.2.2 Analysis of Historical Shoreline Positions within the ZLC
The time series of shoreline positions was analyzed to determine average change rates, maximum change rates, seasonal change rates, and historical minimum and maximum beach widths. The time variation of the shoreline change was also used to estimate sediment transport rates.
Figure 6-7 presents the average shoreline change at Broad Beach from 1946 until the present. There are several significant items to be noted from this graph.
There has been significant variation in the average beach width since 1946.
The position of the beach in 2009 is within 20 feet of its position in 1946, but the majority of the beach has been artificially prevented from retreating.
The beach was at its widest point in the early 1970s, and was 80+ feet farther seaward than in October 2009.
Since the peak of the beach width, Broad Beach has experienced variable, but declining beach width.
Oscillations in the beach width do not appear to correspond to a uniform pattern.
Figure 6-7. Average Broad Beach Shoreline Change
-60
-40
-20
0
20
40
60
80
1945 1950 1955 1960 1965 1970 1975 1980 1985 1990 1995 2000 2005 2010
Dis
tanc
e fr
om 1
946
Shor
elin
e (F
eet)
Year
Shoreline Change Relative to 1946
Average

Broad Beach Restoration Project, Coastal Engineering Report
Moffatt & Nichol 63
To depict what has been happening since the 1970s, the data was re-plotted and trend lines were determined, as shown in Figure 6-8.
Figure 6-8. Broad Beach Shoreline Position and Trends, 1970s-2000s
The linear regression trend line has a high correlation factor (R2) and indicates that the beach has had, on average, a width loss rate of about two feet per year since the 1970s. A review of the data during this timeframe indicates that the beach can experience width changes of as much as 27 feet in any given year, with an average change (loss or accretion) of approximately 7 feet from any given year to the next. The moving average trend line indicates that the shoreline recession happens at variable rates, but appears to be accelerating in the 2000s.
Figure 6-9 presents the Broad Beach shoreline positions broken down by the bins depicted in Figure 6-2. Bin 2 (blue line) represents the most westward portion of Broad Beach near Point Lechuza, and Bin 5 (orange line) represents the most eastward portion of Broad Beach near Trancas Creek. A comparison of these curves indicates that Bin 2 (West Broad Beach) has eroded more quickly than Bins 3-5 and that the eroded sand is being transported to the downdrift (eastern) beaches.
-30
-20
-10
0
10
20
30
40
50
60
70
1965 1970 1975 1980 1985 1990 1995 2000 2005 2010
Dis
tanc
e fr
om 1
946
Shor
elin
e (F
eet)
Year
Shoreline Change Relative to 1946
Average Linear (Average) 4 per. Mov. Avg. (Average)
Change, Ft = (-2 x Year) + 4,000

Broad Beach Restoration Project, Coastal Engineering Report
Moffatt & Nichol 64
Figure 6-9. Broad Beach Shoreline Positions by Subcell
Figure 6-10 presents a comparison of the average shoreline positions for the Broad Beach and Zuma Beach cells. Zuma Beach is represented by Bins 6, 7, and 8. The plot shows the sympathetic variation in the Zuma Beach width based on losses from Broad Beach. After each large scale loss at Broad Beach, there is a corresponding gain at Zuma Beach.
-80
-60
-40
-20
0
20
40
60
80
100
1945 1950 1955 1960 1965 1970 1975 1980 1985 1990 1995 2000 2005 2010
Dis
tanc
e fr
om 1
946
Shor
elin
e (F
eet)
Year
Shoreline Change Relative to 1946 Bin 2_West Broad Beach1 Bin 3_West Broad Beach2Bin 4_East Broad Beach1 Bin 5_East Broad Beach2

Broad Beach Restoration Project, Coastal Engineering Report
Moffatt & Nichol 65
Figure 6-10. Broad Beach and Zuma Beach Average Shoreline Positions
6.2.3 Broad Beach Sediment Transport Rates
The average Broad Beach volume changes are presented in Figure 6-11 through Figure 6-15, and include associated trend lines. Figure 6-11 shows the full 63-year shoreline position data record. Figure 6-12 through Figure 6-15 illustrate specific historic time periods. By reviewing the changes in volumes, as well as rates of change in volume, trends in the sediment transport regime can be assessed. The earliest switch from rise to fall in volume appears to have occurred in the late 1960s and 1970s. The peak was followed by a progressive loss until the present. The trend lines indicate the following:
1968-2009, 41 years of data - 20,000 cyy loss.
1986-2009, 23-years of data - 28,000 cyy loss.
2001-2009, 8 years of data - 26,000 cyy loss.
2006-2009, 3 years of data - 35,000 cyy loss.
-60
-40
-20
0
20
40
60
80
100
1945 1950 1955 1960 1965 1970 1975 1980 1985 1990 1995 2000 2005 2010
Dis
tanc
e fr
om 1
946
Shor
elin
e (F
eet)
Year
Shoreline Change Relative to 1946
Broad Beach Average Zuma Beach Average

Broad Beach Restoration Project, Coastal Engineering Report
Moffatt & Nichol 66
These trends indicate a continuing pattern of erosion since the 1970s. The six data point moving averages shown in Figure 6-12 and Figure 6-13 help even out fluctuations in the data and suggest the trend of sand volume loss along Broad Beach has recently accelerated.
Figure 6-11. Volumetric Changes, 1946-2009
400,000
600,000
800,000
1,000,000
1,200,000
1,400,000
1,600,000
1940 1950 1960 1970 1980 1990 2000 2010
Sand
Vol
ume
(Cub
ic Y
ards
)
Year
6-Data-Point Moving Average
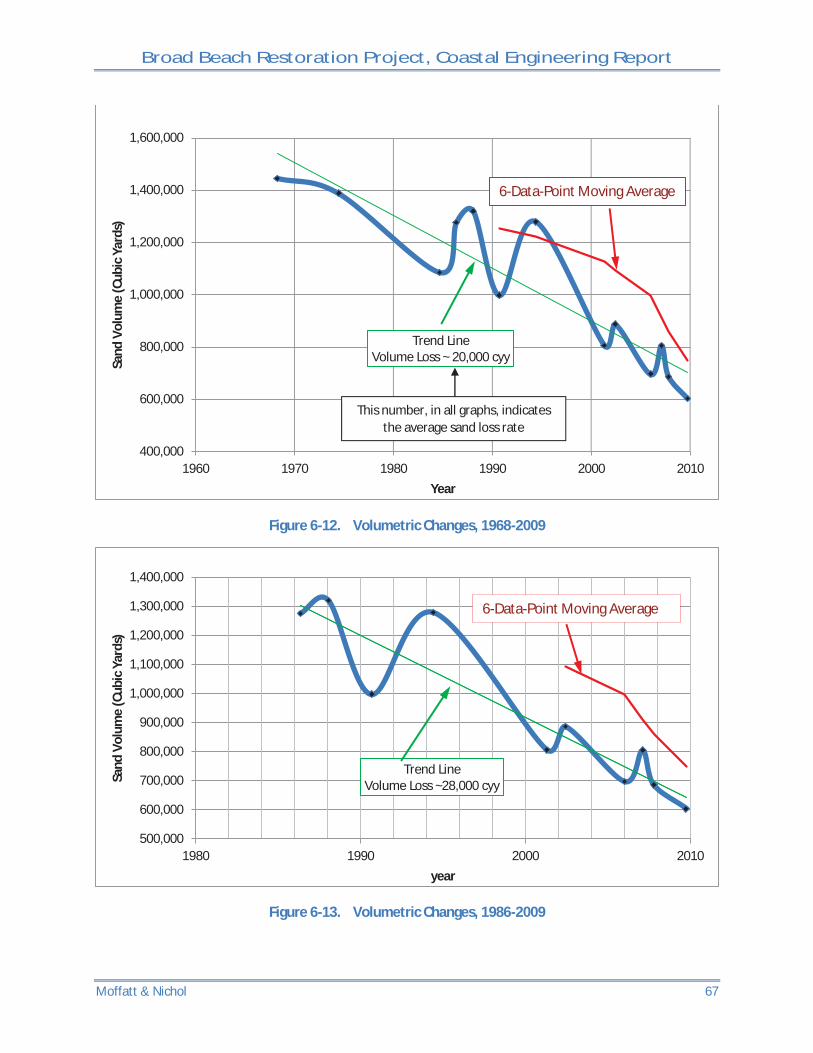
Broad Beach Restoration Project, Coastal Engineering Report
Moffatt & Nichol 67
Figure 6-12. Volumetric Changes, 1968-2009
Figure 6-13. Volumetric Changes, 1986-2009
Trend Line Volume Loss ~ 20,000 cyy
400,000
600,000
800,000
1,000,000
1,200,000
1,400,000
1,600,000
1960 1970 1980 1990 2000 2010
Sand
Vol
ume
(Cub
ic Y
ards
)
Year
6-Data-Point Moving Average
Trend Line Volume Loss ~28,000 cyy
500,000
600,000
700,000
800,000
900,000
1,000,000
1,100,000
1,200,000
1,300,000
1,400,000
1980 1990 2000 2010
Sand
Vol
ume
(Cub
ic Y
ards
)
year
6-Data-Point Moving Average
This number, in all graphs, indicates the average sand loss rate

Broad Beach Restoration Project, Coastal Engineering Report
Moffatt & Nichol 68
Figure 6-14. Volumetric Changes, 2001-2009
Figure 6-15. Volumetric Changes, 2006-2009
500,000
600,000
700,000
800,000
900,000
1,000,000
2001 2002 2003 2004 2005 2006 2007 2008 2009 2010
Sand
Vol
ume
(Cub
ic Y
ards
)
Year
Trend Line Volume Loss ~26,000 cyy
500,000
600,000
700,000
800,000
900,000
2006 2006 2007 2007 2008 2008 2009 2009 2010 2010
Sand
Vol
ume
(Cub
ic Y
ards
)
Year
Trend Line Volume Loss ~ 35,000 cyy

Broad Beach Restoration Project, Coastal Engineering Report
Moffatt & Nichol 69
6.2.4 Broad Beach and Zuma Beach Sediment Transport Interaction
A comparison of the historical behavior of Broad Beach with that of the rest of the ZLC provides useful information on the evolution of Broad Beach within the larger context of the hook-shaped bay of which it is the western part. This comparison may help to identify potential causes of the Broad Beach retreat since changes in one location in a hook-shaped bay tend to be evident by changes elsewhere in the bay.
Broad Beach, Zuma Beach, and Westward Beach performed very differently during the study period, as shown in Figure 6-16. The volume of sand at Broad Beach increased until about 1974 then began a decline that continues to the present. In contrast, Zuma Beach and Westward Beach experienced a net accretion over that 60-plus year interval. The big mid-1970s turnaround at Broad Beach is not evident in the two beaches further downcoast, suggesting the hooked bay is rotating as its shoreline retreats in the west and advances in the east. The trend lines for this analysis indicate:
Between 1974 and late 2007, Broad Beach losses averaged over 21,000 cyy of sand;
During this same time period, Zuma and Westward Beaches exhibited an average annual accretion of about 8,500 cyy;
Combined, the net loss in the ZLC between 1974 and 2007 was about 12,500 cyy.
Figure 6-16. Comparative Sand Volumes between Broad Beach, Zuma Beach, and Westward Beach
y = -21143x + 4E+07 R² = 0.74
y = 8499.9x - 2E+07 R² = 0.0487
y = -12643x + 3E+07 R² = 0.0637
-2000000
-1500000
-1000000
-500000
0
500000
1000000
1500000
1970 1975 1980 1985 1990 1995 2000 2005 2010
Sand
Vol
ume
(Cub
ic Y
ards
)
Year
Sand Volume Comparison Broad Beach Zuma and Westward Beaches Zuma Littoral Subcell

Broad Beach Restoration Project, Coastal Engineering Report
Moffatt & Nichol 70
Figure 6-17 summarizes the alongshore distribution of the sand volume change for each of the beaches over three different historic time periods. The data midpoint of the Broad Beach Bins is about 3,000 feet from Lechuza Point. The Zuma Beach Bins were averaged to provide a data point at 7,000 feet and 13,000 feet east of Point Lechuza. The Westward/Point Dume Bins were averaged to provide a representative data point at about 18,000 feet from Point Lechuza. This figure illustrates an increasing loss of sand at the Lechuza Point end of the ZLS with time toward the present. It also shows a declining sand loss rate, or declining rate of sand gain, from west to east in the western two-thirds of the ZLC. Sand gain in the eastern third of the ZLC increased with time. The cross-over point, where sand loss turns to gain, progressively moved eastward with time (about 5,000 feet from Lechuza Point between 1946-2007; 8,000 feet from Lechuza Point in the 1968-2007 interval; and about 12,000 feet from Lechuza Point in the 1986-2007 interval). This is clear evidence the beach retreat problem has spread to Zuma Beach and is progressing eastward toward Westward Beach.
Figure 6-17. Alongshore Distribution of Volumetric Change for Different Time Intervals
6.2.5 Potential Causes of Sand Loss at Broad Beach
The recent performance of Broad Beach has been one of accelerating retreat due to a negative sediment budget (i.e., more sand is leaving the system than entering). Potential causes of that imbalance between supply and loss may be due to:
1. Net seaward movement of sand across from the beach; and/or
-25,000
-20,000
-15,000
-10,000
-5,000
0
5,000
10,000
0 2,000 4,000 6,000 8,000 10,000 12,000 14,000 16,000 18,000 20,000Sand
Vol
ume
Chan
ge R
ate
(Cub
ic Y
ards
Per
Yea
r)
Distance East of Lechuza Point (Feet)
Volume Change Along ZLC 1946-2007 1968-2007 1986-2007
Broad Beach Pt L
echu
za
Tran
cas C
reek
Zum
a Cr
eek
Pt D
ume
Zuma Beach Westward
Beach

Broad Beach Restoration Project, Coastal Engineering Report
Moffatt & Nichol 71
2. A west to east alongshore sand transport gradient; and
3. The effects of SLR.
Sediment pathways are limited in the Broad Beach control volume because sand does not pass the dune line due to wind or wave overwash, it does not pass westward around Point Lechuza, and sand has not been artificially added to or removed from Broad Beach in any significant quantities.
The Broad Beach Study presents the following conclusions:
1. The Broad Beach shoreline is retreating because of a negative sand balance.
2. SLR accounts for less than five percent of the sand imbalance.
3. An analysis of wave measurements and historical beach and shoreface data argues against the notion of a decades-long transport of hundreds of thousands of cy offshore.
4. The sand imbalance is due to a west to east longshore sand transport gradient. More sand is being transported from Broad Beach to Zuma Beach than is being supplied from upcoast beaches. The analysis indicates the gradient is either due to a reduction in sand supply entering around Point Lechuza, or a change in the alongshore component of wave energy that increases the amount leaving near Trancas Creek.
A gradually increasing sand loss rate is consistent with a supply drop updrift of Broad Beach. If that is the case, sand would have first been denied from beaches closest to the reduction or cutoff site. With time, the effects would then have migrated downdrift in an erosional wave that should be identifiable in a larger scale analysis. Upon reaching Point Lechuza, this would result in a reduction of sand being passed around the point, a pattern that measurements show. The supply denial scenario is also compatible with what appear to be losses along some coastal reaches between Point Lechuza and Hueneme Beach, but not everywhere. Griggs (2008) states that an upcoast supply deficit “doesn’t seem to be an issue from all available evidence,” but caveats that “it appears that the sand losses or beach erosion started at the Lechuza Point or western end of Broad Beach and has progressed eastward.”
A changing wave climate is also a possible cause. An apparent increase in the net longshore sand transport rate between the timeframe of 2000 to 2009 is more likely due to increased energy out of the south to southwest quadrant than an increase in total energy. This suggests the net wave approach direction changed slightly over time. Griggs (2008) notes that “the beach narrowing, at least at the Lechuza end of Broad Beach, has been going on for over a decade so the progressive reduction in beach width would seem to require more than a single winter of wave activity, although the changes to the beach that began this past winter (2007-08) seem unprecedented in recent history.”
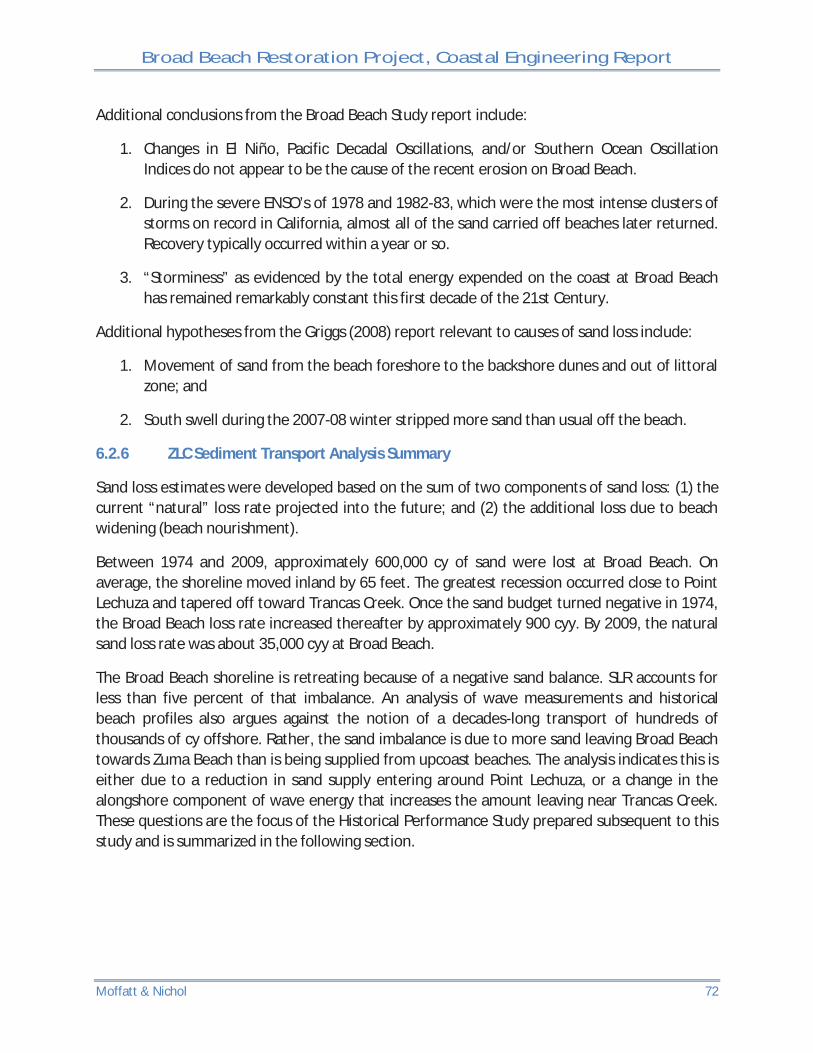
Broad Beach Restoration Project, Coastal Engineering Report
Moffatt & Nichol 72
Additional conclusions from the Broad Beach Study report include:
1. Changes in El Niño, Pacific Decadal Oscillations, and/or Southern Ocean Oscillation Indices do not appear to be the cause of the recent erosion on Broad Beach.
2. During the severe ENSO’s of 1978 and 1982-83, which were the most intense clusters of storms on record in California, almost all of the sand carried off beaches later returned. Recovery typically occurred within a year or so.
3. “Storminess” as evidenced by the total energy expended on the coast at Broad Beach has remained remarkably constant this first decade of the 21st Century.
Additional hypotheses from the Griggs (2008) report relevant to causes of sand loss include:
1. Movement of sand from the beach foreshore to the backshore dunes and out of littoral zone; and
2. South swell during the 2007-08 winter stripped more sand than usual off the beach.
6.2.6 ZLC Sediment Transport Analysis Summary
Sand loss estimates were developed based on the sum of two components of sand loss: (1) the current “natural” loss rate projected into the future; and (2) the additional loss due to beach widening (beach nourishment).
Between 1974 and 2009, approximately 600,000 cy of sand were lost at Broad Beach. On average, the shoreline moved inland by 65 feet. The greatest recession occurred close to Point Lechuza and tapered off toward Trancas Creek. Once the sand budget turned negative in 1974, the Broad Beach loss rate increased thereafter by approximately 900 cyy. By 2009, the natural sand loss rate was about 35,000 cyy at Broad Beach.
The Broad Beach shoreline is retreating because of a negative sand balance. SLR accounts for less than five percent of that imbalance. An analysis of wave measurements and historical beach profiles also argues against the notion of a decades-long transport of hundreds of thousands of cy offshore. Rather, the sand imbalance is due to more sand leaving Broad Beach towards Zuma Beach than is being supplied from upcoast beaches. The analysis indicates this is either due to a reduction in sand supply entering around Point Lechuza, or a change in the alongshore component of wave energy that increases the amount leaving near Trancas Creek. These questions are the focus of the Historical Performance Study prepared subsequent to this study and is summarized in the following section.

Broad Beach Restoration Project, Coastal Engineering Report
Moffatt & Nichol 73
6.3 ANALYSIS OF SEDIMENT TRANSPORT WITHIN BROADER MMLC
The Historical Performance Study (Everts Coastal, 2011) expanded the Broad Beach Study (Everts Coastal, 2009) to include 24 beaches in the MMLC. The report describes the historical performance of Broad Beach and other beaches in the MMLC and provides possible explanations why the Broad Beach shoreline advanced between 1946 and 1974 and retreated from 1974 through late 2007.
For the purposes of analysis of this large stretch of coastline, the area was divided into 13 beach bins for analysis in addition to the ZLC bins between Point Lechuza and Point Dume. The beach bins are spread such that they provide a representative estimate of the sediment transport patterns throughout the MMLC. The 13 beach bins analyzed in the MMLC are shown in Figure 6-18 and listed in Table 6-3.
Figure 6-18. Beach Bins within the MMLC

Broad Beach Restoration Project, Coastal Engineering Report
Moffatt & Nichol 74
Table 6-3. Description of MMLC Beach Bins
BIN BEACH DESCRIPTION BIN LENGTH, FEET
DISTANCE FROM PORT HUENEME, FEET (MILES)
1 US Navy Groins 4,640 23,500 (4.5)
2 Beach West of Pt Mugu 3,586 49,500 (9.4)
3 La Jolla Beach 6,872 62,500 (11.8)
4 Sycamore Beach 1,884 68,100 (12.9)
5 Whalers Village 2,585 85,900 (16.3)
6 Beach West of Sequit Pt 2,544 91,900 (17.4)
7 Little Encinal Canyon Beach 5,896 125,900 (23.9)
ZLC Bins (See Table 6-1) 20,625 127,000 – 147,000 (24 - 27.9)
8 Crescent Beach East of Pt Dume 3,422 152,600 (28.9)
9 Paradise Cove Beach 10,393 168,900 (32.0)
10 Beach West of Sunset Blvd 2,789 233,900 (44.3)
11 Beach East of Sunset Blvd 4,552 239,900 (45.4)
12 Will Rogers Beach Groins 3,285 244,400 (46.3)
13 La Costa Beach, Malibu 3,967 207,600 (39.3)
Table 6-4 lists the historical aerial images used to create the shoreline position database for this study. Available shoreline position data varied per beach bin and ranged from a total of 12 to 16 dates for analysis during the 1946 to 2009 timeframe.

Broad Beach Restoration Project, Coastal Engineering Report
Moffatt & Nichol 75
Table 6-4. Aerial Imagery Used to Create Shoreline Positions for the MMLC
Bin Number
TIMEFRAME YEAR DATA SOURCE BIN 1 BIN 2 BIN 3 BIN 4 BIN 5 BIN 6 BIN 7 BIN 8 BIN 9 BIN 10 BIN 11 BIN 12 BIN 13
Pre-1974
1946 EM USACE 1/22/1946 1/22/1946 1/22/1946 1/22/1946 1/22/1946 1/22/1946 1/22/1946 - - - - - - 1955 LA USACE 9/30/1955 9/30/1955 9/30/1955 9/30/1955 9/30/1955 9/30/1955 9/30/1955 10/10/1955 10/10/1955 10/10/1955 10/10/1955 10/10/1955 10/10/1955 1959 LA USACE 9/1/1959 9/1/1959 9/1/1959 9/1/1959 9/1/1959 9/1/1959 9/1/1959 9/1/1959 9/1/1959 9/1/1959 9/1/1959 9/1/1959 9/1/1959 1968 LA USACE - - - - - - - 3/28/1964 3/28/1964 - - - - 1974 LA USACE 4/3/1968 4/3/1968 4/3/1968 4/3/1968 4/3/1968 4/3/1968 4/3/1968 - - - - - -
Post-1974
1984 EM USACE - 6/19/1974 6/19/1974 6/19/1974 - 6/19/1974 6/19/1974 6/19/1974 6/19/1974 6/19/1974 6/19/1974 6/19/1974 6/19/1974 1989 EM USACE 3/19/1984 3/19/1984 3/19/1984 3/19/1984 3/19/1984 3/19/1984 3/19/1984 3/19/1984 3/19/1984 3/19/1984 3/19/1984 3/19/1984 3/19/1984 1989 Google Earth 6/19/1989 6/20/1989 6/20/1989 6/20/1989 8/22/1989 8/22/1989 8/22/1989 - - 8/22/1989 8/22/1989 8/22/1989 7/18/1989 1990 Google Earth - - - - - - - 9/7/1990 9/7/1990 9/7/1990 9/7/1990 9/7/1990 - 1994 Google Earth - - - - - 1/25/1988 1/25/1988 1/25/1988 1/25/1988 1/25/1988 1/25/1988 1/25/1988 - 1994 Google Earth 9/3/1994 9/3/1994 9/3/1994 9/3/1994 6/1/1994 6/1/1994 6/1/1994 6/1/1994 6/1/1994 6/1/1994 6/1/1994 6/1/1994 6/1/1994 2002 Google Earth 6/12/2002 7/12/2002 6/12/2002 6/12/2002 6/12/2002 - 6/12/2002 6/12/2002 6/12/2002 6/10/2002 6/10/2002 6/10/2002 6/11/2002 2003 Google Earth 12/31/2003 12/31/2003 12/31/2003 12/31/2003 - - - - 12/31/2003 12/31/2003 12/31/2003 12/31/2003 12/31/2003 2004 Google Earth 10/31/2004 10/31/2004 - - - - - - - - - - -
2005 Google Earth 6/26/2005 - 12/31/2005 12/31/2005 12/31/2005 - - - - 11/3/2005 11/3/2005 11/3/2005 - Google Earth 12/31/2005 12/31/2005 - - - - - - - 12/31/2005 12/31/2005 12/31/2005 12/31/2005
2006 Google Earth 8/8/2006 8/8/2006 - - 3/16/2006 3/16/2006 3/16/2006 3/16/2006 3/16/2006 3/16/2006 3/16/2006 3/16/2006 3/16/2006 2007 Google Earth 9/30/2007 9/30/2007 - 9/30/2007 9/30/2007 9/30/2007 10/23/2007 10/23/2007 10/23/2007 10/23/2007 10/23/2007 10/23/2007 10/23/2007 2008 Google Earth - - - - - - - 7/28/2008 7/28/2008 7/28/2008 - - 7/28/2008
2009 Google Earth - - - - - - - - - - 6/6/2009 6/6/2009 6/6/2009 Google Earth 6/6/2009 6/6/2009 6/6/2009 6/6/2009 6/6/2009 6/6/2009 6/6/2009 6/6/2009 6/6/2009 6/6/2009 11/15/2009 - -
Total Shoreline Years 15 15 12 13 12 12 13 13 14 16 16 15 13

Broad Beach Restoration Project, Coastal Engineering Report
Moffatt & Nichol 76
The sediment deficit discussion below summarizes changes in beach widths and sediment volumes of the beach bins analyzed within the MMLC. Graphics shown in this section are in terms of distance from east to west starting at Port Hueneme. The following landmarks are associated with the reference distances from Port Hueneme below for context:
Port Hueneme – 0 feet U.S. Navy Groins – 25,000 feet Point Mugu – 51,000 feet Lechuza Point – 127,000 feet Broad Beach – between 127,500 and 133,000 feet Point Dume – 147,000 feet Marina Del Rey – 250,000 feet
6.3.1 Shoreline Changes
Between 1946 and 1974 the Broad Beach shoreline and most other shorelines in the MMLC advanced; while between 1974 and late 2007 they retreated, as shown in Figure 6-19. In both periods, beach performance west of Point Dume was inferior to that of beaches further east. Note the shoreline advance rate either increased, or shoreline retreat declined, in a west-to-east direction, especially west of Point Dume. Figure 6-20, which is a blowup of Figure 6-19, illustrates the remarkably similar gradients in the rates of shoreline change west of Point Dume for the two averaging periods. This is in contrast to the different average rates for those periods, with the rate during the earlier being +0.5 ft/yr while it was -2.3 ft/yr in the second period.

Broad Beach Restoration Project, Coastal Engineering Report
Moffatt & Nichol 77
Figure 6-19. Net Shoreline Change Rates in the MMLC
Figure 6-20. Shoreline Change Rates West of Point Dume
-4
-3
-2
-1
0
1
2
3
4
0 50,000 100,000 150,000 200,000 250,000
Shor
elin
e Ch
ange
Rat
e, F
eet/
Year
Distance East of Port Hueneme, Feet
1946-1974 1974-2007 Broad Beach
Pt M
ugu
Pt D
ume
Suns
et B
lvd
Pt L
echu
za
y = 0.000025x - 1.5 R² = 0.56
y = 0.000030x - 4.8 R² = 0.49
-5
-4
-3
-2
-1
0
1
2
3
4
0 25,000 50,000 75,000 100,000 125,000 150,000
Shor
elin
e Ch
ange
Rat
e, F
eet/
Year
Distance East of Port Hueneme, Feet
1946-1974 1974-2007 Broad Beach
Pt D
ume
Pt L
echu
za
Pt M
ugu

Broad Beach Restoration Project, Coastal Engineering Report
Moffatt & Nichol 78
6.3.2 Sediment Volume Changes
Sediment volume changes were evaluated to determine if the overall MMLC trends were consistent with trends observed in the ZLC. Cumulative sediment volume change in the MMLC between the US Navy Groins and the Will Rogers State Beach groins is shown in Figure 6-21. Items to note in this graphic are as follows:
The cumulative sediment volume change rate in the MMLC increased almost uniformly from west to east during the 1946–1974 period, suggesting most beaches in the MMLC gained volume at similar rates.
In contrast, between 1974 and 2007 the cumulative sediment volume change rate decreased from the US Navy groins to Point Lechuza but remained essentially constant between Point Lechuza and Will Rogers State Beach.
The alongshore trends of sediment volume change in the MMLC are remarkably similar to trends measured in the ZLC, as shown in Figure 6-22. The ZLC experienced a significant and almost uniform increase in sediment volume alongshore between 1946 and 1974. On the contrary, the 1974 to 2007 period suggests some variability within the ZLC. The cumulative sediment volume change rate decreased sharply at the west end of the ZLC (Broad Beach) but increased slightly along Zuma and Westward beaches. Although generated from a different data set, these findings are consistent with the Broad Beach Study (2009) summarized in Section 6.2.
Figure 6-21. Cumulative Sediment Volume Changes in the MMLC
-250000
-200000
-150000
-100000
-50000
0
50000
100000
150000
0 50000 100000 150000 200000 250000 300000
Cum
ulat
ive
Chan
ge in
Vol
ume
of M
MLC
Fro
m
USN
Gro
ins t
o W
ill R
oger
s SB
Groi
ns, C
ubic
Yar
ds
Per Y
ear
Distance East of Port Hueneme, Feet
1974-20071946-1974
Will
Rog
ers S
tate
Bea
ch
Pt L
echu
za
USN
Gro
ins

Broad Beach Restoration Project, Coastal Engineering Report
Moffatt & Nichol 79
Figure 6-22. Cumulative Sediment Volume Changes in the ZLC
Broad Beach volume changes within the ZLC were re-evaluated using the expanded aerial image database and are shown in Figure 6-23. The best fit trend line suggests a volume loss rate of about -17,000 cyy between 1974 and 2007. This is also consistent with volume loss estimates of the Broad Beach Study (2009) summarized in Section 6.2.
Figure 6-23. Sediment Volume Changes at Broad Beach
-30000
-20000
-10000
0
10000
20000
30000
40000
50000
60000
125000 130000 135000 140000 145000 150000
Cum
ulat
ive
Sedi
men
t Vol
ume
Chan
ge in
the
ZLC,
Cub
ic Y
ards
Per
Yea
r
Distance East of Port Hueneme, Feet
1974-2007
1946-1974
Pt L
echu
za
Pt D
ume
Broad Beach
Volume = (23,000 x Year) - 40,000,000) R² = 0.4402
Volume = - (17,000 x Year) + 30,000,000 R² = 0.4211
-600,000
-400,000
-200,000
0
200,000
400,000
600,000
800,000
1940 1950 1960 1970 1980 1990 2000 2010Sedi
men
t Vol
ume
Chan
ges R
elat
ive
to 1
946,
Cu
bic
Yard
s
Year

Broad Beach Restoration Project, Coastal Engineering Report
Moffatt & Nichol 80
6.3.3 Causes of Beach Change
Analyses of historic sediment transport patterns throughout the MMLC have clearly identified two different time periods with opposite trends in shoreline behavior. Three factors are potentially the cause of the change in shoreline behavior in the MMLC, the ZLC, and at Broad Beach:
Change in the wave climate as it affects the alongshore component of wave energy flux.
Change in the supply of sediment to the ZLC. Change in the relative SLR.
These three factors were determined as a result of an investigation into the historic MMLC sediment budgets, performance of fillet beaches and hook-shaped bays in the Modern Malibu and the Santa Barbara littoral cells, historic trends in major climate indices and wave characteristics, and the trends of historic SLR. The findings in support of these three causes are summarized in the following sections.
6.3.3.1 Beach Change Due to a Changed Wave Climate
The investigation into the cause of the shoreline behavior in the MMLC, ZLC, and at Broad Beach found that a change in the wave climate, as it effects the alongshore component of wave energy flux, to be the primary driver for shoreline changes between 1946 and 2007. This was most evident when sediment transport parameters for pre- and post-1974 time periods were compared.
Historic sediment budget analyses were developed for the MMLC to help quantify and better understand the causes of past beach performance. The objectives of the sediment budget analysis were to quantify the extent of sand loss to Mugu Submarine Canyon and to quantify the alongshore gradient in net LST of the MMLC. The historic sediment budget was balanced for each time period using measurements or estimates of past sediment fluxes across littoral sediment lens (LSL) boundaries coupled with measured changes in beach width and volume. Major sediment fluxes include the sand bypass rate from Channel Islands Harbor, losses to Mugu Submarine Canyon, and alongshore gradients in the net LST rate from one littoral cell to the next. Other minor sediment fluxes that did not significantly influence results, but were included in the analysis, include fluvial sediment from watersheds in the Santa Monica Mountains, sand release from erosion of seacliffs and lower-elevation substrate, and the effects of SLR over the averaging period. Losses to dunes created by Aeolian sand transport and Dume Submarine Canyon losses are comparatively minor players that were considered steady state fluxes in the budget analysis.
A fillet beach is the beach retained upcoast of headlands, groins, jetties and other features that impede the free alongshore movement of sediment. These beaches respond to changes in

Broad Beach Restoration Project, Coastal Engineering Report
Moffatt & Nichol 81
wave climate in a measurable way and therefore, the gross, net downcoast, and upcoast longshore sediment transport rates can be calculated for these from empirical equations. A number of fillet beaches exist in the MMLC where this analysis was conducted.
The sediment transport parameters determined by the sediment budget and fillet beach analyses are presented in Table 6-5. The following conclusions can be drawn from these results:
A comparison of the net LST rates for the two averaging periods suggests that the westerly wave energy approaching the MMLC was perhaps 1.5 times greater in the earlier time period (1946-1974) than the later time period (1974-2007).
Gross LST rates, determined by analysis of fillet beaches in the MMLC, suggest the total alongshore component of wave energy approaching from all directions, was 1.3 times larger in the earlier versus the later averaging period.
Overall, the LST data show more energy from a westerly direction, a larger total energy, and a higher ratio of west to east energy prevailed between 1946 and 1974 than between 1974 and 2007.
Table 6-5. Sediment Transport Parameters of the MMLC and ZLC
Sediment Transport Parameter
Method MMLC 1946 - 1974
MMLC 1974 - 2007
ZLC 1946 – 1974
ZLC 1974 - 2007
Net LST, cyy Sediment
Budget Analysis
400,000 270,000 424,000 280,000
Net/Gross LST Ratio
Fillet Beach Analysis 0.63 0.57 0.535 0.515
Gross LST, cyy Fillet Beach Analysis 635,000 475,000 792,000 544,000
These findings led to an investigation of historic trends in major climate indices and wave climate. Several different indicators were investigated to evaluate the relationship between measured shoreline change and changes in the wave climate. These indicators include: climate indices, hindcast waves (and to a lesser extent gauged waves), and trends in bypass rates. Correlations were found to varying extents and are discussed further below.
6.3.3.2 Climate Indices
The shift from shoreline accretion to erosion and the clear differences in the magnitudes of the LST parameters, before and after 1974, coincide with a major shift in at least three climate indices. NOAA views the following three indices as "leading indicators" of ocean conditions:

Broad Beach Restoration Project, Coastal Engineering Report
Moffatt & Nichol 82
Pacific Decadal Oscillation index (PDO): The PDO is based on variations in sea surface temperature of the North Pacific. The index has both warm and cool phases, which are related to Northern California current. Adams et al. (2008) associates warm phases with storm waves that are larger, have longer periods, and approach directions that are favorable to delivering more energy than usual to the Southern California coast. Conversely, cool phases tend to deliver smaller waves with more northwesterly approach directions.
Multivariate El Niño Southern Oscillation Index (MEI): MEI is affected by atmospheric conditions in the North Pacific and equatorial waters, the index has both positive and negative phases. During a positive MEI, weather in the Pacific Northwest often results in stronger winter storms and tracks closely with the PDO.
Southern Oscillation Index (SOI): SOI is based on standardized sea level pressure difference between Tahiti and Darwin, Australia. The index varies closely, but inversely with the PDO and MEI.
The values of the climate indices over the last 60 years are shown in Figure 6-24. The following can be noted from this graphic as it relates to LST within the MMLC:
The area of MMLC and Broad Beach advance prior to around 1974 correlates well with the negative slopes of the PDO and MEI and the positive slope of the SIO.
The shift from shoreline advance to retreat in 1974 correlates well with the sharp reversal in index signs and with the recession of the Broad Beach shoreline until at least 1998.
This strong correlation is lost after 1998. Shorelines continued to retreat, at an even higher rate, and the positive alongshore gradient in net LST continued, but the cumulative residual curves were relatively neutral.

Broad Beach Restoration Project, Coastal Engineering Report
Moffatt & Nichol 83
Figure 6-24. Cumulative Residual Annual Values of Climate Indices
6.3.3.3 Wave Characteristics
Measured wave conditions are not available for correlation with the climate indices for the entire 1946 to 2007 time period in Southern California. Gauged wave data was only available for the past 16 years at a location west of Santa Barbara and for a period of 27 years at a location in Santa Monica Bay. The data provides measured significant wave height and peak period data (without wave directions), but a strong correlation to beach changes was not found, potentially due to differing levels of blockage from offshore islands and their nearshore locations.
In the absence of sufficient measured wave data, hindcast wave conditions were investigated for a correlation to shoreline changes and the major climate indices. Adams et al. (2008) obtained strong correlations between hindcast wave conditions that span back to 1948, and residual PDO and SOI values at a site due west of San Clemente Island (33°N and 121.5°W) that represents a pure “deep water” condition without the influence of island blocking or shoaling. Adams et al. (2008) concluded:
Significant deep water winter wave heights were consistently below the long-term mean from 1948 to 1968, relatively unchanging between 1968 and about 1977, and consistently above the long-term mean between 1977 and 1998;
Peak periods were below the series mean before 1977 and above it after 1977;
-10
-8
-6
-4
-2
0
2
4
6
8
10
1950 1960 1970 1980 1990 2000 2010
Ann
ual A
vera
ge C
umul
ativ
e Re
sidu
al V
alue
s,
Clim
ate
Indi
ces
Year
PDO
MEI
SOI
1974

Broad Beach Restoration Project, Coastal Engineering Report
Moffatt & Nichol 84
Peak wave directions exhibit several intervals of north-of-mean trends prior to 1977 and two strong west-of-mean trend intervals after 1977.
Approximations of their published results, shown in Figure 6-25, indicate there was considerably more wave energy in deep water off the Southern California coast during the mid-1970s until at least 1997 when compared to the interval between 1948 and the mid-1970s. This finding is in contrast to the gross LST rates of the two periods, which shows the alongshore component of wave energy flux was greater before 1974.
Figure 6-25. Cumulative Residual Winter Wave Characteristics (Adams et al, 2008)
These results and the estimated LST rates for the two periods show much of the difference in wave and LST characteristics before and after 1974 is probably due to changes in waves that approach from west of shore normal. Changes in alongshore gradient in net LST are more dependent upon changes in the breaking wave angle than breaker height. LST rates are very sensitive to wave direction and, for this reason, even a modest difference in the wave climate can have a huge influence on the net LST rate and its alongshore gradient. Differences in alongshore gradients in the LST parameters explain most of the differing performances of beaches in the MMLC, including Broad Beach.
6.3.3.4 Sand Bypass Trends
The historic bypass trends of Channel Islands, Ventura, and Santa Barbara Harbors were analyzed to estimate trends in net LST at these harbors. The amount of sand artificially bypassed from one side to the other side of a small craft harbor built seaward of the general trend of the coast, when averaged over a substantial period, is nearly equal to the net LST reaching the barrier. If this were not the case, the trap from which sand was bypassed would
R² = 0.8031
-4.5-4
-3.5-3
-2.5-2
-1.5-1
-0.50
1940 1990Sign
ifica
nt W
ave
Heig
ht, M
eter
s
Year
R² = 0.827
-8-7-6-5-4-3-2-1012
1940 1990
Peak
Wav
e Pe
riod,
Sec
onds
Year
R² = 0.7958 0
5
10
15
20
25
30
35
1940 1990
Peak
Wav
e Di
rect
ion,
Deg
rees
Year

Broad Beach Restoration Project, Coastal Engineering Report
Moffatt & Nichol 85
either have filled or continually expanded. Figure 6-26 shows the residual long-term bypass rates at Santa Barbara and Ventura Harbors remain relatively steady. Meanwhile, there is a continuing decline in the bypass rate at Channel Islands Harbor. A change in mean beach width immediately upcoast of these harbors does not seem to be the cause, nor does the orientation of the coastline. It is postulated that the temporal changes in net LST at Channel Islands Harbor are due to local effects in and near the MMLC caused by a change in wave climate in the 1970s.
Figure 6-26. Residual Bypass Rates for Channel Islands, Ventura, and Santa Barbara Harbors
6.3.3.5 Change in Sediment Supply to the MMLC
Two human interventions especially impacted the sand supply near the upcoast end of the MMLC between 1946 and 2007:
Jetty construction at Port Hueneme and the accompanying 22-year hiatus in artificial sand bypassing substantially reduced the 1946-1974 supply reaching Hueneme Beach. This had a dramatic effect on beaches between Port Hueneme and Mugu Submarine Canyon as they experienced significant retreat in response to this reduction in LST. The volume of sand eroded from these beaches almost completely offset the LST reduction and the amount of sand reaching the canyon
-600
-400
-200
0
200
400
600
800
1960 1965 1970 1975 1980 1985 1990 1995 2000 2005 2010
Resi
dual
Byp
ass R
ate,
100
0's o
f CYY
Year

Broad Beach Restoration Project, Coastal Engineering Report
Moffatt & Nichol 86
and downcoast beaches was relatively unchanged during the pre-1974 time period.
Revetment construction in the lee of the Mugu Submarine Canyon that narrowed the transport zone in the lee of the canyon over time. Sediment budget findings indicate the canyon sand capture ratio was about 0.64 for the 1946-1974 averaging period and about 0.83 for the 1974-2007 averaging period. The increased sand capture ratio reduced the amount of sand at downcoast beaches by about 120,000 cyy. This value was obtained by balancing the 1974-2007 sediment budget using a sand capture ratio of 0.64 for Mugu Submarine Canyon.
The effect of this sand reduction on downcoast beaches, and Broad Beach in particular, cannot be determined at this time. Some assumptions of where this material would have deposited include: 1) equal deposition between Mugu Submarine Canyon and Marina Del Rey of about 0.5 cyy/ft of shoreline; 2) equal deposition of about 1.2 or 1.3 cyy/ft between Mugu Submarine Canyon and Point Dume (where sand gains and losses were nearly in balance from 1974 to 2007); or 3) a larger increase in the deposition rate in the west, tapering off in a west-east direction proportional to the gradient of the measured sand loss rate. The last assumption seems most realistic given the 1974-2007 sand volume change gradient. In all likelihood not all of that material would have been deposited in the MMLC; some would probably have moved through the system.
6.3.3.6 Beach Change Due to SLR
The movement of sediment in the littoral zone is water-depth dependent because the vertical position of the beach and shoreface profile is fixed by the mean position of the sea surface. So over a period of years or decades, the mean width of the beach will decrease with an increase in sea level without additional sand supply.
Lyle et al, (1986) found the average SLR rate was about 1.2mm/yr from 1950-1986 at Santa Monica. The Los Angeles Harbor Tide gauge suggests a similar rate over the same period. A Jet Propulsion Laboratory (2009) image of the sea level trend for the west coast over the past two decades indicates little or no net movement. For purposes of estimating beach loss due to SLR in the MMLC, a SLR rate of 1.2 mm/yr (0.004 ft/yr) for the 1946-1974 averaging period and 0.6 mm/yr (0.002 ft/yr) for the 1974-2007 period was assumed.
These estimates seem to indicate volume loss due to SLR was greater pre-1974 than post-1974, which is opposite of the measured shoreline behavior. The SLR increase likely contributed to volume losses in the MMLC between 1946 and 2007 but the contributions were minor compared to the effects of a changed wave climate and changes in the sand supply to the ZLC. For example, between 1974 and late 2007 the impact of SLR on Broad Beach increased the loss rate by about 500 cyy, roughly 3% of the total loss rate for this period.

Broad Beach Restoration Project, Coastal Engineering Report
Moffatt & Nichol 87
6.3.4 Past Beach Performance Summary
The performance of Broad Beach fits into two distinct time periods: 1) a period of notable sand gains between 1946 and 1974; and 2) sand losses after 1974. Between 1946 and 1974 the Broad Beach shoreline as well as shorelines at Zuma Beach, Westward Beach, and almost all of the other beaches within the MMLC advanced seaward. Notably, gains at Broad Beach were much larger than elsewhere. Changes in sand volume averaged +0.8 cyy per alongshore foot (cyy/ft) in the MMLC, +2.5 cyy/ft in the ZLC, and +4.3 cyy/ft at Broad Beach.
Conversely, after 1974, Broad Beach losses were the largest in the ZLC. Between 1974 and late 2007, Broad Beach lost an average -3.2 cyy/ft, or over 10 times as much as the ZLC average. During this period, the MMLC, on average, gained +0.1 cyy/ft with most gains east of Point Dume. The largest losses in the MMLC were near Point Mugu from whence they trailed off in an easterly direction. Losses in the ZLC were greatest at Point Lechuza. The net loss in the ZLC was about 7,000 cyy (with Zuma and Westward Beaches gaining almost +0.5 cyy/ft or a total near 10,000 cyy) while Broad Beach losses averaged 17,000 cyy between 1974 and 2007.
Post-1974 losses at Broad Beach were unsteady, increasing to a maximum 40,000 cyy during the first decade of the 21st Century. Losses since late 2007 have continued, but the extent has not been quantified. Recent (April 2010 to July 2011) County of Los Angeles beach profile surveys show a fluctuating, but near constant mean position of the shoreline near Trancas Creek and further southeast along Zuma Beach.
6.3.5 Beach Change Causes Summary
A changed wave climate was primarily responsible for the pre-1974 shoreline advance and its post-1974 retreat in the MMLC and at Broad Beach. Gains and losses were a consequence of the way the wave climate impacted the alongshore gradient in net LST. Pre-1974 accretion rates correlate strongly (R2 = 0.86) with an east to west alongshore gradient in the net LST rate (net LST declines in that direction leaving sand behind). Just the opposite occurred between 1974 and late 2007. A consistent west to east net LST gradient transported sand from Broad Beach to beaches to the east.
The especially large seaward, then landward shift in the Broad Beach shoreline from before to after 1974 was due to its location in the lee of Point Lechuza. The fishhook shape of the Broad Beach shoreline is evidence of the wave-blocking and diffracting function of the Point Lechuza headland. Breaking wave heights and approach directions are altered more by headlands; as a consequence, downcoast beaches are affected more than beaches elsewhere. When wave approach directions change over intervals of decades or more, shorelines near headlands tend to be disproportionally impacted. In the ZLC, the difference between shoreline change rates near Point Lechuza before and after 1974 was over 7 ft/yr. In contrast, close to Point Dume it

Broad Beach Restoration Project, Coastal Engineering Report
Moffatt & Nichol 88
was near zero (Figure 6-19). The MMLC average difference in shoreline change rates before and after 1974 was about 3.5 ft/yr.
Two human factors affected the post-1946 sand supply in the MMLC, but neither had a substantial impact on Broad Beach before at least 2007. These include the delay in the establishment of a sand bypassing program and the construction of the revetment along a portion of the Point Mugu Naval Base. Sand bypassing from Channel Islands Harbor did not begin until 22 years after jetties at Port Hueneme were completed in 1938. The consequence was a huge negative sand budget at Hueneme Beach. Had the bypassing been in place since the onset of the harbor construction, erosion of downcoast beaches would have been severely diminished.
In the 1970s, a revetment was constructed along a portion of the Point Mugu Naval Base shoreline in the lee of Mugu Submarine Canyon. Around 1985, the conduit along which sand moved landward of the canyon began narrowing as the retreating headwall of the canyon moved closer to the fixed position of the revetment. This increased the capture fraction of the canyon and reduced the sand supply that would have naturally reached downcoast beaches, on average, by 120,000 cyy between 1974 and late 2007. However, no direct evidence was found that this denial adversely impacted beaches east of Point Lechuza. At most, the effect would have been a denial of 1,600 cyy to Broad Beach.
SLR had a lesser impact on Broad Beach after 1974 than it did between 1946 and 1974. Since about 1985 sea level has risen very little along the west coast of the United States, although it accelerated worldwide. After 1974 the contribution of SLR to the retreat of the Broad Beach shoreline was between 0.1 and 0.2 ft/yr.
6.4 DISCUSSION OF VARIABILITY IN SHORELINE CHANGE RATES
In addition to the long-term shoreline change trends estimated in previous sections, the short-term variability in shoreline position is also an important factor to consider in developing a shoreline protection plan along Broad Beach. Short-term variations in shoreline position can be much greater than the long-term background rates identified in Sections 6.2 and 6.3 and help determine appropriate buffers to maintain a level of protection for infrastructure along Broad Beach. The following factors contribute to potential short-term variation in shoreline position:
Seasonal fluctuations along Broad Beach ranged from 20 to 40 feet according to beach profile surveys from 2010 to 2011 and reflect a somewhat mild wave climate. Beach profile surveys from 2004 to 2005 indicate a maximum seasonal recession of 70 feet, representative of a more intense winter storm season. Seasonal changes are discussed in more detail in Section 7.1.

Broad Beach Restoration Project, Coastal Engineering Report
Moffatt & Nichol 89
Severe storm erosion may also result in significant short-term losses in beach width. For example, during a severe storm event of the 1997-1998 El Niño season, 30 feet of beach loss occurred over the course of two days.
The background shoreline retreat rate also contributes a measurable amount of beach loss on an annual basis. According to findings presented in Sections 6.2 and 6.3, a changing wave climate is primarily responsible for an increased rate of erosion along Broad Beach. The average annual rate of retreat since the 1970s varies from -2 to -3 feet/year; however, there are periods in which the shoreline eroded at a much faster rate of -6 to -7 feet/year, as shown in Figure 6-9.
Based on these observations, the short-term variations in shoreline position of up to 50 feet can be expected on an annual basis with a potential for extreme variations in excess of 70 feet.

Broad Beach Restoration Project, Coastal Engineering Report
Moffatt & Nichol 90
7. ENGINEERING ANALYSIS OF BASELINE “NO PROJECT” CONDITIONS
A wave uprush analysis was performed for the baseline project conditions to evaluate the risk of damage to existing development along Broad Beach resulting from seasonal fluctuations in beach width, storm related erosion and runup, long term erosion rates, and the effects of SLR. This analysis evaluated the baseline project conditions along Broad Beach prior to the installment of temporary coastal protection structures, such as sandbag seawalls and the emergency rock revetment. Using the June 2005 MHTL as the starting shoreline position, the wave uprush limit line was estimated for the baseline condition to determine which structures are immediately threatened by coastal flooding and erosion. To estimate future risk to existing development under the “No Project” scenario, the wave uprush limit was projected over a span of 20 years, accounting for long-term erosion rates coupled with projected SLR. The various factors that influence the current and future risk to existing development are described in the following sections.
7.1 SEASONAL CHANGES IN BEACH WIDTH
The dynamics of the Broad Beach shoreline can be depicted via cross-sections of shore-perpendicular transects, also referred to as beach profiles. Beach profile data was available from the following sources:
Historic beach profiles between 1950 and 1970 were obtained from Los Angeles County archives.
Fugro West, Inc. surveyed beach profiles along Broad Beach from 2002 to 2005 for the USACE.
CFC is providing semi-annual (fall and spring) surveyed beach profiles along Broad Beach in support of the project. The program was initiated in 2009 and will continue throughout the construction and post-construction monitoring duration. Surveyed profiles are available from Fall 2009 through Spring 2013 for purposes of this analysis.
7.1.1 Historic Beach Profiles
The historic profiles along Broad Beach generally include the years 1951, 1962, and 1970. A single profile was measured during the summer for each of these three years. This data set helps illustrate the long-term trend in beach width over this time period and supports the findings of the historic shoreline assessment that beach width increased along Broad Beach between 1950 and 1970.
The historic profiles were measured at about 500-ft intervals along Broad Beach and Zuma Beach, as shown in Figure 7-1. Station 145+00 was located at the mouth of Trancas Creek and 210+00 located at the base of Point Lechuza. Historic profiles at two representative locations
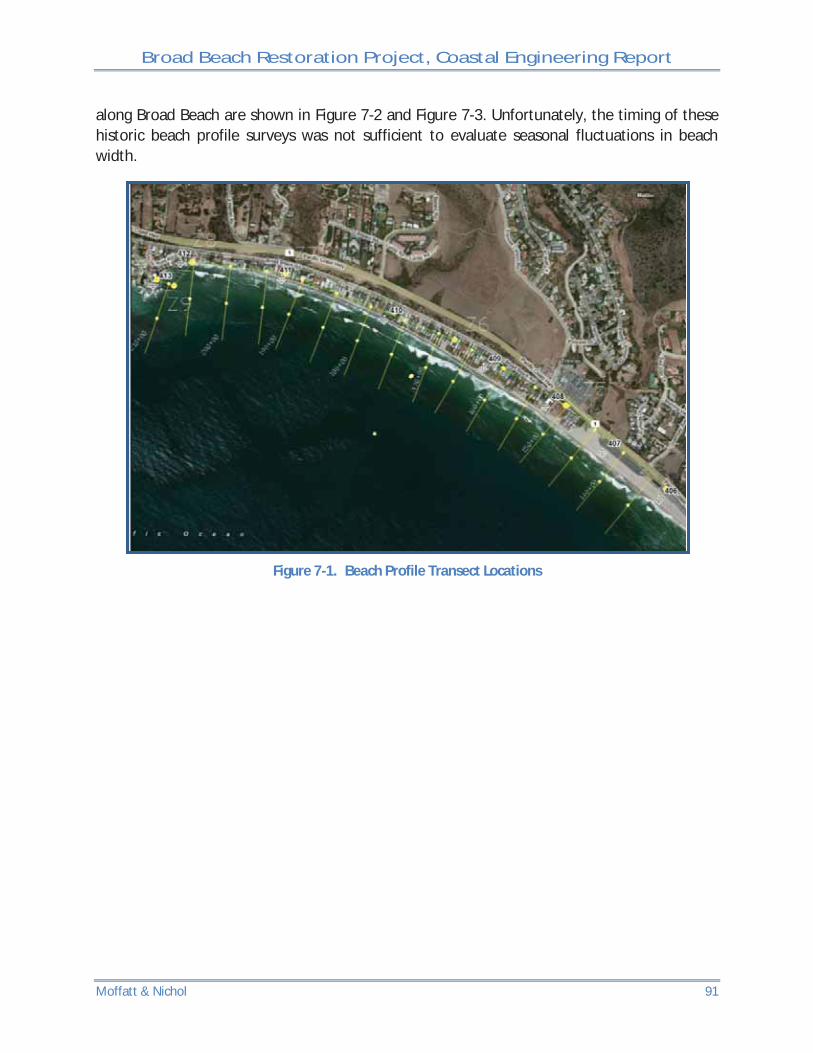
Broad Beach Restoration Project, Coastal Engineering Report
Moffatt & Nichol 91
along Broad Beach are shown in Figure 7-2 and Figure 7-3. Unfortunately, the timing of these historic beach profile surveys was not sufficient to evaluate seasonal fluctuations in beach width.
Figure 7-1. Beach Profile Transect Locations

Broad Beach Restoration Project, Coastal Engineering Report
Moffatt & Nichol 92
-25 0
-20 0
-15 0
-10 0
-5 0
0 0
5 0
10 0
15 0
20 0
0 100 200 300 400 500 600 700 800 900
Elev
atio
n (M
LLW
-ft
)
Range (ft)
Historic Beach Profile Comparison (165+00)
1951
1962
1970
Figure 7-2. Historic Beach Profiles at Broad Beach (Station 165+00)
Figure 7-3. Historic Beach Profiles at Broad Beach (Station 190+00)
-30.0
-25.0
-20.0
-15.0
-10.0
-5.0
0.0
5.0
10.0
15.0
20.0
0 100 200 300 400 500 600 700 800 900
Elev
atio
n (M
LLW
-ft
)
Range (ft)
Beach Profile Comparision (190+00)
1951
1962
1970

Broad Beach Restoration Project, Coastal Engineering Report
Moffatt & Nichol 93
7.1.2 Fugro West, Inc. Beach Profile Surveys (2004-2005)
More recent profile information, recorded by Fugro West, Inc. from 2004 through 2005, was used to generate an estimate for seasonal changes in beach width. While this data provides measurements for only a single year, it is helpful for estimating the magnitude of typical seasonal fluctuations in beach width.
Figure 7-4 presents three typical profiles at Station 160+00 from the Spring of 2004 until Spring 2005; Figure 7-5 presents a “close-up” view of this plot depicting seasonal shifts at approximately mean sea level (MSL). For this station, there was a gain in beach width of approximately 30 feet in the summer of 2004, and then a loss of approximately 70 feet during the winter of 2004/2005.
Figure 7-4. Beach Profiles at Station 160+00
-20
-15
-10
-5
0
5
10
15
20
0 100 200 300 400 500 600 700 800 900 1000 1100 1200
Ele
vatio
n (ft
-MLL
W)
Range (ft)
Station 160+00 - Fugro Data 2004 spring 2004 Fall 2005 Spring

Broad Beach Restoration Project, Coastal Engineering Report
Moffatt & Nichol 94
Figure 7-5. Seasonal Shift of Mean Sea Level (MSL) Position at Station 160+00
7.1.3 Coastal Frontiers Beach Profile Surveys (2009-2013)
CFC has performed beach profile surveys along Broad Beach beginning in October 2009 until most recently in May 2013. Beach profiles have been measured at five transects along Broad Beach, as shown in Figure 7-6, since October 2009. The profile data has been collected biannually in the fall and spring to provide comparison points for evaluating seasonal fluctuations in beach width. Beginning in November 2012, seven profiles were added between Trancas Creek and Point Dume. In May 2013, four beach profiles were added at the west end of Broad Beach. All beach profile locations between Point Lechuza and Point Dume are shown in Figure 7-7.
0
1
2
3
4
5
400 420 440 460 480 500 520 540 560 580
Ele
vatio
n (ft
-MLL
W)
Range (ft)
Station 160+00 - Fugro Data 2004 spring 2004 Fall 2005 Spring
+ 30'
+ 70'

Broad Beach Restoration Project, Coastal Engineering Report
Moffatt & Nichol 95
Figure 7-6. Broad Beach Transect Locations (Coastal Frontiers, 2011)
Figure 7-7. Additional Transect Locations (Coastal Frontiers, 2013)
The most recent CFC beach profile survey report, dated July 3, 2013, provides a summary of the seasonal and annual changes measured at each transect location. The results are summarized in the following table and the complete report can be found in Appendix 3 to this report. These
408
409 410
411
412

Broad Beach Restoration Project, Coastal Engineering Report
Moffatt & Nichol 96
profile measurements provide the most complete data set for estimating seasonal fluctuations in MSL position and will be used to determine the potential wave uprush limits for the baseline condition and proposed project alternatives. These seasonal changes are assumed to be typical of relatively mild winters and do not include the effects of extreme storm erosion. The winter beach loss of 70 feet measured from the 2004 to 2005 beach profiles may be more indicative of what can be expected during a stormy winter season.
Table 7-1. Seasonal Changes (Coastal Frontiers, 2013)
Transect Designation
Seasonal Changes in MSL Position (Fall to Spring)
Nov 2010 to May
2011
Oct 2011 to May
2012
Nov 2012 to May
2013 394 - - 11
396 - - 29
398 - - -14
400 - - -43
402 - - -39
404 - - -33
406 - - -1
408 -5 -18 -6
409 -15 11 17
410 -21 -12 17
411 -30 -42 6
412 -5 13 7
A comparison of the seasonal beach profile changes at Broad Beach indicate losses of 20 to 40 feet have occurred at Transects 410 and 411 during the winter months. Much smaller seasonal beach losses were measured at Transect 412, near Pt. Lechuza. The east end of Broad Beach, represented by Transects 409 and 408, have experienced seasonal beach losses between 5 to 20 feet over a winter season. These results are based on recent profile surveys and, therefore, include effects of the emergency shore protection measures between Transects 409 and 411. Although the emergency shore protection measures have likely influenced beach profile changes, the results are similar in magnitude to the seasonal changes measured in 2004/2005 and similar in magnitude to profiles located east of the temporary rock revetment. Beach profiles surveyed at Transect 410 (Broad Beach) are shown in Figure 7-8 and those surveyed at Transect 402 (Zuma Beach) are shown in Figure 7-9.

Broad Beach Restoration Project, Coastal Engineering Report
Moffatt & Nichol 97
Figure 7-8. Beach Profiles at Transect 410 (Coastal Frontiers, 2013)

Broad Beach Restoration Project, Coastal Engineering Report
Moffatt & Nichol 98
Figure 7-9. Beach Profiles at Transect 402 (Coastal Frontiers, 2013)

Broad Beach Restoration Project, Coastal Engineering Report
Moffatt & Nichol 99
7.2 SAND LOSS ESTIMATES FROM CFC PROFILE SURVEYS (2009 – 2013)
In addition to providing an understanding of seasonal profile changes along Broad Beach, the survey data also illustrates the recent interannual profiles changes. Due to factors discussed in Section 6, Broad Beach has experienced the adverse impacts of a sediment deficit that has increased rates of shoreline erosion dating back to the early 1970s.
Previous estimates of sand loss rates were based on an analysis of historic shoreline positions. Following this methodology, the average rate of sand loss at Broad Beach had increased to an estimated 40,000 cyy by 2007. Relative to analysis of historic shoreline positions, the recent beach profiles provide a more accurate data set for estimating the rate of sand loss. Rather than comparing shorelines from aerial imagery (which represent a single point on the beach profile), the surveyed beach profiles allow for comparison of changes over the entire profile from the upper berm out to the depth of closure.
With five beach profile transects at regular intervals along Broad Beach, an estimate of sand loss volume was estimated using the average end method. The total volume of sand loss along Broad Beach from October 2009 to May 2013 was estimated to be about 225,000 cy (CFC, 2013). The linear trend of shorezone volume changes (sand loss), illustrated in Figure 7-10, was estimated to be -53,000 cyy. The profile losses were relatively uniform along Broad Beach, as shown in Figure 7-11, at profiles 409 and 411.
Figure 7-10. Recent Sand Loss Rate at Broad Beach (Coastal Frontiers, 2013)
-250,000
-200,000
-150,000
-100,000
-50,000
0
2009 2010 2011 2012 2013 2014
Sho
rezo
ne V
olum
e C
hang
e (c
y)
Date
Broad Beach Shorezone Volume Change Relative to Fall 2009
Trend = -53,000 cyy