Embed Size (px)
Citation preview

Appendix A
Streamflow Rating Curves

Sand Canyon
Q=C(ght-A)^rc= 3.94a= 0.11r= 1.50
chitest = 0.9997Min Diff= 0.9880Min Staff= 0.2720
Measured Discharge fromDate Staff Gage Logger Discharge Rating Curve Difference
0.2 0.110.25 0.20
10/18/01 0.272 0.55 0.16 0.26 0.018/30/01 0.34 0.64 0.42 0.43 0.0010/31/01 0.345 0.63 0.08 0.45 0.137/24/01 0.41 0.71 0.47 0.64 0.036/21/01 0.53 0.88 1.35 1.07 0.0810/5/01 0.55 0.83 1.19 1.15 0.009/18/01 0.58 0.86 1.53 1.27 0.077/9/01 0.65 1.07 1.37 1.56 0.038/6/01 0.66 1.12 1.60 0.24
6/13/01 0.75 2.64 2.01 0.390.8 2.250.9 2.76
Sand Canyon Rating Curve
0
0.1
0.2
0.3
0.4
0.5
0.6
0.7
0.8
0.9
1
0.00 0.50 1.00 1.50 2.00 2.50 3.00Stream Flowrate, cfs
Dep
th, f
t
Measured FlowRating Curve

Rock Island
Q=C(ght-A)^rc= 7.42a= 0.41r= 1.79
chitest = 1.0000Min Diff = 0.6794Min Staff= 0.56
Measured Discharge fromDate Staff Gage Logger Discharge Rating Curve Difference
0.5 0.1010/5/01 0.56 0.65 0.24 0.25 0.00
10/18/01 0.56 0.65 0.33 0.25 0.0110/31/01 0.59 0.69 0.30 0.35 0.009/18/01 0.6 0.68 0.32 0.38 0.008/30/01 0.61 0.7 0.35 0.42 0.018/6/01 0.67 0.69 0.67 0.007/24/01 0.69 0.58 0.76 0.047/9/01 0.73 1.38 0.97 0.161/9/02 0.74 0.82 0.77 1.02 0.076/21/01 0.77 1.67 1.17 0.256/13/01 0.81 1.06 1.44 0.152/23/02 1.65 1.23 10.94 10.94 0.00
2.00 17.073.00 40.94
Rock Island Rating Curve
0
0.5
1
1.5
2
2.5
3
3.5
0.00 5.00 10.00 15.00 20.00 25.00 30.00 35.00 40.00 45.00Stream Flowrate, cfs
Dep
th, f
t
Measured FlowRating Curve

Douglas
Q=C(ght-A)^rc= 4.03a= 0.00r= 3.30
chitest = 0.9999Min Diff = 4.4748Min Staff= 1.38
Measured Discharge fromDate Staff Gage Logger Discharge Rating Curve Difference
1.00 4.031.10 5.52
9/18/01 1.38 1.32 10.96 11.68 0.528/30/01 1.38 1.35 12.45 11.68 0.59
10/18/01 1.39 1.33 12.65 11.96 0.4810/5/01 1.40 1.33 12.45 12.25 0.04
10/31/01 1.42 1.34 13.30 12.69 0.381/9/02 1.46 1.37 13.90 14.07 0.03
6/21/01 1.47 1.03 12.85 14.39 2.382/23/02 1.73 get later 24.63 24.40 0.05
1.80 28.081.90 33.572.00 39.77
7/24/01 1.45 1.49 11.34 13.75 5.836/13/01 1.51 13.10 15.72 6.918/6/01 1.36 12.66 11.13 2.357/9/01 1.50 1.94 13.06 15.38 5.37
Douglas Creek Rating Curve
1.25
1.35
1.45
1.55
1.65
1.75
1.85
1.95
2.05
10.00 15.00 20.00 25.00 30.00 35.00 40.00 45.00
Stream flowrate, cfs
Dep
th, f
tMeasured FlowRating CurveNot Used

Pine Canyon
Q=C(ght-A)^rc= 1.50a= 0.00r= 5.93
chitest = 1.0000Min Diff = 0.0168Min Staff= 0.74
Measured Discharge fromDate Staff Gage Logger Discharge Rating Curve Difference
0.60 0.070.70 0.18
8/6/01 0.74 0.284 0.25 0.009/18/01 0.74 0.55 0.301 0.25 0.007/24/01 0.75 0.57 0.308 0.27 0.008/30/01 0.76 0.56 0.236 0.29 0.007/9/01 0.76 0.59 0.250 0.29 0.00
10/4/01 0.775 0.55 0.347 0.33 0.0010/18/01 0.8 0.56 0.410 0.40 0.006/13/01 0.8 0.346 0.40 0.006/21/01 0.8 0.61 0.382 0.40 0.00
10/31/01 0.825 0.59 0.519 0.48 0.001/9/02 0.87 0.60 0.618 0.66 0.00
0.9 0.801.00 1.50
Pine Canyon Rating Curve
0.00
0.20
0.40
0.60
0.80
1.00
1.20
0.000 0.100 0.200 0.300 0.400 0.500 0.600 0.700 0.800 0.900 1.000
Stream Flowrate, cfs
Dep
th, f
t
Measured FlowRating Curve

Foster
Q=C(ght-A)^rc= 40.751a= 0.000r= 5.502
chitest = 0.9074Min Diff = 5.0362Min Staff= 0.45
Measured Discharge fromDate Staff Gage Logger Discharge Rating Curve Difference
0.20 0.010.40 0.26
8/30/01 0.45 0.44 1.31 0.50 0.659/18/01 0.45 0.44 1.17 0.50 0.458/6/01 0.46 1.24 0.57 0.46
7/24/01 0.47 0.49 1.65 0.64 1.0110/4/01 0.48 0.44 1.24 0.72 0.28
10/18/01 0.51 0.47 1.13 1.00 0.027/9/01 0.55 1.83 1.52 0.09
10/31/01 0.58 0.52 1.72 2.05 0.116/13/01 0.60 3.20 2.45 0.556/21/01 0.60 2.23 2.45 0.051/8/02 0.80 0.62 10.81 11.94 1.27
2/22/02 0.91 1.15 24.56 24.25 0.090.95 30.731.00 40.75
Foster Creek Rating Curve
0.00
0.20
0.40
0.60
0.80
1.00
1.20
0.00 5.00 10.00 15.00 20.00 25.00 30.00 35.00 40.00 45.00
Stream Flowrate, cfs
Dep
th, f
tMeasured FlowRating Curve

Appendix B-1
Screening Level Macroinvertebrate Assessment of Potential Anadromous Fish-Bearing Streams
in WRIAs 44 and 50 During 2001

Screening Level Macroinvertebrate Assessment of Potential Anadromous
Fish-Bearing Streams in WRIAs 44 and 50
During 2001
Prepared for:
Foster Creek Conservation District
P.O. Box 428 Waterville, Washington 98858
Prepared by:
R2 Resource Consultants, Inc.
15250 N.E. 95th Street Redmond, Washington 98052
January 2003

Foster Creek Conservation District Screening Level Macroinvertebrate Assessment
R2 Resource Consultants, Inc. ii January 2003 1303.02/Macroinvertebrate.final_1/03
This report is part of a habitat assessment conducted under §2514 watershed planning findings for potentially anadromous fish-bearing streams in Watershed Resource Inventory Areas (WRIAs) 44 and 50 in Douglas County. The report was prepared by R2 Resource Consultants, Inc. under subcontract to Pacific Groundwater Group. It follows the scope for a screening level biological assessment as approved by the WRIAs 44 and 50 Planning Unit in May 2001. Principal Investigator
Ronald F. Campbell
Aquatic Ecologist
E. Bruce Kvam

Foster Creek Conservation District Screening Level Macroinvertebrate Assessment
R2 Resource Consultants, Inc. iii January 2003 1303.02/Macroinvertebrate.final_1/03
CONTENTS
1. INTRODUCTION..................................................................................................................... 1
2. MACROINVERTEBRATE FIELD METHODS ..................................................................... 2
2.1 SITE LOCATION/DESCRIPTION............................................................................................. 3
2.1.1 Sand Canyon Creek ................................................................................................ 3
2.1.2 Douglas Creek......................................................................................................... 3
2.1.3 Pine Canyon Creek ................................................................................................. 3
2.1.4 Blue Grade Draw .................................................................................................... 3
2.1.5 Rock Island Creek................................................................................................... 6
2.1.6 Foster Creek............................................................................................................ 6
3. MACROINVERTEBRATE LABORATORY ANALYSIS..................................................... 7
4. MACROINVERTEBRATE DATA ANALYSIS ..................................................................... 8
5. RESULTS................................................................................................................................ 12
5.1 DENSITY............................................................................................................................ 12
5.2 TOTAL NUMBER OF TAXA ................................................................................................. 12
5.2.1 Number of Mayfly, Stonefly, and Caddisfly Taxa ............................................... 14
5.2.2 Relative Abundance by Order............................................................................... 14
5.2.3 Intolerant Taxa Richness ...................................................................................... 15
5.2.4 Percentage of Tolerant Taxa ................................................................................. 15
5.2.5 Functional Feeding Group Composition............................................................... 15
5.2.6 Long-Lived Taxa Richness................................................................................... 16
5.2.7 Relative Abundance by Habit ............................................................................... 16
5.2.8 Modified Hilsenhoff Biotic Index......................................................................... 16
5.2.9 B-IBI ..................................................................................................................... 17
6. CONCLUSIONS..................................................................................................................... 18

Foster Creek Conservation District Screening Level Macroinvertebrate Assessment
R2 Resource Consultants, Inc. iv January 2003 1303.02/Macroinvertebrate.final_1/03
6.1 SAND CANYON CREEK ...................................................................................................... 18
6.2 DOUGLAS CREEK .............................................................................................................. 18
6.3 PINE CANYON CREEK........................................................................................................ 18
6.4 BLUE GRADE DRAW.......................................................................................................... 19
6.5 ROCK ISLAND CREEK ........................................................................................................ 19
6.6 FOSTER CREEK.................................................................................................................. 19
7. REFERENCES........................................................................................................................ 20

Foster Creek Conservation District Screening Level Macroinvertebrate Assessment
R2 Resource Consultants, Inc. v January 2003 1303.02/Macroinvertebrate.final_1/03
FIGURES Figure 1. Macroinvertebrate sampling locations in WRIA 44. ............................................. 4
Figure 2. Macroinvertebrate sampling locations in WRIA 50. ............................................. 5
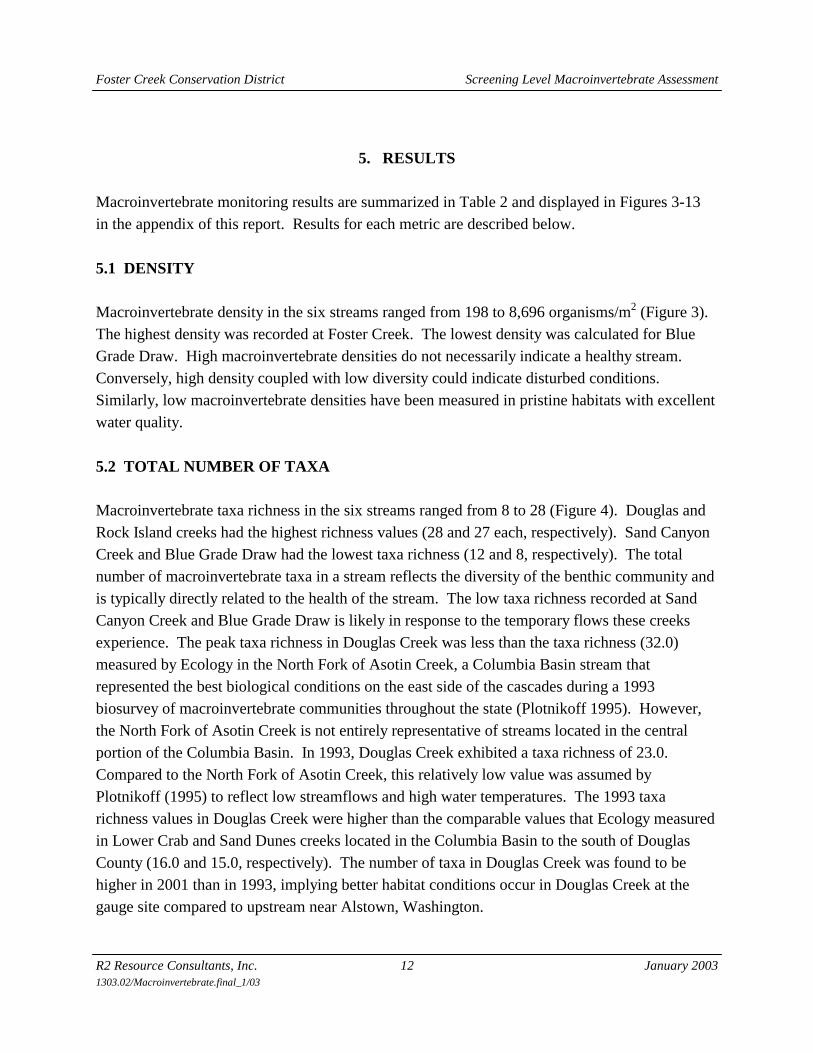
Figure 3. Macroinvertebrate density (#/m2) in six Columbia River tributaries located in WRIAs 44 and 50. ........................................................................................A-1
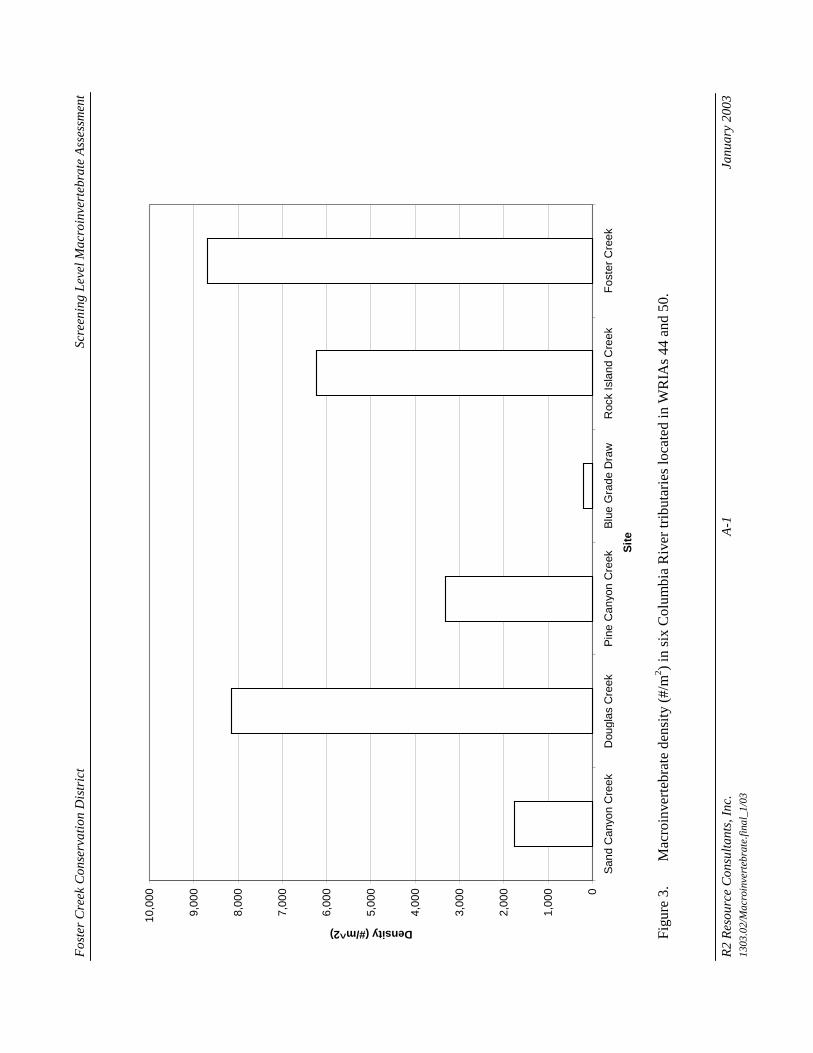
Figure 4. Macroinvertebrate taxa richness (# of taxa) in six Columbia River tributaries located in WRIAs 44 and 50............................................................A-2
Figure 5. Mayfly taxa richness (# of taxa) in six Columbia River tributaries located in WRIAs 44 and 50. ........................................................................................A-3
Figure 6. Stonefly taxa richness (# of taxa) in six Columbia River tributaries located in WRIAs 44 and 50. ........................................................................................A-4
Figure 7. Caddisfly taxa richness (# of taxa) in six Columbia River tributaries located in WRIAs 44 and 50. ........................................................................................A-5
Figure 8. Relative abundance (%) of major macroinvertebrate groups in six Columbia River tributaries located in WRIAs 44 and 50. ................................A-6
Figure 9. Intolerant macroinvertebrate taxa richness (# of taxa) in six Columbia River tributaries located in WRIAs 44 and 50..................................................A-7
Figure 10. Relative abundance (%) of tolerant macroinvertebrate taxa in six Columbia River tributaries located in WRIAs 44 and 50..................................................A-8
Figure 11. Relative abundance (%) of macroinvertebrate functional feeding groups in six Columbia River tributaries located in WRIAs 44 and 50. ..........................A-9
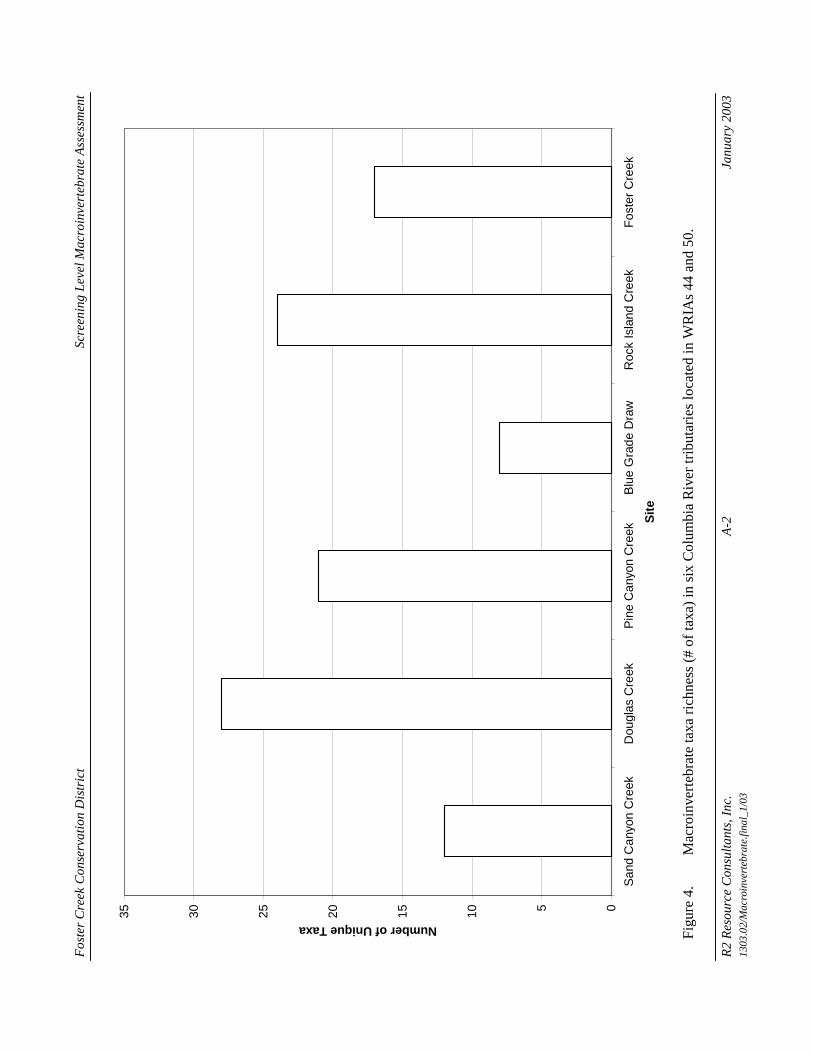
Figure 12. Relative abundance (%) of (# of taxa) long-lived macroinvertebrate taxa in six Columbia River tributaries located in WRIAs 44 and 50. ........................A-10
Figure 13. Relative abundance (%) of macroinvertebrate habits in six Columbia River tributaries located in WRIAs 44 and 50..........................................................A-11

Foster Creek Conservation District Screening Level Macroinvertebrate Assessment
R2 Resource Consultants, Inc. vi January 2003 1303.02/Macroinvertebrate.final_1/03
TABLES Table 1. Cumulative M-HBI scores and the corresponding evaluation of the degree
of organic enrichment. ........................................................................................ 10
Table 2. Summary of biometrics describing the late spring, 2001 macroinvertebrate communities in six streams in WRIAs 44 and 50............................................... 13
Table 3. Summary of B-IBI and M-HBI biometrics describing the late spring 2001 macroinvertebrate communities in six streams in WRIAs 44 and 50................. 17
Table B-1. Benthic macroinvertebrate sampling data for Sand Canyon Creek, 24 May 2001. ................................................................................................................. B-1
Table B-2. Benthic macroinvertebrate sampling data for Douglas Creek, 25 May 2001. . B-10
Table B-3. Benthic macroinvertebrate sampling data for Pine Canyon Creek, 23 May 2001. ............................................................................................................... B-19
Table B-4 Benthic macroinvertebrate sampling data for Blue Grade Draw, 24 May 2001. ............................................................................................................... B-28
Table B-5. Benthic macroinvertebrate sampling data for Rock Island Creek, 25 May 2001. ............................................................................................................... B-36
Table B-6. Benthic macroinvertebrate sampling data for Foster Creek, 23 May 2001. .... B-45

Foster Creek Conservation District Screening Level Macroinvertebrate Assessment
R2 Resource Consultants, Inc. 1 January 2003 1303.02/Macroinvertebrate.final_1/03
1. INTRODUCTION Benthic macroinvertebrates are one part of the stream health monitoring R2 Resource Consultants (R2) was contracted to perform for the Foster Creek Conservation District in spring 2001 under H.B. 2514 Watershed Analysis funding. Benthic macroinvertebrates offer many advantages when used to monitor stream health. Macroinvertebrate communities are diverse, abundant, easy to collect, sedentary, and have relatively short life spans of several months to a few years (Platts et al. 1983). These characteristics allow macroinvertebrate communities to reflect local conditions and the recent past, consequently making excellent indicators of proximate, acute impacts. They also represent an important food source for resident and anadromous fishes. The macroinvertebrate monitoring goal was to characterize the spring macroinvertebrate fauna in six potentially anadromous fish-bearing streams in Douglas County. The streams are tributaries to the Columbia River and may offer habitat for anadromous salmonid fishes during certain times of the year. Specific qualities of the macroinvertebrate community that were characterized are described below in the Macroinvertebrate Data Analysis section.

Foster Creek Conservation District Screening Level Macroinvertebrate Assessment
R2 Resource Consultants, Inc. 2 January 2003 1303.02/Macroinvertebrate.final_1/03
2. MACROINVERTEBRATE FIELD METHODS Sampling methods generally followed the Washington Department of Ecology’s (Ecology) protocols for benthic macroinvertebrates (Plotnikoff 1994). Three samples were collected from each of six streams (described below) using a D-frame kick-net sampler fitted with 500-micron (µm) Nitex mesh. All three samples were collected in riffles or shallow runs possessing coarse gravel to small cobble substrates. All samples were collected from areas possessing water depths between 0.0 and 1.0 ft deep, and mean water column velocities between 1.0 and 3.0 ft per second. Sample locations were randomly selected, although sampling was not conducted at a specific location unless depths and water velocities were within the suitable range specified above. Depths were measured with a wading rod and velocities were measured with a Swoffer current meter (Model 2100). Each sample was collected from an area of the stream bottom 1 ft wide (i.e., width of kick net) and 2 ft long (i.e., 2 ft2; 0.19 m2). The stream bottom was vigorously kicked for a period of one minute. Large substrates were scrubbed by hand to dislodge remaining organisms. Substrates were sampled to a depth of approximately 0.2 ft (6.0 cm). The contents of the kick-net were dumped into a 5-gallon bucket and the net was backflushed several times with river water to dislodge as many organisms as possible, with the rinsate collecting in the bucket. The contents of the bucket were swirled to entrain light particles. The entrained solution was then poured into a 500-micron mesh sieve. After rinsing, swirling, and pouring the contents of the bucket into the sieve three times, the heavier particles remaining in the bucket were examined and macroinvertebrates removed (e.g., snails and heavy-case caddisflies). The contents of the sieve were then emptied into a 16-oz, wide-mouth mason jar with a rubber spatula. The sieve was then rinsed with 86 percent ethyl alcohol and the rinsate was collected in the mason jar. Any invertebrates still clinging to the kicknet mesh were removed with fine point forceps or by hand and put into the mason jar. The depth, mean column velocity, and substrate composition of each sampling location were recorded in a field notebook. Water temperatures were also measured with a hand-held thermometer at the time of sampling. All three samples were preserved in separate wide-mouth mason jars to allow for independent statistical analysis. The samples were labeled (location, date of sampling, and sample identification number), and preserved with an 86 percent solution of ethyl alcohol.

Foster Creek Conservation District Screening Level Macroinvertebrate Assessment
R2 Resource Consultants, Inc. 3 January 2003 1303.02/Macroinvertebrate.final_1/03
2.1 SITE LOCATION/DESCRIPTION The six surveyed streams are located in WRIAs 44 and 50. Sample site locations are shown in Figures 1 and 2 and described below.
2.1.1 Sand Canyon Creek Samples were collected from riffle habitats in Sand Canyon Creek (approximate RM 0.1) downstream of a footbridge that serves a paved biking/walking trail. Riparian canopy is composed primarily of mature black cottonwood and willow trees. In the lower mile of Sand Canyon Creek, discharge during the late spring and summer period is entirely comprised of irrigation return flows consisting of water withdrawn from the Wenatchee River. This flow terminates annually in mid-October at the end of the irrigation season.
2.1.2 Douglas Creek Samples in Douglas Creek were collected from riffle habitats upstream of the bridge washout (approximate RM 23.0). The sampling site is located in a shallow canyon containing riparian vegetation dominated by reed canary grass. This reach of Douglas Creek experiences year-round streamflow and the water quality is generally regarded as good (see water quality report).
2.1.3 Pine Canyon Creek Samples were collected from riffle habitats in Pine Canyon Creek (approximate RM 4.5) approximately 100 feet downstream of a culvert running underneath Old Pine Canyon Road. The sampling site is well-shaded with black cottonwood and willow trees. Summer streamflow near RM 4.5 is low, but apparently small volumes of surface water flow year-round. The quality of the water is generally considered good (see water quality report).
2.1.4 Blue Grade Draw Samples were collected from riffle habitats in Blue Grade Draw near RM 0.3. The stream is well-shaded with black cottonwood and willow trees. During the late spring and summer, the lower half mile of Blue Grade Draw entirely comprised of irrigation return flows consisting of water withdrawn from the Wenatchee River. This flow terminates annually in mid-October at the end of the irrigation season.

Fig
ure
1.
Mac
roin
vert
ebra
te s
ampl
ing
loca
tions
in W
RIA
44.

Fig
ure
2.
Mac
roin
vert
ebra
te s
ampl
ing
loca
tions
in W
RIA
50.

Foster Creek Conservation District Screening Level Macroinvertebrate Assessment
R2 Resource Consultants, Inc. 6 January 2003 1303.02/Macroinvertebrate.final_1/03
2.1.5 Rock Island Creek Samples were collected from riffle habitats in Rock Island Creek (approximate RM 0.4) near the Chelan County PUD pumphouse. The channel was fairly well-shaded with willow and poplar trees and shrubs. Year-round flow at this location is supported from a spring-fed stream discharging to surface waters at RM 0.55. Since flow at RM 0.4 is dominated by groundwater, water temperatures are relatively cool, fine sediment levels are low and the water quality is very good (see water quality report).
2.1.6 Foster Creek Samples were collected from riffle habitats in Foster Creek (approximate RM 0.8) downstream of Foster Creek Dam. The channel contained sparse mature riparian vegetation. Water apparently flows all year near RM 0.8, although summer discharge can be low. Based on observations of substrate embeddedness, fine sediment levels in the creek are relatively high (see fish habitat report).

Foster Creek Conservation District Screening Level Macroinvertebrate Assessment
R2 Resource Consultants, Inc. 7 January 2003 1303.02/Macroinvertebrate.final_1/03
3. MACROINVERTEBRATE LABORATORY ANALYSIS Following the completion of invertebrate sampling, samples were transported to the laboratory for processing. Laboratory processing of the macroinvertebrate samples followed protocols described in Barbour et al. (1999) and consisted of: 1) large organic material not removed in the field was rinsed, visually inspected for invertebrates, and discarded; 2) contents from a single sample were then spread evenly over a gridded pan approximately 6 cm by 6 cm; and 3) squares within the gridded pan were randomly selected and invertebrates were removed from these squares until 300 organisms were encountered. In some cases, obtaining 300 organisms meant enumerating the entire sample. The encountered invertebrates were then identified using keys provided in Merritt and Cummins (1996), Pennak (1978), Stewart and Stark (1988), and Wiggins (1998). Most benthic macroinvertebrates were identified to the genus or species level using a zoom stereo microscope. Taxa representing the chironomids (midges), Turbellaria (flatworms), Aschelminthes (roundworms), Annelids (leeches and earthworms), Pelecypoda (clams and mussels), Isopoda (aquatic sowbugs), and Hydracarina (water mites) or immatures of some taxa were identified to the family or higher level. A voucher specimen of each identified taxon was preserved in a vial with a solution of 86 percent ethyl alcohol.

Foster Creek Conservation District Screening Level Macroinvertebrate Assessment
R2 Resource Consultants, Inc. 8 January 2003 1303.02/Macroinvertebrate.final_1/03
4. MACROINVERTEBRATE DATA ANALYSIS Following taxonomic identification and enumeration of each sample, the abundance of each taxonomic group was entered into a computer spreadsheet developed to calculate the key biotic metrics. The following metrics and biotic indices were calculated for each invertebrate sample that was analyzed. Density – Density is calculated as the number of individuals per unit area (i.e., m2). Density values could be estimated from the samples because they were obtained from a standardized collection area (0.19 m2). Taxa Richness – Taxa richness is the total number of macroinvertebrate taxa present in each sample. This metric generally increases with enhanced water quality and/or habitat diversity, and is used as a relative measurement of the health of the benthic invertebrate community. Mayfly, Stonefly, and Caddisfly (EPT) Taxa Richness – This metric describes the number of distinct taxa within the insect orders Ephemeroptera (mayflies), Plecoptera (stoneflies), and Trichoptera (caddisflies). These insect orders are relatively sensitive to habitat disturbance or water quality degradation and are important items in fish diets. Taxa richness values will be calculated separately for mayflies, stoneflies, and caddisflies because certain human disturbances can decrease the diversity of one order and not the others. The separate taxa richness values generally increase with improving water quality. Consequently, this indicator is widely used for overall stream health. Intolerant Taxa Richness – Intolerant taxa are known to be very sensitive to stream disturbance. The tolerance ratings were determined for each taxa based upon the Oregon Department of Environmental Quality’s tolerance classifications (Hafele and Mulvey 1998). Percent Tolerant Taxa – Percent tolerant taxa is the relative abundance of all invertebrates in a sample that is considered to be tolerant to disturbance. The tolerance ratings were determined for each taxonomic group based upon the Oregon Department of Environmental Quality’s tolerance classifications (Hafele and Mulvey 1998). Long-Lived Taxa Richness – Long-lived taxa are organisms that complete their immature life cycle in more than one year. Because they are long lived, they can be exposed to single, catastrophic events that occur infrequently (every one or more years) or to more regular, subtle
Foster Creek Conservation District Screening Level Macroinvertebrate Assessment
R2 Resource Consultants, Inc. 9 January 2003 1303.02/Macroinvertebrate.final_1/03
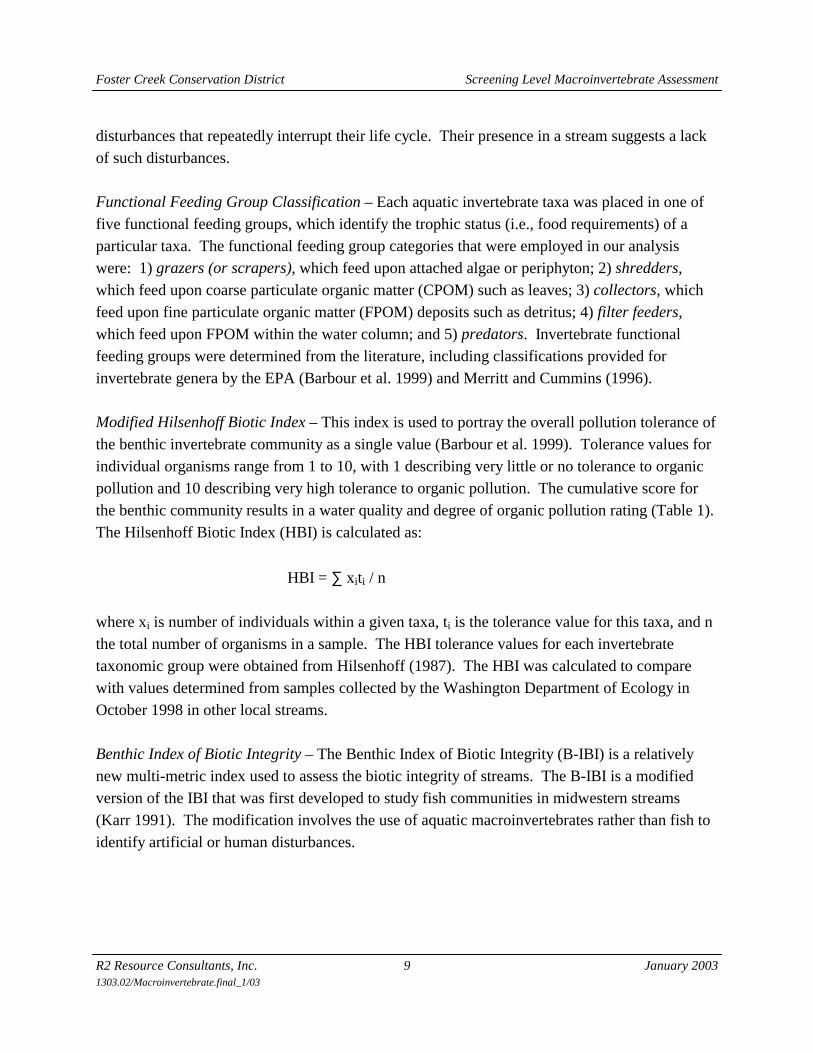
disturbances that repeatedly interrupt their life cycle. Their presence in a stream suggests a lack of such disturbances. Functional Feeding Group Classification – Each aquatic invertebrate taxa was placed in one of five functional feeding groups, which identify the trophic status (i.e., food requirements) of a particular taxa. The functional feeding group categories that were employed in our analysis were: 1) grazers (or scrapers), which feed upon attached algae or periphyton; 2) shredders, which feed upon coarse particulate organic matter (CPOM) such as leaves; 3) collectors, which feed upon fine particulate organic matter (FPOM) deposits such as detritus; 4) filter feeders, which feed upon FPOM within the water column; and 5) predators. Invertebrate functional feeding groups were determined from the literature, including classifications provided for invertebrate genera by the EPA (Barbour et al. 1999) and Merritt and Cummins (1996). Modified Hilsenhoff Biotic Index – This index is used to portray the overall pollution tolerance of the benthic invertebrate community as a single value (Barbour et al. 1999). Tolerance values for individual organisms range from 1 to 10, with 1 describing very little or no tolerance to organic pollution and 10 describing very high tolerance to organic pollution. The cumulative score for the benthic community results in a water quality and degree of organic pollution rating (Table 1). The Hilsenhoff Biotic Index (HBI) is calculated as:
HBI = ∑ xiti / n where xi is number of individuals within a given taxa, ti is the tolerance value for this taxa, and n the total number of organisms in a sample. The HBI tolerance values for each invertebrate taxonomic group were obtained from Hilsenhoff (1987). The HBI was calculated to compare with values determined from samples collected by the Washington Department of Ecology in October 1998 in other local streams. Benthic Index of Biotic Integrity – The Benthic Index of Biotic Integrity (B-IBI) is a relatively new multi-metric index used to assess the biotic integrity of streams. The B-IBI is a modified version of the IBI that was first developed to study fish communities in midwestern streams (Karr 1991). The modification involves the use of aquatic macroinvertebrates rather than fish to identify artificial or human disturbances.

Foster Creek Conservation District Screening Level Macroinvertebrate Assessment
R2 Resource Consultants, Inc. 10 January 2003 1303.02/Macroinvertebrate.final_1/03
Table 1. Cumulative M-HBI scores and the corresponding evaluation of the degree of organic enrichment.
Cumulative HBI Score Degree of Organic Pollution
0.00 to 3.50 No apparent organic pollution
3.51 to 4.50 Possible slight organic pollution
4.51 to 5.50 Some organic pollution
5.51 to 6.50 Fairly significant organic pollution
6.51 to 7.50 Significant organic pollution
7.51 to 8.50 Very significant organic pollution
8.51 to 10.00 Severe organic pollution
The B-IBI incorporates a number of metrics or attributes of the macroinvertebrate community that change in predictable ways in response to human disturbance. The metrics used in the calculation of the B-IBI were consistent with the metrics used by Ecology in their calculation of biotic integrity and included: 1) total taxa richness, 2) Ephemeroptera taxa richness, 3) Plecoptera taxa richness, 4) Trichoptera taxa richness, 5) intolerant taxa richness, 6) long-lived species taxa richness, 7) percentage of tolerant taxa, 8) percentage of predators, and 9) percentage of the three most numerically dominant taxa. Each metric in the B-IBI is given a score to reflect the level of disturbance that is detected by the metric (5 for minimal, 3 for moderate, and 1 for severe disturbance). Each metric score is summed to calculate the total B-IBI value. Ecology’s Ambient Biological Monitoring Program rates B-IBI scores as follows:
• 33 to 45 = natural biological conditions;
• 21 to 33 = slight impairment; and
• 0 to 21 = obvious impairment.
Multi-metric indexes like the B-IBI are believed to be better at detecting disturbances than single metric indexes (e.g., presence or absence of indicator species) because they use a number of biological attributes that integrate information from ecosystem, community, population, and individual levels (Barbour et al. 1995). Ecology completed macroinvertebrate monitoring previously in 1993 in Douglas Creek and other Columbia Basin drainages as part of a statewide biological assessment. Metrics examined by

Foster Creek Conservation District Screening Level Macroinvertebrate Assessment
R2 Resource Consultants, Inc. 11 January 2003 1303.02/Macroinvertebrate.final_1/03
Ecology that were common to this study included total taxa, and stonefly, mayfly, and caddisfly richness B-IBI. The 1993 data enable a comparison with these monitoring results. It should be noted the station sampled in 1993 on Douglas Creek was near Alstown, Washington. It is not directly comparable to the 2001 station located further downstream in the basin near the USGS and BLM gauging sites, as reported herein, due to differences in discharge, thermal regimes and overall habitat conditions.
Foster Creek Conservation District Screening Level Macroinvertebrate Assessment
R2 Resource Consultants, Inc. 12 January 2003 1303.02/Macroinvertebrate.final_1/03
5. RESULTS Macroinvertebrate monitoring results are summarized in Table 2 and displayed in Figures 3-13 in the appendix of this report. Results for each metric are described below.
5.1 DENSITY Macroinvertebrate density in the six streams ranged from 198 to 8,696 organisms/m2 (Figure 3). The highest density was recorded at Foster Creek. The lowest density was calculated for Blue Grade Draw. High macroinvertebrate densities do not necessarily indicate a healthy stream. Conversely, high density coupled with low diversity could indicate disturbed conditions. Similarly, low macroinvertebrate densities have been measured in pristine habitats with excellent water quality.
5.2 TOTAL NUMBER OF TAXA Macroinvertebrate taxa richness in the six streams ranged from 8 to 28 (Figure 4). Douglas and Rock Island creeks had the highest richness values (28 and 27 each, respectively). Sand Canyon Creek and Blue Grade Draw had the lowest taxa richness (12 and 8, respectively). The total number of macroinvertebrate taxa in a stream reflects the diversity of the benthic community and is typically directly related to the health of the stream. The low taxa richness recorded at Sand Canyon Creek and Blue Grade Draw is likely in response to the temporary flows these creeks experience. The peak taxa richness in Douglas Creek was less than the taxa richness (32.0) measured by Ecology in the North Fork of Asotin Creek, a Columbia Basin stream that represented the best biological conditions on the east side of the cascades during a 1993 biosurvey of macroinvertebrate communities throughout the state (Plotnikoff 1995). However, the North Fork of Asotin Creek is not entirely representative of streams located in the central portion of the Columbia Basin. In 1993, Douglas Creek exhibited a taxa richness of 23.0. Compared to the North Fork of Asotin Creek, this relatively low value was assumed by Plotnikoff (1995) to reflect low streamflows and high water temperatures. The 1993 taxa richness values in Douglas Creek were higher than the comparable values that Ecology measured in Lower Crab and Sand Dunes creeks located in the Columbia Basin to the south of Douglas County (16.0 and 15.0, respectively). The number of taxa in Douglas Creek was found to be higher in 2001 than in 1993, implying better habitat conditions occur in Douglas Creek at the gauge site compared to upstream near Alstown, Washington.

Fos
ter
Cre
ek C
onse
rvat
ion
Dis
tric
t Sc
reen
ing
Lev
el M
acro
inve
rteb
rate
Ass
essm
ent
R2
Res
ourc
e C
onsu
ltan
ts, I
nc.
13
Janu
ary
2003
13
03.0
2/M
acro
inve
rteb
rate
.fina
l_1/
03
Tab
le 2
. Su
mm
ary
of b
iom
etri
cs d
escr
ibin
g th
e la
te s
prin
g, 2
001
mac
roin
vert
ebra
te c
omm
unit
ies
in s
ix s
trea
ms
in W
RIA
s 44
and
50.
Site
D
ensi
ty
(#/s
q-m
) T
axa
Ric
hnes
s M
ayfl
y R
ichn
ess
Ston
efly
Ric
hnes
s C
addi
sfly
R
ichn
ess
EP
T T
axa
Ric
hnes
s T
oler
ant T
axa
(%)
Into
lera
nt T
axa
Ric
hnes
s
Lon
g-L
ive d
T
axa
Ric
hnes
s Sa
nd C
anyo
n 17
55
12
2 0
1 3
33.3
1
0 D
ougl
as
8152
28
6
1 7
14
32.1
2
6 P
ine
Can
yon
3309
22
4
2 5
11
27.3
2
3 B
lue
Gra
de D
raw
19
8 8
0 0
0 0
25.0
0
0 R
ock
Isla
nd
6233
27
4
2 5
11
22.2
2
3 Fo
ster
86
96
17
2 0
3 5
41.2
1
1 Si
te
Col
lect
ors
(%)
Gra
zers
(%
) Sh
redd
ers
(%)
Filte
r Fe
eder
s (%
) P
reda
tors
(%
) U
nkno
wn
(%)
Sa
nd C
anyo
n 23
.9
0.0
0.0
1.2
0.7
74.3
Dou
glas
82
.4
4.0
0.1
8.6
1.2
3.8
P
ine
Can
yon
60.0
11
.6
0.5
12.5
6.
6 8.
7
Blu
e G
rade
Dra
w
22.1
2.
7 0.
0 12
.4
26.5
36
.3
R
ock
Isla
nd
55.1
0.
5 0.
0 1.
4 2.
8 40
.2
Fo
ster
39
.2
0.1
0.4
0.4
1.3
58.6
Site
M
ayfl
ies
(%)
Ston
eflie
s (%
) C
addi
sflie
s (%
) D
amse
lflie
s (%
) B
eetle
s (%
) T
rue
Flie
s (%
) M
oths
(%
) N
on-I
nsec
ts (
%)
Sand
Can
yon
20.4
0.
0 0.
4 0.
0 0.
5 75
.6
0.0
3.1
D
ougl
as
54.1
0.
1 9.
6 0.
9 31
.4
3.6
0.0
0.3
P
ine
Can
yon
44.7
6.
8 22
.7
0.0
8.7
8.1
0.0
8.2
B
lue
Gra
de D
raw
0.
0 0.
0 0.
0 0.
0 26
.5
44.2
0.
0 29
.2
R
ock
Isla
nd
44.8
0.
6 1.
8 0.
1 8.
6 37
.6
0.0
2.4
Fo
ster
8.
1 0.
0 0.
8 0.
4 17
.1
59.2
0.
0 14
.5
Si
te
Bur
row
ers
(%)
Clim
bers
(%
) C
linge
rs (
%)
Ska
ters
(%
) S
praw
lers
(%
) Sw
imm
ers
(%)
Unk
now
n
Sa
nd C
anyo
n 72
.3
0.4
6.6
0.0
0.2
20.4
0.
1
D
ougl
as
1.2
0.0
44.8
0.
0 0.
4 52
.2
1.3
Pin
e C
anyo
n 2.
4 0.
0 54
.6
0.0
0.6
41.5
0.
9
B
lue
Gra
de D
raw
57
.5
26.5
15
.9
0.0
0.0
0.0
0.0
Roc
k Is
land
34
.1
0.6
13.8
0.
0 0.
9 46
.3
4.2
Fost
er
49.7
1.
0 17
.3
0.0
9.9
21.9
0.
4

Foster Creek Conservation District Screening Level Macroinvertebrate Assessment
R2 Resource Consultants, Inc. 14 January 2003 1303.02/Macroinvertebrate.final_1/03
5.2.1 Number of Mayfly, Stonefly, and Caddisfly Taxa The number of mayfly taxa in the streams ranged from 0 to 6 (Figure 5). Douglas, Pine Canyon and Rock Island creeks had the highest mayfly richness value (6, 4, and 4 respectively) compared to the other streams. Blue Grade Draw, Sand Canyon, and Foster creeks had the lowest mayfly taxa richness values (0 and 2 each, respectively). Mayfly taxa richness at the reference station in the North Fork of Asotin Creek in 1993 was 5.0, indicating that habitat conditions in Douglas, Pine Canyon and Rock Island creeks may be benefiting the mayfly community. Stoneflies were the rarest of the three insect orders. Taxa richness values ranged from 0 to 2 (Figure 6). Pine Canyon and Rock Island creeks had the highest number of stonefly taxa, while no stoneflies were identified in Blue Grade Draw or Sand Canyon and Foster creeks. The number of stonefly taxa recorded in the North Fork of Asotin Creek in 1993 was 5.0. Thus, the low number of stonefly taxa identified during this monitoring indicates some kind of habitat disturbance or unsuitable water quality. Stoneflies are typically cold water organisms and the warmwater temperatures recorded in Foster and Sand Canyon creeks and Blue Grade Draw probably explain their absence in these systems. The immature life stages of stoneflies also have longer life cycles, so Sand Canyon Creek and Blue Grade Draw probably do not offer enough permanent habitat for stonefly production. Caddisflies were relatively common in each stream and taxa richness values ranged from 0 to 7 (Figure 7). Peak caddisfly richness was recorded in Douglas Creek, closely followed by Pine Canyon and Rock Island creeks. The lowest caddisfly richness was measured in Blue Grade Draw and Sand Canyon creeks. Caddisfly richness in the North Fork of Asotin Creek in 1993 was 8.0. This finding suggests some streams in this study were approaching good, reference habitat conditions, while others had low caddisfly diversity. The low values in the study streams probably resulted from some type of stream disturbance or unstable habitat conditions.
5.2.2 Relative Abundance by Order The major groups of macroinvertebrates were represented in most of the streams (Figure 8). Douglas Creek was dominated by mayflies (54 %), but also included beetles (31 %), caddisflies (10 %), true flies (4 %), non-insect taxa (0.3 %), and stoneflies (0.1 %). Pine Canyon and Rock Island creeks were also dominated by mayflies and contained the same major groups of macroinvertebrates as Douglas Creek, but the taxa were more evenly distributed among the groups. Relative abundances in Pine Canyon Creek for all of the major groups ranged from 7 to 45 percent, while in Rock Island Creek, percentages ranged from 0.1-45 percent. Cool water

Foster Creek Conservation District Screening Level Macroinvertebrate Assessment
R2 Resource Consultants, Inc. 15 January 2003 1303.02/Macroinvertebrate.final_1/03
temperatures in Rock Island and Pine Canyon creeks may explain the more even distribution compared to Douglas Creek. Foster Creek was dominated by true flies (59 %), but also contained beetles (17%), non-insect taxa (15 %), mayflies (8 %), and caddisflies (0.8 %). The dominant order in Sand Canyon Creek was true flies (76 %), followed in relative abundance by mayflies (20 %). Blue Grade Draw was comprised of only three groups of macroinvertebrates; true flies (44 %), non-insect taxa (29 %), and beetles (27 %). The dominance of mayflies, true flies, and non-insect taxa in Blue Grade Draw and Sand Canyon Creek reflects the short life cycles and other adaptations these groups have to take advantage of temporary habitats. A wide variety of macroinvertebrate group representatives indicates a number of different permanent microhabitats are available in a particular riffle.
5.2.3 Intolerant Taxa Richness Intolerant taxa are those most sensitive to water quality degradation or habitat disturbances. The presence of intolerant taxa indicates good water quality and natural, undisturbed habitat. The number of intolerant (sensitive) taxa in each stream was generally low (0-2 taxa) (Figure 9). Blue Grade Draw had the lowest and Douglas, Pine Canyon, and Rock Island creeks had the highest number of intolerant taxa compared to the other study streams. The peak numbers of intolerant taxa recorded are likely a response to the permanent flow and stable temperature regime that these spring-fed streams experience.
5.2.4 Percentage of Tolerant Taxa The percentage of tolerant taxa in the six streams ranged from 22 to 41 percent (Figure 10). Foster Creek had the highest relative abundance of tolerant taxa (41%). Tolerant taxa percentages at the other five creeks were similar (22-33%). Blue Grade Draw and Rock Island creeks had the lowest relative abundance of tolerant taxa. The presence of tolerant taxa is not necessarily indicative of unhealthy streams, as tolerant taxa can be present under undisturbed, as well as disturbed conditions. However, coupled with the results of other metrics, a high percentage of tolerant taxa may reflect some degree of habitat or water quality disturbance.
5.2.5 Functional Feeding Group Composition Collector-gatherers were the most common functional feeding group (Figure 11). It is possible that dead organic matter that typically accumulates over the fall and winter in response to leaf fall and macrophyte senescence supplied the food source that contributed to high collector-gatherer productivity. Collector-gatherers generally comprised more than 50 percent of the

Foster Creek Conservation District Screening Level Macroinvertebrate Assessment
R2 Resource Consultants, Inc. 16 January 2003 1303.02/Macroinvertebrate.final_1/03
fauna in the naturally flowing streams but less than 25 percent in Sand Canyon Creek and Blue Grade Draw. However, a large percentage of the fauna in some streams had an unknown functional group classification because chironomids comprised a substantial percentage of the fauna. In this study, chironomids were not identified to the taxonomic level that allowed an accurate identification of functional group classification. If the functional classifications of the chironomids were known, the relative abundance of collector-gatherers in the natural and temporary streams might be more similar.
5.2.6 Long-Lived Taxa Richness The number of long-lived taxa in the six streams ranged from 0 taxa in Sand Canyon Creek and Blue Grade Draw to 6 taxa in Douglas Creek (Figure 12). Pine Canyon and Rock Island creeks contained 3 long-lived taxa, and Foster Creek only 1. These data indicate that Sand Canyon, Blue Grade Draw and Foster Creek are receiving some level of periodic disturbance and that habitat conditions in the other creeks are more stable, particularly in Douglas Creek.
5.2.7 Relative Abundance by Habit Burrowers, swimmers, and clingers were the most common habits employed by the macroinvertebrates in the six streams (Figure 13). Burrowers were most common in Sand Canyon, Blue Grade Canyon, and Foster creeks, while swimmers and clingers dominated the benthic community in the other streams. Burrower dominance in the temporary streams is probably an adaptation to flow cessation. Organisms that are able to burrow into the damp substrate or hyporheic zone avoid desiccation when flows cease. The high relative abundance of clingers in most of the natural streams suggests good habitat conditions and minimal influence from inputs of fine sediments. Inputs of fine sediment tend to fill the small spaces and pores between rocks, where clingers typically reside. Swimmers can be found in a variety of habitats and have a high propensity to drift. These characteristics make their presence in macroinvertebrate samples quite common.
5.2.8 Modified Hilsenhoff Biotic Index Pine Canyon had the lowest M-HBI value of the six creeks surveyed in 2001, measuring 4.0 (Table 2). The modified HBI value was similar for Foster Creek (4.4). These values are categorized as sites that exhibit the potential for slight organic pollution. Rock Island, Sand Canyon, and Douglas creeks had the higher values measuring between 5.0 and 5.2 indicating

Foster Creek Conservation District Screening Level Macroinvertebrate Assessment
R2 Resource Consultants, Inc. 17 January 2003 1303.02/Macroinvertebrate.final_1/03
some organic pollution. Fairly significant organic pollution is indicated by an M-HBI value of 5.9 in Blue Grade Draw.
5.2.9 B-IBI B-IBI values for the six streams surveyed ranged from a high of 31 at Pine Canyon Creek to a low of 15 at Sand Canyon and Blue Grade Draw (Table 2). Rock Island, Douglas, and Foster creeks exhibited B-IBI scores in between these ranges. The scores indicate that Douglas, Pine Canyon and Rock Island creeks are slightly impaired compared to natural biological conditions, while Sand Canyon, Blue Grade Draw and Foster creeks exhibit obvious impairment of natural biological conditions.
Table 3. Summary of B-IBI and M-HBI biometrics describing the late spring 2001 macroinvertebrate communities in six streams in WRIAs 44 and 50.
Site B-IBI Score Impairment M-HBI
Organic Enrichment
Rating
Sand Canyon Creek 15 Obvious 5.2 Some
Douglas Creek 29 Slight 5.0 Some
Pine Canyon Creek 31 Slight 4.0 Possible Slight
Blue Grade Draw 15 Obvious 5.9 Fairly Significant
Rock Island Creek 27 Slight 5.0 Some
Foster Creek 19 Obvious 4.4 Possible Slight

Foster Creek Conservation District Screening Level Macroinvertebrate Assessment
R2 Resource Consultants, Inc. 18 January 2003 1303.02/Macroinvertebrate.final_1/03
6. CONCLUSIONS
Late-spring monitoring of macroinvertebrate communities in six streams with potential access for anadromous fish species in WRIAs 44 and 50 suggest a wide range of habitat conditions exist between the streams. The data indicate that Sand Canyon Creek and Blue Grade Draw contain a low density and diversity of macroinvertebrates and that the fauna is comprised entirely of short-lived taxa. The majority of the taxa exhibit burrowing habits that allow them to survive in temporary habitats when streamflows cease. The macroinvertebrate community in the other four naturally flowing streams was more abundant and diverse and more evenly represented by various macroinvertebrate groups. Furthermore, the macroinvertebrate fauna was comprised of short and long-lived taxa with varying habits. The macroinvertebrate community in each stream primarily consisted of collector-gatherers, which reflected the seasonal availability of food resources and an abundance of fine particulate organic matter (FPOM). The data imply relatively good water quality and habitat conditions occur in perennial reaches of Douglas, Pine Canyon, and Rock Island creeks. Habitat seems to be relatively degraded in Foster Creek and substantially impaired in Sand Canyon Creek and Blue Grade Draw. 6.1 SAND CANYON CREEK Sand Canyon Creek contained the second-lowest density of macroinvertebrates and second-lowest number of total, EPT, and intolerant taxa of the six streams. Short-lived true flies and mayflies dominated the fauna. The data imply temporary seasonal irrigation return flows do not provide for diverse and robust macroinvertebrate communities in WRIA 44. 6.2 DOUGLAS CREEK Douglas Creek had the highest number of total and EPT taxa, the second highest B-IBI score, and the second highest macroinvertebrate density. The number of intolerant taxa was relatively high and mayflies dominated the fauna. Douglas Creek had the highest relative abundance of long-lived taxa of all six streams. Warm water temperatures may be depressing stonefly taxa richness. The macroinvertebrate community suggests that overall water quality, productivity, and flow conditions in Douglas Creek are good relative to the other five streams. 6.3 PINE CANYON CREEK Although Pine Canyon Creek had the lowest macroinvertebrate density of the four naturally flowing streams, it possessed the highest B-IBI score. Pine Canyon Creek contained moderate

Foster Creek Conservation District Screening Level Macroinvertebrate Assessment
R2 Resource Consultants, Inc. 19 January 2003 1303.02/Macroinvertebrate.final_1/03
density and taxa richness. Mayflies dominated the macroinvertebrate fauna, but all major groups were well represented. The high relative abundance of clinger taxa indicates little influence of fine sediment deposition in Pine Canyon Creek. The macroinvertebrate data suggest habitat and water quality conditions in Pine Canyon Creek are good relative to the other five streams. 6.4 BLUE GRADE DRAW Blue Grade Draw contained the lowest density of macroinvertebrates and lowest number of total, EPT, and intolerant taxa and the lowest B-IBI scores of the six streams. The fauna was primarily comprised of short-lived true flies and mayflies. The data imply temporary seasonal irrigation return flows do not provide for diverse and robust macroinvertebrate communities in WRIA 44. 6.5 ROCK ISLAND CREEK Rock Island Creek had a relatively high density of macroinvertebrates and the second highest taxa richness and EPT taxa richness values, although stonefly taxa richness was relatively high. The number of intolerant taxa was the highest of the naturally flowing streams. Mayflies dominated the macroinvertebrate fauna. The biological signal from the macroinvertebrate data suggests cool water temperatures, low sediment levels, stable flow regimes, and relatively good water quality prevail in Rock Island Creek, characteristic of a spring-fed system. 6.6 FOSTER CREEK Foster Creek had the highest macroinvertebrate density of the four naturally flowing streams but the lowest total and EPT richness values. Furthermore, stoneflies were absent from Foster Creek. The number of intolerant taxa was the second-lowest and the relative abundance of tolerant taxa was the highest of the natural streams. True flies and burrowers dominated the macroinvertebrate community. The high density, but low diversity macroinvertebrate community indicates some level of stream disturbance that may be related to warm water temperatures, fine sediment accumulations, low streamflows, organic enrichment, or other water quality problems. The high relative abundance of burrowers suggest a routine, chronic disturbance.

Foster Creek Conservation District Screening Level Macroinvertebrate Assessment
R2 Resource Consultants, Inc. 20 January 2003 1303.02/Macroinvertebrate.final_1/03
7. REFERENCES Cummins, K.W. and R.W. Merritt. 1996. Ecology and distribution of aquatic insects. Pages 74-
86 in Merritt and Cummins (editors). An introduction to the aquatic insects of North America, third edition. Kendall/Hunt Publishing Company, Dubuque, IA.
Hafele, R., and M. Mulvey. 1998. Stream macroinvertebrate protocol. Oregon plan for salmon and watersheds. March draft. Oregon Dept. of Environmental Quality, DEQ Laboratory, Portland, OR.
Merritt, R.W. and K.W. Cummins. 1996. An introduction to the aquatic insects of North America. Third edition. Kendall/Hunt Publishing Company, Dubuque, IA.
Pennak, R.W. 1989. Freshwater invertebrates of the United States. Third edition. John Wiley & Sons, Inc. New York, NY.
Platts, W.S., W.F. Megahan, and G.W. Minshall. 1983. Methods for evaluating stream, riparian, and biotic conditions. U.S. Department of Agriculture, U.S. Forest Service, Ogden, UT. General technical report INT-138.
Plotnikoff, R.W. 1994. Instream biological assessment monitoring protocols: benthic macroinvertebrates. Publication #94-113, Washington Department of Ecology, Olympia, WA.
Plotnikoff, R.W. 1995. Ambient monitoring instream biological assessment: Progress report of 1993 pilot survey. Publication #95-333, Washington Department of Ecology, Olympia, WA.
Stewart, K.W. and B.P. Stark. 1993. Nymphs of North American stonefly genera (Plecoptera). University of North Texas Press, Denton, TX.
Wiggins, G.B. 1998. Larvae of the North American caddisfly genera (Trichoptera). Second edition. University of Toronto Press, Buffalo, NY.

R2 Resource Consultants, Inc. January 2003 1303.02/Macroinvertebrate.final_1/03
APPENDIX A
FIGURES
Fos
ter
Cre
ek C
onse
rvat
ion
Dis
tric
t Sc
reen
ing
Lev
el M
acro
inve
rteb
rate
Ass
essm
ent
R2
Res
ourc
e C
onsu
ltan
ts, I
nc.
A-1
Ja
nuar
y 20
03
1303
.02/
Mac
roin
vert
ebra
te.fi
nal_
1/03
Fig
ure
3.
Mac
roin
vert
ebra
te d
ensi
ty (
#/m
2 ) in
six
Col
umbi
a R
iver
trib
utar
ies
loca
ted
in W
RIA
s 44
and
50.
0
1,00
0
2,00
0
3,00
0
4,00
0
5,00
0
6,00
0
7,00
0
8,00
0
9,00
0
10,0
00
San
d C
anyo
n C
reek
Dou
glas
Cre
ekP
ine
Can
yon
Cre
ekB
lue
Gra
de D
raw
Roc
k Is
land
Cre
ekF
oste
r C
reek
Sit
e
Density (#/m^2)
Fos
ter
Cre
ek C
onse
rvat
ion
Dis
tric
t Sc
reen
ing
Lev
el M
acro
inve
rteb
rate
Ass
essm
ent
R2
Res
ourc
e C
onsu
ltan
ts, I
nc.
A-2
Ja
nuar
y 20
03
1303
.02/
Mac
roin
vert
ebra
te.fi
nal_
1/03
Figu
re 4
. M
acro
inve
rteb
rate
taxa
ric
hnes
s (#
of
taxa
) in
six
Col
umbi
a R
iver
trib
utar
ies
loca
ted
in W
RIA
s 44
and
50.
05101520253035
San
d C
anyo
n C
reek
Dou
glas
Cre
ekP
ine
Can
yon
Cre
ekB
lue
Gra
de D
raw
Roc
k Is
land
Cre
ekF
oste
r C
reek
Sit
e
Number of Unique Taxa

Fos
ter
Cre
ek C
onse
rvat
ion
Dis
tric
t Sc
reen
ing
Lev
el M
acro
inve
rteb
rate
Ass
essm
ent
R2
Res
ourc
e C
onsu
ltan
ts, I
nc.
A-3
Ja
nuar
y 20
03
1303
.02/
Mac
roin
vert
ebra
te.fi
nal_
1/03
Figu
re 5
. M
ayfl
y ta
xa r
ichn
ess
(# o
f ta
xa)
in s
ix C
olum
bia
Riv
er tr
ibut
arie
s lo
cate
d in
WR
IAs
44 a
nd 5
0.
012345678
San
d C
anyo
n C
reek
Dou
glas
Cre
ekP
ine
Can
yon
Cre
ekB
lue
Gra
de D
raw
Roc
k Is
land
Cre
ekF
oste
r C
reek
Sit
e
Number of Unique Taxa

Fos
ter
Cre
ek C
onse
rvat
ion
Dis
tric
t Sc
reen
ing
Lev
el M
acro
inve
rteb
rate
Ass
essm
ent
R2
Res
ourc
e C
onsu
ltan
ts, I
nc.
A-4
Ja
nuar
y 20
03
1303
.02/
Mac
roin
vert
ebra
te.fi
nal_
1/03
Figu
re 6
. St
onef
ly ta
xa r
ichn
ess
(# o
f ta
xa)
in s
ix C
olum
bia
Riv
er tr
ibut
arie
s lo
cate
d in
WR
IAs
44 a
nd 5
0.
012345678
San
d C
anyo
n C
reek
Dou
glas
Cre
ekP
ine
Can
yon
Cre
ekB
lue
Gra
de D
raw
Roc
k Is
land
Cre
ekF
oste
r C
reek
Sit
e
Number of Unique Taxa

Fos
ter
Cre
ek C
onse
rvat
ion
Dis
tric
t Sc
reen
ing
Lev
el M
acro
inve
rteb
rate
Ass
essm
ent
R2
Res
ourc
e C
onsu
ltan
ts, I
nc.
A-5
Ja
nuar
y 20
03
1303
.02/
Mac
roin
vert
ebra
te.fi
nal_
1/03
Figu
re 7
. C
addi
sfly
taxa
ric
hnes
s (#
of
taxa
) in
six
Col
umbi
a R
iver
trib
utar
ies
loca
ted
in W
RIA
s 44
and
50.
012345678
San
d C
anyo
n C
reek
Dou
glas
Cre
ekP
ine
Can
yon
Cre
ekB
lue
Gra
de D
raw
Roc
k Is
land
Cre
ekF
oste
r C
reek
Sit
e
Mean Number of Unique Taxa

Fos
ter
Cre
ek C
onse
rvat
ion
Dis
tric
t Sc
reen
ing
Lev
el M
acro
inve
rteb
rate
Ass
essm
ent
R2
Res
ourc
e C
onsu
ltan
ts, I
nc.
A-6
Ja
nuar
y 20
03
1303
.02/
Mac
roin
vert
ebra
te.fi
nal_
1/03
Figu
re 8
. R
elat
ive
abun
danc
e (%
) of
maj
or m
acro
inve
rteb
rate
gro
ups
in s
ix C
olum
bia
Riv
er tr
ibut
arie
s lo
cate
d in
WR
IAs
44 a
nd 5
0.
0%20%
40%
60%
80%
100%
San
d C
anyo
n C
reek
Dou
glas
Cre
ekP
ine
Can
yon
Cre
ekB
lue
Gra
de D
raw
Roc
k Is
land
Cre
ekF
oste
r C
reek
Sit
e
Abundance (%)
May
flies
Dam
selfi
les
Sto
ne F
lies
Cad
disf
lies
Bee
tles
Tru
e F
lies
Non
-Ins
ects

Fos
ter
Cre
ek C
onse
rvat
ion
Dis
tric
t Sc
reen
ing
Lev
el M
acro
inve
rteb
rate
Ass
essm
ent
R2
Res
ourc
e C
onsu
ltan
ts, I
nc.
A-7
Ja
nuar
y 20
03
1303
.02/
Mac
roin
vert
ebra
te.fi
nal_
1/03
Figu
re 9
. In
tole
rant
mac
roin
vert
ebra
te ta
xa r
ichn
ess
(# o
f ta
xa)
in s
ix C
olum
bia
Riv
er tr
ibut
arie
s lo
cate
d in
WR
IAs
44 a
nd 5
0.
0
0.51
1.52
2.53
3.54
San
d C
anyo
n C
reek
Dou
glas
Cre
ekP
ine
Can
yon
Cre
ekB
lue
Gra
de D
raw
Roc
k Is
land
Cre
ekF
oste
r C
reek
Sit
e
Number of UniqueTaxa

Fos
ter
Cre
ek C
onse
rvat
ion
Dis
tric
t Sc
reen
ing
Lev
el M
acro
inve
rteb
rate
Ass
essm
ent
R2
Res
ourc
e C
onsu
ltan
ts, I
nc.
A-8
Ja
nuar
y 20
03
1303
.02/
Mac
roin
vert
ebra
te.fi
nal_
1/03
Figu
re 1
0.
Rel
ativ
e ab
unda
nce
(%)
of to
lera
nt m
acro
inve
rteb
rate
taxa
in s
ix C
olum
bia
Riv
er tr
ibut
arie
s lo
cate
d in
WR
IAs
44 a
nd 5
0.
0102030405060708090100
San
d C
anyo
n C
reek
Dou
glas
Cre
ekP
ine
Can
yon
Cre
ekB
lue
Gra
de D
raw
Roc
k Is
land
Cre
ekF
oste
r C
reek
Sit
e
Abundance (%)

Fos
ter
Cre
ek C
onse
rvat
ion
Dis
tric
t Sc
reen
ing
Lev
el M
acro
inve
rteb
rate
Ass
essm
ent
R2
Res
ourc
e C
onsu
ltan
ts, I
nc.
A-9
Ja
nuar
y 20
03
1303
.02/
Mac
roin
vert
ebra
te.fi
nal_
1/03
Fig
ure
11.
Rel
ativ
e ab
unda
nce
(%)
of m
acro
inve
rteb
rate
fun
ctio
nal f
eedi
ng g
roup
s in
six
Col
umbi
a R
iver
trib
utar
ies
loca
ted
in W
RIA
s 44
and
50.
0%20%
40%
60%
80%
100%
San
d C
anyo
n C
reek
Dou
glas
Cre
ekP
ine
Can
yon
Cre
ekB
lue
Gra
de D
raw
Roc
k Is
land
Cre
ekF
oste
r C
reek
Sit
e
Abundance (%)
Col
lect
ors
Gra
zers
Shr
edde
rsF
ilter
Fee
ders
Pre
dato
rsU
nkno
wn
Fos
ter
Cre
ek C
onse
rvat
ion
Dis
tric
t Sc
reen
ing
Lev
el M
acro
inve
rteb
rate
Ass
essm
ent
R2
Res
ourc
e C
onsu
ltan
ts, I
nc.
A-1
0 Ja
nuar
y 20
03
1303
.02/
Mac
roin
vert
ebra
te.fi
nal_
1/03
Figu
re 1
2.
Lon
g-li
ved
taxa
ric
hnes
s (#
of
taxa
) in
six
Col
umbi
a R
iver
trib
utar
ies
loca
ted
in W
RIA
s 44
and
50.
012345678910
San
d C
anyo
n C
reek
Dou
glas
Cre
ekP
ine
Can
yon
Cre
ekB
lue
Gra
de D
raw
Roc
k Is
land
Cre
ekF
oste
r C
reek
Sit
e
Number of UniqueTaxa

Fos
ter
Cre
ek C
onse
rvat
ion
Dis
tric
t Sc
reen
ing
Lev
el M
acro
inve
rteb
rate
Ass
essm
ent
R2
Res
ourc
e C
onsu
ltan
ts, I
nc.
A-1
1 Ja
nuar
y 20
03
1303
.02/
Mac
roin
vert
ebra
te.fi
nal_
1/03
Figu
re 1
3.
Rel
ativ
e ab
unda
nce
(%)
of m
acro
inve
rteb
rate
hab
its
in s
ix C
olum
bia
Riv
er tr
ibut
arie
s lo
cate
d in
WR
IAs
44 a
nd 5
0.
0%20%
40%
60%
80%
100%
San
d C
anyo
n C
reek
Dou
glas
Cre
ekP
ine
Can
yon
Cre
ekB
lue
Gra
de D
raw
Roc
k Is
land
Cre
ekF
oste
r C
reek
Sit
e
Abundance (%)
Bur
row
ers
Clim
bers
Clin
gers
Ska
ters
Spr
awle
rsS
wim
mer
s

R2 Resource Consultants, Inc. January 2003 1303.02/Macroinvertebrate.final_1/03
APPENDIX B
TABLES

Foster Creek Conservation District Screening Level Macroinvertebrate Assessment
R2 Resource Consultants, Inc. B-1 January 2003 1303.02/Macroinvertebrate.final_1/03
Table B-1. Benthic macroinvertebrate sampling data for Sand Canyon Creek, 24 May 2001.
ABUNDANCE
Taxonomic Group Sample
1 Sample
2 Sample
3 Sample
4 Sample
5 Mean
Abundance Standard
Error EPHEMEROPTERA (mayflies) Baetidae Acentrella insignificans - - Baetis bicaudatus 0 1 0 0.3 0.3 Baetis tricaudatus 56 90 58 67.8 10.9 Baetis sp. - - Immature - - Caenidae Caenis - - Ephemerellidae Attenella margarita - -
Caudatella edmundsi - - Drunella spinifera - - Drunella sp. - - Ephemerella - - Serratella - - Immature - - Heptageniidae Cinygmula - - Epeorus - - Heptagenia/Leucrocuta/Nixe - - Leucrocuta - - Nixe simplicoides - - Rhithrogena - - Stenonema - - Immature - - Leptophlebiidae Paraleptophlebia bicornata - - Paraleptophlebia temporalis - - Immature - - Siphlonuridae Ameletus - - Tricorythidae Tricorythodes - - ODONATA (dragonflies) Anisoptera Aeshnidae - - Gomphidae - -

Foster Creek Conservation District Screening Level Macroinvertebrate Assessment
R2 Resource Consultants, Inc. B-2 January 2003 1303.02/Macroinvertebrate.final_1/03
Table B-1. Benthic macroinvertebrate sampling data for Sand Canyon Creek, 24 May 2001.
ABUNDANCE
Taxonomic Group Sample
1 Sample
2 Sample
3 Sample
4 Sample
5 Mean
Abundance Standard
Error
Ophiogomphus - - Unknown - - Zygoptera Coenagrionidae Argia - - Unknown - - MEGALOPTERA Sialidae Sialis - - PLECOPTERA (stoneflies)
Capniidae
Immature - - Chloroperlidae
Sweltsa - -
Immature - -
Nemouridae
Malenka - -
Zapada cinctipes - - Zapada Oregonensis Gr. - -
Immature Perlidae Claassenia - - Hesperoperla pacifica - - Immature - - Perlodidae Isoperla - - Skwala - - Immature - - Pteronarcyidae
Pteronarcella - - Pteronarcys - - Taeniopterygidae Taenionema Immature - -

Foster Creek Conservation District Screening Level Macroinvertebrate Assessment
R2 Resource Consultants, Inc. B-3 January 2003 1303.02/Macroinvertebrate.final_1/03
Table B-1. Benthic macroinvertebrate sampling data for Sand Canyon Creek, 24 May 2001.
ABUNDANCE
Taxonomic Group Sample
1 Sample
2 Sample
3 Sample
4 Sample
5 Mean
Abundance Standard
Error HEMIPTERA (true bugs) Corixidae - - Gerridae - - Unknown - - TRICHOPTERA (caddisflies) Brachycentridae Brachycentrus - - Micrasema - - Immature - - Glossosomatidae Glossosoma - - Protoptila - - Helicopsychidae
Helicopsyche - - Hydropsychidae Arctopsyche grandis - - Cheumatopsyche - - Hydropsyche / Ceratopsyche - - Immature - - Hydroptilidae Agraylea - - Hydroptila 0 4 0 1.4 1.4 Leucotrichia - - Immature - - Lepidostomatidae
Lepidostoma - - Leptoceridae Ceraclea - - Nectopsyche - - Oecetis - - Limnephilidae Dicosmoecus - - Immature - - Philopotamidae Wormaldia - - Polycentropodidae Polycentropus - - Rhyacophilidae

Foster Creek Conservation District Screening Level Macroinvertebrate Assessment
R2 Resource Consultants, Inc. B-4 January 2003 1303.02/Macroinvertebrate.final_1/03
Table B-1. Benthic macroinvertebrate sampling data for Sand Canyon Creek, 24 May 2001.
ABUNDANCE
Taxonomic Group Sample
1 Sample
2 Sample
3 Sample
4 Sample
5 Mean
Abundance Standard
Error
Rhyacophila angelita Grp.
Rhyacophila Betteni Grp.
Rhyacophila vemna/Brunnea Grps. - -
Rhyacophila sp. - -
Uenoidae
Neophylax - - LEPIDOPTERA (moths) Pyralidae Petrophila - - Unknown - - COLEOPTERA (beetles) Curculionidae 0 0 1 0.3 0.3 Dytiscidae - - Dytiscus - - Illybius - - Immature 3 0 1 1.2 0.8 Elmidae Ampumixis - - Cleptelmis - - Dubiraphia - - Heterlimnius - -
Lara - -
Narpus - - Optioservus - - Zaitzevia - - Immature - - Haliplidae Haliplus - - Immature - - Hydrophilidae Hydrobius - - Immature - - DIPTERA (true flies) Athericidae
Atherix - -

Foster Creek Conservation District Screening Level Macroinvertebrate Assessment
R2 Resource Consultants, Inc. B-5 January 2003 1303.02/Macroinvertebrate.final_1/03
Table B-1. Benthic macroinvertebrate sampling data for Sand Canyon Creek, 24 May 2001.
ABUNDANCE
Taxonomic Group Sample
1 Sample
2 Sample
3 Sample
4 Sample
5 Mean
Abundance Standard
Error
Blephariceridae
Blepharicera - -
Philorus
Ceratopogonidae - -
Chironomidae - -
Chironominae/Chironomini Chironomus - -
Dicrotendipes - -
Endochironomus - -
Microtendipes - -
Paracladopelma - -
Paralauterborniella - - Polypedilum - -
Tanytarsini 0 0 1 0.3 0.3 Micropsectra - - Paratanytarsus - -
Rheotanytarsus - - Tanytarsus - -
Tanypodinae Macropelopia Procladius - -
Thienenmannimyia Grp. - -
Diamesinae 37 6 6 16.3 10.2 Pagastia - -
Potthastia - -
Orthocladiinae 297 202 194 230.8 32.9
Brillia - -
Cardiocladius - -
Corynoneura - - Cricotopus nostococladius - -
Cricotopus bicinctus - -
Cricotopus sp. - -
Diplocladius
Eukiefferiella - -
Eukiefferiella Pseudomontana G - - Nanocladius - -
Orthocladius - -
Paraphaenocladius - -

Foster Creek Conservation District Screening Level Macroinvertebrate Assessment
R2 Resource Consultants, Inc. B-6 January 2003 1303.02/Macroinvertebrate.final_1/03
Table B-1. Benthic macroinvertebrate sampling data for Sand Canyon Creek, 24 May 2001.
ABUNDANCE
Taxonomic Group Sample
1 Sample
2 Sample
3 Sample
4 Sample
5 Mean
Abundance Standard
Error
Parametriocnemus - -
Rheocricotopus - -
Synorthocladius - -
Thienemanniella - -
Tvetenia - -
Zalutschia - - Dixidae - -
Dixa - -
Empididae Chelifera - -
Hemerodromia 1 0 1 0.8 0.4
Oreogeton - - Simuliidae - -
Simulium 7 0 5 3.9 2.0
Stratiomyidae - -
Tabanidae - -
Tipulidae Antocha - -
Dicranota - -
Hexatoma - -
Limnophila - -
Tipula - - NON-INSECT TAXA Turbellaria (flatworms) Planariidae - - Unknown - - Aschelminthes Nematoda (roundworms) - - Annelida Hirudinea (leeches) - - Oligochaeta (earthworms) 14 7 10 10.3 1.9 Lumbricidae - - Tubificidae - - Gastropoda (snails) Ancylidae - - Hydrobiidae - -

Foster Creek Conservation District Screening Level Macroinvertebrate Assessment
R2 Resource Consultants, Inc. B-7 January 2003 1303.02/Macroinvertebrate.final_1/03
Table B-1. Benthic macroinvertebrate sampling data for Sand Canyon Creek, 24 May 2001.
ABUNDANCE
Taxonomic Group Sample
1 Sample
2 Sample
3 Sample
4 Sample
5 Mean
Abundance Standard
Error Fluminicola - - Physidae Physella - - Planorbidae - - Vorticifex - - Pelecypoda (clams, mussels) Sphaeriidae - - Unknown - - Amphipoda (scuds, sideswimmers) Gammarus - - Hyalella azteca - - Decapoda Pacifasticus - - Cladocera - - Copepoda - - Isopoda - Caecidotea - - Ostracoda - - Hydracarina (water mites) - - TOTAL INDIVIDUALS 414 310 277 333.5 41.1

Foster Creek Conservation District Screening Level Macroinvertebrate Assessment
R2 Resource Consultants, Inc. B-8 January 2003 1303.02/Macroinvertebrate.final_1/03
Benthic macroinvertebrate summary data for Sand Canyon Creek, 24 May 2001.
Sample 1 Sample 2 Sample 3 Sample 4 Sample 5 Composite Total Abundance (#/sample) 414 310 277 333.5 Density (#/sq-m) 2,176 1,632 1,458 1,755 Taxa Richness (# taxa) 7 6 10 12.0 B-IBI Metric Score 1 1 3 3 Hilsenhoff Biotic Index 4.92 5.26 5.31 5.2 Ephemeroptera Richness 1 2 1 2 B-IBI Metric Score 1 1 1 1 Plecoptera Richness 0 0 0 0 B-IBI Metric Score 1 1 1 1 Trichoptera Richness 0 1 0 1 B-IBI Metric Score 1 1 1 1 EPT Taxa Richness 1 3 1 3 % EPT of Total Abundance 13.5 30.5 20.9 20.8 % Predators 1.0 0.0 1.1 0.7 B-IBI Metric Score 1 1 1 1 % Contribution of Dominant Taxa 94.1 96.0 93.1 94.4 B-IBI Metric Score 1 1 1 1 Intolerant Taxa Richness 0 1 0 1 B-IBI Metric Score 1 3 1 3 Long-Lived Taxa Richness 0 0 0 0 B-IBI Metric Score 1 1 1 1 % Tolerant Taxa 42.9 33.3 30.0 33.3 B-IBI Metric Score 3 3 3 3 B-IBI 11 13 13 15 Abundance by Order (%) Ephemeroptera 13.5 29.2 20.9 20.4 Odonata 0.0 0.0 0.0 0.0 Plecoptera 0.0 0.0 0.0 0.0 Hemiptera 0.0 0.0 0.0 0.0 Trichoptera 0.0 1.3 0.0 0.4 Lepidoptera 0.0 0.0 0.0 0.0 Coleoptera 0.7 0.0 0.7 0.5 Diptera 82.6 67.1 74.7 75.6 Non-Insect Taxa 3.3 2.3 3.6 3.1 Abundance by Food Group (%) Collector-Gatherers 16.8 32.9 24.5 23.9 Scrapers/Grazers 0.0 0.0 0.0 0.0 Shredders 0.0 0.0 0.0 0.0 Filter Feeders 1.6 0.0 1.8 1.2 Predators 1.0 0.0 1.1 0.7 Unknown 80.6 67.1 72.6 74.2

Foster Creek Conservation District Screening Level Macroinvertebrate Assessment
R2 Resource Consultants, Inc. B-9 January 2003 1303.02/Macroinvertebrate.final_1/03
Abundance by Habit (%) Burrowers 75.0 67.5 73.6 72.3 Climbers 0.7 0.0 0.4 0.4 Clingers 10.5 3.3 4.3 6.6 Skater 0.0 0.0 0.0 0.0 Sprawler 0.3 0.0 0.4 0.2
Swimmer 13.5 29.2 20.9 20.4

Foster Creek Conservation District Screening Level Macroinvertebrate Assessment
R2 Resource Consultants, Inc. B-10 January 2003 1303.02/Macroinvertebrate.final_1/03
Table B-2. Benthic macroinvertebrate sampling data for Douglas Creek, 25 May 2001.
ABUNDANCE
Taxonomic Group Sample
1 Sample
2 Sample
3 Sample
4 Sample
5 Mean Abundance Standard Error EPHEMEROPTERA (mayflies) Baetidae Acentrella insignificans - - Baetis bicaudatus 60 110 30 66.7 23.3 Baetis tricaudatus 780 790 649 739.6 45.5 Baetis sp. - - Immature - - Caenidae Caenis - - Ephemerellidae Attenella margarita - - Caudatella edmundsi - - Drunella spinifera - - Drunella sp. 0 0 4 1.3 1.3 Ephemerella - -
Serratella - - Immature - - Heptageniidae Cinygmula - - Epeorus - - Heptagenia/Leucrocuta/Nixe 24 30 15 23.0 4.4 Leucrocuta - - Nixe simplicoides - - Rhithrogena - - Stenonema - - Immature - - Leptophlebiidae Paraleptophlebia bicornata - - Paraleptophlebia temporalis 0 5 4 2.9 1.5 Immature - - Siphlonuridae Ameletus - - Tricorythidae Tricorythodes 0 0 11 3.8 3.8 ODONATA (dragonflies) Anisoptera
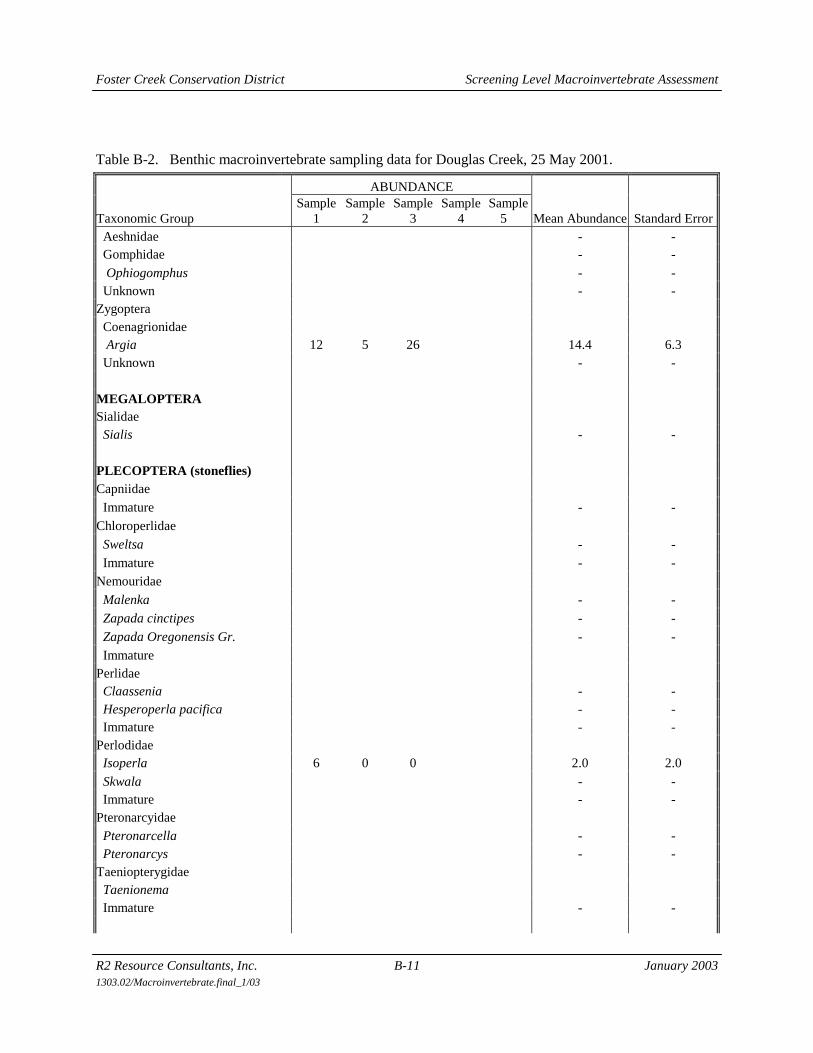
Foster Creek Conservation District Screening Level Macroinvertebrate Assessment
R2 Resource Consultants, Inc. B-11 January 2003 1303.02/Macroinvertebrate.final_1/03
Table B-2. Benthic macroinvertebrate sampling data for Douglas Creek, 25 May 2001.
ABUNDANCE
Taxonomic Group Sample
1 Sample
2 Sample
3 Sample
4 Sample
5 Mean Abundance Standard Error Aeshnidae - - Gomphidae - -
Ophiogomphus - - Unknown - - Zygoptera Coenagrionidae Argia 12 5 26 14.4 6.3 Unknown - - MEGALOPTERA Sialidae Sialis - - PLECOPTERA (stoneflies) Capniidae
Immature - -
Chloroperlidae
Sweltsa - -
Immature - - Nemouridae
Malenka - -
Zapada cinctipes - -
Zapada Oregonensis Gr. - -
Immature Perlidae Claassenia - - Hesperoperla pacifica - - Immature - - Perlodidae Isoperla 6 0 0 2.0 2.0
Skwala - - Immature - - Pteronarcyidae Pteronarcella - - Pteronarcys - - Taeniopterygidae Taenionema Immature - -

Foster Creek Conservation District Screening Level Macroinvertebrate Assessment
R2 Resource Consultants, Inc. B-12 January 2003 1303.02/Macroinvertebrate.final_1/03
Table B-2. Benthic macroinvertebrate sampling data for Douglas Creek, 25 May 2001.
ABUNDANCE
Taxonomic Group Sample
1 Sample
2 Sample
3 Sample
4 Sample
5 Mean Abundance Standard Error HEMIPTERA (true bugs) Corixidae - - Gerridae - - Unknown - - TRICHOPTERA (caddisflies) Brachycentridae Brachycentrus - -
Micrasema - - Immature - - Glossosomatidae Glossosoma - - Protoptila - -
Helicopsychidae
Helicopsyche - - Hydropsychidae
Arctopsyche grandis - - Cheumatopsyche 6 0 23 9.5 6.7 Hydropsyche / Ceratopsyche 90 30 4 41.3 25.5 Immature 36 50 26 37.4 6.9 Hydroptilidae Agraylea - - Hydroptila 6 10 15 10.3 2.6 Leucotrichia 0 10 0 3.3 3.3 Immature - -
Lepidostomatidae
Lepidostoma - - Leptoceridae Ceraclea - - Nectopsyche - - Oecetis - - Limnephilidae Dicosmoecus - - Immature 12 0 0 4.0 4.0 Philopotamidae Wormaldia 102 15 11 42.8 29.6 Polycentropodidae Polycentropus - -
Rhyacophilidae

Foster Creek Conservation District Screening Level Macroinvertebrate Assessment
R2 Resource Consultants, Inc. B-13 January 2003 1303.02/Macroinvertebrate.final_1/03
Table B-2. Benthic macroinvertebrate sampling data for Douglas Creek, 25 May 2001.
ABUNDANCE
Taxonomic Group Sample
1 Sample
2 Sample
3 Sample
4 Sample
5 Mean Abundance Standard Error
Rhyacophila angelita Grp.
Rhyacophila Betteni Grp.
Rhyacophila vemna/Brunnea Grps. - - Rhyacophila sp. - -
Uenoidae
Neophylax - - LEPIDOPTERA (moths) Pyralidae Petrophila - - Unknown - - COLEOPTERA (beetles) Curculionidae - - Dytiscidae - - Dytiscus - - Illybius - - Immature - - Elmidae Ampumixis 426 330 214 323.3 61.3 Cleptelmis - - Dubiraphia - - Heterlimnius 42 15 0 19.0 12.3 Lara - -
Narpus - - Optioservus 102 80 146 109.4 19.5 Zaitzevia 66 25 11 34.1 16.4 Immature - - Haliplidae Haliplus - - Immature - - Hydrophilidae Hydrobius - - Immature - - DIPTERA (true flies)
Athericidae Atherix - -
Blephariceridae

Foster Creek Conservation District Screening Level Macroinvertebrate Assessment
R2 Resource Consultants, Inc. B-14 January 2003 1303.02/Macroinvertebrate.final_1/03
Table B-2. Benthic macroinvertebrate sampling data for Douglas Creek, 25 May 2001.
ABUNDANCE
Taxonomic Group Sample
1 Sample
2 Sample
3 Sample
4 Sample
5 Mean Abundance Standard Error
Blepharicera - -
Philorus
Ceratopogonidae - - Chironomidae - -
Chironominae/Chironomini Chironomus - -
Dicrotendipes - -
Endochironomus - -
Microtendipes - - Paracladopelma - -
Paralauterborniella - -
Polypedilum - -
Tanytarsini 48 30 23 33.5 7.6 Micropsectra - - Paratanytarsus - -
Rheotanytarsus - -
Tanytarsus - -
Tanypodinae Macropelopia Procladius - - Thienenmannimyia Grp. - -
Diamesinae 0 5 0 1.7 1.7
Pagastia - -
Potthastia - -
Orthocladiinae 36 5 11 17.4 9.5
Brillia - - Cardiocladius - -
Corynoneura - -
Cricotopus nostococladius - -
Cricotopus bicinctus - -
Cricotopus sp. - -
Diplocladius Eukiefferiella - -
Eukiefferiella Pseudomontana G - -
Nanocladius - -
Orthocladius - -
Paraphaenocladius - -
Parametriocnemus - -

Foster Creek Conservation District Screening Level Macroinvertebrate Assessment
R2 Resource Consultants, Inc. B-15 January 2003 1303.02/Macroinvertebrate.final_1/03
Table B-2. Benthic macroinvertebrate sampling data for Douglas Creek, 25 May 2001.
ABUNDANCE
Taxonomic Group Sample
1 Sample
2 Sample
3 Sample
4 Sample
5 Mean Abundance Standard Error
Rheocricotopus - -
Synorthocladius - -
Thienemanniella - - Tvetenia - -
Zalutschia - -
Dixidae - -
Dixa - -
Empididae Chelifera - - Hemerodromia 0 5 0 1.7 1.7
Oreogeton - -
Simuliidae - -
Simulium 0 5 0 1.7 1.7
Stratiomyidae - -
Tabanidae - -
Tipulidae Antocha - -
Dicranota - -
Hexatoma - -
Limnophila - - Tipula - -
NON-INSECT TAXA Turbellaria (flatworms) Planariidae - - Unknown - - Aschelminthes Nematoda (roundworms) 6 0 0 2.0 2.0 Annelida Hirudinea (leeches) - - Oligochaeta (earthworms) 0 5 0 1.7 1.7 Lumbricidae - - Tubificidae - - Gastropoda (snails) Ancylidae - - Hydrobiidae - - Fluminicola - -

Foster Creek Conservation District Screening Level Macroinvertebrate Assessment
R2 Resource Consultants, Inc. B-16 January 2003 1303.02/Macroinvertebrate.final_1/03
Table B-2. Benthic macroinvertebrate sampling data for Douglas Creek, 25 May 2001.
ABUNDANCE
Taxonomic Group Sample
1 Sample
2 Sample
3 Sample
4 Sample
5 Mean Abundance Standard Error Physidae Physella - - Planorbidae - - Vorticifex - - Pelecypoda (clams, mussels) Sphaeriidae - - Unknown - - Amphipoda (scuds, sideswimmers) Gammarus - - Hyalella azteca - - Decapoda Pacifasticus 0 0 4 1.3 1.3 Cladocera - - Copepoda - - Isopoda - Caecidotea - - Ostracoda - - Hydracarina (water mites) - - TOTAL INDIVIDUALS 1860 1560 1227 1549.0 182.8

Foster Creek Conservation District Screening Level Macroinvertebrate Assessment
R2 Resource Consultants, Inc. B-17 January 2003 1303.02/Macroinvertebrate.final_1/03
Benthic macroinvertebrate summary data for Douglas Creek, 25 May 2001.
Sample 1 Sample 2 Sample 3 Sample 4 Sample 5 Composite Total Abundance (#/sample) 1,860 1,560 1,227 1549.0 Density (#/sq-m) 9,789 8,211 6,457 8,152 Taxa Richness (# taxa) 18 21 18 28.0 B-IBI Metric Score 3 5 3 5 Hilsenhoff Biotic Index 4.84 5.04 5.15 5.0 Ephemeroptera Richness 3 4 6 6 B-IBI Metric Score 3 3 5 5 Plecoptera Richness 1 0 0 1 B-IBI Metric Score 1 1 1 1 Trichoptera Richness 6 5 5 7 B-IBI Metric Score 5 5 5 5 EPT Taxa Richness 10 9 11 14 % EPT of Total Abundance 60.3 67.3 64.5 63.8 % Predators 1.0 0.6 2.1 1.2 B-IBI Metric Score 1 1 1 1 % Contribution of Dominant Taxa 70.3 76.9 82.2 75.7 B-IBI Metric Score 3 1 1 1 Intolerant Taxa Richness 2 2 1 2 B-IBI Metric Score 3 3 3 3 Long-Lived Taxa Richness 4 4 5 6 B-IBI Metric Score 5 5 5 5 % Tolerant Taxa 27.8 28.6 38.9 32.1 B-IBI Metric Score 3 3 3 3 B-IBI 27 27 27 29 Abundance by Order (%) Ephemeroptera 46.5 59.9 58.1 54.1 Odonata 0.6 0.3 2.1 0.9 Plecoptera 0.3 0.0 0.0 0.1 Hemiptera 0.0 0.0 0.0 0.0 Trichoptera 13.5 7.4 6.4 9.6 Lepidoptera 0.0 0.0 0.0 0.0 Coleoptera 34.2 28.8 30.3 31.4 Diptera 4.5 3.2 2.8 3.6 Non-Insect Taxa 0.3 0.3 0.3 0.3 Abundance by Food Group (%) Collector-Gatherers 76.1 86.2 87.1 82.4 Scrapers/Grazers 4.8 4.2 2.5 4.0 Shredders 0.0 0.0 0.3 0.1 Filter Feeders 12.6 6.4 5.2 8.6 Predators 1.0 0.6 2.1 1.2 Unknown 5.5 2.6 2.8 3.8

Foster Creek Conservation District Screening Level Macroinvertebrate Assessment
R2 Resource Consultants, Inc. B-18 January 2003 1303.02/Macroinvertebrate.final_1/03
Abundance by Habit (%) Burrowers 1.9 0.6 0.9 1.2 Climbers 0.0 0.0 0.0 0.0 Clingers 51.3 40.7 40.1 44.8 Skater 0.0 0.0 0.0 0.0 Sprawler 0.0 0.3 1.2 0.4
Swimmer 45.2 58.0 55.6 52.2

Foster Creek Conservation District Screening Level Macroinvertebrate Assessment
R2 Resource Consultants, Inc. B-19 January 2003 1303.02/Macroinvertebrate.final_1/03
Table B-3. Benthic macroinvertebrate sampling data for Pine Canyon Creek, 23 May 2001.
ABUNDANCE
Taxonomic Group Sample
1 Sample
2 Sample
3 Sample
4 Sample
5 Mean
Abundance Standard
Error EPHEMEROPTERA (mayflies) Baetidae Acentrella insignificans - - Baetis bicaudatus 4 0 0 1.3 1.3 Baetis tricaudatus 92 84 467 214.2 126.3 Baetis sp. - - Immature - - Caenidae Caenis - - Ephemerellidae Attenella margarita - - Caudatella edmundsi - - Drunella spinifera - - Drunella sp. - - Ephemerella - -
Serratella - - Immature - - Heptageniidae Cinygmula 10 7 6 7.5 1.3 Epeorus 42 40 93 58.2 17.3 Heptagenia/Leucrocuta/Nixe - - Leucrocuta - - Nixe simplicoides - - Rhithrogena - - Stenonema - - Immature - - Leptophlebiidae Paraleptophlebia bicornata - - Paraleptophlebia temporalis - - Immature - - Siphlonuridae Ameletus - - Tricorythidae Tricorythodes - - ODONATA (dragonflies) Anisoptera Aeshnidae - - Gomphidae - - Ophiogomphus - -

Foster Creek Conservation District Screening Level Macroinvertebrate Assessment
R2 Resource Consultants, Inc. B-20 January 2003 1303.02/Macroinvertebrate.final_1/03
Table B-3. Benthic macroinvertebrate sampling data for Pine Canyon Creek, 23 May 2001.
ABUNDANCE
Taxonomic Group Sample
1 Sample
2 Sample
3 Sample
4 Sample
5 Mean
Abundance Standard
Error Unknown - - Zygoptera Coenagrionidae Argia - - Unknown - - MEGALOPTERA Sialidae Sialis - - PLECOPTERA (stoneflies) Capniidae
Immature - -
Chloroperlidae
Sweltsa 58 23 38 39.6 10.2
Immature - -
Nemouridae Malenka 4 3 3 3.2 0.4
Zapada cinctipes - -
Zapada Oregonensis Gr. - -
Immature Perlidae Claassenia - - Hesperoperla pacifica - - Immature - - Perlodidae Isoperla - -
Skwala - - Immature - - Pteronarcyidae
Pteronarcella - - Pteronarcys - - Taeniopterygidae Taenionema Immature - - HEMIPTERA (true bugs) Corixidae - - Gerridae - - Unknown - -

Foster Creek Conservation District Screening Level Macroinvertebrate Assessment
R2 Resource Consultants, Inc. B-21 January 2003 1303.02/Macroinvertebrate.final_1/03
Table B-3. Benthic macroinvertebrate sampling data for Pine Canyon Creek, 23 May 2001.
ABUNDANCE
Taxonomic Group Sample
1 Sample
2 Sample
3 Sample
4 Sample
5 Mean
Abundance Standard
Error TRICHOPTERA (caddisflies) Brachycentridae Brachycentrus - -
Micrasema - - Immature - - Glossosomatidae Glossosoma 4 3 3 3.2 0.4 Protoptila - -
Helicopsychidae
Helicopsyche - - Hydropsychidae
Arctopsyche grandis - - Cheumatopsyche - - Hydropsyche / Ceratopsyche 84 95 55 77.9 12.1 Immature - - Hydroptilidae Agraylea - - Hydroptila - - Leucotrichia - - Immature - -
Lepidostomatidae
Lepidostoma - - Leptoceridae Ceraclea - - Nectopsyche - - Oecetis - - Limnephilidae Dicosmoecus - - Immature - - Philopotamidae Wormaldia - - Polycentropodidae Polycentropus - -
Rhyacophilidae
Rhyacophila angelita Grp.
Rhyacophila Betteni Grp. Rhyacophila vemna/Brunnea Grps. 2 0 0 0.7 0.7
Rhyacophila sp. 2 0 0 0.7 0.7
Uenoidae

Foster Creek Conservation District Screening Level Macroinvertebrate Assessment
R2 Resource Consultants, Inc. B-22 January 2003 1303.02/Macroinvertebrate.final_1/03
Table B-3. Benthic macroinvertebrate sampling data for Pine Canyon Creek, 23 May 2001.
ABUNDANCE
Taxonomic Group Sample
1 Sample
2 Sample
3 Sample
4 Sample
5 Mean
Abundance Standard
Error
Neophylax 100 58 22 60.0 22.6 LEPIDOPTERA (moths) Pyralidae Petrophila - - Unknown - - COLEOPTERA (beetles) Curculionidae - - Dytiscidae - - Dytiscus - - Illybius - - Immature - - Elmidae Ampumixis - - Cleptelmis - - Dubiraphia - - Heterlimnius 54 37 55 48.5 5.8 Lara - -
Narpus - - Optioservus 10 1 0 3.8 3.1 Zaitzevia 6 1 0 2.5 1.8 Immature - - Haliplidae Haliplus - - Immature - - Hydrophilidae Hydrobius - - Immature - - DIPTERA (true flies) Athericidae
Atherix - -
Blephariceridae
Blepharicera - -
Philorus
Ceratopogonidae - - Chironomidae - -
Chironominae/Chironomini 2 6 8 Chironomus - -

Foster Creek Conservation District Screening Level Macroinvertebrate Assessment
R2 Resource Consultants, Inc. B-23 January 2003 1303.02/Macroinvertebrate.final_1/03
Table B-3. Benthic macroinvertebrate sampling data for Pine Canyon Creek, 23 May 2001.
ABUNDANCE
Taxonomic Group Sample
1 Sample
2 Sample
3 Sample
4 Sample
5 Mean
Abundance Standard
Error
Dicrotendipes - -
Endochironomus - -
Microtendipes - - Paracladopelma - -
Paralauterborniella - -
Polypedilum - -
Tanytarsini 40 40 41 40.3 0.4 Micropsectra - - Paratanytarsus - -
Rheotanytarsus - -
Tanytarsus - -
Tanypodinae Macropelopia Procladius - - Thienenmannimyia Grp. - -
Diamesinae - -
Pagastia - -
Potthastia - -
Orthocladiinae 18 7 3 9.3 4.5
Brillia - - Cardiocladius - -
Corynoneura - -
Cricotopus nostococladius - -
Cricotopus bicinctus - -
Cricotopus sp. - -
Diplocladius Eukiefferiella - -
Eukiefferiella Pseudomontana G - -
Nanocladius - -
Orthocladius - -
Paraphaenocladius - -
Parametriocnemus - - Rheocricotopus - -
Synorthocladius - -
Thienemanniella - -
Tvetenia - -
Zalutschia - -
Dixidae - - Dixa - -

Foster Creek Conservation District Screening Level Macroinvertebrate Assessment
R2 Resource Consultants, Inc. B-24 January 2003 1303.02/Macroinvertebrate.final_1/03
Table B-3. Benthic macroinvertebrate sampling data for Pine Canyon Creek, 23 May 2001.
ABUNDANCE
Taxonomic Group Sample
1 Sample
2 Sample
3 Sample
4 Sample
5 Mean
Abundance Standard
Error
Empididae Chelifera - -
Hemerodromia 2 0 0 0.7 0.7 Oreogeton - -
Simuliidae - -
Simulium - -
Stratiomyidae - -
Tabanidae - -
Tipulidae Antocha 0 1 0 0.5 0.5
Dicranota - -
Hexatoma - -
Limnophila - -
Tipula - - NON-INSECT TAXA Turbellaria (flatworms) Planariidae - - Unknown - - Aschelminthes Nematoda (roundworms) - - Annelida Hirudinea (leeches) - - Oligochaeta (earthworms) 8 4 6 5.9 1.1 Lumbricidae - - Tubificidae - - Gastropoda (snails) Ancylidae - - Hydrobiidae - - Fluminicola - - Physidae Physella - - Planorbidae - - Vorticifex - - Pelecypoda (clams, mussels) Sphaeriidae - - Unknown - - Amphipoda (scuds, sideswimmers) Gammarus 56 19 60 44.9 13.2 Hyalella azteca - -

Foster Creek Conservation District Screening Level Macroinvertebrate Assessment
R2 Resource Consultants, Inc. B-25 January 2003 1303.02/Macroinvertebrate.final_1/03
Table B-3. Benthic macroinvertebrate sampling data for Pine Canyon Creek, 23 May 2001.
ABUNDANCE
Taxonomic Group Sample
1 Sample
2 Sample
3 Sample
4 Sample
5 Mean
Abundance Standard
Error Decapoda Pacifasticus - - Cladocera - - Copepoda - - Isopoda - Caecidotea - - Ostracoda 2 0 0 0.7 0.7 Hydracarina (water mites) - - TOTAL INDIVIDUALS 600 429 857 628.7 124.5

Foster Creek Conservation District Screening Level Macroinvertebrate Assessment
R2 Resource Consultants, Inc. B-26 January 2003 1303.02/Macroinvertebrate.final_1/03
Benthic macroinvertebrate summary data for Pine Canyon Creek, 23 May 2001.
Sample 1 Sample 2 Sample 3 Sample 4 Sample 5 Composite Total Abundance (#/sample) 600 429 857 628.7 Density (#/sq-m) 3,158 2,257 4,512 3,309 Taxa Richness (# taxa) 21 17 14 22.0 B-IBI Metric Score 5 3 3 5 Hilsenhoff Biotic Index 3.72 3.86 4.55 4.0 Ephemeroptera Richness 4 3 3 4 B-IBI Metric Score 3 3 3 3 Plecoptera Richness 2 2 2 2 B-IBI Metric Score 1 1 1 1 Trichoptera Richness 5 3 3 5
B-IBI Metric Score 5 3 3 5 EPT Taxa Richness 11 8 8 11 % Predators 10.7 5.3 4.5 6.6 B-IBI Metric Score 5 3 1 3 % Contribution of Dominant Taxa 46.0 55.3 63.4 56.0 B-IBI Metric Score 5 3 3 3 Intolerant Taxa Richness 2 1 1 2 B-IBI Metric Score 3 3 3 3 Long-Lived Taxa Richness 3 3 1 3 B-IBI Metric Score 5 5 3 5 % Tolerant Taxa 23.8 29.4 14.3 27.3 B-IBI Metric Score 3 3 5 3 B-IBI 35 27 25 31 Abundance by Order (%) Ephemeroptera 24.7 30.5 65.9 44.7 Odonata 0.0 0.0 0.0 0.0 Plecoptera 10.3 5.9 4.8 6.8 Hemiptera 0.0 0.0 0.0 0.0 Trichoptera 32.0 36.4 9.2 22.7 Lepidoptera 0.0 0.0 0.0 0.0 Coleoptera 11.7 9.3 6.4 8.7 Diptera 10.3 12.6 6.1 8.1 Non-Insect Taxa 11.0 5.3 7.7 8.2 Abundance by Food Group (%) Collector-Gatherers 44.3 43.4 79.3 60.0 Scrapers/Grazers 20.0 16.2 3.5 11.6 Shredders 0.7 0.7 0.3 0.5 Filter Feeders 14.3 22.2 6.4 12.5 Predators 10.7 5.3 4.5 6.6 Unknown 10.0 12.3 6.1 8.7

Foster Creek Conservation District Screening Level Macroinvertebrate Assessment
R2 Resource Consultants, Inc. B-27 January 2003 1303.02/Macroinvertebrate.final_1/03
Abundance by Habit (%) Burrowers 4.7 4.0 1.9 2.4 Climbers 0.0 0.0 0.0 0.0 Clingers 68.7 71.5 36.3 54.6 Skater 0.0 0.0 0.0 0.0 Sprawler 1.0 0.7 0.3 0.6
Swimmer 25.7 23.9 61.5 41.5

Foster Creek Conservation District Screening Level Macroinvertebrate Assessment
R2 Resource Consultants, Inc. B-28 January 2003 1303.02/Macroinvertebrate.final_1/03
Table B-4 Benthic macroinvertebrate sampling data for Blue Grade Draw, 24 May 2001.
ABUNDANCE
Taxonomic Group Sample
1 Sample
2 Sample
3 Sample
4 Sample
5 Mean
Abundance Standard
Error EPHEMEROPTERA (mayflies) Baetidae Acentrella insignificans - - Baetis bicaudatus - - Baetis tricaudatus - - Baetis sp. - - Immature - - Caenidae Caenis - - Ephemerellidae Attenella margarita - - Caudatella edmundsi - - Drunella spinifera - - Drunella sp. - - Ephemerella - - Serratella - - Immature - - Heptageniidae Cinygmula - - Epeorus - - Heptagenia/Leucrocuta/Nixe - - Leucrocuta - - Nixe simplicoides - - Rhithrogena - - Stenonema - - Immature - - Leptophlebiidae Paraleptophlebia bicornata - - Paraleptophlebia temporalis - - Immature - - Siphlonuridae Ameletus - - Tricorythidae Tricorythodes - -
ODONATA (dragonflies) Anisoptera Aeshnidae - - Gomphidae - - Ophiogomphus - - Unknown - - Zygoptera Coenagrionidae Argia - - Unknown - -

Foster Creek Conservation District Screening Level Macroinvertebrate Assessment
R2 Resource Consultants, Inc. B-29 January 2003 1303.02/Macroinvertebrate.final_1/03
Table B-4 Benthic macroinvertebrate sampling data for Blue Grade Draw, 24 May 2001.
ABUNDANCE
Taxonomic Group Sample
1 Sample
2 Sample
3 Sample
4 Sample
5 Mean
Abundance Standard
Error
MEGALOPTERA Sialidae Sialis - -
PLECOPTERA (stoneflies) Capniidae Immature - - Chloroperlidae Sweltsa - - Immature - - Nemouridae Malenka - - Zapada cinctipes - - Zapada Oregonensis Gr. - - Immature Perlidae Claassenia - - Hesperoperla pacifica - - Immature - - Perlodidae Isoperla - - Skwala - - Immature - - Pteronarcyidae Pteronarcella - - Pteronarcys - - Taeniopterygidae Taenionema Immature - -
HEMIPTERA (true bugs) Corixidae - - Gerridae - - Unknown - -
TRICHOPTERA (caddisflies) Brachycentridae Brachycentrus - - Micrasema - - Immature - - Glossosomatidae Glossosoma - - Protoptila - - Helicopsychidae
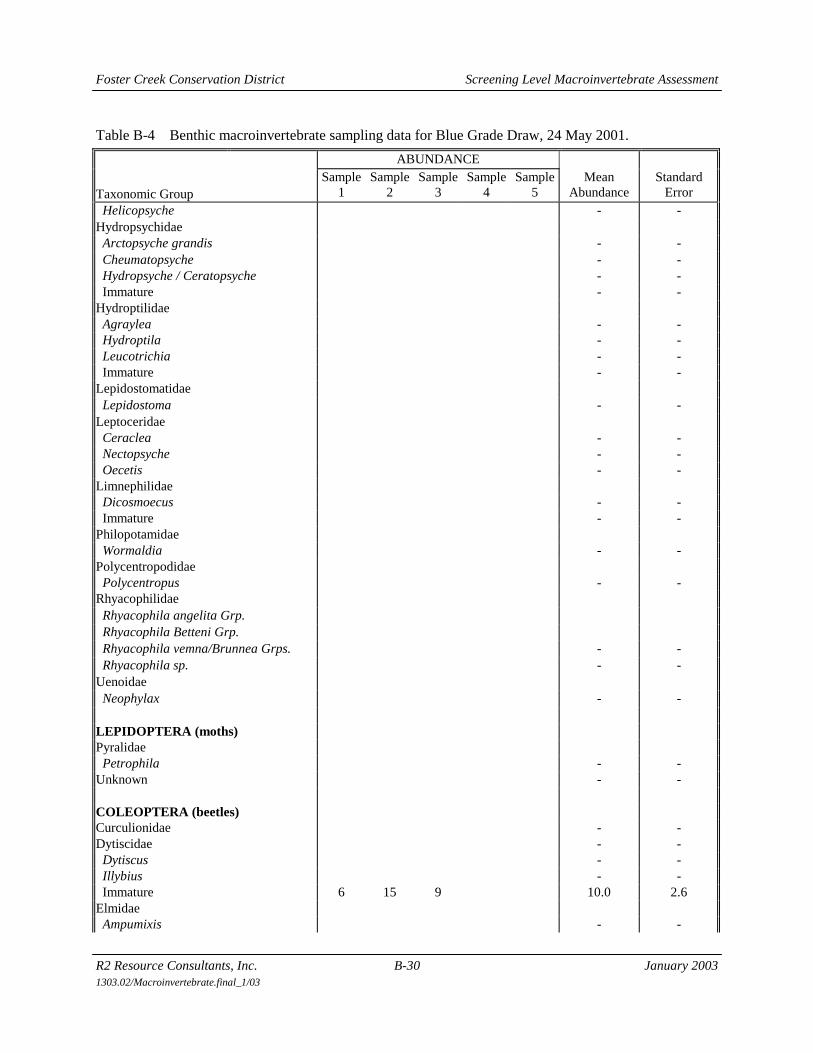
Foster Creek Conservation District Screening Level Macroinvertebrate Assessment
R2 Resource Consultants, Inc. B-30 January 2003 1303.02/Macroinvertebrate.final_1/03
Table B-4 Benthic macroinvertebrate sampling data for Blue Grade Draw, 24 May 2001.
ABUNDANCE
Taxonomic Group Sample
1 Sample
2 Sample
3 Sample
4 Sample
5 Mean
Abundance Standard
Error Helicopsyche - - Hydropsychidae Arctopsyche grandis - - Cheumatopsyche - - Hydropsyche / Ceratopsyche - - Immature - - Hydroptilidae Agraylea - - Hydroptila - - Leucotrichia - - Immature - - Lepidostomatidae Lepidostoma - - Leptoceridae Ceraclea - - Nectopsyche - - Oecetis - - Limnephilidae Dicosmoecus - - Immature - - Philopotamidae Wormaldia - - Polycentropodidae Polycentropus - - Rhyacophilidae Rhyacophila angelita Grp. Rhyacophila Betteni Grp. Rhyacophila vemna/Brunnea Grps. - - Rhyacophila sp. - - Uenoidae Neophylax - -
LEPIDOPTERA (moths) Pyralidae Petrophila - - Unknown - -
COLEOPTERA (beetles) Curculionidae - - Dytiscidae - - Dytiscus - - Illybius - - Immature 6 15 9 10.0 2.6 Elmidae Ampumixis - -

Foster Creek Conservation District Screening Level Macroinvertebrate Assessment
R2 Resource Consultants, Inc. B-31 January 2003 1303.02/Macroinvertebrate.final_1/03
Table B-4 Benthic macroinvertebrate sampling data for Blue Grade Draw, 24 May 2001.
ABUNDANCE
Taxonomic Group Sample
1 Sample
2 Sample
3 Sample
4 Sample
5 Mean
Abundance Standard
Error Cleptelmis - - Dubiraphia - - Heterlimnius - - Lara - - Narpus - - Optioservus - - Zaitzevia - - Immature - - Haliplidae Haliplus - - Immature - - Hydrophilidae Hydrobius - - Immature - -
DIPTERA (true flies) Athericidae Atherix - - Blephariceridae Blepharicera - - Philorus Ceratopogonidae - - Chironomidae - - Chironominae/Chironomini Chironomus - - Dicrotendipes - - Endochironomus - - Microtendipes - - Paracladopelma - - Paralauterborniella - - Polypedilum - - Tanytarsini 0 0 1 0.3 0.3 Micropsectra - - Paratanytarsus - - Rheotanytarsus - - Tanytarsus - - Tanypodinae Macropelopia Procladius - - Thienenmannimyia Grp. - - Diamesinae - - Pagastia - - Potthastia - - Orthocladiinae 0 5 35 13.3 10.9

Foster Creek Conservation District Screening Level Macroinvertebrate Assessment
R2 Resource Consultants, Inc. B-32 January 2003 1303.02/Macroinvertebrate.final_1/03
Table B-4 Benthic macroinvertebrate sampling data for Blue Grade Draw, 24 May 2001.
ABUNDANCE
Taxonomic Group Sample
1 Sample
2 Sample
3 Sample
4 Sample
5 Mean
Abundance Standard
Error Brillia - - Cardiocladius - - Corynoneura - - Cricotopus nostococladius - - Cricotopus bicinctus - - Cricotopus sp. - - Diplocladius Eukiefferiella - - Eukiefferiella Pseudomontana G - - Nanocladius - - Orthocladius - - Paraphaenocladius - - Parametriocnemus - - Rheocricotopus - - Synorthocladius - - Thienemanniella - - Tvetenia - - Zalutschia - - Dixidae - - Dixa - - Empididae Chelifera - - Hemerodromia - - Oreogeton - - Simuliidae - - Simulium 0 8 1 3.0 2.5 Stratiomyidae - -
Tabanidae - - Tipulidae Antocha - - Dicranota - - Hexatoma - - Limnophila - - Tipula - -
NON-INSECT TAXA Turbellaria (flatworms) Planariidae 5 0 0 1.7 1.7 Unknown - - Aschelminthes Nematoda (roundworms) - - Annelida Hirudinea (leeches) - -

Foster Creek Conservation District Screening Level Macroinvertebrate Assessment
R2 Resource Consultants, Inc. B-33 January 2003 1303.02/Macroinvertebrate.final_1/03
Table B-4 Benthic macroinvertebrate sampling data for Blue Grade Draw, 24 May 2001.
ABUNDANCE
Taxonomic Group Sample
1 Sample
2 Sample
3 Sample
4 Sample
5 Mean
Abundance Standard
Error Oligochaeta (earthworms) 15 7 3 8.3 3.5 Lumbricidae - - Tubificidae - - Gastropoda (snails) Ancylidae - - Hydrobiidae - - Fluminicola - - Physidae Physella 2 1 0 1.0 0.6 Planorbidae - - Vorticifex - - Pelecypoda (clams, mussels) Sphaeriidae - - Unknown - - Amphipoda (scuds, sideswimmers) Gammarus - - Hyalella azteca - - Decapoda Pacifasticus - - Cladocera - - Copepoda - - Isopoda - Caecidotea - - Ostracoda - - Hydracarina (water mites) - -
TOTAL INDIVIDUALS 28 36 49 37.7 6.1

Foster Creek Conservation District Screening Level Macroinvertebrate Assessment
R2 Resource Consultants, Inc. B-34 January 2003 1303.02/Macroinvertebrate.final_1/03
Benthic macroinvertebrate sampling data for Blue Grade Draw, 24 May 2001.
Sample 1 Sample 2 Sample 3 Sample 4 Sample 5 Composite Total Abundance (#/sample) 28 36 49 37.7 Density (#/sq-m) 147 189 258 198 Taxa Richness (# taxa) 4 6 6 8.0 B-IBI Metric Score 1 1 1 1 Hilsenhoff Biotic Index 5.57 6.83 5.22 5.9 Ephemeroptera Richness 0 0 0 0 B-IBI Metric Score 1 1 1 1 Plecoptera Richness 0 0 0 0 B-IBI Metric Score 1 1 1 1 Trichoptera Richness 0 0 0 0
B-IBI Metric Score 1 1 1 1 EPT Taxa Richness 0 0 0 0 % EPT of Total Abundance 0 0 0 0 % Predators 21.4 41.7 18.4 26.5 B-IBI Metric Score 5 5 5 5 % Contribution of Dominant Taxa 75.0 75.0 95.9 84.1 B-IBI Metric Score 3 3 1 1 Intolerant Taxa Richness 0 0 0 0 B-IBI Metric Score 1 1 1 1 Long-Lived Taxa Richness 0 0 0 0 B-IBI Metric Score 1 1 1 1 % Tolerant Taxa 25.0 33.3 16.7 25.0 B-IBI Metric Score 3 3 5 3 B-IBI 17 17 17 15 Abundance by Order (%) Ephemeroptera 0.0 0.0 0.0 0.0 Odonata 0.0 0.0 0.0 0.0 Plecoptera 0.0 0.0 0.0 0.0 Hemiptera 0.0 0.0 0.0 0.0 Trichoptera 0.0 0.0 0.0 0.0 Lepidoptera 0.0 0.0 0.0 0.0 Coleoptera 21.4 41.7 18.4 26.5 Diptera 0.0 36.1 75.5 44.2 Non-Insect Taxa 78.6 22.2 6.1 29.2 Abundance by Food Group (%) Collector-Gatherers 53.6 19.4 6.1 22.1 Scrapers/Grazers 7.1 2.8 0.0 2.7 Shredders 0.0 0.0 0.0 0.0 Filter Feeders 17.9 22.2 2.0 12.4 Predators 21.4 41.7 18.4 26.5 Unknown 0.0 13.9 73.5 36.3

Foster Creek Conservation District Screening Level Macroinvertebrate Assessment
R2 Resource Consultants, Inc. B-35 January 2003 1303.02/Macroinvertebrate.final_1/03
Abundance by Habit (%) Burrowers 53.6 33.3 77.6 57.5 Climbers 21.4 41.7 18.4 26.5 Clingers 25.0 25.0 4.1 15.9 Skater 0.0 0.0 0.0 0.0 Sprawler 0.0 0.0 0.0 0.0
Swimmer 0.0 0.0 0.0 0.0

Foster Creek Conservation District Screening Level Macroinvertebrate Assessment
R2 Resource Consultants, Inc. B-36 January 2003 1303.02/Macroinvertebrate.final_1/03
Table B-5. Benthic macroinvertebrate sampling data for Rock Island Creek, 25 May 2001.
ABUNDANCE
Taxonomic Group Sample
1 Sample
2 Sample
3 Sample
4 Sample
5 Mean
Abundance Standard
Error EPHEMEROPTERA (mayflies) Baetidae Acentrella insignificans - - Baetis bicaudatus 72 18 72 53.8 18.2 Baetis tricaudatus 381 333 654 455.8 100.1 Baetis sp. - - Immature - - Caenidae Caenis - - Ephemerellidae Attenella margarita - -
Caudatella edmundsi - - Drunella spinifera - - Drunella sp. - - Ephemerella 3 0 0 1.0 1.0
Serratella - - Immature - - Heptageniidae Cinygmula - - Epeorus - - Heptagenia/Leucrocuta/Nixe - - Leucrocuta - - Nixe simplicoides - - Rhithrogena - - Stenonema - - Immature - - Leptophlebiidae Paraleptophlebia bicornata - - Paraleptophlebia temporalis 0 5 54 19.7 17.2 Immature - - Siphlonuridae Ameletus - - Tricorythidae Tricorythodes - - ODONATA (dragonflies) Anisoptera Aeshnidae - - Gomphidae - - Ophiogomphus - -
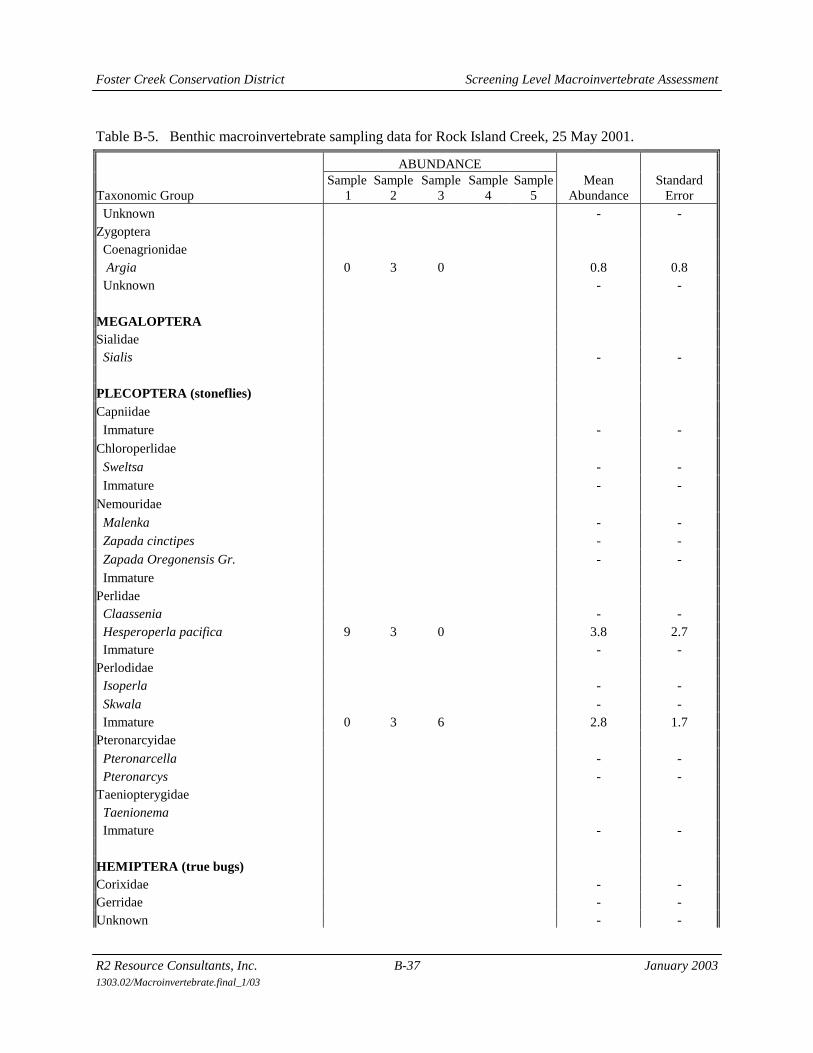
Foster Creek Conservation District Screening Level Macroinvertebrate Assessment
R2 Resource Consultants, Inc. B-37 January 2003 1303.02/Macroinvertebrate.final_1/03
Table B-5. Benthic macroinvertebrate sampling data for Rock Island Creek, 25 May 2001.
ABUNDANCE
Taxonomic Group Sample
1 Sample
2 Sample
3 Sample
4 Sample
5 Mean
Abundance Standard
Error Unknown - - Zygoptera Coenagrionidae Argia 0 3 0 0.8 0.8 Unknown - - MEGALOPTERA Sialidae Sialis - - PLECOPTERA (stoneflies)
Capniidae Immature - -
Chloroperlidae
Sweltsa - -
Immature - -
Nemouridae
Malenka - - Zapada cinctipes - -
Zapada Oregonensis Gr. - -
Immature Perlidae Claassenia - - Hesperoperla pacifica 9 3 0 3.8 2.7 Immature - - Perlodidae Isoperla - -
Skwala - - Immature 0 3 6 2.8 1.7 Pteronarcyidae
Pteronarcella - - Pteronarcys - - Taeniopterygidae Taenionema Immature - - HEMIPTERA (true bugs) Corixidae - - Gerridae - - Unknown - -

Foster Creek Conservation District Screening Level Macroinvertebrate Assessment
R2 Resource Consultants, Inc. B-38 January 2003 1303.02/Macroinvertebrate.final_1/03
Table B-5. Benthic macroinvertebrate sampling data for Rock Island Creek, 25 May 2001.
ABUNDANCE
Taxonomic Group Sample
1 Sample
2 Sample
3 Sample
4 Sample
5 Mean
Abundance Standard
Error TRICHOPTERA (caddisflies) Brachycentridae Brachycentrus - - Micrasema - - Immature - - Glossosomatidae Glossosoma - - Protoptila - -
Helicopsychidae
Helicopsyche - - Hydropsychidae Arctopsyche grandis - - Cheumatopsyche - - Hydropsyche / Ceratopsyche 24 0 0 8.0 8.0 Immature 3 0 0 1.0 1.0 Hydroptilidae Agraylea - - Hydroptila 0 0 12 4.0 4.0 Leucotrichia - - Immature - -
Lepidostomatidae
Lepidostoma - - Leptoceridae Ceraclea - - Nectopsyche - - Oecetis - - Limnephilidae Dicosmoecus 0 3 0 0.8 0.8 Immature - - Philopotamidae Wormaldia - - Polycentropodidae Polycentropus - - Rhyacophilidae
Rhyacophila angelita Grp.
Rhyacophila Betteni Grp.
Rhyacophila vemna/Brunnea Grps. - - Rhyacophila sp. 15 8 0 7.5 4.3
Uenoidae

Foster Creek Conservation District Screening Level Macroinvertebrate Assessment
R2 Resource Consultants, Inc. B-39 January 2003 1303.02/Macroinvertebrate.final_1/03
Table B-5. Benthic macroinvertebrate sampling data for Rock Island Creek, 25 May 2001.
ABUNDANCE
Taxonomic Group Sample
1 Sample
2 Sample
3 Sample
4 Sample
5 Mean
Abundance Standard
Error
Neophylax - - LEPIDOPTERA (moths) Pyralidae Petrophila - - Unknown - - COLEOPTERA (beetles) Curculionidae - - Dytiscidae - - Dytiscus - - Illybius - - Immature 3 8 12 7.5 2.6 Elmidae Ampumixis - - Cleptelmis - - Dubiraphia - - Heterlimnius - - Lara - -
Narpus - - Optioservus 123 113 48 94.5 23.4 Zaitzevia - - Immature - - Haliplidae Haliplus - - Immature - - Hydrophilidae Hydrobius - - Immature - - DIPTERA (true flies)
Athericidae Atherix - -
Blephariceridae
Blepharicera - -
Philorus
Ceratopogonidae - -
Chironomidae - - Chironominae/Chironomini 0 5 6 Chironomus - -

Foster Creek Conservation District Screening Level Macroinvertebrate Assessment
R2 Resource Consultants, Inc. B-40 January 2003 1303.02/Macroinvertebrate.final_1/03
Table B-5. Benthic macroinvertebrate sampling data for Rock Island Creek, 25 May 2001.
ABUNDANCE
Taxonomic Group Sample
1 Sample
2 Sample
3 Sample
4 Sample
5 Mean
Abundance Standard
Error
Dicrotendipes - -
Endochironomus - -
Microtendipes - -
Paracladopelma - - Paralauterborniella - -
Polypedilum - -
Tanytarsini 3 68 18 29.5 19.5 Micropsectra - - Paratanytarsus - -
Rheotanytarsus - -
Tanytarsus - -
Tanypodinae 3 28 102 Macropelopia Procladius - -
Thienenmannimyia Grp. - - Diamesinae - -
Pagastia - -
Potthastia - -
Orthocladiinae 216 155 822 397.7 212.9
Brillia - -
Cardiocladius - - Corynoneura - -
Cricotopus nostococladius - -
Cricotopus bicinctus - -
Cricotopus sp. - -
Diplocladius
Eukiefferiella - - Eukiefferiella Pseudomontana G - -
Nanocladius - -
Orthocladius - -
Paraphaenocladius - -
Parametriocnemus - -
Rheocricotopus - - Synorthocladius - -
Thienemanniella - -
Tvetenia - -
Zalutschia - -
Dixidae - -
Dixa - -

Foster Creek Conservation District Screening Level Macroinvertebrate Assessment
R2 Resource Consultants, Inc. B-41 January 2003 1303.02/Macroinvertebrate.final_1/03
Table B-5. Benthic macroinvertebrate sampling data for Rock Island Creek, 25 May 2001.
ABUNDANCE
Taxonomic Group Sample
1 Sample
2 Sample
3 Sample
4 Sample
5 Mean
Abundance Standard
Error
Empididae Chelifera 6 8 6 6.5 0.5
Hemerodromia - -
Oreogeton 0 3 6 2.8 1.7 Simuliidae - -
Simulium 15 3 6 7.8 3.7
Stratiomyidae - -
Tabanidae - -
Tipulidae 3 0 0 Antocha - - Dicranota 3 0 0 1.0 1.0
Hexatoma - -
Limnophila - -
Tipula - - NON-INSECT TAXA Turbellaria (flatworms) Planariidae - - Unknown - - Aschelminthes Nematoda (roundworms) - - Annelida Hirudinea (leeches) - - Oligochaeta (earthworms) 12 8 0 6.5 3.5 Lumbricidae - - Tubificidae - - Gastropoda (snails) Ancylidae - - Hydrobiidae - - Fluminicola - - Physidae Physella 6 0 6 4.0 2.0 Planorbidae - - Vorticifex - - Pelecypoda (clams, mussels) Sphaeriidae - - Unknown - - Amphipoda (scuds, sideswimmers) Gammarus 0 8 48 18.5 14.9 Hyalella azteca - -

Foster Creek Conservation District Screening Level Macroinvertebrate Assessment
R2 Resource Consultants, Inc. B-42 January 2003 1303.02/Macroinvertebrate.final_1/03
Table B-5. Benthic macroinvertebrate sampling data for Rock Island Creek, 25 May 2001.
ABUNDANCE
Taxonomic Group Sample
1 Sample
2 Sample
3 Sample
4 Sample
5 Mean
Abundance Standard
Error Decapoda Pacifasticus - - Cladocera - - Copepoda - - Isopoda - Caecidotea - - Ostracoda - - Hydracarina (water mites) - - TOTAL INDIVIDUALS 900 775 1878 1184.3 348.7

Foster Creek Conservation District Screening Level Macroinvertebrate Assessment
R2 Resource Consultants, Inc. B-43 January 2003 1303.02/Macroinvertebrate.final_1/03
Benthic macroinvertebrate summary data for Rock Island Creek, 25 May 2001.
Sample 1 Sample 2 Sample 3 Sample 4 Sample 5 Composite Total Abundance (#/sample) 900 775 1,878 1184.3 Density (#/sq-m) 4,737 4,079 9,884 6,233 Taxa Richness (# taxa) 18 20 17 27.0 B-IBI Metric Score 3 3 3 5 Hilsenhoff Biotic Index 5.08 5.08 4.90 5.0 Ephemeroptera Richness 3 3 3 4 B-IBI Metric Score 3 3 3 3 Plecoptera Richness 1 2 1 2 B-IBI Metric Score 1 1 1 1 Trichoptera Richness 3 2 1 5
B-IBI Metric Score 3 3 1 5 EPT Taxa Richness 7 7 5 11 % EPT of Total Abundance 56.3 47.7 42.5 47.1 % Predators 4.0 4.2 1.6 2.8 B-IBI Metric Score 1 1 1 1 % Contribution of Dominant Taxa 80.0 77.4 81.2 80.0 B-IBI Metric Score 1 1 1 1 Intolerant Taxa Richness 1 2 2 2 B-IBI Metric Score 3 3 3 3 Long-Lived Taxa Richness 2 3 1 3 B-IBI Metric Score 3 5 3 5 % Tolerant Taxa 22.2 20.0 35.3 22.2 B-IBI Metric Score 3 3 3 3 B-IBI 21 23 19 27 Abundance by Order (%) Ephemeroptera 50.7 45.8 41.5 44.8 Odonata 0.0 0.3 0.0 0.1 Plecoptera 1.0 0.6 0.3 0.6 Hemiptera 0.0 0.0 0.0 0.0 Trichoptera 4.7 1.3 0.6 1.8 Lepidoptera 0.0 0.0 0.0 0.0 Coleoptera 14.0 15.5 3.2 8.6 Diptera 27.7 34.5 51.4 37.6 Non-Insect Taxa 2.0 1.9 2.9 2.4 Abundance by Food Group (%) Collector-Gatherers 65.3 62.3 47.3 55.1 Scrapers/Grazers 1.0 0.3 0.3 0.5 Shredders 0.0 0.0 0.0 0.0 Filter Feeders 4.7 0.3 0.3 1.4 Predators 4.0 4.2 1.6 2.8 Unknown 25.0 32.9 50.5 40.2

Foster Creek Conservation District Screening Level Macroinvertebrate Assessment
R2 Resource Consultants, Inc. B-44 January 2003 1303.02/Macroinvertebrate.final_1/03
Abundance by Habit (%) Burrowers 25.3 21.6 44.1 34.1 Climbers 0.3 1.0 0.6 0.6 Clingers 22.3 25.2 5.1 13.8 Skater 0.0 0.0 0.0 0.0 Sprawler 1.3 5.2 6.1 0.9
Swimmer 50.3 46.8 44.1 46.3

Foster Creek Conservation District Screening Level Macroinvertebrate Assessment
R2 Resource Consultants, Inc. B-45 January 2003 1303.02/Macroinvertebrate.final_1/03
Table B-6. Benthic macroinvertebrate sampling data for Foster Creek, 23 May 2001.
ABUNDANCE
Taxonomic Group Sample
1 Sample
2 Sample
3 Sample
4 Sample
5 Mean
Abundance Standard Error EPHEMEROPTERA (mayflies) Baetidae Acentrella insignificans - - Baetis bicaudatus 0 6 48 17.8 14.9 Baetis tricaudatus 66 42 238 115.2 61.6 Baetis sp. - - Immature - - Caenidae Caenis - - Ephemerellidae Attenella margarita - - Caudatella edmundsi - - Drunella spinifera - - Drunella sp. - - Ephemerella - -
Serratella - - Immature - - Heptageniidae Cinygmula - - Epeorus - - Heptagenia/Leucrocuta/Nixe - - Leucrocuta - - Nixe simplicoides - - Rhithrogena - - Stenonema - - Immature - - Leptophlebiidae Paraleptophlebia bicornata - - Paraleptophlebia temporalis - - Immature - - Siphlonuridae Ameletus - - Tricorythidae Tricorythodes - - ODONATA (dragonflies) Anisoptera Aeshnidae - - Gomphidae - - Ophiogomphus - -

Foster Creek Conservation District Screening Level Macroinvertebrate Assessment
R2 Resource Consultants, Inc. B-46 January 2003 1303.02/Macroinvertebrate.final_1/03
Table B-6. Benthic macroinvertebrate sampling data for Foster Creek, 23 May 2001.
ABUNDANCE
Taxonomic Group Sample
1 Sample
2 Sample
3 Sample
4 Sample
5 Mean
Abundance Standard Error Unknown - - Zygoptera Coenagrionidae Argia 18 0 0 6.0 6.0 Unknown - - MEGALOPTERA Sialidae Sialis - - PLECOPTERA (stoneflies) Capniidae
Immature - -
Chloroperlidae
Sweltsa - -
Immature - -
Nemouridae Malenka - -
Zapada cinctipes - -
Zapada Oregonensis Gr. - -
Immature Perlidae Claassenia - - Hesperoperla pacifica - - Immature - - Perlodidae Isoperla - -
Skwala - - Immature - - Pteronarcyidae
Pteronarcella - - Pteronarcys - - Taeniopterygidae Taenionema Immature - - HEMIPTERA (true bugs) Corixidae - - Gerridae - - Unknown - -

Foster Creek Conservation District Screening Level Macroinvertebrate Assessment
R2 Resource Consultants, Inc. B-47 January 2003 1303.02/Macroinvertebrate.final_1/03
Table B-6. Benthic macroinvertebrate sampling data for Foster Creek, 23 May 2001.
ABUNDANCE
Taxonomic Group Sample
1 Sample
2 Sample
3 Sample
4 Sample
5 Mean
Abundance Standard Error TRICHOPTERA (caddisflies) Brachycentridae Brachycentrus - -
Micrasema - - Immature - - Glossosomatidae Glossosoma - - Protoptila - -
Helicopsychidae
Helicopsyche - - Hydropsychidae
Arctopsyche grandis - - Cheumatopsyche - - Hydropsyche / Ceratopsyche 6 0 3 2.8 1.7 Immature - - Hydroptilidae Agraylea - - Hydroptila 6 6 3 4.8 1.2 Leucotrichia - - Immature - -
Lepidostomatidae
Lepidostoma 6 12 0 6.0 3.5 Leptoceridae Ceraclea - - Nectopsyche - - Oecetis - - Limnephilidae Dicosmoecus - - Immature - - Philopotamidae Wormaldia - - Polycentropodidae Polycentropus - -
Rhyacophilidae
Rhyacophila angelita Grp.
Rhyacophila Betteni Grp. Rhyacophila vemna/Brunnea Grps. - -
Rhyacophila sp. - -
Uenoidae

Foster Creek Conservation District Screening Level Macroinvertebrate Assessment
R2 Resource Consultants, Inc. B-48 January 2003 1303.02/Macroinvertebrate.final_1/03
Table B-6. Benthic macroinvertebrate sampling data for Foster Creek, 23 May 2001.
ABUNDANCE
Taxonomic Group Sample
1 Sample
2 Sample
3 Sample
4 Sample
5 Mean
Abundance Standard Error
Neophylax - - LEPIDOPTERA (moths) Pyralidae Petrophila - - Unknown - - COLEOPTERA (beetles) Curculionidae - - Dytiscidae - - Dytiscus - - Illybius - - Immature 30 0 0 10.0 10.0 Elmidae Ampumixis - - Cleptelmis - - Dubiraphia - - Heterlimnius - - Lara - -
Narpus - - Optioservus 414 162 240 272.0 74.5 Zaitzevia - - Immature - - Haliplidae Haliplus - - Immature - - Hydrophilidae Hydrobius - - Immature - - DIPTERA (true flies) Athericidae
Atherix - -
Blephariceridae
Blepharicera - -
Philorus
Ceratopogonidae - - Chironomidae - -
Chironominae/Chironomini Chironomus - -

Foster Creek Conservation District Screening Level Macroinvertebrate Assessment
R2 Resource Consultants, Inc. B-49 January 2003 1303.02/Macroinvertebrate.final_1/03
Table B-6. Benthic macroinvertebrate sampling data for Foster Creek, 23 May 2001.
ABUNDANCE
Taxonomic Group Sample
1 Sample
2 Sample
3 Sample
4 Sample
5 Mean
Abundance Standard Error
Dicrotendipes - -
Endochironomus - -
Microtendipes - - Paracladopelma - -
Paralauterborniella - -
Polypedilum - -
Tanytarsini - - Micropsectra - - Paratanytarsus - -
Rheotanytarsus - -
Tanytarsus - -
Tanypodinae Macropelopia Procladius - - Thienenmannimyia Grp. - -
Diamesinae - -
Pagastia - -
Potthastia - -
Orthocladiinae 978 1332 123 810.8 359.0
Brillia - - Cardiocladius - -
Corynoneura - -
Cricotopus nostococladius - -
Cricotopus bicinctus - -
Cricotopus sp. - -
Diplocladius Eukiefferiella - -
Eukiefferiella Pseudomontana G - -
Nanocladius - -
Orthocladius - -
Paraphaenocladius - -
Parametriocnemus - - Rheocricotopus - -
Synorthocladius - -
Thienemanniella - -
Tvetenia - -
Zalutschia - -
Dixidae - - Dixa - -

Foster Creek Conservation District Screening Level Macroinvertebrate Assessment
R2 Resource Consultants, Inc. B-50 January 2003 1303.02/Macroinvertebrate.final_1/03
Table B-6. Benthic macroinvertebrate sampling data for Foster Creek, 23 May 2001.
ABUNDANCE
Taxonomic Group Sample
1 Sample
2 Sample
3 Sample
4 Sample
5 Mean
Abundance Standard Error
Empididae Chelifera - -
Hemerodromia - - Oreogeton - -
Simuliidae - -
Simulium 0 6 5 3.7 1.9
Stratiomyidae 198 192 83 157.5 37.5
Tabanidae - -
Tipulidae Antocha - -
Dicranota 12 0 5 5.7 3.5
Hexatoma - -
Limnophila - -
Tipula - - NON-INSECT TAXA Turbellaria (flatworms) Planariidae - - Unknown - - Aschelminthes Nematoda (roundworms) - - Annelida Hirudinea (leeches) - - Oligochaeta (earthworms) 12 0 18 9.8 5.2 Lumbricidae - - Tubificidae - - Gastropoda (snails) Ancylidae - - Hydrobiidae - - Fluminicola - - Physidae Physella - - Planorbidae 0 6 0 2.0 2.0 Vorticifex - - Pelecypoda (clams, mussels) Sphaeriidae - - Unknown - - Amphipoda (scuds, sideswimmers) Gammarus 210 240 78 175.8 49.9 Hyalella azteca 30 84 43 52.2 16.3

Foster Creek Conservation District Screening Level Macroinvertebrate Assessment
R2 Resource Consultants, Inc. B-51 January 2003 1303.02/Macroinvertebrate.final_1/03
Table B-6. Benthic macroinvertebrate sampling data for Foster Creek, 23 May 2001.
ABUNDANCE
Taxonomic Group Sample
1 Sample
2 Sample
3 Sample
4 Sample
5 Mean
Abundance Standard Error Decapoda Pacifasticus - - Cladocera - - Copepoda - - Isopoda - Caecidotea - - Ostracoda - - Hydracarina (water mites) - - TOTAL INDIVIDUALS 1986 2088 883 1652.2 386.0

Foster Creek Conservation District Screening Level Macroinvertebrate Assessment
R2 Resource Consultants, Inc. B-52 January 2003 1303.02/Macroinvertebrate.final_1/03
Benthic macroinvertebrate summary data for Foster Creek, 23 May 2001
Sample 1 Sample 2 Sample 3 Sample 4 Sample 5 Composite Total Abundance (#/sample) 1,986 2,088 883 1652.2 Density (#/sq-m) 10,453 10,989 4,645 8,696 Taxa Richness (# taxa) 13 12 13 17.0 B-IBI Metric Score 3 3 3 3 Hilsenhoff Biotic Index 4.27 4.49 4.58 4.4 Ephemeroptera Richness 1 2 2 2.0 B-IBI Metric Score 1 1 1 1 Plecoptera Richness 0 0 0 0 B-IBI Metric Score 1 1 1 1 Trichoptera Richness 3 2 2 3
B-IBI Metric Score 3 3 3 3 EPT Taxa Richness 4 4 4 5 % Predators 3.0 0.0 0.6 1.3 B-IBI Metric Score 1 1 1 1 % Contribution of Dominant Taxa 80.7 83.0 49.9 76.2 B-IBI Metric Score 1 1 5 1 Intolerant Taxa Richness 0 1 1 1 B-IBI Metric Score 1 3 3 3 Long-Lived Taxa Richness 1 1 1 1 B-IBI Metric Score 3 3 3 3 % Tolerant Taxa 38.5 58.3 46.2 41.2 B-IBI Metric Score 3 1 3 3 B-IBI 17 17 23 19 Abundance by Order (%) Ephemeroptera 3.3 2.3 32.3 8.1 Odonata 0.9 0.0 0.0 0.4 Plecoptera 0.0 0.0 0.0 0.0 Hemiptera 0.0 0.0 0.0 0.0 Trichoptera 0.9 0.9 0.6 0.8 Lepidoptera 0.0 0.0 0.0 0.0 Coleoptera 22.4 7.8 27.2 17.1 Diptera 59.8 73.3 24.4 59.2 Non-Insect Taxa 12.7 15.8 15.6 14.5 Abundance by Food Group (%) Collector-Gatherers 37.2 25.9 75.4 39.2 Scrapers/Grazers 0.0 0.3 0.0 0.1 Shredders 0.3 0.6 0.0 0.4 Filter Feeders 0.3 0.3 0.8 0.4 Predators 3.0 0.0 0.6 1.3 Unknown 59.2 73.0 23.2 58.6

Foster Creek Conservation District Screening Level Macroinvertebrate Assessment
R2 Resource Consultants, Inc. B-53 January 2003 1303.02/Macroinvertebrate.final_1/03
Abundance by Habit (%) Burrowers 49.8 63.8 15.9 49.7 Climbers 1.8 0.6 0.0 1.0 Clingers 21.5 8.6 28.3 17.3 Skater 0.0 0.0 0.0 0.0 Sprawler 10.6 9.2 9.9 9.9
Swimmer 15.4 17.8 45.9 21.9
Appendix B-2
Screening Level Macroinvertebrate Assessment of Potential Anadromous Fish-Bearing Streams
in WRIAs 44 and 50 During 2002

Foster Creek Conservation District Screening Level Macroinvertebrate Assessment
R2 Resource Consultants, Inc. ii January 2003 1303.10/macroinvertebrate assessment_103
This report is part of a habitat assessment conducted under §2514 watershed planning findings for potentially anadromous fish-bearing streams in Watershed Resource Inventory Areas (WRIAs) 44 and 50 in Douglas County. The report was prepared by R2 Resource Consultants, Inc. under subcontract to Pacific Groundwater Group. It follows the scope for a screening level biological assessment as approved by the WRIAs 44 and 50 Planning Unit in May 2001.
Principal Investigator Ronald F. Campbell
Biologist Catherine M. Morello
Cover photo captions:
Upper left: Stonefly (stock photo).
Middle: Tim Behne (Foster Creek Conservation District) sampling macroinvertebrates in McCartney Creek, June 2002. (photo provided by C. Morello).
Lower right: Embedded substrate conditions in McCartney Creek. (photo provided by C. Morello).

Foster Creek Conservation District Screening Level Macroinvertebrate Assessment
R2 Resource Consultants, Inc. iii January 2003 1303.10/macroinvertebrate assessment_103
CONTENTS
1. INTRODUCTION ................................................................................................................1
2. MACROINVERTEBRATE FIELD METHODS...................................................................2
2.1 SITE LOCATION/DESCRIPTION..........................................................................................3
2.1.1 McCartney Creek ................................................................................................3
2.1.2 Rattlesnake Creek................................................................................................6
2.1.3 Coyote Creek.......................................................................................................7
2.1.4 West Foster Creek ...............................................................................................8
2.1.5 East Foster Creek ................................................................................................9
2.1.6 Other Sites...........................................................................................................9
3. MACROINVERTEBRATE LABORATORY ANALYSIS ................................................. 10
4. MACROINVERTEBRATE DATA ANALYSIS................................................................. 11
5. RESULTS........................................................................................................................... 14
5.1 DENSITY ....................................................................................................................... 14
5.2 TOTAL NUMBER OF TAXA.............................................................................................. 14
5.2.1 Number of Mayfly, Stonefly, and Caddisfly Taxa.............................................. 16
5.2.2 Relative Abundance by Order............................................................................ 16
5.2.3 Intolerant Taxa Richness ................................................................................... 16
5.2.4 Percentage of Tolerant Taxa .............................................................................. 17
5.2.5 Functional Feeding Group Composition ............................................................ 17
5.2.6 Relative Abundance of Long-lived Taxa............................................................ 18
5.2.7 Relative Abundance by Habit ............................................................................ 18
5.2.8 Modified Hilsenhoff Biotic Index ...................................................................... 18
5.2.9 B-IBI................................................................................................................. 18
6. CONCLUSIONS................................................................................................................. 20
6.1 MC CARTNEY CREEK .................................................................................................... 20
6.2 RATTLESNAKE CREEK ................................................................................................... 20
6.3 COYOTE CREEK............................................................................................................. 20

Foster Creek Conservation District Screening Level Macroinvertebrate Assessment
R2 Resource Consultants, Inc. iv January 2003 1303.10/macroinvertebrate assessment_103
6.4 WEST FOSTER CREEK .................................................................................................... 21
6.5 EAST FOSTER CREEK ..................................................................................................... 21
7. REFERENCES ................................................................................................................... 22
APPENDIX A: FIGURES APPENDIX B: TABLES

Foster Creek Conservation District Screening Level Macroinvertebrate Assessment
R2 Resource Consultants, Inc. v January 2003 1303.10/macroinvertebrate assessment_103
FIGURES
Figure 1. McCartney Creek near macroinvertebrate sampling location...............................3
Figure 2. Macroinvertebrate sampling locations in WRIA 44.............................................4
Figure 3. Macroinvertebrate sampling locations in WRIA 50.............................................5
Figure 4. Rattlesnake Creek near macroinvertebrate sampling location. .............................6
Figure 5. Coyote Creek downstream from macroinvertebrate sampling location (with survey measuring tape). .....................................................................................7
Figure 6. West Foster Creek near macroinvertebrate sampling location..............................8
Figure 7. East Foster Creek near macroinvertebrate sampling location...............................9
Figure 8. Macroinvertebrate density (#/m2) in five Columbia River tributaries located in WRIAs 44 and 50. .....................................................................................A-1
Figure 9. Macroinvertebrate taxa richness (# of taxa) in five Columbia River tributaries located in WRIAs 44 and 50. ........................................................A-2
Figure 10. Mayfly taxa richness (# of taxa) in five Columbia River tributaries located in WRIAs 44 and 50. .....................................................................................A-3
Figure 11. Stonefly taxa richness (# of taxa) in five Columbia River tributaries located in WRIAs 44 and 50. .....................................................................................A-4
Figure 12. Caddisfly taxa richness (# of taxa) in five Columbia River tributaries located in WRIAs 44 and 50. .........................................................................A-5
Figure 13. Relative abundance (%) of major macroinvertebrate groups in five Columbia River tributaries located in WRIAs 44 and 50................................A-6
Figure 14. Intolerant macroinvertebrate taxa richness (# of taxa) in five Columbia River tributaries located in WRIAs 44 and 50. ...............................................A-7
Figure 15. Relative abundance (%) of tolerant macroinvertebrate taxa in five Columbia River tributaries located in WRIAs 44 and 50................................A-8
Figure 16. Relative abundance (%) of macroinvertebrate functional feeding groups in five Columbia River tributaries located in WRIAs 44 and 50.........................A-9
Figure 17. Long-lived macroinvertebrate taxa richness (# of taxa) in five Columbia River tributaries located in WRIAs 44 and 50. ............................................. A-10
Figure 18. Relative abundance (%) of macroinvertebrate habits in five Columbia River tributaries located in WRIAs 44 and 50. ............................................. A-11
Foster Creek Conservation District Screening Level Macroinvertebrate Assessment
R2 Resource Consultants, Inc. vi January 2003 1303.10/macroinvertebrate assessment_103
TABLES
Table 1. Cumulative M HBI scores and the corresponding evaluation of the degree
of organic pollution. ........................................................................................ 13
Table 2. Summary of biometrics describing the late spring macroinvertebrate communities in five streams in WRIAs 44 and 50............................................ 15
Table 3. Summary of biometrics describing the late spring macroinvertebrate communities in five streams in WRIAs 44 and 50............................................ 19

Foster Creek Conservation District Screening Level Macroinvertebrate Assessment
R2 Resource Consultants, Inc. 1 January 2003 1303.10/macroinvertebrate assessment_103
1. INTRODUCTION
Benthic macroinvertebrates are one part of the stream health monitoring R2 Resource Consultants (R2) was contracted to perform for the Foster Creek Conservation District in spring 2001 under H.B. 2514 Watershed Analysis funding. This project was continued in 2002. Benthic macroinvertebrates offer many advantages when used to monitor stream health. Macroinvertebrate communities are diverse, abundant, easy to collect, sedentary, and have relatively short life spans of several months to a few years (Platts et al. 1983). These characteristics allow macroinvertebrate communities to reflect local conditions and the recent past, consequently making excellent indicators of proximate, acute impacts. They also represent an important food source for resident and anadromous fishes. The 2002 macroinvertebrate monitoring goal was to characterize the macroinvertebrate fauna in five fish-bearing streams in Douglas and Okanogan Counties. Specific qualities of the macroinvertebrate community that were characterized are described below in the Macroinvertebrate Data Analysis section. This study is a continuation of the monitoring work performed by R2 Resource Consultants in 2001 (see R2 Resource Consultants 2001).

Foster Creek Conservation District Screening Level Macroinvertebrate Assessment
R2 Resource Consultants, Inc. 2 January 2003 1303.10/macroinvertebrate assessment_103
2. MACROINVERTEBRATE FIELD METHODS
Sampling methods generally followed the Washington Department of Ecology’s (Ecology) protocols for benthic macroinvertebrates (Plotnikoff 1994). Three samples were collected from each of five streams (described below) using a D-frame kick-net sampler fitted with 500-micron (µm) Nitex mesh. All three samples were collected in riffles or shallow runs possessing coarse gravel to small cobble substrates. All samples were collected from areas possessing water depths between 0.0 and 1.0 ft deep, and mean water column velocities between 1.0 and 3.0 ft per second. Sample locations were randomly selected, although sampling was not conducted at a specific location unless depths and water velocities were within the suitable range specified above. Depths were measured with a wading rod and velocities were measured with a Swoffer current meter (Model 2100). Each sample was collected from an area of the stream bottom 1 ft wide (i.e., width of kick net) and 2 ft long (i.e., 2 ft2; 0.19 m2). The stream bottom was vigorously kicked for a period of one minute. Large substrates were scrubbed by hand to dislodge remaining organisms. Substrates were sampled to a depth of approximately 0.2 ft (6.0 cm). The contents of the kick-net were dumped into a 5-gallon bucket and the net was backflushed several times with river water to dislodge as many organisms as possible, with the rinsate collecting in the bucket. The contents of the bucket were swirled to entrain light particles. The entrained solution was then poured into a 500-micron mesh sieve. After rinsing, swirling, and pouring the contents of the bucket into the sieve three times, the heavier particles remaining in the bucket were examined and macroinvertebrates noted and removed (e.g., crayfish). The contents of the sieve were then emptied into a 16-oz, wide-mouth glass Mason jar with a rubber spatula. The sieve was subsequently rinsed with 86 percent ethyl alcohol and the rinsate was collected in the Mason jar. Any invertebrates still clinging to the kicknet mesh were removed with fine point forceps or by hand and placed into the Mason jar. The depth, mean column velocity, and substrate composition of each sampling location were recorded in a field notebook. Water temperatures were also measured with a hand-held thermometer at the time of sampling. All three samples were preserved in separate wide-mouth Mason jars to allow for independent statistical analysis. The samples were labeled (location, date of sampling, and sample identification number), and preserved with an 86 percent solution of ethyl alcohol.

Foster Creek Conservation District Screening Level Macroinvertebrate Assessment
R2 Resource Consultants, Inc. 3 January 2003 1303.10/macroinvertebrate assessment_103
2.1 SITE LOCATION/DESCRIPTION The five streams surveyed in 2002 are located in WRIAs 44 and 50. Sample site locations are shown in Figures 2 and 3 and described below. 2.1.1 McCartney Creek Samples were collected from riffle habitats in McCartney Creek approximately 2 miles north of the Rattlesnake Creek confluence. McCartney Creek substrates were moderately embedded with fine silt and sand (Figure 1). The stream channel contains some riparian vegetation. Mean velocities and depths measured during the kick net sampling were 1.16 fps and 0.52 feet. Water temperature at the time of sampling (June 5th, 1300 hrs) was 20.0°C.
Figure 1. McCartney Creek near macroinvertebrate sampling location.

Fig
ure
2.
Mac
roin
vert
ebra
te s
ampl
ing
loca
tions
in W
RIA
44.

Fig
ure
3.
Mac
roin
vert
ebra
te s
ampl
ing
loca
tions
in W
RIA
50.

Foster Creek Conservation District Screening Level Macroinvertebrate Assessment
R2 Resource Consultants, Inc. 6 January 2003 1303.10/macroinvertebrate assessment_103
2.1.2 Rattlesnake Creek Samples in Rattlesnake Creek were collected from riffle habitats just east of the McCartney Creek confluence. The sample site is located in a wide grassy valley with little to no riparian shading (Figure 4). Mean sample velocity was measured at 0.67 fps. Mean sample depth was 0.32 feet. Samples at this site were taken at velocities less than those stated in the protocol due to lack of available streamflow. The instream temperature was measured as 16°C.
Figure 4. Rattlesnake Creek near macroinvertebrate sampling location.

Foster Creek Conservation District Screening Level Macroinvertebrate Assessment
R2 Resource Consultants, Inc. 7 January 2003 1303.10/macroinvertebrate assessment_103
2.1.3 Coyote Creek Samples were collected from riffle habitats in Coyote Creek approximately 0.25 miles upstream from the River Road bridge crossing. The riparian zone was fairly well shaded with willow and hawthorn trees and shrubs (Figure 5). Adult trout were observed near the sample locations. Water temperatures in Coyote Creek were relatively cool, measuring 10°C at survey time. Mean sample velocity was measured to be 1.94 fps. Mean sample depth was 0.43 feet.
Figure 5. Coyote Creek downstream from macroinvertebrate sampling location (with survey measuring tape).

Foster Creek Conservation District Screening Level Macroinvertebrate Assessment
R2 Resource Consultants, Inc. 8 January 2003 1303.10/macroinvertebrate assessment_103
2.1.4 West Foster Creek Samples were collected from riffle habitats in West Foster Creek approximately 1.75 miles upstream of the Bridgeport diversion dam. The streambed at this site is highly embedded with fine sediments (Figure 6). The channel contained sparse mature riparian vegetation. Mean sample velocity at West Foster Creek was 0.99 fps. Mean sample depth 0.53 feet. Water temperature was 19°C.
Figure 6. West Foster Creek near macroinvertebrate sampling location.

Foster Creek Conservation District Screening Level Macroinvertebrate Assessment
R2 Resource Consultants, Inc. 9 January 2003 1303.10/macroinvertebrate assessment_103
2.1.5 East Foster Creek Samples were collected from riffle habitats in East Foster Creek just upstream from its confluence with West Foster Creek. Riparian vegetation provided sparse shading of the stream channel (Figure 7). The sample sites contained moderately high embedded substrates. Samples were collected at velocities less than stated in the protocol due to lack of streamflow. Mean velocity of the sample sites was 0.88 fps. Mean sample depth was 0.3 feet. Water temperature was moderately high, at 22°C.
Figure 7. East Foster Creek near macroinvertebrate sampling location. 2.1.6 Other Sites Sample sites from the previous survey year were revisited during 2002. These sites include Rock Island, Moses Coulee, Douglas and Pine Canyon Creeks. Water temperatures measured at the sites were respectively: 13°C, dry, 17°C and 10°C. Moses Coulee Creek, observed at the CRO bridge crossing just upstream from the Columbia confluence, contained no water at survey time. The other three streams were wetted with an estimated 2-10 cfs of streamflow.

Foster Creek Conservation District Screening Level Macroinvertebrate Assessment
R2 Resource Consultants, Inc. 10 January 2003 1303.10/macroinvertebrate assessment_103
3. MACROINVERTEBRATE LABORATORY ANALYSIS
Following field collection, the samples were transported to the laboratory for processing. Laboratory processing of the macroinvertebrate samples followed protocols described in Barbour et al. (1999) and consisted of: 1) large organic material not removed in the field was rinsed, visually inspected for invertebrates, and discarded; 2) contents from a single sample were then spread evenly over a gridded pan approximately 6 cm by 6 cm (2.5 x 2.5 in.); and 3) squares within the gridded pan were randomly selected and invertebrates were removed until 300 organisms were encountered. In some cases, obtaining 300 organisms meant enumerating the entire sample. The encountered invertebrates were then identified using keys provided in Merritt and Cummins (1996), Pennak (1978), Stewart and Stark (1993), and Wiggins (1998). Most benthic macroinvertebrates were identified to the genus or species level using a zoom stereo microscope. Taxa representing the chironomids (midges), Turbellaria (flatworms), Aschelminthes (roundworms), Annelids (leeches and earthworms), Pelecypoda (clams and mussels), Isopoda (aquatic sowbugs), and Hydracarina (water mites) or immatures of some taxa were identified to the family or higher level. A voucher specimen of each identified taxon was preserved in a vial with a solution of 86 percent ethyl alcohol.

Foster Creek Conservation District Screening Level Macroinvertebrate Assessment
R2 Resource Consultants, Inc. 11 January 2003 1303.10/macroinvertebrate assessment_103
4. MACROINVERTEBRATE DATA ANALYSIS
Following taxonomic identification and enumeration of each sample, the abundance of each taxonomic group was entered into a computer spreadsheet developed to calculate the key biotic metrics. The following metrics and biotic indices were calculated for each invertebrate sample analyzed. Density – Density is calculated as the number of individuals per unit area (i.e., m2). Density values could be estimated from the samples because they were obtained from a standardized collection area (0.19 m2). Taxa Richness – Taxa richness is the total number of unique macroinvertebrate taxa present in the combined samples. This metric generally increases with enhanced water quality and/or habitat diversity, and it is used as a relative measurement of the health of the benthic invertebrate community. Mayfly, Stonefly, and Caddisfly (EPT) Taxa Richness – This metric describes the number of distinct taxa within the insect orders Ephemeroptera (mayflies), Plecoptera (stoneflies), and Trichoptera (caddisflies). These insect orders are relatively sensitive to habitat disturbance or water quality degradation and are important items in fish diets. Taxa richness values will be calculated separately for mayflies, stoneflies, and caddisflies because certain human disturbances can decrease the diversity of one order and not the others. The separate taxa richness values generally increase with improving water quality. Consequently, these indicators are widely used for overall stream health. Intolerant Taxa Richness – Intolerant taxa are known to be very sensitive to stream disturbance. The tolerance ratings were determined for each taxa based upon the protocol outlined in (Wisseman 2002). For this report, intolerant taxa are defined as sensitive species present in water of sufficient quality (i.e., temperature, oxygenation) to support salmonid rearing. Percent Tolerant Taxa – Percent tolerant taxa is the relative abundance of all invertebrates in a sample that is considered to be tolerant to disturbance. The tolerance ratings were determined for each taxonomic group based upon Wisseman 2002. For the purposes of this study, tolerant taxa were defined as taxa that are present in the stream category of open, warm nutrient-enriched streams.

Foster Creek Conservation District Screening Level Macroinvertebrate Assessment
R2 Resource Consultants, Inc. 12 January 2003 1303.10/macroinvertebrate assessment_103
Functional Feeding Group Classification – Each aquatic invertebrate taxa was placed in one of five functional feeding groups, to categorize the trophic status (i.e., food requirements) of a particular taxa. The functional feeding group categories that were employed in our analysis were: 1) grazers (or scrapers), which feed upon attached algae or periphyton; 2) shredders, which feed upon coarse particulate organic matter (CPOM) such as leaves; 3) collectors, which feed upon fine particulate organic matter (FPOM) deposits such as detritus; 4) filter feeders, which feed upon FPOM within the water column; and 5) predators. Invertebrate functional feeding groups were determined from the literature, including classifications provided for invertebrate genera by the EPA (Barbour et al. 1999) and Merritt and Cummins (1996). Long-Lived Taxa Richness – Long-lived taxa are organisms that complete their immature life cycle in more than one year. Because they are long-lived, they cannot be exposed to single, catastrophic events that occur infrequently (every one or more years) or to more regular, subtle disturbances that repeatedly interrupt their life cycle. Their presence in a stream suggests a lack of such disturbances. Representative long-lived species include certain mayfly and stonefly species as well as many snails, mussels and riffle beetles. Modified Hilsenhoff Biotic Index – This index is used to portray the overall pollution tolerance of the benthic invertebrate community as a single value (Barbour et al. 1999). Tolerance values for individual organisms range from 1 to 10, with 1 describing very little or no tolerance to organic pollution and 10 describing very high tolerance to organic pollution. The cumulative score for the benthic community results in a water quality and degree of organic pollution rating (Table 1). The Hilsenhoff Biotic Index (HBI) is calculated as: HBI = ∑ xiti / n where xi is number of individuals within a given taxa, ti is the tolerance value for this taxa, and n the total number of organisms in a sample. The HBI tolerance values for each invertebrate taxonomic group were obtained from Hilsenhoff (1987). The HBI was calculated to compare with values determined from samples collected by the Washington Department of Ecology in October 1998 in other local streams. Benthic Index of Biotic Integrity – The Benthic Index of Biotic Integrity (B-IBI) is a relatively new multi-metric index used to assess the biotic integrity of streams. The B-IBI is a modified version of the IBI that was first developed to study fish communities in midwestern streams (Karr 1991). The modification involves the use of aquatic macroinvertebrates rather than fish to identify artificial or human disturbances.

Foster Creek Conservation District Screening Level Macroinvertebrate Assessment
R2 Resource Consultants, Inc. 13 January 2003 1303.10/macroinvertebrate assessment_103
Table 1. Cumulative M HBI scores and the corresponding evaluation of the degree of organic
pollution.
Cumulative HBI Score Degree of Organic Pollution
0.00 to 3.50 No apparent organic pollution
3.51 to 4.50 Possible slight organic pollution 4.51 to 5.50 Some organic pollution
5.51 to 6.50 Fairly significant organic pollution 6.51 to 7.50 Significant organic pollution 7.51 to 8.50 Very significant organic pollution
8.51 to 10.00 Severe organic pollution
The B-IBI incorporates a number of metrics or attributes of the macroinvertebrate community that change in predictable ways in response to human disturbance. The metrics used in the calculation of the B-IBI were consistent with the metrics used by Ecology in their calculation of biotic integrity and included: 1) total taxa richness, 2) Ephemeroptera taxa richness, 3) Plecoptera taxa richness, 4) Trichoptera taxa richness, 5) intolerant taxa richness, 6) long-lived species taxa richness, 7) percentage of tolerant taxa, 8) percentage of predators, and 9) percentage of the three most numerically dominant taxa. Each metric in the B-IBI is given a score to reflect the level of disturbance that is detected by the metric (5 for minimal, 3 for moderate, and 1 for severe disturbance). Each metric score is summed to calculate the total B-IBI value. Ecology’s Ambient Biological Monitoring Program rates B-IBI scores as follows:
• 33 to 45 = natural biological conditions;
• 21 to 33 = slight impairment; and
• 0 to 21 = obvious impairment. Multi-metric indexes like the B-IBI are believed to be better at detecting disturbances than single metric indexes (e.g., presence or absence of indicator species) because they use a number of biological attributes that integrate information from ecosystem, community, population, and individual levels (Barbour et al. 1995). Ecology completed macroinvertebrate monitoring previously in 1993 in Douglas Creek and other Columbia Basin drainages as part of a statewide biological assessment. Metrics examined by Ecology that were common to this study included total taxa, and stonefly, mayfly, and caddisfly richness B-IBI. The 1993 data enable a comparison with these monitoring results.

Foster Creek Conservation District Screening Level Macroinvertebrate Assessment
R2 Resource Consultants, Inc. 14 January 2003 1303.10/macroinvertebrate assessment_103
5. RESULTS
Macroinvertebrate monitoring results are summarized in Table 2 and displayed in Figures 7-17 in the appendix of this report. Results for each metric are described below. 5.1 DENSITY Macroinvertebrate density in the five streams ranged from 1,233 to 17,439 organisms/m2 (Figure 8). The highest density was recorded at McCartney Creek. The lowest density was calculated for East Foster Creek. High macroinvertebrate densities do not necessarily indicate a healthy stream. Conversely, high density coupled with low diversity could indicate disturbed conditions. Similarly, low macroinvertebrate densities have been measured in pristine habitats with excellent water quality. 5.2 TOTAL NUMBER OF TAXA Taxa richness is generally considered to be one of the most useful metrics to describe biological integrity in streams. Macroinvertebrate taxa richness in the five streams ranged from 18 to 32 (Figure 9). McCartney and Coyote Creeks had the highest richness values (32 and 30, respectively). East Foster and Rattlesnake Creek had the lowest taxa richness (18 and 23, respectively). The total number of macroinvertebrate taxa in a stream reflects the diversity of the benthic community and is typically directly related to stream health. The taxa richness recorded at East Foster is the lowest of the 2002 streams sampled. Instream temperature in East Foster Creek was measured at 22.0°C, which may have affected taxa richness. The lower taxa richness of Rattlesnake Creek is likely in response to low overall streamflow. The taxa richness in McCartney Creek (32) is in the same range as that measured by Ecology in the North Fork of Asotin Creek, a Columbia Basin stream that represented the best biological conditions on the east side of the cascades during a 1993 biosurvey of macroinvertebrate communities throughout the state (Plotnikoff 1995). However, the North Fork of Asotin Creek is not entirely representative of streams located in the central portion of the Columbia Basin.

Foster Creek Conservation District Screening Level Macroinvertebrate Assessment
R2 Resource Consultants, Inc. 15 January 2003 1303.10/macroinvertebrate assessment_103
Table 2. Summary of biometrics describing the late spring macroinvertebrate communities in five streams in WRIAs 44 and 50.
Site Density (#/sq-m) Taxa Richness
Mayfly Richness Stonefly Richness
Caddisfly Richness
EPT Taxa Richness
Tolerant Taxa (%)
Intolerant Taxa
Richness
Long-Lived Taxa
Coyote Creek 3,276 30 4 3 6 13 20.0 1 8 East Foster Creek 1,233 18 3 0 0 3 38.9 1 1 West Foster Creek 6,280 25 3 0 2 5 44.0 1 3 McCartney Creek 17,439 32 4 0 5 9 40.6 3 5 Rattlesnake Creek 5,979 23 1 0 2 3 30.4 1 2
Site Collectors (%) Grazers (%) Shredders (%) Filter Feeders (%) Predators (%) Unknown (%) Coyote Creek 81.4 2.7 5.2 4.2 0.7 5.7 East Foster Creek 24.6 0.1 0.0 35.4 6.0 33.9 West Foster Creek 62.3 0.6 0.0 14.9 1.1 21.1 McCartney Creek 72.0 5.7 0.4 6.6 0.6 14.6 Rattlesnake Creek 39.3 3.9 0.1 31.6 0.5 24.6
Site Mayflies (%) Caddisflies (%) Damselflies (%) Beetles (%) True Flies (%) Non-Insects (%) True Bugs (%) Moths (%) Coyote Creek 15.0 3.9 0.0 69.6 6.2 3.0 0.7 0.1 East Foster Creek 20.9 0.0 0.0 8.9 66.2 1.1 2.9 0.0 West Foster Creek 12.8 2.2 0.1 27.3 55.7 1.3 0.0 0.5 McCartney Creek 54.7 2.3 0.1 10.5 19.3 12.8 0.3 0.0 Rattlesnake Creek 0.7 2.8 0.0 34.5 26.1 36.0 0.0 0.0
Site Burrowers
(%) Climbers (%) Clingers (%) Skaters (%) Sprawlers (%) Swimmers (%) Coyote Creek 5.4 0.3 79.9 0.0 0.6 12.1 East Foster Creek 24.7 6.0 42.6 0.0 1.5 21.8 West Foster Creek 19.1 0.4 46.2 0.0 20.6 13.6 McCartney Creek 4.3 0.6 30.8 0.0 20.3 42.0 Rattlesnake Creek 27.6 0.1 43.1 0.0 0.4 27.3

Foster Creek Conservation District Screening Level Macroinvertebrate Assessment
R2 Resource Consultants, Inc. 16 January 2003 1303.10/macroinvertebrate assessment_103
5.2.1 Number of Mayfly, Stonefly, and Caddisfly Taxa The number of mayfly (Ephemeroptera) taxa in the streams ranged from 1 to 4 (Figure 10). McCartney and Coyote Creeks had the highest mayfly richness values, both measured at 4. Rattlesnake Creek had the lowest mayfly taxa richness with a single taxa. For reference, mayfly taxa richness in the North Fork of Asotin Creek in 1993 was 5.0. Stoneflies (Plecoptera) were the rarest of the three insect orders; taxa richness values ranged from 0 to 3 (Figure 11). Coyote Creek had the peak number of stonefly taxa, while no stoneflies were identified in any of the other sampled creeks. The number of stonefly taxa recorded in the North Fork of Asotin Creek in 1993 was 5. Thus, the low number of stonefly taxa identified during this monitoring indicates some kind of habitat disturbance or unsuitable water quality. Stoneflies are typically cold water organisms and the warm water temperatures recorded in East and West Foster and Rattlesnake and McCartney Creeks likely explains their absence in these systems. Caddisflies (Trichoptera) were relatively common in each stream with richness values ranging from 0 to 6 (Figure 12). Peak caddisfly richness was recorded in Coyote and McCartney Creeks. No caddisflies were found in East Foster Creek. Caddisfly richness in the North Fork of Asotin Creek in 1993 was 8.0, suggesting that all streams in this study had moderate to low caddisfly diversity. Similar to stonefly, caddisflies are typically found in streams with little habitat disturbance, and good water quality. 5.2.2 Relative Abundance by Order
East and West Foster Creeks were dominated by true flies (Diptera) (66.2 and 55.7%, respectively), but also included beetles (Coleoptera) (8.9 and 27.3%, respectively), mayflies (20.9 and 12.8%, respectively), and less than 3% each of caddisfly, damselfly (Odonata), moths (Lepidoptera), true bugs (Hemiptera) and non-insects (Figure 13). McCartney Creek was dominated by mayflies (54.7%), but also included 19.3% true flies, 10.5% beetles, and 12.8% non-insects. Rattlesnake Creek contained 36% non-insects, 34.5% beetles, and 26.1% true flies. Coyote Creek was dominated by beetles, with 69.6%, but also contained 15.0% mayflies. A wide variety of macroinvertebrate group representatives indicates a number of different permanent microhabitats are available in a particular riffle. 5.2.3 Intolerant Taxa Richness The number of intolerant (sensitive) taxa in each stream was low (1 to 3 or not more than 10% for any site) (Figure 14). Coyote Creek contained only one intolerant taxa. McCartney Creek

Foster Creek Conservation District Screening Level Macroinvertebrate Assessment
R2 Resource Consultants, Inc. 17 January 2003 1303.10/macroinvertebrate assessment_103
had three intolerant taxa. Intolerant taxa are those most sensitive to water quality degradation or habitat disturbances. The presence of intolerant taxa indicates good water quality and natural, undisturbed habitat. 5.2.4 Percentage of Tolerant Taxa The percentage of tolerant taxa in the five streams ranged from 20 to 44 percent (Figure 15). West Foster and McCartney creeks had the highest relative abundance of tolerant taxa (44.0 and 40.6%, respectively). Tolerant taxa percentages at the other three creeks ranged from (20.0-38.9%). Coyote Creek had the lowest relative abundance of tolerant taxa. The presence of tolerant taxa is not necessarily indicative of unhealthy streams, as tolerant taxa can be present under undisturbed, as well as disturbed conditions. However, coupled with the results of other metrics, a high percentage of tolerant taxa may reflect some degree of habitat or water quality disturbance. In addition, numerous Ostracoda were found in Rattlesnake Creek. These organisms are a tolerant species often found in association with vegetated substrates. 5.2.5 Functional Feeding Group Composition Overall, collector-gatherers were the most common functional feeding group for all streams sampled except East Foster Creek (Figure 16). East Foster Creek was dominated by filter feeders (35.4%) and unspecific feeding groups (33.9%). Overall, the lack of shredders found in the study sites indicates a low amount of leaf litter, or lack of riparian leaf litter input. The high percentages of filter feeders found in East Foster and Rattlesnake Creeks (35.4% and 31.6% respectively) may indicate high suspended-organic concentrations, which may be associated with organic pollution, extensive filamentous algae growth or lake outflows (McGuire 1997). A large amount of algae growth was present in Rattlesnake Creek. A large percentage of the fauna in some streams had an unknown functional group classification because chironomids comprised a substantial percentage of the fauna. In this study, chironomids were not identified to the taxonomic level that allowed an accurate identification of functional group classification. If the functional classifications of the chironomids were known, the relative abundance of collector-gatherers may change. Most of the unidentified chironomids are from the genus Orthocladiinae, which contains primarily collector-gatherers (Merritt and Cummins 1996).

Foster Creek Conservation District Screening Level Macroinvertebrate Assessment
R2 Resource Consultants, Inc. 18 January 2003 1303.10/macroinvertebrate assessment_103
5.2.6 Relative Abundance of Long-lived Taxa There was a very high abundance (8 taxa or 27 percent of total taxa) of long-lived taxa in Coyote Creek (Figure 17). The presence of long-lived taxa suggests the lack of a recent single episode of severe disturbance or more regular chronic disturbances. East Foster and Rattlesnake Creeks contained one and two long-lived taxa respectively, implying more dynamic habitat conditions are present in these streams at low stream flows. 5.2.7 Relative Abundance by Habit Clingers, swimmers and burrowers were the most common habits employed by the macroinvertebrates in the five streams (Figure 18). Clingers were most common in East and West Foster, Rattlesnake and Coyote Creeks, while swimmers dominated the benthic community in McCartney Creek. The high relative abundance of clingers in most of the streams suggests good habitat conditions and minimal influence from inputs of fine sediments. Inputs of fine sediment tend to fill the small spaces and pores between rocks, where clingers typically reside. Swimmers can be found in a variety of habitats and have a high propensity to drift. These characteristics make their presence in macroinvertebrate samples quite common. A relatively high percentage of burrowers in East Foster, West Foster and Rattlesnake creeks compared to the other sites indicates either the presence of soft substrate or flow cessation. 5.2.8 Modified Hilsenhoff Biotic Index Coyote Creek had the lowest HBI value of the five creeks surveyed, measuring 4.1 (see Table 3 below). However, this value still indicates possible slight organic pollution. Modified HBI values were similar for West Foster and McCartney creeks, 5.5 and 5.1 respectively. Theses values are categorized as containing some organic pollution. Rattlesnake Creek and East Fork Foster creeks had the highest values measured at 5.6, indicating fairly significant organic pollution. 5.2.9 B-IBI B-IBI values for the five streams surveyed ranged from a high of 31 at McCartney and Coyote creeks to a low of 21 at East Foster and Rattlesnake creeks. West Foster Creek received a B-IBI score of 27. These scores indicate that McCartney, West Foster and Coyote creeks contain slight impairment of natural biological conditions. Rattlesnake and East Foster creeks contain obvious impairment of natural biological conditions.

Foster Creek Conservation District Screening Level Macroinvertebrate Assessment
R2 Resource Consultants, Inc. 19 January 2003 1303.10/macroinvertebrate assessment_103
Table 3. Summary of biometrics describing the late spring macroinvertebrate communities in five
streams in WRIAs 44 and 50.
Site B-IBI Impairment Rating M- HBI Organic Equivalent
Rating McCartney Creek 31 Slight 5.1 Some Rattlesnake Creek 21 Obvious 5.6 Fairly significant Coyote Creek 31 Slight 4.1 Possible, slight West Foster Creek 27 Slight 5.5 Some East Foster Creek 21 Obvious 5.6 Fairly significant

Foster Creek Conservation District Screening Level Macroinvertebrate Assessment
R2 Resource Consultants, Inc. 20 January 2003 1303.10/macroinvertebrate assessment_103
6. CONCLUSIONS
Late-spring/early summer monitoring of macroinvertebrate communities in five fish-bearing streams in WRIAs 44 and 50 suggest a similar range of habitat conditions exist between the streams. The majority of the taxa exhibit clinging habits that allow them to attach to rocks and use relatively clean interstitial spaces within the streambed. The macroinvertebrate community in most streams primarily consisted of collector-gatherers, which reflected the seasonal availability of food resources and an abundance of fine particulate organic matter (FPOM). The data imply relatively good water quality and habitat conditions occur in McCartney and Coyote Creek. Habitat seems to be relatively degraded in East and West Foster creeks. The highly vegetative nature and low flow conditions of Rattlesnake Creek compared to the other sites may influence the macroinvertebrate community present. Nevertheless, indications are that from a fish habitat and water quality perspective, conditions in Rattlesnake Creek are impaired. 6.1 MC CARTNEY CREEK McCartney Creek contained the highest macroinvertebrate density and the second highest EPT richness. McCartney Creek contained three intolerant taxa, and five long-lived taxa. These results indicate that habitat is relatively healthy and undisturbed in this stream system. 6.2 RATTLESNAKE CREEK Rattlesnake Creek had the second lowest number of taxa and the lowest EPT richness of the five streams. Overall, Rattlesnake Creek is highly vegetated and contains minimal flow. It is possible these conditions were not conducive to the macroinvertebrate sampling methods used during the 2002 survey. This stream does not seem to provide a diverse and robust macroinvertebrate community. 6.3 COYOTE CREEK Although Coyote Creek had the second lowest macroinvertebrate density of the streams studied, it possessed the second highest total taxa richness and the highest EPT richness values. In addition, the number of long-lived taxa richness the highest. The high relative abundance of clinger taxa indicates little influence of fine sediment deposition in Coyote Creek. These macroinvertebrate data suggest habitat and water quality conditions are good relative to the other sampled streams. Resident trout were observed during the macroinvertebrate sampling in Coyote Creek.

Foster Creek Conservation District Screening Level Macroinvertebrate Assessment
R2 Resource Consultants, Inc. 21 January 2003 1303.10/macroinvertebrate assessment_103
6.4 WEST FOSTER CREEK While West Foster Creek had the second highest macroinvertebrate density of the five streams surveyed it possesses only a moderate diversity suggesting some level of stream disturbance is occurring in this stream. Such disturbances may be related to warm water temperatures, fine sediment accumulations, low streamflows, or other water quality problems. 6.5 EAST FOSTER CREEK East Foster Creek had the lowest macroinvertebrate density, the second lowest number of taxa, and the lowest EPT (tied with Rattlesnake Creek) of the five streams surveyed. Only one long-lived taxa was found in East Foster Creek. These results indicate water quality and habitat conditions are degraded in East Foster Creek. The instream temperature was high, measuring 22°C. These warm temperatures may be depressing stonefly taxa richness. The dominant functional feeding group in East Foster Creek was filter feeders, totaling 35 percent. This value is an indicator of slow-moving water with high nutrients and an abundance of algae entrained in the water column.

Foster Creek Conservation District Screening Level Macroinvertebrate Assessment
R2 Resource Consultants, Inc. 22 January 2003 1303.10/macroinvertebrate assessment_103
7. REFERENCES
Barbour, M.T., J. Gerritsen, and J.R. Karr. 1995. Multimetric approach for establishing
biocriteria and measuring biological condition. Pages 63-77 in W. S. Davis and T. P. Simon, editors. Biological assessment and criteria. Tools for water resource planning and decision making. Lewis Publishers, Boca Raton, FL.
Barbour, M.T., J. Gerritsen, B.D. Snyder, and J.B. Stribling. 1999. Rapid Bioassessment Protocols for use in streams and wadeable rivers: periphyton, benthic macroinvertebrates and fish, Second Edition. EPA 841-B-99-002. U.S. Environmental Protection Agency; Office of Water; Washington, D.C.
Cummins, K.W., and R.W. Merritt. 1996. Ecology and distribution of aquatic insects. Pages 74-86 in Merritt and Cummins (editors). An introduction to the aquatic insects of North America, third edition. Kendall/Hunt Publishing Company, Dubuque, IA.
Hilsenhoff, W.L. 1987. An improved biotic index of organic stream pollution. Great Lakes Entomologist 20: 31-39.
Karr, J.R. 1991. Biological integrity: a long-neglected aspect of water resource management. Ecological Applications 1: 66-84.
McGuire, Daniel L. 1997. Clark Fork River macroinvertebrate community biointegrity: 1995 assessment. Prepared for Montana Department of Environmental Quality Planning, Prevention and Assistance Division.
Merritt, R.W. and K.W. Cummins. 1996. An introduction to the aquatic insects of North America. Third edition. Kendall/Hunt Publishing Company, Dubuque, IA.
Pennak, R.W. 1978. Freshwater invertebrates of the United States. Third edition. John Wiley & Sons, Inc. New York, NY.
Platts, W.S., W.F. Megahan, and G.W. Minshall. 1983. Methods for evaluating stream, riparian, and biotic conditions. U.S. Department of Agriculture, U.S. Forest Service, Ogden, UT. General technical report INT-138.
Plotnikoff, R.W. 1994. Instream biological assessment monitoring protocols: benthic macroinvertebrates. Publication #94-113, Washington Department of Ecology, Olympia, WA.
Plotnikoff, R.W. 1995. Ambient monitoring instream biological assessment: Progress report of 1993 pilot survey. Publication #95-333, Washington Department of Ecology, Olympia, WA.

Foster Creek Conservation District Screening Level Macroinvertebrate Assessment
R2 Resource Consultants, Inc. 23 January 2003 1303.10/macroinvertebrate assessment_103
R2 Resource Consultants. 2001. Screening level macroinvertebrate assessment of potential anadromous fish-bearing stream in WRIAs 44 and 50. Prepared for Foster Creek Conservation District, Waterville, Washington.
Stewart, K.W., and B.P. Stark. 1993. Nymphs of North American stonefly genera (Plecoptera). University of North Texas Press, Denton, TX.
Wiggins, G.B. 1998. Larvae of the North American caddisfly genera (Trichoptera). Second edition. University of Toronto Press, Buffalo, NY.
Wisseman, R. 2002. Ecological and life history attributes of freshwater benthic invertebrates found in the Clackamas River and adjacent drainages, Oregon. Appendix B in Portland General Electric. Characterization of benthic invertebrate communities in the Clackamas River watershed, Oregon. Clackamas Hydro electric Relicensing Project, Water Quality 3 (WQ3) Studies.
R2 Resource Consultants, Inc. 24 January 2003 1303.10/macroinvertebrate assessment_103
APPENDIX A
FIGURES
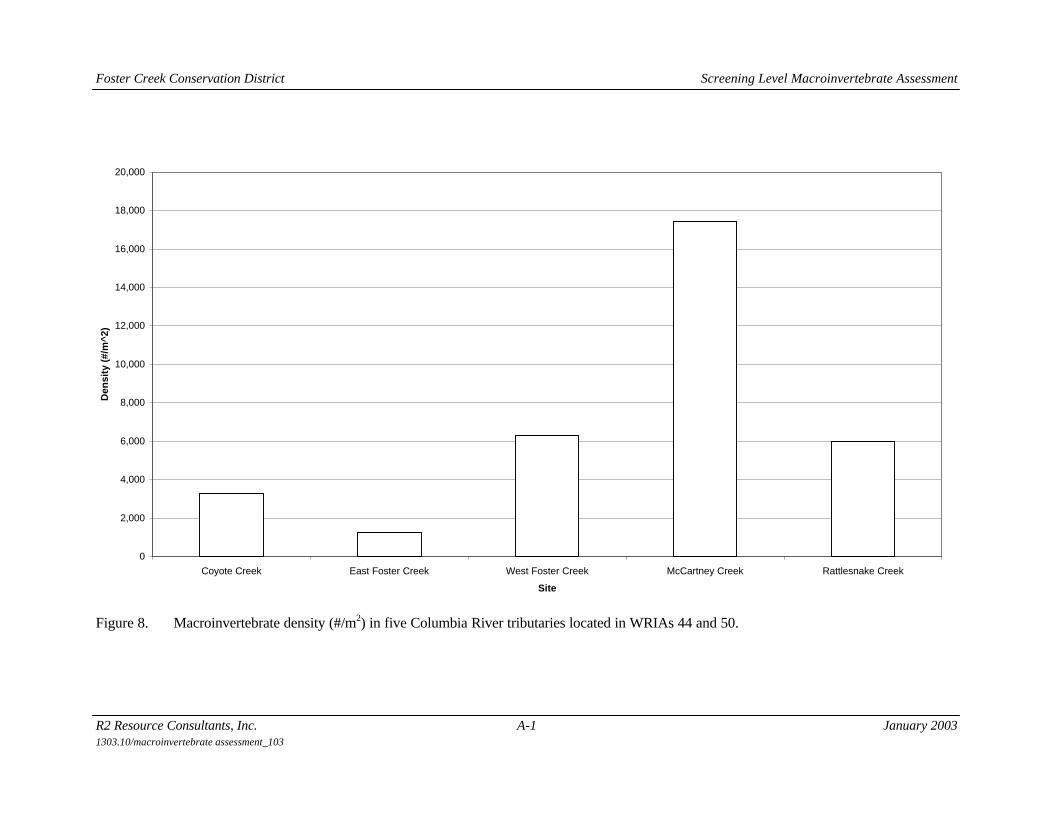
Foster Creek Conservation District Screening Level Macroinvertebrate Assessment
R2 Resource Consultants, Inc. A-1 January 2003 1303.10/macroinvertebrate assessment_103
Figure 8. Macroinvertebrate density (#/m2) in five Columbia River tributaries located in WRIAs 44 and 50.
0
2,000
4,000
6,000
8,000
10,000
12,000
14,000
16,000
18,000
20,000
Coyote Creek East Foster Creek West Foster Creek McCartney Creek Rattlesnake Creek
Site
Den
sity
(#/
m^2
)

Foster Creek Conservation District Screening Level Macroinvertebrate Assessment
R2 Resource Consultants, Inc. A-2 January 2003 1303.10/macroinvertebrate assessment_103
Figure 9. Macroinvertebrate taxa richness (# of taxa) in five Columbia River tributaries located in WRIAs 44 and 50.
0
5
10
15
20
25
30
35
Coyote Creek East Foster Creek West Foster Creek McCartney Creek Ratt lesnake Creek
Site
Nu
mb
er o
f U
niq
ue
Tax
a

Foster Creek Conservation District Screening Level Macroinvertebrate Assessment
R2 Resource Consultants, Inc. A-3 January 2003 1303.10/macroinvertebrate assessment_103
Figure 10. Mayfly taxa richness (# of taxa) in five Columbia River tributaries located in WRIAs 44 and 50.
0
1
2
3
4
5
6
7
8
Coyote Creek East Foster Creek West Foster Creek McCartney Creek Rattlesnake Creek
Site
Nu
mb
er o
f U
niq
ue
Tax
a

Foster Creek Conservation District Screening Level Macroinvertebrate Assessment
R2 Resource Consultants, Inc. A-4 January 2003 1303.10/macroinvertebrate assessment_103
Figure 11. Stonefly taxa richness (# of taxa) in five Columbia River tributaries located in WRIAs 44 and 50.
0
1
2
3
4
5
6
7
8
Coyote Creek East Foster Creek West Foster Creek McCartney Creek Rattlesnake Creek
Site
Nu
mb
er o
f U
niq
ue
Tax
a

Foster Creek Conservation District Screening Level Macroinvertebrate Assessment
R2 Resource Consultants, Inc. A-5 January 2003 1303.10/macroinvertebrate assessment_103
Figure 12. Caddisfly taxa richness (# of taxa) in five Columbia River tributaries located in WRIAs 44 and 50.
0
1
2
3
4
5
6
7
8
Coyote Creek East Foster Creek West Foster Creek McCartney Creek Rattlesnake Creek
Site
Mea
n N
um
ber
of
Tax
a

Foster Creek Conservation District Screening Level Macroinvertebrate Assessment
R2 Resource Consultants, Inc. A-6 January 2003 1303.10/macroinvertebrate assessment_103
Figure 13. Relative abundance (%) of major macroinvertebrate groups in five Columbia River tributaries located in WRIAs 44 and 50.
0%
20%
40%
60%
80%
100%
Coyote Creek East Foster Creek West Foster Creek McCartney Creek Rattlesnake Creek
Site
Ab
un
dan
ce (
%)
Mayflies Damselfiles True Bugs Caddisflies Moths Beetles True Flies Non-Insects

Foster Creek Conservation District Screening Level Macroinvertebrate Assessment
R2 Resource Consultants, Inc. A-7 January 2003 1303.10/macroinvertebrate assessment_103
Figure 14. Intolerant macroinvertebrate taxa richness (# of taxa) in five Columbia River tributaries located in WRIAs 44 and 50.
0
0.5
1
1.5
2
2.5
3
3.5
4
Coyote Creek East Foster Creek West Foster Creek McCartney Creek Rattlesnake Creek
Site
Nu
mb
er o
f U
niq
ueT
axa

Foster Creek Conservation District Screening Level Macroinvertebrate Assessment
R2 Resource Consultants, Inc. A-8 January 2003 1303.10/macroinvertebrate assessment_103
Figure 15. Relative abundance (%) of tolerant macroinvertebrate taxa in five Columbia River tributaries located in WRIAs 44 and 50.
0
10
20
30
40
50
60
70
80
90
100
Coyote Creek East Foster Creek West Foster Creek McCartney Creek Rattlesnake Creek
Site
Ab
un
dan
ce (
%)

Foster Creek Conservation District Screening Level Macroinvertebrate Assessment
R2 Resource Consultants, Inc. A-9 January 2003 1303.10/macroinvertebrate assessment_103
Figure 16. Relative abundance (%) of macroinvertebrate functional feeding groups in five Columbia River tributaries located in WRIAs 44 and 50.
0%
20%
40%
60%
80%
100%
Coyote Creek East Foster Creek West Foster Creek McCartney Creek Rattlesnake Creek
Site
Ab
un
dan
ce (
%)
Collectors Grazers Shredders Filter Feeders Predators Unknown

Foster Creek Conservation District Screening Level Macroinvertebrate Assessment
R2 Resource Consultants, Inc. A-10 January 2003 1303.10/macroinvertebrate assessment_103
Figure 17. Long-lived macroinvertebrate taxa richness (# of taxa) in five Columbia River tributaries located in WRIAs 44 and 50.
0
1
2
3
4
5
6
7
8
9
10
Coyote Creek East Foster Creek West Foster Creek McCartney Creek Rattlesnake Creek
Site
Nu
mb
er o
f U
niq
ueT
axa

Foster Creek Conservation District Screening Level Macroinvertebrate Assessment
R2 Resource Consultants, Inc. A-11 January 2003 1303.10/macroinvertebrate assessment_103
Figure 18. Relative abundance (%) of macroinvertebrate habits in five Columbia River tributaries located in WRIAs 44 and 50.
0%
20%
40%
60%
80%
100%
Coyote Creek East Foster Creek West Foster Creek McCartney Creek Rattlesnake Creek
Site
Ab
un
dan
ce (
%)
Burrowers Climbers Clingers Skaters Sprawlers Swimmers

R2 Resource Consultants, Inc. January 2003 1303.10/macroinvertebrate assessment_103
APPENDIX B
TABLES

Foster Creek Conservation District Screening Level Macroinvertebrate Assessment
R2 Resource Consultants, Inc. B-1 January 2003 1303.10/macroinvertebrate assessment_103
Sampling Method: Kick Date: 6/5/02 Site: McCartney Sample #: A-C
Metric Sample
1 Sample
2 Sample
3 Sample
4 Sample
5 Composite Total Abundance (#/sample) 3,610 3,160 3,170 3313.3 Density (#/sq-m) 19,000 16,632 16,684 17438.6 Taxa Richness (# taxa) 21 16 30 32.0 B-IBI Metric Score 5 3 5 5 Hilsenhoff Biotic Index 5.19 5.08 5.08 5.1 Ephemeroptera Richness 4 3 4 4.0 B-IBI Metric Score 3 3 3 3 Plecoptera Richness 0 0 0 0.0 B-IBI Metric Score 1 1 1 1 Trichoptera Richness 2 0 5 5.0 B-IBI Metric Score 3 1 5 5 EPT Taxa Richness 6 3 9 9.0 % EPT of Total Abundance 75.6 58.9 36.6 60.8 % Predators 1.1 0.3 0.3 0.6 B-IBI Metric Score 1 1 1 1 % Contribution of Dominant Taxa 74.5 68.0 44.2 62.2 B-IBI Metric Score 3 3 5 3 Intolerant Taxa Richness 2 3 2 3.0 B-IBI Metric Score 3 5 3 5 Long-Lived Taxa Richness 3 2 6 5.0 B-IBI Metric Score 5 3 5 5 % Tolerant Taxa 42.9 37.5 43.3 40.6 B-IBI Metric Score 3 3 3 3 B-IBI 27 23 33 31
Abundance by Order (%) Ephemeroptera 27 23 33 31 Odonata 0.0 0.0 0.3 0.1
Plecoptera 0.0 0.0 0.0 0.0 Hemiptera 0.8 0.0 0.0 0.3 Trichoptera 2.5 0.0 4.4 2.3 Lepidoptera 0.0 0.0 0.0 0.0 Coleoptera 10.2 6.0 15.1 10.5 Diptera 6.1 22.2 29.7 19.3 Non-Insect Taxa 7.2 13.0 18.3 12.8 Abundance by Food Group (%) Collector-Gatherers 90.0 73.1 53.0 72.0 Scrapers/Grazers 1.4 4.1 11.7 5.7

Foster Creek Conservation District Screening Level Macroinvertebrate Assessment
R2 Resource Consultants, Inc. B-2 January 2003 1303.10/macroinvertebrate assessment_103
Sampling Method: Kick Date: 6/5/02 Site: McCartney Sample #: A-C
Metric Sample
1 Sample
2 Sample
3 Sample
4 Sample
5 Composite Shredders 0.0 0.0 1.3 0.4 Filter Feeders 0.6 1.3 18.0 6.6 Predators 1.1 0.3 0.3 0.6 Unknown 6.9 21.2 15.8 14.6 Abundance by Habit (%) Burrowers 3.3 4.7 4.7 4.3 Climbers 1.1 0.0 0.6 0.6 Clingers 15.0 25.9 51.4 30.8 Skater 0.0 0.0 0.0 0.0 Sprawler 27.4 25.9 7.6 20.3 Swimmer 51.5 43.0 31.5 42.0

Foster Creek Conservation District Screening Level Macroinvertebrate Assessment
R2 Resource Consultants, Inc. B-3 January 2003 1303.10/macroinvertebrate assessment_103
Sampling Method: Kick Date: 6/5/02 Site: McCartney Sample #: A-C
ABUNDANCE
Taxonomic Group Sample
1 Sample
2 Sample
3 Sample
4 Sample
5 Mean
Abundance Standard
Error EPHEMEROPTERA (mayflies) Baetidae Acentrella insignificans 6 3 4.5 1.5 Baetis bicaudatus 6 4 5 5.0 0.6 Baetis tricaudatus 154 105 72 110.3 23.8 Baetis sp. - - Immature - - Caenidae Caenis - - Ephemerellidae Attenella margarita - - Caudatella edmundsi - - Drunella spinifera - - Drunella sp. - - Ephemerella - - Serratella - - Immature - - Heptageniidae Epeorus - - Leucrocuta - - Nixe simplicoides - - Rhithrogena - - Stenonema - - Immature - - Leptophlebiidae Paraleptophlebia bicornata - - Paraleptophlebia temporalis - - Immature - - Siphlonuridae Ameletus - - Tricorythidae Tricorythodes 98 77 22 65.7 22.7 ODONATA (dragonflies) Anisoptera Aeshnidae - - Gomphidae - -

Foster Creek Conservation District Screening Level Macroinvertebrate Assessment
R2 Resource Consultants, Inc. B-4 January 2003 1303.10/macroinvertebrate assessment_103
Sampling Method: Kick Date: 6/5/02 Site: McCartney Sample #: A-C
ABUNDANCE
Taxonomic Group Sample
1 Sample
2 Sample
3 Sample
4 Sample
5 Mean
Abundance Standard
Error Ophiogomphus - - Unknown - - Zygoptera Coenagrionidae Argia - - Unknown 1 1.0 - MEGALOPTERA Sialidae Sialis - - PLECOPTERA (stoneflies) Capniidae Immature - - Chloroperlidae Sweltsa - - Immature - - Nemouridae Zapada cinctipes - - Zapada Oregonensis Gr. - - Immature Perlidae Claassenia - - Hesperoperla pacifica - - Immature - - Perlodidae Skwala - - Immature - - Pteronarcyidae Pteronarcella - - Pteronarcys - - Taeniopterygidae Taenionema Immature - - HEMIPTERA (true bugs) Corixidae - -

Foster Creek Conservation District Screening Level Macroinvertebrate Assessment
R2 Resource Consultants, Inc. B-5 January 2003 1303.10/macroinvertebrate assessment_103
Sampling Method: Kick Date: 6/5/02 Site: McCartney Sample #: A-C
ABUNDANCE
Taxonomic Group Sample
1 Sample
2 Sample
3 Sample
4 Sample
5 Mean
Abundance Standard
Error Gerridae - - Unknown 3 3.0 - TRICHOPTERA (caddisflies) Brachycentridae Brachycentrus - - Micrasema - - Immature - - Glossosomatidae Glossosoma - - Protoptila - - Helicopsychidae Helicopsyche - - Hydropsychidae Arctopsyche grandis - - Cheumatopsyche 1 1.0 - Hydropsyche 6 6.0 - Immature 1 3 2.0 1.0 Hydroptilidae Agraylea - - Hydroptila 8 2 5.0 3.0 Immature - - Lepidostomatidae Lepidostoma 2 2.0 - Leptoceridae Ceraclea - - Nectopsyche - - Oecetis - - Limnephilidae Dicosmoecus - - Immature - - Polycentropodidae Polycentropus - - Rhyacophilidae Rhyacophila angelita Grp. Rhyacophila hylinata Grp. Rhyacophila vemna/Brunnea Grps. - -

Foster Creek Conservation District Screening Level Macroinvertebrate Assessment
R2 Resource Consultants, Inc. B-6 January 2003 1303.10/macroinvertebrate assessment_103
Sampling Method: Kick Date: 6/5/02 Site: McCartney Sample #: A-C
ABUNDANCE
Taxonomic Group Sample
1 Sample
2 Sample
3 Sample
4 Sample
5 Mean
Abundance Standard
Error Rhyacophila sp. - - LEPIDOPTERA (moths) Pyralidae Petrophila - - Unknown - - COLEOPTERA (beetles) Curculionidae - - Dytiscidae - - Dytiscus - - Illybius - - Immature 4 4.0 - Elmidae - - Ampumixis 4 19 11.5 7.5 Cleptelmis - - Dubiraphia - - Heterlimnius 17 2 5 8.0 4.6 Lara - - Narpus 2 2.0 - Optioservus 12 17 20 16.3 2.3 Zaitzevia 2 2.0 - Immature - - Haliplidae Haliplus - - Immature - - Hydrophilidae Hydrobius - - Immature - - DIPTERA (true flies) Athericidae Atherix - - Blephariceridae Blepharicera - - Philorus Chironomidae - -
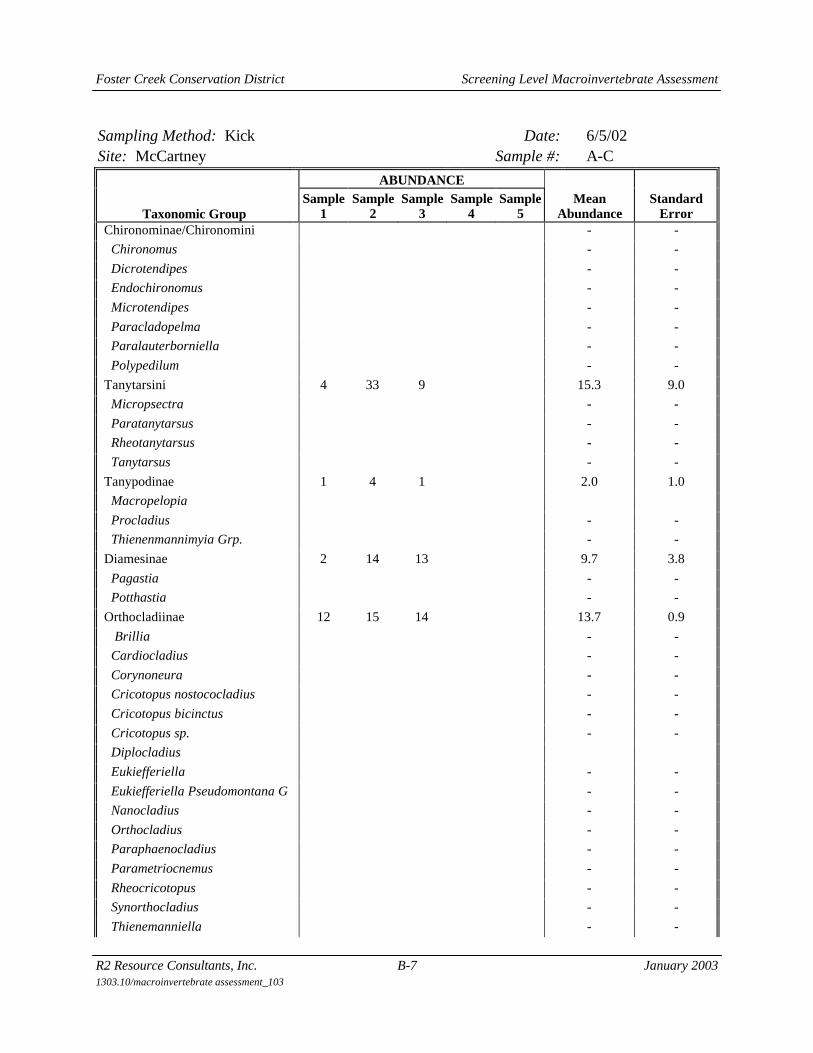
Foster Creek Conservation District Screening Level Macroinvertebrate Assessment
R2 Resource Consultants, Inc. B-7 January 2003 1303.10/macroinvertebrate assessment_103
Sampling Method: Kick Date: 6/5/02 Site: McCartney Sample #: A-C
ABUNDANCE
Taxonomic Group Sample
1 Sample
2 Sample
3 Sample
4 Sample
5 Mean
Abundance Standard
Error Chironominae/Chironomini - - Chironomus - - Dicrotendipes - - Endochironomus - - Microtendipes - - Paracladopelma - - Paralauterborniella - - Polypedilum - - Tanytarsini 4 33 9 15.3 9.0 Micropsectra - - Paratanytarsus - - Rheotanytarsus - - Tanytarsus - - Tanypodinae 1 4 1 2.0 1.0 Macropelopia Procladius - - Thienenmannimyia Grp. - - Diamesinae 2 14 13 9.7 3.8 Pagastia - - Potthastia - - Orthocladiinae 12 15 14 13.7 0.9 Brillia - - Cardiocladius - - Corynoneura - - Cricotopus nostococladius - - Cricotopus bicinctus - - Cricotopus sp. - - Diplocladius Eukiefferiella - - Eukiefferiella Pseudomontana G - - Nanocladius - - Orthocladius - - Paraphaenocladius - - Parametriocnemus - - Rheocricotopus - - Synorthocladius - - Thienemanniella - -

Foster Creek Conservation District Screening Level Macroinvertebrate Assessment
R2 Resource Consultants, Inc. B-8 January 2003 1303.10/macroinvertebrate assessment_103
Sampling Method: Kick Date: 6/5/02 Site: McCartney Sample #: A-C
ABUNDANCE
Taxonomic Group Sample
1 Sample
2 Sample
3 Sample
4 Sample
5 Mean
Abundance Standard
Error Tvetenia - - Zalutschia - - Empididae Chelifera - - Hemerodromia - - Oreogeton 1 1.0 - Simuliidae - - Simulium 1 3 46 16.7 14.7 Stratiomyidae 2 10 6.0 4.0 Tipulidae - - Antocha - - Dicranota 1 1.0 - Hexatoma - - Limnophila - - Tipula - - NON-INSECT TAXA Turbellaria (flatworms) Planariidae - - Unknown - - Aschelminthes Nematoda (roundworms) 1 1 2 1.3 0.3 Annelida Hirudinea (leeches) - - Oligochaeta (earthworms) 1 1.0 - Lumbricidae - - Tubificidae - - Gastropoda (snails) Ancylidae - - Hydrobiidae - - Fluminicola 3 3.0 - Physidae Physella 5 16 10.5 5.5 Planorbidae 13 16 14.5 1.5 Vorticifex - - Pelecypoda (clams, mussels)

Foster Creek Conservation District Screening Level Macroinvertebrate Assessment
R2 Resource Consultants, Inc. B-9 January 2003 1303.10/macroinvertebrate assessment_103
Sampling Method: Kick Date: 6/5/02 Site: McCartney Sample #: A-C
ABUNDANCE
Taxonomic Group Sample
1 Sample
2 Sample
3 Sample
4 Sample
5 Mean
Abundance Standard
Error Sphaeriidae - - Unknown - - Amphipoda (scuds, sideswimmers) Gammarus 5 12 6 7.7 2.2 Hyalella azteca 15 14 13 14.0 0.6 Decapoda Pacifasticus - - Cladocera - - Copepoda - - Isopoda - Caecidotea - - Ostracoda 1 1 1.0 0.0 Hydracarina (water mites) - - TOTAL INDIVIDUALS 361 316 317 331.3 14.8

Foster Creek Conservation District Screening Level Macroinvertebrate Assessment
R2 Resource Consultants, Inc. B-10 January 2003 1303.10/macroinvertebrate assessment_103
Sampling Method: Kick Date: 6/5/02 Site: Rattlesnake Sample #: A-C
Metric Sample
1 Sample
2 Sample
3 Sample
4 Sample
5 Composite Total Abundance (#/sample) 902 1,540 966 1136.0 Density (#/sq-m) 4,747 8,105 5,084 5978.9 Taxa Richness (# taxa) 18 12 14 23.0 B-IBI Metric Score 3 3 3 5 Hilsenhoff Biotic Index 5.49 5.44 5.98 5.6 Ephemeroptera Richness 1 1 0 1.0 B-IBI Metric Score 1 1 1 1 Plecoptera Richness 0 0 0 0.0 B-IBI Metric Score 1 1 1 1 Trichoptera Richness 2 1 1 2.0 B-IBI Metric Score 3 1 1 3 EPT Taxa Richness 3 2 1 3.0 % EPT of Total Abundance 2.9 2.9 4.7 3.8 % Predators 0.8 0.3 0.3 0.5 B-IBI Metric Score 1 1 1 1 % Contribution of Dominant Taxa 85.9 82.5 82.9 83.8 B-IBI Metric Score 1 1 1 1 Intolerant Taxa Richness 1 1 0 1.0 B-IBI Metric Score 3 3 1 3 Long-Lived Taxa Richness 2 1 1 2.0 B-IBI Metric Score 3 3 3 3 % Tolerant Taxa 38.9 50.0 28.6 30.4 B-IBI Metric Score 3 3 3 3
B-IBI 19 17 15 21
Abundance by Order (%) Ephemeroptera 19 17 15 21 Odonata 0.0 0.0 0.0 0.0 Plecoptera 0.0 0.0 0.0 0.0 Hemiptera 0.0 0.0 0.0 0.0 Trichoptera 2.5 1.3 4.7 2.8 Lepidoptera 0.0 0.0 0.0 0.0 Coleoptera 36.7 40.9 25.8 34.5 Diptera 29.9 24.0 24.2 26.1 Non-Insect Taxa 30.5 32.1 45.3 36.0 Abundance by Food Group (%) Collector-Gatherers 42.1 43.8 32.0 39.3 Scrapers/Grazers 1.6 6.5 3.7 3.9

Foster Creek Conservation District Screening Level Macroinvertebrate Assessment
R2 Resource Consultants, Inc. B-11 January 2003 1303.10/macroinvertebrate assessment_103
Sampling Method: Kick Date: 6/5/02 Site: Rattlesnake Sample #: A-C
Metric Sample
1 Sample
2 Sample
3 Sample
4 Sample
5 Composite Shredders 0.2 0.0 0.0 0.1 Filter Feeders 26.8 28.6 39.4 31.6 Predators 0.8 0.3 0.3 0.5 Unknown 28.5 20.8 24.5 24.6 Abundance by Habit (%) Burrowers 33.7 20.5 28.6 27.6 Climbers 0.4 0.0 0.0 0.1 Clingers 41.5 51.6 36.3 43.1 Skater 0.0 0.0 0.0 0.0 Sprawler 0.4 0.3 0.3 0.4 Swimmer 23.1 25.0 33.9 27.3

Foster Creek Conservation District Screening Level Macroinvertebrate Assessment
R2 Resource Consultants, Inc. B-12 January 2003 1303.10/macroinvertebrate assessment_103
Sampling Method: Kick Date: 6/5/02 Site: Rattlesnake Sample #: A-C
ABUNDANCE
Taxonomic Group Sample
1 Sample
2 Sample
3 Sample
4 Sample
5 Mean
Abundance Standard
Error EPHEMEROPTERA (mayflies) Baetidae Acentrella insignificans - - Baetis bicaudatus - - Baetis tricaudatus 3 5 4.0 1.0 Baetis sp. - - Immature - - Caenidae Caenis - - Ephemerellidae Attenella margarita - - Caudatella edmundsi - - Drunella spinifera - - Drunella sp. - - Ephemerella - - Serratella - - Immature - - Heptageniidae Cinygmula - - Epeorus - - Leucrocuta - - Nixe simplicoides - - Rhithrogena - - Stenonema - - Immature - - Leptophlebiidae Paraleptophlebia bicornata - - Paraleptophlebia temporalis - - Immature - - Siphlonuridae Ameletus - - Tricorythidae Tricorythodes - -
ODONATA (dragonflies) Anisoptera Aeshnidae - - Gomphidae - - Ophiogomphus - - Unknown - - Zygoptera Coenagrionidae Unknown - -

Foster Creek Conservation District Screening Level Macroinvertebrate Assessment
R2 Resource Consultants, Inc. B-13 January 2003 1303.10/macroinvertebrate assessment_103
Sampling Method: Kick Date: 6/5/02 Site: Rattlesnake Sample #: A-C
ABUNDANCE
Taxonomic Group Sample
1 Sample
2 Sample
3 Sample
4 Sample
5 Mean
Abundance Standard
Error
MEGALOPTERA Sialidae Sialis - -
PLECOPTERA (stoneflies) Capniidae Immature - - Chloroperlidae Sweltsa - - Immature - - Nemouridae Malenka - - Zapada cinctipes - - Zapada Oregonensis Gr. - - Immature Perlidae Claassenia - - Hesperoperla pacifica - - Immature - - Perlodidae Skwala - - Immature - - Pteronarcyidae Pteronarcella - - Pteronarcys - - Taeniopterygidae Taenionema Immature - -
HEMIPTERA (true bugs) Corixidae - - Gerridae - - Unknown - -
TRICHOPTERA (caddisflies) Brachycentridae Brachycentrus - - Micrasema - - Immature - - Glossosomatidae Glossosoma - - Protoptila - -

Foster Creek Conservation District Screening Level Macroinvertebrate Assessment
R2 Resource Consultants, Inc. B-14 January 2003 1303.10/macroinvertebrate assessment_103
Sampling Method: Kick Date: 6/5/02 Site: Rattlesnake Sample #: A-C
ABUNDANCE
Taxonomic Group Sample
1 Sample
2 Sample
3 Sample
4 Sample
5 Mean
Abundance Standard
Error Helicopsychidae Helicopsyche - - Hydropsychidae Arctopsyche grandis - - Cheumatopsyche - - Hydropsyche / Ceratopsyche - - Immature - - Hydroptilidae Agraylea - - Hydroptila 21 4 15 13.3 5.0 Immature - - Lepidostomatidae Lepidostoma 2 2.0 - Leptoceridae Ceraclea - - Nectopsyche - - Oecetis - - Limnephilidae Dicosmoecus - - Immature - - Polycentropodidae Polycentropus - - Rhyacophilidae Rhyacophila angelita Grp. Rhyacophila Betteni Grp. Rhyacophila vemna/Brunnea Grps. - - Rhyacophila sp. - - Uenoidae Neophylax - -
LEPIDOPTERA (moths) Pyralidae Petrophila - - Unknown - -
COLEOPTERA (beetles) Curculionidae - - Dytiscidae - - Dytiscus - - Illybius - - Immature 2 2.0 - Elmidae - - Ampumixis 329 126 83 179.3 75.9

Foster Creek Conservation District Screening Level Macroinvertebrate Assessment
R2 Resource Consultants, Inc. B-15 January 2003 1303.10/macroinvertebrate assessment_103
Sampling Method: Kick Date: 6/5/02 Site: Rattlesnake Sample #: A-C
ABUNDANCE
Taxonomic Group Sample
1 Sample
2 Sample
3 Sample
4 Sample
5 Mean
Abundance Standard
Error Cleptelmis - - Dubiraphia - - Heterlimnius - - Lara - - Narpus - - Optioservus - - Zaitzevia - - Immature - - Haliplidae Haliplus - - Immature - - Hydrophilidae Hydrobius - - Immature - -
DIPTERA (true flies) Athericidae Atherix - - Blephariceridae Blepharicera - - Philorus Chironomidae - - Chironominae/Chironomini - - Chironomus - - Dicrotendipes - - Endochironomus - - Microtendipes - - Paracladopelma - - Paralauterborniella - - Polypedilum - - Tanytarsini - - Micropsectra - - Paratanytarsus - - Rheotanytarsus - - Tanytarsus - - Tanypodinae Macropelopia Procladius - - Thienenmannimyia Grp. - - Diamesinae Pagastia - - Potthastia - - Orthocladiinae 249 56 76 127.0 61.3

Foster Creek Conservation District Screening Level Macroinvertebrate Assessment
R2 Resource Consultants, Inc. B-16 January 2003 1303.10/macroinvertebrate assessment_103
Sampling Method: Kick Date: 6/5/02 Site: Rattlesnake Sample #: A-C
ABUNDANCE
Taxonomic Group Sample
1 Sample
2 Sample
3 Sample
4 Sample
5 Mean
Abundance Standard
Error Brillia - - Cardiocladius - - Corynoneura - - Cricotopus nostococladius - - Cricotopus bicinctus - - Cricotopus sp. - - Diplocladius Eukiefferiella - - Eukiefferiella Pseudomontana G - - Nanocladius - - Orthocladius - - Paraphaenocladius - - Parametriocnemus - - Rheocricotopus - - Synorthocladius - - Thienemanniella - - Tvetenia - - Zalutschia - - Empididae Chelifera - - Hemerodromia - - Oreogeton 4 1 2.5 1.5 Simuliidae - - Simulium 9 9 9.0 0.0 Stratiomyidae 1 5 1 2.3 1.3 Tabanidae 7 3 1 3.7 1.8 Tipulidae Antocha - - Dicranota - - Hexatoma - - Limnophila - - Tipula - -
NON-INSECT TAXA Turbellaria (flatworms) Planariidae 7 7.0 - Unknown - - Aschelminthes Nematoda (roundworms) 1 1.0 - Annelida Hirudinea (leeches) 1 1.0 - Oligochaeta (earthworms) 19 4 11.5 7.5

Foster Creek Conservation District Screening Level Macroinvertebrate Assessment
R2 Resource Consultants, Inc. B-17 January 2003 1303.10/macroinvertebrate assessment_103
Sampling Method: Kick Date: 6/5/02 Site: Rattlesnake Sample #: A-C
ABUNDANCE
Taxonomic Group Sample
1 Sample
2 Sample
3 Sample
4 Sample
5 Mean
Abundance Standard
Error Lumbricidae - - Tubificidae - - Gastropoda (snails) Ancylidae - - Hydrobiidae - - Fluminicola - - Physidae Physella 13 13 10 12.0 1.0 Planorbidae 1 7 2 3.3 1.9 Vorticifex - - Pelecypoda (clams, mussels) Sphaeriidae 36 7 12 18.3 9.0 Unknown - - Amphipoda (scuds, sideswimmers) Gammarus 1 1.0 - Hyalella azteca 7 1 4.0 3.0 Decapoda Pacifasticus - - Cladocera - - Copepoda - - Isopoda - Caecidotea - - Ostracoda 197 72 108 125.7 37.1 Hydracarina (water mites) 1 1.0 -
TOTAL INDIVIDUALS 902 308 322 510.7 195.7

Foster Creek Conservation District Screening Level Macroinvertebrate Assessment
R2 Resource Consultants, Inc. B-18 January 2003 1303.10/macroinvertebrate assessment_103
Sampling Method: Kick Date: 6/6/02 Site: Coyote Sample #: A-C
Metric Sample
1 Sample
2 Sample
3 Sample
4 Sample
5 Composite Total Abundance (#/sample) 401 1,067 400 622.4 Density (#/sq-m) 2,110 5,614 2,103 3275.7 Taxa Richness (# taxa) 18 26 20 30.0 B-IBI Metric Score 3 5 3 5 Hilsenhoff Biotic Index 4.07 4.03 4.34 4.1 Ephemeroptera Richness 2 4 3 4.0 B-IBI Metric Score 1 3 3 3 Plecoptera Richness 1 2 1 3.0 B-IBI Metric Score 1 1 1 3 Trichoptera Richness 4 5 3 6.0 B-IBI Metric Score 3 5 3 5 EPT Taxa Richness 7 11 7 13.0 % EPT of Total Abundance 23.5 13.8 21.8 0.0 0.0 21.6 % Predators 0.7 0.3 1.0 0.7 B-IBI Metric Score 1 1 1 1 % Contribution of Dominant Taxa 65.6 74.1 84.3 74.7 B-IBI Metric Score 3 3 1 3 Intolerant Taxa Richness 1 1 1 1.0 B-IBI Metric Score 3 3 3 3 Long-Lived Taxa Richness 7 7 5 8.0 B-IBI Metric Score 5 5 5 5 % Tolerant Taxa 22.2 23.1 20.0 20.0 B-IBI Metric Score 3 3 3 3 B-IBI 23 29 23 31 Abundance by Order (%) Ephemeroptera 18.0 9.7 17.4 15.0 Odonata 0.0 0.0 0.0 0.0 Plecoptera 0.7 1.3 0.3 0.8 Hemiptera 0.0 0.9 1.0 0.7 Trichoptera 4.8 2.8 4.1 3.9 Lepidoptera 0.3 0.0 0.0 0.1 Coleoptera 65.6 75.9 67.2 69.6 Diptera 8.8 5.3 4.4 6.2 Non-Insect Taxa 1.7 2.8 4.4 3.0 Abundance by Food Group (%) Collector-Gatherers 78.2 79.1 87.0 81.4 Scrapers/Grazers 3.1 5.0 0.0 2.7

Foster Creek Conservation District Screening Level Macroinvertebrate Assessment
R2 Resource Consultants, Inc. B-19 January 2003 1303.10/macroinvertebrate assessment_103
Sampling Method: Kick Date: 6/6/02 Site: Coyote Sample #: A-C
Metric Sample
1 Sample
2 Sample
3 Sample
4 Sample
5 Composite Shredders 6.1 6.9 2.7 5.2 Filter Feeders 4.8 3.4 4.4 4.2 Predators 0.7 0.3 1.0 0.7 Unknown 7.1 5.3 4.8 5.7 Abundance by Habit (%) Burrowers 5.8 5.0 5.5 5.4 Climbers 0.3 0.3 0.3 0.3 Clingers 80.6 84.1 75.1 79.9 Skater 0.0 0.0 0.0 0.0 Sprawler 0.0 1.3 0.7 0.6 Swimmer 12.6 7.2 16.4 12.1

Foster Creek Conservation District Screening Level Macroinvertebrate Assessment
R2 Resource Consultants, Inc. B-20 January 2003 1303.10/macroinvertebrate assessment_103
Sampling Method: Kick Date: 6/6/02 Site: Coyote Sample #: A-C
ABUNDANCE
Taxonomic Group Sample
1 Sample
2 Sample
3 Sample
4 Sample
5 Mean
Abundance Standard
Error EPHEMEROPTERA (mayflies) Baetidae Acentrella insignificans - - Baetis bicaudatus - - Baetis tricaudatus 37 20 45 34.0 7.4 Baetis sp. - - Immature - - Caenidae Caenis - - Ephemerellidae Attenella margarita - - Caudatella edmundsi - - Drunella spinifera - - Drunella sp. - - Ephemerella 1 1.0 - Serratella - - Immature - - Heptageniidae Epeorus 16 8 3 9.0 3.8 Leucrocuta - - Nixe simplicoides - - Rhithrogena - - Stenonema - - Immature - - Leptophlebiidae Paraleptophlebia bicornata - - Paraleptophlebia temporalis 2 3 2.5 0.5 Immature - - Siphlonuridae Ameletus - - Tricorythidae Tricorythodes - - ODONATA (dragonflies) Anisoptera Aeshnidae - -

Foster Creek Conservation District Screening Level Macroinvertebrate Assessment
R2 Resource Consultants, Inc. B-21 January 2003 1303.10/macroinvertebrate assessment_103
Sampling Method: Kick Date: 6/6/02 Site: Coyote Sample #: A-C
ABUNDANCE
Taxonomic Group Sample
1 Sample
2 Sample
3 Sample
4 Sample
5 Mean
Abundance Standard
Error Gomphidae - - Ophiogomphus - - Unknown - - Zygoptera Coenagrionidae Unknown - - MEGALOPTERA Sialidae Sialis - - PLECOPTERA (stoneflies) Capniidae Immature - - Chloroperlidae Sweltsa - - Immature - - Nemouridae Zapada cinctipes 3 3.0 - Zapada Oregonensis Gr. - - Immature Perlidae Claassenia - - Hesperoperla pacifica 2 2.0 - Immature - - Perlodidae Skwala - - Immature - - Pteronarcyidae Pteronarcella - - Pteronarcys 1 1 1.0 0.0 Taeniopterygidae Taenionema Immature - -

Foster Creek Conservation District Screening Level Macroinvertebrate Assessment
R2 Resource Consultants, Inc. B-22 January 2003 1303.10/macroinvertebrate assessment_103
Sampling Method: Kick Date: 6/6/02 Site: Coyote Sample #: A-C
ABUNDANCE
Taxonomic Group Sample
1 Sample
2 Sample
3 Sample
4 Sample
5 Mean
Abundance Standard
Error HEMIPTERA (true bugs) Corixidae - - Gerridae - - Unknown 3 3 3.0 0.0 TRICHOPTERA (caddisflies) Brachycentridae Brachycentrus 1 1.0 - Micrasema 5 2 1 2.7 1.2 Immature - - Glossosomatidae Glossosoma - - Protoptila - - Helicopsychidae Helicopsyche - - Hydropsychidae Arctopsyche grandis - - Cheumatopsyche - - Hydropsyche 7 4 10 7.0 1.7 Immature - - Hydroptilidae Agraylea - - Hydroptila - - Immature - - Lepidostomatidae Lepidostoma 1 1 1 1.0 0.0 Leptoceridae Ceraclea - - Nectopsyche - - Oecetis - - Limnephilidae Dicosmoecus - - Immature - - Polycentropodidae
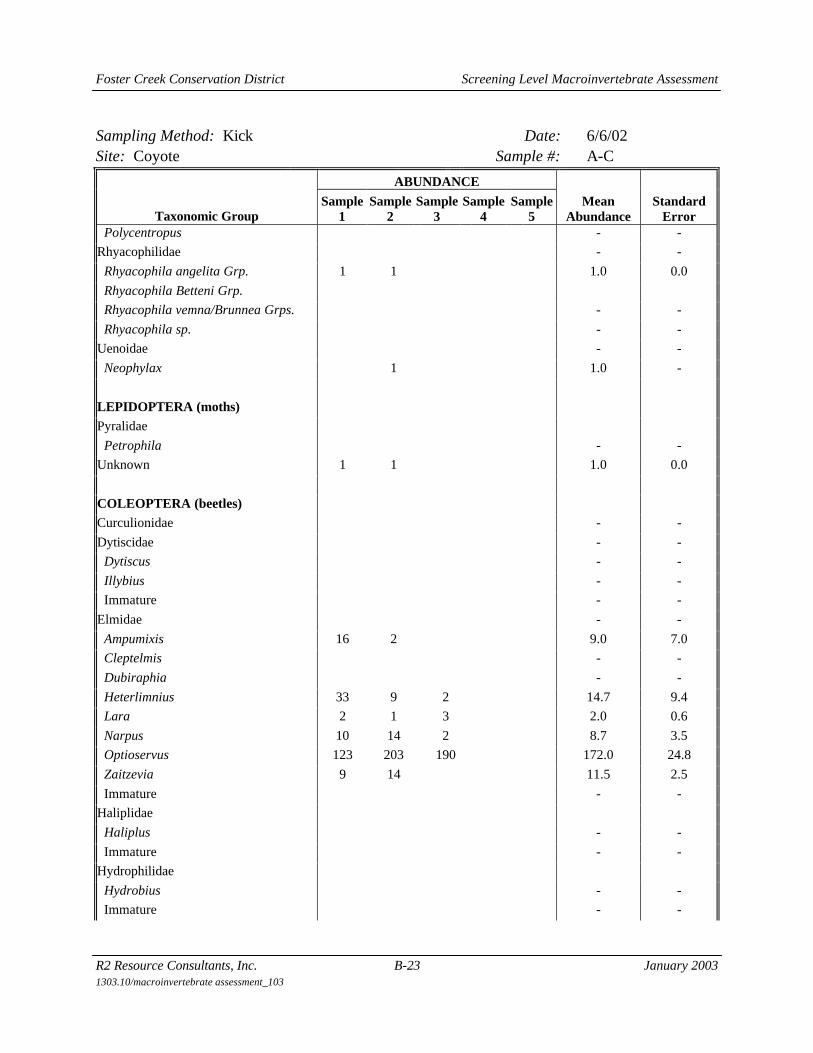
Foster Creek Conservation District Screening Level Macroinvertebrate Assessment
R2 Resource Consultants, Inc. B-23 January 2003 1303.10/macroinvertebrate assessment_103
Sampling Method: Kick Date: 6/6/02 Site: Coyote Sample #: A-C
ABUNDANCE
Taxonomic Group Sample
1 Sample
2 Sample
3 Sample
4 Sample
5 Mean
Abundance Standard
Error Polycentropus - - Rhyacophilidae - - Rhyacophila angelita Grp. 1 1 1.0 0.0 Rhyacophila Betteni Grp. Rhyacophila vemna/Brunnea Grps. - - Rhyacophila sp. - - Uenoidae - - Neophylax 1 1.0 - LEPIDOPTERA (moths) Pyralidae Petrophila - - Unknown 1 1 1.0 0.0 COLEOPTERA (beetles) Curculionidae - - Dytiscidae - - Dytiscus - - Illybius - - Immature - - Elmidae - - Ampumixis 16 2 9.0 7.0 Cleptelmis - - Dubiraphia - - Heterlimnius 33 9 2 14.7 9.4 Lara 2 1 3 2.0 0.6 Narpus 10 14 2 8.7 3.5 Optioservus 123 203 190 172.0 24.8 Zaitzevia 9 14 11.5 2.5 Immature - - Haliplidae Haliplus - - Immature - - Hydrophilidae Hydrobius - - Immature - -

Foster Creek Conservation District Screening Level Macroinvertebrate Assessment
R2 Resource Consultants, Inc. B-24 January 2003 1303.10/macroinvertebrate assessment_103
Sampling Method: Kick Date: 6/6/02 Site: Coyote Sample #: A-C
ABUNDANCE
Taxonomic Group Sample
1 Sample
2 Sample
3 Sample
4 Sample
5 Mean
Abundance Standard
Error DIPTERA (true flies) Athericidae Atherix - - Blephariceridae Blepharicera - - Philorus - - Ceratopogonidae 1 1.0 - Chironomidae - - Chironominae/Chironomini Chironomus - - Dicrotendipes - - Endochironomus - - Microtendipes - - Paracladopelma - - Paralauterborniella - - Polypedilum - - Tanytarsini 6 1 5 4.0 1.5 Micropsectra - - Paratanytarsus - - Rheotanytarsus - - Tanytarsus - - Tanypodinae Macropelopia Procladius - - Thienenmannimyia Grp. - - Diamesinae Pagastia - - Potthastia - - Orthocladiinae 12 8 3 7.7 2.6 Brillia - - Cardiocladius - - Corynoneura - - Cricotopus nostococladius - - Cricotopus bicinctus - - Cricotopus sp. - -

Foster Creek Conservation District Screening Level Macroinvertebrate Assessment
R2 Resource Consultants, Inc. B-25 January 2003 1303.10/macroinvertebrate assessment_103
Sampling Method: Kick Date: 6/6/02 Site: Coyote Sample #: A-C
ABUNDANCE
Taxonomic Group Sample
1 Sample
2 Sample
3 Sample
4 Sample
5 Mean
Abundance Standard
Error Diplocladius Eukiefferiella - - Eukiefferiella Pseudomontana G - - Nanocladius - - Orthocladius - - Paraphaenocladius - - Parametriocnemus - - Rheocricotopus - - Synorthocladius - - Thienemanniella - - Tvetenia - - Zalutschia - - Empididae Chelifera - - Hemerodromia 1 1 1.0 0.0 Oreogeton - - Simuliidae - - Simulium 7 6 2 5.0 1.5 Tabanidae 1 1.0 - Tipulidae Antocha - - Dicranota 1 1.0 - Hexatoma 1 1.0 - Limnophila - - Tipula - - immature 2 3 NON-INSECT TAXA Turbellaria (flatworms) Planariidae 1 1.0 - Unknown - - Aschelminthes Nematoda (roundworms) - - Annelida Hirudinea (leeches) - - Oligochaeta (earthworms) 5 8 12 8.3 2.0

Foster Creek Conservation District Screening Level Macroinvertebrate Assessment
R2 Resource Consultants, Inc. B-26 January 2003 1303.10/macroinvertebrate assessment_103
Sampling Method: Kick Date: 6/6/02 Site: Coyote Sample #: A-C
ABUNDANCE
Taxonomic Group Sample
1 Sample
2 Sample
3 Sample
4 Sample
5 Mean
Abundance Standard
Error Lumbricidae - - Tubificidae - - Gastropoda (snails) Ancylidae - - Hydrobiidae - - Fluminicola - - Physidae Physella - - Planorbidae - - Vorticifex - - Pelecypoda (clams, mussels) Sphaeriidae - - Unknown - - Amphipoda (scuds, sideswimmers) Gammarus 1 1.0 - Hyalella azteca - - Decapoda Pacifasticus - - Cladocera - - Copepoda - - Isopoda - Caecidotea - - Ostracoda - - Hydracarina (water mites) - - TOTAL INDIVIDUALS 294 320 293 302.3 8.8

Foster Creek Conservation District Screening Level Macroinvertebrate Assessment
R2 Resource Consultants, Inc. B-27 January 2003 1303.10/macroinvertebrate assessment_103
Sampling Method: Kick Date: 6/6/02 Site: West Foster Sample #: A-C
Metric Sample
1 Sample
2 Sample
3 Sample
4 Sample
5 Composite Total Abundance (#/sample) 2,393 832 355 1193.2 Density (#/sq-m) 12,592 4,378 1,870 6280.2 Taxa Richness (# taxa) 13 14 17 25.0 B-IBI Metric Score 3 3 3 5 Hilsenhoff Biotic Index 5.47 5.49 5.56 5.5 Ephemeroptera Richness 3 1 3 3.0 B-IBI Metric Score 3 1 3 3 Plecoptera Richness 0 0 0 0.0 B-IBI Metric Score 1 1 1 1 Trichoptera Richness 1 2 1 2.0 B-IBI Metric Score 1 3 1 3 EPT Taxa Richness 4 3 4 5.0 % EPT of Total Abundance 9.1 12.8 23.1 16.1 % Predators 0.6 1.3 1.3 1.1 B-IBI Metric Score 1 1 1 1 % Contribution of Dominant Taxa 78.4 59.7 69.2 69.1 B-IBI Metric Score 1 3 3 3 Intolerant Taxa Richness 1 0 1 1.0 B-IBI Metric Score 3 1 3 3 Long-Lived Taxa Richness 3 1 1 3.0 B-IBI Metric Score 5 3 3 5 % Tolerant Taxa 69.2 42.9 41.2 44.0 B-IBI Metric Score 1 3 3 3 B-IBI 19 19 21 27 Abundance by Order (%) Ephemeroptera 8.8 8.9 20.8 12.8 Odonata 0.0 0.3 0.0 0.1 Plecoptera 0.0 0.0 0.0 0.0 Hemiptera 0.0 0.0 0.0 0.0 Trichoptera 0.3 3.9 2.3 2.2 Lepidoptera 0.9 0.7 0.0 0.5 Coleoptera 21.3 32.5 28.2 27.3 Diptera 68.3 53.1 45.8 55.7 Non-Insect Taxa 0.3 0.7 2.9 1.3 Abundance by Food Group (%) Collector-Gatherers 49.5 62.6 74.7 62.3 Scrapers/Grazers 0.9 0.7 0.3 0.6

Foster Creek Conservation District Screening Level Macroinvertebrate Assessment
R2 Resource Consultants, Inc. B-28 January 2003 1303.10/macroinvertebrate assessment_103
Sampling Method: Kick Date: 6/6/02 Site: West Foster Sample #: A-C
Metric Sample
1 Sample
2 Sample
3 Sample
4 Sample
5 Composite Shredders 0.0 0.0 0.0 0.0 Filter Feeders 9.1 22.3 13.3 14.9 Predators 0.6 1.3 1.3 1.1 Unknown 39.8 13.1 10.4 21.1 Abundance by Habit (%) Burrowers 38.6 12.1 6.5 19.1 Climbers 0.0 0.0 1.3 0.4 Clingers 33.2 59.3 46.1 46.2 Skater 0.0 0.0 0.0 0.0 Sprawler 19.4 19.3 23.1 20.6 Swimmer 8.8 8.9 23.1 13.6

Foster Creek Conservation District Screening Level Macroinvertebrate Assessment
R2 Resource Consultants, Inc. B-29 January 2003 1303.10/macroinvertebrate assessment_103
Sampling Method: Kick Date: 6/6/02 Site: West Foster Sample #: A-C
ABUNDANCE
Taxonomic Group Sample
1 Sample
2 Sample
3 Sample
4 Sample
5 Mean
Abundance Standard
Error EPHEMEROPTERA (mayflies) Baetidae Acentrella insignificans 3 1 2.0 1.0 Baetis bicaudatus 1 1 1.0 0.0 Baetis tricaudatus 24 27 62 37.7 12.2 Baetis sp. - - Immature - - Caenidae Caenis - - Ephemerellidae Attenella margarita - - Caudatella edmundsi - - Drunella spinifera - - Drunella sp. - - Ephemerella - - Serratella - - Immature - - Heptageniidae Epeorus - - Heptagenia/Leucrocuta/Nixe - - Nixe simplicoides - - Rhithrogena - - Stenonema - - Immature - - Leptophlebiidae Paraleptophlebia bicornata - - Paraleptophlebia temporalis - - Immature - - Siphlonuridae Ameletus - - Tricorythidae Tricorythodes - - ODONATA (dragonflies) Anisoptera Aeshnidae - -

Foster Creek Conservation District Screening Level Macroinvertebrate Assessment
R2 Resource Consultants, Inc. B-30 January 2003 1303.10/macroinvertebrate assessment_103
Sampling Method: Kick Date: 6/6/02 Site: West Foster Sample #: A-C
ABUNDANCE
Taxonomic Group Sample
1 Sample
2 Sample
3 Sample
4 Sample
5 Mean
Abundance Standard
Error Gomphidae - - Ophiogomphus - - Unknown - - Zygoptera Coenagrionidae Argia - - Unknown 1 1.0 - MEGALOPTERA Sialidae Sialis - - PLECOPTERA (stoneflies) Capniidae Immature - - Chloroperlidae Sweltsa - - Immature - - Nemouridae Zapada cinctipes - - Zapada Oregonensis Gr. - - Immature Perlidae Claassenia - - Hesperoperla pacifica - - Immature - - Perlodidae Skwala - - Immature - - Pteronarcyidae Pteronarcella - - Pteronarcys - - Taeniopterygidae Taenionema Immature - -

Foster Creek Conservation District Screening Level Macroinvertebrate Assessment
R2 Resource Consultants, Inc. B-31 January 2003 1303.10/macroinvertebrate assessment_103
Sampling Method: Kick Date: 6/6/02 Site: West Foster Sample #: A-C
ABUNDANCE
Taxonomic Group Sample
1 Sample
2 Sample
3 Sample
4 Sample
5 Mean
Abundance Standard
Error HEMIPTERA (true bugs) Corixidae - - Gerridae - - Unknown - - TRICHOPTERA (caddisflies) Brachycentridae Brachycentrus - - Micrasema - - Immature - - Glossosomatidae Glossosoma - - Protoptila - - Helicopsychidae Helicopsyche - - Hydropsychidae Arctopsyche grandis - - Cheumatopsyche - - Hydropsyche 4 4.0 - Immature - - Hydroptilidae Agraylea - - Hydroptila 1 8 7 5.3 2.2 Immature - - Lepidostomatidae Lepidostoma - - Leptoceridae Ceraclea - - Nectopsyche - - Oecetis - - Limnephilidae Dicosmoecus - - Immature - - Polycentropodidae Polycentropus - - Rhyacophilidae

Foster Creek Conservation District Screening Level Macroinvertebrate Assessment
R2 Resource Consultants, Inc. B-32 January 2003 1303.10/macroinvertebrate assessment_103
Sampling Method: Kick Date: 6/6/02 Site: West Foster Sample #: A-C
ABUNDANCE
Taxonomic Group Sample
1 Sample
2 Sample
3 Sample
4 Sample
5 Mean
Abundance Standard
Error Rhyacophila angelita Grp. - - Rhyacophila Betteni Grp. - - Rhyacophila vemna/Brunnea Grps. - - Rhyacophila sp. - - LEPIDOPTERA (moths) Pyralidae Petrophila 3 2 2.5 0.5 Unknown - - COLEOPTERA (beetles) Curculionidae - - Dytiscidae - - Dytiscus - - Illybius - - Immature 4 4.0 - Elmidae Ampumixis 66 99 83 82.7 9.5 Dubiraphia - - Heterlimnius - - Lara - - Narpus - - Optioservus 2 2.0 - Zaitzevia - - Immature - - Haliplidae Haliplus - - Immature - - Hydrophilidae Hydrobius - - Immature - - DIPTERA (true flies) Athericidae Atherix - - Blephariceridae

Foster Creek Conservation District Screening Level Macroinvertebrate Assessment
R2 Resource Consultants, Inc. B-33 January 2003 1303.10/macroinvertebrate assessment_103
Sampling Method: Kick Date: 6/6/02 Site: West Foster Sample #: A-C
ABUNDANCE
Taxonomic Group Sample
1 Sample
2 Sample
3 Sample
4 Sample
5 Mean
Abundance Standard
Error Blepharicera - - Philorus Chironomidae - - Chironominae/Chironomini 2 2.0 - Chironomus - - Dicrotendipes - - Endochironomus - - Microtendipes - - Paracladopelma - - Paralauterborniella - - Polypedilum - - Tanytarsini 4 4 9 5.7 1.7 Micropsectra - - Paratanytarsus - - Rheotanytarsus - - Tanytarsus - - Tanypodinae 3 3.0 - Macropelopia Procladius - - Thienenmannimyia Grp. - - Diamesinae 1 1.0 - Pagastia - - Potthastia - - Orthocladiinae 123 36 17 58.7 32.6 Brillia - - Cardiocladius - - Corynoneura - - Cricotopus nostococladius - - Cricotopus bicinctus - - Cricotopus sp. - - Diplocladius Eukiefferiella - - Eukiefferiella Pseudomontana G - - Nanocladius - - Orthocladius - - Paraphaenocladius - -

Foster Creek Conservation District Screening Level Macroinvertebrate Assessment
R2 Resource Consultants, Inc. B-34 January 2003 1303.10/macroinvertebrate assessment_103
Sampling Method: Kick Date: 6/6/02 Site: West Foster Sample #: A-C
ABUNDANCE
Taxonomic Group Sample
1 Sample
2 Sample
3 Sample
4 Sample
5 Mean
Abundance Standard
Error Parametriocnemus - - Rheocricotopus - - Synorthocladius - - Thienemanniella - - Tvetenia - - Zalutschia - - Empididae Chelifera - - Hemerodromia 1 1 1.0 0.0 Oreogeton - - Simuliidae - - Simulium 29 64 41 44.7 10.3 Stratiomyidae 61 56 68 61.7 3.5 Tipulidae Antocha - - Dicranota 1 1.0 - Hexatoma - - Limnophila - - Tipula - - NON-INSECT TAXA Turbellaria (flatworms) Planariidae - - Unknown - - Aschelminthes Nematoda (roundworms) - - Annelida Hirudinea (leeches) 1 1.0 - Oligochaeta (earthworms) 1 1 1.0 0.0 Lumbricidae - - Tubificidae - - Gastropoda (snails) Ancylidae - - Hydrobiidae - - Fluminicola - - Physidae

Foster Creek Conservation District Screening Level Macroinvertebrate Assessment
R2 Resource Consultants, Inc. B-35 January 2003 1303.10/macroinvertebrate assessment_103
Sampling Method: Kick Date: 6/6/02 Site: West Foster Sample #: A-C
ABUNDANCE
Taxonomic Group Sample
1 Sample
2 Sample
3 Sample
4 Sample
5 Mean
Abundance Standard
Error Physella 1 1.0 - Planorbidae - - Vorticifex - - Pelecypoda (clams, mussels) Sphaeriidae - - Unknown - - Amphipoda (scuds, sideswimmers) Gammarus 2 2.0 - Hyalella azteca 5 5.0 - Decapoda Pacifasticus - - Cladocera - - Copepoda - - Isopoda - Caecidotea - - Ostracoda - - Hydracarina (water mites) 1 1.0 - TOTAL INDIVIDUALS 319 305 308 310.7 4.3

Foster Creek Conservation District Screening Level Macroinvertebrate Assessment
R2 Resource Consultants, Inc. B-36 January 2003 1303.10/macroinvertebrate assessment_103
Sampling Method: Kick Date: 6/6/02 Site: East Foster Sample #: A-C
Metric Sample
1 Sample
2 Sample
3 Sample
4 Sample
5 Composite Total Abundance (#/sample) 330 1,760 1,610 1233.3 Density (#/sq-m) 1,737 9,263 8,474 6491.2 Taxa Richness (# taxa) 15 14 11 18.0 B-IBI Metric Score 3 3 3 3 Hilsenhoff Biotic Index 5.35 5.61 5.70 5.6 Ephemeroptera Richness 2 3 2 3.0 B-IBI Metric Score 1 3 1 3 Plecoptera Richness 0 0 0 0.0 B-IBI Metric Score 1 1 1 1 Trichoptera Richness 0 0 0 0.0 B-IBI Metric Score 1 1 1 1 EPT Taxa Richness 2 3 2 3.0 % EPT of Total Abundance 25.5 18.5 18.6 21.0 % Predators 7.6 6.8 3.7 6.0 B-IBI Metric Score 3 3 1 3 % Contribution of Dominant Taxa 73.6 82.7 87.6 81.3 B-IBI Metric Score 3 1 1 1 Intolerant Taxa Richness 1 1 1 1.0 B-IBI Metric Score 3 3 3 3 Long-Lived Taxa Richness 1 1 1 1.0 B-IBI Metric Score 3 3 3 3 % Tolerant Taxa 40.0 35.7 36.4 38.9 B-IBI Metric Score 3 3 3 3 B-IBI 21 21 17 21 Abundance by Order (%) Ephemeroptera 25.5 18.5 18.6 20.9 Odonata 0.0 0.0 0.0 0.0 Plecoptera 0.0 0.0 0.0 0.0 Hemiptera 6.7 1.4 0.6 2.9 Trichoptera 0.0 0.0 0.0 0.0 Lepidoptera 0.0 0.0 0.0 0.0 Coleoptera 10.6 9.1 7.1 8.9 Diptera 55.5 70.2 73.0 66.2 Non-Insect Taxa 1.8 0.9 0.6 1.1 Abundance by Food Group (%) Collector-Gatherers 29.7 21.3 22.7 24.6 Scrapers/Grazers 0.3 0.0 0.0 0.1

Foster Creek Conservation District Screening Level Macroinvertebrate Assessment
R2 Resource Consultants, Inc. B-37 January 2003 1303.10/macroinvertebrate assessment_103
Sampling Method: Kick Date: 6/6/02 Site: East Foster Sample #: A-C Shredders 0.0 0.0 0.0 0.0 Filter Feeders 3.9 45.5 56.8 35.4 Predators 7.6 6.8 3.7 6.0 Unknown 58.5 26.4 16.8 33.9 Abundance by Habit (%) Burrowers 40.9 19.9 13.4 24.7 Climbers 7.6 6.8 3.7 6.0 Clingers 14.2 51.1 62.4 42.6 Skater 0.0 0.0 0.0 0.0 Sprawler 3.0 0.9 0.6 1.5 Swimmer 27.0 19.3 19.3 21.8
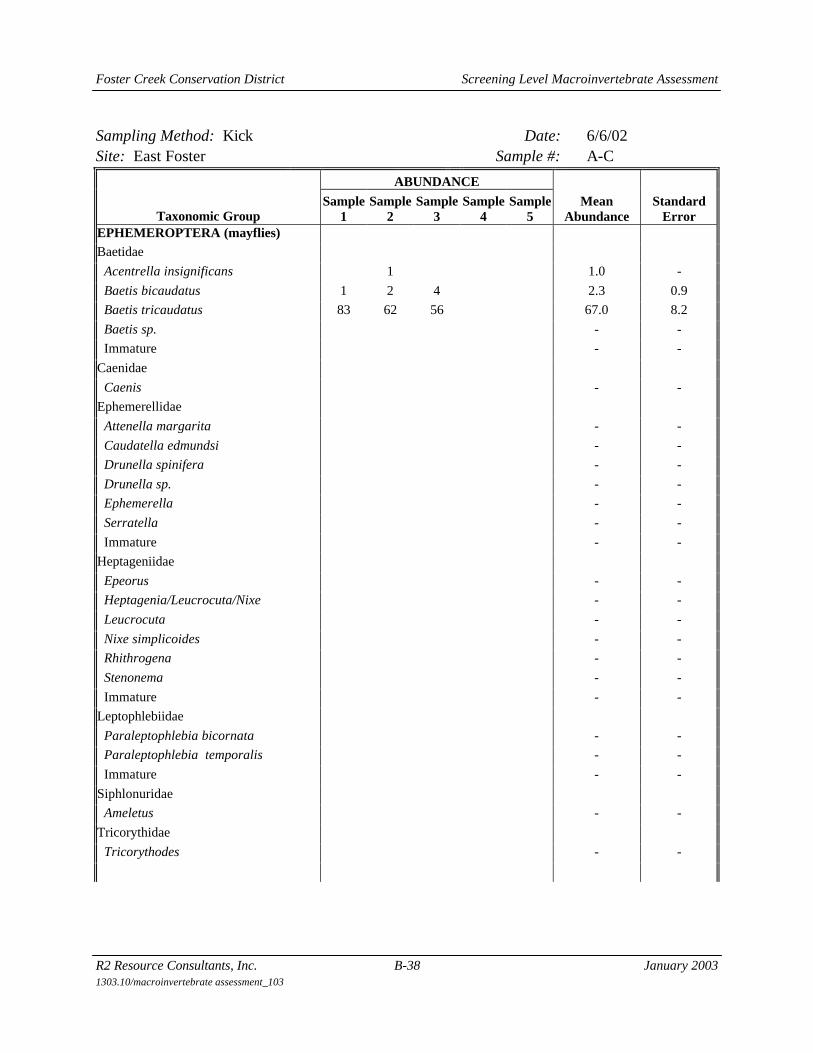
Foster Creek Conservation District Screening Level Macroinvertebrate Assessment
R2 Resource Consultants, Inc. B-38 January 2003 1303.10/macroinvertebrate assessment_103
Sampling Method: Kick Date: 6/6/02 Site: East Foster Sample #: A-C
ABUNDANCE
Taxonomic Group Sample
1 Sample
2 Sample
3 Sample
4 Sample
5 Mean
Abundance Standard
Error EPHEMEROPTERA (mayflies) Baetidae Acentrella insignificans 1 1.0 - Baetis bicaudatus 1 2 4 2.3 0.9 Baetis tricaudatus 83 62 56 67.0 8.2 Baetis sp. - - Immature - - Caenidae Caenis - - Ephemerellidae Attenella margarita - - Caudatella edmundsi - - Drunella spinifera - - Drunella sp. - - Ephemerella - - Serratella - - Immature - - Heptageniidae Epeorus - - Heptagenia/Leucrocuta/Nixe - - Leucrocuta - - Nixe simplicoides - - Rhithrogena - - Stenonema - - Immature - - Leptophlebiidae Paraleptophlebia bicornata - - Paraleptophlebia temporalis - - Immature - - Siphlonuridae Ameletus - - Tricorythidae Tricorythodes - -

Foster Creek Conservation District Screening Level Macroinvertebrate Assessment
R2 Resource Consultants, Inc. B-39 January 2003 1303.10/macroinvertebrate assessment_103
Sampling Method: Kick Date: 6/6/02 Site: East Foster Sample #: A-C
ABUNDANCE
Taxonomic Group Sample
1 Sample
2 Sample
3 Sample
4 Sample
5 Mean
Abundance Standard
Error ODONATA (dragonflies) Anisoptera Aeshnidae - - Gomphidae - - Ophiogomphus - - Unknown - - Zygoptera Coenagrionidae Argia - - Unknown - - MEGALOPTERA Sialidae Sialis - - PLECOPTERA (stoneflies) Capniidae Immature - - Chloroperlidae Sweltsa - - Immature - - Nemouridae Zapada cinctipes - - Zapada Oregonensis Gr. - - Immature Perlidae Claassenia - - Hesperoperla pacifica - - Immature - - Perlodidae Isoperla - - Skwala - - Immature - - Pteronarcyidae Pteronarcella - - Pteronarcys - -

Foster Creek Conservation District Screening Level Macroinvertebrate Assessment
R2 Resource Consultants, Inc. B-40 January 2003 1303.10/macroinvertebrate assessment_103
Sampling Method: Kick Date: 6/6/02 Site: East Foster Sample #: A-C
ABUNDANCE
Taxonomic Group Sample
1 Sample
2 Sample
3 Sample
4 Sample
5 Mean
Abundance Standard
Error Taeniopterygidae Taenionema Immature - - HEMIPTERA (true bugs) Corixidae - - Gerridae - - Unknown 22 5 2 9.7 6.2 TRICHOPTERA (caddisflies) Brachycentridae Brachycentrus - - Micrasema - - Immature - - Glossosomatidae Glossosoma - - Protoptila - - Helicopsychidae Helicopsyche - - Hydropsychidae Arctopsyche grandis - - Cheumatopsyche - - Hydropsyche / Ceratopsyche - - Immature - - Hydroptilidae Agraylea - - Hydroptila - - Leucotrichia - - Immature - - Lepidostomatidae Lepidostoma - - Leptoceridae Ceraclea - - Nectopsyche - - Oecetis - -

Foster Creek Conservation District Screening Level Macroinvertebrate Assessment
R2 Resource Consultants, Inc. B-41 January 2003 1303.10/macroinvertebrate assessment_103
Sampling Method: Kick Date: 6/6/02 Site: East Foster Sample #: A-C
ABUNDANCE
Taxonomic Group Sample
1 Sample
2 Sample
3 Sample
4 Sample
5 Mean
Abundance Standard
Error Limnephilidae Dicosmoecus - - Immature - - Philopotamidae Wormaldia - - Polycentropodidae Polycentropus - - Rhyacophilidae Rhyacophila angelita Grp. Rhyacophila Betteni Grp. Rhyacophila vemna/Brunnea Grps. - - Rhyacophila sp. - - LEPIDOPTERA (moths) Pyralidae Petrophila - - Unknown - - COLEOPTERA (beetles) Curculionidae - - Dytiscidae - - Dytiscus - - Illybius - - Immature 25 24 12 20.3 4.2 Elmidae Ampumixis 10 8 11 9.7 0.9 Cleptelmis - - Dubiraphia - - Heterlimnius - - Lara - - Narpus - - Optioservus - - Zaitzevia - - Immature - -
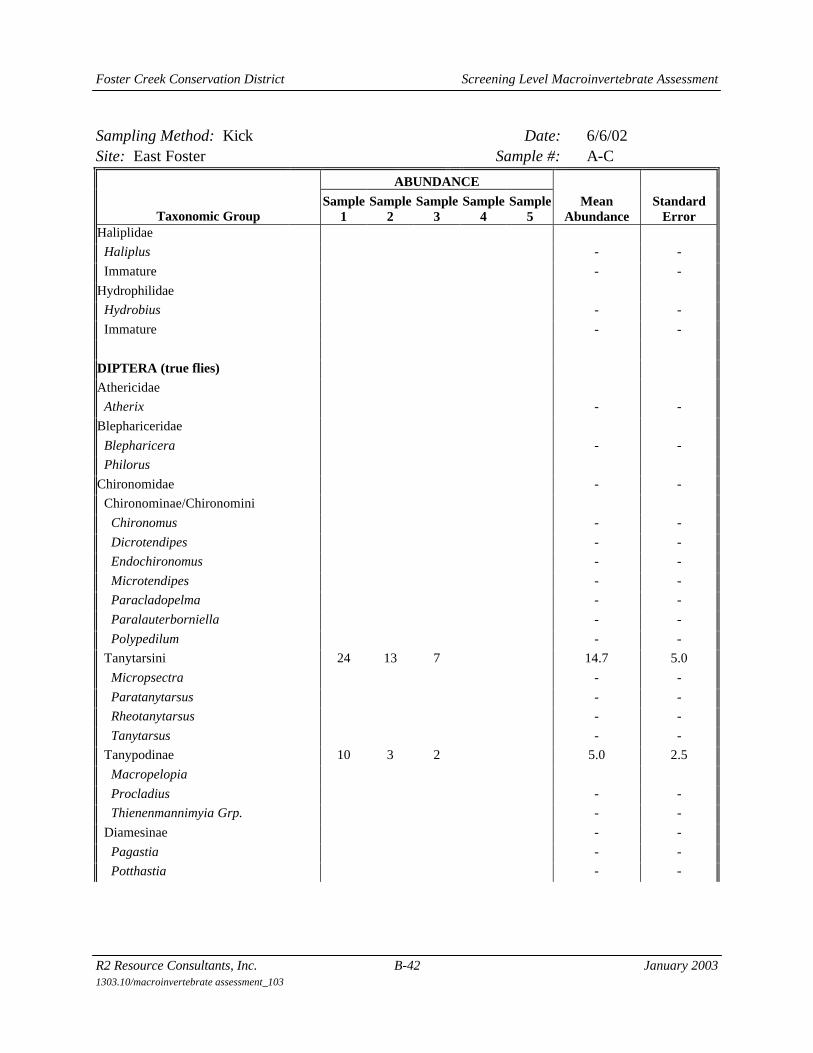
Foster Creek Conservation District Screening Level Macroinvertebrate Assessment
R2 Resource Consultants, Inc. B-42 January 2003 1303.10/macroinvertebrate assessment_103
Sampling Method: Kick Date: 6/6/02 Site: East Foster Sample #: A-C
ABUNDANCE
Taxonomic Group Sample
1 Sample
2 Sample
3 Sample
4 Sample
5 Mean
Abundance Standard
Error Haliplidae Haliplus - - Immature - - Hydrophilidae Hydrobius - - Immature - - DIPTERA (true flies) Athericidae Atherix - - Blephariceridae Blepharicera - - Philorus Chironomidae - - Chironominae/Chironomini Chironomus - - Dicrotendipes - - Endochironomus - - Microtendipes - - Paracladopelma - - Paralauterborniella - - Polypedilum - - Tanytarsini 24 13 7 14.7 5.0 Micropsectra - - Paratanytarsus - - Rheotanytarsus - - Tanytarsus - - Tanypodinae 10 3 2 5.0 2.5 Macropelopia Procladius - - Thienenmannimyia Grp. - - Diamesinae - - Pagastia - - Potthastia - -

Foster Creek Conservation District Screening Level Macroinvertebrate Assessment
R2 Resource Consultants, Inc. B-43 January 2003 1303.10/macroinvertebrate assessment_103
Sampling Method: Kick Date: 6/6/02 Site: East Foster Sample #: A-C
ABUNDANCE
Taxonomic Group Sample
1 Sample
2 Sample
3 Sample
4 Sample
5 Mean
Abundance Standard
Error Orthocladiinae 135 70 43 82.7 27.3 Brillia - - Cardiocladius - - Corynoneura - - Cricotopus nostococladius - - Cricotopus bicinctus - - Cricotopus sp. - - Diplocladius Eukiefferiella - - Eukiefferiella Pseudomontana G - - Nanocladius - - Orthocladius - - Paraphaenocladius - - Parametriocnemus - - Rheocricotopus - - Synorthocladius - - Thienemanniella - - Tvetenia - - Zalutschia - - Dixidae - - Dixa 1 1.0 - Empididae Chelifera - - Hemerodromia - - Oreogeton - - Simuliidae - - Simulium 12 159 183 118.0 53.5 Stratiomyidae 1 1.0 - Tabanidae 2 2.0 - Tipulidae Antocha - - Dicranota - - Hexatoma - - Limnophila - - Tipula - -

Foster Creek Conservation District Screening Level Macroinvertebrate Assessment
R2 Resource Consultants, Inc. B-44 January 2003 1303.10/macroinvertebrate assessment_103
Sampling Method: Kick Date: 6/6/02 Site: East Foster Sample #: A-C
ABUNDANCE
Taxonomic Group Sample
1 Sample
2 Sample
3 Sample
4 Sample
5 Mean
Abundance Standard
Error NON-INSECT TAXA Turbellaria (flatworms) Planariidae - - Unknown - - Aschelminthes Nematoda (roundworms) 1 1.0 - Annelida Hirudinea (leeches) - - Oligochaeta (earthworms) - - Lumbricidae - - Tubificidae - - Gastropoda (snails) Ancylidae - - Hydrobiidae - - Fluminicola - - Physidae Physella - - Planorbidae 1 1.0 - Vorticifex - - Pelecypoda (clams, mussels) Sphaeriidae - - Unknown - - Amphipoda (scuds, sideswimmers) Gammarus 3 2 2 2.3 0.3 Hyalella azteca - - Decapoda Pacifasticus - - Cladocera - - Copepoda - - Isopoda - Caecidotea - - Ostracoda 1 1 1.0 0.0 Hydracarina (water mites) - - TOTAL INDIVIDUALS 330 352 322 334.7 9.0

Appendix C
Stream Reach Inventory and Channel Stability Evaluation Methodology

Appendix C
Stream Reach Inventory and Channel Stability Evaluation(SRI/CSE) Methodology
The field assessment for the SRI/CSE methodology consisted of evaluating fifteenvariables over the length of the sample reach. The fifteen variables in the numericalscore included: 1) landform slope, 2) mass wasting potential, 3) debris jam potential, 4)vegetative bank cover, 5) channel capacity, 6) bank rock content, 7) flow obstructions, 8)bank cutting, 9) deposition, 10) rock angularity, 11) bed material brightness, 12) bedmaterial consolidation, 13) particle size distribution, 14) scour and deposition patterns,and 15) abundance of aquatic vegetation. A brief description of each variable is providedbelow.
� Upper Banks: Four variables are evaluated to reflect conditions on thefloodplain above the normal high water mark. Landform Slope - whichdetermines the extent that stream banks can erode; Mass Wasting Potential –the degree to which upper banks show signs of sloughing; Debris JamPotential – the potential for stream bank objects to become lodged inconstricted areas; Vegetative Bank Protection – the extent of vegetative coveroccurring on the upper banks.
� Lower Banks: Five variables associated with the lower banks (i.e., from thenormal high water line to the water’s edge) are evaluated. Channel Capacity –the quantity of water that can be effectively transported through a channel;Bank Rock Content – the size and quantity of materials comprising the lowerchannel banks; Obstruction and Flow Deflectors – objects, debris, etc., of asufficiently large size which can deflect of alter the natural flow pattern;Cutting – a rate of the scouring or uprooting of aquatic and bank vegetation;Deposition – the quantity of material being deposited within a given streamchannel.
� Channel Bottom: Six variables that define the characteristics associated withthe bottom portion of the channel. Angularity – the shape and structure of thebottom substrate; Brightness – the percentage of the stream substrate that isbright in color and clean of algae; Consolidation – the size gradation andpacking of substrate materials; Bottom Size Distribution and Percent StableMaterial – the percentage of substrate comprised of stable sized materials;Souring and/or Deposition – the percentage of the stream bottom affected byscour or deposition; Aquatic Vegetation – a qualitative estimate of the extentand abundance of aquatic vegetation occurring within the substrate.

Appendix D
Wolman Pebble Count; Particle Size Distributions

Appendix Table D-1. Foster Creek particle size distribution
Pebble Count Worksheet COMMENTS:Particle Size
(mm)% finer
thanTotal Count
STREAM NAME: Foster Creek
DATE: 5/23/01CREW: M. Gagner
Particle Size Fines <6 mm D35 D50 D84 D95< 2 6% 6 Distribution (mm) 20% 16.0 21.7 44.9 64.0
2 - 4 20% 144 - 6 20% 06 - 8 24% 48 - 12 26% 2
12 - 16 35% 916 - 24 55% 2024 - 32 69% 1432 - 48 87% 1848 - 64 95% 864 - 96 98% 396 - 128 100% 2
128 - 192 100% 0192 - 256 100% 0256 - 384 100% 0384 - 512 100% 0512 - 1024 100% 01024-2048 100% 02048-4096 100% 0
Total # 100
BoulderCobbleGravel
0
0.1
0.2
0.3
0.4
0.5
0.6
0.7
0.8
0.9
1
1 10 100 1000 10000
Particle Size (mm)
Cum
ulat
ive
% F
iner
Tha
n
Percent of Total

Appendix Table D-2. Pine Canyon Creek particle size distribution
Pebble Count Worksheet COMMENTS:Particle Size
(mm)% finer
thanTotal Count
STREAM NAME: Pine Canyon Creek
DATE: 5/22/01CREW: M. Gagner
Particle Size Fines <6 mm D35 D50 D84 D95< 2 0% 0 Distribution (mm) 20% 16.0 25.8 101.7 173.5
2 - 4 20% 204 - 6 20% 06 - 8 27% 78 - 12 28% 1
12 - 16 35% 716 - 24 47% 1224 - 32 59% 1232 - 48 63% 448 - 64 76% 1364 - 96 82% 696 - 128 92% 10
128 - 192 96% 4192 - 256 99% 3256 - 384 100% 1384 - 512 100% 0512 - 1024 100% 01024-2048 100% 02048-4096 100% 0
Total # 100
BoulderCobbleGravel
0
0.1
0.2
0.3
0.4
0.5
0.6
0.7
0.8
0.9
1
1 10 100 1000 10000
Particle Size (mm)
Cum
ulat
ive
% F
iner
Tha
n
Percent of Total

Appendix Table D-3. Sand Canyon Creek particle size distribution
Pebble Count Worksheet COMMENTS:Particle Size
(mm)% finer
thanTotal Count
STREAM NAME: Sand Canyon Creek
DATE: 5/24/01CREW: M. Gagner
Particle Size Fines <6 mm D35 D50 D84 D95< 2 0% 0 Distribution (mm) 49% 3.4 8.0 46.1 80.7
2 - 4 46% 464 - 6 49% 36 - 8 50% 18 - 12 54% 4
12 - 16 59% 516 - 24 67% 824 - 32 75% 832 - 48 85% 1048 - 64 91% 664 - 96 98% 796 - 128 99% 1
128 - 192 99% 0192 - 256 100% 1256 - 384 100% 0384 - 512 100% 0512 - 1024 100% 01024-2048 100% 02048-4096 100% 0
Total # 100
BoulderCobbleGravel
0
0.1
0.2
0.3
0.4
0.5
0.6
0.7
0.8
0.9
1
1 10 100 1000 10000
Particle Size (mm)
Cum
ulat
ive
% F
iner
Tha
n
Percent of Total

Appendix Table D-4. Rock Island Creek particle size distribution
Pebble Count Worksheet COMMENTS:Particle Size
(mm)% finer
thanTotal Count
STREAM NAME: Rock Island Creek
DATE: 5/25/01CREW: B. Kvam
Particle Size Fines <6 mm D35 D50 D84 D95< 2 12% 12 Distribution (mm) 16% 21.2 37.0 108.6 192.0
2 - 4 13% 14 - 6 16% 36 - 8 17% 18 - 12 21% 4
12 - 16 26% 516 - 24 39% 1324 - 32 45% 632 - 48 59% 1448 - 64 66% 764 - 96 81% 1596 - 128 88% 7
128 - 192 95% 7192 - 256 99% 4256 - 384 100% 1384 - 512 100% 0512 - 1024 100% 01024-2048 100% 02048-4096 100% 0
Total # 100
BoulderCobbleGravel
0
0.1
0.2
0.3
0.4
0.5
0.6
0.7
0.8
0.9
1
1 10 100 1000 10000
Particle Size (mm)
Cum
ulat
ive
% F
iner
Tha
n
Percent of Total
Appendix E
Habitat Quantity Assessment Results in Potential Anadromous Fish-Bearing Streams
in WRIAs 44 and 50

Table E-1. Summary statistics for fish habitat data collected during stream surveys conducted as part of WRIAs 44 and 50Watershed Planning, Douglas County, Washington.
Data Summary
Stream Name and Reach
Average1
ChannelWidth (ft)
PoolTally
% Pool2
by Length% Pool2
by Area% Riffle2
by LengthLWDTally
Substrate3
(Dom/Sub)
Spawning4
Area(sq. ft)
Foster Creek Alluvial Fan (RM 0.0 to 0.05) 22.0 0 0 0 100 0 1/4 60 Step-Pool (RM 0.02 to 0.36) 20.3 7 20 20 18 0 7/4 82 Pool-Riffle (RM 0.36 to 0.98) 14.5 6 14 16 56 0 4/3 431
Pine Canyon Creek Pool-Riffle (RM 1.23 to 1.62) 5.5 8 9 9 88 0 4/5 0
Blue Grade Draw Alluvial Fan (RM 0.0 to 0.01) 40.0 0 0 0 100 0 4/3 12 Step-Pool (RM 0.01 to 0.23) 9.0 8 12 10 25 0 1/6 48
Sand Canyon Creek Alluvial Fan (RM 0.0 to 0.05) 8.0 0 0 0 100 0 3/4 12 Pool-Riffle (RM 0.05 to 0.35) 6.1 9 7 7 60 0 3/4 200
Rock Island Creek Alluvial Fan (RM 0.0 to 0.08) 6.1 1 10 12 90 0 4/3 74 Pool-Riffle (RM 0.08 to 0.52) 10.4 15 21 10 63 0 5/6 154
1Average width values represent the active channel width.2All percent values have been rounded to the nearest whole percent.3 Dominant and subdominant substrate size classes: 1=silt, 2=sand, 3=small gravel, 4=medium gravel, 5=large gravel, 6=cobble, 7=boulder,
8=bedrock4Spawing areas capable of supporting large anadromous sized adult spawners.

Appendix F
Draft Instream Flow Study Recommendations, WRIAs 44 and 50

DraftInstream Flow Study
RecommendationsWRIAs 44 and 50
Prepared for:
Foster Creek Conservation DistrictP.O. Box 428
Waterville, Washington 98858
Prepared by:
R2 Resource Consultants, Inc.15250 N.E. 95th Street
Redmond, Washington 98052
March 26, 2002

Foster Creek Conservation District Instream Flow Study Recommendations
R2 Resource Consultants ii March 26, 20021303.08/InstreamFlowMethod.32602 Draft
This report is part of a habitat assessment conducted under §2514 watershedplanning findings for potentially anadromous fish-bearing streams in WatershedResource Inventory Areas (WRIAs) 44 and 50 in Douglas County.
The report was prepared by R2 Resource Consultants under subcontract toPacific Groundwater Group. It follows the scope for a screening level biologicalassessment as approved by the WRIAs 44 and 50 Planning Unit in May 2001.
Principal Investigator
Ronald F. Campbell
Fisheries Biologist
Michael R. Gagner

Foster Creek Conservation District Instream Flow Study Recommendations
R2 Resource Consultants iii March 26, 20021303.08/InstreamFlowMethod.32602 Draft
CONTENTS
1. INTRODUCTION .....................................................................................................................1
2. STREAM REACH CHARACTERIZATION ...........................................................................3
2.1 FOSTER CREEK.....................................................................................................................3
2.1.1 Channel Types and Habitat Conditions...................................................................3
2.2 ROCK ISLAND CREEK...........................................................................................................9
2.2.1 Channel Types and Habitat Conditions...................................................................9
2.2.2 Hydrologic and Channel Cross Section Data for Rock Island Creek....................10
2.3 MOSES COULEE .................................................................................................................12
2.3.1 Channel Types and Habitat Conditions.................................................................12
2.3.2 Hydrologic Data for Moses Coulee .......................................................................13
3. LIFE-HISTORY TIMING OF RELEVANT ANADROMOUS SALMONID SPECIES ......15
4. FLOW STUDY METHODOLOGIES.....................................................................................17
4.1 TOE-WIDTH METHOD ........................................................................................................21
4.2 TENNANT/MONTANA METHOD ..........................................................................................21
4.3 WETTED PERIMETER..........................................................................................................23
4.4 IFIM/PHABSIM ...............................................................................................................24
4.5 FLOW METHOD SUMMARY ................................................................................................24
5. CONCEPTUAL APPROACH TO INSTREAM FLOW STUDIES .......................................26
6. PHASE 2 STUDY RECOMMENDATIONS..........................................................................28
7. LITERATURE CITED ............................................................................................................31

Foster Creek Conservation District Instream Flow Study Recommendations
R2 Resource Consultants iv March 26, 20021303.08/InstreamFlowMethod.32602 Draft
FIGURES
Figure 1a. Stream reaches surveyed during the May 2001 assessment of fish habitat inWRIA 50. ............................................................................................................. 4
Figure 1b. Stream reaches surveyed during the May 2001 assessment of fish habitat inWRIA 44. ............................................................................................................. 5
Figure 2. Foster Creek channel cross-section May 23, 2001. Elevations are relativeto a temporary bench mark that has been assigned an arbitrary elevation of100.0 feet. ............................................................................................................. 8
Figure 3. Rock Island Creek channel cross-section May 23, 2001. Elevations arerelative to a temporary bench mark that has been assigned an arbitraryelevation of 100.0 feet. ....................................................................................... 11
TABLES
Table 1. Instream Flow Study Criteria Recommendation ................................................... 2
Table 2. Results of baseline habitat mapping completed for streams surveyed as partof WRIA 44/50 Watershed Planning, Douglas County, Washington, May2001. ..................................................................................................................... 6
Table 3. Monthly flow statistics (cfs) from Foster Creek gage (RM 1.03) installed inMay 2001 by Montgomery Watson. The June through October 2001 flowvalues represent the period of record available for this gage site......................... 8
Table 4. Monthly flow statistics (cfs) from Rock Island Creek gage at RM 0.45 forthe June to October 2001 period of record. ........................................................ 10
Table 5. Moses Coulee instantaneous stream flow measurements conductedsporadically in water years 19861, 19872, and 1988........................................... 14
Table 6. Life-history stage periodicity chart for anadromous species of interest inWRIAs 44 and 50. .............................................................................................. 16
Table 7. Comparison of instream flow methodologies with possible relevance todetermining fish habitat needs during the low flow season in WRIA 44and 50. ................................................................................................................ 19
Table 8. Instream flow regimes for fish habitat (Tennant 1975) ....................................... 22

Foster Creek Conservation District Instream Flow Study Recommendations
R2 Resource Consultants 1 March 26, 20021303.08/InstreamFlowMethod.32602 Draft
1. INTRODUCTION
This preliminary recommendation to the WRIAs 44 and 50 Planning Unit is intended to assistwith a future decision concerning the establishment of instream flows for streams in thewatersheds. Under the assumption the Planning Unit wishes to proceed with this task, The H.B.2514 Consulting Team consisting of Pacific Groundwater Group, Montgomery Water Resourcesand R2 Resource Consultants, Inc. offer the following guidance for an instream flow approachbased upon the findings of the Phase 1 studies to date. This guidance is specific to the streamchannel and hydrological characteristics found in the watersheds.
The following two study criteria have been established for recommending streams reaches forthe establishment of instream flow regimes in WRIAs 44 and 50:
1) Anadromous Fish Species: H.B. 2514 funding grants include priorities for the protectionand enhancement of fish habitat in watersheds supporting aquatic species listed orproposed as threatened or endangered under the Endangered Species Act (ESA) [Ch90.82.040(3)(c) RCW]. The Planning Unit has set policy under this study effort toaddress the specific needs of anadromous fish species that are the current attention ofESA efforts in WRIAs 44 and 50.
2) Perennial-flowing Streams: Ecology, in establishing their Instream Resource ProtectionPlan (IRPP) WAC (RCW 90.54) indicate that ‘perennial rivers and streams of the stateshall be retained with base flows necessary to provide for the preservation of fish andwildlife.’ The word perennial means: A) present at all seasons of the year; B)throughout the year, C) persisting for several years, with synonyms: persistent, enduring;continuing without interruption, constant. For use in this report, we define the termperennial simply to mean: ‘flowing year-round.’
For the flow setting objective in WRIAs 44 and 50, we have interpreted the criteria to mean year-round flow in a reach of stream that is connected to the Columbia River, at least some timeduring the year, to allow for the potential passage of juvenile and adult anadromous fish species.This interpretation is used herein to prioritize the stream reaches for further instream flow studyassessment.
During the summer of 2001, the physical, hydrological and chemical conditions in six (6)streams with the potential for anadromous fish use were assessed with respect to habitat

Foster Creek Conservation District Instream Flow Study Recommendations
R2 Resource Consultants 2 March 26, 20021303.08/InstreamFlowMethod.32602 Draft
condition under Phase 1 studies. The presence of anadromous salmonid fish use was confirmedin two streams during 2001, Foster Creek and Rock Island Creek. Two other streams hadhistoric observations of anadromous salmonid use, Sand Canyon and Moses Coulee. Theremaining two streams, Pine Canyon Creek and Blue Grade Draw, have the potential foranadromous fish access and at least temporary use, although anadromy has not previously beendocumented. An assessment of the waterbodies in relation to the two instream flow settingcriteria is shown in Table 1.
Table 1. Instream Flow Study Criteria Recommendation
StreamAnadromous Fish
UsePerennial Flowing
ReachFlow Recommendation
PriorityFoster Creek Yes Yes 1Pine Canyon Creek Yes No 3Blue Grade Draw Yes No NoSand Canyon Creek Yes No NoRock Island Creek Yes Yes 1Moses Coulee Yes No 2Douglas Creek Unknown No 3
Based on the above criteria, we recommend setting instream flow regimes as the top priority forthe anadromous stream reaches in Foster Creek (RM 0.00 – RM 1.03) and in Rock Island Creek(RM 0.00 – RM 0.55). Although perennial flowing stream reaches in Moses Coulee have notbeen apparent for a number of years, historic evidence indicates year-round flow occurredregularly during the 1970s and 1980s and that the stream supported anadromous fish species atleast up to RM 1.8 (WDF 1987). As such, we recommend further studies to assess the properapproach for establishing instream flow needs in Moses Coulee as a second priority. All otherstreams received either a third level priority recommendation (related to resident fish production)or no flow recommendation (related to streams supported solely by summer irrigation returnflows).
Foster Creek Conservation District Instream Flow Study Recommendations
R2 Resource Consultants 3 March 26, 20021303.08/InstreamFlowMethod.32602 Draft
2. STREAM REACH CHARACTERIZATION
Habitat data are summarized below for the highest priority streams based on the study criteria.For a description of habitat conditions observed during the summer of 2001 in all of the streamsrefer to Section 10 (Habitat) of the main document provided herein (Pacific Groundwater Groupet al. 2002). Figure 1a and Figure 1b presents fish habitat sampling reaches surveyed withinWRIAs 44 and 50 in May 2001.
2.1 FOSTER CREEK
2.1.1 Channel Types and Habitat Conditions
Foster Creek is accessible year-round to anadromous salmon and steelhead trout migratingthrough the Columbia River up to Chief Joseph Hydroelectric Facility, the US Army Corps ofEngineer’s mainstem dam at RM 545.1. This facility is the lowest on the Columbia Riverwithout provision for anadromous fish passage. Since Foster Creek enters the Columbia Riverfrom the south shore a half-mile downstream of Chief Joseph Dam (RM 544.6), it is currently themost upstream tributary in the Columbia River Basin with anadromous fish production.
Summer-run steelhead trout were observed spawning in the creek between RM 0.28 and 0.98during late May 2001. Young-of-the-year juvenile trout were also found rearing in theanadromous fish section during the summer low flow season. These fish have access upstreamto a steep cascading stream section complete with numerous bedrock falls just short of anapproximate 35 ft. high dam built in a tight bedrock constriction near RM 1.03. The BridgeportIrrigation District reportedly constructed the dam during the early part of the 20th Century as anirrigation water supply. The dam and subsequent irrigation were abandoned when bedloadmaterials consisting of coarse and fine sediments filled the reservoir, eliminating the facilitiescapacity to store and deliver water. It is reported that the dam was built in the vicinity of abedrock falls that historically limited anadromous fish passage (cite: Planning Unit MeetingsMay 22nd and October 29th 2001, WS Conservation Commission LFA, 2000).

Foster Creek Conservation District Instream Flow Study Recommendations
R2 Resource Consultants 4 March 26, 20021303.08/InstreamFlowMethod.32602 Draft
Figure 1a. Stream reaches surveyed during the May 2001 assessment of fish habitat in WRIA 50.

Foster Creek Conservation District Instream Flow Study Recommendations
R2 Resource Consultants 5 March 26, 20021303.08/InstreamFlowMethod.32602 Draft
Figure 1b. Stream reaches surveyed during the May 2001 assessment of fish habitat in WRIA 44.

Foster Creek Conservation District Instream Flow Study Recommendations
R2 Resource Consultants 6 March 26, 20021303.08/InstreamFlowMethod.32602 Draft
The reach of Foster Creek, downstream of the concrete dam at RM 1.03, consists primarily offour channel morphologies:
1) Alluvial Fan (RM 0.00 to 0.05)2) Step-Pool (RM 0.02 to 0.36)3) Pool-Riffle (RM 0.36 to 0.98)4) Cascade-falls (RM 0.98 to 1.03)
The alluvial fan consists of coarse and fine sediments deposited at the point where the channelgradient decreases as the stream enters the Columbia River. Stream gradients are generally lessthan one percent and riffle habitat accounts for about 42 percent of the reach length (Table 2). Asmall amount (60 ft.2; 5.6 m2) of spawning gravel was mapped in this section. The usefulness ofthis reach as a spawning area is somewhat reduced by the backwater elevations of Wells Pooland tailrace of Chief Joseph Dam which inundates this area during high pool elevations.
Table 2. Results of baseline habitat mapping completed for streams surveyed as part of WRIA44/50 Watershed Planning, Douglas County, Washington, May 2001.
Habitat Composition by Length (feet) and Percent of Total %
Stream Reach CascadePool/
Step Pool Riffle Run/Glide FallsTotal
Distance
Foster Creek
(RM 0.0 – RM 1.03)(18%) (15%) (42%) (20%) (6%) 5457�
Pine Canyon Creek
(RM 1.23 – RM 1.62)(0%) (9%) (88%) (3%) (0%) 2051�
Blue Grade Canyon
(RM 0.0 – RM 0.27)(37%) (12%) (30%) (21%) (0%) 1432�
Sand Canyon
(RM 0.0 – RM 0.37)(15%) (7%) (74%) (4%) (0%)
1939�
Rock Island Creek
(RM 0.0 – RM 0.55)(0%) (23%) (76%) (1%) (0%) 2901�
Moses Coulee No habitat data collected – stream channel was dry during site visit

Foster Creek Conservation District Instream Flow Study Recommendations
R2 Resource Consultants 7 March 26, 20021303.08/InstreamFlowMethod.32602 Draft
The step-pool channel reach (RM 0.02-0.36) has a moderately steep channel gradient (2.5 to 5percent) with a series of pools separated by short cascading sections. Small amounts ofspawning gravel were observed in riffles associated with pool tailouts. A total of 91ft.2 (8.5 m2)of spawning habitat was observed in this section during the May, 2001 survey. Although apossible steelhead redd was seen at RM 0.28, steep-pool channels are generally used by juvenilesteelhead for rearing. The lowermost portion of this stream section has been channelized andstraightened, likely in relation to construction of Chief Joseph Dam and the road bridges crossingthe lower channel.
The pool-riffle reach (RM 0.36-0.98) in Foster Creek is low gradient (<0.5 to 1.5 percent). Atotal of 431 ft.2 (40 m2) of spawning gravel and the majority of steelhead spawning activity wasobserved in this reach. However, high levels of fines were noted in the streambed. Theembeddedness of dominant substrate particles with fine sediments was rated at 50 percent orhigher in some (approximately 20 percent) of the sampled habitat units. These levels ofsedimentation have been associated with biologically meaningful reductions in survival toemergence of incubating salmonid embryos and alvins, the amount and diversity of invertebrateprey species for fry, over-wintering habitat, and refuge space from predators (Chapman andMcLead 1987).
The cascade-falls reach (RM 0.98-1.03) in Foster Creek occurs in a bedrock constriction thatdrops roughly 50 ft in elevation over a distance of 300 feet (17 % gradient). It is doubtful thisreach contains significant anadromous spawning or rearing habitat.
Reaches upstream of the bedrock constriction and the diversion dam, including the West, Middleand East Forks of Foster Creek, appear to be associated with resident salmonid production areasonly.
Stream flows, measured at the Foster Creek gage site (Section 7) during the summer of 2001,were continuous but low, ranging between approximately 1 and 4 cfs (Table 3). Base flowsduring the months of August and September were on the order of 1 cfs. It is assumed that aseries of springs located along the Middle and West forks and along the west side of themainstem of Foster Creek support continuous stream flow. Regionally, the 2001 water year wasconsidered a relatively dry year. Therefor, flow values presented in Table 3 should be viewed asrepresenting the lower range of water availability during this time period.

Foster Creek Conservation District Instream Flow Study Recommendations
R2 Resource Consultants 8 March 26, 20021303.08/InstreamFlowMethod.32602 Draft
Table 3. Monthly flow statistics (cfs) from Foster Creek gage (RM 1.03) installed in May 2001 byMontgomery Watson. The June through October 2001 flow values represent the period ofrecord available for this gage site.
June July Aug Sept Oct SeasonalMean 2.61 1.66 1.13 1.1 1.56 1.61Min 2.32 1.13 1.07 1.05 1.27 1.05Max 3.26 2.61 1.2 1.19 2.27 3.26
A representative channel cross-section from within the pool/riffle reach of Foster Creek is shownin Figure 2.
Figure 2. Foster Creek channel cross-section May 23, 2001. Elevations arerelative to a temporary bench mark that has been assigned an arbitraryelevation of 100.0 feet.
Foster Creek (5/23/01)
95.0
95.5
96.0
96.5
97.0
97.5
98.0
98.5
99.0
99.5
100.0
100.5
101.0
-10 0 10 20 30 40 50 60 70
Station (ft)
Elev
atio
n (ft
)

Foster Creek Conservation District Instream Flow Study Recommendations
R2 Resource Consultants 9 March 26, 20021303.08/InstreamFlowMethod.32602 Draft
The water surface elevation (WSE) during the spring 2001 survey conducted on May 23rd, was96.7 ft. (relative to a subjective benchmark of 100 ft). The flow level included a measureddischarge of (Q) = 5.5 cfs representing a wetted channel width of 14.4 ft, a wetted perimeter of14.5 ft; and a flow area (A) = 3.25 ft2. The toe-of-bank width at this cross section was estimatedto be 7.8 ft with a bankfull width (BFW) estimated to be 22.9 ft.
2.2 ROCK ISLAND CREEK
2.2.1 Channel Types and Habitat Conditions
Rock Island Creek enters the Columbia River on its eastern shore approximately one mileupstream of Rock Island Dam (RM 453.5). Anadromous fish species are assumed to have year-round access from the confluence upstream to a spring located along the north side of the RockIsland Creek at RM 0.52. It is reported that the spring generally supports continuous year-roundflow (Personal Communication, Keane 2001).
During habitat surveys conducted in late-May, 2001 young-of-the-year chinook or cohosalmonid fry (based on size, 40 – 60 mm, and parr markings) were observed rearing in the creeknear its confluence with the Columbia River at RM 0.04. However, whether the observed fishwere the offspring of parents spawning in Rock Island Creek or immigrated from other areasupstream in the Columbia River Basin could not be determined. WDFW regional biologist BobSteele observed young-of-the-year anadromous salmonids and spawned-out adult coho salmoncarcasses in the creek during the late-1970s (Bartu and Andonaegui 2001).
The reach downstream of the springs at RM 0.52, can be delineated into two channelmorphologies consisting of (Figure 1b):
1) Alluvial Fan (RM 0.00 to 0.08), and2) Pool-Riffle (RM 0.08 to 0.52).
The alluvial fan reach consists of coarse and fine sediments deposition at the point where thechannel gradient decreases near the railroad and highway bridges and as the stream enters theColumbia River. Stream gradients are generally less than 1.0 percent and riffle habitat accountsfor about 90 percent of the reach length. A small amount (74 ft.2; 6.9 m2) of spawning gravelwas recorded in this section.

Foster Creek Conservation District Instream Flow Study Recommendations
R2 Resource Consultants 10 March 26, 20021303.08/InstreamFlowMethod.32602 Draft
The pool-riffle reach is low gradient (0.5 to 1.5 percent). A total of 154 ft.2 (14.3 m2) ofspawning gravel is distributed intermittently throughout the reach. High levels of fine sedimentaccumulations were not observed in the channel, reflecting the spring-fed character of thestream. Spawning and rearing habitat and food production should not be compromised as aresult of fine sediment levels noted in Rock Island Creek.
2.2.2 Hydrologic and Channel Cross Section Data for Rock Island Creek
Summer stream flows during 2001 in Rock Island Creek ranged roughly between 0.2 and 2.1 cfs(Table 4). The highest observed discharge of 2.1 cfs was a spot measurement taken duringhabitat surveys in May 2001. This flow is not reflected in the continuous gage data presented inTable 4 below since the measurement was made prior to installation of the Rock Island flowgage.
Stream flows in Rock Island Creek are supported by a spring near RM 0.52. The spring appearsto originate from shallow bedrock. In the late 1950s, the Keane family excavated seven to tenfeet deep to expose the spring, which still runs free-flowing today. Without the spring, waterwould not be expected to flow in the channel annually after April or May. The combined surfacewater flow from the spring contributes approximately one half of the flow in the mainstem of thecreek depending upon the time of year. Since the channel upstream of the spring is essentiallydry beginning early spring each year, additional groundwater seepage makes up the balance ofstream flow at RM 0.17. The spring has a base flow of approximately 1 cfs from May throughAugust, but the surface contribution declines in September and October.
A channel cross-section in the pool/riffle reach of Rock Island Creek is shown in Figure 3.The water surface elevation (WSE) during the spring 2001 survey conducted on May 25th, was96.1 ft. (relative to a subjective benchmark of 100 ft). The flow level included a measureddischarge of (Q) = 2.1 cfs representing a wetted channel width of 13.8 ft, a wetted perimeter of13.8 ft; a flow area (A) = 3.92 ft2. The toe-of-bank width at this cross section was estimated tobe 11.8 ft with a bankfull width (BFW) estimated to be 28.5 ft.
Table 4. Monthly flow statistics (cfs) from Rock Island Creek gage at RM 0.45 for the June toOctober 2001 period of record.
June July Aug Sept Oct SeasonalMean 1.24 0.93 0.54 0.4 0.26 0.67Min 1.21 0.7 0.44 0.29 0.21 0.21Max 1.31 1.17 0.69 0.47 0.36 1.31

Foster Creek Conservation District Instream Flow Study Recommendations
R2 Resource Consultants 11 March 26, 20021303.08/InstreamFlowMethod.32602 Draft
A cross-sectional profile in the pool-riffle reach of Rock Island Creek is shown in Figure 3.
Figure 3. Rock Island Creek channel cross-section May 23, 2001. Elevations arerelative to a temporary bench mark that has been assigned an arbitraryelevation of 100.0 feet.
Rock Island Creek (5/25/01)
95.0
95.5
96.0
96.5
97.0
97.5
98.0
98.5
99.0
99.5
100.0
100.5
101.0
0 5 10 15 20 25 30Station(ft)
Elev
atio
n (ft
)

Foster Creek Conservation District Instream Flow Study Recommendations
R2 Resource Consultants 12 March 26, 20021303.08/InstreamFlowMethod.32602 Draft
2.3 MOSES COULEE
2.3.1 Channel Types and Habitat Conditions
Habitat and flow data descriptions for Moses Coulee are not available since the channel was dryduring the 2001 site visit. Instead we relied on historic information for developing the Phase 2study recommendations.
Moses Coulee was formed by the Columbia River in relatively recent Pleistocene time (10,000years ago) when the river, diverted by a large ice lobe near the present day Grand Coulee Dam,cut through the thick basalt formations of the Columbia River Plateau (Bartu and Andonaegui2001). The basalt layers vary in thickness from 6,000 to 10,000 feet and date primarily from theMiocene epoch (30 million years ago). Erosion and subsequent formation of Moses Coulee andother river meltwater channels in the region (including the Grand Coulee) were augmented byenormous floods from the glacial Lake Missoula.
The resulting valley bottom today is flat, filling the entire width between the canyon walls and isfilled with several hundred feet of glacial and river deposits. The alluvial materials along thevalley bottom are large and porous. Although the upstream drainage basin is large, the mainstemCoulee is dry for a majority of the year.
During the 2001 survey, the channel appeared to have been dry for several seasons which wouldhave restricted access of anadromous fish to Moses Coulee or any upstream tributaries. Thereare no known barriers to upstream fish migration should sufficient water exist in the future.
Washington Department of Fisheries (WDF) and Washington Department of Game (WDG)survey data from the 1970s and 1980s documented anadromous fish use in the lowermost 1.8river miles in Moses Coule, including two size classes of juvenile chinook salmon (young-of-the-year fry and yearling pre-smolts) and yearling pre-smolt steelhead trout (WDF 1987). Althoughno redds or suitable spawning habitat were observed during the department surveys, it wasassumed that anadromous fish species were migrating into Moses Coulee from the ColumbiaRiver system for seasonal rearing purposes to take advantage of winter habitat provided byboulders, small pools, woody debris and vegetation growing on the banks and in the creek bed.During winter surveys the fish were collected in deep, low velocity pools with boulder or woodydebris cover. WDF did not capture anadromous fish during the low flow summer period inMoses Coulee. They assumed the lack of fish presence was due to low stream flows and high

Foster Creek Conservation District Instream Flow Study Recommendations
R2 Resource Consultants 13 March 26, 20021303.08/InstreamFlowMethod.32602 Draft
water temperatures, 20 – 22C. WDF concluded that juvenile salmonid fish rearing is limited tothe fall, winter and early spring periods and instream flows should be established to protectseasonal rearing (WDF 1987).
Habitat conditions appear to have changed considerably since the 1980s because our 2001 surveyindicated an abundance of spawning gravel present in the same channel section and an absenceof large woody debris and shoreline vegetation. It is possible that a flood of considerablemagnitude rearranged the channel conditions near the mouth of Moses Coulee since the WDFsurveys. Floods of 1989, 1991 and 1993 were of sufficient flow rate. Given the porous alluviumand prevalence of ground water or hyporheic flows, it is also possible that continued surface andgroundwater allocations since the mid-1980s may have similarly reduced surface water flows inMoses Coulee.
2.3.2 Hydrologic Data for Moses Coulee
A few spot measurements of stream flow were collected during the WDF studies in 1986 (Table5). At that time, the summer base flow appeared to be around 1.5 cfs during July and August.The Washington Department of Ecology monitored flows the following year in Moses Couleeand in an upstream section of Douglas Creek. The flow in Moses Coulee at SR 28 HighwayBridge was between 2.4 to 4.5 cfs from May through October, with a July base flow of around2.4 cfs (Figure 1b). Caldwell (1988) estimated approximately 10 cfs of Douglas Creek water ona year-round basis was lost to subsurface flow by the time it reached Palisades, Washington. Hecalculated the loss from irrigation was approximately 4 to 6 cfs, although only 2.4 cfs ofconsumptive water rights existed at the time (Caldwell 1988). WDF (1987) appealed Ecologyapprovals of water right application in the mid-1980s due to insufficient stream flows to supportsalmonid fish species.
From 12 channel cross sections in Moses Coulee between RM 0.1 and RM 0.5, WDF calculatedan average toe-of-bank width of 17 ft. A rearing flow of 8 cfs was determined to be appropriateusing the US Geological Survey/WDF "Toe-Width" methodology (Swift 1974, 1976; WDF1987); for a discussion of the Toe-Width methodology and it’s appropriateness for use in settingflow regimes in WRIAs 44 and 50, see Section 4 below. Based on this approach, WDFconcluded that there was insufficient rearing flows in the stream between mid-April through theend of October, and that any further water appropriation would deteriorate salmonid fish rearinghabitat in lower Moses Coulee (WDF 1987). Despite this contention, additional water rights forirrigation purposes have been allocated since 1988.
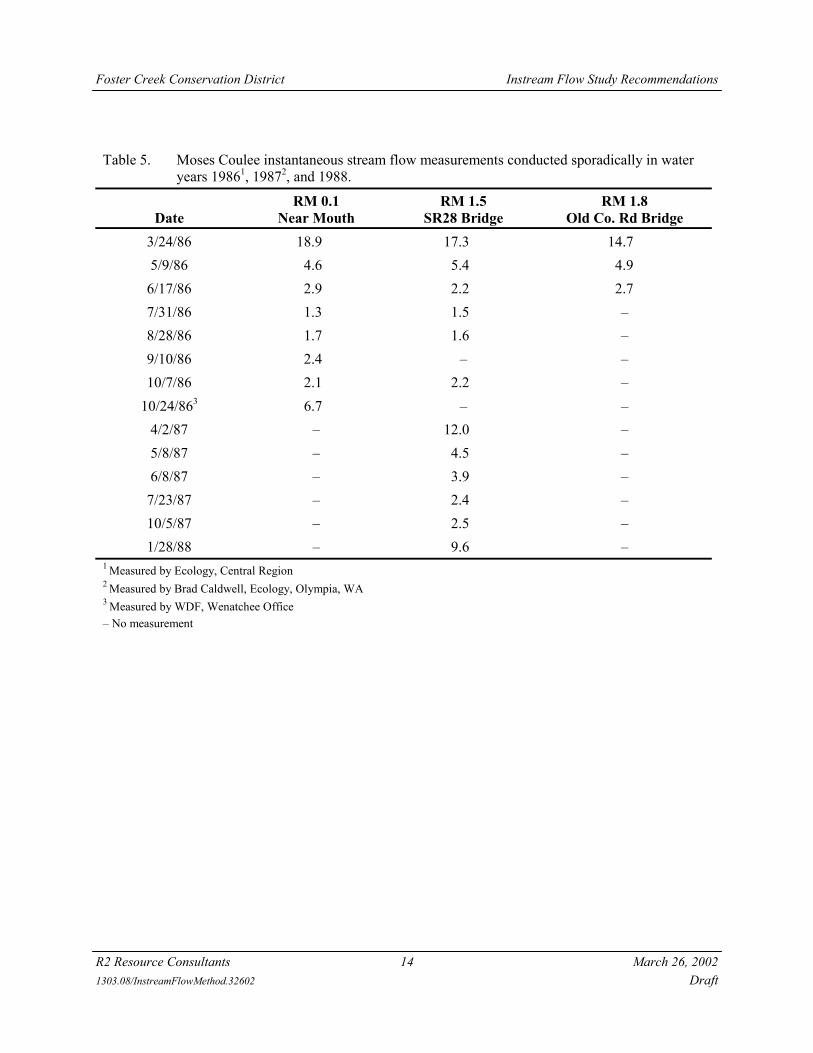
Foster Creek Conservation District Instream Flow Study Recommendations
R2 Resource Consultants 14 March 26, 20021303.08/InstreamFlowMethod.32602 Draft
Table 5. Moses Coulee instantaneous stream flow measurements conducted sporadically in wateryears 19861, 19872, and 1988.
DateRM 0.1
Near MouthRM 1.5
SR28 BridgeRM 1.8
Old Co. Rd Bridge3/24/86 18.9 17.3 14.75/9/86 4.6 5.4 4.9
6/17/86 2.9 2.2 2.77/31/86 1.3 1.5 –8/28/86 1.7 1.6 –9/10/86 2.4 – –10/7/86 2.1 2.2 –
10/24/863 6.7 – –4/2/87 – 12.0 –5/8/87 – 4.5 –6/8/87 – 3.9 –
7/23/87 – 2.4 –10/5/87 – 2.5 –1/28/88 – 9.6 –
1 Measured by Ecology, Central Region2 Measured by Brad Caldwell, Ecology, Olympia, WA3 Measured by WDF, Wenatchee Office– No measurement
Foster Creek Conservation District Instream Flow Study Recommendations
R2 Resource Consultants 15 March 26, 20021303.08/InstreamFlowMethod.32602 Draft
3. LIFE-HISTORY TIMING OF RELEVANT ANADROMOUS SALMONID SPECIES
The goal of establishing an instream flow regime for any streams in WRIAs 44 and 50 includesaddressing the biological needs of the various life-history stages of fish species of interest. Forthe purposes of Phase 2 studies, the following anadromous species have been determined to be ofprimary concern: spring chinook salmon (Oncorhynchus tshawytscha); summer/fall chinooksalmon; coho salmon (O. kisutch); and summer steelhead trout (O. mykiss). Other anadromoussalmonid species use in WRIAs 44 and 50 streams has not been documented (Bartu andAndonaegui 2001).
Flow needs should reflect the seasonal presence of each life history stage in the priority streams.Anadromous life history stages of interest in instream flow studies generally include:
1) Adult Migration/Access/Holding
2) Adult Spawning
3) Incubation
4) Summer Rearing
5) Winter Rearing
Because any flow recommendations produced as part of the instream flow study will bedeveloped on a monthly basis, the need exists to determine the seasonal presence and absence(or, periodicity) of each species and life stage, so that flow recommendations for a given monthreflect appropriate life stage requirements. For this, periodicities were broadly determined foreach of the species and life stages of concern (Table 6).

Foster Creek Conservation District Instream Flow Study Recommendations
R2 Resource Consultants 16 March 26, 20021303.08/InstreamFlowMethod.32602 Draft
Table 6. Life-history stage periodicity chart for anadromous species of interest in WRIAs 44 and 50.
Species Jan Feb Mar Apr May Jun Jul Aug Sep Oct Nov Dec
Summer Steelhead TroutSpawning X X XIncubation X XSu. Rearing X X X XWi. Rearing X X X X X X
Spring Chinook SalmonSu. Rearing X X X X X XWi. Rearing X X X X X X
Summer/Fall Chinook SalmonSu. Rearing X X X X X X
Coho SalmonSu. Rearing X X X X X XWi. Rearing X X X X X X
Using this information, a seasonal flow regime can be developed that addresses the critical orpriority life-history stages for any given month. An example of how this might be used for eachof the priority streams might look something like:
Foster CreekApril to mid-Jun = SpawningMid-June to July = IncubationAugust to mid-October = Summer RearingMid-October to March = Winter Rearing
Rock Island CreekApril to mid-October = Summer RearingMid-October to March = Winter Rearing
Moses CouleeApril to mid-October = Summer RearingMid-October to March = Winter Rearing
These dates for a seasonal flow schedule may be modified pending additional information relatedto species use, stream-specific life history information and seasonal water temperatures. Plans tofill these data gaps within the WRIAs are proposed under H.B. 2496 funding grants.

Foster Creek Conservation District Instream Flow Study Recommendations
R2 Resource Consultants 17 March 26, 20021303.08/InstreamFlowMethod.32602 Draft
4. FLOW STUDY METHODOLOGIES
There are a large number of methods available for assessing instream flow needs. Which methodis used depends on the issues addressed, underlying methodological assumptions, and theintensity and cost of the effort required for the application. More generally acceptedmethodologies for determining instream flow requirements can grouped into three generalcategories: 1) hydrology-based methods; 2) hydraulic rating methods; and 3) habitat ratingmethods. These techniques progress from simple (using historic flows) to more complex (habitatrating), with time, data requirements, cost, and degree of difficulty in application also increasingwith complexity (Karim et al. 1995).
Most techniques available today primarily address flows to protect fish habitat requirements.However, efforts have also been conducted to determine flushing flow requirements for removalof fines from streambeds, for channel and riparian maintenance flows and for recreationalenjoyment.
As stated earlier, each stream system is unique, with it’s own hydrology, morphology, fish use,and water resource needs. The most unique nature of streams within WRIAs 44 and 50 arerelated to its hydrology and channel-forming flows. The following excerpt is from theWashington Conservation Commission Habitat Limiting Factor Assessment for the Foster andMoses Coulee Watersheds (Bartu and Andonaegui 2001):
“…Most steams are intermittent, feed by spring runoff or a spring systemand shaped by high flow events. Some years there are perennial flows, butthis hydraulic continuity is unlikely year around. Storms of extremeintensity and short duration occur in the watersheds causing high floodevents. Flood events are causes by two distinct climatological patterns:summer thunderstorms or a warm rain-on-snow storm event.Thunderstorms occur primarily during the summer months and normallyhave high rainfall intensities over relatively small areas (KCM 1995;Johnson 1974). Rain-on-snow events occur in the late winter or earlyspring, usually with smaller amounts of precipitation; however, with theground frozen and infiltration prevented, the melting snow combined withrainfall can create a large runoff event. Major floods have occurredabout every 10 years, although smaller storms causing localized damage

Foster Creek Conservation District Instream Flow Study Recommendations
R2 Resource Consultants 18 March 26, 20021303.08/InstreamFlowMethod.32602 Draft
are more frequent. The largest floods in recent history occurred in 1972and 1989. Several smaller events occurred in 1957, 1973, 1975, 1976,1991, and 1993 (KCM 1995).
The existing stream [channels] have been shaped and continue to bereshaped by high flood events…”
Stream discharge the balance of the year is a fraction of the storm flows, if they occur at all.Flood disturbances in the channels also have a tendency to deposit substantial coarse sedimentmaking inter-gravel or subsurface stream flows more likely until streambed armoring layersbecome re-established. This dynamic nature of stream bed characteristics as a function of floodcycles has a large influence on the volume of surface water expressed throughout the year.Surface water discharges and hence salmonid fish habitat are sporadic and inconsistent overtime. Such a unique hydrologic history makes the establishment of instream flow regimes achallenge for the Planning Unit.
With this in mind, we have identified a collection or subset of methodologies that could be usedindividually or in combination depending on basin needs and resource value. A generalcomparison of each of the proposed methods is provided in Table 7. A more detailed summaryof each method is provided below:

Foster Creek Conservation District Instream Flow Study Recommendations
R2 Resource Consultants 19 March 26, 20021303.08/InstreamFlowMethod.32602 Draft
Table 7. Comparison of instream flow methodologies with possible relevance to determining fish habitat needs during the low flow season inWRIA 44 and 50.
MethodPurpose andTypical use Features Limitations/Constraints Time
Toe-Width
Generally used on smallstreams.
Quick method for estimatingspawning and rearing flows.
Based on empirical habitat-flowrelationship.
Quick (several streammeasurements can be taken inone day.
No specialized training orequipment required.
Generally provides flows foroptimal resource protection.
Long-term flow records are notrequired as part of the analysis.
Yields a single number forspawning and rearing flow(which makes it harder tobalance between species and lifestages because it does not showthe relationship between flowand habitat).
Relies on a single channelmorphology variable fordetermination of instream flows.
Can take as little as afew weeks from datacollection through write-up.
Montana/Tennant
Recommends flow regimens fordifferent time periods basedupon percent of the averageannual flow.
Assumes that a set percentage(10%, 30%, and 60%) ofaverage annual flow isappropriate for establishinginstream flows with percentagevarying according to prioritylife stage needs.
Reflects professionaljudgement and experience withlocal habitat and flowconditions.
A quick, easy method fordetermining flows to protectaquatic resources.
Requires only one hydrologicstatistic for assessment.
Flushing flow recommendationsare also possible.
Best suited for large riversystems with limited flowvariation.
Recommendations aresubjective; generally used forplanning level assessment.
Relies on a single hydrologicvariable for determination ofinstream flows – no biologicaldata are used.
Should not be applied to spring-feed creeks with uniform yearround flow.
Used infrequently inWashington.
If hydrologic data areavailable, the analysiscan be completed in lessthan a day.

Foster Creek Conservation District Instream Flow Study Recommendations
R2 Resource Consultants 20 March 26, 20021303.08/InstreamFlowMethod.32602 Draft
Table 7. Comparison of instream flow methodologies with possible relevance to determining fish habitat needs during the low flow season inWRIA 44 and 50.
MethodPurpose andTypical use Features Limitations/Constraints Time
Wetted Perimeter
Uses designated critical areas(e.g., shallowest riffle) andcross channel transects todetermine lowest flow thatmeet habitat criteria.
Relies on interdisciplinary fieldteam to identify critical areasand flow needs.
Relatively quick to collect fielddata and complete hydraulicmodeling.
Requires limited number oftransects and flowmeasurements.
Focuses on critical habitat areasincluding spawning and rearing.
Accuracy of hydraulic modelingis limited by number of flowdata sets.
Focuses primarily ondetermining minimum instreamflow levels.
Relies on somewhat arbitrarycriteria for determiningrecommended flows.
Three to six monthtimeframe depending onflow conditions.
Physical HabitatSimulation
Describes incremental flow vshabitat relationship.
Provides data at various flowlevels that indicate the range offlows resulting in the “besthabitat” (i.e., flow, velocity,depth, substrate combination)for a specific species and lifestage.
Provides a quantifiable measureof an index of habitat loss orgain under different flowregimes.
Generally recognized as “state ofthe art.”
Most widely accepted byresource agencies.
Allows for comparison of flowvs habitat relationship formultiple species and life stages.
Useful for evaluating resourcetradeoffs.
Can evaluate habitat bottlenecks.
Relatively data intensive.
Can require one or two completefield seasons to complete allnecessary measurements.
Requires specialized training andcomputer software.
Timeline is crucial – sampling isextremely flow dependent.
Correlation of habitat indices toactive fish production remainsunverified.
Can take from sixmonths to two years tomake flowmeasurements at variousstages of stream flow.

Foster Creek Conservation District Instream Flow Study Recommendations
R2 Resource Consultants 21 March 26, 20021303.08/InstreamFlowMethod.32602 Draft
4.1 TOE-WIDTH METHOD
The Toe-Width Method was developed by the Washington Departments of Fish and of Gameand the U.S. Geological Service (USGS) in the 1970s at the request of the state legislature inresponse to the need to determine minimum instream flows for fish (Swift 1974, 1976). In ajoint effort, the state and USGS collected water depth and velocity data from some 336 transectsover a nine-year period at 8 to 10 different flow levels. This information was combined withcriteria for depths and velocities needed for spawning and rearing of salmon and steelhead, tocalculate the square feet of habitat over a range of measured flows and subsequently create a fishhabitat versus streamflow relationship. A number of hydraulic variables were evaluated todetermine if there were correlations that could be used to predict the flows necessary forprotection of spawning and rearing habitat. The toe-width was the only variable found to have ahigh correlation with flows considered necessary for protecting spawning and rearing habitat ofsalmon and steelhead. The toe-width is the distance from the toe of one streambank to that of theother streambank across the channel. The toe-width method produced a strong correlationbetween an easily measured stream variable (the toe-width) and the empirically determineddischarge that produced maximum and sustained spawning and rearing habitat in the streamssurveyed. Since this methodology relies so strongly on a single channel characteristic torecommend instream flows, special attention must be given to sampling location(s) and historicchannel disturbance regime. In WRIAs 44 and 50, the toe-width can be heavily influenced bychannel-forming peak storm events and the method should attempt to focus on low flow rearingchannels that more routinely support seasonal stream flows. This method if fairly simplistic andonly addresses hydrology indirectly through the channel signature. Resulting recommendationsshould be compared with hydrology data to determine if the estimated flow will actually occur innature.
4.2 TENNANT/MONTANA METHOD
The Montana Method was presented by Donald Tennant in 1975 and has been applied widely toestablishing instream flows in broad scale studies and regional planning efforts. The methodrequires minimal expenditures of resources and can be used with limited or extensivehydrological and fishery data. The Tennant Method is considered one of the simplest techniquesfor selecting or qualitatively evaluating instream flows for fish. In general, the method relies oneight flow classifications established by Tennant after analyzing a series of field measurementsand observations (Table 8). Each classification is assigned a percentage or percentage range ofthe average annual flow (QAA). The percentages are applied to specific times of year with the

Foster Creek Conservation District Instream Flow Study Recommendations
R2 Resource Consultants 22 March 26, 20021303.08/InstreamFlowMethod.32602 Draft
year divided into two six-month periods, April through September and October through March.These two periods reflect summer and winter rearing seasons established initially for the WRIAs44 and 50 planning effort in Section 2.0 of this Appendix.
The QAA can be estimated from existing flow records, or by using regional hydrologicregression models. Habitat quality is expressed as a percentage of QAA ranging from less than10% (Severe Degradation) to 60% - 100% (Optimal Range).
Table 8. Instream flow regimes for fish habitat (Tennant 1975)
Recommended BaseFlow Regimes (QAA)Narrative
Descriptionsof Flows Oct. – Mar. Apr. – Sept.
Flushing Flow 200% 200%Optimal Range 60 – 100% 60 – 100%Outstanding 40% 60%Excellent 30% 50%Good 20% 40%Fair 10% 30%Poor or Minimum 10% 10%Severe Degradation <10% <10%
The Tessman modification of the Tennant Method (in Wesche and Rechard 1980) is designed toaccount for the importance of flow cycles and stream productivity on ecosystems. It is based onthe following assumptions:
1) Living components of the stream ecosystem are adapted to the natural flow regime anddepend both on high flows and periods of low or even zero flow to satisfy allrequirements of their life cycles.
2) The best minimum flow model is one that mimics nature. Hence, minimum flow valuesshould parallel the natural flow regime during the yearly cycle.
The Tessman method accommodates fluctuation in periodicity by calculating minimum flows ona monthly basis rather than on an annual or bi-annual basis. The recommended minimum iscalculated as a percentage of the mean monthly flow (MMF) rather than the average annual flow(QAA). The approach used a mean value of 40 percent of the mean monthly flow as mid-way

Foster Creek Conservation District Instream Flow Study Recommendations
R2 Resource Consultants 23 March 26, 20021303.08/InstreamFlowMethod.32602 Draft
between the 30 percent and 50 percent values Tennant used to represent excellent habitat duringthe two periods of the year. The Tessman approach included the following stipulation amongothers:
1) During low water months, when the MMF is less than 40 percent of the QAA, the MMFis designated as the minimum flow to preserve stream flow in low water months.
The National Marine Fisheries Service (NMFS) is similarly proposing the establishment of flowschedules based on MMFs and recommends multiple tiered flow targets based on wet, normal, ordry water years. Establishing flows as a function of the relative degree of precipitation during agiven water year is an appropriate approach for WRIA 44 and 50 streams. It provides annualflexibility that is directly tied to the dynamic nature of surface water flows and avoids a “one-size fits all” type of flow threshold.
Modifications to the Tennant method that address flows as a function of MMF appear to be moreappropriate for WRIAs 44 and 50 streams than the original method due to the ability to takemonthly flows into consideration.
4.3 WETTED PERIMETER
An alternative approach involves a simple cross-sectional hydraulic measurement as a way toapproximate fish habitat. The distance from water’s edge to water’s edge along the bottom ofthe channel is defined as the wetted channel perimeter. This hydraulic variable changes withflow and a variety of biological benefits have been ascribed to increasing the amount of wettedperimeter. In this approach, a desired low-flow value is chosen based on the shape of the wettedperimeter-flow curve. The wetted perimeter technique generally selects the narrowest wettedbottom of the stream cross section that is estimated to protect the minimum habitat.
The analyst selects a critical area (typically a riffle) as an indicator of habitat conditions in therest of the stream. If a riffle is used as the indicator area, it is assumed that the resultingminimum flows will satisfy the needs for food production, fish passage, and spawning. Theusual procedure is to choose the break or “inflection point” in the streams wetted perimeterversus discharge relation as a surrogate for minimally acceptable habitat. The inflection pointrepresents the flow where the rate of wetted perimeter change begins to slow with increasingdischarge. Once this level of flow is estimated, other habitat areas, such as pools and runs, areassumed to also be protected.

Foster Creek Conservation District Instream Flow Study Recommendations
R2 Resource Consultants 24 March 26, 20021303.08/InstreamFlowMethod.32602 Draft
4.4 IFIM/PHABSIM
The PHABSIM (Physical HABitat SIMulation) is the most commonly used method by waterresource managers for evaluating the incremental change in habitat quantity and quality withstream flow. The use of PHABSIM allows agency and stakeholder groups to evaluate resourcetradeoffs of different instream flow scenarios. The PHABSIM system is nested within theInstream Flow Incremental Methodology (IFIM) and is the hydraulic modeling and habitatanalysis component. PHABSIM involves a comprehensive set of microcomputer based modelsused to simulate habitat conditions in rivers and streams for various species and life stages of fishover a range of discharge conditions. PHABSIM is currently supported by the US GeologicalService to analyze incremental discharge rates on the quantity and quality of aquatic habitatavailable in rivers and streams.
The basic application of PHABSIM involves selecting a representative section of the stream orriver, typical of the river’s morphology and habitat conditions. Hydraulic characteristics (depthand velocity) of cross-sections are recorded within distinct giomorphic channel units (e.g., pool,runs, and riffles). Each cross-section is divided into individual cells of a set width. For each ofthe resulting cells, depth, velocity, substrate, and cover characteristics are measured andrecorded. It is assumed that these four parameters determine the suitability of any particularsegment of the stream channel for a specific species and life stage of fish. It is the relationship orchange in the suitability of each cell for a given stream flow that provides a quantitative way ofrepresenting the impact on aquatic habitat for any reference species and life stage.
4.5 FLOW METHOD SUMMARY
A variety of acceptable methodologies are currently available for determining instream flows. Inselecting the appropriate methodology for use on WRIAs 44 and 50 streams, one must considerseveral factors including resource sensitivity, data availability, time and financial constraints, andthe level of confidence required in the instream flow values. For example, the historicalhydrological methods will require development of a simulated hydrograph and resultingrecommendations are made without an established relationship between discharge and habitat.All of the other methods involve channel hydraulic measurements that are heavily influenced bystorm flow events in the WRIA streams. Most of these approaches will also require a simulatedhydrograph. Extreme care must be taken, and it is our recommendation, to ensure the methods

Foster Creek Conservation District Instream Flow Study Recommendations
R2 Resource Consultants 25 March 26, 20021303.08/InstreamFlowMethod.32602 Draft
employed address the low flow distribution channels and not the storm conveyance channels insetting ongoing monthly or seasonal minimum instream flow regimes.
In the subsequent section, a conceptual approach to performing instream flow studies isdescribed. The best attributes of various methods are combined to specifically address the natureof WRIA streams.

Foster Creek Conservation District Instream Flow Study Recommendations
R2 Resource Consultants 26 March 26, 20021303.08/InstreamFlowMethod.32602 Draft
5. CONCEPTUAL APPROACH TO INSTREAM FLOW STUDIES
The purpose for setting instream flows in WRIAs 44 and 50 is to ensure future waterappropriations occur without jeopardizing the continued existence of, or hindering federalrecovery efforts for, anadromous fish populations in the WRIAs that are currently listed asthreatened or endangered under the Endangered Species Act (ESA). In establishing streamflows, however, the following constraint must be taken into account.
1) It should be recognized that the availability of fish habitat in the WRIA streams is primarilyrelated to the ability of stream channels to carry surface water. The local flood history hasinfluenced channel conditions such that flood deposits in low gradient areas of alluvial fansnear the stream mouths allow the surface water to percolate within the alluvium. Surfacewater stream flows while apparently perennial one year may be non-existent during another.Therefore, instream flow levels must be flexible, recognizing channels may occasionally bedry and that fish habitat is dynamic.
2) Groundwater springs support surface water flow, and hence ESA fish species, in Rock Islandand Foster Creeks during the low-flow summer season. Without the springs, surface streamflows would be intermittent. Therefore, whatever the springs discharge plus any furtherdownstream non-point groundwater seepage, will generally provide the base flow regime inthe channel. Minimum instream flow recommendations during low flow periods shouldrecognize that surface water discharges are dependent upon outflow from the springs andhence groundwater recharge.
Given the unique nature of streams in WRIAs 44 and 50, we suggest an instream flow-settingapproach that integrates many of the best attributes of several different methodologies whilemaintaining the flexibility to focus on those flow-related factors that may currently limitsalmonid production within the Foster Creek and Rock Island Creek basins. This approachevaluates instream flow needs for key biological factors including adult spawning and juvenilerearing.
In this manner, a blend of methodologies allowing the use of a “stepwise” or phased approachfor development of instream flows in the WRIAs is recommended. A sequential approachallows the method and accompanying data analysis to be tailored to fit the “level of effort”required to meet specific needs based on stream channel configuration, resource sensitivity,

Foster Creek Conservation District Instream Flow Study Recommendations
R2 Resource Consultants 27 March 26, 20021303.08/InstreamFlowMethod.32602 Draft
identified limiting factors, and stakeholder needs. Specific parameters evaluated in the processof determining the appropriate method and level of analysis would include both basin-scale andstream specific-scale including:
� Stream Hydrology � Channel Morphology- perennial or intermittent - bankfull width and depth- base and peak flow levels - toe of bank width- flow duration (daily, monthly, annual) - local slope and confinement- surface flow connectivity - disturbance regime and sensitivity
� Fish Use � Stakeholder Value- current and historic - current appropriation- life stage use (e.g., spawning, rearing) - future appropriation- periodicity/use duration - federal/state resource protection
One factor essential for development of most of the recommended flow establishmentmethodologies is the establishment of a long-term flow record for each stream of interest. Long-term records of surface water discharge are not available for these streams. This data gap mustbe filled before a credible effort can be made to establish minimum instream flows. An existinglong-term record at a gaged site with similar basin characteristics should be used for calibration.Using regression analysis, the gaged basin within the region that provides surrogate data wouldbe adjusted to fit the unique characteristics (e.g., drainage size, aspect, precipitation, etc.) of theungaged basin.
In short, the recommended approach for establishment of instream flows for WRIAs 44 and 50should at a minimum:
1. Determine the amount of water available hydrologically using existing data or developedusing regional regression analysis;
2. Compare the flow rate(s) developed in #1 with stream specific channel morphology andfish habitat information;
3. Determine the quality and quantity of fish habitat available at the flows develop in #2;4. Determine the deviation from “ideal” or “preferred” habitat conditions; and5. Evaluate whether the flow recommendations are realistically achievable under the natural
flow regime.
Foster Creek Conservation District Instream Flow Study Recommendations
R2 Resource Consultants 28 March 26, 20021303.08/InstreamFlowMethod.32602 Draft
6. PHASE 2 STUDY RECOMMENDATIONS
Following the conceptual approach outlined above, it is recommended the Planning Unit initiatea sequential process for the development of minimum instream flows. This process would beapplied to only the highest priority stream systems with a somewhat reduced level of effort usedon lower priority or less sensitive sites. The instream flow study recommendations include thefollowing items:
1) Proceed with field studies to help establish instream flow needs as a top priority, on:
- Foster and Rock Island Creeks.
2) Delay recommendation of flow regimes on all other intermittently flowing streams untilresource conditions or flow requirements suggest additional assessment is warranted.
3) Initiate Phase 2 hydrologic studies to simulate monthly long-term hydrograph andestablish likely flows for wet, average, and dry years. This process is essential fordevelopment of most of the recommended flow establishment methodologies. Before aninstream flow level can be set, the surface water available within the basin on a daily,monthly, and yearly basis must be estimated for Foster Creek, Rock Island Creek, andperhaps Moses Coulee Creek (subject to recommendation #2 above). The hydrologicdata developed from this process should be used to develop daily, monthly, and annualflow records and predict flow levels during wet, average, and dry years.
4) With an interdisciplinary team of specialist, use the Phase 1 habitat mapping data andinformation on limiting factors to select field sampling transects that are representative ofthe available and critical habitat. Ensure critical spawning, passage or rearing habitatareas are included. Field sampling locations should be agreed to by all resource specialistand stakeholders.
5) Initiate field data collection from selected transects in Foster, Rock Island, and perhapsMoses Coulee Creeks. Data collection could be conducted as if a PHABSIM study wereto be performed. Such information will be valuable for, and would not preclude, any ofthe methods from being selected. The types of cross-sectional data collected wouldinclude:
- depth, velocity, and substrate characterization;- channel shape, cover, and longitudinal profile.

Foster Creek Conservation District Instream Flow Study Recommendations
R2 Resource Consultants 29 March 26, 20021303.08/InstreamFlowMethod.32602 Draft
6) Begin data analysis in terms of the simplest flow setting methodology first. End theanalysis if the recommended flow regime resulting from the simplest approach orcombination of approaches is logical, defendable and agreeable to the Planning Unit andstakeholders. If the flow level is neither logical, defendable or agreeable, sequentiallyproceed to the next approach level as follows:
Levelof Effort
RecommendedMethodology
RelativeCost
Simple Tennant: hydrology based Low
Toe-width: channel based�
Wetted Perimeter: channel + hydrology based�
Complex PHABSIM: channel + hydrology + biology based High
7) Recommended flows should be put into perspective against long-term flow record andpotential habitat duration. Establish monthly/seasonal flow levels based on fish lifehistory needs, while ensuring the range of historical stream flows could support such aminimum flow recommendation. Recommending flow levels that may presumablyoptimize the needs of fish but did not historically occur may not be realistic.
8) Provide flexibility by establishing an alternative instream flow schedule based on the typeof water year (wet, average, dry) experienced. Using the long-term simulated flow recordand developed flow exceedance tables for each stream as part of Step 3, develop a set oftrigger flows to tailor the monthly flow regime depending on the anticipated wateravailable at the beginning of each irrigation season.
9) Instream flow recommendations during low flow periods will be contingent on surfacewater discharges from springs. Protect the springs in Rock Island and Foster Creeks fromphysical and/or hydrological alteration.
10) Where spring outflow is a significant contribution during low periods, target minimumbase flows in each priority stream to replicate the seasonal contribution of outflows fromthe springs to surface water flow.
11) Continue stream flow gages established in Rock Island and Foster Creeks

Foster Creek Conservation District Instream Flow Study Recommendations
R2 Resource Consultants 30 March 26, 20021303.08/InstreamFlowMethod.32602 Draft
12) Locate and measure the surface water discharge from springs in the Foster Creekdrainage system known to contribute to streamflow in the anadromous fish reach(downstream of RM 1.0).
13) Perform studies to assess minimum flows needed to sustain production of various life-history stages of salmonid fish species throughout the year. Recognize that channels mayoccasionally be dry and that fish habitat is dynamic.
These recommendations are preliminary and would benefit from discussion of the consultingteam and planning unit members. Our last recommendation is administrative in nature, webelieve:
14) The study could benefit from a formal definition of the purpose for setting flows and avision for the desirable outcome. Setting goals and objectives for the project is one of themost important steps. All parties in the Planning Unit should be aware of and, hopefully,agree to the study elements. This aspect will minimize future disagreements about thestudy’s approach. Once goals and objectives have been identified in a consensus manner,the appropriate analytical methods and data collection techniques can be selected toaddress the issues.

Foster Creek Conservation District Instream Flow Study Recommendations
R2 Resource Consultants 31 March 26, 20021303.08/InstreamFlowMethod.32602 Draft
7. LITERATURE CITED
Bartu, K., and C. Andonaegui. 2001. Salmon and Steelhead Habitat Limiting Factors Report forthe Foster and Moses Coulee Watersheds Water Resource Inventory Areas (WRIA) 50 and44. Report prepared by the Washington State Conservation Commission, Olympia, WA,and the Foster Creek Conservation District, Waterville, WA. Final Report. March, 2001114p + app.
Bovee, K. D. 1982. A guide to stream habitat analysis using the Instream Flow IncrementalMethodology. Instream Flow Information Paper No. 12. FWS/OBS-82/26. CooperativeInstream Flow Service Group, U.S. Fish and Wildlife Service, Fort Collins, Colorado.249 p.
Caldwell, B. 1988. Letter from Brad Caldwell, Ecology to Doug Clausing dated March 3rd,1988 regarding IFIM Study results for Douglas Creek. 2 p + graphs.
Campbell, R.F. and E.B. Kvam. 2001. Screening Level Macroinvertebrate Assessment ofPotential Anadromous Fish-Bearing Streams in WRIAs 44 and 50. Draft report preparedfor the Foster Creek Conservation District, Waterville, WA by R2 Resource Consultants,Inc. Redmond, WA October 26, 2001. 17 pp + app.
Chapman, D.W., and K.P. McLeod. 1987. Development of criteria for fine sediment in thenorthern Rockies ecoregion. Final report prepared for EPA Region 10, Work assignment273. Battelle Columbus Laboratories. EPA 910/987162. 279 p.
KCM, Inc. 1995. Comprehensive flood hazard management plan, Draft Report. DouglasCounty Transportation and Land Services.
Karim, T.K., M. E. Gubbels, and I. C. Goulter. 1995. Review of determination of instream flowrequirements with special application to Australia. American Water Resources Association,Volume 31, No. 6, December 1995, pages 1063-1077.
Johnson, L. and Associates, Inc. 1974. Water pollution control and abatement plan, waterresource inventory areas 44 and 50, Douglas County. June. 176 p.

Foster Creek Conservation District Instream Flow Study Recommendations
R2 Resource Consultants 32 March 26, 20021303.08/InstreamFlowMethod.32602 Draft
Beak Consultants, Inc. 1995. Mid-Columbia Mainstem Conservation Plan; OverviewDocument. Report prepared for the Public Utility District No. 1 of Douglas County; PublicUtility District No. 1 of Chelan County; Public Utility District No.2 of Grant County; byBeak Consultants, Inc., Kirkland, WA in association with FishPro, Inc., Port Orchard, WA.August.
Swift, C.H. 1976. Estimates of stream discharges preferred by steelhead trout for spawning andrearing in western Washington. USGS Open File Report 75-155. U.S. Geological Survey,Tacoma, WA.
Swift, C.H. 1979. Preferred stream discharge by for salmon spawning and rearing inWashington. USGS Open File Report 77-422. U.S. Geological Survey, Tacoma, WA.
Tennant, D. L. 1975. Instream flow regimens for fish, wildlife, recreation and relatedenvironmental resources. U.S. Fish and Wildlife Service, Billings, Montana. 30 p.
Tennant, D.L. 1976. Instream flow requirements for fish, wildlife, recreation, and relatedenvironmental resources. In Proc. Symposium and Specialty Conference on InstreamFlow Needs (J.G. Orsborn and C.H. Allman, eds.), Vol. II, pp. 359-373. AmericanFisheries Society, Bethesda, MD.
Tessman. 1980. In Wesche and Rechard 1980.
Washington Department of Fisheries. 1987. Letter from WDF Director, Joseph Blum toEcology Director, Andrea Riniker, dated January 30th, 1987 regarding Appeal to thePollution Control Hearings Board (PCHB) of Ecology’s issuance of two surface waterrights in Douglas Creek. 7p.
Wesche, T. A., and P. A. Rechard. 1980. A summary of instream flow methods for fisheries andrelated research needs. Eisenhower Consortium Bulletin 9. Water Resources ResearchInstitute, University of Wyoming, Laramie, Wyoming. 122 p.
Weatherred, J.D., H.L. Silvey, and D.J. Pfankuch. 1981. Program documentation for R2-Cross-81. Rep. WSDG-AD-00004. USDA Forest Service, Watershed System DevelopmentGroup, Ft. Collins, CO.
![Brochure2 - MagicBricks€¦ · Location Map School B sc Delhi Pub licSçh001 To 20 min 13 12 min 10 min 08 m] n 02 Temple AFMC 20 min 12 min IS min 10 min min IS min min 07 min](https://img.dokumen.tips/doc/110x75/6034384eb5808f20db6ba851/brochure2-magicbricks-location-map-school-b-sc-delhi-pub-licsh001-to-20-min.jpg)