Embed Size (px)
Citation preview

1
Appendix A
Partial Treatment Worksheet for module 1
EXERCISE 1. INFLUENCE OF SIZE ON SA/V RATIOS.
We will use a cube to serve as a model cell (or organism). Cubes are especially nice because
surface area (length x width x 6 sides) and volume (length x width x height) calculations are easy
to perform. To calculate the surface-to-volume ratio divide the surface area by the volume.
Complete the table below for a series of cubes of varying size:
Table 1. Effect of increasing size on surface area-to-volume ratio (SA/V)
Length of a
side (mm)
Surface Area (mm2) Volume (mm
3) Surface Area/volume ratio
1
2
3
4
5
6
7
8
9
10
2
Questions and Analysis:
1. Which cube has the greatest surface area? volume? SA/V ratio?
2. What happens to the surface area as the cubes get larger? What happens to the volume as
the cubes get larger? What happens to the S/V ratio as the cubes get larger?
3. Which grows faster - surface area or volume? Explain.
4. If you cut a cube in half, how does the volume, surface area and SA/V ratio of one of the
resultant halves compare to the original?
5. As the linear dimension of the cube is increased by a factor of x, the surface area
increases by:
x ___
x2 ___
x3 ___

3
6. Plot, all on one graph, the following: s/v ratio vs. cube size (length in mm); volume vs.
cube size (length in mm); and surface area vs. cube size (length in mm).

4
7. Compare the volume, surface area and S/V ratio of the following: shrew vs. elephant,
baby vs. adult, ostrich egg vs. chicken egg.
Organism Mass Volume Surface Area SA/V
Ostrich egg 1.4kg
Chicken egg 0.07kg
Adult Human 70kg
Baby Human 7kg
Elephant 7000kg
Shrew 0.1kg
EXERCISE 2. SHAPE AND S/V RATIOS:
In this exercise we will explore the impact of shape on surface to volume ratios. The three
shapes given below have approximately the same volume (1 mm3). Complete the calculations for
each shape.
Remember:
Sphere volume=3
Sphere surface area=
Cylinder volume=
Cylinder surface area=
Shape Dimensions (mm) Volume (mm3) Surface Area (mm
2) SA/V ratio
Sphere 1.2 (diameter)
Cube 1 x 1 x1
Filament
(box)
0.1 x 0.1 x 100

5
Questions & Analysis:
1. Make a sketch, to scale, of the three objects.
2. Which shape has the greatest surface area? volume? s/v ratio?
3. If you had to select a package with the greatest volume and smallest surface area, what
shape would it be?
4. Explain why the shape of animals is basically "spherical", whereas plants and fungi are
"filamentous".

6
EXERCISE 3.
S/V RATIOS IN FLATTENED OBJECTS:
In this exercise we will explore how flattening an object impacts the surface area to volume
ratio. Consider a box that is 8 x 8 x 8 mm on a side. Then, imagine that we can flatten the box
making it thinner and thinner while maintaining the original volume. What will happen to the
surface area and s/v ratio as the box is flattened? Complete the table below.
Table 3. Effect of flattening an object on surface-to-volume ratio
Box No. Height
(mm)
Length
(mm)
Width
(mm)
Surface Area
(mm2)
Volume
(mm3)
SA/V ratio
1 8 8 8
2 4 16 8
3 2 16 16
4 1 32 16
5 0.5 32 32
Questions/Analysis:
1. Explain why leaves are thin and flat.
2. Why do elephants have large, flat ears?
3. How do you think flatworms feed?

7
EXERCISE 4. S/V RATIOS IN ELONGATED OBJECTS:
In this exercise we will explore how elongating an object impacts the surface to volume ratio.
Consider a box that is 8 x 8 x 8 mm on a side. Then, imagine that we pull on the ends to make it
longer and longer while maintaining the original volume. What will happen to the surface area
and s/v ratio as the box is flattened? Complete the table below.
Table 4. Effect of elongating an object on surface-to-volume ratio
Box No. Length
(mm)
Height
(mm)
Width
(mm)
Surface Area
(mm2)
Volume
(mm3)
SA/V ratio
1 8 8 8
2 16 4 8
3 32 4 4
4 64 2 4
5 128 2 2
Questions/Analysis:
1. Explain the shape of blood vessels relative to their function.
2. Explain why roots have "hairs."

8
Appendix B
Worksheet for full treatment group, Module 1
Materials:
Play Dough
Dental Floss
Rulers
Scales—one for every pair of students
Calculators (or they use their phones)
List of formulas
Concepts to be emphasized:
Density
Units
Tables
Graphing
Objectives:
1. Use property of density to determine that weight is an accurate indicator of volume (when
working with the same material).
2. Conjecture, collect data, and determine what happens to SA/V ratio as objects get
smaller, and as objects change form.
3. Explain implications of conclusions made.
Procedure:
Part I: What happens to SA/V as objects get smaller?
1. Give pairs of students cubes of different sizes, ruler, dental floss and the extra play dough
in a cup.
2. Review Surface Area
3. Ask students for ways to measure volume of the cubes
a. Calculation—works well for cubes, but what about irregular shapes?
b. Water displacement—good but messy
c. Weigh it
i. Why can we do this?
ii. Talk about density
4. Once it’s agreed that weighing the cubes will determine relative volume, have students
determine the surface area of the cubes and fill out Table 1.
5. Collect class data
6. Make conclusion: What happens to the SA/V as objects get smaller?

9
Part II: What happens to SA/V as objects change form while keeping the same volume?
1. Have students explore using Table 2
2. Discuss findings
Part III: What are the implications in ecology and in our everyday lives?
1. Whole group discussion.
List of relevant formulas:
Measurements of a rectangular prism:
Surface area: SArectangular prism=2wl+2hl+2wh
Volume: Vrectangular prism=lwh
Volume of a cube: Vcube= s3
Measurements of a cylinder:
Surface area: SAcylinder=2πr
2+2πrh
Volume: Vcylinder=πr2h
You have been given a cube of play dough. Please answer the following questions and
complete Table 1 as instructed.
1. Fill out row 1 related to your original cube.
2. What do you think would happen to the SA/V ratio if your cube were to shrink?
a. Stays the same_______
b. Increases_________
c. Decreases________

10
3. Please explain your thinking:
4. Different students in this room have different sized cubes. Let’s collect everyone’s data
and see what happens to the SA/V ratio with different sizes of cubes.
5. What can you conclude from the table and graph?
6. What do you think would happen to the SA/Volume ratio if you were to slice off part of
your cube? (Check the one that applies.)
Stays the same_______
Increases_________
Decreases________
Please explain your thinking:
7. Slice off a part of your cube (while maintaining a rectangular prism.) Fill out row 2 in
the table. Slice off more and fill out rows 3-5.
E dr Surface Area
(in cm2)
Volume (as
measure by
weight)
SA/Volume
(Surface Area ÷
Weight)

11
(in grams)
1 Original cube
2 Sliced cube #1
3 Sliced cube #2
4 Sliced cube #3
5 Sliced cube #4
Graph the surface area of each stage against the volume:
8. What conclusions can be drawn from your table?

12
Part III
Implications:
List organisms or parts of organisms that are/have flat features. What is the impact of this?
What are some organisms or their features that are roundish? What is the impact?

13
Appendix C
Worksheet for Partial Treatment, Module 2
Simple Growth
1.) Think about how populations change. What are two main contributing factors to
population change?
2.) Write a mathematical expression that describes the change in population using two main
factors. (You can use words or use variables.)
3.) Convert your expression from above to a change proportional to a population.
4.) How do we calculate an increase in the population by a factor of 0.05 (5%)? We will call
this growth factor r.
5.) Say your starting population was 200 ( . What would be your population after 1 year
( ), if there was:
a.) 5% growth?
b.) 12% growth?
c.) -10% growth?

14
6.) If is your starting population, express , the population after 1 year as a function of
accounting for population growth (r).
7.) Choose birth and death rates that would represent the following growth rates if average if
the starting population is 100:
a. 1% birthrate______ deathrate___________
b. 2% birthrate______ deathrate___________
c. -2% birthrate______ deathrate___________
d. 0% birthrate______ deathrate___________
8.) Does the population change by the same number of individuals each year? Explain.
9.) Sketch a graph of each population growth scenario in question 1, expressing population
as a function of time. Sketch these all on the same graph.
10.)Will any of the populations reach zero? Explain.
11.)Thus far, the discussion has been on simple growth models. That is, we’ve only
considered births and deaths, and we have assumed that the population growth will
remain constant regardless of its size. Name some factors that might hinder population
growth as populations get larger for each of the following organisms:
e. bacteria
f. fish
g. snails
h. moose
i. people
j. maple trees

15
12.) Models that consider these constraints account for carrying capacities (K). Carrying
capacities can be considered to be the theoretical maximum population allowed by the
resources available. If K is the carrying capacity, how do we show how far a population
(N) is from the carrying capacity (K).
13.)How would you express this as a fraction of the carrying capacity?
14.)We can add this to our growth model by multiplying what you derived earlier by this
fraction. Write this equation:
15.)Sketch what you think a growth model that accounts for carrying capacity would look
like. Label significant parts.
16.)Sketch what you think the change in population under this model would look like.
17.)Sketch what you think the fraction of carrying capacity (from #7) would look like.
16
Appendix D
Full Treatment, Module 2
Simple Growth
1.) Think about how populations change. What are two main contributing factors to
population change?
a. Births, deaths
2.) Write a mathematical expression that describes the change in population using these two
main factors. (You can use words or use variables.)
a. b-d
3.) Convert your expression from above to a change that is a fraction of the starting
population. We will call this r.
a. r=(b-d)/n
4.) Suppose the population increases in the same manner each year. How would we
determine the population in a given year from the population in the previous year?
N(t+1)=N(t)+rN(t)= (1+r)N(t)
5.) Open the Excel worksheet. Be sure that you are on the first worksheet. (Check the tab
on the bottom for “unlimited growth”.) We will be working only with the cells that are
colored.
17
a. In column B (in pink ), enter numbers of births and deaths that would give you a
1% increase if the starting population is 100. Make sure that cell B5 indicates
1% (that r is 0.01).
b. In column D (in green ), enter numbers of births and deaths that would give you
a 2% increase if the starting population is 100.
c. In column F (in purple), enter numbers of births and deaths that would give you a
2% decrease if the starting population is 100.
d. In column H (in blue ), enter numbers of births and deaths that would result in a
constant (unchanged) population size. Think about what you want r to be.
6.) For each situation, look at the first 20 or so years. Notice how the population size is
changing and how the changes to the population change are also changing. Write a few
sentences to describe what you notice.
7.) Sketch the shape of the graph (on the same set of axes) for these four situations.
8.) Scroll down to confirm the shape of your graphs…
9.) Explore other values of B and D. What happens to the population?
18.)Thus far, the discussion has been on simple growth models. That is, we’ve only
considered births and deaths, and we have assumed that the population growth will
remain constant regardless of its size. Name some factors that might hinder population
growth as populations get larger for each of the following organisms:
k. bacteria
l. fish
m. snails
n. moose
o. people
p. maple trees
19.) Models that consider these constraints account for carrying capacities (K). Carrying
capacities can be considered to be the theoretical maximum population allowed by the
resources available. If K is the carrying capacity, how do we show how far a population
(N) is from the carrying capacity (K)?
18
20.) How would you express this as a fraction of the carrying capacity? Explain the
meaning of this fraction.
21.) How can we use this fraction to modify our growth model from before.
The change in population will be rN(t)*(1-N/K).
The actual population will be N(t)+ rN(t)*(1-N/K).
22.) Write an equation for the population, N(t), using the carrying capacity model for the
following condition:
q. Starting population=100
r. Births= 40
s. Deaths=30
t. Carrying capacity=1000
23.) Sketch what you think the population over time would look like for this situation. Label
significant parts.
24.) Sketch what you think the change in population under this model would look like.
19
25.) Sketch what you think the fraction of carrying capacity (from #7) would look like.
26.) Use the worksheet under “constrained growth” to verify your sketches, inputting the
appropriate values.
27.) Explore using Excel: You can modify any of the colored cells (initial pop, B, D, K, r).
Play around with the spreadsheet and write your observations below.
20
Tables:
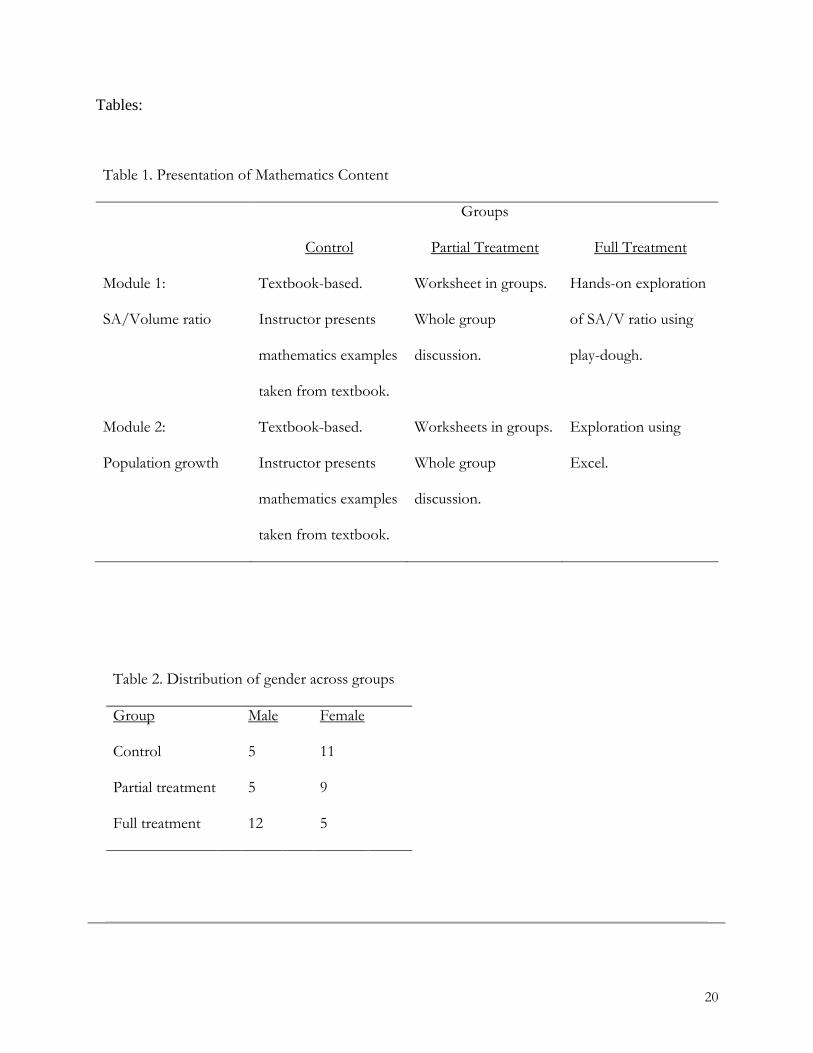
Table 1. Presentation of Mathematics Content
Groups
Control Partial Treatment Full Treatment
Module 1:
SA/Volume ratio
Textbook-based.
Instructor presents
mathematics examples
taken from textbook.
Worksheet in groups.
Whole group
discussion.
Hands-on exploration
of SA/V ratio using
play-dough.
Module 2:
Population growth
Textbook-based.
Instructor presents
mathematics examples
taken from textbook.
Worksheets in groups.
Whole group
discussion.
Exploration using
Excel.
Table 2. Distribution of gender across groups
Group Male Female
Control 5 11
Partial treatment 5 9
Full treatment 12 5

21
Table 3. Summary of student performance in response to treatments and other factors
Factors Exam Score Final Lab Score Final Score
Control 0† 0 0
Partial treatment 0 0 0
Full treatment + + +
Gender (Male) 0 0 -
MATH-100 0 0 -
Quantitative Courses 0 0 +
† 0 indicates no effect of factor on score, + indicates significant (p < 0.05) positive effect of
factor on score, and - indicates significant (p <0.05) negative effect of factor on score.

22
Table 4. Excerpted comments from focus group interviews
Control Partial Treatment Full Treatment
Math and math courses are not “conceptual.”
Knowing math is knowing how to find data in word-problems.
Math has concrete and definitive solutions.
BIO213 math as “basic math,” yet they also felt lost in it.
At the end of the course, they saw value to math for communication of ideas.
Math content needs to be addressed in shorter time segments.
Math is something new to biology education.
Math and science are interconnected: math is the language of science.
Math is necessary for the replication of scientific studies.
Though they took statistics courses, they admitted not knowing how they would use this again.
This course was “math intensive” with respect to other classes; yet not as much as high school.
The math was more than course filler.
Math gives “a broader perspective” of science; it allows us to see impact and effect.
Wanted more examples and sequencing that builds from basic concepts.
Students wanted more experiences with statistics and graphing.
Have forgotten math because they have not done it in a long time.
Math is necessary because it is connected to sciences.
Math taught in math classes is different than problem-solving.
Saw math as something helpful for making comparisons.
This course had more math than previous biology courses, especially with graph analysis.
Saw a benefit to having a more knowledgeable other helping with the math.
Wanted more help with their symbol-sense before working on formulas.
Did not want math forced into the science.
Thought statistics for biology would be helpful
They wanted course sequencing that builds from basic concepts.
Have forgotten math because they have not done it in a long time.

23
Table 5. Student dispositions to mathematics and science.
Pre-Survey Post-Survey
Group M SD Mdn M SD Mdn
Control -0.117 0.868 -0.14 0.096 1.237 -0.02
Partial -0.175 0.781 -0.14 -0.207 0.823 -0.12
Full -0.028 1.052 -0.15 -0.041 1.053 -0.54