Embed Size (px)
Citation preview

1
North Mono Basin
Watershed/Landscape Analysis
Appendices
Index of Appendices:
Appendix A. List of Hydrology/Water Use Information
Sources for the Mill/Wilson Area………………………………….. 2
Appendix B. Hydrologic Condition Assessment (Kattelman)…….. 7
Appendix C. Spreadsheet Documentation (Vorster) ………………32
Appendix D. Draft North Mono Basin Road Analysis (2001) …….40
Appendix E. Riparian Vegetation (Nelson)………………………...64
Appendix F. Wildlife Species – Conway Ranch …………………...74
Appendix G. Thompson Ranch Bird Census ………………………76
2
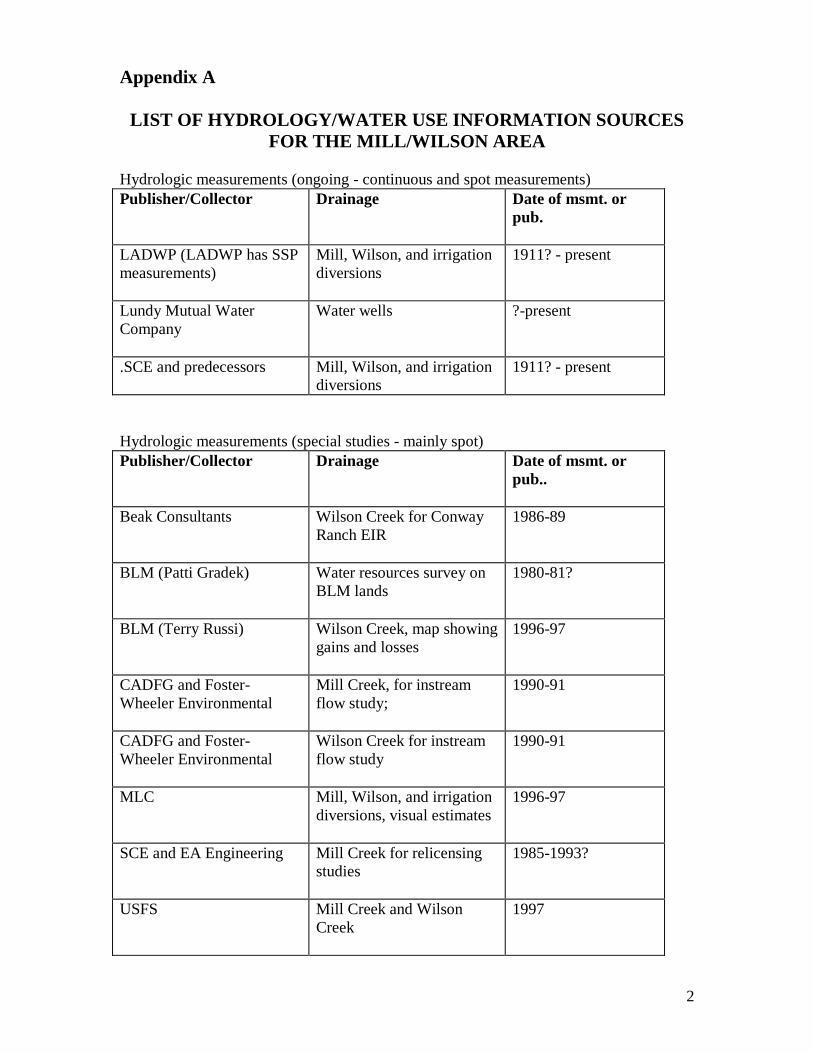
Appendix A
LIST OF HYDROLOGY/WATER USE INFORMATION SOURCES
FOR THE MILL/WILSON AREA
Hydrologic measurements (ongoing - continuous and spot measurements)
Publisher/Collector
Drainage
Date of msmt. or
pub.
LADWP (LADWP has SSP
measurements)
Mill, Wilson, and irrigation
diversions
1911? - present
Lundy Mutual Water
Company
Water wells ?-present
.SCE and predecessors
Mill, Wilson, and irrigation
diversions
1911? - present
Hydrologic measurements (special studies - mainly spot)
Publisher/Collector Drainage Date of msmt. or
pub..
Beak Consultants Wilson Creek for Conway
Ranch EIR
1986-89
BLM (Patti Gradek)
Water resources survey on
BLM lands
1980-81?
BLM (Terry Russi) Wilson Creek, map showing
gains and losses
1996-97
CADFG and Foster-
Wheeler Environmental
Mill Creek, for instream
flow study;
1990-91
CADFG and Foster-
Wheeler Environmental
Wilson Creek for instream
flow study
1990-91
MLC Mill, Wilson, and irrigation
diversions, visual estimates
1996-97
SCE and EA Engineering Mill Creek for relicensing
studies
1985-1993?
USFS Mill Creek and Wilson
Creek
1997

3
USFS Mill Creek for relicensing
?
Hydrologic and water management analysis: reports and testimony focused on
Mill/Wilson system.
Author Title Date Relevant Information
Physical
Location
Applied
Geotechnolo
gy
Groundwater
resource and lake
construction
irrigation for
Conway Ranch at
Mono Lake
1987
Groundwater resource
and lake construction
irrigation for Conway
Ranch
Mono
County
Planning
Dept.
(EIR)
Beak
Consultants
Conway Ranch
EIR and Specific
Plan (including
Technical
Appendices)
1986-
89
Conway Ranch hydrology
MLC
Library;
Mono
County
Larry
Harrison
Testimony
submitted to
SWRCB on behalf
of NAS/MLC
1997
alternative methods to
rewater Mill Creek
MLC;
LADWP
Kleinfelder
and
Associates
Preliminary
geotechnical
engineering and
geology report for
master planning
purposes (Conway
Ranch)
1983
Mono
County
Planning
Dept.
(EIR)
Jim Perrault Appendix E of
Waterfowl Habitat
Restoration Plan
1995
Mill Creek Watershed
Report
MLC
Library;
LADWP
Scott Stine Testimony
submitted to
SWRCB on behalf
of SLC/DPR
1997
water requirements for
the restoration of Mill
Creek
MLC:
LADWP
Scott Stine Appendix F of
Waterfowl Habitat
Restoration Plan
1995
Restoration of degraded
riparian, wetland, and
deltaic environments on
Mill Creek
MLC
Library;
LADWP
Triad Conway Ranch 1986 Conway Ranch flood Mono

4
Engineering flood hydrology
for EIR
hydrology County
Planning
Dept.
(EIR)
Triad
Engineering
report for Lundy
Mutual Water
Company for new
well
Grant
Phillips?
Peter
Vorster
Mill/Wilson
spreadsheet and
documentation
1997
Can model various
scenarios by inputting
water rights and
hydrologic variables
MLC
Peter
Vorster
Testimony
submitted to
SWRCB on behalf
of NAS/MLC
1997
Mill-Wilson hydrology
and water management,
water rights in the Mill-
Wilson system
MLC;
LADWP
Publications that include information on Mill/Wilson hydrography, hydrology, and water
management
Author Title Date
Relevant Information Physical
Location
Beak
Consultants,
BLM, FERC
Reports and
comments on
Conway Virginia
Creek Water
Power Project
1983 May not
exist,
contact
Beak
Consulta
nts
CADFG/Fos
ter-Wheeler
Environmen
tal
Mill Creek Stream
Evaluation Report
1996 Fish habitat evaluation MLC
FERC Final
Environmental
Assessment for
Hydropower
License (Lundy
Project, FERC
No. 1390)
1992
Joseph
Keating,
BLM,
CADFG
Reports and
comments on
Paoha Project
(Wilson Creek)
(There are concerns
about accuracy of
information in EIR)
Mono
County
Energy
dept.
Keenan Lee Infrared
Exploration for
1969
springflow information MLC
Library

5
Shoreline Springs
at Mono Lake
SWRCB Final EIR and
testimony in
LADWP Mono
Basin license
amendment
1993-
94
Mono Basin information,
including hydrology
MLC
Library;
LADWP
Scott Stine Historical and
Future Waterfowl
Habitat at Mono
Lake
1995
waterfowl habitat
information
MLC
USFS Dechambeau
Ponds EA
1992? Hydrogeology of area USFS
USFS Comprehensive
Management Plan
for Mono Basin
National Forest
Scenic Area
1989
Management of National
Forest Lands in the
Scenic Area
MLC
Library;
USFS
Peter
Vorster
A Water Balance
Forecast Model
for Mono Lake
1985
Water Balance, irrigated
acreage, irrigation use
and requirements
MLC
Library
Water Rights information and compilations
Document Physical
Location
Judgment and Decree - Mill Creek water rights adjudication,
1901, 1915
MLC
Compilation by Ernie Bullpit (SCE employee)
SCE?
LADWP (from Bishop office)
LADWP?
compilation in Division of Water Rights response to protests to
LADWP water rights applications for Mono Basin stream
(including Mill Creek)
Division of Water
Rights?
compilation of Mono Basin water users in LADWP cross-
complaint in National Audubon et al vs. DWP (1979)
?
6
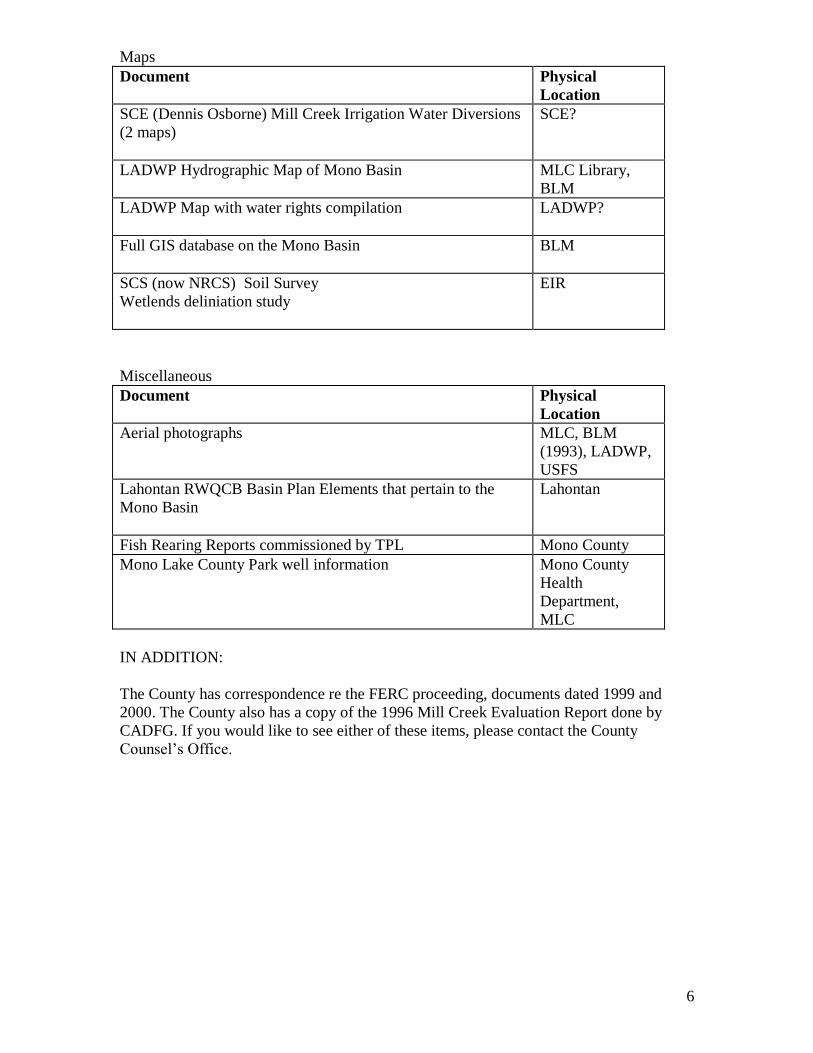
Maps
Document Physical
Location
SCE (Dennis Osborne) Mill Creek Irrigation Water Diversions
(2 maps)
SCE?
LADWP Hydrographic Map of Mono Basin
MLC Library,
BLM
LADWP Map with water rights compilation
LADWP?
Full GIS database on the Mono Basin
BLM
SCS (now NRCS) Soil Survey
Wetlends deliniation study
EIR
Miscellaneous
Document Physical
Location
Aerial photographs
MLC, BLM
(1993), LADWP,
USFS
Lahontan RWQCB Basin Plan Elements that pertain to the
Mono Basin
Lahontan
Fish Rearing Reports commissioned by TPL Mono County
Mono Lake County Park well information
Mono County
Health
Department,
MLC
IN ADDITION:
The County has correspondence re the FERC proceeding, documents dated 1999 and
2000. The County also has a copy of the 1996 Mill Creek Evaluation Report done by
CADFG. If you would like to see either of these items, please contact the County
Counsel‟s Office.

7
Appendix B
Hydrologic Condition Assessment Richard Kattelman, Hydrologist 2001
STEP 1 Mill Creek / Wilson Creek watershed characteristics draft of July 16, 2001
METEOROLOGY
Precipitation
Declining gradient from west (Sierra Nevada crest) to east (Mono Lake)
Ave. annual amounts: 30-40” near crest, 17-20” at 7,000‟, 16” at Conway Ranch
most precipitation as snow from November thru March; occasional thunderstorms in summer
rare mid-winter warm storms (rain up to 10,000‟ or higher)
Air Temperature
at Conway Ranch, summer mid-40s to mid-80s oF
at Conway Ranch, winter 20 to 40 oF
frost-free growing period of 45 to 130 days
Wind – wind speeds relatively low but breezes are common during growing season
Evaporation
open water evaporation estimated at about 40-45” per year at lower elevations
actual evapotranspiration at Conway Ranch estimated at about 17-24” per year
SURFACE WATER
Streamflow
Mill Ck just below Lundy Lk – ave volume 21,000 to 22,000 AF/yr (29 cfs, 22-23” over area)
Mill Ck historic range in annual volume: 8,700 to 40,000 AF
base flow generally between 10 and 18 cfs; flow ceases entirely in very dry years
Wilson Ck – about 15,000 AF is imported from Mill Ck on average; up to 70 cfs
Wilson Ck receives about 1,100 AF/yr from Virginia Ck; can import up to 2,900 AF/yr
Floods – average snowmelt peak in June about 89 cfs; up to 267 cfs recorded; peak of Jan. 1997
?
Impoundments - Lundy Lk can store 3,820 AF (about 18% of average annual flow of Mill Ck)
Quality – almost no turbidity and very low TDS; summer water temps up to 65-70 oF in Wilson
Ck
GROUND WATER
unconfined (“water table”) aquifer in soils & surficial alluvium largely maintained by irrigation
& ditches
relatively small confined aquifers of alluvial sands and gravel exist below glacial till and
lacustrine silts
BASIN CHARACTERISTICS
Channel Geometry
Mill Ck upper portion – bedrock/boulder stream; mid – incised in lake deposits; lower - delta
Wilson Ck – artificially eroded channel; wide arroyo formed downstream of highway 167
Topography
Elevation range = 6,380 to 12,446 feet
Mill Ck above 7,200‟ steep glacial canyon; then across old lake terraces; below 6,600‟
“bottomlands”
Wetlands/Riparian
Mill Ck above 6, 600‟ strip of willows, cottonwood, aspen, Jeffrey pine; bottomlands: former
woodland
Wilson Ck strip of willows; little vegetation in arroyo section

8
irrigated meadows
Soils - depth is highly variable and infiltration high except where high water table or impervious
subsoil
Geology - Mill Ck areal coverage: 45% metamorphic, 35% granitic, 20% unconsolidated
Vegetation - upper elevations: montance scrub and conifers; Great Basin sagebrush and irrigated
meadow
HUMAN INFLUENCES
Water Management – diversion of Mill Ck water into Wilson Ck and irrigation ditches largely
controls the
distribution of water throughout the study area
Stock – reports of livestock induced bank erosion along Wilson Ck channel
Mining - no active mines; a few historic prospects in upper basin and on Copper Mtn
Roads – about 15 miles of paved roads and 15-20 miles of unsurfaced roads
Agriculture – about 1400 AF of water applied to Conway Ranch and about 400 AF applied to
Thompson
Urban – Mono City uses about 27 AF per year with about half of that lost to atmosphere
Fish Rearing – new operation on Conway Ranch may use up to 13 cfs at peak (generally August
– Sept)

9
STEP 2 Relative Influence of Factors on:
Flow Quality Timing
1 =
high
FACTORS
2 = moderate 3 =
slight/none Meteorology
Precipitation
Amount 1 1 1
Duration 1 1 1
Frequency/Intensity 1 1 1
Snowmelt 1 1 1
Air Temperature
Maximum 2 2 2
Minimum 3 3 3
Evaporation 1 3 3
Wind 3 3 3
Surface Water
Floods 1 1 1
Impoundments 1 1 1
Basin Characteristics
Channel Geometry 2 2 3
Topography 3 3 3
Wetlands/Riparian 2 2 3
Soils
Depth 3 3 3
Infiltration 3 3 3
Geology 3 3 3
Vegetation 3 3 3
Human Influences
Water Management 1 2 1
Stock 3 2(historic) 3
Mining 3 3 3
Roads 3 2 3
Agriculture 2 3 3
Urban 3 3 3
10
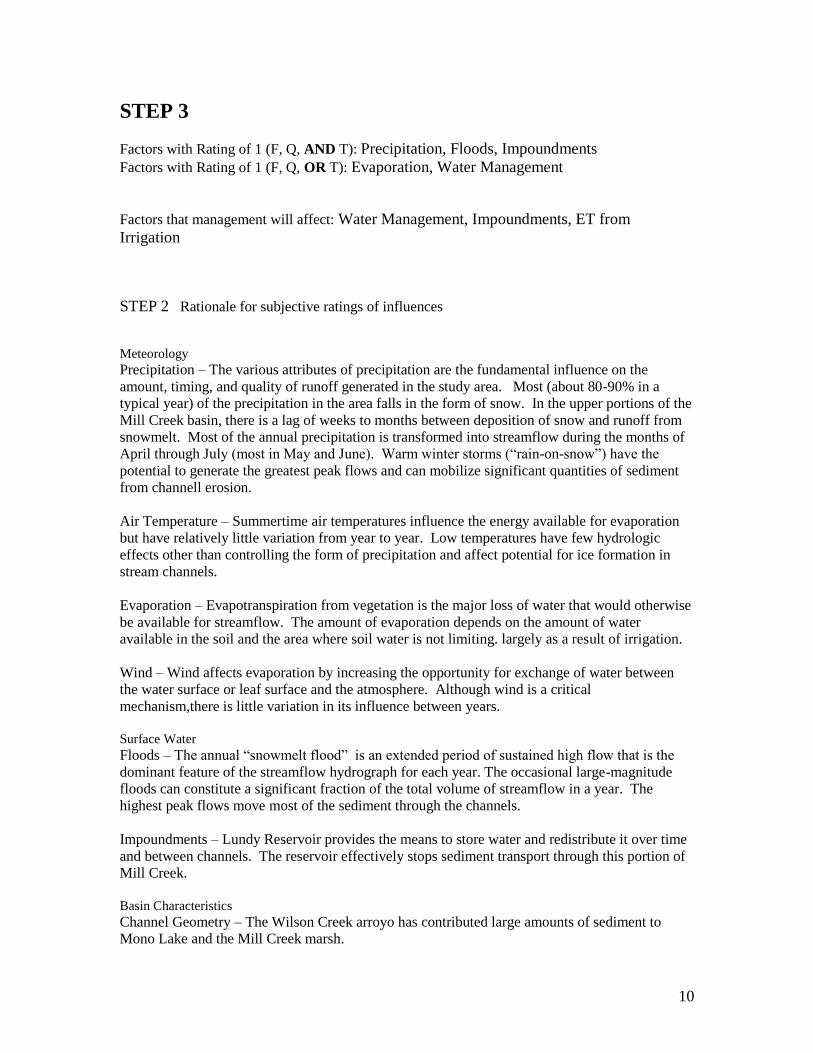
STEP 3
Factors with Rating of 1 (F, Q, AND T): Precipitation, Floods, Impoundments
Factors with Rating of 1 (F, Q, OR T): Evaporation, Water Management
Factors that management will affect: Water Management, Impoundments, ET from
Irrigation
STEP 2 Rationale for subjective ratings of influences
Meteorology
Precipitation – The various attributes of precipitation are the fundamental influence on the
amount, timing, and quality of runoff generated in the study area. Most (about 80-90% in a
typical year) of the precipitation in the area falls in the form of snow. In the upper portions of the
Mill Creek basin, there is a lag of weeks to months between deposition of snow and runoff from
snowmelt. Most of the annual precipitation is transformed into streamflow during the months of
April through July (most in May and June). Warm winter storms (“rain-on-snow”) have the
potential to generate the greatest peak flows and can mobilize significant quantities of sediment
from channell erosion.
Air Temperature – Summertime air temperatures influence the energy available for evaporation
but have relatively little variation from year to year. Low temperatures have few hydrologic
effects other than controlling the form of precipitation and affect potential for ice formation in
stream channels.
Evaporation – Evapotranspiration from vegetation is the major loss of water that would otherwise
be available for streamflow. The amount of evaporation depends on the amount of water
available in the soil and the area where soil water is not limiting. largely as a result of irrigation.
Wind – Wind affects evaporation by increasing the opportunity for exchange of water between
the water surface or leaf surface and the atmosphere. Although wind is a critical
mechanism,there is little variation in its influence between years.
Surface Water
Floods – The annual “snowmelt flood” is an extended period of sustained high flow that is the
dominant feature of the streamflow hydrograph for each year. The occasional large-magnitude
floods can constitute a significant fraction of the total volume of streamflow in a year. The
highest peak flows move most of the sediment through the channels.
Impoundments – Lundy Reservoir provides the means to store water and redistribute it over time
and between channels. The reservoir effectively stops sediment transport through this portion of
Mill Creek.
Basin Characteristics
Channel Geometry – The Wilson Creek arroyo has contributed large amounts of sediment to
Mono Lake and the Mill Creek marsh.

11
Wetlands/Riparian – The riparian vegetation can use a significant fraction of the base flow in late
summer.
The riparian vegetation (where present) protects the channel banks from erosion and thereby
reduces sediment input.
Topography,Soils, Geology, and Vegetation – There is nothing particularly unusual or influencial
about these factors in the context of the study area
Human Influences
Water Management – Except for the driving force of precipitation, the water management
activities are the primary influence on water volume and timing in the study area. The removal of
water from Mill Creek for hydroelectric generation and irrigation and the augmentation of Wilson
Creek have drastically changed the volume and timing of streamflow in these creeks compared to
natural conditions. In turn, the sediment transport regime, stream temperature, dissolvedoxygen
content, and capacity to dilute and assimilate contaminants have been altered by the changes in
flow regime.
Stock – Historic grazing practices are reported to have altered some riparian vegetation and
increased bank erosion. The extent and intensity of any effects are unknown.
Mining - Historic mining prospects on Copper Mountain and in upper Mill Creek may generate
small contributions of metallic compounds to surface waters, but problems have not been
reported. The primary impact of mining in the area may have been the secondary effects of
demands for food and fuel from Bodie.
Roads – The road density is relatively low, and the roads and stream crossings appear to be
stable.
Agriculture – Irrigation has been the main human use of water in the study area over the past
hundred years and appears to have constituted about 20% of the average annual streamflow
volume of Mill Creek.
Urban – The principal community in the study area, Mono City, is small and not known to
generate any significant water use or water pollution problems.

12
STEP 3
Factors with Rating of 1 (F, Q, AND T): Precipitation, Floods, Impoundments
Factors with Rating of 1 (F, Q, OR T): Evaporation, Water Management
Factors that management will affect: Water Management, Impoundments, ET from
Irrigation
Summary of important hydrologic condition factors and selected measures
Factor Flow Quality Timing
Water Mgmt & Total volume (AF/yr) Sediment yield (tons/yr) Volume/mo
(AF/mo)
Impoundments Peak flow (cfs) Date of
peak
Low flows (cfs)
ET/Irrigation Total volume (AF/yr) not significant not
significant
Low flows (cfs)
STEP 4
Current range of variability for primary factors
Factor Value Reliability
Flow
Mill (gage 355)
Total volume 0(‟77)-14,000 (‟83) AF/yr high
(Ave. ‟68-‟91: 3,200 AF/yr)
Peak 48(‟76) to 267(‟80) cfs high
Low 0 cfs high
Wilson (gage 393 Lundy PH out)
Total volume 7,000(‟76)-30,000(‟82) AF/yr high
(Ave. ‟68-‟91: 17,000 AF/yr) high
Peak 29‟(‟76) to 76 (‟70) cfs high
Low 0 (‟70 & ‟74) to 12 (‟85) cfs high
Quality
Sediment yield quantities unknown poor
(qualitative assessment only)
Timing
Volume/month compare to Lundy inflow high
Date of peak compare to Lundy inflow high
13
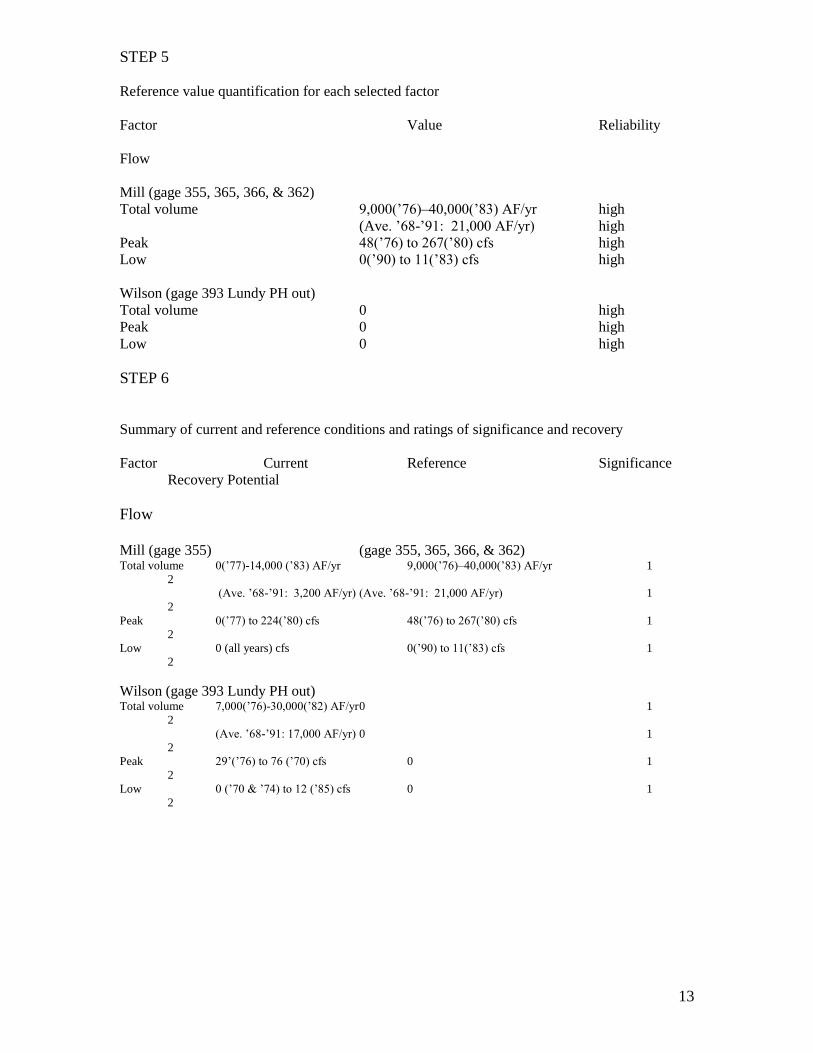
STEP 5
Reference value quantification for each selected factor
Factor Value Reliability
Flow
Mill (gage 355, 365, 366, & 362)
Total volume 9,000(‟76)–40,000(‟83) AF/yr high
(Ave. ‟68-‟91: 21,000 AF/yr) high
Peak 48(‟76) to 267(‟80) cfs high
Low 0(‟90) to 11(‟83) cfs high
Wilson (gage 393 Lundy PH out)
Total volume 0 high
Peak 0 high
Low 0 high
STEP 6
Summary of current and reference conditions and ratings of significance and recovery
Factor Current Reference Significance
Recovery Potential
Flow
Mill (gage 355) (gage 355, 365, 366, & 362) Total volume 0(‟77)-14,000 (‟83) AF/yr 9,000(‟76)–40,000(‟83) AF/yr 1
2
(Ave. ‟68-‟91: 3,200 AF/yr) (Ave. ‟68-‟91: 21,000 AF/yr) 1
2
Peak 0(‟77) to 224(‟80) cfs 48(‟76) to 267(‟80) cfs 1
2
Low 0 (all years) cfs 0(‟90) to 11(‟83) cfs 1
2
Wilson (gage 393 Lundy PH out) Total volume 7,000(‟76)-30,000(‟82) AF/yr 0 1
2
(Ave. ‟68-‟91: 17,000 AF/yr) 0 1
2
Peak 29‟(‟76) to 76 (‟70) cfs 0 1
2
Low 0 (‟70 & ‟74) to 12 (‟85) cfs 0 1
2
14
Basin Description and Characteristics
The study area for this hydrologic condition analysis is defined to include the lands
draining into (from southwest to northeast) Dechambeau Creek, Mill Creek, Wilson
Creek, and Rattlesnake Gulch as well as the unchanneled lands between these creeks that
drain directly into Mono Lake. The topographic divide between Wilson Creek and
Rancheria Gulch is considered the northeastern boundary of the study area.
Dechambeau Creek collects runoff from the northwest slopes of Mount Warren and a
small portion of lake terraces before entering Mono Lake at County Park. The USGS-
mapped channel begins at about 9,520‟ and extends for about 2.5 miles.
The drainage basin of Mill Creek extends to the crest of the Sierra Nevada between North
Peak (12,242‟) and Excelsior Mountain (12,446‟). About 60 % of the drainage area is
above 10,000 feet, and about 45% of the area is exposed bedrock or thin colluvium
(Vorster, 1985). Areal coverages of different geologic substrates are approximately 45%
metamorphic, 35% granitic, and 20% unconsolidated (U.S. Forest Service, 1997). Mill
Creek flows through glacier-carved Lundy Canyon, through a series of moraines, and
then across an expanse of ancestral lake terraces before entering Mono Lake (about
6,380‟) for a distance of about 13 miles. The stream flows for about 9.25 miles
(~49,000‟) in a deep canyon composed of crystalline rocks that contains Lundy Lake
(natural outlet elevation 7,766‟), a natural water body dammed by recessional moraines
of the Tioga (about 20,000 years ago) glacial advance. Most of the area contributing
water to Mill Creek above the mouth of Lundy Canyon (7,200‟ and 3.25 miles
downstream of Lundy dam) is rugged, steep terrain with little vegetation except along the
water courses. Downstream of the canyon, Mill Creek flows east for 3.45 miles (18,200‟)
through a narrowly incised lake delta over a bed of alternating coarse-alluvial and fine
lacustrine sediments (Stine, 1995). This delta was formed during the late Pleistocene
when ancestral Lake Russell filled the Mono Basin to an elevation of about 7,060 feet.
Aerial photos and field observations indicate that this reach of Mill Creek was
characterized over most of its length by a single channel lined with a narrow band of
riparian vegetation (willows, cottonwoods, aspen, Jeffrey pine) (Stine, 1995). At an
elevation of about 6,630‟, the eastward-trending channel of Mill Creek begins to curve to
the south. From this point, the stream enters a zone of coarse, permeable sediments
deposited in the past 10,000 years. This final reach is currently about 2.15 miles
(11,200‟) long and becomes progressively wider as it approaches Mono Lake (Stine,
1995). From a point near the present crossing of County Road, Mill Creek extended its
channel into Mono Lake by building a delta composed of the sediments it transported out
of its headwaters. Upstream of this point, an “interior delta” was built by the stream
backfilling into Mill Creek canyon for a distance of about 7,800‟ (Stine, 1995). Under
natural conditions, this interior delta was characterized by several channels, which
distributed the flow across the valley bottom. Riparian vegetation was present along the
narrow distributaries, and on the interfluve that separated them, as suggested by the dead
snags remaining today (Stine, 1995).
Wilson Creek drains the area north and east of Copper Mountain and south of Conway
Summit. Two small channels halfway between Copper Mountain and Conway Summit
form the natural headwaters of Wilson Creek. The northern channel has intermittent
flow, and the southern channel appears to be perennial (U.S. Bureau of Land

15
Management, 1978?). Much of Wilson Creek‟s drainage area consists of the lake
terraces between Conway Ranch and Black Point. After approximately 2 miles in its
natural course, flow is artificially split at County Road: a relatively small portion of the
water follows a wash to the north of Black Point (the Dechambeau Ranch fork), while
most of the water flows southward through an artificially cut arroyo that crosses the west
flank of Black Point (Stine, 1997).
“Bedrock below Conway Ranch is comprised of plutonic grantitic rocks of the Sierra
Nevada batholith intruded into and in fault contact with metamorphic rocks. Volcanic
rocks exist immediately north of Conway Ranch and recent basalts and volcanics exist to
the southeast along the shore of and in Mono Lake. Conway Ranch is primarily underlain
by fine grained lake bed deposits (silt and fine to medium sand). Upslope regions
generally are covered by recent sedimentary alluvial fan deposits (coarser sands with
some gravel) which have been washed from the adjacent mountains and deposited over
the old lake bed sediments (Kleinfelder and Associates, 1983).
Rattlesnake Gulch drains the area immediately northeast and east of Conway Summit. A
series of seeps and springs supply water intermittently to parts of the channel. Water has
not been observed to flow continuously for more than 0.25 miles (U.S. Bureau of Land
Management, 1979?). The USGS-mapped channel terminates on the Conway Ranch.
Subsurface flow from derived from Rattlesnake Gulch probably contributes to Wilson
Creek.
The Bishop Resource Office of the Bureau of Land Management has prepared a series of
maps and digital geographic information products that include physical and cultural
features, land ownership, and hydrographic information (contact Terry Russi 872-4881).
Riparian and Aquatic Conditions
There seems to have been sufficient water to maintain riparian vegetation and thereby
minimize streambank erosion throughout the past century in the reach of Mill Creek
above the bottomlands (Stine, 1995). However, the lowermost reach appears to have
dewatered routinely between the 1890s and 1920s, resulting in the loss of the riparian
woodland on the delta. This vegetation was already dead by 1929, when the first aerial
photos of the area were made (Stine, 1995). A recent study found little significant
difference in area or stand width of riparian vegetation along Mill Creek represented on
aerial photographs of 1929 and 1983 (Department of Fish and Game, 1996). Since 1960,
more water has available in lower Mill Creek from a combination of non-operation of the
Lundy powerhouse following damage in 1962 and frequent occurrences of above-average
runoff. As a result of this additional water, riparian vegetation has become reestablished
in some parts of lower Mill Creek. Although the channel remains wide and ill-defined,
riparian vegetation is currently more abundant than it was during most of this century
(Stine, 1995). Large woody debris was not found to be a dominant feature within the
USFS study reach. Of three pools found, only one was formed by wood. Most of the
large woody debris originated from cottonwoods (Inyo National Forest, 1997).

16
“Wilson Creek supports only a narrow, artificial riparian corridor, much of which is
exposed to wind shear and scouring by blowing snow. Biological diversity is extremely
low along this creek. Wilson Ditch and Arroyo below highway 167 are largely devoid of
riparian vegetation. This area is deeply incised, and sediments have been transported
onto the Mill Creek Marsh. The marsh has been covered with alluvium at the mouth of
Wilson Arroyo (Barry, 1997).
“By comparison with the multistoried, continuous corridor on upper Mill Creek, the
[Wilson] ditch vegetation is quite narrow and composed mainly of willow shrubs or low
trees. Nonetheless, the Wilson system does currently provide some values to wildlife and
the local human community. There is no established riparian vegetation on the arroyo of
lower Wilson Creek (Jacobs, 1997). Cottonwoods grow poorly in soils with a high clay
content (such as the Wilson Creek formation).
The distribution of plants reflects the abundance of natural seeps and the long history of
irrigation and grazing on the [Conway] ranch.
“Much of the [Conway Ranch] property has been flood irrigated for at least 100 years,
resulting in the presence of hydrophytic vegetation in virtually all irrigated portions.
Wetland portions of the project consist of several areas of Wet Meadow located both
north and south of Wilson Creek and a narrow fringe of Modoc-Great Basin Riparian
Scrub along Wilson Creek. The total acreage of wetlands on the project area is 171. 3
acres (out of 878 acres total) (Sanders, 1989).
Wilson Creek is characteristic of most streams on the eastern slope of the Sierra Nevada
in trout productivity and biomass. The water temperature, streamflow level and stability,
and the extent of cover provided by riparian vegetation on Wilson Creek are the critical
limiting factors (Biological Resources App to CR SP&EIR).
Field sampling of Wilson Cr (BEAK 86, WESCO 82) shows that the fish community is
almost exclusively brown trout (Salmo trutta).
“Fish densities ranged from 103 to 370 fish per acre (17 to 52 pounds per acre by
weight). Most fish were quite small and rarely exceeded 8” in length. The bulk of the
fish population was not of a size suitable for harvest by anglers. The small size of the
fish sampled and the generally low fish biomass of fish present suggest that Wilson Creek
is a stream of low productivity [probably because of cold water temperature, dramatically
fluctuating flow, few nutrients, low primary productivity, and limited riparian
vegetation]. Wilson Creek also suffers from sediment problems due to livestock
trampling of banks and bed (Triad Engineering, 1988).
Meteorology
Precipitation
The generally arid climate of the area results from its position immediately east of the
crest of the Sierra Nevada. There is a rapidly declining gradient in precipitation from
west (near the crest) to east (near Mono Lake). Precipitation is at a maximum in the upper
parts of the Mill Creek catchment where measurements of the water equivalence of the
snowpack at sites in upper Lee Vining Creek, a few miles to the south, suggest that
average annual precipitation is between 30 and 40 inches. The portion of the Mill Creek
17
catchment above the canyon mouth (7,200‟ - 12,446‟) has been estimated to receive
about 85% of the catchment‟s precipitation (Stine, 1995). Estimates of average annual
precipitation at Lundy Lake range from 17 to 20” (Mann and Blevin, 1982; Vorster,
1985). Precipitation continues to decline rapidly to the east where occasional
measurements suggest the following as mean annual values: Conway Summit 15”, lower
Dechambeau Creek 13”, Conway Ranch 16”, Black Butte 10” (Mann and Blevin, 1982;
Vorster, 1985; Triad Engineering, 1988). An average of 20” was estimated for the 11 mi2
area approximately tributary to Conway Ranch (Vorster, 1985). Almost all precipitation
in the Mill-Wilson region falls as snow during the winter, except for small amounts from
scattered thundershowers during the summer. Occasionally, a warm mid-winter storm
with large amounts of rain may produce flooding, as in January 1997.
Air Temperature
At Conway Ranch, average high temperatures in the summer are in the mid-80oF range,
and summer lows tend to be in the mid-40s. In winter, a typical high temperature would
be 40oF, and a typical low would be about 20
oF. The frost-free growing period ranges
from 45 to 130 days depending on location and elevation (Triad Engineering, 1988).
Wind
Winds are generated by storms moving across the Sierra Nevada from west to east,
regional pressure differences, and differences in temperature across the elevation range of
the basin. Wind speeds tend to be relatively low during the growing season.
Evaporation
Only limited data and estimates of evapotranspiration are available for the Mono Basin.
Evaporation pans have been monitored at a few locations and provide an index of
evaporation from small water bodies. Evaporation from a pan at Grant Lake totaled 43”,
and average evaporation from a pan floating in Mono Lake from 1957 to 1959 was 74”
(Lee, 1969). Evaporation pan data from a pan at Simis‟ place for May to October was
54” in 1981, 47” in 1982, and 49” in 1983 (Vorster, 1985). Two regional studies by
Harding (1935 and 1965, cited by Lee, 1969) estimated evaporation in Mono Basin as
39”. Vorster (1985) estimated 45” of open-water evaporation annually and an average
growing season evapotranspiration rate of 24”. Calculations by Ben Tsuang, a graduate
student at UCLA, confirm that fresh water evaporation rates in the Mono Basin are 45”
per year or higher (Vorster, 1988 – letter in CR EIR). The surface water evaporation rate
at Conway Ranch was estimated at 40” per year (Triad Engineering, 1987). Although the
mean annual potential ET is approx 40”, peaking during June thru August, mean annual
actual ET for CR is estimated at approx. 17”, with a seasonal peak from April thru June
and distributed as follows (Triad Engineering, 1987):
J F M A M J J A S O N D total
0.7 0.9 1.5 2.4 3.3 2.3 1.7 0.8 0.8 0.6 1.2 0.5 16.7 (inches)
18
Surface Water Quantity
“Natural” Hydrology
Natural runoff conditions only exist in the headwaters of the streams of the north Mono
Basin, above engineering works that divert or store some of the water. Most of the runoff
is generated in spring and early summer from melt of the seasonal snow cover.
Relatively little subsurface storage capacity exists in the thin layer of unconsolidated
materials in the headwater areas. Therefore, the volume and timing of runoff depend on
the quantity of water stored as snow and the timing of its melt. Approximately 81 % of
the annual runoff of Mill Creek has been attributed to snowmelt, occurring from April
through September, and about 19 % of the annual streamflow occurs as base flow from
October through March (Perrault, 1995). Although the annual hydrograph (daily volume
of streamflow plotted against day of the water year [October to September]) has roughly
the same shape each year, the volumes of snowmelt runoff can be quite different from
year to year.
Because streamflow in Mill and Wilson Creeks has been manipulated through diversions,
the natural (or “unimpaired”) flow regime can only be inferred from combining records
of gaged flows at various locations in the basin. Estimates of annual unimpaired runoff
in Mill Creek at a point immediately downstream of Lundy Lake for 1941 to 1990
averaged 21,200 acre-feet (AF) [29 cfs] (Perrault, 1995). These estimates were derived
from flow through Lundy powerhouse (SCE gages 365 and 366), flow in Mill Creek
below Lundy Reservoir (SCE gage 355) and storage change in Lundy reservoir. The
average depends on the time period considered: Lee (1969) estimated an average flow in
Mill Creek of 17,100 AF and Vorster (1985) calculated an average for 1937-1983 of
21,971 AF. This volume is equivalent to 22.7” depth of water spread uniformly over the
drainage area of 11,604 ac (Vorster, 1985). Comparable figures for other creeks in the
area are 22” for Rush Creek and 26.5” for Lee Vining Creek; Dechambeau Creek
averages 7.6” (945 AF) from its drainage area of 1,511 ac (Vorster, 1985).
Under natural conditions, streamflow in Mill Creek would typically reach a maximum
between late May and early July and then decline to base flow levels, which persist
through the winter until the following snowmelt season. Average monthly discharge for
June is about 89 cfs, and base flow tends to be about 14 cfs +/- 4 cfs (Perrault, 1995;
Department of Fish and Game, 1996). Using data for runoff years (April-March) 1968 to
1991 supplied by Southern California Edison, the Department of Fish and Game (1996)
estimated that unimpaired DAILY streamflow in Mill Creek ranged from 0 to 267 cfs and
averaged 29 cfs. This study also estimated average ANNUAL unimpaired streamflow
ranged from 12 to 56 cfs (8,700 AF to 40,000 AF).
A gain (or “accretion”) of 3 to 10 cfs occurs in the channel between Lundy Lake and the
mouth of Lundy Canyon (Stine, 1995 citing EBASCO, 1995 [not in Stine‟s references]).
Further downstream, a loss of 2-4 cfs has been estimated to occur in the reach of Mill
Creek underlain by Pleistocene sediments (Stine, 1995).
Prior to diversions, the natural drainage area of Wilson Creek above the southeast corner
of Conway Ranch was about 14 mi2 (Triad Engineering, 1987) and included the area
north and east of Copper Mountain and south of Conway Summit. Because much of this

19
area has a southern exposure, snow on these slopes melts throughout the winter between
storms. Therefore, spring snowmelt comes from a relatively shallow snowpack and
would not be expected to produce dramatic snowmelt runoff in most spring melt periods.
Wilson Creek was not mentioned in the reports of either VonSchmidt (1856) or Russell
(1889). Considering the detail of these reports, the lack of a description of Wilson Creek
suggests that this creek was not particularly noticeable in the 19th
century.
Some geomorphologists have hypothesized that the upper and lower Wilson Creek were
not connected as surface channels prior to diversion and that water seeping out of the
upper channel flowed as groundwater for several hundred feet before converging
downslope and forming the lower channel.
Vorster (1985) estimated precipitation and runoff from the ungaged portion of Mill Creek
/ Wilson Creek basins (7,251 ac) as 20.5” and 5.5”, respectively.
Streamflow Measurements
Southern California Edison estimates Mill Creek flows as sum of measured flow from
power plant plus releases/spill/leakage from Lundy Lake
Streamgage on Mill Creek below Lundy Lake consisted of a 6‟ Parshall flume, replaced
by 8‟ flume in 1983, which measures seepage, spillage and releases from Lundy Lake.
Outflow from the Mill Creek Power Plant is estimated as sum of measured flow in
tailrace and Upper Conway Ditch; velocities are measured with a current meter below the
powerhouse.
Dechambeau Creek above diversions LADWP established 5/29/35, 1‟venturi flume,
recorder installed 4/28/38, since 12/1/36 irrigation diversions of 0.2 cfs above station
Runoff records for Lee Vining and Mill Creeks exist since 1904 and for Rush Creek since
1935.
The U.S. Geological Survey reports discharge from Mill Creek below Lundy Dam in
three ways and for three different intervals: station 10287069 10/01/1988 through
09/30/1999, station 10287070 10/01/1969 through 09/30/1990 actual flow, station
10287071 10/01/1969 through 09/30/1972 natural flow. Discharge measured in the
Lundy Power Plant tailrace (station 10287195) has been reported from 10/01/1986
through 09/30/1999. A schematic of the Mill Creek water distribution system and gage
locations can be found in DFG 1996, page 11
Alterations of the Hydrologic System
Streamflows in the north Mono Basin began to be managed in the 1860s or 1870s with
importation of water from Virginia Creek. In the 1880‟s, small ditches diverted some
water out of the local streams for nearby irrigation. Over time, the ditches were
improved to convey more water for greater distances. A major rearrangement of water
distribution occurred in the early 20th century when water from Mill Creek was diverted

20
to generate hydroelectric power. [DFG96 says built 1911, burned twice, restored in 1962,
online since]. The original powerhouse at the Jordan site, north of the Mill Creek divide
and 0.5 mile south of Conway Ranch at the base of Copper Mountain, was destroyed by
an avalanche in 1905 (Stine, 1995) [1911 CR SP&EIR]. In 1911, the Lundy Project was
completed by the Southern Sierra Power Company (Perrault, 1995). A dam raised the
natural outlet of Lundy Lake 37‟ to an elevation of [7,803‟ (Stine, 1995) or 7,808‟
(Vorster, 1985)]. Lundy reservoir has a surface area of 130 ac and a usable capacity of
[3,802 AF (Vorster, 1985); 3,820 AF (Perrault, 1995)]. The diversion to the Lundy
powerhouse has a capacity of [take your pick 68.8/70/70.6 cfs]. Therefore, storage in
Lundy reservoir can increase in spring and summer when inflow exceeds this capacity (or
when diversion is reduced operationally), and storage is drawn down when inflow
declines below the capacity of the penstock. An agreement between SCE and LADWP
states that Lundy reservoir must be lowered to 10 % capacity each year (source
unknown).
The Mill Creek plant was damaged in 1961, and was rebuilt by 1969. Southern
California Edison assumed ownership and control of the hydrogeneration facilities in
1962 (Vorster, 1997)
Because of diversion from Lundy Lake to the powerhouse, there is little flow in Mill
Creek immediately below Lundy dam. Seepage from the dam is negligible. Lundy dam
was intended to include Deer Creek as well as Mill Creek but between 1956 and 1968,
Deer Creek shifted eastward on its alluvial fan, so it enters Mill Creek below the dam
(Stine, 1995). Outflow of groundwater into the Mill Creek channel downstream of Deer
Creek contributes additional water. Some water initially diverted from Lundy reservoir is
sometimes returned to Mill Creek via the Mill Creek Return Ditch. This return ditch is
an earthen canal beginning 1,400‟ below the powerhouse that is approximately 6,800‟ in
length with a flow capacity of about 12-15 cfs depending on the condition of the ditch.
Its capacity is limited by the flat gradient in some portions (Harrison, 1997) and can be
further decreased by ice build-up in the winter months (Varnell, 1997). The return ditch
was recently gaged while at capacity: 13 cfs went in, 10 cfs came out (Casey Shannon,
pers. comm., 2000) The Mill Creek Return Ditch has been described as “somewhat
degraded due to infrequent use and little maintenance” (Harrison, 1997). Additional
water is diverted from Mill Creek at Upper Thompson Ditch and Thompson Main Ditch.
Abandoned ditches leading from Mill Creek to Wilson Creek occur at and above Upper
Thompson Ditch. Significant quantities of water are lost to percolation and evaporation,
especially downstream of Thompson Main Ditch (Department of Fish and Game, 1996).
Forest Service technicians have compiled several years of data on Mill Creek flows and
percolation losses and continue to gather data. The channel through the Pleistocene
sediments appears to have had sufficient water during the past century to maintain
channel form and much of its riparian vegetation. However, the massive reduction in
flows in the lower channel (last 2 miles) produced dramatic changes in vegetation and
channel form (Stine, 1995). Only dead snags remain of an apparently-lush riparian
woodland, and the many channels of the bottomlands have been superseded by a single
channel (Stine, 1991). The last mile of the stream has undergone further changes since
the 1940s, when Mono Lake began to fall in response to the exports of other tributaries to
the lake. This drop in base level, totaling 45 feet by 1982, forced Mill Creek to cut into
its exterior delta, creating two elongate trenches up to 10‟ deep. (Stine, 1995). By 1955,
21
most of this lowermost reach had been transformed into a straight, wide wash with little
to no channel definition (Stine, 1995).
“Virtually all surface streamflow to the Conway Ranch project area is regulated by
diversions (i.e., Mill Creek via Wilson Creek and Virginia Creek via Conway Diversion
Ditch) which typically peak June through August. Nearly all of the flow in Wilson Creek
downstream of the SCE powerhouse originates from Mill Creek and is regulated by
powerhouse operation. Primarily because of the SCE powerhouse operation, the flow to
Conway Ranch is subject to drastic fluctuations both seasonally and on a year-to-year
basis. For example, mean annual Wilson Creek flows from the powerhouse have varied
from 8 to 33.6 cfs. Inflow to the Conway Ranch from the upper and lower Conway
Ditches is summarized as “Wilson Diversions” in the hydrologic budget. The Conway
Ranch holds water rights for a maximum of 19 cfs from Wilson Creek, although actual
diversions vary seasonally and are typically much less than 19 cfs (Triad Engineering,
1988).
Diversions from Mill Creek: Upper Conway tapped left bank at ~7520‟ - irrigated lands near present-day site of Lundy
power house and near base of Bodie Hills. Upper Conway ditch irrigates Mattly Ranch;
Silver Canyon also drains into the ditch. Water hasn‟t been seen in Upper Conway Ditch
at 395 crossing (where it makes a right-angle turn)
Approximately 1.5 miles farther downstream just below canyon mouth (7185‟), Upper
Thompson ditch right bank, water east and southward to Thompson Ranch near
Dechambeau Creek.
At 7080‟, Lower Conway left bank toward the Conway and Dechambeau ranchlands
north and east
At 6920‟, Thompson Main
At 6650‟, McGahn ditch left bank, 1 mile downstream of 395 - watered 80 ac between
Mill and Wilson Creeks
Physical capacities: (from Perrault 1995)
Lundy storage 3820 AF
Storage to average annual flow (3820 AF / 21,200 AF) 0.18 Lundy PH penstock 70.6 cfs
Farmer‟s Gate 150 cfs
return ditch 16 cfs
The ability to release water to Mill Creek through the Farmer‟s Gate is limited by the
water surface elevation of the reservoir (inlet at 7,779‟)
Mean annual diversion flows from Mill to Wilson at SCE PH: from Triad Engineering,
1987, table 7)
1974 75 76 77 78 79 80 81 82 83 84 85
36 20 9 8 26 24 30 19 32 37 34 17 cfs
Wilson Creek also changed dramatically with the addition of the water diverted from Mill
Creek. Beyond the Lundy powerhouse tailrace, a new channel connected with headwater
channel of Wilson Creek coming off of Copper Mountain. The great increase over

22
natural flow eroded the channel into a new form capable of transmitting several times
more water than it carried in pre-diversion times.
Perhaps the earliest significant diversion of water in the area resulted from a ditch
constructed in the 1860s or 1870s that brought water from Virginia Creek off of Conway
Summit down to the northwest corner of Conway Ranch. This diversion, commonly
called the Conway Summit diversion, is conducted under water rights adjudicated and
confirmed by Federal Court Decree C-125 (1936) The Court Decree set the diversion
right at 6 cfs during the period from March 1 to October 31 (Triad Engineering, 1987)].
The maximum diversion permitted under this decree would be slightly more than 2,900
AF/yr. The actual diversion for the 600 irrigated acres has been estimated at 1,100 AF/yr
(Vorster, 1985).
Current Hydrology
The control and diversion of water below Lundy Lake has resulted in a highly modified
hydrologic regime in both Mill and Wilson Creeks. This section describes some of the
characteristics of streamflow in the past few decades.
On the average, 70 % of the annual flow of Mill Creek (about 14,800 AF out of an
average of 21,200 AF) is diverted out Mill Creek at Lundy reservoir and passed through
the Lundy powerhouse (Perrault, 1995). The modern seasonal pattern of discharge from
Lundy Lake to Mill Creek is no or minimal flow from October through April, increasing
flow in May and June, and maximum discharge in July. After the Lundy powerhouse
was damaged in September 1961, diversions to the Conway-Dechambeau lands were
curtailed for seven years and Mill Creek carried some flow until the power plant was
returned to service in 1968 (Stine, 1995). Between 1968 and 1991, zero discharge was
observed at least 60 % of the time. Releases from Lundy Lake to Mill Creek may be
made occasionally during the irrigation season to supply water for diversion at Upper
Thompson Ditch (Department of Fish and Game, 1996). Inflows to Lundy reservoir are
rarely sufficient to spill water over the dam, although up to 230 cfs has flowed into the
reservoir since 1968 (Los Angeles Department of Water and Power, 1988). Mill Creek
received flow during peak snowmelt in several normal to wet years (69, 73, 74, 78, 80,
82, 83, 84, 86, 93, 95) since hydroelectric operations resumed (Stine, 1995).
Downstream of Lundy dam, Mill Creek gains flow from Deer Creek and from seeps
between Deer Creek and Upper Thompson Ditch. Streamflow measurements indicated
discharge in this reach increased by 3 to 10 cfs during periods characterized by minimal
runoff (Department of Fish and Game, 1996). Another set of measurements showed
accumulated accretion at the diversion point (Thompson Main ditch) (including ungaged
Deer Creek flow) ranging from a low of 6.6 cfs in March 1987 to a high of 10.5 cfs in
October 1986 (Federal Energy Regulatory Commission, cited by Perrault, 1995). Mill
Creek may gain additional flow from seeps near Upper Thompson Ditch (Department of
Fish and Game, 1996).
The Mill Creek Return Ditch is operated on occasion to return water to Mill Creek from
the Lundy powerhouse to supply water for irrigation in the Thompson ditch system when
flow in Mill Creek is insufficient to meet the demand Average monthly discharge in the
Mill Creek Return Ditch between 1990 and 1992 ranged from 0 cfs in most months to
11.2 cfs in June 1990. About 3 cfs was estimated to be lost to infiltration along this ditch
23
(Department of Fish and Game, 1996). The Upper Thompson and Thompson Main
ditches are used to divert water primarily during May through September. Average
monthly diversions into Upper Thompson Ditch from 1968 through 1992 ranged from 0
to 15.3 cfs. Average monthly diversions were greatest during June, July, and August,
averaging from 4.3 to 8.0 cfs. Capacity seems to be about 15.3 cfs (Department of Fish
and Game, 1996). Average monthly diversions into Thompson Main Ditch during 1977,
1978, and 1983 ranged from 0 to 17 cfs. Capacity seems to be about 17 cfs. (Department
of Fish and Game, 1996). Return flow from these lands ends up in Dechambeau Creek.
The Department of Fish and Game (1996) developed a longitudinal hydrologic model to
estimate response in discharge downstream from changes in inputs to and diversions from
the Mill Creek system.
Besides being dry just downstream of Lundy dam, Mill Creek is also dry for extended
periods in the lower reach. No Mill Creek flow was observed for most of 1990 through
1992 near Cemetery Road and Mono Lake (LADWP unpub, cited by DFG96).
Water that is discharged from the Lundy powerhouse and that is not returned to Mill
Creek supplies an artificial channel once called the Dechambeau ditch (Vorster, 1997) or
Wilson ditch (Harrison, 1997). This extension of the tailrace joins the original channel of
Wilson Creek that drains the east side of Copper Mountain.
“The present normal practice of SCE is to route most of the power house discharge flow
to Wilson Creek” (Harrison 1997).
“Although essentially an artificially maintained diversion, Wilson Creek has acquired
properties of a natural stream and is paralleled by riparian vegetation. The remaining
flow in the stream is generally lost through the permeable soils over which the stream
traverses.” Below the diversions below Conway Ranch, in May 1987, surface flow
ceased within one mile of Mono Lake (Triad Engineering, 1988).
Water balance prepared by Beak Consultants: ave flow in Wilson Creek below Conway
Ranch 21.2 cfs under average conditions and 7.9 cfs during severe drought, assuming
historical irrigation practices. Comparison with a “no irrigation” scenario suggested that
net annual consumption associated with historical irrigation on the Conway Ranch is
approximately 3 cfs for average and 2.5 cfs for drought conditions, respectively (Triad
Engineering, 1988) [1 cfs for 1 day = 1.98 AF; 5.9 AF/day and 5 AF/day; 2168 AF/yr
and 1807 AF/yr; half those numbers if „annual‟ means April-Sept.]
Peak flows in Wilson Creek on eastern boundary of Conway Ranch were estimated for
return intervals of 25 years (p=0.04): 230 cfs and 100 years (p=0.01): 380 cfs from the
drainage area above the 6,800‟ level at Conway Ranch of 14.2 mi2 (9088 ac). Additional
maximum flows of 74 cfs from the Lundy power house diversion and 6 cfs imported
from Virginia Creek would add to those values (Triad Engineering, 1987).
The volume of water diverted from Virginia Creek to Conway Ranch can be up to 2500
AF annually (Fox, 1964; cited by Lee, 1969).

24
Subsurface Water
“Unconfined groundwater in Mono Basin resides in poor aquifers which transmit little
water to Mono Lake. The majority of the groundwater in the basin occurs in alluvial
sands and gravels under confined or semi-confined conditions.
The floor of Mono Basin is covered in most areas by fine-grained lacustrine sediments
whose permeability to water is very low.
Confined aquifers are recharged along the margin of the basin floor through fractures in
the surrounding igneous rocks. Discharge from the aquifers occurs along localized faults
as discrete springs and by upward leakage though semi-confing lacutrine sediments (Lee,
1969).
“Because of the unsorted nature of glacial tills, water-bearing capability would thought to
be low. Sketchy information from a well (“Lundy well”) which started drilling in till
where US 395 crosses Mill Creek, indicates that the till may act as a semi-confining layer
to underlying water. The section of lake sediments exposed in the lower reaches of
Wilson Creek is 46 feet thick and rests on older stream gravels of granitic and
metamorphic rocks with cross-bedded sands. The stream sands and gravels form the best
aquifers in the Mono Basin. The stream gravels exposed beneath the lacustrine silts and
ashes in Wilson Creek are probably the source aquifer for the confined water which
discharges in the springs of Black Point and Mono Vista. Sands and gravels in the
DeChambeau well at a depth of 112 feet probably correlate with the Wilson Creek
gravels (Lee, 1969).
“Surficial soils are almost exclusively alluvial deposits of varying thicknesses consisting
of well-graded fine to coarse silty sands and sandy loams with an occasional gravel
fraction. In the central pasture area of Conway Ranch where long-term irrigation of a
natural meadow has been practiced, moderate to heavy accumulations of organic material
has occurred. Deeper into the soil profile, the project site is underlain by old lake
deposits consisting of interbedded silts, sands, and silty clays of medium density. These
lake deposits extend to depths of 90-100 feet and are, in turn, underlain by even more
ancient lake sediments extending to depths greater than 170 feet (Applied
Geotechnology, 1987).
“Groundwater in the soil profile occurs at shallow depths from near the surface in the
central pasture area of Conway Ranch but declines to 68 feet below the surface at the
southeast corner of the project site (Applied Geotechnology, 1987).
“A localized bedrock high is suspected near the middle of the project site which trends
north-south and constricts groundwater flow such that virtually all of the groundwater
from the project site‟s central basin is through a narrow area near the southeast corner of
the property (Applied Geotechnology, 1987).
It does not appear that Wilson Creek is contributing to the groundwater levels ranging
from near surface to three feet below the surface in the adjacent areas.
(Kleinfelder & Associates, 1983. Preliminary geotechnical engineering and geology
report: Conway Ranch, Mono County, California.)
25
“Surface water from the Virginia Creek Diversion Ditch and from Wilson Creek and
various diversion ditches also serves to recharge the “water table aquifer” during flood
irrigation. In the central basin area, groundwater elevations apparently are maintained
near land surface by the damming effect of the inferred bedrock high. Significant
leakage from Wilson Creek and recharge to the water table aquifer likely occurs along the
southeast trending portion of the creek, where the water table is some distance below the
bed of the creek.
“Groundwater wells were developed in June 1982 along Wilson Creek in the southeast
corner of the project site. Two production wells were drilled to a depth of approximately
200 feet, and water levels were encountered 40-50 feet below land surface. Pump tests
indicated a maximum permanent yield of 520-630 gallons per minute (gpm). Average
annual discharge was estimated in the water budget as 2.7 cfs or approximately 1200
gpm. This value represents the tradiational safe yield of groundwater. Groundwater
storage under the Conway Ranch property was estimated at 4,900 AF. (CR SP&EIR).
“The extensive low permeability layer which underlies the Recent aquifer (0-17‟ of
gravelly sand at Lee Vining Creek delta) was deposited in Lake Russell during the Tioga
glacial advance. It has been named the Wilson Creek formation and studied extensively
by Lajoie (1968). At its excellent and complete exposure along Wilson Creek just west
of Black Point, it is 22 feet thick. Along Wilson Creek, it consists primarily of light gray,
finely laminated clayey silts interbedded with 19 distinct rhyolitic ash layers, each
representing a separate eruption of the Mono Craters. It was deposited 23,000 to 12,500
years ago. Along Wilson Creek, near the top of this formation, is a thick (8-20 foot) bed
of dark basaltic cinders resulting from the eruption of the Black Point volcano.” (Lajoie,
1968)
Recharge to groundwater may be classified: 1) percolation into the Recent aquifer from
streams of the Sierra Nevada, 2) direct penetration of melt and rainfall into Recent
aquifer, 3) direct percolation into fractured rock.
In the drainage areas of the Sierra Nevada, there are no alluvial areas and no Recent
aquifer. Rain, melting snow, and local channeled runoff are able to flow into fractures,
then move through complex, interconnected fracture systems until forced to the ground
surface. Some fracture systems daylight on the slope above highway 395 and support
areas of vigorous phreatophytes. Groundwater in the Recent aquifer is flowing near the
base of these permeable deposits and is riding on the underlying clays (Wilson Creek
formation) on its way to the lake.
Applied Geotechnology study at Conway Ranch July 1987:
one test well, some pits, pump test
Depth to groundwater 5-6‟
saturated thickness of the aquifer 60‟
average annual storage capacity 4,900 AF
safe yield (annual recharge) 2.45 cfs (1,771 AF pg 29) (2,390 AF pg 133)
recharge by percolation of snowmelt from mountainous areas, infiltration of surface
water from Wilson Creek, various Conway diversion ditches, and Virginia Creek
diversion
26
groundwater flow is generally from northwest to southeast with all outflow confined in
saturated sediments which are parallel with and beneath the Wilson Creek drainage
corridor
Lee 69: Mono Vista springs discharge of 5 to 42 l/s [0.18 to 1.5 cfs] (map on pg 69)
Black Rock Point Hot Spring 4 miles away from Conway Ranch flows at 33 gallons per
minute (Kleinfelder and Associates, 1983).
In 1981, a static water depth at the Mono Lake County Park well (#26555) was 9 ft below
the ground surface (DWR record sheet).
Thompson Ranch meadow has a naturally high water table: 35-40 cm depth. The current
flood irrigation practices have maintained a water table at or near the soil surface for
about 140 years (Barry, 1997).
Water Quality
The Lahontan Basin Plan of 1975 characterizes the waters of the region as generally
excellent in quality, with total dissolved solids (TDS) levels of less than 50 parts per
million (ppm) in surface water and less than 100 ppm in groundwater. Surface water is
ionically dominated by calcium carbonate and classified as soft. Heavy metal
concentrations are below detectable limits or only present in trace amounts. There is no
turbidity, and dissolved oxygen is at or near saturation. Coliform bacteria are below
detectable limits in groundwater; surface waters were not analyzed for bacteria (Triad
Engineering, 1987).
Independent sampling by Lee (1969) in several Mono Basin streams including Mill and
Wilson Creeks found that the waters were calcilum bicarbonate type and had TDS
ranging from 31 to 81 ppm.
Water in Wilson Creek and associated ditches and various springs on the ranch is slightly
acidic (mean pH of 6.5) and of very low conductivity (mean of 33 umhos). Productivity
of the streams and springs is considered low. Water temperature in Wilson Creek ranged
from 50 to 60oF on 8-10 July 1986 and is considered slightly cooler than preferred for
some brown trout life history phases. Maximum water temperatures probably rarely
exceed 65-70oF, but fluctuate up to 15
oF on a diel basis (Beak Consultants Inc., 1986.
Conceptual stream design and support studies for the enrichment of salmonid fisheries on
the Conway Ranch near Lee Vining, CA. Portland.)
Current Water Use

27
Only limited data and estimates of evapotranspiration are available for the Mono Basin.
Evaporation pans have been monitored at a few locations and provide an index of
evaporation from small water bodies. Evaporation from a pan at Grant Lake totaled 43”,
and average evaporation from a pan floating in Mono Lake from 1957 to 1959 was 74”
(Lee, 1969). Evaporation pan data from a pan at Simis‟ place for May to October was
54” in 1981, 47” in 1982, and 49” in 1983 (??Vorster, 1985??). Two regional studies by
Harding (1935 and 1965, cited by Lee, 1969) estimated evaporation in Mono Basin as
39”. Vorster (1985) estimated an average growing season evapotranspiration rate of 24”.
The surface water evaporation rate at Conway Ranch was estimated at 40” per year
(Triad Engineering, 1987).
Most of the land currently irrigated with Los Angeles Department of Water and Power
water is in the Thompson Ranch area, south of Mill Creek. Therefore, the water
historically diverted into the two Thompson ditches would be a significant portion of
DWP water available for rewatering (Perrault, 1995).
Thompson Ranch Water Diversion Median Monthly (cfs) (Perrault, 1995)
Month A M J J A S O N D J F M
Thompson Upper 0 4 9 9 8 6 3 0 0 0 0 0
Thompson Main 0 4 10 10 7 3 0 0 0 0 0 0
Total Water Returned 0 8 19 19 15 9 3 0 0 0 0 0
Vorster (1997) provided an analysis of water requirements for Conway and Thompson
meadows:
The area of the Conway Ranch meadow (350 ac) [Conway Ranch EIR 384 ac vs. Stine
315 ac] was multiplied by an estimate of evapotranspiration of meadow grass (2 feet) to
yield 700 AF. This quantity was doubled to 1400 AF (or 4 feet over 350 ac) to get a
rough estimate of total water needed for flood irrigation. Four feet of water for 50 %
irrigation efficiency is consistent with figures used by LADWP and NRCS for pastures.
Distributing 1400 AF over a five-month growing season (May to September) resulted in
an average monthly application of about 4.5 cfs. The Conway Ranch meadow north of
Wilson Creek represents about 85% of the total Conway meadow acreage; therefore, its
irrigation requirement was calculated to be 85% of 4.5 cfs or 4 cfs.
“This 4 cfs requirement can be entirely supplied (as it apparently has for the last decade)
by the diversion from Virginia Creek (which provides 2-4 cfs) combined with natural
spring flow on the property, accretion in the drainage used by the Virginia Creek
diversion, and occasional peak snowmelt season supply from the ephemeral drainages
that drain on to the ranch” (Vorster, 1997). “The 0.5 cfs requirement (15% of 4.5 cfs) for
the meadow south of Wilson Creek, which sits in a “bowl” of high groundwater levels,
could in theory, be supplied by the excess supply (tailwater) and groundwater accretion
from north of the creek” (Vorster, 1997).
The area of Thompson meadow (100 ac) [LADWP 170 ac vs. Stine 90 ac] was multiplied
by the same consumptive use requirement as above (2 feet) and doubled to provide a
gross demand of 400 AF (or 4 feet over 100 ac). Distributing 400 AF over a five-month
growing season resulted in an average monthly application of 1.3 cfs. “The 1.3 cfs
requirement can come from several sources: a) diversions from Mill Creek transported in
a closed pipeline that reduces the infiltration losses of the existing Thompson Main ditch,
b) runoff from Upper Dechambeau Creek runs through the western portion of the
Thompson Ranch and a portion is used to convey the Mill Creek water to the Ranch ditch
28
system. The 1.3 cfs requirement is less than the Simis right (1.8 cfs) to Mill Creek water.
Currently Simis does not use her Mill Creek right, which historically was transported
through the Upper Thompson and Sylvester-McPherson ditch system. Her meadow is
irrigated with Dechambeau Creek, which runs through her property” (Vorster, 1997).
“Evapotranspiration requirements for meadow areas are less than 2 feet per year. True
evapotranspiration requirements need to be doubled when using flood irrigation due to
the inefficiency of this method. Thus, Thompson Ranch would require about 320
AF/year and Conway Ranch would require about 1280 AF/year. Much higher rates are
currently being applied than is required to maintain green meadows. A more efficient
irrigation system will promote grasses [instead of rushes and sedges] which are better
pasture for grazing animals (Barry, 1997).
The volume of water diverted from Virginia Creek to Conway Ranch can be up to 2500
AF annually (Fox, 1964; cited by Lee, 1969).
“In recent years, nearly all of the flow in Wilson Creek through Conway Ranch is water
in excess of the demands of the water right holders since the USFS is generally not using
its right on Dechambeau Ranch, and the Conway Ranch has no major diversions from
Wilson Creek on the Ranch property (the two diversions that supply the Conway land
south of Wilson Creek divert upstream from the property boundary)” (Vorster, 1997).
“A large portion of diverted water is never applied to pasture lands, but rather sent across
the Conway lands and on to Mono Lake. This has been particularly true in the past 10
years, when water earmarked for the Upper Conway Ditch has been diverted instead into
Wilson Creek. For the past ~10 years, the upslope (north of Wilson Creek) part of
Conway Ranch has been irrigated without the use of Mill Creek water (Stine, 1997).
An estimate of water use in Mono City was about 27 AF per year with about half of that
amount lost to the atmosphere (Vorster, 1985).
Water Rights
Early rights to appropriate water from streams in the north Mono Basin were established
as farmers and ranchers constructed the first diversion ditches to redirect water on to their
lands. A court decision in 1901 formalized some of these rights (Vorster, 1997), but the
principal adjudication of water rights to Mill Creek was a judgment and decree by the
Mono County Court on November 30, 1914 (Perrault, 1995).
At least four versions of the priority of appropriative water rights appear in different
documents (Triad Engineering, 1988; Perrault, 1995; Stine, 1995; Vorster, 1997).
Triad Engineering, 1988: Water Rights Summary
Original Volume Cumulative
Priority Claimant Lands (cfs) Volume (cfs)
1 N.C.P. Co. S1/2N1/2 Sec15-2N-25 1.0 1.0
2 J. A. Conway Conway 12.0 13.0
3 Cain Irr. Co. Miller Ranch 6.0 19.0
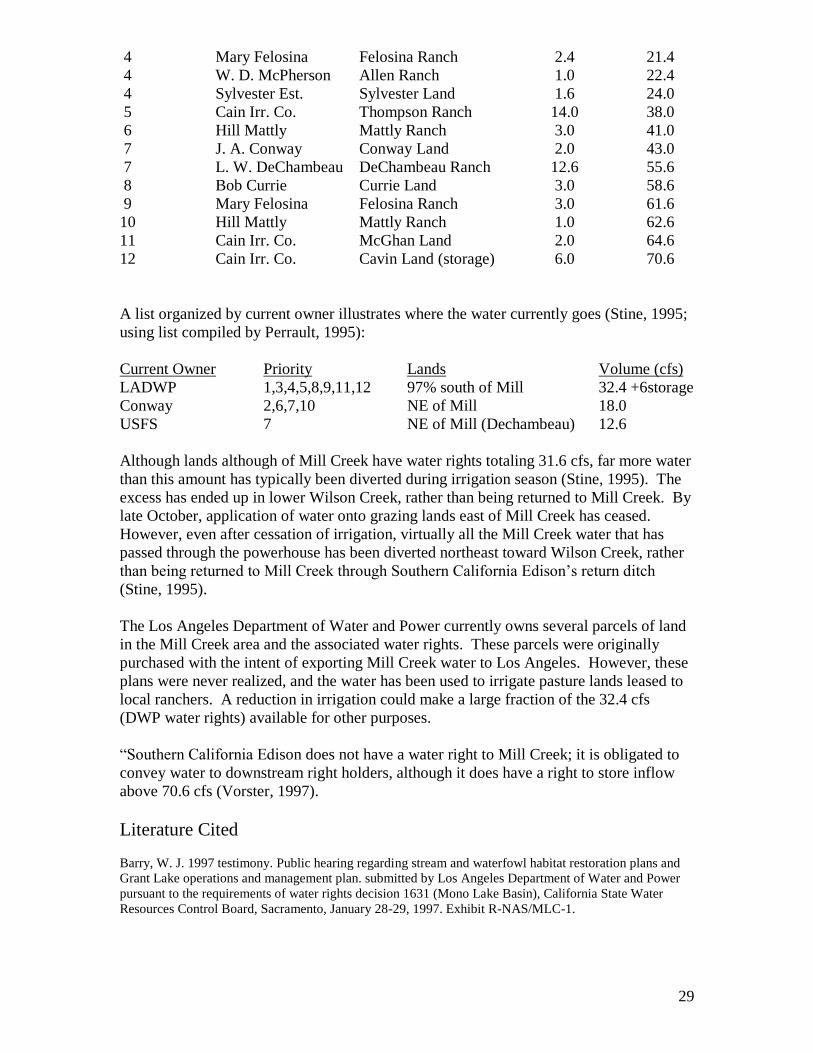
29
4 Mary Felosina Felosina Ranch 2.4 21.4
4 W. D. McPherson Allen Ranch 1.0 22.4
4 Sylvester Est. Sylvester Land 1.6 24.0
5 Cain Irr. Co. Thompson Ranch 14.0 38.0
6 Hill Mattly Mattly Ranch 3.0 41.0
7 J. A. Conway Conway Land 2.0 43.0
7 L. W. DeChambeau DeChambeau Ranch 12.6 55.6
8 Bob Currie Currie Land 3.0 58.6
9 Mary Felosina Felosina Ranch 3.0 61.6
10 Hill Mattly Mattly Ranch 1.0 62.6
11 Cain Irr. Co. McGhan Land 2.0 64.6
12 Cain Irr. Co. Cavin Land (storage) 6.0 70.6
A list organized by current owner illustrates where the water currently goes (Stine, 1995;
using list compiled by Perrault, 1995):
Current Owner Priority Lands Volume (cfs)
LADWP 1,3,4,5,8,9,11,12 97% south of Mill 32.4 +6storage
Conway 2,6,7,10 NE of Mill 18.0
USFS 7 NE of Mill (Dechambeau) 12.6
Although lands although of Mill Creek have water rights totaling 31.6 cfs, far more water
than this amount has typically been diverted during irrigation season (Stine, 1995). The
excess has ended up in lower Wilson Creek, rather than being returned to Mill Creek. By
late October, application of water onto grazing lands east of Mill Creek has ceased.
However, even after cessation of irrigation, virtually all the Mill Creek water that has
passed through the powerhouse has been diverted northeast toward Wilson Creek, rather
than being returned to Mill Creek through Southern California Edison‟s return ditch
(Stine, 1995).
The Los Angeles Department of Water and Power currently owns several parcels of land
in the Mill Creek area and the associated water rights. These parcels were originally
purchased with the intent of exporting Mill Creek water to Los Angeles. However, these
plans were never realized, and the water has been used to irrigate pasture lands leased to
local ranchers. A reduction in irrigation could make a large fraction of the 32.4 cfs
(DWP water rights) available for other purposes.
“Southern California Edison does not have a water right to Mill Creek; it is obligated to
convey water to downstream right holders, although it does have a right to store inflow
above 70.6 cfs (Vorster, 1997).
Literature Cited
Barry, W. J. 1997 testimony. Public hearing regarding stream and waterfowl habitat restoration plans and
Grant Lake operations and management plan. submitted by Los Angeles Department of Water and Power
pursuant to the requirements of water rights decision 1631 (Mono Lake Basin), California State Water
Resources Control Board, Sacramento, January 28-29, 1997. Exhibit R-NAS/MLC-1.
30
Beak Consultants, Inc. 1986. Conceptual stream design and support studies for the enhancement of
salmonid fisheries on the Conway Ranch. Modified version appears in Appendix E of Triad Engineers
1988.
Beak Consultants, Inc. 1987. Hydrology and water resources study for Conway Ranch at Mono Lake.
Modified version appears as Appendix B of Triad Engineers 1988.
Beak Consultants, Inc. 1988. Biological resources study. In Appendix E of Triad Engineers 1988.
California Department of Fish and Game, 1996. Instream flow and habitat development investigations for
Mill Creek, Mono County, California. prepared by Foster Wheeler Environmental Corporation, Water
Engineering and Technology, R2 Resource Consultants, and California Department of Fish and Game.
Resources Agency, Sacramento, Stream Evaluation Report 96-1, 163 pp.
California Department of Fish and Game, 1998. Instream flow and habitat development investigations for
Wilson Creek, Mono County, California. prepared by Foster Wheeler Environmental Corporation, Water
Engineering and Technology, R2 Resource Consultants, and California Department of Fish and Game.
Resources Agency, Sacramento, Stream Evaluation Report 98-1, DRAFT edition.
Harrison, L. L., 1997. testimony. Public hearing regarding stream and waterfowl habitat restoration plans
and Grant Lake operations and management plan. submitted by Los Angeles Department of Water and
Power pursuant to the requirements of water rights decision 1631 (Mono Lake Basin), California State
Water Resources Control Board, Sacramento, January 28-29, 1997. Exhibit R-NAS/MLC-1.
Jacobs, D., 1997. testimony. Public hearing regarding stream and waterfowl habitat restoration plans and
Grant Lake operations and management plan. submitted by Los Angeles Department of Water and Power
pursuant to the requirements of water rights decision 1631 (Mono Lake Basin), California State Water
Resources Control Board, Sacramento, January 28-29, 1997. Exhibit R-NAS/MLC-1.
Lee, K., 1969. Infrared exploration for shoreline springs at Mono Lake, California test site. Stanford
Remote Sensing Laboratory, Technical Report 69-7.
Perrault, J. R., 1995. Mill Creek report. in Mono Basin Waterfowl Habitat Restoration Plan, Los Angeles
Department of Water and Power. Appendix E to Appendix 1 (Drewien, Reid, and Radcliff), 20 pp.
Russell, I. C.,1889. Quaternary history of Mono Valley, California. Reprinted (1984) from the Eighth
Annual Report of the U.S. Geological Survey, 1889, pg. 267-394. Artemisia Press. Lee Vining.
Stine, S. 1991. Extent of riparian vegetation on streams tributary to Mono Lake, 1930-1940: An
assessment of the streamside woodlands and wetlands, and the environmental conditions that supported
them. Report to the California State Water Resources Control Board and Jones and Stokes Associates,
Sacramento, 59 pp.
Stine, S., 1995. Restoration of degraded riparian, wetland, and deltaic environments on Mill Creek, Mono
County, California in Mono Basin Waterfowl Habitat Restoration Plan, Los Angeles Department of Water
and Power. Appendix E to Appendix 1 (Drewien, Reid, and Radcliff), 23 pp.
Triad Engineering, 1987. Drainage and flood hydrology study. Appendix D to Conway Ranch DEIR.
Mammoth Lakes.
Triad Engineering, 1988. Conway Ranch combined Specific Plan and draft environmental impact report.
State Clearing House #87092804. Mammoth Lakes.
U.S. Forest Service, 1997. Mill Creek stream condition inventory status report. Inyo National Forest,
Bishop, 10 pp.
Varnell, K., 1997. SCE memo to Nino Mascolo, Jan.16, 1997. on file MLC

31
Von Schmidt, A. W.,1856. Field notes: Survey of Township 2 North, Range 26 East, Mt. Diablo Meridian,
California. U.S. Bureau of Land Management, Sacramento. Cited by Dept. of Fish and Game, 1986.
Vorster, P., 1985. A water balance forecast model for Mono Lake, California. M.A. thesis, California
State University, Hayward.
Vorster, P., 1997. Testimony. Public hearing regarding stream and waterfowl habitat restoration plans and
Grant Lake operations and management plan. submitted by Los Angeles Department of Water and Power
pursuant to the requirements of water rights decision 1631 (Mono Lake Basin), California State Water
Resources Control Board, Sacramento, January 28-29, 1997. Exhibit R-NAS/MLC-1.

32
Appendix C
Spreadsheet Documentation Peter Vorster, Hydrologist 2001
Dry Norm Wet Dry Norm Wet Dry Norm Wet Dry Norm Wet Dry Norm Wet
1994 1993 1995 1994 1993 1995 1994 1993 1995 1994 1993 1995 1994 1993 1995
CURRENT CONDITIONS
Apr May Jun Jul Aug
Mill Creek Flows
a. Unimpaired a t Lundy Reservoir 10.8 20.7 21.4 35.5 62.3 51.6 49.1 86.0 137.6 18.8 100.6 178.2 8.8 40.0 95.6
b. Impaired a t Lundy Reservoir 10.5 25.2 25.1 34.2 48.4 46.3 36.3 54.0 98.6 31.9 88.4 165.4 17.5 52.6 99.1
c . Release/ Seepage from Dam to Mill 0.0 0.0 0.0 0.1 0.0 0.0 1.9 0.6 31.8 1.7 9.5 98.2 0.2 7.3 31.4
d. Mill a t 395 5.0 6.0 30.2 4.1 0.5 5.7 3.4 0.0 37.0 2.6 7.2 100.4 0.0 5.5 33.6
e. Mill a t Cemetery Rd. 1.1 1.9 22.6 0.3 0.0 1.6 0.0 0.0 28.4 0.0 2.9 82.8 0.0 1.4 25.5
f. Mill a t Mono Lake 0.0 0.8 20.7 0.0 0.0 0.5 0.0 0.0 26.3 0.0 1.8 78.3 0.0 0.4 23.5
Wilson Creek Flows
g. Lundy Ta ilrac e 10.4 25.2 25.1 34.1 48.4 46.3 32.5 52.7 60.4 24.4 57.0 58.5 14.7 37.8 57.6
h. Wilson a t 395 10.4 25.2 25.1 31.5 44.5 46.3 27.6 48.0 60.4 18.9 49.6 58.5 14.3 32.9 57.6
i. Wilson below Bowl Diversion 8.4 19.2 19.1 27.5 38.5 40.3 21.6 42.0 54.4 16.9 43.6 52.5 9.3 26.9 51.6
j. Wilson leaving Conway property 9.4 22.2 22.1 30.0 42.5 44.3 25.1 46.0 58.4 18.4 47.6 56.5 12.3 30.9 55.6
k. Wilson a t 167 7.4 19.3 19.2 26.5 38.3 40.0 22.0 41.5 53.2 15.7 43.0 51.4 10.0 27.4 50.5
l. Wilson a t Cemetery Rd. 5.8 17.1 17.0 24.0 35.1 36.7 19.7 38.2 49.2 13.7 39.6 47.5 8.3 24.8 46.7
Dry Norm Wet Dry Norm Wet Dry Norm Wet Dry Norm Wet Dry Norm Wet Dry Norm Wet Dry Norm Wet
1994 1993 1995 1994 1993 1995 1994 1993 1995 1994 1993 1995 1994 1993 1995 1994 1993 1995 1994 1993 1995 1994 1993 1995
Sep Oct Nov Dec Jan Feb Mar Total ac-ft
6.6 16.1 39.9 7.2 8.6 17.3 8.9 6.6 11.0 8.2 6.6 11.4 9.5 5.2 10.1 9.2 5.3 14.5 15.4 6.5 15.4 11,357 22,124 36,638
9.8 22.6 53.2 6.4 13.5 21.1 6.3 11.2 12.8 6.3 11.1 12.1 6.3 10.0 11.5 7.6 4.7 17.3 29.5 4.8 38.0 12,323 21,079 36,532
0.0 4.2 5.7 0.0 2.5 3.9 0.0 1.4 2.8 0.0 0.6 2.2 0.0 0.1 1.7 0.0 0.0 1.6 0.0 0.0 0.7
1.1 8.4 10.2 1.7 7.4 10.5 3.9 7.2 10.8 4.0 6.6 10.2 4.0 6.1 10.5 4.0 6.0 11.8 4.0 6.0 12.4
0.0 4.0 5.4 0.0 3.1 5.7 0.1 2.9 6.0 0.2 2.4 5.4 0.2 2.0 5.7 0.2 1.9 6.9 0.2 1.9 7.3 123 1,471 12,377
0.0 2.8 4.2 0.0 2.0 4.5 0.0 1.8 4.7 0.0 1.3 4.2 0.0 0.9 4.5 0.0 0.8 5.6 0.0 0.8 6.1
9.8 16.1 47.5 6.4 10.9 17.2 6.3 9.8 10.0 6.3 9.9 9.9 6.3 9.8 9.8 7.6 4.7 15.7 29.5 4.8 37.3 11,454 17,465 24,054
9.8 15.0 47.5 6.4 10.9 17.2 6.3 9.8 9.3 6.3 9.9 7.7 6.3 9.8 6.0 7.6 4.7 10.5 29.5 4.8 30.6
3.8 12.0 44.5 3.4 7.9 14.2 6.3 9.8 9.3 6.3 9.9 7.7 6.3 9.8 6.0 7.6 4.7 10.5 26.5 1.8 27.6
7.3 14.5 47.0 4.9 9.4 15.7 6.3 9.8 9.3 6.3 9.9 7.7 6.3 9.8 6.0 7.6 4.7 10.5 28.0 3.3 29.1
5.4 12.1 42.5 3.1 7.3 13.2 4.4 7.7 7.2 4.4 7.8 5.7 4.4 7.7 4.2 5.6 2.9 8.3 24.7 1.6 25.8 8,130 13,181 19,536
3.9 10.3 39.1 1.7 5.8 11.4 3.0 6.1 5.6 3.0 6.2 4.2 3.0 6.1 2.8 4.1 1.6 6.7 22.2 0.3 23.2 6,842 11,631 17,656
Ac re-feet tota ls are approximate exc ept for bold numbers. All negative numbers are shown as zero.
This sc enario assumes c urrent c ond itions (as they existed in the year shown). This is the only sc enario that assumes losses in the return d itc h.
Sourc es of data for this sc enario:
a . Data from SCE for the year shown.
b . Data from SCE for the year shown.
c . Data from SCE for the year shown.
d . Dam releases and seepage p lus estimated ga ins minus Thompson and Simis d iversions p lus return d itc h (with 3c fs loss in the return d itc h).
e. Wilson's IFIM equation for the 2.7 mile reac h. This results in lower losses below Mono City than FS measurements show in the reac h above Mono City (a lthough higher losses than USFS Sept. 2001 measurements). A more deta iled study is needed.
f. Uses Wilson's IFIM equation for the 0.8 mile reac h (1990 length).
g . Data from SCE for the year shown.
h. Ta ilrac e - return d itc h
i. Wilson a t 395 minus south Conway d iversions. South Conway d iversions are the sum of Bell and Bowl d iversions whic h are estimates derived from Conway Ranc h EIR hydrology worksheets. Va lues c onsistent with visua l observations.
j. Wilson a t 395 minus south Conway d iversions, p lus ha lf of the sum of south Conway and Virg inia Creek runoff minus 1, 2, or 0 depending on month. If 395-SC is less than zero, then treat tha t number as zero.
k. Uses IFIM equation for the 1.22 mile reac h.
l. Uses IFIM equation for the 0.98 mile reac h. This is a c onservative estimate, sinc e rec ent measurements by the USFS show higher losses a t higher flows.

33
Dry Norm Wet Dry Norm Wet Dry Norm Wet Dry Norm Wet Dry Norm Wet
1994 1993 1995 1994 1993 1995 1994 1993 1995 1994 1993 1995 1994 1993 1995
MONO COUNTY WATER RIGHTS
Apr May Jun Jul Aug
Mill Creek Flows
Unimpaired a t Lundy Reservoir 10.8 20.7 21.4 35.5 62.3 51.6 49.1 86.0 137.6 18.8 100.6 178.2 8.8 40.0 95.6
Impaired a t Lundy Reservoir 10.5 25.2 25.1 34.2 48.4 46.3 36.3 54.0 98.6 31.9 88.4 165.4 17.5 52.6 99.1
Release/ Seepage from Dam to Mill 0.0 0.0 0.0 0.1 0.0 0.0 1.9 0.6 31.8 1.7 9.5 98.2 0.2 7.3 31.4
Mill a t 395 6.0 19.2 21.1 27.3 40.1 38.4 29.9 49.2 89.4 25.5 64.5 156.5 10.1 42.6 90.2
Mill a t Cemetery Rd. 1.9 13.2 14.8 20.1 31.1 29.7 22.4 38.9 73.3 18.5 52.0 130.8 5.4 33.2 74.1
Mill a t Mono Lake 0.9 11.7 13.2 18.3 28.8 27.4 20.5 36.3 69.2 16.8 48.8 124.3 4.2 30.9 69.9
Wilson Creek Flows
Lundy Ta ilrace 10.4 25.2 25.1 32.8 48.7 45.0 33.1 57.2 65.2 28.8 64.6 65.9 16.0 43.9 66.4
Wilson a t 395 9.4 12.0 12.0 10.7 15.7 15.7 10.7 15.7 16.7 10.7 16.7 16.7 10.7 15.7 16.7
Wilson below Bowl Diversion 1.4 4.0 4.0 2.7 7.7 7.7 2.7 7.7 8.7 2.7 8.7 8.7 2.7 7.7 8.7
Wilson leaving Conway property 9.4 12.0 12.0 10.9 16.4 16.4 10.9 16.4 17.4 10.9 17.4 17.4 10.9 16.4 17.4
Wilson a t 167 7.4 9.7 9.7 8.7 13.9 13.9 8.7 13.9 14.8 8.7 14.8 14.8 8.7 13.9 14.8
Wilson a t Cemetery Rd. 5.8 8.1 8.1 7.1 12.0 12.0 7.1 12.0 12.8 7.1 12.8 12.8 7.1 12.0 12.8
1994 1993 1995 1994 1993 1995 1994 1993 1995 1994 1993 1995 1994 1993 1995 1994 1993 1995 1994 1993 1995 1994 1993 1995
Sep Oct Nov Dec Jan Feb Mar Total ac-ft
6.6 16.1 39.9 7.2 8.6 17.3 8.9 6.6 11.0 8.2 6.6 11.4 9.5 5.2 10.1 9.2 5.3 14.5 15.4 6.5 15.4 11,357 22,124 36,638
9.8 22.6 53.2 6.4 13.5 21.1 6.3 11.2 12.8 6.3 11.1 12.1 6.3 10.0 11.5 7.6 4.7 17.3 29.5 4.8 38.0 12,323 21,079 36,532
0.0 4.2 5.7 0.0 2.5 3.9 0.0 1.4 2.8 0.0 0.6 2.2 0.0 0.1 1.7 0.0 0.0 1.6 0.0 0.0 0.7
5.6 17.7 45.3 5.5 10.5 19.1 5.0 8.4 11.8 5.0 7.6 11.2 5.0 7.1 10.7 5.0 7.0 13.3 21.5 7.0 34.0
1.5 11.9 35.6 1.4 5.8 13.1 1.0 3.9 6.8 1.0 3.2 6.3 1.0 2.8 5.9 1.0 2.7 8.2 15.1 2.7 25.9 5,506 12,262 25,816
0.5 10.5 33.1 0.4 4.5 11.6 0.0 2.8 5.6 0.0 2.1 5.1 0.0 1.7 4.7 0.0 1.6 6.8 13.5 1.6 23.8
8.5 17.1 46.2 6.4 10.9 17.2 6.3 9.8 10.0 6.3 9.9 9.9 6.3 9.8 9.8 7.6 4.7 15.7 29.5 4.8 37.3 11,686 18,652 25,169
7.5 10.7 15.7 5.4 9.9 12.0 5.3 8.8 9.0 5.3 8.9 8.9 5.3 8.8 8.8 6.6 3.7 12.0 12.0 3.8 12.0
0.0 2.7 7.7 2.4 6.9 9.0 2.3 5.8 6.0 2.3 5.9 5.9 2.3 5.8 5.8 3.6 0.7 9.0 9.0 0.8 9.0
7.7 11.4 16.4 5.4 9.9 12.0 5.3 8.8 9.0 5.3 8.9 8.9 5.3 8.8 8.8 6.6 3.7 12.0 12.0 3.8 12.0
5.8 9.2 13.9 3.5 7.8 9.7 3.5 6.8 6.9 3.5 6.8 6.9 3.5 6.8 6.8 4.7 2.0 9.7 9.7 2.1 9.7 4,646 6,541 8,011
4.3 7.5 12.0 2.2 6.2 8.1 2.1 5.2 5.4 2.1 5.3 5.3 2.1 5.2 5.2 3.2 0.7 8.1 8.1 0.8 8.1 3,540 5,336 6,729
Notes
Acre-feet tota ls a re approximate except for bold numbers. All negative numbers a re shown as zero.
This scenario assumes a ll water in excess of Mono County water rights is returned to Mill in a p ipeline. The only d iversions a re for irriga ting meadows with approx. 4 ft of water per ac re and
South Conway d iversions of 8 c fs Apr-Sept and 3 c fs Oc t-Mar. for fish rearing and irriga tion.
Sources of da ta for this scenario:
a . Data from SCE for the year shown.
b . Data from SCE for the year shown.
c . Data from SCE for the year shown.
d . Dam releases and seepage p lus estimated ga ins minus Thompson d iversions of .9c fs May-Sept.(4ac ft/ ac ) p lus return d itch (ta ilrace-Wilson@395).
e. Wilson's IFIM equation for the 2.7 mile reach. This results in lower losses below Mono City than FS measurements show in the reach above Mono City (a lthough higher losses than USFS Sept. 2001 measurements). A more deta iled study is needed.
f. Uses Wilson's IFIM equation for the 0.8 mile reach (1990 leng th).
g . Data from SCE + ac tua l upper Conway - Mattly irriga tion d iversion (1.3c fs may-sept or 3.9 ac ft/ ac )
h. Ta ilrace - water in excess of Mono County rights. Excess water equation based on the equation found in p rior scenario spreadsheets.
i. Wilson a t 395 minus south Conway d iversions. South Conway d iversions a re the sum of Bell and Bowl d iversions which a re 8 c fs Apr-Sept. and 3 c fs the rest of the year, or whatever is ava ilab le.
j. Wilson a t 395 minus 0.3 c fs evapotransp ira tion (2 ac ft/ ac ) May-Sept., p lus ha lf VA Cr runoff -1, 2, or 0 depend ing on month.
k. Uses IFIM equation for the 1.22 mile reach.
l. Uses IFIM equation for the 0.98 mile reach. This is a conserva tive estimate, since recent measurements by the USFS show higher losses a t higher flows.
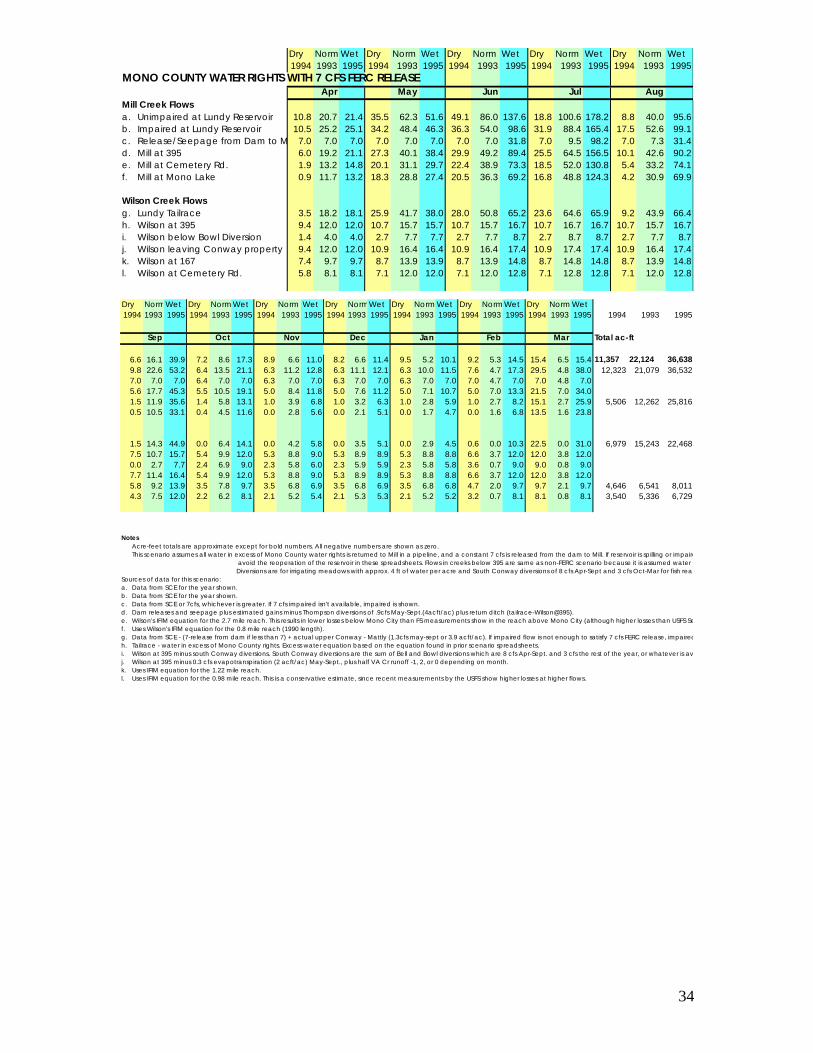
34
Dry Norm Wet Dry Norm Wet Dry Norm Wet Dry Norm Wet Dry Norm Wet
1994 1993 1995 1994 1993 1995 1994 1993 1995 1994 1993 1995 1994 1993 1995
MONO COUNTY WATER RIGHTS WITH 7 CFS FERC RELEASE
Apr May Jun Jul Aug
Mill Creek Flows
a. Unimpaired a t Lundy Reservoir 10.8 20.7 21.4 35.5 62.3 51.6 49.1 86.0 137.6 18.8 100.6 178.2 8.8 40.0 95.6
b. Impa ired a t Lundy Reservoir 10.5 25.2 25.1 34.2 48.4 46.3 36.3 54.0 98.6 31.9 88.4 165.4 17.5 52.6 99.1
c . Release/ Seepage from Dam to Mill 7.0 7.0 7.0 7.0 7.0 7.0 7.0 7.0 31.8 7.0 9.5 98.2 7.0 7.3 31.4
d. Mill a t 395 6.0 19.2 21.1 27.3 40.1 38.4 29.9 49.2 89.4 25.5 64.5 156.5 10.1 42.6 90.2
e. Mill a t Cemetery Rd. 1.9 13.2 14.8 20.1 31.1 29.7 22.4 38.9 73.3 18.5 52.0 130.8 5.4 33.2 74.1
f. Mill a t Mono Lake 0.9 11.7 13.2 18.3 28.8 27.4 20.5 36.3 69.2 16.8 48.8 124.3 4.2 30.9 69.9
Wilson Creek Flows
g. Lundy Ta ilrace 3.5 18.2 18.1 25.9 41.7 38.0 28.0 50.8 65.2 23.6 64.6 65.9 9.2 43.9 66.4
h. Wilson a t 395 9.4 12.0 12.0 10.7 15.7 15.7 10.7 15.7 16.7 10.7 16.7 16.7 10.7 15.7 16.7
i. Wilson below Bowl Diversion 1.4 4.0 4.0 2.7 7.7 7.7 2.7 7.7 8.7 2.7 8.7 8.7 2.7 7.7 8.7
j. Wilson leaving Conway property 9.4 12.0 12.0 10.9 16.4 16.4 10.9 16.4 17.4 10.9 17.4 17.4 10.9 16.4 17.4
k. Wilson a t 167 7.4 9.7 9.7 8.7 13.9 13.9 8.7 13.9 14.8 8.7 14.8 14.8 8.7 13.9 14.8
l. Wilson a t Cemetery Rd. 5.8 8.1 8.1 7.1 12.0 12.0 7.1 12.0 12.8 7.1 12.8 12.8 7.1 12.0 12.8
Dry NormWet Dry Norm Wet Dry Norm Wet Dry NormWet Dry Norm Wet Dry Norm Wet Dry Norm Wet
1994 1993 1995 1994 1993 1995 1994 1993 1995 1994 1993 1995 1994 1993 1995 1994 1993 1995 1994 1993 1995 1994 1993 1995
Sep Oct Nov Dec Jan Feb Mar Total ac-ft
6.6 16.1 39.9 7.2 8.6 17.3 8.9 6.6 11.0 8.2 6.6 11.4 9.5 5.2 10.1 9.2 5.3 14.5 15.4 6.5 15.4 11,357 22,124 36,638
9.8 22.6 53.2 6.4 13.5 21.1 6.3 11.2 12.8 6.3 11.1 12.1 6.3 10.0 11.5 7.6 4.7 17.3 29.5 4.8 38.0 12,323 21,079 36,532
7.0 7.0 7.0 6.4 7.0 7.0 6.3 7.0 7.0 6.3 7.0 7.0 6.3 7.0 7.0 7.0 4.7 7.0 7.0 4.8 7.0
5.6 17.7 45.3 5.5 10.5 19.1 5.0 8.4 11.8 5.0 7.6 11.2 5.0 7.1 10.7 5.0 7.0 13.3 21.5 7.0 34.0
1.5 11.9 35.6 1.4 5.8 13.1 1.0 3.9 6.8 1.0 3.2 6.3 1.0 2.8 5.9 1.0 2.7 8.2 15.1 2.7 25.9 5,506 12,262 25,816
0.5 10.5 33.1 0.4 4.5 11.6 0.0 2.8 5.6 0.0 2.1 5.1 0.0 1.7 4.7 0.0 1.6 6.8 13.5 1.6 23.8
1.5 14.3 44.9 0.0 6.4 14.1 0.0 4.2 5.8 0.0 3.5 5.1 0.0 2.9 4.5 0.6 0.0 10.3 22.5 0.0 31.0 6,979 15,243 22,468
7.5 10.7 15.7 5.4 9.9 12.0 5.3 8.8 9.0 5.3 8.9 8.9 5.3 8.8 8.8 6.6 3.7 12.0 12.0 3.8 12.0
0.0 2.7 7.7 2.4 6.9 9.0 2.3 5.8 6.0 2.3 5.9 5.9 2.3 5.8 5.8 3.6 0.7 9.0 9.0 0.8 9.0
7.7 11.4 16.4 5.4 9.9 12.0 5.3 8.8 9.0 5.3 8.9 8.9 5.3 8.8 8.8 6.6 3.7 12.0 12.0 3.8 12.0
5.8 9.2 13.9 3.5 7.8 9.7 3.5 6.8 6.9 3.5 6.8 6.9 3.5 6.8 6.8 4.7 2.0 9.7 9.7 2.1 9.7 4,646 6,541 8,011
4.3 7.5 12.0 2.2 6.2 8.1 2.1 5.2 5.4 2.1 5.3 5.3 2.1 5.2 5.2 3.2 0.7 8.1 8.1 0.8 8.1 3,540 5,336 6,729
Notes
Acre-feet tota ls a re approximate except for bold numbers. All negative numbers a re shown as zero.
This scenario assumes a ll water in excess of Mono County water rights is returned to Mill in a p ipeline, and a constant 7 c fs is re leased from the dam to Mill. If reservoir is sp illing or impa ired flow is less than 7, ac tua l flow is re leased. Flows less th nario as
avoid the reopera tion of the reservoir in these spreadsheets. Flows in c reeks below 395 a re same as non-FERC scenario because it is assumed water rights water would be taken from Mill to Wilson in a p ipeline.
Diversions a re for irriga ting meadows with approx. 4 ft of water per ac re and South Conway d iversions of 8 c fs Apr-Sept and 3 c fs Oc t-Mar for fish rearing and irriga tion.
Sources of da ta for this scenario:
a . Data from SCE for the year shown.
b . Data from SCE for the year shown.
c . Data from SCE or 7c fs, whichever is g rea ter. If 7 c fs impa ired isn't ava ilab le, impa ired is shown.
d . Dam releases and seepage p lus estimated ga ins minus Thompson d iversions of .9c fs May-Sept.(4ac ft/ ac ) p lus return d itch (ta ilrace-Wilson@395).
e. Wilson's IFIM equation for the 2.7 mile reach. This results in lower losses below Mono City than FS measurements show in the reach above Mono City (a lthough higher losses than USFS Sept. 2001 measurements). A more deta iled study is needed.
f. Uses Wilson's IFIM equation for the 0.8 mile reach (1990 leng th).
g . Data from SCE - (7-release from dam if less than 7) + ac tua l upper Conway - Mattly (1.3c fs may-sept or 3.9 ac ft/ ac ). If impa ired flow is not enough to sa tisfy 7 c fs FERC release, impa ired is re leased from the dam and zero is shown here.
h. Ta ilrace - water in excess of Mono County rights. Excess water equation based on the equation found in p rior scenario spreadsheets.
i. Wilson a t 395 minus south Conway d iversions. South Conway d iversions a re the sum of Bell and Bowl d iversions which a re 8 c fs Apr-Sept. and 3 c fs the rest of the year, or whatever is ava ilab le.
j. Wilson a t 395 minus 0.3 c fs evapotransp ira tion (2 ac ft/ ac ) May-Sept., p lus ha lf VA Cr runoff -1, 2, or 0 depend ing on month.
k. Uses IFIM equation for the 1.22 mile reach.
l. Uses IFIM equation for the 0.98 mile reach. This is a conserva tive estimate, since recent measurements by the USFS show higher losses a t higher flows.
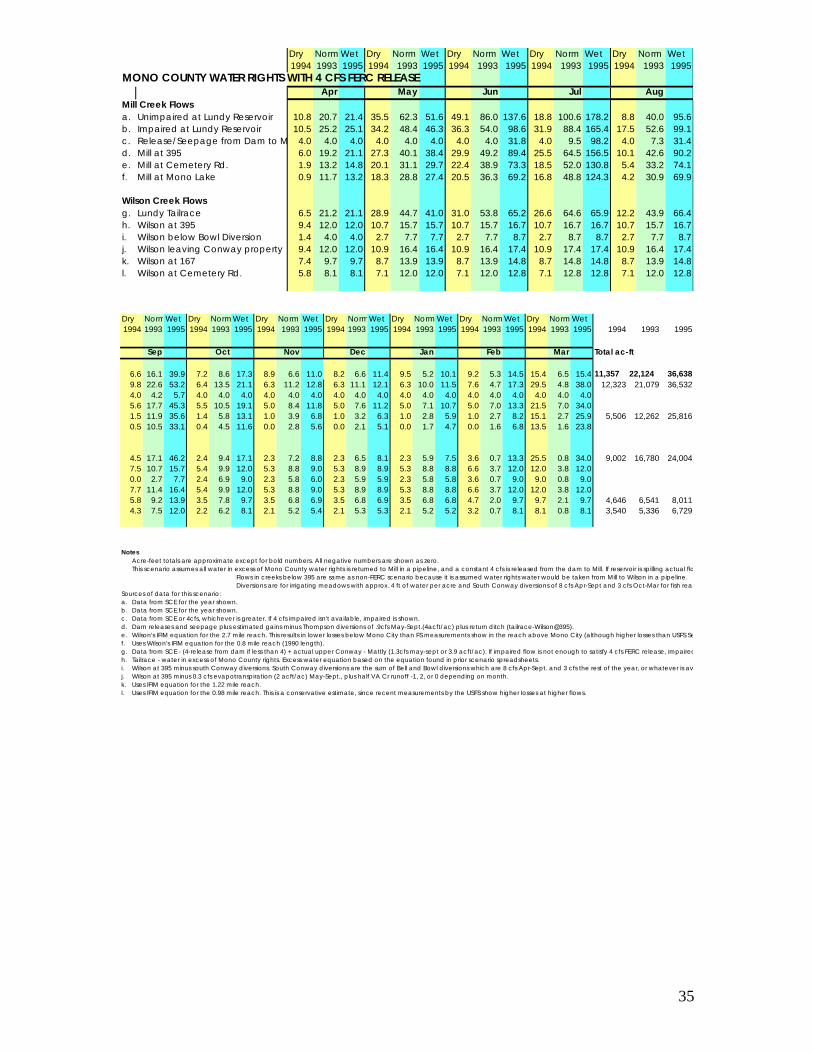
35
Dry Norm Wet Dry Norm Wet Dry Norm Wet Dry Norm Wet Dry Norm Wet
1994 1993 1995 1994 1993 1995 1994 1993 1995 1994 1993 1995 1994 1993 1995
MONO COUNTY WATER RIGHTS WITH 4 CFS FERC RELEASE
Apr May Jun Jul Aug
Mill Creek Flows
a. Unimpaired a t Lundy Reservoir 10.8 20.7 21.4 35.5 62.3 51.6 49.1 86.0 137.6 18.8 100.6 178.2 8.8 40.0 95.6
b. Impa ired a t Lundy Reservoir 10.5 25.2 25.1 34.2 48.4 46.3 36.3 54.0 98.6 31.9 88.4 165.4 17.5 52.6 99.1
c . Release/ Seepage from Dam to Mill 4.0 4.0 4.0 4.0 4.0 4.0 4.0 4.0 31.8 4.0 9.5 98.2 4.0 7.3 31.4
d. Mill a t 395 6.0 19.2 21.1 27.3 40.1 38.4 29.9 49.2 89.4 25.5 64.5 156.5 10.1 42.6 90.2
e. Mill a t Cemetery Rd. 1.9 13.2 14.8 20.1 31.1 29.7 22.4 38.9 73.3 18.5 52.0 130.8 5.4 33.2 74.1
f. Mill a t Mono Lake 0.9 11.7 13.2 18.3 28.8 27.4 20.5 36.3 69.2 16.8 48.8 124.3 4.2 30.9 69.9
Wilson Creek Flows
g. Lundy Ta ilrace 6.5 21.2 21.1 28.9 44.7 41.0 31.0 53.8 65.2 26.6 64.6 65.9 12.2 43.9 66.4
h. Wilson a t 395 9.4 12.0 12.0 10.7 15.7 15.7 10.7 15.7 16.7 10.7 16.7 16.7 10.7 15.7 16.7
i. Wilson below Bowl Diversion 1.4 4.0 4.0 2.7 7.7 7.7 2.7 7.7 8.7 2.7 8.7 8.7 2.7 7.7 8.7
j. Wilson leaving Conway property 9.4 12.0 12.0 10.9 16.4 16.4 10.9 16.4 17.4 10.9 17.4 17.4 10.9 16.4 17.4
k. Wilson a t 167 7.4 9.7 9.7 8.7 13.9 13.9 8.7 13.9 14.8 8.7 14.8 14.8 8.7 13.9 14.8
l. Wilson a t Cemetery Rd. 5.8 8.1 8.1 7.1 12.0 12.0 7.1 12.0 12.8 7.1 12.8 12.8 7.1 12.0 12.8
Dry NormWet Dry Norm Wet Dry Norm Wet Dry NormWet Dry Norm Wet Dry Norm Wet Dry Norm Wet
1994 1993 1995 1994 1993 1995 1994 1993 1995 1994 1993 1995 1994 1993 1995 1994 1993 1995 1994 1993 1995 1994 1993 1995
Sep Oct Nov Dec Jan Feb Mar Total ac-ft
6.6 16.1 39.9 7.2 8.6 17.3 8.9 6.6 11.0 8.2 6.6 11.4 9.5 5.2 10.1 9.2 5.3 14.5 15.4 6.5 15.4 11,357 22,124 36,638
9.8 22.6 53.2 6.4 13.5 21.1 6.3 11.2 12.8 6.3 11.1 12.1 6.3 10.0 11.5 7.6 4.7 17.3 29.5 4.8 38.0 12,323 21,079 36,532
4.0 4.2 5.7 4.0 4.0 4.0 4.0 4.0 4.0 4.0 4.0 4.0 4.0 4.0 4.0 4.0 4.0 4.0 4.0 4.0 4.0
5.6 17.7 45.3 5.5 10.5 19.1 5.0 8.4 11.8 5.0 7.6 11.2 5.0 7.1 10.7 5.0 7.0 13.3 21.5 7.0 34.0
1.5 11.9 35.6 1.4 5.8 13.1 1.0 3.9 6.8 1.0 3.2 6.3 1.0 2.8 5.9 1.0 2.7 8.2 15.1 2.7 25.9 5,506 12,262 25,816
0.5 10.5 33.1 0.4 4.5 11.6 0.0 2.8 5.6 0.0 2.1 5.1 0.0 1.7 4.7 0.0 1.6 6.8 13.5 1.6 23.8
4.5 17.1 46.2 2.4 9.4 17.1 2.3 7.2 8.8 2.3 6.5 8.1 2.3 5.9 7.5 3.6 0.7 13.3 25.5 0.8 34.0 9,002 16,780 24,004
7.5 10.7 15.7 5.4 9.9 12.0 5.3 8.8 9.0 5.3 8.9 8.9 5.3 8.8 8.8 6.6 3.7 12.0 12.0 3.8 12.0
0.0 2.7 7.7 2.4 6.9 9.0 2.3 5.8 6.0 2.3 5.9 5.9 2.3 5.8 5.8 3.6 0.7 9.0 9.0 0.8 9.0
7.7 11.4 16.4 5.4 9.9 12.0 5.3 8.8 9.0 5.3 8.9 8.9 5.3 8.8 8.8 6.6 3.7 12.0 12.0 3.8 12.0
5.8 9.2 13.9 3.5 7.8 9.7 3.5 6.8 6.9 3.5 6.8 6.9 3.5 6.8 6.8 4.7 2.0 9.7 9.7 2.1 9.7 4,646 6,541 8,011
4.3 7.5 12.0 2.2 6.2 8.1 2.1 5.2 5.4 2.1 5.3 5.3 2.1 5.2 5.2 3.2 0.7 8.1 8.1 0.8 8.1 3,540 5,336 6,729
Notes
Acre-feet tota ls a re approximate except for bold numbers. All negative numbers a re shown as zero.
This scenario assumes a ll water in excess of Mono County water rights is returned to Mill in a p ipeline, and a constant 4 c fs is re leased from the dam to Mill. If reservoir is sp illing ac tua l flow is re leased.
Flows in c reeks below 395 a re same as non-FERC scenario because it is assumed water rights water would be taken from Mill to Wilson in a p ipeline.
Diversions a re for irriga ting meadows with approx. 4 ft of water per ac re and South Conway d iversions of 8 c fs Apr-Sept and 3 c fs Oc t-Mar for fish rearing and irriga tion.
Sources of da ta for this scenario:
a . Data from SCE for the year shown.
b . Data from SCE for the year shown.
c . Data from SCE or 4c fs, whichever is g rea ter. If 4 c fs impa ired isn't ava ilab le, impa ired is shown.
d . Dam releases and seepage p lus estimated ga ins minus Thompson d iversions of .9c fs May-Sept.(4ac ft/ ac ) p lus return d itch (ta ilrace-Wilson@395).
e. Wilson's IFIM equation for the 2.7 mile reach. This results in lower losses below Mono City than FS measurements show in the reach above Mono City (a lthough higher losses than USFS Sept. 2001 measurements). A more deta iled study is needed.
f. Uses Wilson's IFIM equation for the 0.8 mile reach (1990 leng th).
g . Data from SCE - (4-release from dam if less than 4) + ac tua l upper Conway - Mattly (1.3c fs may-sept or 3.9 ac ft/ ac ). If impa ired flow is not enough to sa tisfy 4 c fs FERC release, impa ired is re leased from the dam and zero is shown here.
h. Ta ilrace - water in excess of Mono County rights. Excess water equation based on the equation found in p rior scenario spreadsheets.
i. Wilson a t 395 minus south Conway d iversions. South Conway d iversions a re the sum of Bell and Bowl d iversions which a re 8 c fs Apr-Sept. and 3 c fs the rest of the year, or whatever is ava ilab le.
j. Wilson a t 395 minus 0.3 c fs evapotransp ira tion (2 ac ft/ ac ) May-Sept., p lus ha lf VA Cr runoff -1, 2, or 0 depend ing on month.
k. Uses IFIM equation for the 1.22 mile reach.
l. Uses IFIM equation for the 0.98 mile reach. This is a conserva tive estimate, since recent measurements by the USFS show higher losses a t higher flows.

36
Dry Norm Wet Dry Norm Wet Dry Norm Wet Dry Norm Wet Dry Norm Wet
1994 1993 1995 1994 1993 1995 1994 1993 1995 1994 1993 1995 1994 1993 1995
EFFICIENT USE
Apr May Jun Jul Aug
Mill Creek Flows
a. Unimpaired a t Lundy Reservoir 10.8 20.7 21.4 35.5 62.3 51.6 49.1 86.0 137.6 18.8 100.6 178.2 8.8 40.0 95.6
b. Impa ired a t Lundy Reservoir 10.5 25.2 25.1 34.2 48.4 46.3 36.3 54.0 98.6 31.9 88.4 165.4 17.5 52.6 99.1
c . Release/ Seepage from Dam to Mill 0.0 0.0 0.0 0.1 0.0 0.0 1.9 0.6 31.8 1.7 9.5 98.2 0.2 7.3 31.4
d. Mill a t 395 13.5 29.2 31.1 37.0 53.8 52.1 39.6 62.9 104.1 35.2 79.2 171.2 19.8 56.3 104.9
e. Mill a t Cemetery Rd. 8.3 21.8 23.4 28.4 42.8 41.4 30.7 50.6 85.9 26.9 64.6 143.4 13.7 45.0 86.6
f. Mill a t Mono Lake 7.0 19.9 21.4 26.2 40.1 38.7 28.4 47.5 81.3 24.8 60.9 136.3 12.2 42.1 82.0
Wilson Creek Flows
g. Lundy Ta ilrace 10.4 25.2 25.1 33.4 49.3 45.6 33.7 57.8 65.8 29.4 65.2 66.5 16.6 44.5 67.0
h. Wilson a t 395 2.0 2.0 2.0 2.0 3.0 3.0 2.0 3.0 3.0 2.0 3.0 3.0 2.0 3.0 3.0
i. Wilson below Bowl Diversion 2.0 2.0 2.0 1.5 2.5 2.5 1.5 2.5 2.5 1.5 2.5 2.5 1.5 2.5 2.5
j. Wilson leaving Conway property 2.0 2.0 2.0 2.3 3.8 3.8 2.3 3.8 3.8 2.3 3.8 3.8 2.3 3.8 3.8
k. Wilson a t 167 0.4 0.4 0.4 0.6 2.0 2.0 0.6 2.0 2.0 0.6 2.0 2.0 0.6 2.0 2.0
l. Wilson a t Cemetery Rd. 0.0 0.0 0.0 0.0 0.7 0.7 0.0 0.7 0.7 0.0 0.7 0.7 0.0 0.7 0.7
Dry NormWet Dry Norm Wet Dry Norm Wet Dry NormWet Dry Norm Wet Dry Norm Wet Dry Norm Wet
1994 1993 1995 1994 1993 1995 1994 1993 1995 1994 1993 1995 1994 1993 1995 1994 1993 1995 1994 1993 1995 1994 1993 1995
Sep Oct Nov Dec Jan Feb Mar Total ac-ft
6.6 16.1 39.9 7.2 8.6 17.3 8.9 6.6 11.0 8.2 6.6 11.4 9.5 5.2 10.1 9.2 5.3 14.5 15.4 6.5 15.4 11,357 22,124 36,638
9.8 22.6 53.2 6.4 13.5 21.1 6.3 11.2 12.8 6.3 11.1 12.1 6.3 10.0 11.5 7.6 4.7 17.3 29.5 4.8 38.0 12,323 21,079 36,532
0.0 4.2 5.7 0.0 2.5 3.9 0.0 1.4 2.8 0.0 0.6 2.2 0.0 0.1 1.7 0.0 0.0 1.6 0.0 0.0 0.7
12.1 26.4 59.0 8.9 18.4 29.1 8.3 15.2 18.8 8.3 14.5 18.1 8.3 13.9 17.5 9.6 8.7 23.3 31.5 8.8 44.0
7.1 19.4 47.3 4.3 12.5 21.7 3.8 9.7 12.8 3.8 9.2 12.2 3.8 8.7 11.7 4.9 4.2 16.7 23.7 4.3 34.4 9,707 17,808 32,709
5.9 17.6 44.3 3.2 11.0 19.8 2.7 8.4 11.3 2.7 7.8 10.8 2.7 7.3 10.3 3.8 3.0 15.0 21.7 3.1 32.0
9.1 17.7 46.8 6.4 10.9 17.2 6.3 9.8 10.0 6.3 9.9 9.9 6.3 9.8 9.8 7.6 4.7 15.7 29.5 4.8 37.3 11,869 18,834 25,351
2.0 3.0 3.0 2.0 2.0 2.0 2.0 2.0 2.0 2.0 2.0 2.0 2.0 2.0 2.0 2.0 2.0 2.0 2.0 2.0 2.0
1.5 2.5 2.5 2.0 2.0 2.0 2.0 2.0 2.0 2.0 2.0 2.0 2.0 2.0 2.0 2.0 2.0 2.0 2.0 2.0 2.0
2.3 3.8 3.8 2.0 2.0 2.0 2.0 2.0 2.0 2.0 2.0 2.0 2.0 2.0 2.0 2.0 2.0 2.0 2.0 2.0 2.0
0.6 2.0 2.0 0.4 0.4 0.4 0.4 0.4 0.4 0.4 0.4 0.4 0.4 0.4 0.4 0.4 0.4 0.4 0.4 0.4 0.4 359 786 786
0.0 0.7 0.7 0.0 0.0 0.0 0.0 0.0 0.0 0.0 0.0 0.0 0.0 0.0 0.0 0.0 0.0 0.0 0.0 0.0 0.0 0 225 225
Notes
Acre-feet tota ls a re approximate except for bold numbers. All negative numbers a re shown as zero.
This scenario assumes a ll water in excess of a c onstant 2 or 3 c fs re lease to Wilson is returned to Mill in a p ipeline. The only d iversions a re for irriga ting meadows with approx. 2 ft of water per ac re.
Sources of da ta for this scenario:
a . Data from SCE for the year shown.
b . Data from SCE for the year shown.
c . Data from SCE for the year shown.
d . Dam releases and seepage p lus estimated ga ins minus Thompson d iversions of .5c fs May-Sept.(2.2ac ft/ ac ) p lus return d itch (ta ilrace-Wilson@395).
e. Wilson's IFIM equation for the 2.7 mile reach. This results in lower losses below Mono City than FS measurements show in the reach above Mono City (a lthough higher losses than USFS Sept. 2001 measurements). A more deta iled study is needed.
f. Uses Wilson's IFIM equation for the 0.8 mile reach (1990 leng th).
g . Data from SCE + ac tua l upper Conway - Mattly irriga tion d iversion (0.7c fs may-sept or 2.1 ac ft/ ac )
h. A constant 2 c fs, except 3c fs May-Sept. in normal and wet years (or ta ilrace, whichever is less)
i. Wilson a t 395 minus south Conway d iversions. South Conway d iversions a re the sum of Bell and Bowl d iversions which a re .5c fs May-Sept or 3ac ft/ ac .
j. Wilson a t 395 minus south Conway d iversions, p lus ha lf of the sum of south Conway and Virg inia Creek runoff -1, 2, or 0 depend ing on month. In normal and wet years, 3 c fs (2 c fs in d ry years and in non-irriga tion season) a t Wilson lower p roperty boundary i i
intended to be ava ilab le to be taken through a p ipeline to ma inta in DeChambeau Ranch and Ponds. Irriga tion pa ttern would be 14 days on and 14 days off.
k. Uses IFIM equation for the 1.22 mile reach.
l. Uses IFIM equation for the 0.98 mile reach. This is a conserva tive estimate, since recent measurements by the USFS show higher losses a t higher flows.
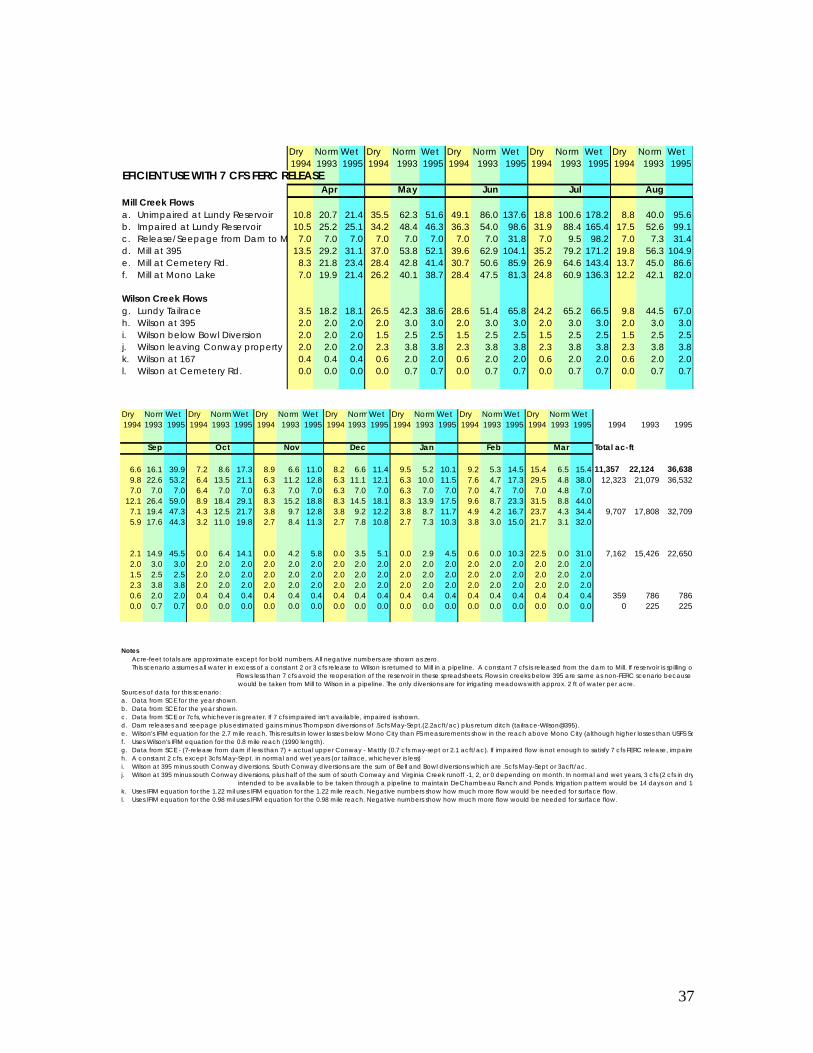
37
Dry Norm Wet Dry Norm Wet Dry Norm Wet Dry Norm Wet Dry Norm Wet
1994 1993 1995 1994 1993 1995 1994 1993 1995 1994 1993 1995 1994 1993 1995
EFICIENT USE WITH 7 CFS FERC RELEASE
Apr May Jun Jul Aug
Mill Creek Flows
a. Unimpaired a t Lundy Reservoir 10.8 20.7 21.4 35.5 62.3 51.6 49.1 86.0 137.6 18.8 100.6 178.2 8.8 40.0 95.6
b. Impa ired a t Lundy Reservoir 10.5 25.2 25.1 34.2 48.4 46.3 36.3 54.0 98.6 31.9 88.4 165.4 17.5 52.6 99.1
c . Release/ Seepage from Dam to Mill 7.0 7.0 7.0 7.0 7.0 7.0 7.0 7.0 31.8 7.0 9.5 98.2 7.0 7.3 31.4
d. Mill a t 395 13.5 29.2 31.1 37.0 53.8 52.1 39.6 62.9 104.1 35.2 79.2 171.2 19.8 56.3 104.9
e. Mill a t Cemetery Rd. 8.3 21.8 23.4 28.4 42.8 41.4 30.7 50.6 85.9 26.9 64.6 143.4 13.7 45.0 86.6
f. Mill a t Mono Lake 7.0 19.9 21.4 26.2 40.1 38.7 28.4 47.5 81.3 24.8 60.9 136.3 12.2 42.1 82.0
Wilson Creek Flows
g. Lundy Ta ilrace 3.5 18.2 18.1 26.5 42.3 38.6 28.6 51.4 65.8 24.2 65.2 66.5 9.8 44.5 67.0
h. Wilson a t 395 2.0 2.0 2.0 2.0 3.0 3.0 2.0 3.0 3.0 2.0 3.0 3.0 2.0 3.0 3.0
i. Wilson below Bowl Diversion 2.0 2.0 2.0 1.5 2.5 2.5 1.5 2.5 2.5 1.5 2.5 2.5 1.5 2.5 2.5
j. Wilson leaving Conway property 2.0 2.0 2.0 2.3 3.8 3.8 2.3 3.8 3.8 2.3 3.8 3.8 2.3 3.8 3.8
k. Wilson a t 167 0.4 0.4 0.4 0.6 2.0 2.0 0.6 2.0 2.0 0.6 2.0 2.0 0.6 2.0 2.0
l. Wilson a t Cemetery Rd. 0.0 0.0 0.0 0.0 0.7 0.7 0.0 0.7 0.7 0.0 0.7 0.7 0.0 0.7 0.7
Dry NormWet Dry Norm Wet Dry Norm Wet Dry NormWet Dry Norm Wet Dry Norm Wet Dry Norm Wet
1994 1993 1995 1994 1993 1995 1994 1993 1995 1994 1993 1995 1994 1993 1995 1994 1993 1995 1994 1993 1995 1994 1993 1995
Sep Oct Nov Dec Jan Feb Mar Total ac-ft
6.6 16.1 39.9 7.2 8.6 17.3 8.9 6.6 11.0 8.2 6.6 11.4 9.5 5.2 10.1 9.2 5.3 14.5 15.4 6.5 15.4 11,357 22,124 36,638
9.8 22.6 53.2 6.4 13.5 21.1 6.3 11.2 12.8 6.3 11.1 12.1 6.3 10.0 11.5 7.6 4.7 17.3 29.5 4.8 38.0 12,323 21,079 36,532
7.0 7.0 7.0 6.4 7.0 7.0 6.3 7.0 7.0 6.3 7.0 7.0 6.3 7.0 7.0 7.0 4.7 7.0 7.0 4.8 7.0
12.1 26.4 59.0 8.9 18.4 29.1 8.3 15.2 18.8 8.3 14.5 18.1 8.3 13.9 17.5 9.6 8.7 23.3 31.5 8.8 44.0
7.1 19.4 47.3 4.3 12.5 21.7 3.8 9.7 12.8 3.8 9.2 12.2 3.8 8.7 11.7 4.9 4.2 16.7 23.7 4.3 34.4 9,707 17,808 32,709
5.9 17.6 44.3 3.2 11.0 19.8 2.7 8.4 11.3 2.7 7.8 10.8 2.7 7.3 10.3 3.8 3.0 15.0 21.7 3.1 32.0
2.1 14.9 45.5 0.0 6.4 14.1 0.0 4.2 5.8 0.0 3.5 5.1 0.0 2.9 4.5 0.6 0.0 10.3 22.5 0.0 31.0 7,162 15,426 22,650
2.0 3.0 3.0 2.0 2.0 2.0 2.0 2.0 2.0 2.0 2.0 2.0 2.0 2.0 2.0 2.0 2.0 2.0 2.0 2.0 2.0
1.5 2.5 2.5 2.0 2.0 2.0 2.0 2.0 2.0 2.0 2.0 2.0 2.0 2.0 2.0 2.0 2.0 2.0 2.0 2.0 2.0
2.3 3.8 3.8 2.0 2.0 2.0 2.0 2.0 2.0 2.0 2.0 2.0 2.0 2.0 2.0 2.0 2.0 2.0 2.0 2.0 2.0
0.6 2.0 2.0 0.4 0.4 0.4 0.4 0.4 0.4 0.4 0.4 0.4 0.4 0.4 0.4 0.4 0.4 0.4 0.4 0.4 0.4 359 786 786
0.0 0.7 0.7 0.0 0.0 0.0 0.0 0.0 0.0 0.0 0.0 0.0 0.0 0.0 0.0 0.0 0.0 0.0 0.0 0.0 0.0 0 225 225
Notes
Acre-feet tota ls a re approximate except for bold numbers. All negative numbers a re shown as zero.
This scenario assumes a ll water in excess of a c onstant 2 or 3 c fs re lease to Wilson is returned to Mill in a p ipeline. A constant 7 c fs is re leased from the dam to Mill. If reservoir is sp illing or impa ired flow is less than 7, ac tua l flow is re leased.
Flows less than 7 c fs avoid the reopera tion of the reservoir in these spreadsheets. Flows in c reeks below 395 a re same as non-FERC scenario because it is assumed constant-flow water not ava ilab le from the ta ilrace
would be taken from Mill to Wilson in a p ipeline. The only d iversions a re for irriga ting meadows with approx. 2 ft of water per ac re.
Sources of da ta for this scenario:
a . Data from SCE for the year shown.
b . Data from SCE for the year shown.
c . Data from SCE or 7c fs, whichever is g rea ter. If 7 c fs impa ired isn't ava ilab le, impa ired is shown.
d . Dam releases and seepage p lus estimated ga ins minus Thompson d iversions of .5c fs May-Sept.(2.2ac ft/ ac ) p lus return d itch (ta ilrace-Wilson@395).
e. Wilson's IFIM equation for the 2.7 mile reach. This results in lower losses below Mono City than FS measurements show in the reach above Mono City (a lthough higher losses than USFS Sept. 2001 measurements). A more deta iled study is needed.
f. Uses Wilson's IFIM equation for the 0.8 mile reach (1990 leng th).
g . Data from SCE - (7-release from dam if less than 7) + ac tua l upper Conway - Mattly (0.7 c fs may-sept or 2.1 ac ft/ ac ). If impa ired flow is not enough to sa tisfy 7 c fs FERC release, impa ired is re leased from the dam and zero is shown here.
h. A constant 2 c fs, except 3c fs May-Sept. in normal and wet years (or ta ilrace, whichever is less)
i. Wilson a t 395 minus south Conway d iversions. South Conway d iversions a re the sum of Bell and Bowl d iversions which a re .5c fs May-Sept or 3ac ft/ ac .
j. Wilson a t 395 minus south Conway d iversions, p lus ha lf of the sum of south Conway and Virg inia Creek runoff -1, 2, or 0 depend ing on month. In normal and wet years, 3 c fs (2 c fs in d ry years and in non-irriga tion season) a t Wilson lower p roperty boundary i i
intended to be ava ilab le to be taken through a p ipeline to ma inta in DeChambeau Ranch and Ponds. Irriga tion pa ttern would be 14 days on and 14 days off.
k. Uses IFIM equation for the 1.22 mile reach.uses IFIM equation for the 1.22 mile reach. Negative numbers show how much more flow would be needed for surface flow.
l. Uses IFIM equation for the 0.98 mile reach. This is a conserva tive estimate, since recent measurements by the USFS show higher losses a t higher flows.uses IFIM equation for the 0.98 mile reach. Negative numbers show how much more flow would be needed for surface flow.

38
Dry Norm Wet Dry Norm Wet Dry Norm Wet Dry Norm Wet Dry Norm Wet
1994 1993 1995 1994 1993 1995 1994 1993 1995 1994 1993 1995 1994 1993 1995
EFFICIENT USE WITH 4 CFS FERC RELEASE
Apr May Jun Jul Aug
Mill Creek Flows
a. Unimpaired a t Lundy Reservoir 10.8 20.7 21.4 35.5 62.3 51.6 49.1 86.0 137.6 18.8 100.6 178.2 8.8 40.0 95.6
b. Impa ired a t Lundy Reservoir 10.5 25.2 25.1 34.2 48.4 46.3 36.3 54.0 98.6 31.9 88.4 165.4 17.5 52.6 99.1
c . Release/ Seepage from Dam to Mill 4.0 4.0 4.0 4.0 4.0 4.0 4.0 4.0 31.8 4.0 9.5 98.2 4.0 7.3 31.4
d. Mill a t 395 13.5 29.2 31.1 37.0 53.8 52.1 39.6 62.9 104.1 35.2 79.2 171.2 19.8 56.3 104.9
e. Mill a t Cemetery Rd. 8.3 21.8 23.4 28.4 42.8 41.4 30.7 50.6 85.9 26.9 64.6 143.4 13.7 45.0 86.6
f. Mill a t Mono Lake 7.0 19.9 21.4 26.2 40.1 38.7 28.4 47.5 81.3 24.8 60.9 136.3 12.2 42.1 82.0
Wilson Creek Flows
g. Lundy Ta ilrace 6.5 21.2 21.1 29.5 45.3 41.6 31.6 54.4 65.8 27.2 65.2 66.5 12.8 44.5 67.0
h. Wilson a t 395 2.0 2.0 2.0 2.0 3.0 3.0 2.0 3.0 3.0 2.0 3.0 3.0 2.0 3.0 3.0
i. Wilson below Bowl Diversion 2.0 2.0 2.0 1.5 2.5 2.5 1.5 2.5 2.5 1.5 2.5 2.5 1.5 2.5 2.5
j. Wilson leaving Conway property 2.0 2.0 2.0 2.3 3.8 3.8 2.3 3.8 3.8 2.3 3.8 3.8 2.3 3.8 3.8
k. Wilson a t 167 0.4 0.4 0.4 0.6 2.0 2.0 0.6 2.0 2.0 0.6 2.0 2.0 0.6 2.0 2.0
l. Wilson a t Cemetery Rd. 0.0 0.0 0.0 0.0 0.7 0.7 0.0 0.7 0.7 0.0 0.7 0.7 0.0 0.7 0.7
Dry NormWet Dry Norm Wet Dry Norm Wet Dry NormWet Dry Norm Wet Dry Norm Wet Dry Norm Wet
1994 1993 1995 1994 1993 1995 1994 1993 1995 1994 1993 1995 1994 1993 1995 1994 1993 1995 1994 1993 1995 1994 1993 1995
Sep Oct Nov Dec Jan Feb Mar Total ac-ft
6.6 16.1 39.9 7.2 8.6 17.3 8.9 6.6 11.0 8.2 6.6 11.4 9.5 5.2 10.1 9.2 5.3 14.5 15.4 6.5 15.4 11,357 22,124 36,638
9.8 22.6 53.2 6.4 13.5 21.1 6.3 11.2 12.8 6.3 11.1 12.1 6.3 10.0 11.5 7.6 4.7 17.3 29.5 4.8 38.0 12,323 21,079 36,532
4.0 4.2 5.7 4.0 4.0 4.0 4.0 4.0 4.0 4.0 4.0 4.0 4.0 4.0 4.0 4.0 4.0 4.0 4.0 4.0 4.0
12.1 26.4 59.0 8.9 18.4 29.1 8.3 15.2 18.8 8.3 14.5 18.1 8.3 13.9 17.5 9.6 8.7 23.3 31.5 8.8 44.0
7.1 19.4 47.3 4.3 12.5 21.7 3.8 9.7 12.8 3.8 9.2 12.2 3.8 8.7 11.7 4.9 4.2 16.7 23.7 4.3 34.4 9,707 17,808 32,709
5.9 17.6 44.3 3.2 11.0 19.8 2.7 8.4 11.3 2.7 7.8 10.8 2.7 7.3 10.3 3.8 3.0 15.0 21.7 3.1 32.0
5.1 17.7 46.8 2.4 9.4 17.1 2.3 7.2 8.8 2.3 6.5 8.1 2.3 5.9 7.5 3.6 0.7 13.3 25.5 0.8 34.0 9,184 16,962 24,187
2.0 3.0 3.0 2.0 2.0 2.0 2.0 2.0 2.0 2.0 2.0 2.0 2.0 2.0 2.0 2.0 2.0 2.0 2.0 2.0 2.0
1.5 2.5 2.5 2.0 2.0 2.0 2.0 2.0 2.0 2.0 2.0 2.0 2.0 2.0 2.0 2.0 2.0 2.0 2.0 2.0 2.0
2.3 3.8 3.8 2.0 2.0 2.0 2.0 2.0 2.0 2.0 2.0 2.0 2.0 2.0 2.0 2.0 2.0 2.0 2.0 2.0 2.0
0.6 2.0 2.0 0.4 0.4 0.4 0.4 0.4 0.4 0.4 0.4 0.4 0.4 0.4 0.4 0.4 0.4 0.4 0.4 0.4 0.4 359 786 786
0.0 0.7 0.7 0.0 0.0 0.0 0.0 0.0 0.0 0.0 0.0 0.0 0.0 0.0 0.0 0.0 0.0 0.0 0.0 0.0 0.0 0 225 225
Notes
Acre-feet tota ls a re approximate except for bold numbers. All negative numbers a re shown as zero.
This scenario assumes a ll water in excess of a c onstant 2 or 3 c fs re lease to Wilson is returned to Mill in a p ipeline. A constant 4 c fs is re leased from the dam to Mill. If reservoir is sp illing ac tua l flow is re leased.
Flows in c reeks below 395 a re same as non-FERC scenario because it is assumed constant-flow water not ava ilab le from the ta ilrace
would be taken from Mill to Wilson in a p ipeline. The only d iversions a re for irriga ting meadows with approx. 2 ft of water per ac re.
Sources of da ta for this scenario:
a . Data from SCE for the year shown.
b . Data from SCE for the year shown.
c . Data from SCE or 4 c fs, whichever is g rea ter. If 4 c fs impa ired isn't ava ilab le, impa ired is shown.
d . Dam releases and seepage p lus estimated ga ins minus Thompson d iversions of .5c fs May-Sept.(2.2ac ft/ ac ) p lus return d itch (ta ilrace-Wilson@395).
e. Wilson's IFIM equation for the 2.7 mile reach. This results in lower losses below Mono City than FS measurements show in the reach above Mono City (a lthough higher losses than USFS Sept. 2001 measurements). A more deta iled study is needed.
f. Uses Wilson's IFIM equation for the 0.8 mile reach (1990 leng th).
g . Data from SCE - (4-release from dam if less than 4) + ac tua l upper Conway - Mattly (0.7 c fs may-sept or 2.1 ac ft/ ac ). If impa ired flow is not enough to sa tisfy 4 c fs FERC release, impa ired is re leased from the dam and zero is shown here.
h. A constant 2 c fs, except 3c fs May-Sept. in normal and wet years (or ta ilrace, whichever is less)
i. Wilson a t 395 minus south Conway d iversions. South Conway d iversions a re the sum of Bell and Bowl d iversions which a re .5c fs May-Sept or 3ac ft/ ac .
j. Wilson a t 395 minus south Conway d iversions, p lus ha lf of the sum of south Conway and Virg inia Creek runoff -1, 2, or 0 depend ing on month. In normal and wet years, 3 c fs (2 c fs in d ry years and in non-irriga tion season) a t Wilson lower p roperty boundary i i
intended to be ava ilab le to be taken through a p ipeline to ma inta in DeChambeau Ranch and Ponds. Irriga tion pa ttern would be 14 days on and 14 days off.
k. Uses IFIM equation for the 1.22 mile reach.
l. Uses IFIM equation for the 0.98 mile reach. This is a conserva tive estimate, since recent measurements by the USFS show higher losses a t higher flows.

39
Dry Norm Wet Dry Norm Wet Dry Norm Wet Dry Norm Wet Dry Norm Wet
1994 1993 1995 1994 1993 1995 1994 1993 1995 1994 1993 1995 1994 1993 1995
REFERENCE CONDITIONS (ALL TO MILL)
Apr May Jun Jul Aug
Mill Creek Flows
Unimpaired a t Lundy Reservoir 10.8 20.7 21.4 35.5 62.3 51.6 49.1 86.0 137.6 18.8 100.6 178.2 8.8 40.0 95.6
Impaired a t Lundy Reservoir 10.5 25.2 25.1 34.2 48.4 46.3 36.3 54.0 98.6 31.9 88.4 165.4 17.5 52.6 99.1
Release/ Seepage from Dam to Mill 0.0 0.0 0.0 0.1 0.0 0.0 1.9 0.6 31.8 1.7 9.5 98.2 0.2 7.3 31.4
Mill a t 395 15.4 31.2 33.1 40.2 58.0 56.3 42.8 67.1 108.3 38.3 83.4 175.4 23.0 60.5 109.1
Mill a t Cemetery Rd. 10.0 23.5 25.1 31.1 46.4 45.0 33.4 54.2 89.5 29.6 68.2 147.0 16.4 48.6 90.3
Mill a t Mono Lake 8.6 21.5 23.1 28.8 43.5 42.1 31.0 51.0 84.8 27.3 64.3 139.8 14.8 45.6 85.5
Wilson Creek Flows
Lundy Ta ilrace 10.4 25.2 25.1 34.1 50.0 46.3 34.4 58.5 66.5 30.1 65.9 67.2 17.3 45.2 67.7
Wilson a t 395 0.0 0.0 0.0 0.0 0.0 0.0 0.0 0.0 0.0 0.0 0.0 0.0 0.0 0.0 0.0
Wilson below Bowl Diversion 0.0 0.0 0.0 0.0 0.0 0.0 0.0 0.0 0.0 0.0 0.0 0.0 0.0 0.0 0.0
Wilson leaving Conway property 0.0 0.0 0.0 0.5 1.0 1.0 0.5 1.0 1.0 0.5 1.0 1.0 0.5 1.0 1.0
Wilson a t 167 0.0 0.0 0.0 0.0 0.0 0.0 0.0 0.0 0.0 0.0 0.0 0.0 0.0 0.0 0.0
Wilson a t Cemetery Rd. 0.0 0.0 0.0 0.0 0.0 0.0 0.0 0.0 0.0 0.0 0.0 0.0 0.0 0.0 0.0
Dry NormWet Dry Norm Wet Dry Norm Wet Dry NormWet Dry Norm Wet Dry Norm Wet Dry Norm Wet
1994 1993 1995 1994 1993 1995 1994 1993 1995 1994 1993 1995 1994 1993 1995 1994 1993 1995 1994 1993 1995 1994 1993 1995
Sep Oct Nov Dec Jan Feb Mar Total ac-ft
6.6 16.1 39.9 7.2 8.6 17.3 8.9 6.6 11.0 8.2 6.6 11.4 9.5 5.2 10.1 9.2 5.3 14.5 15.4 6.5 15.4 11,357 22,124 36,638
9.8 22.6 53.2 6.4 13.5 21.1 6.3 11.2 12.8 6.3 11.1 12.1 6.3 10.0 11.5 7.6 4.7 17.3 29.5 4.8 38.0 12,323 21,079 36,532
0.0 4.2 5.7 0.0 2.5 3.9 0.0 1.4 2.8 0.0 0.6 2.2 0.0 0.1 1.7 0.0 0.0 1.6 0.0 0.0 0.7
15.3 30.6 63.2 10.9 20.4 31.1 10.3 17.2 20.8 10.3 16.5 20.1 10.3 15.9 19.5 11.6 10.7 25.3 33.5 10.8 46.0
9.8 23.0 50.9 6.1 14.2 23.4 5.6 11.5 14.6 5.6 10.9 13.9 5.6 10.4 13.4 6.7 5.9 18.4 25.4 6.0 36.2 11,266 19,633 34,532
8.5 21.0 47.8 4.8 12.7 21.4 4.4 10.0 13.0 4.4 9.4 12.4 4.4 9.0 11.9 5.4 4.7 16.7 23.4 4.8 33.6
9.8 18.4 47.5 6.4 10.9 17.2 6.3 9.8 10.0 6.3 9.9 9.9 6.3 9.8 9.8 7.6 4.7 15.7 29.5 4.8 37.3 12,082 19,047 25,564
0.0 0.0 0.0 0.0 0.0 0.0 0.0 0.0 0.0 0.0 0.0 0.0 0.0 0.0 0.0 0.0 0.0 0.0 0.0 0.0 0.0
0.0 0.0 0.0 0.0 0.0 0.0 0.0 0.0 0.0 0.0 0.0 0.0 0.0 0.0 0.0 0.0 0.0 0.0 0.0 0.0 0.0
0.5 1.0 1.0 0.0 0.0 0.0 0.0 0.0 0.0 0.0 0.0 0.0 0.0 0.0 0.0 0.0 0.0 0.0 0.0 0.0 0.0
0.0 0.0 0.0 0.0 0.0 0.0 0.0 0.0 0.0 0.0 0.0 0.0 0.0 0.0 0.0 0.0 0.0 0.0 0.0 0.0 0.0 0 0 0
0.0 0.0 0.0 0.0 0.0 0.0 0.0 0.0 0.0 0.0 0.0 0.0 0.0 0.0 0.0 0.0 0.0 0.0 0.0 0.0 0.0 0 0 0
Notes
Acre-feet tota ls a re approximate except for bold numbers. All negative numbers are shown as zero.
This scenario assumes a ll water going through the powerp lant is returned to Mill in a p ipeline. There are no irriga tion d iversions.
Sources of da ta for this scenario:
a . Data from SCE for the year shown.
b . Data from SCE for the year shown.
c . Data from SCE for the year shown.
d . Dam releases and seepage p lus estimated ga ins p lus return d itch.
e. Wilson's IFIM equation for the 2.7 mile reach. This results in lower losses below Mono City than FS measurements show in the reach above Mono City (a lthough higher losses than USFS Sept. 2001 measurements). A more deta iled study is needed.
f. Uses Wilson's IFIM equation for the 0.8 mile reach (1990 length).
g . Data from SCE + ac tua l upper Conway
h. Always zero: ta ilrace - return d itch (flow in ta ilrace)
i. Always zero
j. Wilson a t 395 p lus ha lf of Virg inia Creek runoff minus 1, 2, or 0 depend ing on month.
k. Uses IFIM equation for the 1.22 mile reach.
l. Uses IFIM equation for the 0.98 mile reach. This is a conserva tive estimate, since recent measurements by the USFS show higher losses a t higher flows.
40
Appendix D
North Mono Basin
Road Analysis
USDA Forest Service
Region 5
Inyo National Forest October 2001

41
I. Introduction
A. Overview
This road analysis was done in conjunction with the North Mono Basin
Watershed Analysis. The objective of the roads analysis is to provide line officers
with information to develop road systems that are safe and responsive to public
needs and desires, are affordable and efficiently managed, have minimal negative
ecological effects on the land, and are in balance with available funding for
needed management actions. The roads analysis should provide the information
needed for future decisions that ensure that National Forest System roads provide
for public uses of National Forest System lands; provide for safe public access
and travel; allow for economical and efficient management; to the extent
practical, begin to reverse adverse ecological impacts associated with roads; and
meet other current and future land and resource management objectives. The
analysis will identify opportunities for increasing benefits of road systems and
reducing existing problems and risks. It will provide a framework for examining
important issues and developing relevant information before managers enter into a
formal decision process (NFMA & NEPA). The analysis will neither make
land management decisions nor allocate land for specific purposes because
both require NFMA and NEPA based Forest and project planning.
B. Organization of this Report
Roads Analysis calls for a six-step process aimed at producing the needed
information. These six steps include:
Step 1: Setting Up the Analysis
Step 2: Describing the Situation
Step 3: Identifying Issues and Key Information Needs
Step 4: Assessing Effects
Step 5: Formulation Options
Step 6: Reporting
The remainder of this report is organized to address these six steps.
II. Step 1: Setting Up the Analysis
The roads analysis was done in conjunction with the landscape analysis and the same ID
team was used for both analysises. The team included the following Forest personnel:
Glen Stein Forest Planner
Ron Keil Resource Staff Officer
Allen Tobey Forest Engineer
Todd Ellsworth Soil Scientist
Kathleen Nelson Forest Botanist
Ginelle O‟Conner Wildlife Bologist
Nicholas Faust Archaeologist Technician

42
Robert Bertolina Fuels Battalion Chief
Laurie Morrow Cartographic Technician
Larry Ford Scenic Area Assistant
Roger Porter Scenic Area Manager
Time and funding was not available to gather and develop new data, so this analysis was
primarily done with existing data. ArcView computer software included in the Forest‟s
GIS, was the principal analysis tool. ArcView helped analyze and display important
spatial relationships.
The Roads Analysis team identified the following data requirements needed from the
Forest GIS database:
Proximity to streams
Steam Crossing
Road Density
Inventoried Roadless Areas
Erosion Hazard
Classified and Unclassified roads
Noxious Weed Locations
III. Step 2: Describing the Situation
Figure 2 shows the North Mono Basin watershed area covered by this analysis. This
watershed is 103,508 acres. Table 2 shows that the watershed includes 264.55 miles of
road of which 142.95 miles are classified roads and 121.6 miles are unclassified and other
roads. Roads in the town of Lee Vining are not included in these numbers. Of the 121.6
miles of unclassified roads 4.55 miles are identified as Non-System – Unclassified roads
and 6.53 miles are identified as OHV – Unclassified roads on Inyo National Forest Land.
The Non System – Unclassified roads are roads that have not been analyzed to determine
if they should be added to the classified road inventory or roads that should be
decommissioned. Figure 1 lists the road definitions from the Forest Service Manual,
Interim Road Rule, and the Draft EIS Roadless Area Conservation Initiative.
Table 3 shows the miles of road by maintenance level. Table 1 shows the Maintenance
Level Descriptions. The roads where the maintenance level is undetermined are roads
that are not part of the classified road system. These roads include non-system –
unclassified roads; roads outside the Inyo National Forest Boundary; roads inside the
Forest boundary, but the road is entirely on the land of another owner; and US/State
highways. The majority of the roads are maintenance level 2 and 3 roads. These roads
are either native or gravel surfaced roads. Figure 4 shows the location of the roads by
maintenance level. Table 5 shows the number of roads by surface type.
Table 3 also shows the miles of road in inventoried roadless areas. The majority of the
roads in the inventoried roadless areas are OHV – unclassified. These are roads that were
identified in the OHV inventory as valid OHV roads, but these roads were not included in
the classified road inventory because they are located in an inventoried roadless area and
need to have an evaluation done as to whether they should be classified or

43
decommissioned. Figure 5 shows the locations of the proposed roadless areas and the
locations of roads in the proposed roadless areas.
Miles of roads in high or very high soil erosion hazard areas are shown in table 3. There
are 44.68 miles of roads in high or very high soil erosion hazard areas. The majority of
these roads are classified roads – roads that are constructed or maintained for long-term
highway vehicle use. Steep side slopes are the main reason these roads have a high or
very high erosion hazard rating.
Figure 3 shows the location of the areas that have a high or very high erosion hazard
rating.
The road densities are shown on figure 6 and in table 4. Most of the area within the
watershed has low road densities. Less than 3 percent of the area has a road density of 7
or more mi/mi2. A typical city would have a road density of between 30 to 50 mi/mi2.
The average road density for the entire watershed is 1.6 mi/mi2.
Figure 7 and table 5 shows roads in riparian conservation areas (RCA). RCAs are the
areas within 300 feet of perennial streams, lakes, and marshes; and within 150 feet of
intermittent and ephemeral streams. 47.73 miles or 17% of roads are within RCAs. The
largest numbers of roads in RCAs shown in table 5 are classified roads.
Figure 8 shows road stream crossing locations. The stream crossings shown on Mill
Creek and Wilson Creek are known fish barriers.
Figure 9 and table 5 identifies known noxious weed location and where they intersect
roads. 3.6 miles of road are identified as intersecting known noxious weed sites, however
the majority of the watershed has not been surveyed for noxious weeds.
Appendix 1 shows the current planning direction for roads from the Mono Basin National
Forest Scenic Area, Comprehensive Management Plan, 1989; Inyo National Forest –
Land and Resource Management Plan, 1988; and the Sierra Nevada Forest Plan
Amendment, Environmental Impact Statement, Record of Decision, January 2001.
IV. Step 3: Identifying Issues
The interdisciplinary team identified the following issues:
Fish barriers as identified on figure 8.
Lack of sufficient routine maintenance.
The steepness of the Log Cabin road beyond Burgers.
Campsite roads in the Lee Vining canyon that are low standard, infrequently
maintained, and too close to the creek.
Should the asphalt on old highway 395 be removed or replaced?
Should the lower dirt section of the Saddlebag road be paved?
Should the loop road at the County Ponds be closed to reduce the disruption to
wildlife?
Should the last ½ mile of the road on the southwest side of Black Point be closed
and rehabilitated at the steep rutted section?

44
Should the motocross area below the Mono Lake Visitor Center be rehabilitated?
Transportation of noxious weeds by vehicles and equipment. How can it be
minimized or avoided?
Improving the accuracy of the road data used for this analysis. The road
jurisdiction, land ownership, and road locations data could be improved and field
verified.
Identifying and verifying classified and unclassified roads. Should all the road
locations be field verified and then a determination made of the classified road
network and the unclassified roads?
V. Step 4: Assessing Benefits, Problems, and Risks
The interdisciplinary team identified the key issues in step 3. For this step the Benefits,
Problems, and Risks associated with each issue is discussed.
Fish barriers as identified on figure 8. The road crossings on Mill Creek and Wilson
are known fish barriers. These crossing are all located on roads under county
jurisdiction. These crossing all have culverts that have the downstream end of the
culvert above the stream where the water has to make a large drop to the
streambed. If these culverts were removed and replaced with a bridge or a culvert
that would allow fish passage, a large head cut would occur due to the large drop
in the streambed from the upstream to the downstream side of the road. This head
cut would travel a considerable distance upstream before stabilizing. In the short
term considerable turbidity and bedload transfer would occur. Correction of these
crossing is currently outside the Forest Services jurisdiction since these are county
roads.
Lack of sufficient routine maintenance. The surface type is only identified in the
GIS database for Forest Service classified roads. Table 5 shows that for the
identified classified roads only 8 miles have a paved surface and 63 miles are
either native surfaced or aggregate surfaced roads. Many of the roads are badly
washboarded. Native and gravel surfaced roads that have heavy traffic quickly
wash board after being graded. This occurs even more quickly when the road has
a steep grade. The Saddlebag road is an example of this problem. Many of the
county roads that accesses the National Forest are also high use roads that
washboard quickly. Both the Forest Service and the County do not receive proper
funding to grade these roads more often.
The steepness of the Log Cabin road beyond Burgers. This section of the road is
steep and lacks sufficient drainage structures. This road accesses the Boy Scout
camp and the Log Cabin mine. An alternate road exists further to the east that
accesses these sites. However, the two roads allow a loop road for recreation and
provides an alternate route if one route were to become closed.
Campsite roads in the Lee Vining canyon that are low standard, infrequently
maintained, and too close to the creek. These roads are in campgrounds that were
acquired from a land exchange. The campgrounds are primitive campgrounds
with user generated native surfaced roads and many of the campsites are located
on the edge of the creek. The campers like being on the creek, but this increases
the potential for water quality degradation.
45
Should the asphalt on old highway 395 be removed or replaced? This asphalt is old,
potholed and falling apart. This road has low use. It would be expensive to
replace this asphalt and replacement is probably not justified for the amount of
use the road receives. It should be investigated if the California Department of
Transportation still has any jurisdiction on these roads. If these roads are totally
under Forest Service jurisdiction, the cost of removing the asphalt needs to be
prioritized against not performing other road maintenance on the Forest with the
limited amount of road maintenance funding that is available.
Should the lower dirt section of the Saddlebag road be paved? The gravel
previously placed on this section is mostly gone. This road quickly becomes
wash boarded from use after grading the road. This road is difficult to grade due
to the lack of a gravel surface and the rocks in the roadbed. Will paving increase
speeds and use of this road? There is a limited amount of parking on this road,
which is at or near capacity. The decision was made in the past to only pave the
very steepest sections because of the concern that paving the road would increase
use and there is insufficient parking to accommodate increased use. It would be
difficult and expensive to increase the parking. However, as the use increases the
road will require more frequent grading and grading will become more difficult as
the smaller material is worn away leaving more large rocks in the roadbed.
Should the loop road at the County Ponds be closed to reduce the disruption to
wildlife? This road only accesses the County Ponds and could be closed at a
parking area, only allowing pedestrian traffic to the County Ponds. Parking could
be provided at the old borrow pit, which would only be a short hike to the ponds.
This would allow a better chance for viewing wildlife without automobile traffic
disturbing the wildlife.
Should the last ½ mile of the road on the southwest side of Black Point be closed
and rehabilitated at the steep rutted section? This section of road is not near any
water but the steep rutted section is a visual eyesore. This road does provide a
challenge for 4wds and provides access to a viewing area to Mono Lake???
Should the motocross area below the Mono Lake Visitor Center be rehabilitated?
The motocross area is on City of Los Angeles Land, is no longer used, and is and
is a visual eyesore. Since this area is on City of Los Angeles Land, the Forest
Service can not fund this project and does not have jurisdiction.
Transportation of noxious weeds by vehicles and equipment. How can it be
minimized or avoided? It would be difficult to prevent the movement to noxious
weed by vehicles. However, the weeds are more likely spread by construction
equipment or vehicles traveling off of the road.
Improving the accuracy of the road data used for this analysis. The road
jurisdiction, land ownership, and road locations data could be improved and field
verified. However, the data could use improvement Forest wide and collecting
data for this watershed need to be prioritized with the rest of the Forest.
Identifying and verifying classified and unclassified roads. Should all the road
locations be field verified and then a determination made of the classified road
network and the unclassified roads? The classified road network should be the
road system needed for long-term use and the unclassified roads would be the
roads identified for decommissioning. Determining whether a road should be
classified need to be an interdisciplinary team effort and needs to include
fieldwork.
46
VI. Step 5: Describing Opportunities and Setting Priorities
The following is the projects the interdisciplinary team recommends for consideration:
Top Priority Projects
The loop road to the County ponds should be decommissioned with the road ending
at the old borrow pit, which would be the parking area. This would be a fairly
low cost project that would benefit wildlife and improve the wildlife viewing.
The low standard campgrounds with low standard roads in lower Lee Vining canyon
should be analyzed for removal and replacement at a more suitable site. The
possibility of a “Private Party Venture” to provide a campground should be
investigated.
The Saddlebag road should be analyzed and considered for either surfacing with
gravel or asphalt. This road has become very difficult to maintain which needs to
be corrected. Possible funding sources should be investigated.
Construction equipment should be cleaned prior to being transported from a noxious
weed site. Consideration should be given to providing barriers or signs to keep
vehicles on the road in noxious weed locations. Field studies are needed to
identify critical problem sites.
Some inaccuracies in the data were found while performing this analysis. The need
for accurate GIS data is only going to increase in the future. This is a problem
Forest wide. Consideration should be made in hiring additional personnel and/or
assigning existing personnel to collect and enter data to improve the accuracy of
the GIS database. Consideration should be given to hiring personnel and
providing a 4wd vehicle with a GPS unit to log the existing roads.
The Forest needs to verify the existing classified roads are the roads that are needed
for long-term use. The existing unclassified roads on the Forest need to be
analyzed to determine whether they should be classified roads or
decommissioned. Very few of the unclassified roads on the Forest have been
analyzed for classifying or decommissioning.
Second Priority Projects
The impacts, cost, and funding sources for the removal of the fish barriers on Mill
Creek and Wilson Creek should be further analyzed before deciding whether to
remove these fish barriers.
The native and gravel surfaced roads that are a problem to maintain because of high
use should be considered for paving. Lower cost paving options such as using
asphalt grinding should be considered. Possible funding sources should be
investigated. The Forest Service should work with the County to investigate
possible funding sources for the County road that access Forest land.
The Log Cabin road beyond Burgers should be analyzed for maintenance that would
improve the drainage and reduce the sedimentation form the road.
The asphalt on old highway 395 should be removed. CalTrans needs to be
contacted to see if they still have any jurisdiction on this road. The removal of the
asphalt need to be prioritized with other road maintenance on the Forest.

47
The steep rutted road on the southwest side of Black Point should be rehabilitated.
Consideration should be made for conversion to a trail.
The Forest Service needs to work with the City of Los Angeles to encourage them to
remove the motocross area below the Mono Lake Visitor Center. The Forest
Service should help investigate possible funding for this work.

48
Table 1. Maintenance Level Descriptions
Level 1 Assigned to intermittent service roads during the time they are closed to
vehicular traffic. The closure period must exceed 1 year. Basic custodial
maintenance is performed to keep damage to adjacent resources to an
acceptable level and to perpetuate the road to facilitate future management
activities. Emphasis is normally given to maintaining drainage facilities and
runoff patterns. Planned road deterioration may occur at this level.
Appropriate traffic management strategies are "prohibit" and "eliminate."
Roads receiving level 1 maintenance may be
of any type, class, or construction standard, and may be managed at any other
maintenance level during the time they are open for traffic. However, while
being maintained at level 1, they are closed to vehicular traffic, but may be
open and suitable for nonmotorized uses.
Level 2 Assigned to roads open for use by high clearance vehicles. Passenger car
traffic is not a consideration. Traffic is normally minor, usually consisting of
one or a combination of administrative, permitted, dispersed recreation, or
other specialized uses. Log haul may occur at this level. Appropriate traffic
management strategies are either to (1) discourage or prohibit passenger cars
or (2) accept or discourage high clearance vehicles.
Level 3 Assigned to roads open and maintained for travel by a prudent driver in a
standard passenger car. User comfort and convenience are not considered
priorities.
Roads in this maintenance level are typically low speed, single lane with
turnouts and spot surfacing. Some roads may be fully surfaced with either
native or processed material. Appropriate traffic management strategies are
either "encourage" or "accept." "Discourage" or "prohibit" strategies may be
employed for certain classes of vehicles or users.
Level 4 Assigned to roads that provide a moderate degree of user comfort and
convenience at moderate travel speeds. Most roads are double lane and
aggregate surfaced. However, some roads may be single lane. Some roads
may be paved and/or dust abated. The most appropriate traffic management
strategy is "encourage." However, the "prohibit" strategy may apply to
specific classes of vehicles or users at certain times.
Level 5 Assigned to roads that provide a high degree of user comfort and convenience.
These roads are normally double lane, paved facilities. Some may be
aggregate surfaced and dust abated. The appropriate traffic management
strategy is "encourage."

49
Figure 1. Road Definitions
DEFINITIONS
FS Manual Forest Development Road – A forest road under the jurisdiction of the Forest Service. (FSM 7705) Forest Development Trail – As defined in 36 CFR 212.1 and 261.2, those trails wholly or partly within or adjacent to and serving, the National Forests and other areas administered by the Forest Service that have been included in the Forest Development Transportation Plan. (FSM 2353.05.2) Four-Wheel Drive Way – A forest development road included in the Forest development Transportation Plan and commonly used by four-wheel drive, high-clearance vehicles with a width greater than 50 inches. (FSM 2353.05.3) Forest Development Transportation System Facilities – Those facilities, including forest development roads, forest highways, bridges, culverts, trails, parking lots, log transfer facilities, road safety and other appurtenances, and airfields, in the transportation network (FSM 7710.5) and under Forest Service jurisdiction. (FSM 7705) Transportation Network – All existing and proposed roads, trails, airfields, and other transportation facilities wholly or partly within or adjacent to and serving the National Forests and other areas administered by the Forest Service or intermingled private lands. (FSM 7710.5) Trail – A commonly used term denoting a pathway for purposes of travel by foot, stock, or trial vehicles. (FSM 2353.05.7.) Trail vehicles – Vehicles designed for trail use, such as bicycles, snowmobiles, trail bikes, trail scooters, and all terrain vehicles (ATV). (FSM 2353.05.8.)
--------------<>--------------
36 CFR DEFINITIONS (Interim Road Rule) UNDER 36 CFR 212.13 TEMPORARY SUSPENSION OF ROAD CONSTRUCTION IN UNROADED AREAS. (a) Definitions. The special terms used in this section are defined as follows:
1. Road. A vehicle travel way of over 50 inches wide. As used in this section, a road may be classified or unclassified.
(I) Classified road. A road that is construction or maintained for long-term highway vehicle use. Classified roads may be public, private, or forest development.

50
(II) Unclassified road. A road that is not constructed, maintained, or intended for long-term highway use, such as, roads constructed for temporary access and other remnants of short term use roads associated with fire suppression, timber harvest, and oil, gas, or mineral activities, as well as travel ways resulting from off-road vehicle use.
2. Forest development trail means a trail wholly or partly within or adjacent to and serving a part of the National Forest System and which has been included in the Forest Development Trail System Plan.
3. Unroaded Area. An area that does not contain classified roads.
--------------<>-------------- DRAFT EIS ROADLESS AREA CONSERVATION
DEFINITIONS
Road. A motor vehicle travelway over 50 inches wide, unless classified and
managed as a trail. A road may be classified or unclassified. *
(1) Classified road. A road within the National Forest System planned or
managed for motor vehicle access including state roads, county
roads, private roads, permitted roads, and Forest Service roads.*
(2) Unclassified road. A road not intended to be part of, and not managed as part of, the forest transportation system, such as temporary roads,
unplanned roads, off-road vehicle tracks, and abandoned travelways.*
*(Note: These definitions are the same as those found in the Federal Register/ Vol. 65, No. 43, Friday, March 3, 2000/ Proposed Rules for the Road Management Policy) The draft EIS does not contain a definition for trail. For definition of trail, see FSM 2353.05.7 above. Unroaded area. Any area, without the presence of a classified road, of a size and configuration sufficient to protect the inherent characteristics associated with its unroaded condition. (note: the operative word here is “classified”) Unroaded portion of an inventoried roadless area. A portion of an inventoried roadless area in which no classified road has been constructed since the area was inventoried. (note: the operative word here is “classified”)

51
Road construction. A capital improvement that results in the addition of new road miles to the forest transportation system. Road reconstruction. A capital improvement that requires the alteration or expansion of a road and usually results in realignment, improvement, or rebuilding as defined as follows:
(1) Realignment. Construction activities that result in the new location of an existing road or portions of roads in order to expand its capacity, change its original design function, or increase its traffic service level. The investment may include decommissioning the abandoned sections of roadway.
(2) Improvement. Construction activities that are needed to increase a road’s traffic service level, expand its capacity, or change its original design function.
(3) Rebuilding. Construction activities that are needed to restore a road to its approved traffic service level and that result in increasing its capacity or changing its original design function.
Road maintenance. The ongoing minor restoration and upkeep of a road necessary to retain the road’s approved traffic service level.
--------------<>--------------

52
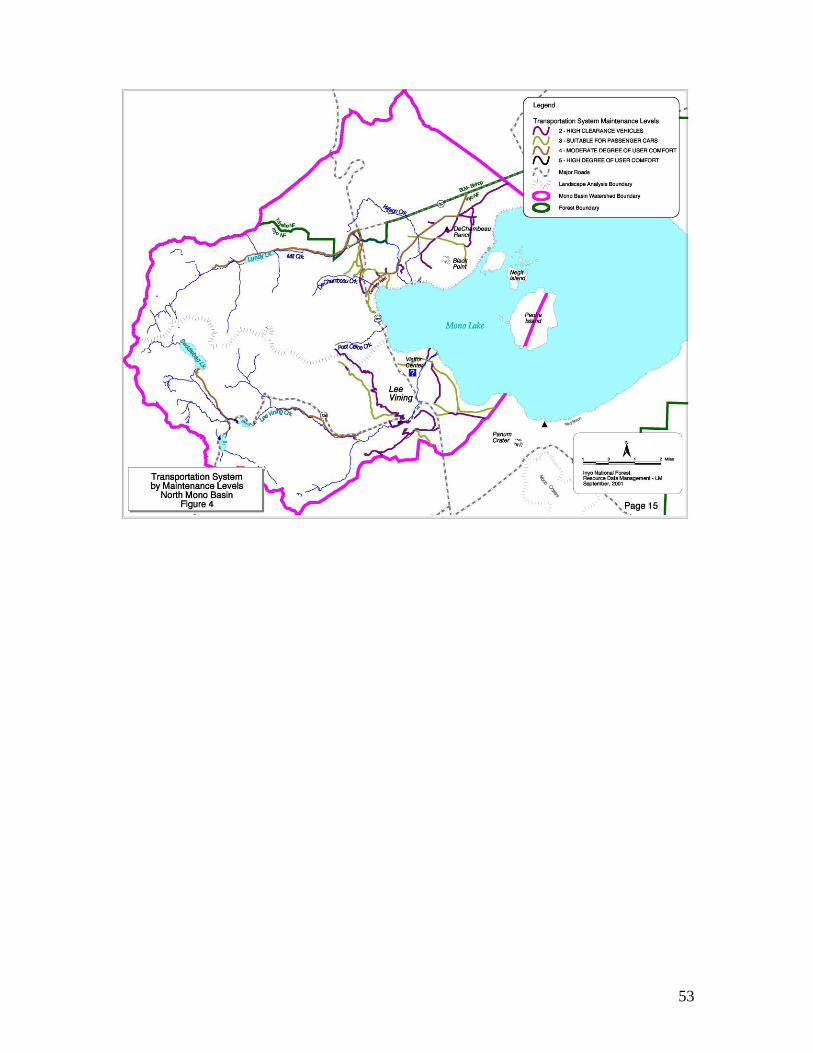
53

54

55

56

57
APPENDIX 1
PLANNING DIRECTION
58
Sierra Nevada Forest Plan Amendment, Environmental Impact Statement, Record of
Decision, January 2001
F. Other Procedural Requirements and Management Direction
Roads Analysis
This decision will follow the national roads policy. Road management in Sierra Nevada
national forest will emphasize five key components:
1) A program of decommissioning and closure of unneeded roads and roads causing
unacceptable environmental impacts;
2) A program of reconstruction and maintenance of needed roads to restore
watershed and ecosystem health;
3) An ecosystem analysis process that will include analysis of the transportation
system, including environmental effects and needs for road access;
4) Management decisions for individual roads made at a local level using
environmental analysis and public involvement as appropriate.
5) This decision will also require the Sierra Nevada national forests to conduct an
integrated, interdisciplinary transportation analysis, following the national roads
analysis procedures, as part of landscape analysis. Finally, each national forest
will complete inventories of unclassified roads within ten years.
Appendix A, Land Allocations and Associated Standards and
Guidelines, 14. Riparian Conservation Areas, RIPARIAN
CONSERVATION OBJECTIVE #1 Standards and Guidelines
Implement soil quality standards for soil loss, detrimental soil compaction, and organic
matter retention to minimize the risk of sediment delivery to aquatic systems from
management activities. Ensure that management-related activities, including roads, skid
trails, landings, trails, or other activities, do not result in detrimental soil compaction on
more than 5 percent of the RCA or 10 percent of the area in CARs. Measure compaction
using the procedures outlined in Appendix F of the FFIS.
Identify existing and potential sources of sediment delivery to aquatic systems.
Implement preventive and restoration measures, such as modifying management
activities, increasing ground cover, reducing the extent of compacted surfaces, or
revegetating disturbed sites to reduce or eliminate sediment delivery from these sources
to aquatic systems.
Mono Basin National Forest Scenic Area, Comprehensive Management
Plan, 1989
Chapter III – Management Direction
3. FACILITIES
59
GOAL – Maintain a transportation system that provides suitable access while
protecting the emphasized values of the Scenic Area. Maintain roads at the assigned
maintenance levels. …Provide distinctive non-interpretive signing only to the extent
necessary to identify the Scenic Area as a component of the National Forest System,
and to provide for the safety of visitors, protection of resources, and basic location
directions.
FOREST STANDARDS AND GUIDELINES:
Provide additions to the transportation system for resource development, Provide
public access to public land and developed recreation sites consistent with Forest
goals and objectives.
Reconstruct road and regulate traffic as needed for public safety and/or resource
protection.
Eliminate concerns regarding public safety and resource protection through road
closures, relocation, or reconstruction of non-system roads consistent with available
budgets.
SCENIC AREA STANDARDS AND GUIDELINES:
To the largest extent possible, insure that signing does not detract from the visual
values and the non-developed character of the Scenic Area.
Outside of developed sites, sign only to the extent necessary to provide for safety of
visitors, protection of resource values, and for interpretation.
10. RECREATION AND INTERPRETATION
GOAL - …Provide a full range of dispersed recreational opportunities in all ROS
classes including motorized use on designated routes. Maintain an atmosphere for
solitude over major portions of the Scenic Area.
FOREST STANDARDS AND GUIDELINES:
Coordinate Forest off-highway vehicle planning and funding with Federal, state
and local agencies, and private land owners where appropriate.
Designate OHV/OSV trails and open areas to minimize conflicts with existing or
potential developed sites, private property, special uses, adjacent wilderness,
administrative areas, cultural resources, riparian areas, key wildlife habitat, and
sensitive watershed areas.
When necessary, close critical wildlife and fish habitat to OHV/OSV use.
Do not permit recreational use of wheeled vehicles over snow except in designated
areas.

60
SCENIC AREA STANDARDS AND GUIDELINES:
Except as otherwise provided for in special use permits or elsewhere in this plan
…, use (including use on relicted lands) by motorized vehicles will be allowed on
existing designated routes and parking areas not posted as closed.
Non-motorized bicycle use will be allowed only on designated routes open to
motorized vehicles or on specifically designated bicycle routes.
Appendix B – Scenic Area Prescriptions
Developed Recreation Zone - The purpose is to maintain existing developments and
provide for new services and/or facilities in support of visitor use needs.
Recreation Improve roads when necessary to provide for heavy public use and
protect
the natural integrity. If resource values are threatened, close
roads, restrict access, or otherwise resolve the issue …
Construct or relocate new 2WD roads to avoid sensitive areas, to
provide access to developed sites, and to provide for public safety.
General Use Zone – The purpose is to manage for inherent values including range,
wildlife, recreation and visual resources. There are a variety of activities which can
occur with a minimum of conflict. Improvements that do not significantly affect scenic
or other natural values are allowed. Improvements might include projects to benefit
wildlife, grazing, recreation and interpretation.
Recreation Construct or relocate 2WD roads to avoid sensitive areas, to
provide
access to developed sites, and provide for public safety. If
resource values are threatened, or roads are not needed to
accommodate access, or otherwise resolve the issue, …
Limited Development Zone – The purpose is to provide for relatively undisturbed areas
where human influence is limited and wildlife, visual, and other natural values
generally take precedence.
Recreation If resource values are threatened, or roads are not needed to
accommodate
appropriate public use, close roads, restrict access, or otherwise
resolve the issue, …
No Development Zone – The purpose is to provide areas free of surface disturbance
and to maintain cultural, geologic, ecological, and visual values in essentially natural
conditions.
The emphasis is on providing protection to natural features by whatever means are
necessary, but favoring avoidance or restriction of access.

61
Recreation Consider closing or restricting access on existing roads, …
Inyo National Forest – Land and Resource Management Plan – 1988
FOREST-WIDE STANDARDS AND GUIDELINES
Facilities
Provide additions to the transportation system for resource development. Provide
public access to public land and developed recreation sites, consistent with Forest
goals and objectives.
Reconstruct and regulate traffic as needed for public safety and/or resource
protection.
Address concerns for public safety and resource protection through road closure,
relocation or reconstruction of non-system roads consistent with available budgets.
Consider mass transit options when vehicle use exceeds the capacity of existing
roads or threatens to damage resource values or when public facilities can best be
served by a community-wide system proposed by another entity.
Utilize existing developed facilities, roads, and trails for both summer and winter
recreation activities, whenever possible, before developing new ones for exclusive
seasonal use.
MANAGEMENT PRESCRIPTIONS
Concentrated Recreation Area (#12)
Recreation Allow OHV use on designated routes and trails. OSVs may be
used off
roads and trails unless restricted by the Winter Motor Vehicle Use
Map.
Dispersed Recreation (#16)
Recreation Permit OSV use in corridors as identified on the Winter Motor
Vehicle
Use map. Allow OHV use only on designated roads and trails.
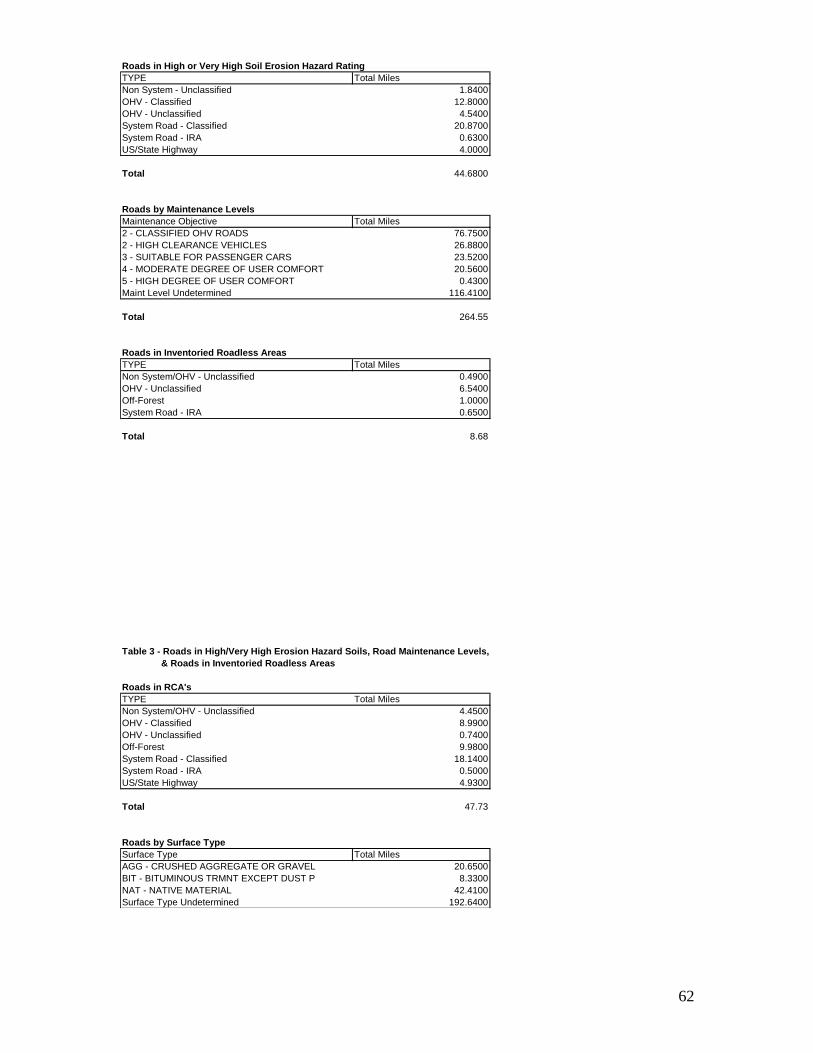
62
Roads in High or Very High Soil Erosion Hazard Rating
TYPE Total Miles
Non System - Unclassified 1.8400
OHV - Classified 12.8000
OHV - Unclassified 4.5400
System Road - Classified 20.8700
System Road - IRA 0.6300
US/State Highway 4.0000
Total 44.6800
Roads by Maintenance Levels
Maintenance Objective Total Miles
2 - CLASSIFIED OHV ROADS 76.7500
2 - HIGH CLEARANCE VEHICLES 26.8800
3 - SUITABLE FOR PASSENGER CARS 23.5200
4 - MODERATE DEGREE OF USER COMFORT 20.5600
5 - HIGH DEGREE OF USER COMFORT 0.4300
Maint Level Undetermined 116.4100
Total 264.55
Roads in Inventoried Roadless Areas
TYPE Total Miles
Non System/OHV - Unclassified 0.4900
OHV - Unclassified 6.5400
Off-Forest 1.0000
System Road - IRA 0.6500
Total 8.68
Table 3 - Roads in High/Very High Erosion Hazard Soils, Road Maintenance Levels,
& Roads in Inventoried Roadless Areas
Roads in RCA's
TYPE Total Miles
Non System/OHV - Unclassified 4.4500
OHV - Classified 8.9900
OHV - Unclassified 0.7400
Off-Forest 9.9800
System Road - Classified 18.1400
System Road - IRA 0.5000
US/State Highway 4.9300
Total 47.73
Roads by Surface Type
Surface Type Total Miles
AGG - CRUSHED AGGREGATE OR GRAVEL 20.6500
BIT - BITUMINOUS TRMNT EXCEPT DUST P 8.3300
NAT - NATIVE MATERIAL 42.4100
Surface Type Undetermined 192.6400

63
Roads intersecting known noxious weed sites
TYPE MILES
Non System/OHV - Unclassified 0.01
OHV - Classified 1.60
System Road - Classified 1.93
US/State Highway 0.06
Total Miles 3.60
Same as above but with more detail
TYPE Maintenance Levels SPECIES MILES
Non System/OHV - Unclassified Verbascum thapsus 0.01
OHV - Classified Bassia hyssopifolia 0.17
OHV - Classified Bromus tectorum 0.04
OHV - Classified Salsola tragus 0.33
OHV - Classified Tamarix ramosissima 0.99
OHV - Classified Verbascum thapsus 0.07
System Road - Classified 2 - HIGH CLEARANCE VEHICLES Bromus tectorum 0.07
System Road - Classified 2 - HIGH CLEARANCE VEHICLES Salsola tragus 0.83
System Road - Classified 2 - HIGH CLEARANCE VEHICLES Tamarix ramosissima 0.16
System Road - Classified 2 - HIGH CLEARANCE VEHICLES Verbascum thapsus 0.05
System Road - Classified 3 - SUITABLE FOR PASSENGER CARS Lepidium latifolium 0.07
System Road - Classified 3 - SUITABLE FOR PASSENGER CARS Tamarix ramosissima 0.75
US/State Highway Lepidium latifolium 0.06
Total Miles 3.60
MAINTENANCE LEVEL SURFACE_TYPE MILES
3 - SUITABLE FOR PASSENGER CARS NAT - NATIVE MATERIAL 3.61
3 - SUITABLE FOR PASSENGER CARS NAT - NATIVE MATERIAL 0.26
4 - MODERATE DEGREE OF USER COMFORT AGG - CRUSHED AGGREGATE OR GRAVEL 3.40
3 - SUITABLE FOR PASSENGER CARS NAT - NATIVE MATERIAL 0.72
3 - SUITABLE FOR PASSENGER CARS NAT - NATIVE MATERIAL 3.66
3 - SUITABLE FOR PASSENGER CARS NAT - NATIVE MATERIAL 2.66
4 - MODERATE DEGREE OF USER COMFORT AGG - CRUSHED AGGREGATE OR GRAVEL 6.52
4 - MODERATE DEGREE OF USER COMFORT BIT - BITUMINOUS TRMNT EXCEPT DUST P 5.95
4 - MODERATE DEGREE OF USER COMFORT BIT - BITUMINOUS TRMNT EXCEPT DUST P 0.04
26.82
Streams for the H5 Watershed
Streams by Type Total Miles
Perennial 85.17
Intermittent 97.76
Ephemeral 34.15
Total 217.08
64
Appendix E
North Mono Basin Landscape Analysis
Existing and Desired Condition for Riparian Vegetation
Mill, Wilson, DeChambeau, and Post Office Creeks, on National Forest System Lands
Kathleen Nelson, June 28, 2001
Existing Condition
Much of the information presented below is drawn from internal reports. Two of the
primary sources are 1) Hydrologic Condition Assessment for the north Mono Basin
(USDA Forest Service 2001b) and 2) a summary report of the history of water diversions
and riparian conditions in the north Mono Basin (USDA Forest Service 2001a).
Stream systems in the northwestern Mono Basin have a long history of human
manipulation of flows, primarily for the purposes of hydroelectric power generation and
irrigation for agricultural uses. As a result of these activities, the extent, distribution, and
diversity of riparian vegetation communities has been altered from pre-settlement
conditions. Prior to the construction of the various irrigation ditches and the first
hydroelectric plant on Mill Creek, average annual flows in Mill Creek were
approximately 29 cfs (cubic feet per second), ranging from 12 to 56 cfs, and with a daily
flow ranging from 0 to 267 cfs. In comparison, for the same time period, Wilson Creek
has been described as a small ephemeral stream, dry for many months of the year (Stine
1991). Streamflow may have been as high as 10 cfs during years of abnormally high
snowmelt, but even in these years flow usually ceased by early July. In DeChambeau
Creek, average annual flows are 15cfs (USDA Forest Service 2001b). The portion of
DeChambeau Creek that crosses National Forest System lands, is upstream of the
manipulated sections of this creek, i.e. Upper and Main Thompson Ditches, and
Thompson Ranch. That portion of Post Office Creek on National Forest System lands,
and Mill Creek above Lundy Lake have also been unaffected by manipulation of flows in
the Mono Basin.
Beginning in the mid to late 19th
century, flows in the northwestern Mono Basin began to
be diverted. Mill Creek now receives only a small percentage of its natural flows. Much
of the water that once flowed down Mill Creek to Mono Lake is now diverted through the
Lundy tailrace, then on to Conway Ranch, and into Wilson Creek. These diversions have
increased the flow of Wilson Creek by one to two orders of magnitude. At the

65
DeChambeau Ditch diversion point, Wilson Creek splits into two “channels”: 1) the
Lower DeChambeau Ditch, which follows the original Wilson Creek channel that flows
towards DeChambeau Ranch, and 2) the Wilson Creek “arroyo”, a large drainage that
was cut when the high flows from Mill Creek were diverted out of DeChambeau Ditch, to
protect DeChambeau Ranch from potential flood damage.
As a result of this history, (more complex than the very brief overview provided here),
riparian vegetation on Mill Creek and Wilson Creek have changed significantly since pre-
settlement times.
The condition of riparian communities on the various stream reaches on National Forest
System lands in the northern Mono Basin is almost completely dependent on the timing
and location of flows. Numerous and complex effects on riparian vegetation from
changes in flow regimes have been recorded. Recently rewatered streams in the Mono
Basin have provided an opportunity to observe locally the recovery process when water is
returned to the system. Increased community diversity of the riparian zone on Rush
Creek has been observed, as well as an increase in area covered by riparian obligate
vegetation, and a decrease in non-riparian and upland species, or bare ground.
Contributing to these changes on Rush Creek were: 1) increased diversity created by
hydrological processes which created new floodplains, 2) the increase in mesic microsites
away from the channel, and 3) the cessation of livestock grazing. (Kauffman, et.al.
2000).
In his study of riparian vegetation of Eastern Sierra streams, which included streams in
the Mono Basin, Dean Taylor (1982) found streamflow and riparian width to be highly
correlated, at least for streams with greater than 3.5 and less than 35 cfs mean annual
flowrate. Other factors that showed a correlation with riparian vegetation width included:
1) incision index - steeper gradient streams have narrower riparian strips, and 2)
elevation, due to higher precipitation, gaining reaches nearer to headwaters and more
losing reaches once the streams leave the mountains, and lower evapotranspiration rates
at higher elevation. A positive relationship also exists between flowrates and the number
of distinct vegetation types a particular stream supports, as well as between mean
flowrates and plant species diversity.
He also noted that, all other factors being equal, higher instream flowrates generally
correlate with greater lateral percolation of water away from the stream channel, resulting
in higher productivity and greater species richness.
Mill Creek
Ford (USDA Forest Service 2001a) notes that until the mid-1880‟s, a wide continuous
riparian corridor existed on Mill Creek, characterized by Jeffrey pines and quaking aspen
in the upper reaches, and a dense, multi-storied cottonwood dominated stand in the lower
reaches. Under natural conditions, the interior delta area (defined as the area upstream of
the present crossing of Cemetery Road), was characterized by several channels, which
distributed the flow across the valley bottom. Riparian vegetation was present along the
narrow distributaries, and on the interfluves that separated them, as suggested by the dead
snags remaining today (USDA Forest Service 2001b).

66
There seems to have been enough water to maintain riparian vegetation sufficient to
minimize streambank erosion throughout the past century in the reach of Mill Ck above
the bottomlands. According to Taylor (1982), the reach above Upper Thompson and the
Return Ditch supports a well developed aspen dominated riparian community, while Mill
Creek just below Highway 395 supports declining stands of Jeffrey pine and black
cottonwood. Further downstream, the riparian vegetation continues to decline, with the
reaches on DWP land nearly devoid of riparian species with the exception of a few
depauperate clumps of narrowleaf willow. This observation is further supported by Stine,
who notes that only a small amount of vegetation had colonized the existing channels in
these reaches (1991). The lowermost reach appears to have been dewatered routinely
between the 1890s and 1920, resulting in the loss of riparian woodland on the delta.
(USDA Forest Service 2001b). Photos show that most of the riparian stand in the lower
reaches had already been lost by 1929. Now, long-dead remnants of trees and shrubs
testify to the once widespread woodland. Since 1960, additional water has allowed for
re-establishment of some riparian vegetation in parts of lower Mill Ck (USDA Forest
Service 2001b); however, much of the system of multiple channels has been abandoned
and the single existing channel remains wide and ill defined along most of its length.
Braiding is evident in some places but there is no indication of a return to a system of
narrow distributary channels (USDA Forest Service 2001a, b).
More detailed information on the riparian communities found along Mill, Wilson, and
DeChambeau Creeks was collected by the Point Reyes Bird Observatory (PRBO) in 1998
(USDA Forest Service 1998). In support of the songbird surveys being conducted by
PRBO in the Mono Basin and elsewhere on the Inyo National Forest, observations on the
type and extent of riparian vegetation was made in several locations. Each site visited
was placed in a series as defined in A Manual of California Vegetation (MCV) (Sawyer
& Keeler-Wolf 1995).
From the Lundy dam to Upper Thompson Ditch (no sites were located between Upper
Thompson Ditch and 395), the PRBO study classified 13 of 15 sites as in the aspen
series, and two montane wetland shrub habitat sites. The 15 vegetation sites were more
or less evenly distributed along the reach. In the aspen sites, riparian width ranges from
50 to 150 meters wide, averaging 94 meters. MCV describes the aspen series as having
aspen as the sole or dominant tree species, or as an important tree with red fir or white fir
in the canopy. Trees are generally less than 35 meters in height, and the canopy may be
continuous, intermittent, or open. Shrubs may be common or infrequent. The ground
layer is typically abundant, if not grazed. Soils are generally seasonally or permanently
saturated. The national inventory of wetland plants (Reed 1988) lists aspen as a FAC+.
The FAC (facultative) rating means that it is equally likely to occur in wetlands or
nonwetlands; however, the “+” indicates that it is more frequently found in wetlands than
not. It is noted that aspen stands may be transitional or self-perpetuating.
The riparian width in the two montane wetland shrub sites was 120 and 150 meters wide.
Montane wetland shrub habitat is characterized by having willows as the sole or
dominant shrubs in the canopy. Emergent trees may be present. Shrubs are generally
less than 10 meters in height. Canopy cover in a healthy community is typically

67
continuous. The ground layer can be variable. This habitat typically occurs on
seasonally flooded or saturated sites. Willow species found in the vicinity of the Mono
Basin are all either FACW (facultative wetland) or OBL (obligate) wetland species (Reed
1988). Facultative wetland species are those that usually occur in wetlands, but are
occasionally found in nonwetlands. Obligate species are those that occur almost always
in wetlands under natural conditions. Species composition of montane willow thickets
varies, and definitive descriptions are lacking at this point in time. Montane wetland
shrub is currently designated as a “habitat” in MCV rather than as a series, due to the
localized fine scale of existing information, and/or the lack of available information
needed to classify it as a series.
From Highway 395 to the east edge of the private land boundary (Mono City), riparian
vegetation observations were made on seven sites. Four of these were classified as black
cottonwood sites, with riparian width ranging from 30 to 70 meters, averaging 53 meters.
The black cottonwood series has black cottonwood as the sole, dominant, or important
tree in the canopy. Other species that may be present include aspen, Fremont
cottonwood, Jeffrey pine, lodgepole pine, narrowleaf willow, Scouler willow, western
juniper, white fir, and/or yellow willow. Trees are generally less than 25 meters in
height. Canopy cover is continuous or intermittent. Shrubs are common. The ground
layer may be abundant or sparse. Soils that support the black cottonwood series are
seasonally flooded or permanently saturated. The national inventory of wetland species
lists black cottonwood as a FACW.
One site on this reach below 395 was recorded as the montane wetland shrub habitat,
with a 45 meter riparian width. The remaining two sites were named simply as “tree”,
with Jeffrey pine being a dominant tree species. The riparian width on these two sites is
40 and 30 meters wide. The Jeffrey pine series is described strictly as an upland
vegetation type in MCV, and is not indicative of the Jeffrey pine community that is found
in association with riparian sites in the eastern Sierra.
From the east edge of the private land boundary (Mono City) to the Forest Service/Los
Angeles Department of Water and Power (DWP) boundary, three sites were visited by
PRBO. One of these was classified in the black cottonwood series, with a 40 meter
riparian width. The remaining two sites are included in the montane wetland shrub
habitat. The riparian width on these two sites was estimated at 35 and 45 meters.
In summary, the upper reaches of Mill Creek below Lundy Lake continue to support
riparian vegetation communities, though the extent and diversity of these communities
may not equal what was supported by natural flows. On the lower reaches of Mill Creek,
riparian condition is severely degraded, with either no riparian vegetation at all, or sparse,
scattered vegetation represented by few species, with little to no vertical structure or
diversity.
Wilson Creek
68
Wilson Creek, between Hwy 167 and DeChambeau Ditch, currently supports a narrow
riparian corridor, composed mainly of willow shrubs or low trees, with a mostly single
storied canopy showing dieback of willows and scattered cottonwoods. There is low
structural or species diversity. This vegetation has been maintained by historical and
ongoing diversions from Mill Creek.
Below the DeChambeau Ditch diversion point, the riparian vegetation becomes more
sparse, until it disappears almost entirely in the vicinity of the lower Wilson Creek
arroyo. This area is deeply incised, and is contributing sediment to the Black Point
Marsh (USDA Forest Service 2001b).
DeChambeau Ditch also currently supports a narrow riparian corridor of primarily
narrowleaf willow.
During the Point Reyes Bird Observatory study, eight sites were visited along the
National Forest portions of Wilson Creek between Hwy 167 and DWP land. All seven
sites above the DeChambeau Ditch diversion were classified as montane wetland shrub
habitat, with riparian width ranging from 10 to 70 meters, and averaging 36 meters. The
single site just below the diversion point, on the “arroyo” branch of lower Wilson Creek,
was also classified as montane wetland shrub, with a 15 meter riparian width.
While no sites were recorded by PRBO as the narrowleaf willow series, this series does
occur in the analysis area, most notably on Wilson Creek, including DeChambeau Ditch.
The presence of more than one willow species may have caused some of this area to be
classified as montane wetland shrub habitat in the PRBO study. The narrowleaf willow
series is described in MCV as having narrowleaf willow as the sole or dominant shrub in
the canopy. Fremont cottonwood, white alder, and/or other willow species may be
present. Shrubs are generally less than 7 meters in height, and provide a mostly
continuous canopy cover in healthy systems. The ground layer is variable. Habitats that
support the narrowleaf willow series are typically seasonally flooded or saturated. The
national list of wetland plants lists narrowleaf willow as an OBL species (Reed 1988).
Narrowleaf willow thickets often occur along margins of streams and rivers that are
continually disturbed by point-bar deposition.
While none of the PRBO sites were located on the DeChambeau Ditch, the likely
classification for this portion of the Wilson Creek system would be narrowleaf willow, as
discussed above.
DeChambeau Creek
From the private land boundary upstream to the headwaters, this section of DeChambeau
Creek has not had a history of diversions. According to the work completed by PRBO,
the portion of DeChambeau Creek on National Forest System lands just above the private
parcels is in the aspen series. Three sites were recorded in this reach. Riparian width on
these sites ranged from 60 to 100 meters, averaging 75 meters.

69
Post Office Creek
Unlike Mill and Wilson Creeks, Post Office Creek didn‟t have an appreciable nickpoint,
so it didn‟t incise when Mono Lake levels receded due to DWP diversions (Stine 1991).
Also unlike Mill and Wilson Creeks, Post Office Creek has not been affected noticeably
by past or current diversions in the Mono Basin.
Desired Condition
Existing management direction that is pertinent to desired riparian condition in the north
Mono Basin analysis area is listed below, including that from the Sierra Nevada Forest
Plan Amendment (USDA Forest Service 2001c).
Sierra Nevada Forest Plan Amendment
Desired Future Conditions:
-Habitat supports viable populations of native and desired non-native plant, invertebrate,
and vertebrate riparian and aquatic-dependent species. New introductions of invasive
species are prevented. Where invasive species are adversely affecting the viability of
native species, the appropriate State and Federal wildlife agencies have reduced impacts
to native populations.
-Species composition and structural diversity of plant and animal communities in riparian
areas, wetlands, and meadows provide desired habitat conditions and ecological
functions.
-The distribution and health of biotic communities in special aquatic habitats (such as
springs, seeps, vernal pools, fens, bogs, and marshes) perpetuates their unique functions
and biological diversity.
-Spatial and temporal connectivity for riparian and aquatic-dependent species within and
between watersheds provides physically, chemically and biologically unobstructed
movement for their survival, migration and reproduction.
-The connections of floodplains, channels, and water tables distribute flood flows and
sustain diverse habitats.

70
-Soils with favorable infiltration characteristics and diverse vegetative cover absorb and
filter precipitation and sustain favorable conditions of stream flows.
-In-stream flows are sufficient to sustain desired conditions of riparian, aquatic, wetland,
and meadow habitats and keep sediment regimes as close as possible to those with which
aquatic and riparian biota evolved.
-The physical structure and condition of stream banks and shorelines minimizes erosion
and sustains desired habitat diversity.
Comprehensive Management Plan for the Mono Basin National Forest Scenic Area
(USFS 1989):
Goals:
Manage vegetation to provide a diversity of species composition and structure.
Inyo National Forest Land and Resource Management Plan (USFS 1988):
Scenic Area Standards and Guidelines:
Increase vegetative diversity using a variety of means including prescribed burning.
Promote the health of ecosystems through reductions in grazing, protection of wetland
areas, revegetation of native plant species, and habitat restoration where appropriate.
Control plant species identified as “noxious weeds”.
Scenic Area Management Prescriptions:
Allow management activities to maintain or enhance wildlife and fish habitat and to
provide for diversity of vegetative species and structure.
The following discussion of desired condition for Mill, Wilson, DeChambeau, and Post
Office Creeks incorporates the intent of the management direction listed above. It is
based on the correlations between stream flow and riparian vegetation discussed in the
existing condition section. In addition, the following assumptions are made, based on
interdisciplinary team discussion:

71
- Based on Mono County‟s use of its water right for fish rearing and irrigation,
approximately 12 to 15 cfs should continue to flow in the DeChambeau Ditch in
the spring and summer months, and in the portion of Wilson Creek above the
DeChambeau Ditch diversion point.
- The lower Wilson Creek arroyo will be dewatered, from the DeChambeau Ditch
diversion point down to Mono Lake.
- The entire water available for reallocation after other needs are met (Mono
County fish rearing, Conway Ranch, Thompson Ranch, DeChambeau Ranch,
DeChambeau ponds, County ponds) will flow in Mill Creek from the Return
Ditch down to Mono Lake.
- Desired condition for the portion of Mill Creek above the Return Ditch and below
Lundy dam will not be addressed at this time.
Mill Creek, from the Return Ditch to Mono Lake, on National Forest System lands:
Mill Creek once again consists of a wide continuous riparian corridor characterized by
Jeffrey pines and quaking aspen in the upper reaches, and a dense, multi-storied
cottonwood riparian forest in the lower reaches. Total cover is high, averaging 75-90%.
Willow shrubs and other riparian shrub species, such as creek dogwood, occupy the
understory, providing additional structure. For woody species, a variety of age and size
classes exist. Herbaceous cover varies, but consists of a diverse assemblage of native
forb and graminoid species. Bryophytes occupy the streambank in places. Flows are
spread across the valley bottom, in multiple channels.
Wilson Creek, from Hwy 167 to the DeChambeau Ditch diversion point, and from the
diversion point to DeChambeau Ranch:
These reaches do support a narrow corridor of riparian vegetation, though the riparian
width, species richness and structural diversity do not equal that of Mill Creek. Tree
species are largely absent. Narrowleaf willow is the primary shrub species, and
dominates most or all of the riparian corridor. Canopy cover is moderate to high, ranging
from 50-85%, though not as continuous as that provided by the communities found on
Mill Creek. Herbaceous cover varies, and consists of a variety of native forb and
graminoid species. Riparian vegetation does not extend across the entire width of the
floodplain.
Wilson Creek, below the DeChambeau Ditch diversion point (the “arroyo” branch):
Flows are not sufficient to support riparian vegetation. Upland species, such as big
sagebrush, bitterbrush, rabbitbrush, and native perennial grasses have become
established, helping to stabilize erosion-prone surfaces.
Dechambeau, Post Office, and upper Mill (above Lundy) Creeks:
Riparian conditions on these stream reaches continue to be largely unaffected by
management activities, particularly water conveyance. The aspen series is the most
common vegetation series encountered. Jeffrey pine, black cottonwood, lodgepole pine,
and occasional red fir or white fir may occur. Total cover is high. Willow shrubs and

72
other riparian shrub species, such as creek dogwood, occupy the understory, providing
additional structure. For woody species, a variety of age and size classes exist.
Herbaceous cover varies, but consists of a diverse assemblage of native forb and
graminoid species. Bryophytes occupy the streambank in places.
References
Kauffman, J.B., D. Cummings, C. Heider, D. Lytjen, and N. Otting. 2000. Riparian
vegetation responses to re-watering and cessation of grazing, Mono Basin, California. In:
Proceedings, International conference on riparian ecology and management in multi-land
use watersheds. American Water Resources Association. August 28-31, 2000. Portland,
OR. Pp. 251-256.
Los Angeles Department of Water and Power. 1996. Mono Basin waterfowl restoration
plan. Prepared for the State Water Resources Control Board.
Reed, P.B., Jr. 1988. National list of plant species that occur in wetlands: national
summary. U.S. Fish and Wildlife Service Biological Report 88(24). 244 pp.
Sawyer, John O. and Todd Keeler-Wolf. 1995. A manual of California vegetation.
California Native Plant Society. Sacramento, CA. 471 pp.
Stine, Scott. 1991. Extent of riparian vegetation on streams tributary to Mono Lake,
1930-1940: an assessment of the streamside woodlands and wetlands, and the
environmental conditions that supported them. A report to the California State Water
Resources Control Board, and Jones and Stokes, Associates. Sacramento, CA. 73 pp.
plus appendices.
Taylor, Dean W. 1982. Eastern Sierra riparian vegetation: ecological effects of stream
diversions. Mono Basin Research Group Contribution No. 6. ISBN 0-939714-04-3.
Report to Inyo National Forest. Bishop, CA. 56 pp.
USDA Forest Service. 2001. Hydrologic Condition Assessment for the North Mono
Basin. Rick Kettleman, author. Inyo National Forest files. Supervisor‟s office. Bishop,
CA and Lee Vining station, Lee Vining, CA.
USDA Forest Service. 2001. Sierra Nevada Forest Plan Amendment. Final
Environmental Impact Statement. Record of Decision. Pacific Southwest Region. 55
pp. plus appendices.
USDA Forest Service. 1998. Point Reyes Bird Observatory vegetation points for the
northern Mono Basin. Inyo National Forest files, Supervisor‟s Office, Bishop, CA.

73
USDA Forest Service. 1989. Comprehensive Management Plan for the Mono Basin
National Forest Scenic Area. Lee Vining, CA.
USDA Forest Service. 1988. Inyo National Forest land and resource management plan.
Bishop, CA. 317 pp.
USDI Bureau of Land Management. 1997. Preliminary botanical assessment for Wilson
Creek reaches 1-3. Compiled by Anne Halford. Bishop Resource Area, Bishop, CA. 6
pp. plus tables.
74
Appendix F.
Wildlife Species Observed on the Conway Ranch Project Site
Conway Ranch EIR, 1990
Birds
Mallard
green-winged teal
cinnamon teal
turkey vulture
northern harrier
Cooper‟s hawk
Red-tailed hawk
American kestral
Prairie falcon
Sage grouse
Killdeer
Spotted sandpiper
Common snipe
Great blue heron
California gull
Mourning dove
Great-horned owl
Belted kingfisher
Red-breasted sapsucker
Northern flicker
Western wood peewee
Say‟s phoebe
Western kingbird
Violet-green swallow
Northern rough-winged swallow
Cliff swallow
Black-billed magpie
Common raven
Clark‟s nutcracker
Bushtit
Rock wren
Bewick‟s wren
House wren
Marsh wren
Ruby-crowned kinglet
Mountain bluebird
American robin
Sage thrasher
Yellow warbler
Orange-crowned warbler
Yellow-rumped warbler

75
Wilson‟s warbler
Yellow-breasted chat
Lazuli bunting
Green-tailed towhee
Rufous-sided towhee
Savannah sparrow
Brewer‟s sparrow
Chipping sparrow
Lake sparrow
Sage sparrow
Song sparrow
White-crowned sparrow
Golden-crowned sparrow
Western meadowlark
Yellow-headed blackbird
Red-winged blackbird
Brewer‟s blackbird
Brown-headed cowbird
Northern oriole
European starling
House finch
Mammals
Broad-handed mole
Pocket gopher
Black-tailed jackrabbit
Mountain cottontail
California ground squirrel
Belding‟s ground squirrel
Least chipmunk
Long-tailed weasel
Badger
Rocky mountain mule deer
Coyote
Reptiles
Sagebrush lizard

76
Appendix G
Point Reyes Bird Observatory Census – Thompson Ranch
09-10-2001
black-throated gray warbler
mountain chickadee
downey woodpecker
western meadowlark
American robin
Cassin‟s finch
Stellar‟s jay
Bewick‟s wren
black-billed magpie
northern flicker
yellow warbler
spotted towhee
western wood peewee
European starling
06-02-2001
yellow warbler
song sparrow
violet-green swallow
Brewer‟s blackbird
American kestral
northern flicker
European starling
house wren
Bullock‟s oriole
western tanager
western meadowlark
mountain bluebird
Bewick‟s wren
brown-headed cowbird
great horned owl
Stellar‟s jay
Brewer‟s blackbird
black-billed magpie
American robin
song sparrow
western wood peewee
spotted towhee

77
06-16-2001
violet-green swallow
warbling vireo
black-billed magpie
house wren
northern flicker
brown-headed blackbird
Brewer‟s blackbird
American kestral
European starling
Bewick‟s wren
American robin
hairy woodpecker
yellow warbler
lazuli bunting
mourning dove
spotted towhee
red-tailed hawk
07-19-2001
downey woodpecker
northern flicker
brown-headed cowbird
western wood peewee
bewicks wren
violet-green swallow
house wren
Clark‟s nutcracker
hairy woodpecker
black-billed magpie
yellow warbler
red-naped sapsucker
American kestral
Bullock‟s oriole
mourning dove
spotted towhee
western meadowlark
Brewer‟s blackbird
American robin
green-tailed towhee
belted kingfisher

78
07-22-2001
violet-green swallow
northern flicker
warbling vireo
house wren
mountain chickadee
mourning dove
yellow warbler
black-billed magpie
American kestral
Clark‟s nutcracker
Bewick‟s wren
Red-tailed hawk
spotted towhee
western wood peewee
American robin
lazuli bunting

79