Embed Size (px)
Citation preview

ICIC
I S
ecurit
ies –
Retail E
quit
y R
esearch
Result
Update
August 2, 2019
CMP: | 150 Target: | 145 ( -3%) Target Period: 12 months
Apollo Tyres (APOTYR)
HOLD
Replacement demand to the rescue…
Apollo Tyres (ATL) reported a steady performance in Q1FY20 with
replacement volume growth of ~12% in domestic operations helping it
overcome the muted prospects on the OEM front. Consolidated revenues
came in at | 4,331 crore (up 1.0% YoY). Revenues from APMEA increased
0.9% YoY to | 3,142.0 crore while revenue from Europe was up 2.4% YoY
at | 1,238.8 crore. Consolidated EBITDA declined 10.1% YoY to | 475 crore
(EBITDA margins at 11.0%, up 103 bps QoQ). While ATL’s gross margins
expanded 152 bps sequentially, gains were limited due to higher employee
cost as well as higher other expenses. Consequent, consolidated PAT
declined 43.9% YoY to | 141.6 crore.
Muted OEM dispatches to limit volume growth!
Demand prospects for automobile purchases were muted both domestically
as well as globally. Domestically, the situation is grimmer given high channel
inventory with key OEMs reporting a volume decline in the range of 15-35%
for July 2019. This is over and above the 12.4% volume decline witnessed
by the industry in Q1FY20. This will limit the volume growth for ATL, which
realises ~30% of its sales from auto OEMs. The replacement market, on the
other hand (constitute ~60% sales) is healthy and growing healthily in
double digits leading to largely flat to marginal positive volume outlook for
FY20E. In the international markets, especially Europe, the risk of trade
barrier as well as Brexit weigh on consumer demand. Consequently, we
build in sales growth of 6.4% CAGR in FY19-21E.
Increase in rubber prices to limit margin expansion!
Rubber & crude derivatives are key raw materials for tyre manufacturers.
With natural rubber prices on the rise and currently quoting at ~| 150/kg in
the domestic market vs. average landed costs of | 137/kg for ATL in Q1FY20
amid stable crude derivative prices, there exists limited scope for gross
margin & consequent EBITDA margin expansion. However, given the
management commentary on cost controls to aid increase in profitability we
build in 70 bps EBITDA margin expansion over FY19-21E.
Valuation & Outlook
ATL is in the midst of executing an aggressive plan, which entails further
loading of debt on its B/S. The interest coverage ratio, however, is
comfortably placed. Building in positives, we expect sales, PAT (excluding
exceptional loss due to IL&FS deposits) to grow at a CAGR of 6.4%, 5.4%,
respectively, in FY19-21E. At the current margin trajectory, RoCE profile is
also muted at ~8% and offers little comfort. With buoyant replacement
demand- the only solace, we maintain our HOLD rating on the stock with a
revised target price of | 145 i.e. 9X P/E on FY21E EPS of | 16.2/share.
Key Financials FY17 FY18 FY19 FY20E FY21E CAGR (FY19-21E)
Net Sales 13,180.0 14,840.5 17,548.8 18,656.6 19,873.4 6.4%
EBITDA 1,846.4 1,651.3 1,958.9 2,128.8 2,357.5 9.7%
EBITDA Margins (%) 14.0 11.1 11.2 11.4 11.9
Net Profit 1,098.6 723.9 680.0 847.5 925.1 16.6%
EPS (|) 19.2 12.7 11.9 14.8 16.2
P/E 7.8 11.9 12.6 10.1 9.3
RoNW (%) 15.1 7.4 8.3 8.0 8.2
RoCE (%) 13.6 7.7 8.0 7.7 8.2
Key Financial Summary
Source: ICICI Direct Research, Company
Particulars
Particular Amount
Market Capitalization | 8581 Crore
Total Debt (FY19) (| Crore) 4,930.7
Cash & Investments (FY19) (| Crore) 562.5
EV (| Crore) 12,948.8
52 week H/L (|) 294 / 144
Equity capital | 57.2 Crore
Face value | 1
Key Highlights
Volume growth was muted for the
quarter tracking weak OEM sales
domestically as well as weak
sentiment in the European markets
Gross margin expanded 150 bps
QoQ with overall gains at the
EBITDA margin being limited to 110
bps due to higher overheads
Management was cautious on the
demand outlook however will
actively engage in increasing
profitability over FY19-21E
Maintain HOLD with a revised target
price of | 145; valuing ATL at 9x P/E
on FY21E EPS. Valuation multiple is
limited by muted return ratios.
Research Analyst
Shashank Kanodia, CFA
Jaimin Desai

ICICI Securities | Retail Research 2
ICICI Direct Research
Result Update | Apollo Tyres
Exhibit 1: Variance Analysis
(| crore) Q1FY20 Q1FY20E Q1FY19 YoY (%) Q4FY19 QoQ (%) Comments
Total Operating Income 4,331 4,351 4,288 1.0 4,274 1.3 Topline came in line with our estimates
Raw Material Expenses 2,453 2,558 2,409 1.8 2,485 -1.3
Savings were realised on the raw material costs front with RM
to sales for the quarter coming in at 56.6%, down 150 bps QoQ
Employee Expenses 642 629 607 5.8 618 3.8
Other expenses 762 720 744 2.4 746 2.2 Other expenses came in higher at 17.6% of sales
EBITDA 475 444 528 -10.1 425 11.8
EBITDA Margin (%) 11.0 10.2 12.3 -135 bps 9.9 103 bps
EBITDA margins were ahead of our estimates tracking beat on
the raw material costs. The gains, however, were limited by
higher employee as well as other expenses
Depreciation 267 220 184 45.2 231 15.5
Interest 58.4 51.4 43.0 35.7 43 34.5
Other income 27.5 11.1 40.6 -32.2 48.5 -43.3
Tax 35.1 46.8 89.8 -60.9 14 144.4 Tax rate came in at its usual run rate of 25%
PAT 141.6 136.8 252.2 -43.9 84.0 68.6
EPS (|) 2.5 2.4 4.4 -43.9 1.5 68.6Beat at the margin level leads to more than anticipated EPS for
Q1FY20
Key Metrics
Revenue (| crore)
India 3,142 3,128 3,114 0.9 3,103 1.2In India, volumes were down ~2% YoY however but sales value
were flat tracking better product mix and marginal price hikes
Europe 1,239 1,223 1,210 2.4 1,253 -1.1
EBIT Margin (%)
India 7.5 NA 8.6 (110) bps 10.9 (340) bps
Europe -1.0 NA -1.5 50 bps 0.9 (190) bps Margins in Europe came in muted at -1%
Source: Company, ICICI Direct Research
Exhibit 2: Change in estimates
(| Crore) Old New % Change Old New % Change Comments
Revenue 18,765 18,657 -0.6 20,587 19,873 -3.5Muted dispatches at OEM front, which forms ~30% of total sales
weigh on forward sales estimates for FY20E, FY21E
EBITDA 2,200 2,129 -3.2 2,492 2,358 -5.4
EBITDA Margin (%) 11.7 11.4 -31 bps 12.1 11.9 -24 bps Broadly maintain our estimates on margin front
PAT 873 848 -2.9 1,025 925 -9.7
EPS (|) 15.3 14.8 -3.2 17.9 16.2 -9.7
EPS estimates revised downward tracking increase in interest costs
& depreciation as company is in the midst of aggressive capacity
expansion
FY20E FY21E
Source: Company, ICICI Direct Research
ICICI Securities | Retail Research 3
ICICI Direct Research
Result Update | Apollo Tyres
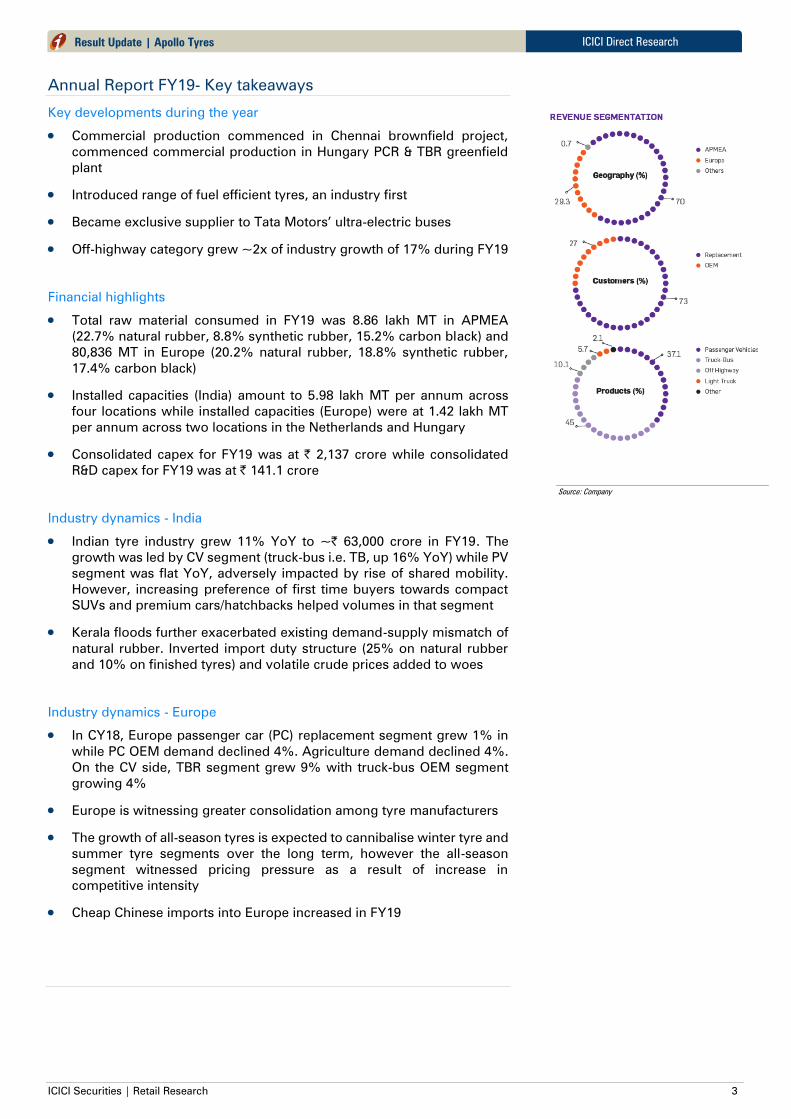
Annual Report FY19- Key takeaways
Key developments during the year
Commercial production commenced in Chennai brownfield project,
commenced commercial production in Hungary PCR & TBR greenfield
plant
Introduced range of fuel efficient tyres, an industry first
Became exclusive supplier to Tata Motors’ ultra-electric buses
Off-highway category grew ~2x of industry growth of 17% during FY19
Financial highlights
Total raw material consumed in FY19 was 8.86 lakh MT in APMEA
(22.7% natural rubber, 8.8% synthetic rubber, 15.2% carbon black) and
80,836 MT in Europe (20.2% natural rubber, 18.8% synthetic rubber,
17.4% carbon black)
Installed capacities (India) amount to 5.98 lakh MT per annum across
four locations while installed capacities (Europe) were at 1.42 lakh MT
per annum across two locations in the Netherlands and Hungary
Consolidated capex for FY19 was at | 2,137 crore while consolidated
R&D capex for FY19 was at | 141.1 crore
Industry dynamics - India
Indian tyre industry grew 11% YoY to ~| 63,000 crore in FY19. The
growth was led by CV segment (truck-bus i.e. TB, up 16% YoY) while PV
segment was flat YoY, adversely impacted by rise of shared mobility.
However, increasing preference of first time buyers towards compact
SUVs and premium cars/hatchbacks helped volumes in that segment
Kerala floods further exacerbated existing demand-supply mismatch of
natural rubber. Inverted import duty structure (25% on natural rubber
and 10% on finished tyres) and volatile crude prices added to woes
Industry dynamics - Europe
In CY18, Europe passenger car (PC) replacement segment grew 1% in
while PC OEM demand declined 4%. Agriculture demand declined 4%.
On the CV side, TBR segment grew 9% with truck-bus OEM segment
growing 4%
Europe is witnessing greater consolidation among tyre manufacturers
The growth of all-season tyres is expected to cannibalise winter tyre and
summer tyre segments over the long term, however the all-season
segment witnessed pricing pressure as a result of increase in
competitive intensity
Cheap Chinese imports into Europe increased in FY19
Source: Company

ICICI Securities | Retail Research 4
ICICI Direct Research
Result Update | Apollo Tyres
Conference call highlights
Management outlook/guidance and demand
The management sees no immediate demand recovery on OEM side but
is bullish on the replacement side. Overall it expects flattish revenue
growth for FY20E and raw material costs to increase slightly
In India, replacement volumes increased 12% YoY to highest ever level.
Replacement: OEM mix stands at 65:35 vs. normal levels of 60:30
Q1FY20 revenue contribution from trucks was 65% (25% bias, 40%
radial) and from cars was 17%
Overall volumes were up 3% QoQ but down 2% YoY. Better mix and
price hikes drove revenue growth.
Europe volumes were down 4% led by 9% decline in Germany.
Agriculture demand remains weak. The company did 5% volume
growth in passenger car tyres and the company sees healthy traction for
this segment going ahead. Truck radial volumes doubled YoY albeit on
a low base
On an overall basis the management expects India revenues to be
flattish for FY20E while Europe is expected to continue to post
improvements on revenue and profit front. India replacement demand
is seen growing in low single digits for the year
Sales, costs and margins
Europe revenues stood at €125 million vs. €120 million YoY, with
margins at 6.7%. Revenues at Reifen were flat YoY at €40 million, with
profit increasing slightly
Margins in the Europe operations are expected to improve given the
continuing Hungary ramp up, marketing cost control efforts and mix
improvement.
Standalone raw material cost for the quarter were at | 128/kg with
landed prices as follows: natural rubber | 137/kg, synthetic rubber
| 115/kg, steel cord | 145/kg & carbon black | 90/kg
Some part of higher staff and depreciation costs in India are expected to
sustain
Apollo undertook a price hike in August to the tune of 1-1.5% across
M&HCV & PV SKUs. It also took a price hike in European truck business
Other
FY20E capex guidance is | 2,700 crore (India) & €30 million (Europe).
FY21E capex guidance is ~| 1,700 crore (India) & €20-30 million (Europe)
In India, TBR capacity utilisation was at 90% while that for PCR was at
~80%
In Europe, passenger car capacity utilisation stands at 70% while that for
trucks stands below 50%
The company would defer half of the capex in Phase 1 of the Andhra
Pradesh plant, planning to achieve savings of | 400-500 crore as a result
Consolidated net debt levels were at ~| 5,500 crore, of which India net
debt stands at | 3,000 crore. Company expects debt levels to peak out
in FY21E

ICICI Securities | Retail Research 5
ICICI Direct Research
Result Update | Apollo Tyres
Financial story in charts
Exhibit 3: Geography wise revenue trend
8,682
8,934
10,300
12,354
13,277
14,260
3,284
4,091
4,630
5,261
5,390
5,614
-
3,000
6,000
9,000
12,000
15,000
18,000
21,000
FY16
FY17
FY18
FY19
FY20E
FY21E
(| crore)
India Europe
Source: Company, ICICI Direct Research
Exhibit 4: Consolidated revenue trend
13,180
14,841
17,549
18,657
19,873
11.2
12.6
18.2
6.3 6.5
0
2
4
6
8
10
12
14
16
18
20
-
3,000
6,000
9,000
12,000
15,000
18,000
21,000
FY17 FY18 FY19 FY20E FY21E
(%
)
(| crore)
Sales % growth
Source: Company, ICICI Direct Research
Exhibit 5: EBITDA margin trend
978
1,166
1,457
1,876
1,931
1,997
1,846
1,651
1,959
2,129
2,358
11.0
9.6
11.4
14.0
15.1
16.9
14.0
11.1
11.2
11.4 11.9
-
2.0
4.0
6.0
8.0
10.0
12.0
14.0
16.0
18.0
-
500
1,000
1,500
2,000
2,500
FY11 FY12 FY13 FY14 FY15 FY16 FY17 FY18 FY19 FY20E FY21E
(%
)
(| crore)
EBITDA EBITDA Margins (%)
Source: Company, ICICI Direct Research
We estimate ~4.8% CAGR (India) and ~5.0% CAGR
(Europe) volume growth during FY19-21E
We expect sales to grow at a CAGR of 6.4 % over
FY19-21E
We expect EBITDA margins at 11.4% and 11.9%, in
FY20E and FY21E, respectively

ICICI Securities | Retail Research 6
ICICI Direct Research
Result Update | Apollo Tyres
Exhibit 6: Margin movement with RM trend
52.4
56.9
50.8
53.4
49.5
49.9
49.2
51.9
52.7
57.2
59.8
58.0
56.3
55.4
56.7
57.8
59.8
59.5
15.8
16.6
17.7
16.1
17.2
16.0 16.3
14.2 14.4
11.1
8.3
10.5
12.312.8
12.3
11.0 11.2
9.9
36
40
44
48
52
56
60
64
4
6
8
10
12
14
16
18
20Q
3FY15
Q4FY15
Q1FY16
Q2FY16
Q3FY16
Q4FY16
Q1FY17
Q2FY17
Q3FY17
Q4FY17
Q1FY18
Q2FY18
Q3FY18
Q4FY18
Q1FY19
Q2FY19
Q3FY19
Q4FY19
(%
)
(%
)
Raw materials/Sales Contribution OPM (LHS)
Source: Company, ICICI Direct Research
Exhibit 7: Profitability trend
440
432
601
1,044
1,015
1,091
1,099.1
723.9
680.0
847.5
925.1
5.0
3.6
4.7
7.8 7.9
9.2
8.3
4.9
3.9
4.5 4.7
2
3
4
5
6
7
8
9
10
-
200
400
600
800
1,000
1,200
FY11 FY12 FY13 FY14 FY15 FY16 FY17 FY18 FY19 FY20E FY21E
(%
)
(| cro
re)
PAT PAT Margin (%)
Source: Company, ICICI Direct Research
Exhibit 8: Profitability trend
1,474
1,242
739 1,602
1,701
3,847
3,479
1,420
3,000
2,000
3,245
4,661
4,931
6,531
7,031
-
1,000
2,000
3,000
4,000
5,000
6,000
7,000
8,000
FY17 FY18 FY19 FY20E FY21E
(| crore)
CFO Capex Debt
Source: Company, ICICI Direct Research
Movement in prices of rubber and crude oil has a
prominent impact on the margin trajectory at tyre
companies including ATL
We build in PAT CAGR of 5.4% (excluding
exceptional items) over FY19-21E.
With high capex spend the Debt is expected to
further increase to ~| 7,000 crore in FY21E

ICICI Securities | Retail Research 7
ICICI Direct Research
Result Update | Apollo Tyres
Exhibit 9: Valuation Summary
Sales Growth EPS Growth PE EV/EBITDA RoNW RoCE
(| cr) (%) (|) (%) (x) (x) (%) (%)
FY17 13,180 11.2 19.2 (2.2) 7.8 6.0 15.1 13.6
FY18 14,841 12.6 12.7 (34.1) 11.9 6.8 7.4 7.7
FY19 17,549 18.2 11.9 (6.1) 12.6 6.6 8.3 8.0
FY20E 18,657 6.3 14.8 24.6 10.1 6.8 8.0 7.7
FY21E 19,873 6.5 16.2 9.2 9.3 6.4 8.2 8.2
Source: Bloomberg, ICICI Direct Research
Exhibit 10: Apollo Tyres currently trades in line with long term two year forward P/E multiple of ~9.3x
0
50
100
150
200
250
300
350
400
450
Mar-09
Jul-09
Nov-09
Mar-10
Jul-10
Nov-10
Mar-11
Jul-11
Nov-11
Mar-12
Jul-12
Nov-12
Mar-13
Jul-13
Nov-13
Mar-14
Jul-14
Nov-14
Mar-15
Jul-15
Nov-15
Mar-16
Jul-16
Nov-16
Mar-17
Jul-17
Nov-17
Mar-18
Jul-18
Nov-18
Mar-19
Jul-19
(|)
Price 20x 17x 15x 12x 10x 7x 5x
Source: Reuters, ICICI Direct Research
ICICI Securities | Retail Research 8
ICICI Direct Research
Result Update | Apollo Tyres
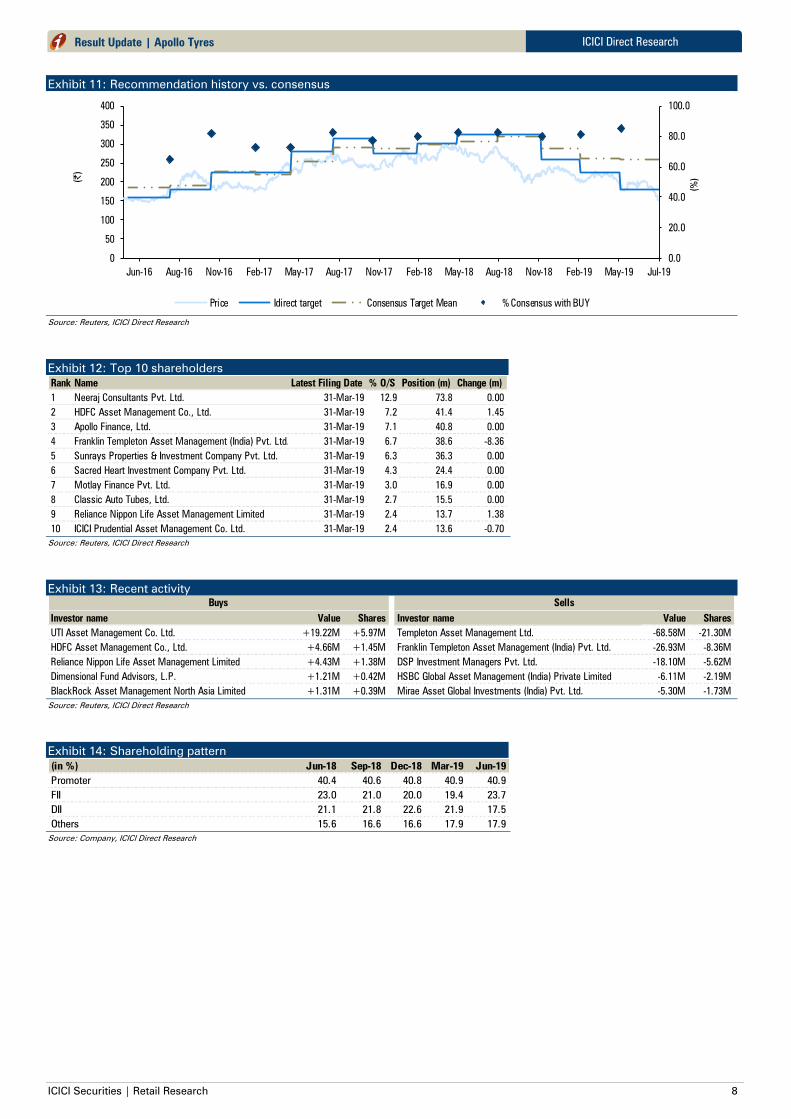
Exhibit 11: Recommendation history vs. consensus
0.0
20.0
40.0
60.0
80.0
100.0
0
50
100
150
200
250
300
350
400
Jul-19May-19Feb-19Nov-18Aug-18May-18Feb-18Nov-17Aug-17May-17Feb-17Nov-16Aug-16Jun-16
(%
)(|)
Price Idirect target Consensus Target Mean % Consensus with BUY
Source: Reuters, ICICI Direct Research
Exhibit 12: Top 10 shareholders
Rank Name Latest Filing Date % O/S Position (m) Change (m)
1 Neeraj Consultants Pvt. Ltd. 31-Mar-19 12.9 73.8 0.00
2 HDFC Asset Management Co., Ltd. 31-Mar-19 7.2 41.4 1.45
3 Apollo Finance, Ltd. 31-Mar-19 7.1 40.8 0.00
4 Franklin Templeton Asset Management (India) Pvt. Ltd. 31-Mar-19 6.7 38.6 -8.36
5 Sunrays Properties & Investment Company Pvt. Ltd. 31-Mar-19 6.3 36.3 0.00
6 Sacred Heart Investment Company Pvt. Ltd. 31-Mar-19 4.3 24.4 0.00
7 Motlay Finance Pvt. Ltd. 31-Mar-19 3.0 16.9 0.00
8 Classic Auto Tubes, Ltd. 31-Mar-19 2.7 15.5 0.00
9 Reliance Nippon Life Asset Management Limited 31-Mar-19 2.4 13.7 1.38
10 ICICI Prudential Asset Management Co. Ltd. 31-Mar-19 2.4 13.6 -0.70
Source: Reuters, ICICI Direct Research
Exhibit 13: Recent activity
Investor name Value Shares Investor name Value Shares
UTI Asset Management Co. Ltd. +19.22M +5.97M Templeton Asset Management Ltd. -68.58M -21.30M
HDFC Asset Management Co., Ltd. +4.66M +1.45M Franklin Templeton Asset Management (India) Pvt. Ltd. -26.93M -8.36M
Reliance Nippon Life Asset Management Limited +4.43M +1.38M DSP Investment Managers Pvt. Ltd. -18.10M -5.62M
Dimensional Fund Advisors, L.P. +1.21M +0.42M HSBC Global Asset Management (India) Private Limited -6.11M -2.19M
BlackRock Asset Management North Asia Limited +1.31M +0.39M Mirae Asset Global Investments (India) Pvt. Ltd. -5.30M -1.73M
Buys Sells
Source: Reuters, ICICI Direct Research
Exhibit 14: Shareholding pattern
(in %) Jun-18 Sep-18 Dec-18 Mar-19 Jun-19
Promoter 40.4 40.6 40.8 40.9 40.9
FII 23.0 21.0 20.0 19.4 23.7
DII 21.1 21.8 22.6 21.9 17.5
Others 15.6 16.6 16.6 17.9 17.9
Source: Company, ICICI Direct Research

ICICI Securities | Retail Research 9
ICICI Direct Research
Result Update | Apollo Tyres
Financial Summary
Exhibit 15: Profit and loss statement | crore
(Year-end March) FY18 FY19 FY20E FY21E
Total operating Income 14,840.5 17,548.8 18,656.6 19,873.4
Growth (%) 12.6 18.2 6.3 6.5
Raw Material Expenses 8,395.5 10,126.2 10,678.9 11,335.4
Employee Expenses 2,156.6 2,456.2 2,619.7 2,765.8
Other Expenses 2,637.1 3,007.5 3,229.2 3,414.6
Total Operating Expenditure 13,189.3 15,589.9 16,527.8 17,515.9
EBITDA 1,651.3 1,958.9 2,128.8 2,357.5
Growth (%) -10.6 18.6 8.7 10.7
Depreciation 592.6 812.7 858.2 894.3
Interest 162.9 181.1 251.8 305.1
Other Income 116.5 123.1 111.9 109.1
PBT 1012.3 888.2 1130.7 1267.2
Exceptional items 0.0 200.0 0.0 0.0
Total Tax 288.4 208.3 283.2 342.2
Reported PAT 723.9 680.0 847.5 925.1
Growth (%) -34.1 -6.1 24.6 9.2
EPS (|) 12.7 11.9 14.8 16.2
Source: Company, ICICI Direct Research
Exhibit 16: Cash flow statement | crore
(Year-end March) FY18 FY19 FY20E FY21E
Profit after Tax 723.9 680.0 847.5 925.1
Add: Depreciation 592.6 812.7 858.2 894.3
(Inc)/dec in Current Assets -682.6 -205.6 -505.9 -369.9
Inc/(dec) in CL and Provisions 607.8 -548.5 402.0 251.4
CF from operating activities 1241.6 738.6 1601.8 1700.8
(Inc)/dec in Investments -944.6 1,339.0 0.0 0.0
(Inc)/dec in Fixed Assets -3,479.0 -1,419.7 -3,000.0 -2,000.0
Others 450.2 -561.3 32.2 35.4
CF from investing activities -3973.4 -642.0 -2967.8 -1964.6
Issue/(Buy back) of Equity 0.0 0.0 6.3 0.0
Inc/(dec) in loan funds 1,416.6 269.5 1,600.0 500.0
Dividend paid & dividend tax -219.3 -237.6 -240.3 -257.4
Others 1,796.7 -164.8 -6.3 0.0
CF from financing activities 2994.0 -132.9 1359.7 242.6
Net Cash flow 262.2 -36.3 -6.2 -21.2
Opening Cash 336.6 598.8 562.5 556.3
Closing Cash 598.8 562.5 556.3 535.1
Source: Company, ICICI Direct Research
Exhibit 17: Balance Sheet | crore
(Year-end March) FY18 FY19 FY20E FY21E
Liabilities
Equity Capital 57.2 57.2 57.2 57.2
Reserve and Surplus 9,719.4 9,982.6 10,589.8 11,257.5
Total Shareholders funds 9,776.6 10,039.8 10,647.0 11,314.7
Total Debt 4,661.2 4,930.7 6,530.7 7,030.7
Deferred Tax Liability 838.9 823.1 875.1 932.1
Total Liabilities 16,152.1 16,591.0 18,891.3 20,161.1
Assets
Gross Block 15,640.9 17,808.7 20,828.8 23,328.8
Less: Acc Depreciation 6,112.2 6,924.9 7,783.1 8,677.4
Net Block 10,867.8 10,883.9 13,045.8 14,651.4
Capital WIP 2,268.2 1,520.1 1,500.0 1,000.0
Total Fixed Assets 13,136.0 12,404.0 14,545.8 15,651.4
Investments 1,342.5 6.0 6.0 6.0
Goodwill on consolidation 206.1 199.3 199.3 199.3
Inventory 2,945.4 3,484.1 3,680.2 3,920.2
Debtors 1,435.0 1,154.7 1,431.2 1,524.5
Loans and Advances 75.7 42.8 45.5 48.4
Other current assets 504.6 484.7 515.3 548.9
Cash 598.8 562.5 556.3 535.1
Total Current Assets 5,559.5 5,728.8 6,228.5 6,577.3
Creditors 2,447.1 2,248.3 2,555.7 2,722.4
Provisions 338.1 251.7 286.1 304.8
Total Current Liabilities 2,785.2 2,500.0 2,841.8 3,027.2
Net Current Assets 2,774.3 3,228.8 3,386.6 3,550.1
Application of Funds 16,152.1 16,591.0 18,891.3 20,161.1
Source: Company, ICICI Direct Research
Exhibit 18: Key ratios
(Year-end March) FY18 FY19 FY20E FY21E
Per share data (|)
EPS 12.7 11.9 14.8 16.2
Cash EPS 23.0 26.1 29.8 31.8
BV 170.9 175.5 186.1 197.8
DPS 3.0 3.3 3.5 3.8
Cash Per Share 10.5 9.8 9.7 9.4
Operating Ratios (%)
EBITDA Margin 11.1 11.2 11.4 11.9
PBT / Net sales 7.1 6.5 6.8 7.4
PAT Margin 4.9 4.7 4.5 4.7
Inventory days 72.4 72.5 72.0 72.0
Debtor days 35.3 24.0 28.0 28.0
Creditor days 60.2 46.8 50.0 50.0
Return Ratios (%)
RoE 7.4 8.3 8.0 8.2
RoCE 7.7 8.0 7.7 8.2
RoIC 8.5 8.0 7.7 8.0
Valuation Ratios (x)
P/E 11.9 10.3 10.1 9.3
EV / EBITDA 6.8 6.6 6.8 6.4
EV / Net Sales 0.8 0.7 0.8 0.8
Market Cap / Sales 0.6 0.5 0.5 0.4
Price to Book Value 0.9 0.9 0.8 0.8
Solvency Ratios
Debt/Equity 0.5 0.5 0.6 0.6
Current Ratio 1.8 2.1 2.0 2.0
Quick Ratio 0.7 0.7 0.7 0.7
Source: Company, ICICI Direct Research

ICICI Securities | Retail Research 10
ICICI Direct Research
Result Update | Apollo Tyres
Exhibit 19: ICICI Direct Research coverage universe (Auto & Auto Ancillary)
Sector / Company CMP M Cap
(|) TP(|) Rating (| Cr) FY19 FY20E FY21E FY19 FY20E FY21E FY19 FY20E FY21E FY19 FY20E FY21E FY19 FY20E FY21E
Amara Raja (AMARAJ) 650 590 Reduce 11108 28.3 31.1 33.8 22.3 20.3 18.6 11.0 9.7 8.7 21.2 21.0 20.5 14.5 14.3 14.0
Apollo Tyre (APOTYR) 150 145 Hold 8581 11.9 14.8 16.2 12.6 10.1 9.3 6.8 6.8 6.4 8.0 7.7 8.2 8.3 8.0 8.2
Ashok Leyland (ASHLEY) 68 70 Hold 19961 6.8 5.3 5.5 10.1 12.8 12.4 6.1 6.6 6.2 26.9 23.1 22.7 24.3 17.4 16.7
Bajaj Auto (BAAUTO) 2462 2360 Reduce 71243 161.6 160.5 168.7 15.4 15.5 14.8 11.0 10.3 9.4 21.0 19.2 25.3 19.9 19.1 18.1
Balkrishna Ind. (BALIND) 703 740 Hold 13590 40.5 40.9 45.3 19.2 19.0 17.2 11.8 10.6 9.1 20.4 19.0 19.3 16.7 19.0 19.3
Bharat Forge (BHAFOR) 421 535 Buy 32590 22.2 23.8 25.4 21.0 19.5 18.3 11.9 11.0 10.3 18.4 18.5 19.1 19.1 17.9 17.5
Bosch (MICO) 14378 15550 Reduce 43883 523.6 538.6 573.1 32.5 31.6 29.7 23.3 22.0 20.5 17.5 15.9 15.0 25.8 23.5 22.3
Eicher Motors (EICMOT) 16350 15875 Hold 44570 808.1 821.9 903.2 20.2 19.9 18.1 14.3 13.6 11.7 32.5 27.7 26.1 24.8 20.8 19.4
Escorts (ESCORT) 462 430 Reduce 4106 54.6 47.3 53.4 8.5 9.8 8.6 5.1 4.9 4.2 21.6 18.0 18.0 15.6 12.3 12.3
Exide Industries (EXIIND) 182 200 Reduce 15428 9.1 9.5 10.4 21.7 22.5 20.8 12.7 11.8 10.7 18.4 17.8 17.5 12.9 12.3 12.1
Hero Moto (HERHON) 2275 2200 Hold 45430 169.5 187.4 175.5 13.6 12.3 13.1 8.4 8.2 7.4 37.1 32.0 31.5 26.3 22.5 22.1
JK Tyre & Ind (JKIND) 70 100 Buy 1598 7.8 4.6 7.9 10.3 17.4 10.1 6.3 7.2 6.2 10.9 9.1 10.5 10.3 6.5 9.5
Mahindra CIE (MAHAUT) 174 230 Buy 6568 13.2 14.1 17.1 14.8 13.8 11.4 7.8 7.8 6.4 12.4 11.1 11.9 13.2 12.6 14.2
Maruti Suzuki (MARUTI) 5523 5000 Reduce 166837 248.3 221.2 250.0 22.8 25.5 22.6 12.3 13.6 11.6 16.3 12.0 13.0 16.3 13.4 13.9
Motherson (MOTSUM) 105 125 Hold 33221 5.1 5.0 6.5 23.5 23.9 18.4 8.5 8.5 6.6 13.5 12.3 16.0 14.7 13.2 15.5
Tata Motors (TELCO) 135 160 Hold 50934 -84.6 9.3 21.4 -1.8 16.1 7.0 3.9 3.6 3.1 5.4 9.1 11.3 7.1 9.8 15.4
Wabco India (WABTVS) 6089 6510 Hold 11549 148.8 157.7 178.3 41.7 39.3 34.8 26.6 24.5 21.5 15.9 14.5 14.3 23.0 21.4 21.0
RoE (%)EPS (|) P/E (x) EV/EBITDA (x) RoCE (%)
Source: Reuters, ICICI Direct Research
ICICI Securities | Retail Research 11
ICICI Direct Research
Result Update | Apollo Tyres
RATING RATIONALE
ICICI Direct endeavors to provide objective opinions and recommendations. ICICI Direct assigns ratings to its
stocks according to their notional target price vs. current market price and then categorizes them as Buy, Hold,
Reduce and Sell. The performance horizon is two years unless specified and the notional target price is defined
as the analysts' valuation for a stock
Buy: >15%
Hold: -5% to 15%;
Reduce: -15% to -5%;
Sell: <-15%
Pankaj Pandey Head – Research [email protected]
ICICI Direct Research Desk,
ICICI Securities Limited,
1st Floor, Akruti Trade Centre,
Road No 7, MIDC,
Andheri (East)
Mumbai – 400 093

ICICI Securities | Retail Research 12
ICICI Direct Research
Result Update | Apollo Tyres
ANALYST CERTIFICATION
I/We, Shashank Kanodia, CFA, MBA (Capital Markets), and Jaimin Desai, CA, Research Analysts, authors and the names subscribed to this report, hereby certify that all of the views expressed in this research report accurately reflect
our views about the subject issuer(s) or securities. We also certify that no part of our compensation was, is, or will be directly or indirectly related to the specific recommendation(s) or view(s) in this report. It is also confirmed that
above mentioned Analysts of this report have not received any compensation from the companies mentioned in the report in the preceding twelve months and do not serve as an officer, director or employee of the companies
mentioned in the report.
Terms & conditions and other disclosures:
ICICI Securities Limited (ICICI Securities) is a full-service, integrated investment banking and is, inter alia, engaged in the business of stock brokering and distribution of financial products. ICICI Securities Limited is a SEBI registered
Research Analyst with SEBI Registration Number – INH000000990. ICICI Securities Limited SEBI Registration is INZ000183631 for stock broker. ICICI Securities is a subsidiary of ICICI Bank which is India’s largest private sector bank
and has its various subsidiaries engaged in businesses of housing finance, asset management, life insurance, general insurance, venture capital fund management, etc. (“associates”), the details in respect of which are available on
www.icicibank.com
ICICI Securities is one of the leading merchant bankers/ underwriters of securities and participate in virtually all securities trading markets in India. We and our associates might have investment banking and other business relationship
with a significant percentage of companies covered by our Investment Research Department. ICICI Securities generally prohibits its analysts, persons reporting to analysts and their relatives from maintaining a financial interest in the
securities or derivatives of any companies that the analysts cover.
Recommendation in reports based on technical and derivative analysis centre on studying charts of a stock's price movement, outstanding positions, trading volume etc as opposed to focusing on a company's fundamentals and, as
such, may not match with the recommendation in fundamental reports. Investors may visit icicidirect.com to view the Fundamental and Technical Research Reports.
Our proprietary trading and investment businesses may make investment decisions that are inconsistent with the recommendations expressed herein.
ICICI Securities Limited has two independent equity research groups: Institutional Research and Retail Research. This report has been prepared by the Retail Research. The views and opinions expressed in this document may or may
not match or may be contrary with the views, estimates, rating, target price of the Institutional Research.
The information and opinions in this report have been prepared by ICICI Securities and are subject to change without any notice. The report and information contained herein is strictly confidential and meant solely for the selected
recipient and may not be altered in any way, transmitted to, copied or distributed, in part or in whole, to any other person or to the media or reproduced in any form, without prior written consent of ICICI Securities. While we would
endeavour to update the information herein on a reasonable basis, ICICI Securities is under no obligation to update or keep the information current. Also, there may be regulatory, compliance or other reasons that may prevent ICICI
Securities from doing so. Non-rated securities indicate that rating on a particular security has been suspended temporarily and such suspension is in compliance with applicable regulations and/or ICICI Securities policies, in
circumstances where ICICI Securities might be acting in an advisory capacity to this company, or in certain other circumstances.
This report is based on information obtained from public sources and sources believed to be reliable, but no independent verification has been made nor is its accuracy or completeness guaranteed. This report and information herein
is solely for informational purpose and shall not be used or considered as an offer document or solicitation of offer to buy or sell or subscribe for securities or other financial instruments. Though disseminated to all the customers
simultaneously, not all customers may receive this report at the same time. ICICI Securities will not treat recipients as customers by virtue of their receiving this report. Nothing in this report constitutes investment, legal, accounting
and tax advice or a representation that any investment or strategy is suitable or appropriate to your specific circumstances. The securities discussed and opinions expressed in this report may not be suitable for all investors, who
must make their own investment decisions, based on their own investment objectives, financial positions and needs of specific recipient. This may not be taken in substitution for the exercise of independent judgment by any recipient.
The recipient should independently evaluate the investment risks. The value and return on investment may vary because of changes in interest rates, foreign exchange rates or any other reason. ICICI Securities accepts no liabilities
whatsoever for any loss or damage of any kind arising out of the use of this report. Past performance is not necessarily a guide to future performance. Investors are advised to see Risk Disclosure Document to understand the risks
associated before investing in the securities markets. Actual results may differ materially from those set forth in projections. Forward-looking statements are not predictions and may be subject to change without notice.
ICICI Securities or its associates might have managed or co-managed public offering of securities for the subject company or might have been mandated by the subject company for any other assignment in the past twelve months.
ICICI Securities or its associates might have received any compensation from the companies mentioned in the report during the period preceding twelve months from the date of this report for services in respect of managing or co-
managing public offerings, corporate finance, investment banking or merchant banking, brokerage services or other advisory service in a merger or specific transaction.
ICICI Securities encourages independence in research report preparation and strives to minimize conflict in preparation of research report. ICICI Securities or its associates or its analysts did not receive any compensation or other
benefits from the companies mentioned in the report or third party in connection with preparation of the research report. Accordingly, neither ICICI Securities nor Research Analysts and their relatives have any material conflict of
interest at the time of publication of this report.
Compensation of our Research Analysts is not based on any specific merchant banking, investment banking or brokerage service transactions.
ICICI Securities or its subsidiaries collectively or Research Analysts or their relatives do not own 1% or more of the equity securities of the Company mentioned in the report as of the last day of the month preceding the publication of
the research report.
Since associates of ICICI Securities are engaged in various financial service businesses, they might have financial interests or beneficial ownership in various companies including the subject company/companies mentioned in this
report.
ICICI Securities may have issued other reports that are inconsistent with and reach different conclusion from the information presented in this report.
Neither the Research Analysts nor ICICI Securities have been engaged in market making activity for the companies mentioned in the report.
We submit that no material disciplinary action has been taken on ICICI Securities by any Regulatory Authority impacting Equity Research Analysis activities.
This report is not directed or intended for distribution to, or use by, any person or entity who is a citizen or resident of or located in any locality, state, country or other jurisdiction, where such distribution, publication, availability or
use would be contrary to law, regulation or which would subject ICICI Securities and affiliates to any registration or licensing requirement within such jurisdiction. The securities described herein may or may not be eligible for sale in
all jurisdictions or to certain category of investors. Persons in whose possession this document may come are required to inform themselves of and to observe such restriction.