Embed Size (px)
Citation preview

APMP.QM-S3 Cd in Rice Powder
(Coordinated by KRISS, NIM and NMIJ)
Final Draft Report
Sep. 16, 2011
Yong-Hyeon YIM, Euijin HWANG, Jun WANG, Yanbei ZHU

APMP.QM-S3 Cd in rice powder Final report
1
Summary The present study, APMP.QM-S3, was performed to demonstrate and document
the capability of interested national metrology institutes in the APMP region to determine the mass fraction of Cd in rice. It was carried out as a regional supplementary comparison related with a previous CCQM key comparison, CCQM-K24, and run in parallel with a pilot study, APMP.QM-P12. The comparison is an activity of the APMP-TCQM and was coordinated by KRISS (Korea Research Institute of Standards and Science, Korea) with NIM (National Institute of Metrology, P. R. China) and NMIJ (National Metrology Institute of Japan) as co-coordination laboratories to provide reference value. Seven national metrology institutes (NMIs) participated in the supplementary comparison. The degrees of equivalence for NMIs employing double ID-ICP/MS techniques are excellent while the results obtained using other techniques may need more improvement.
APMP.QM-S3 Cd in rice powder Final report
2
1. Introduction
Rice is the major source of food for a large proportion of the world’s population, especially in Asia. Therefore, many countries set regulations limiting the amount of toxic elements, such as cadmium, in rice to protect public health. With ever increasing international trade of food, traceable measurement of hazardous elements in food supported by NMIs has become one of the essential requirements for food safety. The intention of this study is to establish the comparability in the measurement of cadmium in rice. It is expected that participating laboratories, which can demonstrate their capability to measure cadmium in such a matrix, will be able to apply such expertise to a range of other types of sample.
The previous regional APMP comparison on cadmium in rice, APMP.QM-P2, was carried out in parallel with CCQM-K24 key comparison. However, many APMP participants failed to show satisfying comparability with the CCQM results. Subsequent APMP.QM-P5 study (Cd content in oyster tissue) also resulted in limited success with small number of participants. The present supplementary study, APMP.QM-S3 (Cd content in rice powder), has been originally proposed and approved by APMP-TCQM in 2007 as APMP.QM-K24 to provide NMIs in the APMP region a chance to demonstrate the degree of equivalence in their measurement and possibly link it to the CCQM-K24 result. The study was run in parallel with the pilot study, APMP.QM-P12. It has been carried out from July to December 2008 and the results were presented at the APMP meeting in Kuala Lumpur, Malaysia, in December 2009. Draft A report for the APMP.QM-K24 was circulated to participants in Feb. 2010. But it was recognized that the RMO comparison should have been discussed and approved by the Inorganic Analysis Working Group (IAWG) and registered in the Key Comparison Data Base (KCDB) in advance. Therefore, the coordinating laboratories asked a retrospective approval of the study and discussions on the report in the IAWG during the CCQM meeting in Paris in April 2010. After submission and discussion of draft A report of APMP.QM-K24 in the CCQM meeting, it was decided to register the study as a supplementary comparison of APMP considering the lack of sound scientific background to link the two studies directly. A new comparison number, APMP.QM-S3 was assigned to the previous APMP.QM-K24 in September 2010. The decision was reported and the follow-up actions were discussed further in the CCQM-IAWG meeting at Hindas, Sweden on 29th September 2010.

APMP.QM-S3 Cd in rice powder Final report
3
2. List of Participants
Participants in APMP.QM-S3 are listed in Table 1.
Table 1. APMP.QM-S3 participants.
Economy Institute/Organization Contributors
China National Institute of Metrology (NIM) Dr. Jun WANG
Dr. Chao WEI
Dr. Qian WANG
Hong Kong
Government Laboratory Hong Kong (GLHK) Dr. Yiu-chung YIP
India National Physics Laboratory-India (NPLI) Mr. Prabhat K. GUPTA
Indonesia Indonesian Institute of Science (LIPI) Dr. SUMARDI
Japan National Metrology Institute of Japan (NMIJ) Dr. Yanbei ZHU
Korea Korea Research Institute of Standards & Science (KRISS)
Dr. Yong-Hyeon YIM
Dr. Kyung-Seok LEE
Thailand National Metrology Institute, Thailand (NMIT)
Mr. Charun YAFA
Ms. Pranee PHUKPHATTHANACHAI
3. Samples
Each participant was sent more than one bottles of rice powder sample containing approximately 30 g of material in each bottle. The sample originated from rice grown in contaminated area. The material was tested at KRISS for stability and homogeneity and was found to be appropriate for the needs of the comparison. The homogeneity test was carried out using isotope dilution ICP/MS (ID-ICP/MS) after microwave digestion of subsamples. Ten bottles were sampled randomly from 1190 bottles with minimum sampling size of 0.5 g. The relative standard deviation of Cd content

APMP.QM-S3 Cd in rice powder Final report
4
between bottles was less than 0.41%. Sample bottle containing about 30 g of material was sent to each participant presented in the Table 1 with information and instruction documents on July 8, 2008. The sample for NIM, China, once returned due to customs clearance problem and finally delivered on October 20, 2008. The deadline for reporting of results was Dec. 31, 2008.
4. Introductions to Participants
The following information was provided to all participants
• General instructions. • Result report form Detailed sample information, guideline for sample preparation and reporting are described in the general instructions. The information provided to participants is given in Appendix A and B.
5. Methods
The participants were free to choose one or more suitable methods of Cd measurement. Methods and instruments used are given in Table 2. Table 2. Analytical methods and instrumental techniques used by APMP.QM-S3 participants for cadmium measurements.
Participant Subsample
mass Number of subsamples
Digestion Calibration Instrument
NIM 0.5 g 12 HNO3 + H2O2 MW digestion
Double IDMS
ICP/MS
GLHK 0.5 g 5 HNO3+HF
MW digestion Double IDMS
ICP/MS
NPLI 0.5 g 6 HNO3 + H2O2 + HF
MW digestion External
calibration GF-AAS
LIPI 0.5 g 4 HNO3 + H2O2 MW digestion
Standard addition
GF-AAS
NMIJ 0.5 g 4 HNO3 + H2O2 + HF
MW digestion Double IDMS
ICP/MS
KRISS 0.5 g 5 5 mL HNO3 + 1 mL H2O2
MW digestion Double IDMS
ICP/MS
NMIT 0.5 g 4 5 mL HNO3 + 1 mL H2O2
MW digestion Double IDMS
ICP/MS

APMP.QM-S3 Cd in rice powder Final report
5
For sample digestion, all laboratories used microwave with varying mixture of HNO3, H2O2 and HF. Two different instrumental techniques were used for the cadmium measurement in samples. Four laboratories used double isotope dilution mass spectrometry (IDMS), while the other two participants used atomic absorption spectroscopy (AAS) with either external calibration or standard addition.
6. Participants’ Results
The participants’ results are given in Table 3.
Table 3. APMP.QM-S3 participants’ measurement results for cadmium.
Participant Reported
value (mg·kg-1)
Reported standard
uncertainty(mg/kg)
Coverage factor k (95% confidence level)
Expanded uncertainty
(mg·kg-1)
Relative expanded
uncertainty (%)
NIM 0.3608 0.0018 2 0.0036 1.00
GLHK 0.3616 0.0052 2 0.0105 2.90
NPLI 0.416 0.025 2 0.051 12.26
LIPI 0.4057 0.0391 2 0.0782 19.28
NMIJ 0.369 0.006 2 0.013 3.52
KRISS 0.3600 0.0033 1.96 0.0065 1.81
NMIT 0.379 0.007 2 0.014 3.69

APMP.QM-S3 Cd in rice powder Final report
6
7. Discussion
In the original proposal, it was suggested to use the results of three NMIs (NIM, NMIJ, KRISS) that have also taken part in CCQM-K24 to calculate the reference value (RV) and its standard uncertainty (RU). Although the present study has been re-classified as an independent RMO supplementary comparison, it is proposed to use the same strategy for calculation of RV. It should be noted that only those three NMIs, among APMP.QM-S3 participants, had demonstrated their measurement capability of Cd in similar matrix at the time of the present comparison by participating in CCQM key comparisons. As shown in Table 4, the arithmetic mean, the median and the mixture model median of the three results used for RV calculation are listed with associated uncertainties. Standard deviation of the three results was used as associated uncertainties of the mean and the median. Scaled median of absolute deviation, MADE, was not used as a statistical estimator of the standard uncertainty for the median value due to its negative bias for small number of data set. The difference between mean, median and mixture model median values are negligible considering the associated uncertainties. Hence, the simplest estimator, the mean value and standard uncertainty of results from the three NMIs (which is 0.3633 ± 0.0029 mg/kg), is proposed as the RV and RU [1]. Based on the homogeneity test, uncertainty contribution from sample homogeneity is expected to be less than a quarter of the proposed uncertainty of the RV. Therefore, the uncertainty of the RV is set satisfactorily for evaluation of degree of equivalence without noticeable contribution from sample homogeneity.
The reported values and standard uncertainties of the participants are graphically displayed in Figure 1 together with the RV and its uncertainty, RU. The double IDMS results from most of participants show decent agreement with the RV within the stated uncertainties. However, the two results obtained by calibration with external standard or standard addition have relatively larger bias and/or uncertainties than those from double IDMS.
Table 4. Reference value calculation for APMP.QM-S3.
Reference value,RV (mg/kg)
Standard Uncertainty,
RU (mg/kg)
Expanded uncertainty
(mg/kg)
Relative expanded
uncertainty (%)
k (95% CL)
Mean 0.3633 0.0029 0.0124 3.41 4.3
Median 0.3608 0.0029 0.0124 3.43 4.3
MM median* 0.3617 0.0027 0.0114 3.15 4.3
* Mixture model median [2].

APMP.QM-S3 Cd in rice powder Final report
7
Figure 1. Participants’ results for APMP.QM-S3 displayed with error bars representing reported standard uncertainties. The solid horizontal line in red color is the proposed RV of 0.3633 mg/kg; the dashed blue lines show the standard uncertainty of the reference value.
The degree of equivalence between a NMI result and the RV is calculated, as given
in Table 5, according to the BIPM guidelines. The degree of equivalence, Di, between the NMI result, xi, and the RV, xR, is calculated according to the following equations:
Rii xxD −= , )(2 22Rii uuU +⋅=
where Ui is the expanded uncertainty (k = 2) of the Di calculated by combining the uncertainty of the NMI result, xi, and the standard uncertainty of the RV, xR. Equivalence statements for APMP.QM-S3 results are displayed in Figure 2. The degree of equivalence for NMIs employing double IDMS techniques was excellent, while the results from other techniques need more improvement.

APMP.QM-S3 Cd in rice powder Final report
8
Table 5. Equivalence statements for APMP.QM-S3.
Participant Reported value (mg/kg)
Standard uncertainty
(mg/kg) Di (mg/kg) Ui (mg/kg)
KRISS 0.3600 0.0033 -0.003 0.009
NIM 0.3608 0.0018 -0.002 0.007
GLHK 0.3616 0.0052 -0.002 0.012
NMIJ 0.369 0.006 0.006 0.013
NMIT 0.379 0.007 0.016 0.015
LIPI 0.4057 0.0391 0.042 0.078
NPLI 0.416 0.025 0.053 0.050
Figure 2. Graph of equivalence statements for APMP.QM-S3. Error bars represent the expanded uncertainties interval calculated with a coverage factor k=2.

APMP.QM-S3 Cd in rice powder Final report
9
The participants for the supplementary comparison are asked to complete core capability forms to document core capabilities being demonstrated in the comparison. Summarized tables of the demonstrated core capabilities for APMP.QM-S3 are also shown in the Appendix C.
8. Conclusion
The present APMP supplementary comparison, APMP.QM-S3, has been carried out in parallel with APMP.QM-P12 to demonstrate and document the capability of NMIs in the APMP region for determination of Cd content in rice and related food matrix materials. The degree of equivalence for results obtained with double ID-ICP/MS was satisfactory with less than 5% deviation from the RV, while those from other methods may require more improvements including rigorous control of measurement method and method validation. The participated laboratories directly demonstrated their capability to measure cadmium in rice and will be able to apply such expertise to a range of samples and analytes with similar matrices.
9. Acknowledgement
The work described here contains the contributions of many scientists as detailed in Table 1. The coordinating laboratory gratefully acknowledges Luis Mussio from BIPM, Linsey Mackay from NMIA, Mike Sargent and all members of the IAWG for their comments and advices for RV calculation. Special thanks are due to Kenji Kato and Della Sin for their assistance as chairpersons of the APMP-TCQM.
10. References 1. CCQM Guidance note: Estimation of a consensus KCRV and associated Degrees
of Equivalence, 1 March 2010. 2. David L. Duewer, A robust approach for the determination of CCQM key
comparison reference values and uncertainties, Working document CCQM, 04-15, BIPM, 2004.
APMP.QM-S3 Cd in rice powder Final report
10
Appendix A. Introduction for APMP.QM-K24 and P12 comparison (Cd content in rice powder)
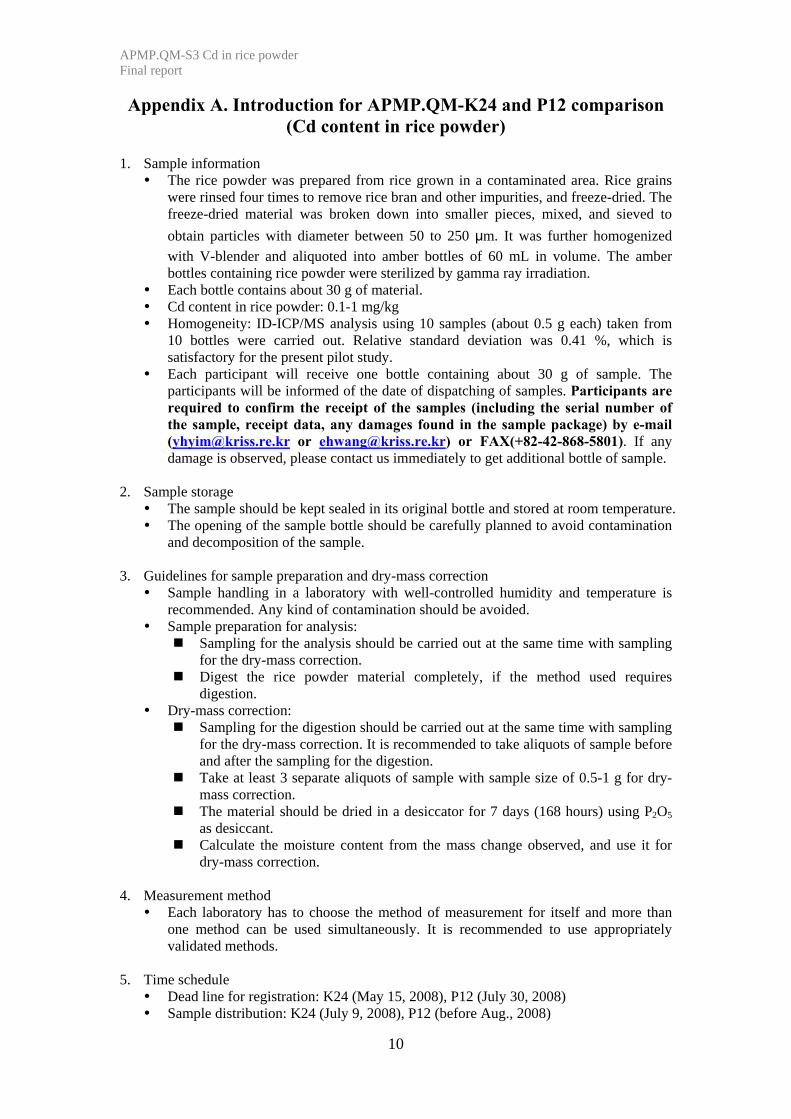
1. Sample information
The rice powder was prepared from rice grown in a contaminated area. Rice grains were rinsed four times to remove rice bran and other impurities, and freeze-dried. The freeze-dried material was broken down into smaller pieces, mixed, and sieved to obtain particles with diameter between 50 to 250 μm. It was further homogenized with V-blender and aliquoted into amber bottles of 60 mL in volume. The amber bottles containing rice powder were sterilized by gamma ray irradiation.
Each bottle contains about 30 g of material. Cd content in rice powder: 0.1-1 mg/kg Homogeneity: ID-ICP/MS analysis using 10 samples (about 0.5 g each) taken from
10 bottles were carried out. Relative standard deviation was 0.41 %, which is satisfactory for the present pilot study.
Each participant will receive one bottle containing about 30 g of sample. The participants will be informed of the date of dispatching of samples. Participants are required to confirm the receipt of the samples (including the serial number of the sample, receipt data, any damages found in the sample package) by e-mail ([email protected] or [email protected]) or FAX(+82-42-868-5801). If any damage is observed, please contact us immediately to get additional bottle of sample.
2. Sample storage
The sample should be kept sealed in its original bottle and stored at room temperature. The opening of the sample bottle should be carefully planned to avoid contamination
and decomposition of the sample.
3. Guidelines for sample preparation and dry-mass correction Sample handling in a laboratory with well-controlled humidity and temperature is
recommended. Any kind of contamination should be avoided. Sample preparation for analysis:
Sampling for the analysis should be carried out at the same time with sampling for the dry-mass correction.
Digest the rice powder material completely, if the method used requires digestion.
Dry-mass correction: Sampling for the digestion should be carried out at the same time with sampling
for the dry-mass correction. It is recommended to take aliquots of sample before and after the sampling for the digestion.
Take at least 3 separate aliquots of sample with sample size of 0.5-1 g for dry-mass correction.
The material should be dried in a desiccator for 7 days (168 hours) using P2O5 as desiccant.
Calculate the moisture content from the mass change observed, and use it for dry-mass correction.
4. Measurement method
Each laboratory has to choose the method of measurement for itself and more than one method can be used simultaneously. It is recommended to use appropriately validated methods.
5. Time schedule
Dead line for registration: K24 (May 15, 2008), P12 (July 30, 2008) Sample distribution: K24 (July 9, 2008), P12 (before Aug., 2008)

APMP.QM-S3 Cd in rice powder Final report
11
Deadline for reporting: December 31, 2008 Draft A report: March 31, 2009
6. Reporting
The report should be sent to the coordinating laboratory by email before Dec. 31, 2008.
For rigorous evaluation of the inter-laboratory comparison, detailed information should be included in the report (final report form will be distributed with the sample)
Final result with relevant uncertainty should be reported as mass faction [mg/kg] based on dry mass. If the final result has been calculated from more than one method, the individual results from the contributing methods must also be reported.
One final result should be reported in the key comparison. However, more than two results can be reported for the pilot study, when different methods are used.
Detailed description of analytical methods used. If more than one method is used, each method should be described in detail.
Information about sample digestion and preparation. Information about the reference material used for calibration or other materials
used in the analytical procedure. Details of the uncertainty evaluation: uncertainty should be evaluated according
to the ISO Guide to the Expression of Uncertainty in Measurement, 1993, which includes - Complete specification of the measurement equation including corrections. - Description of all uncertainty sources and their typical values
7. Contact Person.
Drs. Yong-Hyeon Yim & Euijin Hwang Principal Research Scientists Health Metrology Group, KRISS 1 Doryong-dong, Yuseong-gu, Daejeon 305-340, Republic of Korea Tel: +82-42-868-5343, 5361 Fax: +82-42-868-5801 E-mail: [email protected], [email protected]

APMP.QM-S3 Cd in rice powder Final report
12
Appendix B. Result report form
APMP.QM-K24 Cd Content in Rice Powder
Result Report
Lab. Identification
Name: Institute: Address: Country: E-mail: Tel. number: Fax. Number:
Date: Please report all your results and uncertainties in the unit mg/kg.
Cd content (mg/kg)
Combined standard
uncertainty (mg/kg)
Coverage factor k (in 95% level of
confidence)
Expanded uncertainty
(mg/kg)
Result from individual aliquout (dry-mass corrected)
Aliquot number Cd content (mg/kg) 1 2 3 4 Average Standard deviation Standard deviation of the mean

APMP.QM-S3 Cd in rice powder Final report
13
Questionnaire
1. Analytical method used: 2. Description of the measurement procedure including sample preparation: 3. Correction for dry mass (% of weighted): 4. Amount & number of sample aliquots taken for dry mass correction: 5. Uncertainty for dry mass correction: 6. Amount & number of sample aliquots taken for Cd analysis: 7. (Isotopic) Reference materials used for calibration purposes: 8. For IDMS, indicate reference & spiked isotopes used: 9. Details of the uncertainty evaluation
- Complete specification of the measurement equation including corrections - Description of all uncertainty sources and their typical values

APMP.QM-S3 Cd in rice powder Final report
14
Appendix C. Tables of demonstrated core-capabilities
Method Summary of APMP.QM-S3 (Cd in rice powder)
ID-ICP/MS GF-AAS NIM Cd
GLHK Cd NPLI Cd LIPI Cd
NMIJ Cd KRISS Cd NMIT Cd

APMP.QM-S3 Cd in rice powder Final report
15
Inorganic Core Capabilities Summary Table
CCQM Study: □ APMP.QM-S3 Institute(s): GLHK, KRISS, NIM, NMIJ, NIMT Method: ID-ICP-MS Analyte(s): Cd
Capabilities/Challenges Degree of Difficulty Explanation Low Moderate High
Contamination control and correction All techniques and procedures employed to reduce potential contamination of samples as well as blank correction procedures. The level of difficulty is greatest for analytes that are environmentally ubiquitous and also present at very low concentrations in the sample.
All
Digestion/dissolution of organic matrices All techniques and procedures used to bring a sample that is primarily organic in nature into solution suitable for liquid sample introduction to the ICP.
All
Digestion/dissolution of inorganic matrices All techniques and procedures used to bring a sample that is primarily inorganic in nature into solution suitable for liquid sample introduction to the ICP.
Volatile element containment All techniques and procedures used to prevent the loss of potentially volatile analyte elements during sample treatment and storage.
Pre-concentration Techniques and procedures used to increase the concentration of the analyte introduced to the ICP. Includes evaporation, ion-exchange, extraction, precipitation procedures, but not vapor generation procedures.
Vapor generation Techniques such as hydride generation and cold vapor generation used to remove the analyte from the sample as a gas for introduction into the ICP.
Matrix separation Techniques and procedures used to isolate the analyte(s) from the sample matrix to avoid or reduce interferences caused by the matrix. Includes ion-exchange, extraction, precipitation procedures, but not vapor generation procedures. Techniques and procedures used to isolate the analyte(s) from the sample matrix to avoid or reduce interferences caused by the matrix. Includes ion-exchange, extraction, precipitation procedures, but not vapor generation procedures.
Spike equilibration with sample The mixing and equilibration of the enriched isotopic spike with the sample.
All
Signal detection The detection and recording of the analyte isotope signals. The degree of difficulty increases for analytes present at low concentrations, of low isotopic abundance, or that are poorly ionized.
All
Memory effect Any techniques used to avoid, remove or reduce the carry-over of analyte between consecutively measured standards and/or samples.

APMP.QM-S3 Cd in rice powder Final report
16
Capabilities/Challenges Degree of Difficulty Explanation Low Moderate High
Correction or removal of isobaric/polyatomic interferences Any techniques used to remove, reduce, or mathematically correct for interferences caused by mass overlap of analyte isotopes with isobaric or polyatomic species. Includes collision cell techniques, high resolution mass spectrometry, or chemical separations. The relative concentrations and sensitivities of the analyte isotopes and the interfering species will affect the degree of difficulty.
All
Correction/removal of isobaric/polyatomic interferences (e.g., Sn, MoO) or alternative selection of isotopes is required to prevent isobaric interferences.
Detector deadtime correction Measurement of, and correction for, ion detector deadtime. Importance increases in situations where high ion count rates are encountered.
All
Mass bias/fractionation control and correction Techniques used to determine, monitor, and correct for mass bias/fractionation.
All
Spike calibration Techniques used to determine the analyte concentration in the enriched isotopic spike solution.
All

APMP.QM-S3 Cd in rice powder Final report
17
Inorganic Core Capabilities Summary Table
CCQM Study: □ APMP.QM-S3 Institute(s): NPLI, LIPI Method: ETA-AAS (or GF-AAS) Analyte(s): Cd
Capabilities/Challenges Degree of Difficulty Explanation Low Moderate High
Contamination control and correction All techniques and procedures employed to reduce potential contamination of samples as well as blank correction procedures. The level of difficulty is greatest for analytes that are environmentally ubiquitous and also present at very low concentrations in the sample.
All
Digestion/dissolution of organic matrices All techniques and procedures used to bring a sample that is primarily organic in nature into solution suitable for liquid sample introduction to the ETA-AAS.
All
Digestion/dissolution of inorganic matrices All techniques and procedures used to bring a sample that is primarily inorganic in nature into solution suitable for liquid sample introduction to the ETA-AAS.
Volatile element containment All techniques and procedures used to prevent the loss of potentially volatile analyte elements during sample treatment and storage.
Pre-concentration Techniques and procedures used to increase the concentration of the analyte introduced to the ETA-AAS. Includes evaporation, ion-exchange, extraction, precipitation procedures, but not vapor generation procedures.
Matrix separation Techniques and procedures used to isolate the analyte(s) from the sample matrix to avoid or reduce interferences caused by the matrix. Includes ion-exchange, extraction, precipitation procedures, but not vapor generation procedures.
Hydride preconcentration/matrix separation of volatile species. Coupling of a hydride system to the ETA-AAS and optimization of conditions.
Calibration of analyte concentration The preparation of calibration standards and the strategy for instrument calibration. Includes external calibration and standard additions procedures. Also use of matrix-matched standards to minimize effect of interferences.
All
Careful matrix matching for external calibration, or checking linearity of calibration by standard addition is required to achieve reliable calibration.
Signal detection The detection and recording of the absorption signals of analytes. The degree of difficulty increases for analytes present at low concentrations, of low atomic absorption coefficient. Requires selection of operating conditions such as light source, absorption line, Zeeman background correction conditions. Includes selection of signal processing conditions (peak area or height).
All
Memory effect Any techniques used to avoid, remove or reduce the carry-over of analyte between consecutively measured standards and/or samples.
All
Optimization of the furnace temperature All

APMP.QM-S3 Cd in rice powder Final report
18
Capabilities/Challenges Degree of Difficulty Explanation Low Moderate High
program Optimization of temperature and duration of steps for sample drying, pyrolysis to remove (residual) organics, and atomization. Furnace temperature program to minimize analyte loss in the drying/pyrolysis steps, while maximizing analyte vaporization in the atomization step. Correction or removal of matrix effects or interferences Chemical or instrumental procedures used to avoid or correct for spectral and non-spectral interferences. Includes effects of differences in viscosity and chemical equilibrium states of analyte between the standard and sample. Selection of matrix modifier to adjust volatility of analyte and/or matrix to eliminate these effects is also included. Addition of reactive gases (eg oxygen) to the carrier gas to improve matrix separation. Also included is Zeeman or other background correction techniques to remove interference due to absorption and scattering from coexisting molecules/atoms in the sample.
All
Correction for additive interferences in standard addition method is difficult. Use of matrix modifier, optimized temperature program for selective volatilization, background correction and removal of matrix interferences (inhibiting formation of free analyte atoms in the atomization step) are required to get right results in external calibration.