Embed Size (px)
Citation preview

A PROGRAMMABLE OPTICAL ANGLE
CLAMP FOR ROTARY MOLECULAR MOTORS
TEUTA PILIZOTA
A thesis submitted in partial fulfillment ofthe requirements for the degree of
Doctor of Philosophy at the University of Oxford
Wolfson CollegeUniversity of Oxford
Trinity Term 2006

A PROGRAMMABLE OPTICAL ANGLE
CLAMP FOR ROTARY MOLECULAR MOTORS
Teuta Pilizota, The Wolfson College
Thesis submitted for the degree of Doctor of Philosophyat the Univeristy of Oxford, 2006
ABSTRACT
This thesis describes the design of a programmable optical ‘angle clamp’, a novel
technique for the study of rotary molecular motors. The ‘angle clamp’ is based on
a home-made laser trap and uses a bead-pair as a novel handle to apply torque to
the motor proteins. The resolution achieved with this system is: 1◦ angular resolu-
tion, and 20 µs temporal resolution. The bead-pair was controlled using a feedback
algorithm with a precision of up to 2◦ and a bandwidth of up to 1.6 kHz.
The ‘angle clamp’ was applied to two rotary molecular motors of interest: F1-
ATPase and the bacterial flagellar motor. Preliminary data showing angular and
speed control of the bacterial flagellar motor are presented. Escherichia coli F1-
ATPase purification and a rotation assay was developed based on the protocols
learned and obtained from collaborators at Osaka University, Japan. Yeast mito-
chondrial F1-ATPase was provided by the members of The Chicago Medical School,
USA for collaborative work. The rotation of yeast mitochondrial F1-ATPase was
observed for the first time. The control of the angle of the Escherichia coli as well as
the yeast mitochondrial F1-ATPase was achieved and is presented. The encountered
problems with motor’s attachment to the surface are explained and discussed.
The temporal and angular resolution of the system presented in this thesis was
used by other members of Dr. R.M. Berry’s group for detection of small polystyrene
beads attached to the bacterial flagellar motor. This allowed insight into the behav-
ior of the chimeric sodium driven Escherichia coli flagellar motor in the low-load
regime as well as observation of steps in the motor rotation in the low-load and
low-speed regime. It has also allowed investigation of the switching behavior of a
wild type Escherichia coli flagellar motor.

ACKNOWLEDGEMENTS
The biggest thank you goes to my supervisor, Dr. Richard Berry. The last four
years have been both challenging and rewarding. For your support through out
those years, your enthusiasm and love for science, your excellent scientific insight,
your patience during discussions, you willingness to consider even the craziest ideas,
and for your guidance through all the stages of my research: thank you. You have
without a doubt taught me a lot.
To all the current and former members of my lab: Thomas Bilyard, Mark Leake,
Chien-Jung Lo, Yoshiyuki Sowa, Jennifer Chandler, Tania Saxl, Fan Bai, Stuart
Reid, Richard Branch, Wei-Ming Ho and Alex Rowe. Thank you for the interesting
scientific discussions, for all I learned about different cultures, and foremost for the
great deal of support and understanding I received. Special thanks goes to Thomas
Bilyard for being on the F1 team.
I am very grateful to Jelena Baranovic and Maja Petkovic, for helping me push
forward the F1 work during a wonderful and very hard working three months, and
to Prof. Judy Armitage and members of her lab for having Maja, Jelena and me
in their lab and helping us with the biochemistry. For the help with biochemistry
and for welcoming me in their lab I also thank Prof. Masamitsu Futai, Hiroyuki
Hosokawa and Mayumi Nakanishi.
To Dr. Sonia Contera and Dr. Maurits Deplanque I thank for their outstanding
support, help and advice. And to Dr. Russell Goodman and Tania Saxl for proof
reading my thesis.
To the staff of the Main Workshop, Research Workshop and Central Electronics
Workshop for manufacturing different parts of the setup, as well as for helping me
manufacture some of the parts on my own. To Janet Andrews for her patient help
with all the official procedures, paper work matters and any questions that I have
come to ask her during the years.
For being the most fantastic friends one could ever whish for I thank Branimir Lu-
kic, Mario Juric, Shelley Cook, Maoko Naganuma, Elaine Snell and Julian Summers.
And my mum, dad and grandmother I thank for always being there when I needed
them most.
In the end I whish to thank Prof. John Ryan and his IRC for their support.

To my parents

Contents
1 INTRODUCION 1
1.1 Overview . . . . . . . . . . . . . . . . . . . . . . . . . . . . . . . . . . 2
1.2 Molecular Motors . . . . . . . . . . . . . . . . . . . . . . . . . . . . . 2
1.2.1 Linear molecular motors . . . . . . . . . . . . . . . . . . . . . 7
1.2.2 Rotary molecular motors . . . . . . . . . . . . . . . . . . . . . 13
1.2.3 Synthetic molecular motors . . . . . . . . . . . . . . . . . . . 46
1.3 Single Molecule Techniques . . . . . . . . . . . . . . . . . . . . . . . . 47
1.3.1 Optical tweezers . . . . . . . . . . . . . . . . . . . . . . . . . . 50
2 MATERIALS AND METHODS 58
2.1 Optical trap . . . . . . . . . . . . . . . . . . . . . . . . . . . . . . . . 59
2.1.1 Requirements of the system . . . . . . . . . . . . . . . . . . . 59
2.1.2 Optical trap layout . . . . . . . . . . . . . . . . . . . . . . . . 60
2.1.3 Data acquisition and control electronics . . . . . . . . . . . . . 67
2.1.4 Laser damage to biological samples . . . . . . . . . . . . . . . 70
2.2 Bead pair preparation . . . . . . . . . . . . . . . . . . . . . . . . . . 72
2.3 Bead pair assay preparation . . . . . . . . . . . . . . . . . . . . . . . 75
2.4 F1-ATPase purification . . . . . . . . . . . . . . . . . . . . . . . . . . 76
2.5 F1-ATPase rotation assay preparation . . . . . . . . . . . . . . . . . . 81
2.6 E. coli rotation assay preparation . . . . . . . . . . . . . . . . . . . . 83
3 FEEDBACK 85
3.1 Overview . . . . . . . . . . . . . . . . . . . . . . . . . . . . . . . . . . 86
3.2 Feedback theory . . . . . . . . . . . . . . . . . . . . . . . . . . . . . . 86
3.3 Single bead algorithms and experiments . . . . . . . . . . . . . . . . 90
3.3.1 Alignment and calibration of the detector and AODs . . . . . 90
i
CONTENTS ii
3.3.2 Trap stiffness . . . . . . . . . . . . . . . . . . . . . . . . . . . 94
3.3.3 2-Dimensional Feedback Control . . . . . . . . . . . . . . . . . 95
3.4 Bead pair feedback algorithms and experiments . . . . . . . . . . . . 101
3.4.1 Alignment . . . . . . . . . . . . . . . . . . . . . . . . . . . . . 101
3.4.2 Feedback control of Bead Pairs . . . . . . . . . . . . . . . . . 103
3.4.3 Angular Trap Stiffness . . . . . . . . . . . . . . . . . . . . . . 104
4 BACTERIAL FLAGELLAR MOTOR 108
4.1 Overview . . . . . . . . . . . . . . . . . . . . . . . . . . . . . . . . . . 109
4.2 Feedback on the bacterial flagellar motor . . . . . . . . . . . . . . . . 110
4.2.1 Control of the speed of the bacterial flagellar motor . . . . . . 113
4.3 Collaborations with other group members using the optical trap . . . 115
4.3.1 Switching . . . . . . . . . . . . . . . . . . . . . . . . . . . . . 115
4.3.2 Low load measurements . . . . . . . . . . . . . . . . . . . . . 116
5 F1- ATPase 121
5.1 Overview . . . . . . . . . . . . . . . . . . . . . . . . . . . . . . . . . . 122
5.2 E. coli F1-ATPase rotation assay and feedback experiments . . . . . . 122
5.3 Yeast F1-ATPase rotation assay . . . . . . . . . . . . . . . . . . . . . 129
6 DISCUSSION, CONCLUSIONS AND FUTURE WORK 133
A An example of a QuVIEW program 145
B Analog to digital converter 148
C F1Fo purification 152

Chapter 1
INTRODUCION
1

1.1. Overview 2
1.1 Overview
Ushered by the technological developments of recent years, sub-disciplines of biology
studying basic structures of living systems have made and continue to make great
progress. The fields of bioinformatics, genetics, biochemistry, developmental biology
and biophysics all have a role in exciting new research that offers more and more
information on living systems.
Specifically, in the field of single molecule biophysics, optical and mechanical probes,
sensitive enough to measure forces with piconewton precision and nanometer accu-
racy, enable individual studies of molecules previously well characterized by bulk
experiments.
Initial questions that drove scientific research on the single molecule level include;
how do certain proteins move, how do they change their conformation, how do they
generate force or respond to it?
This thesis aims to answer similar questions for two rotary molecular motors: the
bacterial flagellar motor and F1Fo-ATPase. Thus, a system designed to probe the
energy profiles of rotary molecular motors was constructed and is described. Its ap-
plication to the bacterial flagellar motor and F1-ATPase is subsequently presented
and results discussed. Further ideas and an outline of future research is given at the
very end of the thesis.
1.2 Molecular Motors
A motor is a device that converts any given form of energy into mechanical energy.
Biological molecular motors are complexes that transform chemical energy directly
into mechanical work thereby ensuring suitable energy storage, force production and
directional motion on both microscopic and macroscopic scales.

1.2. Molecular Motors 3
Macroscopic motors as well as their surrounding are made of a large number of
small molecules. Although these molecules move according to Newton’s laws, on
time scales relevant for operation of macroscopic motors, information on their de-
terministic trajectories is lost, and their behaviour can be described statistically.
The most likely configurations of the system are very similar to each other, and
on macroscopic scales, differences between these configurations, i.e. thermodynamic
fluctuations, are negligible. As a result, joint behaviour of large number of molecules
that the macroscopic motor and its surrounding are made of, can be described
through the thermodynamical properties and laws of thermodynamics.
The number of molecules in a microscopic motor is still large, but microscopic mo-
tors are so small that they do ‘feel’ thermodynamic fluctuations. These fluctuations
are an essential component of the molecular motor and must be taken into account.
To describe the way a molecular motor works it is useful to define the so-called
bath and system variables [1]. Bath variables are taken into account implicitly;
they are extra degrees of freedom in the protein and in the solvent, which on ex-
perimental time scale fluctuate fast enough to be in equilibrium. System variables
define an n-dimensional space, and each point in that space has a corresponding free
energy value. A potential energy surface thus defined, spanning an n-dimensional
state space in which the motor moves, arises primarily from three sources; (1) in-
teractions within the motor, as well as interactions with the track along which the
motor moves (if one is present), (2) interactions with the molecules that serve as
fuel (source of chemical energy), and (3) interactions with the solvent. To illustrate
the point clearly, a case in which a motor can be described with one chemical and
one mechanical system variable is shown in Figure 1.1 [1].
The description of a molecular motor moving along an energy surface is usually
mechanical and stochastic, kinetic, or a combination of the two. A mechanical
picture is illustrated in Figure 1.1 A. Since the motor is microscopic its motion is

1.2. Molecular Motors 4
Figure 1.1: (A) Minimal potential energy surface for a molecular motor. The surfaceis periodic in both reaction and position coordinate, and has three local minima (A, B,C). These are connected by low-energy passes and the surface is tilted along the chemicalaxis, representing the free energy of the reaction. The long trough in the centre coupleschemical energy to mechanical motion. The system point moves by random walk over thissurface. (B) Correspondence between the potential energy surface and kinetic mechanismof the motor. The regions around the local minima represent the intermediate species.Diffusion between minima is equivalent to chemical transitions, which can be described bykinetic rate constants. Figure and the legend are taken from reference [1].
not given as a deterministic trajectory defined by the energy surface but it is better
described by the Smoluchowski equation as the diffusion of the system along the
potential energy surface.
The Smoluchovski equation for probability distribution w(x1, x2, t) where x1 and x2
represent chemical and mechanical coordinates is given as
∂w
∂t+ [
2∑
i=1
(−kB · T
γi
∂2
∂x2i
+1
γi
∂
∂xifi)]w = 0 (1.1)
where i is the number of system variables (one mechanical and one chemical in
Figure 1.1), fi are external mechanical forces acting on the motor, γi are friction
coefficients, kB is Boltzmann’s constant and T is the temperature [1].
The kinetic picture is illustrated in Figure 1.1 B. Minima in the energy surface are
recognized as intermediate states (A, B, C). Kinetic rate constants give statistical
rate at which transitions will occur between the minima. They will depend on

1.2. Molecular Motors 5
external forces acting on the motor, fi, and on the spatial position of the motor.
The mechanical motions in this description are thermally excited. The Smoluchowski
equation becomes a set of first-order or pseudo-first-order rate equations governing
the populations of the discrete states.
∂ρ
∂t= Kγ (1.2)
where ρ = (ρ1, ρ2, ..., ρn) is a vector of populations and K is a matrix of rate con-
stants or step transition probabilities:
K =
⎛
⎜
⎜
⎜
⎜
⎜
⎜
⎜
⎜
⎜
⎜
⎜
⎜
⎜
⎜
⎝
k11 k12 . . . k1n
k21 k22 . . . k2n
. . .
. . .
. . .
kn1 kn2 . . . knn
⎞
⎟
⎟
⎟
⎟
⎟
⎟
⎟
⎟
⎟
⎟
⎟
⎟
⎟
⎟
⎠
(1.3)
Both descriptions are in fact two different forms of an equation that describes
a Markov processes [1]. I have started this chapter by introducing them first since
they, despite great variety in geometry of different molecular motors, represent a
general framework for understanding them.
In addition, establishing this frame work facilitates the understanding of the moti-
vation that lies behind building the system presented in this thesis.
The description given above includes two commonly used models for explaining force
or torque generation by molecular motors, ‘power stroke’ and ‘thermal ratchet’. In
the ‘power stroke’ model the free energy supplied either by influx of ions or by the
ATP molecule is directly coupled to the torque/force-generating state. Thus ther-
mal fluctuations are not necessary for torque or force generation. ‘Thermal ratchet’
model on the other hand uses the free energy stored in the flux of ions or ATP

1.2. Molecular Motors 6
molecule to bias thermal fluctuations in a certain direction. Models for different
motors in which the difference between the two is not as clear are also possible and
were proposed [2]. If one looks more closely at the different geometries of molecular
motors, their separation into two groups, depending on the nature of movement they
undergo, is obvious; linear and rotary. Both types of mechanical movement require
energy input.
There are two sources of free energy used by molecular motors: (1) A protonmotive
(pmf ) or sodium-motive force (smf ), i.e. electrical potential and concentration gra-
dient, storing ∼6 kT per ion at ∼100 mV pmf. (2) An ATP molecule, each storing
∼18 kT.
Members of the myosin, dynein and kinesin families represent linear molecular mo-
tors which move in a specific direction along asymmetric actin filaments or micro-
tubules.
In the bacterial flagellar motor (bfm), F1Fo-ATPase (F1Fo) and V-ATPase, steps of
the mechanical cycle are represented by the circular motion of certain units around
a static part of the motor.
It is detailed information about the energy profile (see the imaginery motor given
in Figure 1.1) of the two rotary molecular motors of interest (the bfm and primarily
F1-ATPase) that one should gain with the system presented in this thesis. Below
I give a brief introduction to linear motors and a more extensive one of the two
rotary molecular motors, F1Fo and the bfm. At the very end I briefly mention other
molecular motors, for example DNA related motors. My aim is to create a broad
picture of the field of molecular motors (especially rotary motors), starting with
the general framework above, and finishing by placing my own research into that
picture. I believe that both the reader and myself gain a full understanding of the
place of my research in the field, with an introduction structured in this way.
Therefore, for each of the motors introduced, I explain what they are and what their
1.2. Molecular Motors 7
role and importance is, followed by a description of their structure. In my view the
main purpose of structural information is to help determine the reaction and position
coordinates given in Figure 1.1. I then focus on experiments that unravel motors’
function. These experiments give information about relevant intermediate states
(A, B, C in Figure 1.1) and chemical rate constants (Figure 1.1 B and Equations 1.2
and 1.3) or external forces and friction coeficients, fi and γi in Equation 1.1. For
linear motors, I reference the most important experiments and give a current model
of the motors’ chemomechanical cycle. I describe a few of these experiments, as an
example of the kind of work my system should enable us to do on rotary molecu-
lar motors. When introducing F1Fo and the bfm I describe the experiments more
extensively. This extensive description will help me to outline current unanswered
questions and explain how the system, built as part of my D.Phil. research, does
and will help in answering them.
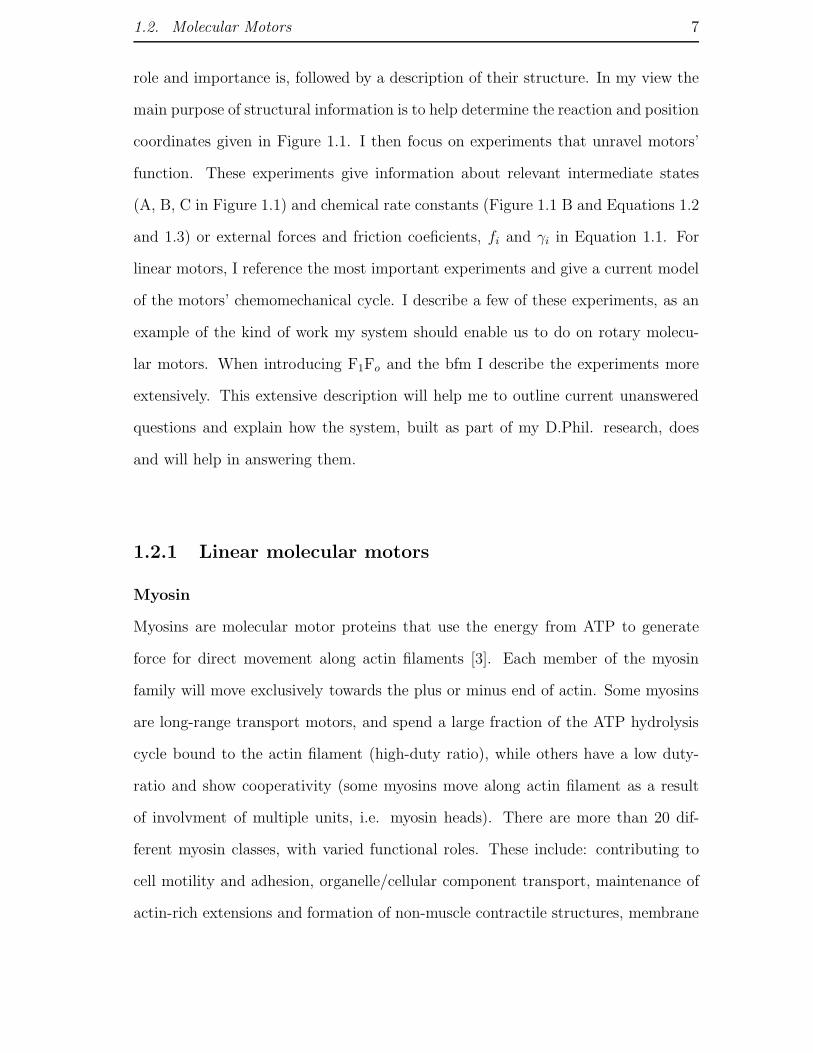
1.2.1 Linear molecular motors
Myosin
Myosins are molecular motor proteins that use the energy from ATP to generate
force for direct movement along actin filaments [3]. Each member of the myosin
family will move exclusively towards the plus or minus end of actin. Some myosins
are long-range transport motors, and spend a large fraction of the ATP hydrolysis
cycle bound to the actin filament (high-duty ratio), while others have a low duty-
ratio and show cooperativity (some myosins move along actin filament as a result
of involvment of multiple units, i.e. myosin heads). There are more than 20 dif-
ferent myosin classes, with varied functional roles. These include: contributing to
cell motility and adhesion, organelle/cellular component transport, maintenance of
actin-rich extensions and formation of non-muscle contractile structures, membrane
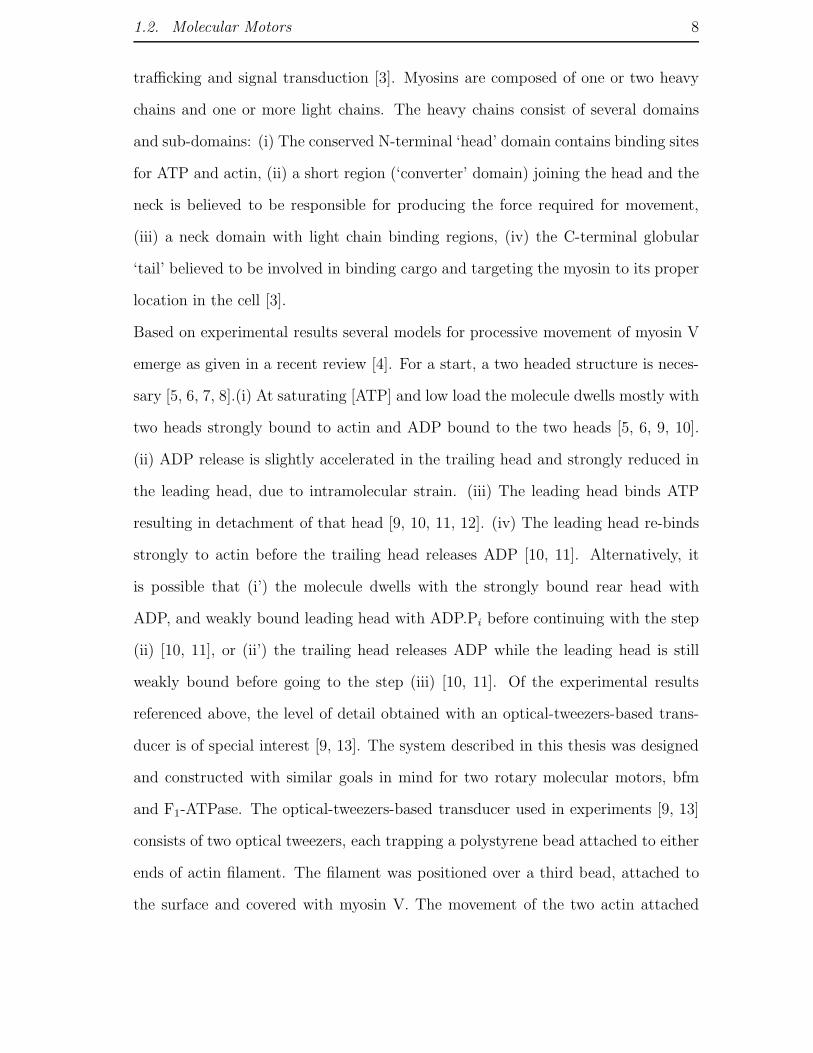
1.2. Molecular Motors 8
trafficking and signal transduction [3]. Myosins are composed of one or two heavy
chains and one or more light chains. The heavy chains consist of several domains
and sub-domains: (i) The conserved N-terminal ‘head’ domain contains binding sites
for ATP and actin, (ii) a short region (‘converter’ domain) joining the head and the
neck is believed to be responsible for producing the force required for movement,
(iii) a neck domain with light chain binding regions, (iv) the C-terminal globular
‘tail’ believed to be involved in binding cargo and targeting the myosin to its proper
location in the cell [3].
Based on experimental results several models for processive movement of myosin V
emerge as given in a recent review [4]. For a start, a two headed structure is neces-
sary [5, 6, 7, 8].(i) At saturating [ATP] and low load the molecule dwells mostly with
two heads strongly bound to actin and ADP bound to the two heads [5, 6, 9, 10].
(ii) ADP release is slightly accelerated in the trailing head and strongly reduced in
the leading head, due to intramolecular strain. (iii) The leading head binds ATP
resulting in detachment of that head [9, 10, 11, 12]. (iv) The leading head re-binds
strongly to actin before the trailing head releases ADP [10, 11]. Alternatively, it
is possible that (i’) the molecule dwells with the strongly bound rear head with
ADP, and weakly bound leading head with ADP.Pi before continuing with the step
(ii) [10, 11], or (ii’) the trailing head releases ADP while the leading head is still
weakly bound before going to the step (iii) [10, 11]. Of the experimental results
referenced above, the level of detail obtained with an optical-tweezers-based trans-
ducer is of special interest [9, 13]. The system described in this thesis was designed
and constructed with similar goals in mind for two rotary molecular motors, bfm
and F1-ATPase. The optical-tweezers-based transducer used in experiments [9, 13]
consists of two optical tweezers, each trapping a polystyrene bead attached to either
ends of actin filament. The filament was positioned over a third bead, attached to
the surface and covered with myosin V. The movement of the two actin attached

1.2. Molecular Motors 9
beads was monitored with two quadrant photo diodes and sudden changes in the
stiffness of the system, corresponding to myosin V binding to actin, were identified
by the changes in the Brownian noise. This revealed that the working stroke of
a single-headed, as well as a double-headed, myosin V happens in two substeps,
∼16 nm and ∼5 nm, of which the first substep is [ATP] independent while the sec-
ond substep became shorter at higher [ATP] [9]. By applying a sinusoidal motion
to one of the beads attached to the actin, the existence of prefered myosin binding
positions was identified, each separated 36 nm from the other. Thus it was proposed
that the single 36 nm step of a double-headed myosin V is a combination of a 25 nm
long working stroke and a 11 nm thermally driven diffusive movement [9]. A later
experiment with the same system, further developed, identified the load dependant
steps of the working stroke [13].
Kinesin
Kinesins are motor proteins that use the energy from ATP to transport cargoes
along microtubule rails [14]. Microtubules are well organized in cells and have a
polarity with a fast-growing (plus) end and a slow-growing (minus) end. Different
members of the kinesin family will move either towards the plus or minus end, and
will show either proccessivity (high-duty ratio) or cooperativity (low-duty ratio).
The functional roles of kinesin are as broad as with myosin. The entire family is di-
vided into 14 classes, members of which transport different kinds of cargo: organelles
and macromolecules in the cell, mitochondria, lysosomes, endotic vesicles, tubulin
oligomers, intermediate filament proteins, and mRNA complexes. They also have
a role in cytoplasmic viral transport [14]. Kinesin typically consists of two heavy
chains (KHCs) and light chains (KLCs). ‘Conventional kinesin’ (the kinesin discov-
ered first), has a rod-like structure composed of two heads (10 nm in diameter), a
stalk, and a fan-like end with a total length of 80 nm. Kinesins are distinguished

1.2. Molecular Motors 10
based on the position of the motor domain (head) into N-terminal, C-terminal, and
middle domain type. The C-terminal type kinesins studied thus far are minus-end
motors, the N-terminal types are plus-end motors [14].
Kinesin’s function has been extensively studied. As with myosin, I will mention only
a few experiments, in which the systems used and the knowledge aquired illustrates
well the kind of detailed information my system should yield for rotary molecular
motors [15, 16, 17]. A 1-D [16] and a 2-D [15, 17] optical force clamp was used to ap-
ply force to kinesin molecules in different directions. The motor turnover rate, kcat,
and substrate binding constant, kb, were monitored in responce to the applied force
and its direction. Sideways loads had an asymmetric effect on kcat [15], backwards
loads reduced both kcat and kb [15, 16], while forward loads had no significant effect
on kinesin [15]. These findings indicate a strongly load dependent transition (power
stroke) early in the cycle and a further smaller motion later in the cycle. Since the
effect of sideways loads was comparatively weak an (essentially) single-stroke mech-
anism is still proposed by the authors as the best explanation for the available data
[15]. A recent review [18] combines many other experimental results (mostly done
on double headed processive Kif5b kinesin) into a model as follows: (i) ATP binds
to the trailing head bound to microtubule [19, 20]. The leading head, detached from
microtubule, has ADP bound. (ii) The leading head attaches to microtubule and
ADP is released [19, 20, 21, 22, 23]. Upon ADP release an 8 nm kinesin step is
completed [24]. ATP binding to the leading head is strain inhibited [25, 26, 27]. (iii)
Hydrolysis occurs in the trailing head and Pi is released [21, 26]. (iv) A pull by the
leading head enables detachment of ADP bound trailing head [28, 23]. Trailing head
crosses over the leading head and becomes the new leading head ready to repeat the
cycle [28, 29, 30, 24].

1.2. Molecular Motors 11
Dynein
Dyneins are large motor proteins that carry their cargo towards the minus end of
microtubules [31]. Unlike kinesin dynein is not restricted to walking along the same
microtubule protofilament [32, 33, 34]. As well as kinesins and myosins, dyneins are
involved in wide variety of cellular functions: mitosis, vesicular transport, the as-
sembly and motility of cilia and flagella, and the generation of left-right asymmetry
in the developing embryo [31]. Dyneins are composed of one to three heavy chains
(HC). Each heavy chain consists of a C-terminal head domain, a stalk composed
of two elongated flexible structures and a N-terminal tail domain. The head is the
motor domain, the stalk binds to the microtubule and the tail to specific cargo.
Dyneins built from two or more HCs also contain two intermediate chains (IC),
involved in the binding of specific cargo. They are located at the base of soluble
dynein and interact both with the HCs and also with three different classes of light
chains (LC). Dyneins are separated into two major classes: cytoplasmic dynein (in-
volved in different cellular processes) and axenomal (producing the bending motions
propagating along cilia and flagella). While more than one member of kinesin and
myosin families, with their diverse cellular functions, will be present in the cell∗,
dynein in the cytoplasm has only one HC isoform (a few more are present in cilia
and flagella dyneins) and the functional variety comes from different accessory pro-
teins. Expression and function of these ‘helper’ proteins is achieved through a set of
different mechanisms [31]. Compared to kinesins and myosins less is known about
the way dynein works. Experiments that help build our understanding of the energy
potential along which this motor moves and the relevant mechanical and chemical
coordinates are summarised in a model from a recent review [35]: (i) Dynein without
nucleotide is bound to the microtubule [36, 37]. (ii) Upon ATP binding to the motor
head, dynein detaches from the microtubule [36, 37, 38, 39, 40, 41, 42]. (iii) ATP is
∗each coded by different gene(s)

1.2. Molecular Motors 12
hydrolysed and dynein changes its conformation in preparation for the power stroke.
(iv) The dynein stalk binds to the microtubule and the microtubule is pushed for-
ward by conformational changes in the head ring, and as a result ADP and Pi are
released [36, 37, 39, 43, 44, 45, 46, 47].
RNA and DNA Polymerases
Polymerases perform directional mechanical work against disipative forces during the
reaction of polymerization. The polymerization of nucleotide triphospates (NTPs)
is a process by which DNA polymerases (DNAP) synthesize exact copies of genomic
DNA during cell division, and the RNA polymerase (RNAP) initiates the tran-
scription process, thus providing expression of genetic information encoded in DNA.
RNAP uses double-stranded DNA as a template (non-polar and in principle permits
motion in both directions), where the direction of movement is determined by the
orientation of the promoter, while the DNAP direction of movement is determined
by polarity of the replication fork. Individual stepping events correspond to the
distance between individual base pairs (∼0.34 nm [48]). The velocity of the motor
is in some cases comparable to linear molecular motors and in some cases slower.
The most significant difference between other molecular motors and polymerases
are the larger forces generated by the later (force and velocity measurements done
on polymerases are similar to the kind of experiments the system described in this
thesis is designed for, for example [49, 50, 51]) The exact significance of such high
forces is not understood. Most probably the high force generated enables the poly-
merase to drive off the ‘road blocks’ (different DNA bound proteins) in the case of
RNAP, and in the case of DNAP it could promote efficient duplex unwinding [48].
Chemical energy is provided by the polymerase reaction, i.e. by all four nucleotide
triphosphates (NTPs), where each polymerization step is directly coupled to forward
motion of the enzyme.

1.2. Molecular Motors 13
Helicases
Helicases are molecular motor proteins that use the energy of NTP hydrolysis to
unidirectionally translocate along a ploymeric nucleic acid (NA) and unwind the
complementary strand of the double stranded NA (they can also destabilize the sec-
ondary structure of RNA, remove NA associated proteins, and thread NA through
various pores). Helicase activity involves NTP binding, hydrolysis and product re-
lease, which induces conformational changes in the helicase NA binding site. These
conformational changes will change helicase affinity for the NA or drive it to perform
a power stroke [52]. The helicase NTPase activity is elevated in the presence of NA.
1.2.2 Rotary molecular motors
F1Fo-ATPase (Figure 1.2)
F1Fo is an enzyme that generates roughly 2.0 million kg of ATP from ADP and
Pi in the 75-year lifespan of a typical 70 kg human [53]. The ATP molecule is the
energy ‘currency’ of living organisms. The transition to ADP, with one less phos-
phate bound, and the free phosphate, releases the energy needed for many cellular
processes), and it is therefore present in large amounts. In 1997 it was directly
proven that the enzyme undergoes rotary motion during ATP hydrolysis [54]. At
∼20 nm in size, it is one of the most evolutionary conserved enzymes [55, 56, 57]. It
is therefore no wonder that it is considered one of the most exciting and remarkable
works of nature.
STRUCTURE
F1Fo-ATPase has a very similar overall structure whatever the source; prokaryotes,
chloroplasts or mitochondria. The part of the enzyme located in the membrane is
usually referred to as Fo and the cytoplasmic part is usually referred to as F1 (Fig-

1.2. Molecular Motors 14
Figure 1.2: (A) Schematic showing E. coli F1Fo-ATPase. (B) Structure of the E. coli
F1Fo ATPase. Figure and the legend are taken from references [58] and [59].
ure 1.2 A and B). Synthesis and hydrolysis occur in F1 (Figure 1.2) which in the
prokaryotes (simplest ATP synthase) consists of α3β3γδǫ subunits. α3β3γ subunits
represent the central part of the enzyme, with ATP synthesis and hydrolysis occur-
ring in the α3β3 hexamer, while the γ subunit rotates, either driving the reaction

1.2. Molecular Motors 15
or driven by it.
Fo, consisting of ab2c10−14 subunits, uses a proton gradient to rotate c subunits, thus
supplying necessary energy for γ subunit rotation. While on a single molecule level
most of the work has been done on prokaryotic ATP synthase, crystal structures are
obtained primarily on the enzyme from bovine heart mitochondria. In 1994, Walker
and Leslie obtained a crystal structure of bovine heart mitochondria F1, with a res-
olution of 2.8 A and with a crystal grown in the presence of 250 µM AMP-PNP (an
analog of ATP), and 250 µM ADP (protein data bank (PDB) code 1BMF) [60]. The
structure consists of three α subunits, three β subunits, and a γ subunit. The non-
catalytic sites of all three α subunits have AMP-PNP and Mg2+ bound, while one β
subunit has ADP and Mg2+ bound (referred to as βDP), one AMP-PNP and Mg2+
(βTP) and one subunit is empty (βE). This native structure most likely represents
the Mg-ADP inhibited form, i.e. the state right after ATP was bound to one of the
β subunits, and is inhibited by the failure of Mg-ADP release from another of the
catalytic sites [61]. Several more crystal structures were obtained subsequently, of
which only a few significantly differ in terms of γ subunit orientation or the number
and location of nucleotides, compared to the native structure. One of them, bovine
mitochondrial F1 inhibited by Dicyclohexylcarbodiimide (DCCD), obtained in 2000
with a resolution of 2.40 A (PDB code 1E79) has ǫ and δ subunits as well as the γ
subunit, forming a foot that interacts with the membrane part of the protein (ǫ and
δ in mitochondrial F1 are equivalent of ǫ in bacterial, to avoid confusion in Figure
1.3 the two are compared) [62]. In the other bovine F1 structure, obtained in 2001
with a resolution of 2.00 A, the γ subunit orientation is shifted by 15◦ compared
to the native structure (PDB code is 1H8E) [63]. The crystal was formed in the
presence of 1 mM AlCl3, 5 mM NaFS and 660 µM ADP, and has ADP, Mg2+ and
glycerol bound to all α subunits; ADP, Mg and SO2−4 to the βE subunit; ADP,
Mg2+ and AlF−
4 to βDP and ADP, Mg2+, AlF−
4 and glycerol to the βTP subunit. It

1.2. Molecular Motors 16
is speculated that the structure represents the post-hydrolysis, pre-product release
step since the βE subunit now binds ADP and sulphate (mimicking Pi) and adopts
a ‘half-closed’ conformation. This interpretation of the 2001 structure implies that
the native structure is actually the ATP waiting state. However, in 2004 a BeF−
3
inhibited structure of bovine mitochondrial F1 was obtained with a resolution of
2.00 A (PDB code 1W0J) [64]. This BeF−
3 inhibited structure is very similar to
the native one, despite the fact that in terms of crystallization conditions it is very
similar to the AlF−
4 inhibited one. Why is the βE subunit empty in the BeF−
3 in-
hibited structure occupied in the AlF−
4 structure is not clear, but it suggests that
the small differences could be due to the crystal packing forces. One thus has to be
very careful when drawing conclusions about the working mechanism of an intact
protein from structures. It is worth noting that four independent inhibition sites of
bovine mitochondrial F1 have been identified while obtaining different crystal struc-
tures: the catalytic sites [60, 65, 62, 66, 63], the aurovertin B-binding site [67], the
efrapeptin-binding site [68] and the site to which natural inhibitor protein IF1 binds
[69]. Understanding of these inhibitors of bovine mitochondrial F1 is of importance
for the treatment of several disorders linked to the regulation of the ATP synthase,
including some cancers [70]. In 1997, the nucleotide-free structure of the α3β3 hex-
amer from Thermophilic Bacillus PS3 was obtained with a resolution of 3.20 A,
showing that the α and β subunits are essentially the same as in the bovine crystals
[71]. In this structure only one β subunit was filled with the nucleotide and the
γ subunit was twisted counterclockwise compared to the mitochondrial structures
suggesting that this structure, rather then the 1994 native structure, represents the
ATP waiting step. The structure of E. coli F1 was probed mostly with NMR studies
[72] and electron microscopy [73, 72, 74, 75] and the arrangement of the subunits as
shown in Figure 1.3 B was thus determined.
In 2005, a crystal structure of the Fo c-ring from Na+-ATPase from Ilyobacter

1.2. Molecular Motors 17
Figure 1.3: (A) Schematic showing the structure of mitochondrial F1Fo-ATPase.(B) Schematic showing the structure of E. coli F1Fo-ATPase. δ and ǫ subunits inthe mitochondrial enzyme are equivalent to the ǫ subunit of the E. coli enzyme.The δ subunit of the E.coli enzyme is equivalent of the oligomycin sensitivity con-ferring protein (OSCP) in mitochondrial enzyme. Also, in mitochondria the sta-tor is built of one b subunit and has F6 and d subunits, while the E. coli en-zyme has only a b subunit dimer. This figure is taken from the following webpagehttp://www.rpi.edu/dept/bcbp/molbiochem/MBWeb/mb1/part2/f1fo.htm, where it isstated that it was provided by Prof. J. E. Walker
tartaricus was determined with 2.40 A resolution (PDB code 1YCE) [76]. Each of
the 11 c subunits showed a cylindrical, hourglass shape and had Na+ bound in the
middle and closer to the outer surface of the subunit (the crystal was formed in the
presence of 100 mM sodium acetate, which promotes binding of Na+). The c-ring
complex is ∼7 nm in height with an outer ring diameter of ∼4 nm in the middle
and ∼5 nm at the top and the bottom. Towards the periplasmic surface from the
binding site, a cavity was observed. It is speculated that the Tyr70 side chain could
relocate to this cavity and allow ion binding and unbinding from the a subunit.
Structures of the following other F1F o-ATPase subunits are known: the NMR struc-
ture of bovine mitochondrial stator unit OSCP (PDB code 2BO5) [77], the NMR
structure of F6 subunit from bovine mitochondrial F1 (PDB code 1VZS) [78], a
crystal structure of bovine mitochondrial peripheral stalk consisting of subunits b,

1.2. Molecular Motors 18
d and F6 (PDB code 2CLY) [79], the NMR structure of E.coli δ subunit (PDB code
1ABV) [80], the NMR structure of the membrane spanning part of the b subunit of
E.coli F1 (PDB code 1B9U) [81], the crystal structure of the ‘dimerisation domain’
of b subunit of E.coli F1 (PDB code 1L2P) [82]. These structures, as well as a
recent electron cryomicroscopy structure of bovine heart mitochondrial F1 [83] and
biochemical studies which probed different features of F1Fo-ATPase structure (for
example [84]), contribute to our current understanding of position and orientation
of certain subunits as shown in Figure 1.3 A and B.
FUNCTION
F1 hydrolysis
Although indirect evidence of rotation of some F1-ATPase subunits had been ob-
tained before, rotation was observed directly in 1997 [54], followed by a series of ab-
solutely beautiful single molecule experiments, from which a great deal was learned
about ATP hydrolysis and of which I give a short account below. In a 1997 experi-
ment, a genetically engineered F1, with His-tags on β subunits and a cys mutation
on the γ subunit, was attached to coverslip surface, and a fluorescently labelled actin
filament was attached to the γ subunit through a biotin-streptavidin-BSA link. Di-
rect rotation was observed under an optical microscope. A later experiment done in
a similar fashion had a fluorescent actin filament attached to the ǫ subunit. Again,
rotation was observed and was taken as a direct proof that the ǫ subunit as well
as γ forms the F1 rotor [85]. More conclusive proof came in 2005 in an experiment
in which rotation of the ǫ subunit was observed in an F1Fo system incorporated
into liposomes. Rotation of the ǫ subunit (labelled with a fluorescent donor) was
observed relative to the b subunit (labelled with a fluorescent acceptor) by fluo-
rescence resonance energy transfer (FRET) [86]. In 1998 an experiment similar to
the one in 1997 revealed discrete 120◦ steps in motor rotation [87]. The steps were
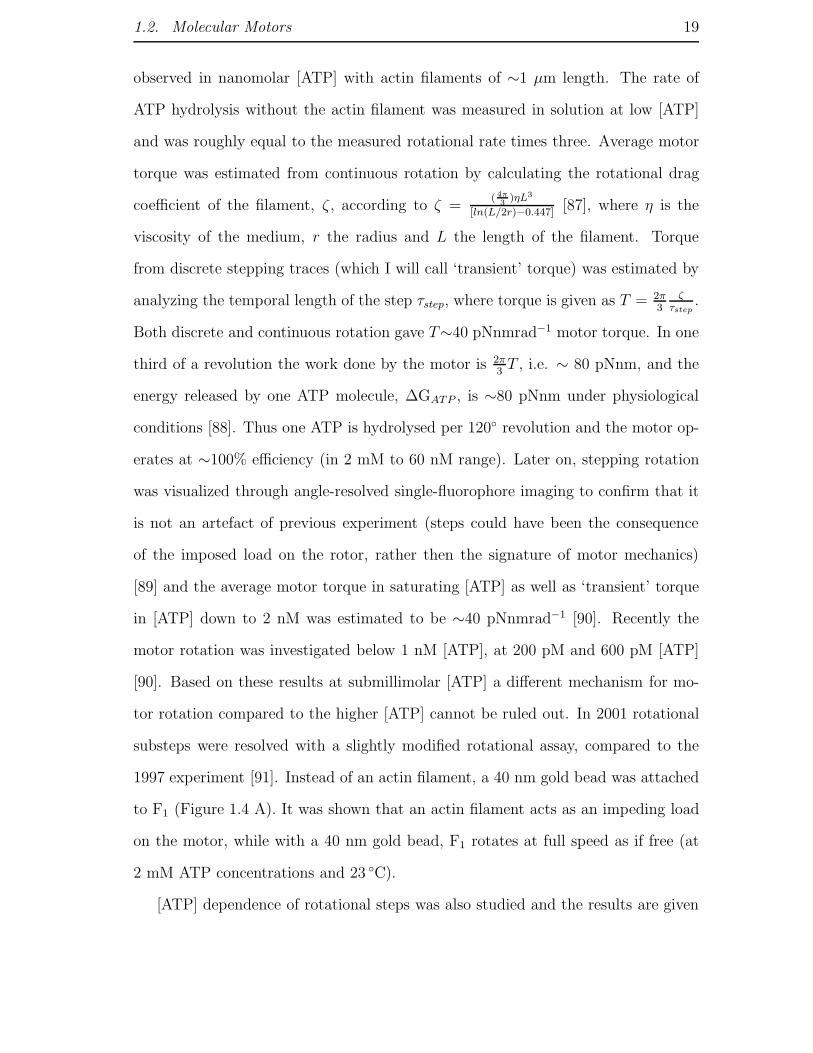
1.2. Molecular Motors 19
observed in nanomolar [ATP] with actin filaments of ∼1 µm length. The rate of
ATP hydrolysis without the actin filament was measured in solution at low [ATP]
and was roughly equal to the measured rotational rate times three. Average motor
torque was estimated from continuous rotation by calculating the rotational drag
coefficient of the filament, ζ , according to ζ =( 4π
3)ηL3
[ln(L/2r)−0.447][87], where η is the
viscosity of the medium, r the radius and L the length of the filament. Torque
from discrete stepping traces (which I will call ‘transient’ torque) was estimated by
analyzing the temporal length of the step τstep, where torque is given as T = 2π3
ζτstep
.
Both discrete and continuous rotation gave T∼40 pNnmrad−1 motor torque. In one
third of a revolution the work done by the motor is 2π3
T , i.e. ∼ 80 pNnm, and the
energy released by one ATP molecule, ∆GATP , is ∼80 pNnm under physiological
conditions [88]. Thus one ATP is hydrolysed per 120◦ revolution and the motor op-
erates at ∼100% efficiency (in 2 mM to 60 nM range). Later on, stepping rotation
was visualized through angle-resolved single-fluorophore imaging to confirm that it
is not an artefact of previous experiment (steps could have been the consequence
of the imposed load on the rotor, rather then the signature of motor mechanics)
[89] and the average motor torque in saturating [ATP] as well as ‘transient’ torque
in [ATP] down to 2 nM was estimated to be ∼40 pNnmrad−1 [90]. Recently the
motor rotation was investigated below 1 nM [ATP], at 200 pM and 600 pM [ATP]
[90]. Based on these results at submillimolar [ATP] a different mechanism for mo-
tor rotation compared to the higher [ATP] cannot be ruled out. In 2001 rotational
substeps were resolved with a slightly modified rotational assay, compared to the
1997 experiment [91]. Instead of an actin filament, a 40 nm gold bead was attached
to F1 (Figure 1.4 A). It was shown that an actin filament acts as an impeding load
on the motor, while with a 40 nm gold bead, F1 rotates at full speed as if free (at
2 mM ATP concentrations and 23 ◦C).
[ATP] dependence of rotational steps was also studied and the results are given

1.2. Molecular Motors 20
Figure 1.4: (A) Side view of the observation system. The 40-nm bead gave a large enoughoptical signal that allowed a submillisecond resolution; but the bead was small enough notto impede the rotation. (B) Sequential images of a rotating bead at 2 mM ATP. Images aretrimmed in circles (diameter 370 nm) to aid identification of the bead position; centroidpositions are shown above the images at 3x magnification. The interval between images is0.5 ms. (C) [ATP]=2 mM (D) [ATP]=20 µM. Grey horizontal lines are placed 30◦ belowblack lines. Insets, positions of a bead within 0.25-0.5 ms before (red) and after (green)the main (90◦ or 120◦) steps; runs lasting 0.5 s (2 mM) or 2 s (20 µM) were analysed.Circles indicate projection of ∼0◦ and ∼90◦ dwell points on an obliquely situated circulartrajectory that best fit the data. Angles in the time courses are those on the oblique circle.Figure and the legend are taken from reference [91].
in Figure 1.4 C and D. At high [ATP] only 120 ◦ steps were seen, while at low [ATP]
90 ◦ and 30 ◦ substeps could be distinguished. The duration of the 120 ◦ step at
saturating [ATP] was roughly equal to that of the 30 ◦ substeps at low concentra-
tions showing that the 90 ◦ substep is ATP dependent. Since the 90 ◦ substep gets
longer as the ATP concentration decreases it is sensible to assume that it corre-
sponds to a step in which the ATP molecule binds to the enzyme. To confirm this
conclusion histograms of dwell times between two main steps for different ATP con-
centrations were plotted and the following rate constants obtained from exponential
fits: kon=(3.0±0.1)·107 M−1s−1 from a single exponential fit to the histogram at low
[ATP] and k1=(1.64±0.06) ms−1 and k2=(0.71±0.02) ms−1 from a double exponen-
tial fit to the histogram at saturating [ATP]. The calculated kon is in agreement with

1.2. Molecular Motors 21
the rate constant for ATP binding to the enzyme obtained from bulk experiments,
therefore it is clear that 90 ◦ substep is an ATP waiting step. The 30◦ and 90◦ steps
were later corrected to be 80◦ and 40◦ steps (bead-pairs were used instead of single
beads giving better angle resolution) [92]. It was not clear, however, from the 2001
experiment that ATP binding immediately leads to the rotational 90◦ step. This
was investigated in a later experiment where a fluorescently labelled ATP was used
simultaneously as the bead-pair rotation was monitored [93]. It was found that: (1)
ATP (or ADP) stays bound to the F1 during two 120◦ steps, (2) the 80◦ substep
happens immediately after the fluorescently labelled ATP binds to the motor, and
(3) that the bead angle and polarization of the fluorescent dye were correlated, im-
plying that the orientation of γ subunit towards β subunits dictates which β subunit
will bind the ATP next. From the two reactions with almost equal rate constants
occurring during the 40 ◦ substep, one was identified as the ATP cleavage in a later
experiment, in which a mutant that slowly hydrolyses ATP and a slowly hydrolyz-
able substrate ATPγS were used [92].
Regarding the torque generation question: (1) It was proven that the so called
‘DELSEED’ region, a conserved acidic region on the β subunit in contact with the
γ subunit, does not have a direct role [94]. (2) Torque generated by mutants with
one, two or three altered catalytic sites that bind ATP slowly stayed the same despite
the fact that the binding affinity (kon rate) was reduced [95]. The torque generated
by the wild type F1 when using GTP or ITP whose kon rate is lower then that of
ATP [96] also stayed the same. This can be explained with the ‘binding zipper’
model proposed by Oster et al. [97] which divides the ATP binding process into
docking of ATP (described by kon) and the torque generation as a result of zipping
of hydrogen bounds between Pi moiety of ATP and residues of the catalytic site.
(3) The rotor tip inside the α3β3 hexamer of thermophilic Bacillus is not necessary
for torque generation [98, 99, 100, 101].

1.2. Molecular Motors 22
It is worth mentioning that the rotation of wild type F1 is accompanied by frequent
pausing; on average every 22 s F1 will lapse into a pause (on average 32 s long) [102].
The pausing, caused by the Mg-ADP inhibited state, represents a regulatory mecha-
nism, and the inhibition can be reversed by ATP binding to one of the non-catalytic
α subunits [103, 104, 105, 106], presence of Pi at one of the catalytic sites [107] or by
mechanical activation of F1 (indicating that pushing the γ subunit forwards weakens
the affinity of its catalytic side for ADP) [108]. In terms of the scheme that emerges
for ATP hydrolysis of F1, it is worth noting that a few experiments suggest a bi-site
model of catalysis (a maximum of two β subunits are occupied with a nucleotide at
some point during a 120◦ rotation), while others favour a tri-site model (three sites
are occupied at some point during a 120◦ step). I will describe briefly a recently
presented model given in reference [93] which describes known as well as unknown
steps well (Figure 1.5). In the tri-site model it shows four successive ATP-waiting
states (Figure 1.5 A, top), with the first 120◦ step driven by binding of Cy3-ATP
(a fluorescently labelled, slowly hydrolyzable ATP analog used in the experiment).
A detailed account of 120◦ to 240◦ step is given in Figure 1.5 B as follows: (1)
ATP binds to the remaining empty site of the β subunit of F1 (marked as site 0).
(2) An 80◦ step occurs, driven by ATP binding. (3) At the site marked as -1, two
reactions with equal rate constants need to occur (the rate limiting reaction must
take place on site -1 based on the results of [93]). Possible candidates are Pi release
and ATP hydrolysis, since ATP and later ADP stays bound for two steps. (4) A 40◦
step occurs, after which F1 waits for the next step. ADP release needs to happen
at some point between events (1) to (4) but is not yet clear when. Figure 1.5 C
shows an alternative bi-site model. Even though this model incorporates most of the
known facts about the F1 hydrolysis cycle, more complicated scenarios cannot yet
be dismissed (for example the existence of smaller shorter substeps). It is worth not-
ing that a recent model [59] suggests that there is no single ‘main kinetic pathway’

1.2. Molecular Motors 23
Figure 1.5: (A) Rotation scheme consistent with Figure 2. Four successive ATP-waitingstates are shown. (B) Events between 120◦ and 240◦. Nucleotide occupancy in schemes(A) and (B) alternates between two and three. (C) An alternative scheme in which theoccupancy alternates between one and two. Figure and the legend are taken from reference[93].
(except under very low substrate). In total there are 64 possible reaction pathways
(corresponding to the 64 occupancy states of the F1 hexamer) and the substrate and
product concentrations affect the overall potentials of F1. Thus under experimental
conditions multiple pathways exist. The authors of the paper conclude their work
by saying: ‘Attempting to fit data with an a priori selected biochemical path will
likely prove fruitless or misleading’.
F1 synthesis
Direct evidence for the chemical synthesis of ATP by mechanically driven F1-ATPase
was demonstrated in 2004 [109]. F1 was attached to the coverslip surface by engi-
neered His tags on β subunits as before, and the γ subunit was labelled with a
magnetic bead attached via a biotin-streptavidin link. The magnetic bead was ro-

1.2. Molecular Motors 24
tated using magnetic tweezers (see section 1.3). Rotation in the synthesis direction
resulted in production of ATP, detected by the luciferase-luciferin reaction. Detect-
ing the ATP proved to be the most difficult problem, due to the background ATP in
buffers nominally containing only ADP. Thus sample droplets (3 µm in height and
30 µm in diameter) on a patterned area coated with Ni2+-NTA were used to reduce
the volume of the sample. A later experiment used a silicone device presenting a
large array of micrometer-sized cavities enclosing F1 in femtolitre chambers, over
long periods of time [110]. F1 was attached to the surface via His tags on α and
β subunits and with a magnetic bead linked to the γ subunit as in the previous
experiment [109]. The magnetic bead on the F1 in the femtolitre chambers lacking
ATP was rotated in the synthesis direction with magnetic tweezers. When the mag-
netic field was switched off the F1 protein rotated in the hydrolysis direction, with
the speed proportional to the amount of synthesized ATP. The mechanochemical
efficiency was proven to be low for the α3β3γ subcomplex but was estimated to be
around 77% when α3β3γǫ was used. This result suggests that catalytic reactions on
F1 are tightly coupled to mechanical rotation, as well as that the ǫ subunit has an
essential function during synthesis [111]. An illustration of the experiment and the
number of revolutions with magnetic fieled switched on and off is given in Figure
1.6.
Fo
Investigating the membrane bound Fo part of the enzyme is difficult. A substantial
effort has gone into proving and investigating Fo proton powered rotation from sev-
eral laboratories around the world. Progress is slow and experimental data are noisy.
The first observation of F1Fo rotation during ATP synthesis or hydrolysis came in
2002 [112]. Na+-translocating ATP-synthase of Propionigenium modestum specially
labelled with a single fluorophore on one c subunit was used. The enzyme was immo-

1.2. Molecular Motors 25
Figure 1.6: (A) An F1 enzyme bound to a magnetic bead was rotated in a backward(clockwise) direction with magnetic tweezers within a microchamber in the presence ofADP, Pi and a small amount of ATP. Synthesized ATP accumulated in the chamber.(B) Before and after a forced clockwise rotation, spontaneous anticlockwise rotation wasrecorded as a means of detecting ATP synthesis through the increased rotational speed(see inset). The figure and figure legend are taken from [111].
bilized via His tags on β subunits and reconstituted into proteoliposomes. Rotation
was observed with polarization-resolved confocal microscopy during synthesis, upon
applying a diffusion potential, but not with a Na+ concentration gradient alone, and
during hydrolysis, in the presence of Na+ but not without the addition of Na+ ions.
Rotation was sensitive to DCCD, a known Fo rotation inhibitor. In a later exper-
iment F1Fo from E.coli was engineered for FRET, with a donor on the γ subunit
and acceptor on b subunit, and incorporated into liposomes and the synthesis and
hydrolysis rotation observed [113]. The γ subunit rotated stepwise during proton
transport-powered ATP synthesis, showing three distances with regards to the b
subunit. Step dwell times were found to correspond to the catalytic turnover times.

1.2. Molecular Motors 26
Having introduced the known, here is my attempt at summarising the unknown
aspects of the F1 and F1Fo chemomechanical cycle:
• Orientation of the γ subunit governs the affinity of ATP for a given β sub-
unit: Upon binding of nucleotide β subunit changes conformation, however the
question of how the motor torque is generated during hydrolysis still remains
open. Some of the models for F1-ATPase hydrolysis are quite explicit about
motor torque generation, proposing a binding zipper model [59]. It would be
interesting to confirm this experimentally.
• Three rate constants are known, which tell us about ∆G for three particular
states each with a corresponding γ-angle, but can we map the energy profile
for all angles?
• A recent model suggests that the energy profiles of the F1 are dependent on the
substrate/product concentrations [59]. Can this be confirmed experimentally?
• F1 hydrolysis seems to be insensitive, while F1 synthesis coupling efficiency is
sensitive to the presence of ǫ subunit. How does the energy profile of these
two subcomplexes α3β3γ and α3β3γǫ vary with angle? Is it different to the
hydrolysis direction, and if so, in what way?
• Is the second catalytic reaction during the ATP independent 40◦ step ADP
release?
• Are there any smaller unseen substeps?
• The entire rotational cycle of Fo, as well as coupling between F1 and Fo is
unknown and poses a big challenge.
The system built was primarily designed to tackle the first four questions listed
above. In fact, the detailed information about the motors’ mechanochemical cycles
1.2. Molecular Motors 27
and working mechanisms provided with the ‘force clamps’ and ‘position clamps’
experiments which combine optical traps with controllable feedback systems in the
case of linear and DNA related molecular motors [15, 16, 17, 114] served as the
motivation for building this system. It was designed as an ‘angle clamp’ with high
temporal and angular resolution for the study of rotary molecular motors, the bac-
terial flagellar motor (bfm) and F1Fo-ATPase. The ‘angle clamp’ feedback, as well
as using a polystyrene bead duplex (bead pair) as a handle to apply external torque
to rotary molecular motors, allows detail investigation of the motor energy profile
at any chosen angle. At low [ATP], for example, with probes which present an
impeding load (hence allowing only three 120◦ steps to be visualized) one expects
interesting behaviour in the feedback signal while motor is held at the ATP waiting
step. At smaller loads interesting behaviour should be seen at 6 different angles.
The feedback signal would carry the signature of the motor energy profile. The
temporal and angular requirements of such a system are further discussed in the
section 2.1.1 and its design and performance in subsequent chapters of this thesis.
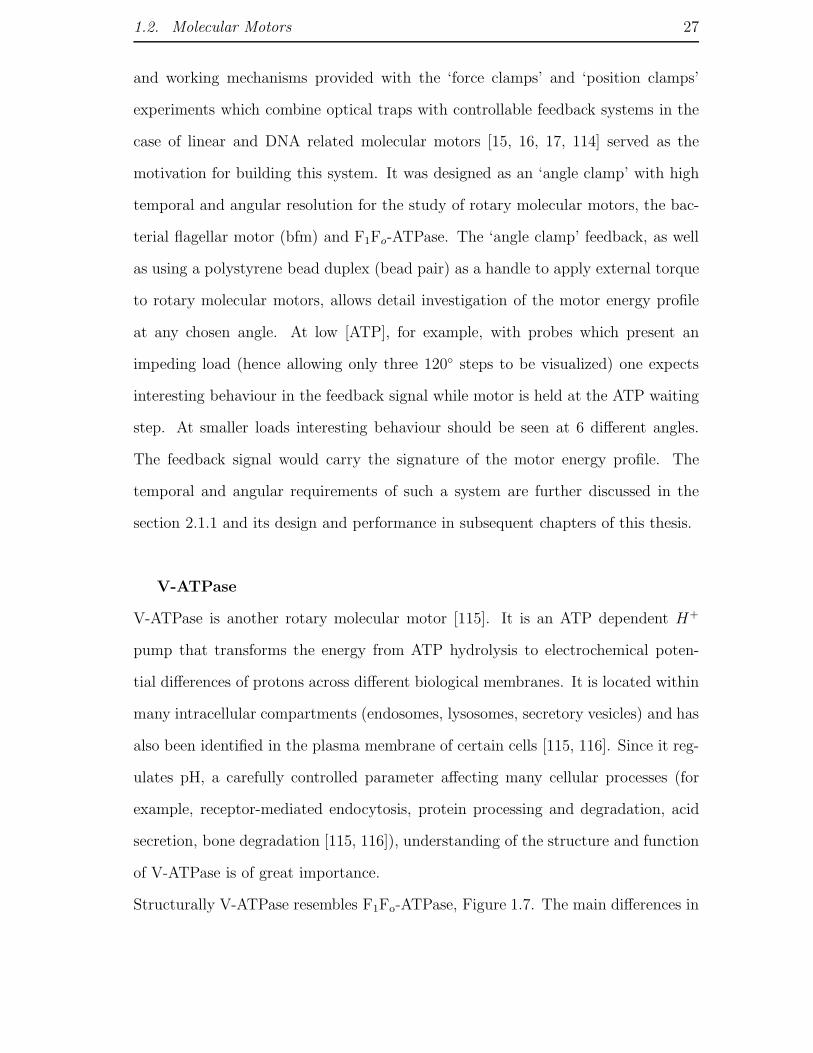
V-ATPase
V-ATPase is another rotary molecular motor [115]. It is an ATP dependent H+
pump that transforms the energy from ATP hydrolysis to electrochemical poten-
tial differences of protons across different biological membranes. It is located within
many intracellular compartments (endosomes, lysosomes, secretory vesicles) and has
also been identified in the plasma membrane of certain cells [115, 116]. Since it reg-
ulates pH, a carefully controlled parameter affecting many cellular processes (for
example, receptor-mediated endocytosis, protein processing and degradation, acid
secretion, bone degradation [115, 116]), understanding of the structure and function
of V-ATPase is of great importance.
Structurally V-ATPase resembles F1Fo-ATPase, Figure 1.7. The main differences in

1.2. Molecular Motors 28
Figure 1.7: (A) and (B) F1Fo-ATPase structure from Figure 1.3. is given for comparison.(C) Schematic model of yeast V-ATPase. Rotor subunits are colored in red; stator subunitsare shown in blue. Figure (C) is taken from the reference [117]
function, compared to F1Fo-ATPase, are due to the membrane embedded Vo part of
the enzyme. Fo contains approximately twice as many central subunits in its rotor.
A smaller number of membrane embedded rotor subunits allows V-ATPase to pump
proteins even against large proton gradients, i.e. in conditions were F1Fo-ATPase
could not act efficiently as a proton pump. Since V-ATPase controls pH (or pNa)
and membrane voltage, a very important question for understanding its function, is
that of its regulatory pathways. These include the reversible dissociation of V1 and
Vo complexes (widely conserved from yeast to animal cells) [118, 119, 120], as well as
other mechanisms such as subunit-subunit interactions [121], or interactions of the
V-ATPase with other proteins that serve physiological regulation [122, 123]. The
great interest in understanding these processes is further amplified by findings which
attribute some diseases to genetic alterations of specific subunits of the V-ATPase.
In terms of proposed models for the V-ATPase mechanochemical cycle, these are
based on the models of F1Fo-ATPase and suggest that cytoplasmic ions bind to the
rotor subunits of Vo by passing through half channels in the stator subunits of Vo.
The rotation of the rotor subunits of Vo is achieved using the energy stored in ATP,

1.2. Molecular Motors 29
hydrolysed on stator subunits of V1 [124, 125].

1.2. Molecular Motors 30
Bacterial flagellar motor (Figure 1.8)
The bacterial flagellar motor (bfm) is a rotary machine about 50 nm in diameter,
embedded in the cell envelope and connected to an extracellular helical filament.
The motor converts chemical energy to the rotational mechanical motion of some of
its units (rotor). Chemical energy is supplied by the flow of ions down an electro-
chemical gradient across the cytoplasmic membrane into the cell (the protonmotive
force (pmf ), or sodium-motive force (smf )). Motor rotation is coupled to rotation
of the flagellum thus enabling the cell to swim. Different species of bacteria use
flagella to swim in different ways (there are exceptions: some bacterial species do
not base their motility on rotation of flagella). Most of the work on the bfm so far
has been on the closely related E.coli and Salmonella enterica. Both use several
flagella that form a bundle and propel the cell forward, and H+ ions are used to
generate the rotary motion. Several interesting studies that have explored the sim-
ilarities and differences between proton and sodium driven motors involve Vibrio
Alginolyticus, which uses a single polar flagellum contained in a membrane sheath
to swim and Na+ ions to generate mechanical motion. Since bacteria swim to find
places with favourable conditions, they actively direct their motion by changing the
direction of the motor rotation, or by starting and stopping. These events are based
on the information received from their sensory system. The bfm is a remarkably
powerful motor achieving speeds of several 100 revolutions per second (rps), and up
to 1700 rps in sodium driven motors [129].
STRUCTURE
The bacterial flagellum has a complex structure (Figure 1.8) composed of ∼20 dif-
ferent proteins with 40-50 genes involved in its expression, assembly and control. It
spans the cell membrane extending into the cytoplasm and the cell exterior. It con-
sists of a hook and a flagellar filament, hook-filament junction proteins, periplasmic

1.2. Molecular Motors 31
Figure 1.8: (right) A schematic diagram of Salmonella bfm based on an electron micro-graph [126]. (left) Axial slice of the Treponema flagellar motor and the electron micrographof Salmonella motor as well cartoon interpretation of both motors. Scale bars are 20 nm.Figures are taken from references [127] and [128].
P and outer-membrane L ring, rod, MS-ring, C-ring, stator units, capping proteins
and an export apparatus [127, 130].
1.2. Molecular Motors 32
The flagellar filament is composed of the FliC protein (flagellin) present in up to
20 000 copies. The length of the filament can vary (usually 5-10 µm) and it can be
re-grown when needed. It is composed of 11 protofilaments, each of which can be
found in a short or long shape (depending on how many filaments are in each shape
several helical forms of the filament are possible). Protofilaments are arranged in a
cylinder with a slight tilt with respect to the cylinder axis [127, 130].
The hook is a flexible structure 55±6 nm in length [131], connected to the filament
via hook-filament junction proteins FlgK and FlgL and composed of ∼120 copies of
a single protein FlgE. FlgE proteins are arranged in 11 protofilaments which con-
tinuously switch from short to long during rotation [127, 130]. The hook displays a
great flexibility but enough torsional stiffness to transfer torque to the filament.
The compliance of the bacterial flagella was measured by rotating tethered bacterial
cells with optical tweezers. The compliance was nonlinear, showing a torsionally
soft phase up to 180◦ and a rigid phase for larger angles [132]. It was suggested and
later confirmed that the soft phase corresponds to the wind-up of the flagellar hook
[133]. The compliance of the bacterial hook was measured with an E.coli strain
that produces long hooks and no filaments. It was found, from the relaxation time
after wind-up of the tethered cells with optical tweezers, that the compliance of the
hook is similar to the compliance of the filament in the torsionally soft phase from
previous experiment.
The periplasmic P ring and outermembrane L ring are composed of FlgI and FlgH
proteins, and form either a part of the rotor or are fixed to the cell wall [134].
Rod proteins FlgB, FlgC, FlgF, FlgG share common structural motifs and are of
similar lengths (so called axial proteins), thus forming a continuous, mechanically
stable structure [135]. FliE does not resemble the axial proteins and is located at
the distal end of the MS-ring probably serving as the junction protein between the
components with axial and rotational symmetry.

1.2. Molecular Motors 33
The MS-ring is formed from the FliF protein [136, 137]. FliM and FliN comprise
the C-ring, and together with FliG form the rotor and the ‘switch complex’ (muta-
tions in FliG, FliM and FliN lead to defects in switching) [138, 139]. The ‘Switch
complex’ also serves as the housing for the export apparatus of the bacterial flagella.
The flagellum is built from the inside out and the export apparatus is used to pass
the components of the flagellum through a channel at the center of the MS-ring.
The copy number of FliM is 34±6, and FliN 111±13, supporting the idea that FliM
and FliN form FliM1-FliN4 heteromers [140]. FliG and FliF have 26 fold symme-
try [140]. Fusion of the FliM and FliN as well as FliG and FliF proteins does not
hinder rotation (the MS-ring is thus considered to be the part of the rotor as well).
Fusion of the FliG and FliM produces a non-functional motor and disables flagel-
lar assembly. The C-terminal domain of FliG, with about 100 residues, interacts
with one of the stator proteins, called MotA. Other parts of the FliG protein are
essential for flagellar assembly and interact with the MS-ring [141, 142, 143, 144]
and FliM [145, 142, 146]. FliM binds to the chemotactic signalling protein CheY
[147, 148, 145, 149].
MotA and MotB are membrane proteins that form the stator of the H+ driven mo-
tor (PomA, PomB, MotX and MotY are Na+ driven equivalents). Mot (or Pom)
proteins can be inserted into the assembled structure at the later stage by inducing
the mot genes. Based on Na+ driven motor studies, PomA and PomB proteins form
a complex of four PomA and two PomB (same is likely for MotA and MotB) proteins
[150, 151]. Two thirds of the MotA molecule are in the cytoplasm [152, 153] while
MotB proteins have one membrane spanning α-helix and the rest of the molecule
is in the periplasmic place [154]. MotB has a peptidoglycan domain near the C-
terminus which anchors the stator unit to the cell wall [155]. Mutational studies
identified Asp32 in MotB protein as the protonation and deprotonation site [156].
The type III export apparatus, as well as hook and filament capping proteins play
1.2. Molecular Motors 34
a significant role in flagallar assembly. The export apparatus is the part of the flag-
ella structure and is composed of FliO, FliP, FliQ, FliR, FlhA, FlhB, FliI, FliJ and
FliH proteins forming a complex within the MS-ring as indicated in Figure 1.8 [130].
FUNCTION
Compared to the linear motors and F1Fo-ATPase, the structure of bacterial flagel-
lar motor is complex, nevertheless a great deal is known about the function of this
beautiful motor.
Power source
The flagellar motor is powered by ions (for example: E.coli, S. typhimurium and
Streptococcus use protons, while Vibrio alginolyticus uses sodium ions) that travel
down an electrochemical gradient. The work required for an ion to cross the cy-
toplasmic membrane is the ion-motive force (pmf for protons, or smf for sodium
ions), comprised from two terms:
imf = ∆ψ +kT
qln(
Ci
Co
) (1.4)
where ∆ψ is the difference in electrical potential between the inside and outside of
the cell, i.e. membrane potential, kT is the thermal energy, q the charge of the ion
and Ci and Co are the activities of the ions inside and outside of the cell.
Several experiments, investigating power source of flagellar motors in E. coli, have
been done. In Fung and Berg’s experiment filamentous cells were drawn halfway into
micropipettes, the cytoplasmic membrane of the cell fragment inside the pipette was
made permeable by exposure to gramicidin, and the cells were subsequently ener-
gised with an external voltage source [157]. A high load was imposed on cell motors
by markers used for monitoring rotation, and ∆ψ was found to be proportional to
speed. Low load dependence of the pmf on speed was investigated in a later exper-

1.2. Molecular Motors 35
iment. Cells were tethered to clean glass, their filaments were sheared and 0.4 µm
beads attached to them. At a certain point the pmf was gradually collapsed by
adding the ionophore CCCP, and speeds of tethered cell and the beads recorded in
the process. Fast motor speeds (from the attached bead) were proportional to the
slow motor speeds (tethered cell), and since the rotation speeds of the slow motor
were known to be proportional to pmf, the slow motor speeds were rescaled to show
the pmf of the cell. Thus a speed-pmf plot for fast motors was generated and found
to be linear with pmf (although the relative contributions of membrane potential
and pH gradient were not known) [158]. Each contribution to imf given in Equa-
tion 1.4 was investigated separately on Streptococcus cells, which in the absence of
exogenous energy source stop swimming and are sensitive to ionophores and uncou-
plers. The contributions of pH and the membrane potential to pmf were found to
be equivalent in driving the motor [159, 160].
Sodium-driven motors in Vibrio alginolyticus have linear dependence in pNa but
the smf was not measured [161].
The contributions of membrane potential and pNa to smf were studied indepen-
dently and on individual cells in a high-load regime, in a recent work by Chien-Jung
Lo [162]. C.H. Lo studied chimeric sodium-driven flagellar motors in E. coli, contain-
ing rotors from the proton-driven E.coli motor and stators that combine proteins
from proton-driven E.coli and sodium-driven V. alginolyticus motors [163, 164, 165].
Membrane voltage was varied by changing external pH and pNa by changing ex-
ternal sodium concentration. Intracellular sodium concentrations and membrane
potential in single cells were measure using two different fluorescent dyes [163, 162].
Motor speed was found to be proportional to smf, with equivalent contributions from
pNa and ∆ψ in agreement with previous work. The linear dependence of speed and
smf in high load regime is consistent with high efficiency and tight coupling. It is
important to note, however, that in the high load regime, the load is the limiting

1.2. Molecular Motors 36
factor to rotation, not for example, the arrival of ions. The preliminary results in
low load regime suggest that equivalence of ∆ψ and pNa does not extend into the
high-speed regime [162]. The number of ions required for one revolution (with one
stator unit present, see discussion about stator units below) is 36±6. Given that
the number of directly observed steps in the low load regime is 26 [164], this result
indicates that more than one ion is needed per step, or that the tight coupling model
as well as proportionality between speed and smf does not extend to the stepping
experiment conditions.
There is one report that measures the number of ions passing through the motor
with maximum number of torque generating units present, on average (1240±240)
protons per revolution [166].
Torque generating units
As mentioned before, proton flux in the bacterial flagellar motor passes through
torque-generating units (probably consisting of four motB and two motA proteins
[151]). Early studies showed that mot mutants of E.coli do not rotate [167], how-
ever they can be ‘resurrected’ through protein synthesis by lambda transducing
phages [168]. This activation has also been studied on the level of single motors.
Cells of a motB strain carrying plasmids with wild type motB genes controlled by
the lac promoter, as well as cells with motA and motB point and deletion muta-
tions, carrying plasmids with wild-type motA and motB genes, were tethered to
the surface and resurrected. Step0filled increments in motor rotation were observed
upon addition of the inducer, showing that bacterial flagellar motors contain sev-
eral torque-generating units [169, 170]. The maximum number of units observed,
corresponding to number of steps by which the rotational rate increased, was eight
in the tethered cell experiments [170]. More recently, using a polystyrene beads
attached to the sheared filaments, number of discret steps observed has increased to

1.2. Molecular Motors 37
at least 11 [171], confirmed by counting fluorophores by the stepwise photobleaching
of single GFP molecules attached to MotB component of the stator [172].
Torque-speed curve
Up until recently the best way of understanding the mechanism of torque generation
and how ion flow is coupled to the motor rotation, was by investigating the torque-
speed relationship of the motor. Steps have since been observed that provide the
most direct insight into the energy profile of the motor. Future research is likely
to use steps as the main biophysical probe to explore the motor’s mechanochemical
cycle.
Since steps have been observed only recently, measurements of the torque of the bfm
have been made at a range of speeds, using several different techniques.
Changing the load attached to the motor (an entire cell, or a bead of different size)
will give information in the range of different CCW (looking at the motor from the
distal part of the filament) speeds. In these experiments motor torque is balanced
by the torque exerted on the object by viscous drag T = fω, where f is the frictional
drag coefficient of a rotating object in viscous medium and ω is its angular velocity
[173, 174]. However, in this way the motor speed at zero load as well as information
for CW speeds is not accessible. For this, a means of applying external torque to
the motor is needed.
The main method for this purpose is electrorotation [175, 176, 177], but an optical
trap has also been used [178] (optical traps offer further potential for increasing the
range of speeds one can achieve [179]). The torque speed curve of the bfm is given in
Figure 1.9 A. At 23◦C the motor torque is approximately constant (slowly declining)
from ∼-100 Hz to ∼200 Hz. At speeds higher than ∼200 Hz the motor torque
declines approximately linearly. The position of the point where the torque changes
from constant to linearly declining (called the ‘knee’) is temperature dependent,

1.2. Molecular Motors 38
however at low speeds the torque is independent of temperature. This is consistent
with the assumption that the motor operates near thermodynamic equilibrium and
at high efficiency, at low speeds and that the torque decline at high speeds results
from limits in the rates of proton transfer. The torque-speed curve given in Figure
1.9 A suggests that the 0-torque line is crossed at speeds of ∼300 Hz at 23◦C.
The torque speed curve at different stator numbers was studied as well, and is shown
in Figure 1.9 B. Torque is proportional to the stator number at high load, while its
shape at the low load suggests that one unit rotates the motor as fast as many. Thus
it is likely that the motor has a high duty ratio, i.e. stator units spend most of the
time attached to the rotor. In Figure 1.9 B the smallest load studied was 300 nm
diameter bead, from which it was concluded that the duty ratio is at least 0.6, but
it is likely higher, close to 1.
Steps
Investigating the dependence of variance in the rotation rate over the mean rotation
rate of the bfm, for a motor with a known number of torque generating units as
well as for a broken motor, lead to expectation that protons passing through sta-
tor units of the bfm move the stator unit along the periphery of the rotor by one
fixed-increment step [180, 181]. Rotating motors were shown to behave like Poisson
steppers, with ∼50 steps per torque generating unit, and appeared to step indepen-
dently. Broken motors showed free rotational diffusion [180, 181]. Increase in the
number of steps per revolution with the number of torque generators suggests that
the torque generating units have a high duty ratio. However, it was only recently
that the steps in motor rotation have been observed directly. For this a Na+-driven
chimaeric flagellar motor in E.coli was constructed. At low sodium-motive force and
with controlled expression of a small number of torque-generating units 26 steps per
revolution were observed. The number of steps is in agreement with the number of
FliG proteins expected to interact with motA proteins in stator units [164]. It ap-

1.2. Molecular Motors 39
Figure 1.9: Torque speed curve for the flagellar motor of E. coli. (A) Three temperaturesare shown (thick lines), together with two load lines (thin lines). One is for the wild typeE.coli cell, with effective radius about 1 µm, the other for the minicell with an effectiveradius of about 0.3 µm. In the low-speed regime, torque is some what misrepresented andshown constant, although it declines about 10% between stall and the knee [174]. Figureand the legend are taken from reference [127] (B) Torque speed curves of one (bottom) tofive (top) torque-generating units. The points for a given bead size fall on a line (one suchline is shown) whose slope is equal to viscous drag coefficient. Reading from left to rightthe bead sizes used were 1.03 µm, 0.535 µm, 0.41 µm, 0.356 µm, 0.3 µm. Figure and thelegend are taken from reference [173].
pears that the number of steps with one or two torque generator units stays 26 [164],
however this is still not clear. At a low speed of 1 Hz, a doubling in speed could be
due to a random fluctuation as well as a change in number of torque generating units.
1.2. Molecular Motors 40
Switching
Active control of the direction of motor rotation is essential for responding to stimuli
and swimming towards places with favourable conditions. Changing the direction
of motor rotation, starting and stopping, is based on the information received from
the sensory system. The likelihood of changing the direction of spinning is enhanced
by CheY, the chemotactic signalling protein which when phosphorylated (CheY-P)
binds to the cytoplasmic face of the bfm (probably to FliM). The phosphorylation
of CheY is catalyzed by the kinase CheA, the activity of which is controlled by
chemoreceptors (either activating or inhibiting CheA). The dephosphorylation of
CheY-P is accelerated by the phosphatase CheZ. Bacterial cells will adapt to the
change in the stimuli by returning to the pre-stimulus behaviour in the presence of
the stimuli, by the methylation and de-methylation of the receptors (by CheR and
CheB, respectively).
How the transition from one direction to the other occurs within the motor when
CheY-P binds to FliM is still under question. Early experiments suggest that switch-
ing is an all-or-none Poisson process. When the distribution of switch intervals was
looked at, to a first approximation, it was exponential [182]. From tethered cell
experiments it was concluded that the time it takes for a switch to happen is not
longer then 10 ms (this includes unwinding and re-winding of the tether) [127], and
from the observation of single filament by laser light scattering, that it is completed
in 1 ms [183]. Later, the switching interval distribution was looked at in conditions
where the chemotaxtic signalling pathways were not perturbing the measurement.
The strain used lacked CheA and CheZ but CheY was replaced by a mutant active
without phosphorylation (CheY**) [184]. In another study CheY was expressed in
a strain, without CheZ and CheB, in which all of CheY is phosphorylated [185].
Both studies found that the CW bias has sigmoidal dependence on the CheY con-
centration, and that the distributions of waiting times are exponentials.

1.2. Molecular Motors 41
Based on these studies it was proposed that switching is a thermal isomerization
process, where the system sits in one of two potential wells, jumping from one to
the other with exponentially distributed waiting times.
The effect of chemotactic signalling on motor switching was also looked at in an
experiment that used CheY-GFP to determine the concentration of CheY protein
inside individual cells. Having shown that the CW bias is very sensitive to [CheY-
GFP] (the response of the motor to changes in [CheY-GFP] was much steeper than
previously thought based on the measurements of proteins concentrations averaged
over cell populations) the study concluded that the motor acts as an amplifier [186].
In some of the studies of switching mentioned so far, pauses and slowdowns were
observed, but have been attributed to artifacts of the experiment. There are how-
ever studies which look at those events, and their relationship with chemotaxis
[187]. These events have been included and explained by a general stochastic 1-D
Ising model, which proposes a possible mechanism by which the FliM-CheY-P in-
teraction leads to a switch [188, 189]. The model is based on a ring of protomers
(FliM), each of which can be in two states (CW or CCW). FliM in each state can
also bind a ligand (CheY-P). A change from one state to the other is accompa-
nied with a change in a free energy. Crucial for the model is the assumption of
the conformation-dependent cooperative interactions between adjacent FliMs that
favour like conformations. Inclusion of this interaction can integrate the activities
of FliMs over the cluster∗. The model also suggests a physical interpretation for the
fluctuations in speed as well as for the experimentally observed pauses. If a given
FliM undergoes a conformational change from a CW to CCW state, due to the cou-
pling energy term, the change may spread to the rest of the FliM proteins present in
the ring. If all of the FliMs change their conformation, the switch will happen as a
∗The exact behaviour will depend on the value of the change in the free energy, [CheY-P] andthe relationship between the FliM number and the coupling energy. With realistic values used inthe model, the sensitivity coefficient obtained is comparable to the one obtained experimentally[188]

1.2. Molecular Motors 42
result. However if only few do so, and the number of FliMs in CCW state returns to
zero, as it does so, fluctuations in speed or even pauses will be observed (depending
on the number of FliMs that did undergo the transition).
Experiments described so far, which looked at the wild type switching interval distri-
bution and concluded that it is exponential, obtained the distribution by averaging
the CCW and the CW series from individual cells (before spectral analysis). In a
more recent experiment, Korobkova et al. looked at the distribution of CW and
CCW intervals for each wild type cell, and found that, on the scales from 5 to 103
seconds, it differs from the population distribution [190]. For the CCW intervals,
it looks more like a power law rather than an exponential. They also looked at
the interval distribution for a mutant with CheY**. They found that the exponen-
tial distribution for the CCW intervals is recovered on long time scales. In a later
experiment Korobkova et al. looked at the CW and CCW interval distribution of
the same mutant but this time they binned the cells according to the CW or CCW
bias [191] (allowing them to study the behaviour of the motors with approximately
the same [CheY**]). What they found is that the probability density of CW and
CCW intervals for each bias bin behaves like a Gamma distribution rather than an
exponential, indicating that there are several independent exponentially distributed
events occurring rather than just one. These they call hidden steps (most likely due
to their experimental resolution where motors never stop rotating and exhibit only
CW or CCW rotation in their experiment, hence hidden). They also speculated that
these hidden steps correspond to the conformational changes in several FliMs that
do not result with a switch. However, the data obtained by Fan Bai, Richard Branch
and I, and analysed by Fan Bai and later Richard Branch, shed some new light on
the problem of switching, the switch times and the switch interval distribution. The
results obtained are briefly discussed in section 4.3.1.

1.2. Molecular Motors 43
Model
Having looked at the experiments performed on the bfm, can we answer (or how
close can one come to answering) the question of what is the energy profile of this
motor? There have been several models giving several possibilities. I will focus on
a recent model proposed by Jianhua Xing and Fan Bai [192]. It is the only model
that gives torque speed curves in agreement with experiment (Figure 1.10 A) and
makes several interesting predictions. Also, the model gives a framework based on
four assumptions and the physics of the bfm is not sensitive on the model details
and parameters, which can be further elaborated once the new experimental data
becomes available. The four assumptions are as follows; (1) the rotation of the
motor is observed through a soft elastic linkage between the motor and the viscous
load, (2) motor rotation and ion transport are tightly coupled, (3) the power stroke
is driven by a conformational transition in the stator that is triggered by the protons
hopping onto and off the stator, probably via the MotB residue D32, (4) the ion
channel through the stator is gated by the motion of the rotor. The first assumption
allows the motor and the load to move on different time scales, and as a consequence
the bfm torque is constant in the low speed, high load regime. The second and third
assumptions are necessary to explain the linear dependence of imf and speed in
the low speed regime, while the fourth assumption allows the ion conductance to
vary with the motor speed, explaining the concave shape of the torque-speed curve.
The rotor-stator interaction is shown in Figure 1.10 B. The power stroke is driven
by the free energy of two ions binding to the Asp32 sites of the MotB proteins.
The cycle is accomplished by two half strokes, one by each MotA loop, alternating
in contacting successive FliG proteins on the rotor (Figure 1.10 B, right). The
model prediction of constant torque in the low speed regime is due to the time-
scale separation between the motor and the load dynamics. In the high load regime
the system evolves ‘infinitesimally’ slowly so the probability distribution is always

1.2. Molecular Motors 44
in the region of potential with a negative potential gradient, the rest of the motor
potential features are thus masked and the torque is constant. As the load decreases
in size the probability distribution moves faster down the potential gradient and is
more likely to be found centered in the potential minimum, torque will thus ‘feel’
the effect of the steep positive potential gradient decreasing its value (Figure 1.10
B, left). If in addition, the chemical rate constant is not modelled with a constant
value in the transition window, but instead a triangle function is used, this positive
feedback mechanism will contribute further to the sharp decrease in the torque. The
model also predicts non-linear imf vs. speed dependence in low load regime.
My introduction to the bacterial flagellar motor has covered the structure, known
aspects of the motor function, and a recent model for the mechanochemical cycle
of the motor. To conclude, I will summarize some of the most interesting questions
that remain to be answered and that guide future research:
• Properties of the hook and the importance of hook flexibility in motor rotation.
Effect of the hook stiffness on the observed torque-speed curve as well as on
the resolution of step observation.
• Imf vs. speed relationship in the low load regime
• The shape of the torque-speed curve, with different number of stator units
present
• Number of steps in the presence of two or more stator units, together with the
step dwell times and backward steps
• Mechanism of switching (switch time, switch interval distribution)
The angular resolution and high sampling rate of my system, can help in an-
swering many of these questions. The option of controlling a bead pair attached
to the bfm via the filament stub offers even greater possibilities, for example: in-
creasing the time resolution needed for step detection by holding the bead pair with

1.2. Molecular Motors 45
Figure 1.10: Comparison of model calculations and experimental data. (A) Upper: Ex-perimental torque-speed curves at different temperatures (squares). The filled dots arecalculated from the model. Lower: The linear dependence of the motor rotation speedwith imf at three different high loads. The experimental data (squares) are taken fromFung and Berg [157]. (B) Left: Schematic illustration of one motor cycle. Right: Thedriving potentials of the stator given on the left. A is the soft elastic coupling betweenthe rotor and the load, B the sharp peaks in the potential may be due to steric interac-tions between FliGs and the MotA cytoplasmic loops that prevent thermal fluctuationsfrom taking the system down the backside of the potential.The (shaded) transition regionsspecify the positions where the transitions between the potentials can take place. LabelsAC correspond to Assumptions 13 in the text. The Figure was obtained from Fan Baiand is essentially the same as in reference [192].
feedback, controlling the speed of the bead pair rotation and gaining information
on the torque-speed curve, and investigating the properties of the hook. Finally, if
it is possible to increase hook stiffness, controlling the angle of the bead pair with
feedback can give information on the energy profile of the motor at a given angle.
1.2. Molecular Motors 46
1.2.3 Synthetic molecular motors
One direction of work on synthetic motors uses single strand DNA molecules with
attached cargo to move along a DNA track. A set of additional complementary single
strands is used as the fuel. The main problems with DNA fuelled motors arise from
the fuel itself: how can it be used only when it’s needed and extracted when it
is potentially blocking the motor? Current efforts are directed towards achieving
continuously running motors as well as designing a track that will allow the cargo
to be transported between two desired points [193, 194]. Another direction is being
pushed forward by synthetic chemists. Although the field is in its infancy, using
the properties of molecules such as rotaxanes, catenanes, helical-shaped alkenes
and trypticene-type propellers, controlled motion on the molecular-level has been
demonstrated [195, 196, 197, 198, 199]. This opens the doors for more ambitious
rotary and translational motion as well as for coupling of that motion to other
functions.

1.3. Single Molecule Techniques 47
1.3 Single Molecule Techniques
Techniques used for single molecule studies can be broadly divided into imaging
techniques and techniques where force or torque is exerted on the molecule
under study (some of the techniques can be used for both). I will briefly mention
some of the commonly used techniques and give a broader introduction to optical
tweezers, a technique used during my research. By doing so I hope to place the
capabilities and restrictions of the optical tweezers in context with other available
methods.
The focus of imaging techniques has been largely to overcome the resolution limit
of optical microscopes. Optical microscopes use visible light passing through the
sample to achieve a magnified image of the object in the sample. A lot has been
achieved in terms of improving the image quality and magnification of optical mi-
croscopes, but the highest resolution is set by the diffraction limit. Resolution limit
has been pushed further with electron microscopes. Using beams of electrons,
having a much smaller wavelength then the visible light, allows much higher resolu-
tion. However, the electron beam needs to pass through a vacuum in order not to
be scattered by air molecules. This places restrictions on the sample preparation.
One other imaging technique that has had a great impact on the field of sin-
gle molecules studies is fluorescence microscopy. A fluorophore (fluorescent
molecule) in its ground state will be excited after exposure to photons. When
relaxing to the ground state it will emit a photon of longer wavelength. The excita-
tion and emission wavelengths will differ from system to system. If the fluorescent
chemical group is attached to a biological molecule of interest very sensitive de-
tection experiments can be performed. As well as in many other applications the
potential of fluorescence microscopes was explored when studying processes localized
on the cell surface. However if the excitation is coming from above the specimen
all of the fluorophores (the fluorophores bound to the cell surface and the once in

1.3. Single Molecule Techniques 48
the solution are in equilibrium) will get excited and, when observed from above the
specimen (epi-fluorescence), give rise to high background noise. Therefore a total
internal reflection fluorescence microscope (TIRFM) was developed, based
on the knowledge that if illuminated at a certain angle the electromagnetic wave
will get fully reflected from the surface, with an evanescent wave passing into the
solution. Since the wave decays exponentially with the distance from the surface
only a small region will get illuminated by the incoming light (and only the fluo-
rophores close to the surface will get excited), avoiding excitation of the fluorophores
in the solution. Another technique that will reduce background noise is confocal
fluorescence microscopy. It relies on focusing the laser light into a small focal
volume within the sample, and exciting fluorophores within this volume. The posi-
tion of the focused laser light within the sample can be changed allowing scanning in
z -axis. The fluorescent light emitted from the small volume can be separated from
the reflected laser light and detected (usually) by a photodiode.
To obtain fine information about the dynamics of two fluorescent molecules, one can
monitor dipole-dipole interactions between them. One of the fluorescent molecules, a
fluorescent donor, is excited at its specific wavelength. It then excites, with dipole-
dipole interactions, the second fluorescent molecule, a fluorescent acceptor. The
donor returns to its ground state. The efficiency of fluorescent transfer (E) depends
on the distance between donor and acceptor molecules and is given as:
E =1
1 + r6
R6
0
(1.5)
where r is the separation of donor and acceptor and R0 Forster distance at which
the rate of donor radiation equals the rate of acceptor absorbance (the transfer of
energy by FRET is 50% efficient). If observed in a certain time interval, fluores-
cence resonance energy transfer (FRET) efficiency will give information about
the dynamics of the two molecules.

1.3. Single Molecule Techniques 49
An atomic force microscope (AFM) is another widely used imaging technique.
It is based on a different concept. It uses a physical probe, instead of electromagnetic
waves or electron beam, to directly probe the surface of the specimen. The probe is
brought close to the sample surface, and the forces between the tip and the sample
are monitored. A scanning tunnelling microscope (STM) uses a physical probe
as well. It is based on a quantum mechanical effect of electron tunnelling. A probe
is scanned across the specimen surface, while voltage is applied between the probe
and the surface. Applied voltage will cause electrons to tunnel, i.e. jump between
the probe and the surface resulting in weak currents exponentially dependent on the
distance between the probe and the surface.
Apart from being imaging techniques, both the STM and the AFM are used as force
transducers. The STM can be used to manipulate individual atoms. It can remove
or add individual electrons from atoms. While the AFM is often used to exert force
on biological molecules of interest tethered between the tip and a surface.
Magnetic tweezers are often used as a means of exerting torque on particles at-
tached to molecular motors or DNA. A system of electromagnets is usually used to
create field gradients, producing a force on a super-paramagnetic object. Adjusting
the current running through the coils enables changes in intensity and direction of
the resulting force. As described in section 1.2.2 this technique has been used to
apply external torque to F1 by controlling the angle of magnetic beads, 470 nm to
700 nm in diameter, attached to the γ-subunit [108, 109, 111]. The way in which
torque is applied with this technique does not enable the high spatial and temporal
resolutions that are possible with optical traps. For example, the typical resolutions
reported using magnetic beads are several seconds and 5◦ [108].
Electrorotation is another technique for applying controlled torque. It is used to
apply torque to dielectric objects such as bacterial cell, in order to study the mechan-
ical properties of the bacterial flagellar motor. The technique uses microelectrodes
1.3. Single Molecule Techniques 50
arranged in a cross (with a small gap in the middle) to generate a rotating electric
field. The field polarizes the object located in the gap between the electrodes. The
polarization of the object lags behind the rotating field, thus the dipole is trying to
line up with the field thereby exerting torque on the object. In section 1.2.2 exper-
iments in which the torque was applied to the bfm with the cell body as the handle
were described. However, the cell body is considerably larger than the polystyrene
beads used in typical optical trapping experiments, and therefore requires extremely
large torques to attain the high speeds (∼300 Hz) that are characteristic of the flag-
ellar motor. Furthermore, as with magnetical tweezers, high spatial and temporal
resolutions that are possible with optical traps cannot be achieved due to the size
of the handle and the way in which the torque is applied.
1.3.1 Optical tweezers
Since their invention just over 20 years ago, optical traps [200, 201, 202, 203] have
been widely used for research purposes in both physics and biology, ranging from the
cooling and trapping of neutral atoms [204] to manipulating live cells and viruses
[205, 206]. More recently, optical traps have been extensively employed in the ex-
perimental investigations of molecular motors [207, 208]. Their unique ability to
apply picoNewton forces to micron-sized particles, while simultaneously measuring
displacement with nanometer precision, often makes them the best tool in practice.
Optical forces and torques arise from transfer of linear and angular momentum, car-
ried by photons (electromagnetic wave), upon reaching an object. In most cases the
resulting force will push the object in the direction of the incoming light, but the
configuration in which all the optical forces and torques acting on an object cancel
each other can be achieved. Thus, a total force (and torque) acting up on an object
is zero and the object is optically trapped. This configuration is usually achieved
by tightly focusing the laser light with an objective with high NA. To gain some

1.3. Single Molecule Techniques 51
intuitive understanding on how the total force of zero arises, forces acting upon an
object have traditionally been decomposed into two parts: (a) a scattering force
and (b) a gradient force. The scattering force is the total force pushing the object
forwards, while the gradient force is the total force pushing the object (dielectric)
in the direction of the light intensity gradient. Fluctuating dipoles will be induced
in a dielectric particle in the laser focus, and it is the interaction of these dipoles
with the inhomogeneous electric field that will give raise to a so called gradient
force (proportional to the dielectric polarizability and the intensity of the gradient)
[209, 210].
Figure 1.11: The ray optical origin of the lateral and axial trapping force within opticaltweezers. Figure and the legend are taken from reference [210].
If the wavelength of the electromagnetic wave is significantly smaller than the
object (d≫ λ), determining the total force and torque acting on an object can be
done with a ray-optics model. The beam is treated as a superposition of rays and
the two refractions when a ray enters and exits the particle are modelled using Snell’s
law. Each ray undergoes a change in momentum between the incoming and outgoing
ray. Due to conservation laws, the momentum in a system remains invariant, so the
transfer of momentum between ray and particle can be calculated for each ray that

1.3. Single Molecule Techniques 52
is refracted. Summing the momenta will result in net force, Figure 1.11 [210]. For
an object much smaller than the wavelength of the electromagnetic wave (d≪ λ)
conditions of Rayleigh scattering are met and the dipole approximation is used for
describing properties in a simplified manner. The object is considered an emitting
dipole and the force that acts on the particle can be decomposed into a scattering
and a gradient force [210], given as
Fscat =I0
c
128π5r6
3λ4(N2 − 1
N2 + 2)2n (1.6)
and
Fgrad =−N3R3
2(N2 − 1
N2 + 2) ▽ (| E |)2 (1.7)
where r is the radius of the object, I0 is the light beam intensity and N is the ratio
of the refractive index of the object to the index n of the surrounding medium.
If the object size is comparable to the laser wavelength (d∼ λ), and this is usually
the case for the objects of interest in biological studies (this thesis included), one has
to solve the rigorous diffraction model on case by case basis, by (1) calculating the
field around the particle and (2) by applying Maxwell’s stress tensor to determine
the force acting on the object [211]
〈F〉 =
∫
S
{ǫ
2Re[(E ·n)E*]−
ǫ
4(E* ·E)n +
µ
2Re[(H ·n)H*]−
µ
4(H* ·H)n}dl′ (1.8)
where S is the surface of the particle and n the normal to the surface pointing out-
ward [212]. Calculating the field around the particle involves solving the problem
of the representation of the beam. A number of available techniques require that
the trapping beam (i.e. the incident field) be represented as a plane wave spectrum
in terms of vector spherical wave functions (VSWF) [211]. An optical trap is a
strongly focused Gaussian beam, but the problem is that the standard represen-
tation of Gaussian beams does not satisfy the Maxwell equations, leading to some
1.3. Single Molecule Techniques 53
difficulty in finding the plane wave of VSWF spectrum. In addition, the trapping
beam is not really a Gaussian, it is truncated. However, satisfactory methods exist
[213, 214].
Once the incident field has been written there is a wide variety of methods to find
the field around the object. Some are semmi-analytical and some numerical, but an
adequate method for a particular case can usually be found [211]. To give a ‘feel-
ing’ for the mentioned variety I give a list of some of the available techniques: (a)
A generalized Lorentz-Mie theory (GLMT, describes in its original formulation the
interaction of an arbitrary shaped beam with a homogenous sphere, and it has been
expanded to other geometries) [215, 216], (b) T-matrix method [217, 218], (c) mul-
tiple multipole method (MMD) [219], (d) finite element method (FEM) [220, 221],
(e) finite difference time domain method (FDTD) [222], and (f) discrete dipole ap-
proximation (DDA) [223]. Since the rigorous model needs to be solved, and given
that the force acting upon an optically trapped sphere-like object when displaced
from the zero force position by a small amount can be easily calibrated, it comes
as no surprise that experimental biophysicists are mostly satisfied with intuitive
description of how optical trapping works, and actually seeing it work in practice
using dielectric microspheres. For objects of different geometry, anything not as
beautifully symmetrical as a sphere, the situation is more complicated. Forces and
torques acting on such objects need to be considered more carefully.
The simplest optical trapping is achieved by focusing a laser with a microscope
objective of high numerical aperture. The back aperture of the objective is usu-
ally slightly overfilled to achieve the smallest possible focal spot, i.e. the steepest
gradient. The trapping laser beam can be steered by placing a steering device
in the back focal plane of the objective. An angular displacement at this point
will produce lateral displacement in the specimen plane without affecting alignment
with the objective back focal plane. The simplest steering device is a mirror, and

1.3. Single Molecule Techniques 54
acusto-optic deflectors or electro-optic deflectors are used for fast automated steer-
ing. Apart from a single trap multiple tweezers can be achieved as well, either by
rapid scanning between trap positions [224, 225], having separate light paths [226] or
using holographic methods [227]. However, these approaches, especially in the case
of holograpic methods, require more complicated trapping systems. The position
detection in an optical tweezers system is usually achieved with the use of one of
the following methods: (1) a video camera, (2) by imaging the object directly to
quadrant photo diode, (3) polarization interferometry or (4) back-focal-plane (bfp)
interferometry [209]. In polarization interferometry, a polarized laser light is split
into two paths and recombined after passing through the specimen. The phase shift
in the polarized laser light is calibrated against the displacement of the object in
the specimen plane. Back-focal-plane interferometry is based on the interference
between forward-scattered light from the object in the specimen plane and unscat-
tered light. The interference signal is usually monitored with the quadrant photo
diode.
Significant progress has been made in trying to achieve the rotation of objects
in optical tweezers, a summary of which is illustrated in Figure 1.12.
If transfer of angular momentum carried by photons is achieved upon scattering
by a particle, a torque can be exerted upon that particle. Photon angular momen-
tum is composed of an orbital and spin angular momentum. Torque can be exerted
on objects in the trap if exchange of one, the other or both is achieved (Figure 1.12 A
and B). Spin angular momentum change can be achieved with the use of birefringent
particles [228, 229, 230, 231, 232, 233]. Upon passing through birefringent material,
an extraordinary (parallel to the axis of anisotropy of the crystal) and an ordinary
(perpendicular to the axis of anisotropy of the crystal) components of the light un-
dergo different phase shifts. If this results in a change in the angular momentum of

1.3. Single Molecule Techniques 55
Figure 1.12: The various schemes employed to achieve rotation of a particle within opticaltweezers: transfer of (A) spin and (B) orbital angular momentum to the particle, torquegenerated by the gradient force created by (C) rotation of a high order mode, (D) rotationof an asymmetric interference pattern or (E) rotation of an aperture and finally (F) theradiation pressure acting on propeller-shaped objects. Figure and the legend are takenfrom reference [210].
the light, the birefringent particle will ‘feel’ corresponding torque. The magnitude
of the torque will depend on the angle describing the ellipticity of the light (α) and
the angle between the fast axis of the elliptically polarized light and the optic axis
of the birefringent material (β). For linearly polarized light the torque is dependent
on β and the birefringent particle will be in stable equilibrium for β=0. If the plane
of polarization of the light is rotated, the particle alignment follows the plane of
the polarization. For circularly polarized light, torque will depend on α and will be
constant for a given laser power, thus the particle will rotate at a constant speed
[229]. Spin angular momentum change can also be achieved with asymmetrically
shaped particles, also called shape birefringence. The principle is essentially the
same except this time the different polarizabilities along the long and short axes
of the particle are due to the particle shape rather than its molecular structure
[234, 235, 236, 237]. Linear momentum, and orbital and spin angular momentum
change, simultaneously, can be achieved with absorbing particles [238, 239]. For
particles with high enough absorptivity, gradient forces are small, and they can not
cause the trapping of absorbing particles. Instead radiation pressure forces (scatter-

1.3. Single Molecule Techniques 56
ing forces) are dominant pushing the particles in the direction of the propagation of
the light. But if the curvature of the light wavefront is such that it can be resolved
into the radial inward force and force in the direction of propagation of the beam,
then if an absorbing particle is constrained in the direction of the light propagation,
it can be trapped two-dimensionally by the inward radial force. For this kind of trap-
ping Gauss-Laguerre LG03 mode laser beams are usually used [240, 241, 242]. The
LG03 mode laser beams carry orbital angular momentum and, if they are polarized,
spin angular momentum. These will also be absorbed, and thus transfer of angular
momentum from light to the particle allows the absorbing particle not only to be
trapped in two dimensions, but also to be rotated [243]. Rotation within optical
tweezers have also been reported. This can be achieved by rotating an asymmetric
interference pattern or a higher-order laser mode, by the use of an elliptical beam
or by rotating an aperture, and requires more complicated laser tweezing systems
[244, 245, 246, 247]. The radiation pressure has been ‘directed’ in such a way as to
rotate a particle, with the shape of that particle. These particles are different micro-
fabricated chiral scattering particles that act as optical ‘windmills’ [248]. Despite the
fact that torque can readily be exerted on microscopic objects with these methods,
important drawbacks exist. The need for special micro-particles, like birefringent
particles or a ‘windmill’ particle, limits the practicality of the method as well as po-
tentially raising problems with attaching particles to rotary molecular motors. The
techniques using energy absorption are limited due to heating, and the methods
which rely on rotation within optical tweezers require more complicated trapping
systems to generate specialized beams. Shaped particles and beams carrying orbital
angular momentum have typical dimensions of several microns, thus the viscous
drag on trapped particles limits the response time of these particles to changes in
torque. Modulation of shaped beams generated by micro-mirror or liquid-crystal
technologies also limits the time resolution of these techniques.

1.3. Single Molecule Techniques 57
So, how does the system built during my DPhil research fit into the overall optical
trapping field introduced above? How does it avoid the drawbacks of other tech-
niques listed above? The design and layout of the system are described in details in
the next chapter. Basically, the optical trapping system in itself has a few novelties
but it is in principle very similar to the reported ‘force clamps’ and ‘position clamps’
[17, 15]. The novelties include use of a digital signal processor (DSP) board and
a feedback algorithm designed for use on rotary motors (‘angle clamp’). The first
one is used to achieve required temporal resolution (I will discuss this further in the
following chapter) and the second to impose minimal damage on rotary molecular
motors (see Chapter 3 for full description). The main novelty is the handle, i.e. use
of bead pairs instead of single beads. I will focus on explaining the resulting geom-
etry and, optical torques and forces acting on the motor via a bead-pair, as well as
giving a thorough account of the problems, limitations and, of course, capabilities
of the system in subsequent chapters.

Chapter 2
MATERIALS AND METHODS
58

2.1. Optical trap 59
2.1 Optical trap
2.1.1 Requirements of the system
So far there has been one report of the use of optical tweezers to exert torque on a
rotary motor, to measure the stall torque of the bfm [178], and two similar reports of
the use of tweezers to study the properties of the bfm hook and filament [133, 132].
In these experiments torque was applied to the motor in the form of linear force on
the trapped particle. This situation is analogous to tightening a nut with a spanner.
The trap is like the hand holding the spanner, the cell body is like the spanner,
and the opposing reactive force that completes the couple is generated by the link
between the motor and the surface. Apart from these reports, optical tweezers have
not been used as the technique of choice when applying external torque to rotary
molecular motor. In the introductory chapter I have discussed and introduced both
rotary motors of interest in this work. I have also introduced and listed the draw-
backs of the methods so far used to apply torque to the rotary molecular motors, as
well as the methods that can apply torque to microscopic objects and are yet to be
applied on the rotary motors. In this chapter, I will describe the system built as part
of this thesis and discuss how it overcomes some of the important drawbacks of other
available techniques. Since high temporal and angular resolution is an important
motivation for building this system, I will start here by summarising, in brief, exper-
iments that answer the question: what is the temporal and angular resolution one
requires when the goal is detailed studies of rotary molecular motors’ energy profiles?
In the case of the bfm, previous experiments detected the angle and speed of
polystyrene beads attached to the bfm [171, 173, 164] using mainly optical traps.
The stepping motion of bfm has thus been resolved [164], with 26 steps per revolu-
tion. Beads of diameter 500 nm or 200 nm attached to the bfm via a filament stub

2.1. Optical trap 60
rotate with a ∼100 nm radius [164], such that each 14◦ step corresponds to a linear
step of ∼24 nm. To resolve steps in the bfm, motors were slowed to ∼10 Hz or below,
corresponding to several milliseconds per step. Under physiological conditions steps
in the bfm are likely to be 10 to 100 times faster [173].
In case of F1, a 40 nm bead attached to the γ subunit rotates with a radius in the
range of 25 to 60 nm [91], hence a 120◦ step corresponds to between 40 nm and
120 nm, and a 40◦ sub-step to between 13 nm and 40 nm. The larger 80◦ sub-step
in F1 rotation depends on ATP binding, and has a rate on the order of seconds for
[ATP] in the nanomolar range. The smaller sub-step, however, is ATP independent
and is separated by a dwell of several milliseconds from the larger [91, 92]. A recent
report of rotation rates up to 721 Hz in F1 from E.coli [249] indicates that average
dwell times between steps in the enzyme rotation must be ∼0.5 ms.
Thus the temporal and spatial resolutions required to detect features of interest in
the rotation of these motors are on the order of milliseconds and tens of nanometres
respectively. The stall torques of 40-60 pNnmrad−1 generated by F1 [91, 250], and
up to 1000-2000 pNnmrad−1 by the bfm [173, 171]), set the scale of torque required
to control these motors.
2.1.2 Optical trap layout
The instrument consists of a custom-built inverted microscope and two lasers for
detection and trapping (Figure 2.1 and 2.2).
Bright-field imaging uses a high-power light-emitting diode (Luxeon Star LEDs,
Alberta, Canada), high N.A. condenser (MEL 30920, Nikon, Japan) and objective
(Plan Fluor 100x / 0.5-1.3 oil iris Nikon, Japan) and a high-sensitivity 1/2” Black
and White CCD video camera (LCL-902K, Watec America CORP, Japan). The
microscope stage was designed to be light and compact to minimize drift and vibra-

2.1. Optical trap 61
Figure 2.1: Schematic layout of the optical components in the system. The positiondetector laser beam is expanded to overfill the back aperture of the microscope objective.The width of the laser beam is additionally controlled with the iris I1, giving the optionof setting different detector ranges at the expense of sensitivity. Detector laser power iscontrolled by iris I1 and neutral density filters, ND. After passing through the microscopeobjective and condenser, the detector laser beam is collimated and expanded to fill thequadrant diode (QD). The trapping laser passes through three pairs of lenses formingtelescopes. The first set reduces the laser beam before entering the AODs, maximizing theresponse speed of the AODs. The other two expand the trapping laser beam to overfillthe back aperture of the objective and create a plane conjugate to the back focal plane ofthe objective at the mirror M1 used for coarse steering of the trapping laser. The rail, Z,is used to adjust the trapping laser focus in the specimen plane. Lenses L1 and L2 givedifferent magnifications of the image formed on the CCD camera. Planes conjugate to thespecimen plane and to the back focal plane of the objective are marked with black andwhite circles respectively.
tion (Figure 2.3). Microscope slides holding specimens are attached to a metal plate
mounted on a 3-axis piezo-electric stage (P-611.3S nanocube with E-664 LVPZT

2.1. Optical trap 62
Figure 2.2: Picture of the system shown in schematic layout of Figure 2.1.
Amplifier/Servo driver, 100 µm travel in x, y, z, 1 nm resolution, with a settling
times of a few milliseconds, Physik Instrumente, Germany) which is in turn mounted
on a lockable 3-axis dovetail stage (Newport, UK) for coarse positioning.
Position detection is by back-focal-plane interferometry [209] using a laser
beam (Helium-Neon, 632 nm, 17 mW, Coherent, USA) focused into the specimen
plane by the objective and collimated onto the face of a quadrant photodiode (UDT
Sensors Inc., CA, USA), Figure 2.4. Optimal positioning was achieved by fine ad-
justment of the axial position of the QD so as to minimize sensitivity to movement of
the condenser (Figure 2.5). After amplification, the QD signals are passed through
anti-aliasing first-order pre-filters with time-constants ranging from 0.625 ms to
6.25 µs and digitized at an appropriate sample rate [251] as described below. The
detector laser beam slightly over-fills the back-aperture of the objective, producing
a diffraction limited focus in the sample plane. This maximizes detector sensitiv-

2.1. Optical trap 63
Figure 2.3: Custom-built inverted microscope. Top: Close-up of condenser, objective andpiezo-electric stage (indicated with white arrow). The microscope slide mount is designedto be light and compact to minimize drift and vibration. Centre: Front view of the custom-built microscope. Yellow arrows indicate the light path through the microscope. Bottom,right: After passing through the objective light passes through several lenses for differentimage magnifications and reaches the camera (shown in top view).

2.1. Optical trap 64
Figure 2.4: Detector laser trap. Bottom: Top view of the detector laser path (red arrows)is shown. Top: Close-up of the laser path as it reaches the back aperture of the objective.Iris I1, used for adjustment of the incoming detector laser beam size, is indicated.
ity but limits the detection range to approximately the laser wavelength. Detector
range can be increased at the expense of sensitivity by reduction of the laser beam
width using an iris (Figure 2.1 and 2.4 I1). The intensity of the detector laser is con-

2.1. Optical trap 65
trolled by the iris aperture and neutral density filters, according to the requirements
of particular experiments. Higher intensities give lower noise, but also increase laser
damage to the specimen and optical trapping forces due to the detector laser.
The optical trap is formed by a near-infra-red Ytterbium fiber laser (1064 nm,
Figure 2.5: Determining the best axial position of the QD. After passing through thecondenser, and a pair of lenses forming a telescope, collimated detector laser light reachesthe QD. To determine the optimal axial position of the QD, the effect of moving thecondenser in x and y on the QD signal (X,Y ) was monitored, with the QD placed at sixdifferent axial positions. Black circle and an arrow indicate the axial position of the backfocal plane of the condenser obtained from simple ray optics calculations. The QD signalX is not sensitive to changes of the condenser position in y, similarly QD signal Y is notsensitive to changes of the condenser position in x, for any of the indicated axial positionsof the QD. However QD signal X is sensitive to the movements of the condenser in x, andQD signal Y to the movements of the condenser in y, for all axial positions apart from theone that corresponds to the position of the back focal plane of the condenser. Thereforethe QD was placed at the back focal plane of the condenser.
PYL-3-LP, 3 W continuous-wave, IPG Photonics Corporation, MA, USA), colli-
mated by the manufacturer, with <3% power fluctuation in 4 hours (Figure 2.6).
The pointing fluctuations of this laser are ∼2.5 µrad (rms) in 1 hour, with the spec-
tral characteristics of white noise above ∼30 Hz and 1f
noise below ∼30 Hz. The

2.1. Optical trap 66
intensity of the trapping laser was varied via the diode current and the combina-
tion of a half-wave plate and polarizing beam-splitter (Figure 2.6, λ2
and P). Fine
control of the trapping laser is achieved with acousto-optic deflectors (“AODs”,
AA.DTS.XY.250@1064nm, AA.DDS.60-90.XY driver, Opto-Electronique, France),
positioned in a plane conjugate to the back focal plane of the objective. The cen-
tre drive frequency of the AODs driver is 75 MHz, with a 30 MHz bandwidth and
15.3 kHz resolution. This corresponds to angular range and resolution of 49 mrad
and 24.9 µrad respectively. The AODs response time is 0.1 ms; corresponding to the
time it takes for the radio-frequency acoustic wave to propagate a distance equal to
the beam width in the acusto-optic medium. Initially the resolution of the DDS was
significantly better, ∼300 Hz, however when DDS was controlled with the computer
and the driving frequency changed faster then 1 s a fault was encountered. After 6-8
months with no replacement DDS the company returned the driver with the current
characteristics explaining that they cannot achieve the stability needed to acquire
initial driver resolution.
The entire instrument is mounted on an optical table in a temperature-controlled
room. All experiments were carried out at 22◦C. To quantify drift in the apparatus
the following was measured; (1) drift in the detection laser optics by recording the
position signal of a bead trapped several microns away from the cover slip surface
with the detection laser, (2) drift in the trapping laser and detection laser optics
by recording the position signal of a bead trapped several microns away from the
cover slip surface with the trapping laser, and (3) drift of the stage by recording
the position of a bead stuck to a coverslip. In all cases a bead of diameter 1 µm
was used. In 1 hour, measured drift in the detector laser optics was ∼2 nm, and
in the trapping and detector laser optics combined was ∼4 nm, compared to pre-
dicted ∼2 nm contribution from the measured trapping laser pointing stability. The
stage drift was considerably larger, ∼1.5 nm/min, and was sensitive to occasional

2.1. Optical trap 67
Figure 2.6: Trapping laser path (indicated with arrows). Mirror labelled as M1 is usedfor coarse adjustments of the trapping laser position in the specimen plane.
fluctuations in the temperature-control circuit of the room. At this stage it was not
necessary to take further measures to reduce drift and instrumental noise [17], which
are not expected to be limiting factors in experiments on rotary motors.
2.1.3 Data acquisition and control electronics
Data acquisition, feedback calculations and control of the optical trap are all per-
formed by a digital signal processing board (“DSP”, SI-C33DSP-PCI, 150MHz pro-
cessor speed with SI-DSP6433R2-PCI daughter module, 16 analog input channels, 4
analog output channels, 16 digital channels, sampling rate up to 50 kHz, Sheldon In-
struments, CA, USA) installed in a host computer (1.8 GHz processor, 1 GB RAM)
running Windows 2000. Digital lines can be configured as either inputs or outputs
2.1. Optical trap 68
and they are used as 8 individual lines and one word. Unfortunately of 16 digital
lines several never worked (did not input or output signal). Also, when digital lines
are used the output rate falls drastically and therefore only 4 analog output lines can
be used with a satisfyingly high output rate. Although, I communicated extensively
with the manufacturers this problem was never resolved. The Sheldon Instruments
company was always very friendly but never very useful. On some occasions the en-
countered problems were solved with their help. Typically I found a way to bypass
the problems which, in the case of not being able to use digital lines, reduced the
performance of the system.
The board is programmed using a software package, QuVIEW, provided by the
manufacturer. QuVIEW represents a set of Dynamic Link Libraries (DLLs) writ-
ten in C/C++ that are incorporated into National Instruments graphical program-
ming language LabVIEW as user libraries. The software package came with signif-
icant number of errors which were either interactively corrected in correspondence
with Sheldon Instruments company, or bypassed by programming around the er-
rors. QuVIEW DLLs are arranged in a specific sequence using LabVIEW. Once the
LabVIEW program has been run the sequence is sent from the host computer to
the board and the program continues running on the DSP irrespective of the host
computer. Changes made in the LabVIEW program on the fly (on the host com-
puter) will be sent to the DSP but the timing between the host and the DSP will
not be controlled and will depend on other processes running on the host computer.
To precisely time the events in QuVIEW, the DSPs clock is used via one of the
QuVIEW DLLs. All the feedback programs on the DSP board (an example of a
typical program written in QuiVIEW is given in Appendix A) were run at up to
10 kHz sampling rate unless otherwise stated. This is the maximum sampling rate at
which the processor on the board can handle most of the feedback programs without
‘loosing’ data points, either when reading inputs or when outputting. The size of the

2.1. Optical trap 69
feedback programs is larger then expected when purchasing this board, due to the
faulty digital lines. The result of this was a need for analog to digital converter (the
AODs driver has 15 digital controls for both X and Y). QuVIEW programs used just
for bfp detection are significantly smaller and can be run up to the maximum DSP
sampling rate, 50 kHz. Data acquired with QuVIEW are stored in QuVIEW specific
format and later on converted into text or binary format using an adjusted version
of a program supplied by the manufacturer. Analog output channels from the DSP
daughter module are converted to digital for the AODs control by a custom-made
12-bit analog to digital converter (ADC). ADCs were designed and produced with
the help of Central electronics workshop, Department of Physics, University of Ox-
ford. Timing is based on the clock signal coming from the board. ADCs used were
set to 0-20 V, to increase the noise margin (since the AODs driver has 15 digital
controls for both X and Y, it was important to successfully convert as many bits as
possible from each of the 4 analog channels). The DSP board outputs 0-10 V, thus
first most significant bit of all 4 ADCs was set to 0. Also, 3 least significant bits
of two ADCs and 2 least significant bits of the other two ADCs were set to zero.
This gave 16 bits with 20 mV and 18 bits with 10 mV noise margin from all ADCs,
which were subsequently arranged and sent to the AODs driver (a layout of the ADC
board and bit arrangements is given in Appendix B). A maximum scan range and
resolution are 27.5 MHz and 15.3 kHz, respectively, corresponding to 44.9 mrad and
24.9 µrad beam deflection and 16.5 µm and 9 nm displacement of the optical trap.
However, the feedback programs which aim to achieve as high bandwith as possi-
ble use a maximum range of 3.9 MHz, corresponding to maximum displacement of
the optical trap ∼2.6 µm (minimal resolution stays the same). Calculations on the
DSP board needed to obtain the required signal for analog to digital conversion in
this range are much shorter. Where a larger maximal displacement is needed, feed-
back bandwidth needs to be sacrificed. The ‘analog lines on the DSP→ADC→DDS’

2.1. Optical trap 70
scheme described above, as well as the temporal and spatial resolution of the system
are not optimal. It is a result of faults encountered when using the DDS and the
DSP. A new DSP from the same company has been purchased, with a 300 MHz
processor (which should speed up the execution of programs 2 to 5 times), 36 work-
ing digital output lines and 8 working analog output lines with the same number of
input lines. When the time resolution of the current system is no longer satisfactory,
this new DSP and AODs with a faster response time can be fitted to further increase
it.
2.1.4 Laser damage to biological samples
Choice of laser wavelengths was determined by the following factors. The trapping
laser was chosen for low cost, high power and relatively low levels of laser-induced
photodamage to biological samples at this wavelength [252]. The shorter wavelength
of the detector laser allows a smaller focussed spot and therefore improved detector
sensitivity, especially for beads with diameters below about 500 nm. It also avoids
potential difficulties with effective low pass filtering (8-9 kHz) that can occur with
silicon photodiodes and 1064 nm lasers [253, 251]. Photodamage caused by the
detector laser was characterized by recording laser-induced changes in the speed of
a bead attached to a rotating flagellar filament of Escherichia coli [173] over the
range of laser powers used (20-150 µW in the objective back-focal-plane). Using a
speed reduction of 5% to define a threshold for laser damage, I was able to record
for 1.5 to 2 min at 150 µW and for 5 to 10 min at 20 µW before observing any laser
damage. By contrast, previous work has shown that similar speed recordings using
a laser at 1064 nm can be extended for hours without observable laser damage [171].
The instrument can be adapted for extended observations by using the trapping laser
for detection, which can easily be achieved by swapping dichroic mirrors D3 and D4
(Figure 2.1) or by the use of singlet-oxygen scavengers (the observation time can be

2.1. Optical trap 71
increased up to 10 min at 2 mW, personal communicaton with Dr. Yoshiyuki Sowa).
Protein motors such as F1 are typically less sensitive to photodamage than live cells,
and can be protected by the addition of singlet-oxygen scavengers if necessary [54].

2.2. Bead pair preparation 72
2.2 Bead pair preparation
CONTRIBUTIONS AND COLLABORATIONS:
Final stages of bead pair preparation protocol were developed together with Thomas Bilyard, a
DTC student as part of his two months project in Dr. R. Berry’s group.
Amino-functionalized, biotinylated, plain (diameter 500 and 200 nm, Polysciences,
Germany), as well as carboxy-functionalized (diameter 350 nm, Bangs Laboratories,
USA) polystyrene microspheres were used. Biotinylated microspheres (beads) were
prepared by modification of amino-functionalized and carboxy-functionalized beads
as follows. Amino-functionalized beads, 1% by volume, were incubate for 2 hours at
room temperature with rolling, in 100 mM sodium bicarbonate buffer pH=8.05 plus
2 mM 6-(biotinamidocaproylamido)caproic acidin-hydroxysuccinimide ester (Sigma-
Aldrich, UK) added as 100 mM stock in dimethyl sulfoxide (Sigma-Aldrich, UK); fol-
lowed by resuspension in storage buffer (10 mM HEPES/NaOH pH=7.8). Carboxy-
functionalized beads, 1% by volume, were incubated for 2 hours at room temperature
with rolling, in 50 mM 2-morpholinoethanesulfonic acid-KOH, pH=5.5 plus 200 µM
1-ethyl-3-(3-dimethylaminopropyl) carbodiimide (EDAC) and 2 mM (+)-biotinyl-
3, 6-dioxaoctanediamine (Biotin-PEO-amine). Biotin-PEO-amine was added as
100 mM stock in DMSO, and EDAC as a 10 mM stock in water. After incuba-
tion beads were resuspended in storage buffer.
Bead pairs were prepared by incubating beads in media with high salt concentra-
tions, which is assumed to collapse the Debye layer and allow beads to stick to each
other by van der Waals interactions. 100-340 mM KCl was used for plain polystyrene
beads and 200-500 mM MgCl2 for biotinylated amino and carboxy beads, both in
storage buffer. Bead concentrations were between 0.5% and 2% by volume. After
adding salt, beads were sonicated for 4-30 min, washed 3 times in storage buffer
and stored at a final concentration of ∼0.5%. The number of bead pairs formed

2.2. Bead pair preparation 73
Figure 2.7: (A) Home made gradient mixer, with the mixer tubes clamped. (B) Exittube of gradient mixer is indicated and centrifuge tube in which sucrose gradient is formedshown. (C) Bands of bead clusters of different sizes (singles, pairs, triples and quadruplsare indicated). Figure C was taken by Thomas Bilyard.
was estimated by direct observation in the microscope. Immediately after washing
10-15% of all objects in the solution were bead pairs, which is consistent with the
maximum number of pairs predicted by modelling bead aggregation as a simple
second-order process with equal rate constants for all interactions, in which single
beads combine to form pairs and all other interactions lead to clumps containing
more than 2 beads. The fraction of bead pairs did not change after storage for a
month.
The bead pairs were separated from single beads and clumps containing more than

2.2. Bead pair preparation 74
2 beads by sucrose gradient centrifugation. Sucrose gradients were prepared with a
home made gradient mixer (Figure 2.7 A) in the following way: (1) The gradient
mixer was setup on a stand as shown in Figure 2.7 B with magnetic stirrers free to
rotate. (2) Both the mixing tubes and the exit tubes were clamped prior to use and
5 ml of 5% and 10% sucrose were added to the mixing tubes. (3) A small amount
of BSA in water was added to the centrifuge tubes (Figure 2.7 B) and collected to
ensure that the sucrose is flowing smoothly down the centrifuge tube and prevent
mixing that might destroy the gradient. The centrifuge tubes were placed about
10 cm below the mixer. (4) The clamps were removed from the mixing tubes and
the ends of the exit tube secured on the inside of the centrifuge tube such that
bubbles of sucrose do not form and a slow continuous flow is the result. (5) After
the gradient was formed beads were carefully loaded into the top of the gradient.
This proved to be a very important step, so adequate care was taken to ensure that
the pipette is in contact with the top of the sucrose gradient and that the flow is
very slow and across the top of the sucrose (not directly into it). (6) Beads were
centrifuged for 15, 25 or 40 min for 500, 350 and 200 nm biotinylated beads, re-
spectively, at 12 256g using the JS13.1 rotor in a centrifuge J2-21 (Beckman, UK).
The centrifuge is located in Micro-Biology Unit, Department of Biochemistry, Uni-
versity of Oxford. Centrifuge, rotor and the tubes were chosen as the best option
for the gradient centrifugation of ∼500 nm particles, as well as for extraction of
bead pairs after centrifugation. No adequate adaptor exists for this tube-adaptor-
rotor-centrifuge combination; therefore, additional home made adaptors were made.
(7) Beads were extracted and washed 2 times into storage buffer (Figure 2.7 C).
Immediately after gradient separation 60-80% of all objects in the solution were
bead pairs. For a maximum yield of bead pairs, sucrose gradient centrifugation is
performed just prior to use.

2.3. Bead pair assay preparation 75
2.3 Bead pair assay preparation
Biotinylated bead pairs were attached to the surface of a coverslip as follows. The
coverslip was cleaned with saturated KOH in 95% ethanol prior to use. A tunnel
slide was constructed using double-sided adhesive tape to define a channel between
the coverslip and a microscope slide (Figure 2.8), filled with KA buffer (10 mM
MOPS/KOH, 2 mM MgCl2, 50 mM KCl, pH=7) containing 6 mg/ml Bovine Serum
Albumin (Sigma- Aldrich, UK) and incubated for 1 min. 4 µM streptavidin (Sigma-
Aldrich, UK) in KA buffer was then added and incubated for 10 min. After washing
with KA buffer, 0.5% biotinylated bead pairs in KA buffer were added and incubated
for 10 min. After incubation, loose beads were washed out and the tunnel sealed
with vacuum grease.
Figure 2.8: A tunnel slide constructed out of a microscope slide, double-sided adhesivetape and a microscope coverslip (22 x 22 x 0.35 mm). The coverslip is placed closer to theedge of the microscope coverslide to fit in home made microscope and microscope stageshown in Figure 2.3

2.4. F1-ATPase purification 76
2.4 F1-ATPase purification
E.coli F1-ATPase purification is based on protocols obtained from Professor
Masamitsu Futai.
CONTRIBUTIONS AND COLLABORATIONS: Protocols, as done in Prof. M. Futai’s lab, were
learned, working with Hiroyuki Howokawa, in November 2003 during a 3 week stay at Division
of Biological Sciences, Institute of Scientific and Industrial Research, Osaka University. Protocols
as well as relevant strains were brought from Japan to Oxford and adequately adopted. This, as
well as purchasing all relevant chemicals, involved adjusting the protocols to best suit the available
equipment, in terms of centrifuges, rotors, centrifuge tubes and adaptors, French press cells and
warm baths. The work was done initially in Prof. Judy Armitage’s lab in Micro-Biology Unit, De-
partment of Biochemistry, University of Oxford together with two undergraduate students, Jelena
Baranovic and Maja Petkovic∗. Due to lack of space the work was continued in Prof. Anthony
Watt’s lab, Department of Biochemistry, University of Oxford. Adequately adopted protocols are
currently performed when F1-ATPase is required for rotation assay experiments by Dr. Simon Ross,
an IRC (Interdisciplinary Research Collaboration) technician working in Prof. Anthony Watt’s lab.
F1, with six histidine residues intorduced in front of the initiation codon of the α
subunits genes and two cystine mutations in γ subunit, was constructed in pBUR17
plasmid and expressed in DK8 bacterial strain by Dr. H. Omote as described previ-
ously [254, 255]. The F1 was purified in four steps (each taking ∼ one day) as shown
in Table 2.1. The first two steps involve cell growth, wich yield a cell pellet of ∼1 g.
At the end of the third step, disrupted cells are collected as membrane fragments
containing F1Fo as well as other membrane proteins. During the fourth step F1 is
separated from Fo and collected by glycerol gradient centrifugation.
∗J. Baranovic and M. Petkovic, worked on their diploma thesis each for two months, as partof their undergraduate degree at University of Zagreb, Department of Molecular Biology. Theywere financed for their stay by city of Zagreb through NGO znanost.org and program Connect (ofwhich I am the program leader).

2.4. F1-ATPase purification 77
Day Purificationstep F inalproduct
Day 1 Cell preculture 8 ml of preculture
Day 2 Cell culture grown in glycerolreach growth medium
Cell pellet of ∼1 g
Day 3 Cell membrane isolation Membrane fragments contain-ing different proteins (includingF1Fo-ATPase)
Day 4 Glycerol gradient purification ofF1-ATPase protein
F1-ATPase
Table 2.1: F1-ATPase purification protocol
(1) Cells were grown in 20 ml Luria-Bertani (LB) medium with 100 µg/ml final
concentration of ampicilin for 12-15 hours, with 120 rpm shaking speed and bath
temperature of 37◦C.
(2) 800 ml of Tanaka medium was inoculated with 8 ml of overnight preculture
(64 mM K2HPO4, 34 mM KH2PO4, 20 mM (NH4)2SO4, 1 µM FeSO4, 10 µM CaCl2,
10 µM ZnCl2, 50 mg/l L(+)-Isoleucin, 50 mg/l L-Valine, 2 mg/l Thiamine-HCl, 0.3
mM MgCl2, 100 µg/ml ampicilin, 0.5% (w/V) glycerol) and incubated with shak-
ing speed of 160 rpm and bath temperature of 37◦C. The culture was grown until
OD600 (optical density, i.e. the absorbance of the cell culture measured at 600 nm
wavelength) became ∼1.0. The culture was then centrifuged for 22.5 min at 6 000 g
average at 4◦C (JLA 9.1000 rotor for Beckman Coulter centrifuge, 6300 rpm aver-
age). The cell pellet was resuspended in 50 mM Tris-HCl (pH=8.0 at 4◦C), using
200 ml per 800 ml Tanaka medium, and centrifuged for 22.5 min at 6000g average
at 4◦C, as above. The pellet was resuspended with TKDG buffer (20 mM Tris-HCl

2.4. F1-ATPase purification 78
pH=8.0 at 4◦ C, 140 mM KCl, 10% (w/V) glycerol, 0.5 mM DTT), using 20 ml
per 800 ml Tanaka medium and centrifuged for 11.5 min at 6000g average at 4◦ C
(JA 12 rotor for Beckman Coulter centrifuge, 7000 rpm average). Cell pellet wet
weight after centrifugation was measured.
(3.) E. coli cells were resuspended in TKDG-a buffer (TKDG buffer with 0.5 mM
PMSF (Sigma-Aldrich, UK), 5 µg/mL leupeptin (Sigma-Aldrich, UK), 5 µg/mL
pepstatin A (Sigma-Aldrich, UK) and 1 µg/mL DNase I) at 7 ml of buffer per 1 g
cells (wet weight) and disrupted with a French Press (SIM AMINCO, SLM Instru-
ments Ltd.). Gauge pressure was set at 1800 kg/cm2 to achieve ∼ 28 000 psi when
using a 40k pressure cell. When using a 20k pressure cell, gauge pressure was set
to 1200 kg/cm2, actual pressure was ∼19 000 psi. Disrupted cells were centrifuged
two times for 12.5 min at 12 000g average, at 4◦C (JA 20 rotor for Beckman Coulter
centrifuge, 12 000 rpm average). Supernatant was transfered to fresh tube and cen-
trifuged for 1.5 hr at 130 000g average, at 4◦C (Type 70.1 TI rotor for 43 500 rpm
in L-XP Beckman Coulter ultracentrifuge). The precipitate was resuspended on
ice in TKDG-b buffer (TKDG-a buffer without DNase I) and centrifuged again for
1.5 hour at 130 000 g average, at 4◦C as before. The precipitate was resuspended
on ice in TKDG buffer (approximately 200 µl/1 g cells (wet weight)).
(4.) The suspension of membranes was diluted about 50 times with TKDG-E buffer
(TKDG buffer with 1 mM Ethylenediamine-N,N,N’,N’-tetraacetic acid (EDTA),
5 g/ml Leupeptin and 5 g/ml Pepstatin A), and centrifuged for 1 hour at 150 000 g
average, at 15◦C (rotor Type 70.1 TI at 46 700 rpm in ultracentrifuge L-XP Beckman
Coulter). The precipitate was rinsed with 1 ml per 1 g of cells of buffer A (1 mM
Tris-HCl pH=8.0 at 25◦C and 0.5 mM EDTA) carefully and quickly, suspended in
0.6 ml per 1 g of cells (wet weight) of buffer A and centrifuged two times for 20 min
at 370 000 g average, at 15◦C (rotor TLA 100.2, 100 000 rpm, Optima TL ultra-
centrifuge). 0.5 M MOPS-NaOH buffer (pH=7.0, at 25◦C) and 1 M Na2SO4 were

2.4. F1-ATPase purification 79
added to the supernatant to final concentration of 25 mM and 50 mM, respectively.
After the pH of the solution was checked to be 7.0, 20 mM Biotin-PEAC5-maleimide
(Sigma-Aldrich, UK), 10 mg/ml Leupeptin and 10 mg/ml Pepstatin A were added
to final concentrations of 100 µM, 10 µg/ml and 5 µg/ml respectively. The solution
was incubated for 1.5 hour at room temperature. After the biotinylation, the solu-
tion was layered on a glycerol gradient (prepared in ultra centrifuge tubes by layering
30, 25, 20, 15 and 10% (w/V)) glycerol solutions (in 20 mM MOPS-NaOH pH=8.0
at 25◦C, 50 mM Na2SO4, 1 mM ATP, 5 µg/ml Leupeptin and 5 µg/ml Pepstatin A)
and centrifuged for 4 hr at 250 000g (average), at 15◦C. (SW 55 Ti rotor, 51 300 rpm
average, Optima L-XP Beckman Coulter ultracentrifuge). After centrifugation the
solution was fractioned. To determine the peak fraction, the ATPase activity of
fractions was checked. Peak fraction was aliquoted and fast frozen for storage at
-80◦C (a gel of peak fractions is shown in Figure 2.9). Protein concentration was
epsilon
Figure 2.9: SDS-PAGE gel of peak F1 fractions after glycerol gradient purification.Weights of marker proteins and positions of α, β and γ units of F1 are indicated. Smallamounts of ǫ subunits are also present as indicated.
obtained using the Bradford and Lowry methods, and ATPase activity was tested

2.4. F1-ATPase purification 80
by Pi coloring method.
The Bradford method is based on an absorbance shift in the Coomassie dye when
it is bound to arginine and hydrophobic amino acid residues present in the protein
of interest. The increase in absorbance at 595 nm is proportional to the amount of
bound dye, and thus to the amount of protein present [256].
The Lowry method was used to estimate the amount of membrane bound protein.
Divalent copper ions, under alkaline conditions, form a complex with peptide bonds
in which they get reduced to monovalent ions. Monovalent copper ions and tryosine,
tryptophan and cysteine R-groups react with the Folin reagent to form an unstable
product that gets reduced to molybdenum/tungsten blue. The amount of product
is proportional to amount of protein and can be detected by absorbance at 650 nm
[257].
ATPase activity by coloring: The assay measures a formation of phosphate by
hydrolyzing ATP. The method depends on quantifying the color obtained from the
formation of a phospho-molybdate complex and its subsequent reduction to highly
colored blue compounds [258].
The yeast mitochondrial F1-ATPase
CONTRIBUTIONS AND COLLABORATIONS: The enzyme was genetically modified for rotation
assays and purified in laboratory of Professor David M. Mueller, Laboratory of Molecular Bioen-
ergetics, Department of Biochemistry and Molecular Biology, The Chicago Medical School.
A 6-His tag was introduced on each of the β subunits and a cys mutation in the
γ subunit.

2.5. F1-ATPase rotation assay preparation 81
2.5 F1-ATPase rotation assay preparation
Both E.coli F1 and yeast F1 were attached to the surface of a coverslip prepared in
on of the following ways.
CONTRIBUTIONS AND COLLABORATIONS: The F1-ATPase rotation assay preparation
was done together with Thomas Bilyard, a DTC student who after finishing his two month DTC
project joined Dr. Richard Berry’s group as Dphil student and started working on F1-ATPase.
Microscope coverslips were
• cleaned as described for bead pair assay and coated with BSA (BSA surface)
• cleaned as described for bead pair assay and coated with nitrocellulose (Collo-
dion Solution, Sigma-Aldrich, UK) and 1 µM Ni-NTA Horseradish-peroxidase
(HRP, Qiagen, UK) (HRP surface)
• cleaned as described for bead pair assay and functionalized with
2%(3-Mercaptopropyl)trimethoxy silane and 50 mM DTT in 10 mM MOPS/KOH
pH=7.5, prior to reaction with 10-15 mg/ml maleimide-C3-NTA (Dojindo,
Japan) in 10 mM MOPS/KOH pH=7 and 10 mM NiCl2 in 10 mM MOPS/KOH
pH=8. [109, 90] (silane surface)
• Cu2+ chelated coverslips from Microsurfaces Inc, USA were used. These are
made from a proprietary coating, consisting of a high density poly-ethylene-
glycol (PEG) brush, which is further functionalized with Cu2+ as shown in
Figure 2.10 (Cu2+ surface)
Microscope coverslips were then assembled into tunnel slides as described for bead
pair assay.
The following were flowed through the channel: 1 to 0.2 nM F1 in KB buffer (KA

2.5. F1-ATPase rotation assay preparation 82
Figure 2.10: Cu2+ coated surface. PEG brush is shown in blue. Figure is taken fromcompany’s webpages (Microsurfaces Inc, USA http://proteinslides.com/product.html).
Buffer, 5 mg/ml BSA, pH=7), wait 10 min; KB buffer; 4 µM streptavidin (Sigma-
Aldrich, UK) in KA buffer, wait 10 min; KB buffer; 0.5% biotinylated bead pairs
in KB buffer, wait 10 min; KB buffer; 24 mM, 1 µM, 60 nM or 20 nM Mg-ATP
in KB buffer (Reaction Mixture). For 1 µM, 60 nM or 20 nM [Mg-ATP] following
ATP regenerating system was used to keep the [ATP] constant: 10 nm/ml PK and
100 mM PEP. At these concentrations oxygen scavengers were used as well (0.5% β-
mercapthoethanol, 25 mM glucose, 36 µl/ml catalase, 4.24 mg/ml glucose oxidaze)
were included in the Reaction Mixture (RM). To prevent evaporation, the tunnel
was sealed with vacuum grease. The rotation assay preparation given above is a
final result of several attempts to determine the buffers and concentrations which
gave the highest yiled of functional surface immobilized complexes. These include
• For incubation in the channel the concentration of F1 was varied between 10
and 0.1 nM . If every F1 molecule present in the 22 x 3 mm2 channel gets
attached to the coverslip surface, a 10 nM concentration of F1 will give ∼ 9000
molecules/µm2 and 0.1 nM concentration will give ∼ 90. Concentrations of
F1 between 1 and 0.2 nM were chosen as the most suitable, with F1 complexes
well distributed on the surface and bead pairs present in good numbers.
• F1, streptavidin and bead-pair incubation was tried with FB buffer (10 mM
HEPES/NaOH pH=7.8, 6 mM MgCl2, 25 mM KCl, 5 mg/ml BSA) as well as
KB. FB buffer is often used in rotation assays reported by other researchers
and was therefore tested [58]. Casein was used instead of BSA in both KA and
FA (FB buffer without BSA) buffer. Concentration of BSA and casein was
varied from 0.25 mg/ml to 10 mg/ml in both KA and FA buffer. It was found
2.6. E. coli rotation assay preparation 83
that incubation in KA gives the highest number of spinners and almost no
non-specific sticking for the 500 nm biotinylated amino-functionalized bead-
pairs.
• Neutravidin (Pierce, USA) was used in stead of streptavidin to try and improve
specific stickiness and minimize non-specific sticking, as well as to reduce the
off rate compared to streptavidin and avidin [259]. No significant improvement
was found.
• Amino functionalised 500 nm beads from Polysciences (Germany) gave almost
no non-specific sticking when biotinylated and used in KB buffer. Carboxy
functionalised beads from different manufacturers were tried (Bangs, USA and
Polysciences, Germany), each having different charge and slightly different size
(all in the range from 300 to 350 nm). In KB buffer, biotinylated 350 nm (Poly-
sciences) carboxy-functionalized beads gave no non-specific sticking. Also, bi-
otinylated 200 nm amino functionalized beads from Polysciences were found
to give low non-specific sticking when used in KB buffer.
2.6 E. coli rotation assay preparation
CONTIRBUTIONS AND COLLABORATIONS: The data presented in section 4.3.2 was obtained
from C. J. Lo for the purpose of demonstrating the capabilities and different uses of the trapping
system.
Cells of E. coli strain KAF95, expressing flagellar filaments that spontaneously
stick to plain polystyrene beads and flagellar motors that do not switch direction
and cells of E. coli strain KAF84, expressing flagellar filaments that spontaneously
stick to plain polystyrene beads and flagellar motors that switch direction were used
[260]. 5 ml of tryptone-broth was inoculated with 100 µl of cells (TB; 1% tryptone,
2.6. E. coli rotation assay preparation 84
Difco, USA; 0.5% sodium chloride) and 5 µl of 100 µg/ml ampicillin (Sigma-Aldrich,
UK) then grown for 5 hours at 30◦C with shaking at 200 r.p.m. [260]. Tunnel slides
were prepared as described for the bead pair assay. Poly-L-lysine (Sigma-Aldrich,
UK) was incubated in the tunnel for one minute and washed with motility buffer
(10 mM potassium phosphate; 0.1 mM EDTA at pH=7.0). Prior to use, flagellar
filaments were sheared by passing the cell culture through a home made shearing
device made of two syringes with narrow gauge needles connected by polyethylene
tubing. The turbulent flow inside the needle is sufficient to shear the flagella at a
random point along the filament. Cells were sheared 40-70 times [174]. Cells with
trunctuated filaments were incubated in the tunnel slide for 10 minutes. Motility
buffer was subsequently added to the tunnel, after which 0.5% solids concentration
500 nm diamtere beads (Polysciences, Germany) in motility buffer were added and
incubated for 10 min. After incubation loose beads were washed with motility buffer
and the tunnel was sealed with vacuum grease.
In section 4.3.2, C. J. Lo used YS34 strain containing pYS13 and pYS11 plasmids,
and flowed the following through the channel: poly-L-lysine, wait 1 min; sodium
motility buffer (motility buffer with 85 mM NaCl); cells with truncated filaments,
wait 10 min; 0.5% solids concentraion 350 nm or 200 nm beads (Polysciences, Ger-
many), wait 10 min; sodium motility buffer. The channel was subsequently sealed
with vacuum grease.

Chapter 3
FEEDBACK
85

3.1. Overview 86
3.1 Overview
Having described the setup built as part of this thesis in the previous chapter, here
I present the feedback algorithms used and demonstrate the performance of the
‘angle clamp’ system. I give a brief introduction to the feedback theory, which
helps to understand the limits of the system in terms of temporal resolution. I then
present experiments performed on a single bead and a bead-pair, with details of the
experimental procedures developed for each particular feedback algorithm.
3.2 Feedback theory
In order to understand the limitations and expected performance of the feedback
system I take a short look at the underlying theory and present algorithms chosen
for use in the experiments.
The equation of motion of a trapped object in the system presented here is given as
[261]
ζdx
dt= −k[x(t) − u(t)] + fb(t) (3.1)
where u(t) is the feedback control term (for this system the position of the
trapping laser), which can have different forms depending on the chosen algorithm.
Without this term, Equation (3.1) represents a Langevin equation where k is the
trap stiffness, x(t) the position of the object in the trap, ζ the viscous drag coefficient
of the bead and fb(t) the Brownian force due to thermal fluctuations. If u(t) = 0,
the power spectrum of the system in Equation (3.1) is a Lorentzian [262]. At low
frequencies it asymptotically behaves as white noise, while at frequencies above
the cut-off frequency fc, it asymptotically decays as 1/f 2. The aim of a feedback
algorithm is to make the system output, x(t), follow a control signal, r(t). The
general strategy as described in [261] minimizes the error-signal e(t) = r(t) − x(t)
by choosing a suitable control law K(t), where u(t) = u(K(t), e(t)) in Equation 3.1.

3.2. Feedback theory 87
The most frequently used control law is
u(t) = Kp(t)e(t) + Ki
∫
e(t) dt + Kdde(t)
dt; Kp, Ki, Kd = const. (3.2)
known as the proportional integral derivative (PID) feedback control law.
In the case of the derivative term, the response is linear with frequency and high
frequency Brownian noise can strongly influence the performance of the feedback.
Therefore, Kd is usually set to zero (PI feedback). A proportional feedback term
Kp is sufficient to reduce fluctuations in e(t) below a certain cut-off frequency fKp,
which is higher than fc. However, the long-term response with only the proportional
term differs from a desired set-point as discussed elsewhere [261]. This steady state
error is eliminated by an integral feedback term. In addition, with the integral term,
the response time of the system is increased [261] and the system changes from first
order to second order, where the system bandwidth and damping is influenced by
the feedback coefficients Ki and Kp.
When discussing the feedback bandwidth and stability of the system, the delays
introduced when the feedback loop is implemented digitally have to be factored in.
To correctly describe the system, Equation 3.1 is discretized
ζ(xn+1 − xn)
Ts
= −k(xn − un) + fbn (3.3)
where Ts = 1fsampling
. The control law in discrete form can be written as
un = Kp(rn − xn) + Ki
n∑
j=0
(rj − xj) + Kd((rn − xn) − (rn−1 − xn−1)) (3.4)
with Kd usually set to 0.
Further time delays are present in the system due to the AODs response time (the

3.2. Feedback theory 88
time it takes for the acoustic wave to reach and cross the laser beam), and to
the delay between the input and output signals on the DSP board, corresponding
to computational time of the board (which depends upon the size of the program
used to run the feedback). These delays and the parameters k, ζ , Kp and Ki set
the feedback bandwidth of the system. The maximum frequency up to which the
feedback can reduce e(t) is usually significantly less than the sampling frequency
fsampling [263]. Simple calculation for an analog first order system such as Equation
3.1 as given in [261], with the effect of delays taken into account, suggests that the
maximum frequency up to which the feedback can reduce Brownian noise is approx-
imately one quarter of the overall feedback execution frequency, floop. Spontaneous
oscillation occurs at this frequency when Kp and Ki are increased beyond a criti-
cal point. This prediction was compared with experiments presented later in the
text, and found that it gives a rough estimate of the frequency at which the system
becomes unstable. These delays limit the speed of the system to ∼1 ms. Faster
feedback would be possible with commercially available hardware updates, specif-
ically AODs with faster response times and a DSP board with a faster processor.
(For display in this thesis, the experimental data were low-pass filtered based on the
measured oscillation frequency, unless otherwise stated.)
The discussion so far considers a cartesian linear system (extension to a 2-D
linear system is straight forward). However, for the purpose of controlling a bead
attached to a rotary molecular motor it is more convenient to express the position of
the bead in polar coordinates (rb, θb). To control only the angle coordinate, θb, the
radius of the trap was chosen to remain constant irrespective of rb. This is desired
as a bead attached to a rotary molecular motor rarely moves along a perfect circle,
and forcing it to move along such a path with feedback, would not be beneficial.

3.2. Feedback theory 89
The 2π periodicity of θb requires a non-linear feedback algorithm:
θt,n =
⎧
⎪
⎪
⎪
⎪
⎨
⎪
⎪
⎪
⎪
⎩
θ∗t,n if |θ∗t,n − θb| < θmax
(θb,n − θmax) if (θ∗t,n − θb) < −θmax
(θb,n + θmax) if (θ∗t,n − θb) > θmax
(3.5)
where
θ∗t,n = θs,n − Kp(θb,n − θs,n) − Ki
n∑
j=0
(θb,j − θs,n) (3.6)
and θt,n, θb,n and θs,n are trap angle, bead angle and set angle respectively. θmax
is a constant. The classic PI-algorithm of Equation 3.4 is modified so that the
angle between the trap and the bead (proportional to torque) never exceeds θmax
(typically 90◦ in most of the presented experiments). This ensures that the torque
on the bead will be in the correct direction even for large error signals and gain.
Also, the addition of the term θs,n in the expression for θt,n removes the steady state
error in the classic algorithm even with Ki = 0.

3.3. Single bead algorithms and experiments 90
3.3 Single bead algorithms and experiments
3.3.1 Alignment and calibration of the detector and AODs
The back-focal-plane (bfp) laser detection used to monitor the position of a bead
is non-linear and was calibrated for each bead that was studied or for a bead in
each sample preparation [209, 17]. The dimensionless position signal from the QD,
N = (X, Y ), is defined by X = (α + β − γ − δ)/(α + β + γ + δ), Y = (α − β −
γ + δ)/(α + β + γ + δ), where α, β, γ and δ are proportional to the photo-currents
of the four quadrants. N is a non-linear function of the 3-dimensional position of
the bead, n = (x, y, z) (Figure 3.1), and therefore requires calibration. Before each
experiment, the QD and AODs were aligned in the following way.
1. A bead stuck to the coverslip surface was moved through the detector laser focus
with the piezo stage and the centre of the detector beam was defined as the mid-
point of the single-valued range of the X and Y signals (see Figure 3.1 B). 2. With
the bead at this centre, X and Y were set to zero by adjustment of a mirror that
steers the detector laser beam onto the QD. 3. Steps 1 and 2 were repeated several
times to remove any sensitivity to the initial state of alignment. 4. With the AODs
set at the centre driving frequency and the stuck bead replaced by a bead trapped
a few microns from the coverslip, X and Y were again set to zero by adjustment
of mirror M1 (Figure 2.1 and 2.6). By scanning beads, either in 2 dimensions with
the AODs or in 3 dimensions with the piezo-electric stage, data-sets Ni(ni) were
obtained, (the measured QD signal at selected bead positions ni). For example,
Figure 3.1 A shows an intensity plot of X versus (x, y) for a 500 nm bead scanned
using the AODs, with iris open and objective overfilled. A least-squares 5th order
polynomial fit was used to describe the detector response in the region where (X, Y )
3.3. Single bead algorithms and experiments 91
are single valued for each bead studied:
x =∑
n=1...5
(anXn + bnY
n) ,
y =∑
n=1...5
(cnXn + dnYn) . (3.7)
Figure 3.1 B shows X as a function of x at y = 0 for a 500 nm bead scanned
with the piezo-electric stage, showing the effect of different settings of the detector
beam iris. The detector response is monotonic over 400 nm with the iris open and
the objective overfilled (squares), increasing to 1200 nm when the iris reduces the
beam to 0.4 mm (triangles, the diameter of the objective back aperture is 7 mm).
The primary calibration standard was the stage operated in closed-loop mode with
capacitive sensing, giving an absolute position uncertainty of 1 nm as quoted by the
manufacturer. To calibrate the AODs, an individual bead was scanned in (x, y) first
using the AODs and then, after sticking it to the coverslip, using the stage. This
confirmed the linear dependence of trap position on AODs driver frequency, and
determined a conversion factor of 600 nm/MHz, consistent with the value estimated
from the trap beam optics and the manufacturer’s specifications for the AODs. The
smallest movement of the trapping laser is 9 nm, limited by the frequency resolution
of the AOD driver. For typical rotational trajectories of 100-1000 nm beads attached
to motors this corresponds to an angular resolution of 1-10◦, depending on the radius
of the circle at which the trapping laser was kept. Figure 3.1 C, shows Y as a function
of x at a range of equally-spaced values of y, for a 500 nm bead scanned in (x, y)
by the stage, illustrating the cross-talk between orthogonal axes. An ideal detector,
linear and without crosstalk, would give a series of equally spaced horizontal lines
in such a plot. By contrast, the sensitivity of the QD signal Y to movement in
y decreases at larger absolute values of x, as the bead moves out of the detector
laser focus. This illustrates the need for the 2-dimensional fit of Equation 3.7. The

3.3. Single bead algorithms and experiments 92
Figure 3.1: Calibration of QD signal (X,Y ) from single beads, using AODs and piezo-electric stage. (A) Intensity plot of X versus bead position (x, y) for a 500 nm beadscanned using the AODs on a 30 nm square grid. (B) X as a function of x at y = 0, fora 500 nm bead scanned with the piezo-electric stage. The monotonic range of detectorresponse increased from 300 nm to 600 nm and 1200 nm (squares, circles, triangles) as theiris opening decreased from 7 mm to 2.5 mm and 0.4 mm respectively. Lines represent a5th order polynomial fit . (C) Y as a function of x for 10 different equally spaced y values,showing cross talk between x and Y . (D) X as a function of z for 10 equally spaced x
values, showing cross talk between z and X. In (C) and (D) a 500 nm bead was scannedby the piezo-electric stage, with 50 nm separation between y and x values respectively.Data were sampled at 2 kHz and X, Y values for each position were averaged over 0.2 s.The iris opening was 7 mm, equal to the diameter of the objective back aperture, exceptwhere otherwise stated.
crosstalk between X and z is illustrated in Figure 3.1 D, which shows X as a function
of z at a range of equally-spaced values of x, also for a 500 nm bead scanned in (x, z)
by the stage.

3.3. Single bead algorithms and experiments 93
Figure 3.2: Bright-field images of a single bead scanned in 100 nm steps in z. The accuracywith which z = 0 could be set by eye using video images was found to be ∼30 nm.
At the beginning of each experiment z = 0 was defined such that the average
brightness of the bright-field image of the bead was similar to the background: thus
beads appeared gray at z = 0, black at z > 0 (by definition, when the microscope and
laser focus was in the sample buffer) and white at z < 0 (focus in the coverglass,
Figure 3.2). By setting z = 0 by eye 20 times each for 9 different beads and
recording the spread of actual heights read from the calibrated piezo-electric stage,
this procedure sets z = 0 with an estimated accuracy of ∼30 nm, comfortably within
the range of ∼400 nm over which the variation of X with z is negligible (Figure 3.1
D). The same was true for crosstalk between Y and z (data not shown). Therefore
any possible effects of z drift on the detector response N(x, y) were neglected. The
experimental procedure was as follows.
(1) Set z = 0 and then align QD and AODs as described above. (2) Trap a bead,
scan it in (x, y) with the AODs, and use this scan to determine the calibration
parameters an, bn, cn, dn (Equation 3.7) for that bead. (3) Pass these parameters to
the feedback algorithm running on the DSP board, to determine the trap position
(un, corresponding to the control term Un in Equation ??) from the QD signal in
subsequent experiments on that bead. In cases where it was not possible to scan a
bead, for example when the bead of interest was attached to the motor before being
examined, calibration parameters were obtained for another bead of the same size
in the same sample preparation.

3.3. Single bead algorithms and experiments 94
3.3.2 Trap stiffness
Calibration of trap stiffness is necessary if the absolute value of force or torque ex-
erted upon a molecular motor via the bead are to be known. For small displacements
of a trapped bead the force is given by F = −kx, where k is the trap stiffness and
x is the bead displacement. This allows the trap to be calibrated using Brownian
motion of the bead, in two different ways [17, 209]. The simplest method is based
on the principle of Equipartition of Energy [209], which states:
1
2k〈x2〉 =
1
2kBT (3.8)
where kB is Boltzmann’s constant and T the absolute temperature. This gives
k directly from the mean-squared displacement, dependent upon calibration of the
QD signal as described above. An alternative method based on the power-spectrum
of Brownian motion does not require knowledge of the absolute displacement of
the bead [264]. To a first approximation the power-spectrum is Lorentzian, with a
corner frequency fc = k2πζ
, where ζ is the viscous drag coefficient of the bead. In
practice the power-spectrum was fitted using a more accurate theory that accounts
for discrete sampling of the data, low-pass filtering by the QD and inertial effects
from the entrained fluid surrounding the bead [264], using a program made freely
available by the authors [265]. The program gives a corrected value of fc, from
which the trap stiffness k was calculated, using Faxen’s formula with correction for
the proximity of the surface to calculate ζ [209]:
ζ =6πηr
1 − 916
( rh) + 1
8( r
h)3 − 45
256( r
h)4 − 1
16( r
h)5
(3.9)
where η is the viscosity of the fluid, h distance of the bead from the surface of the
coverslip and r the radius of the bead. At least 30 separate recordings were used
at various laser powers to calibrate each bead, each lasting 2 s, with a sampling
3.3. Single bead algorithms and experiments 95
frequency of 36 kHz and anti-alias pre-filtering at 16 kHz. A 500 nm bead was
trapped with a stiffness of (1.11 ± 0.02) pNµm−1 per mW of trapping laser power in
the x direction, and (1.03 ± 0.02) pNµm−1mW−1 in the y direction, as measured by
the power-spectrum method (Figure 3.3 A). The equipartition method gave slightly
lower values of stiffness, typically within 4% of the values obtained from the power-
spectrum. This is most likely due to external noise at low frequencies, which is
ignored in the power-spectrum method by exclusion of low frequencies from the
fitting of fc, but adds to the variance in the equipartition method, lowering the
estimate of trap stiffness. The asymmetry between x and y stiffness is in agreement
with theoretical predictions for polarized laser light, and is expected to vanish as
the diameter of the bead approaches the trapping laser wavelength [266].
One unavoidable property of AODs is that the intensity of the deflected beam
varies with the angle of deflection, and thus the trap stiffness varies with position.
This effect was limited to a < 8% intensity variation over the full range of the AODs
by choosing the appropriate driving amplitude for the range of frequencies used.
The remaining variation was characterized by measuring trap stiffness at different
positions, and was found to follow the intensity variation as expected (Figure 3.3
B).
3.3.3 2-Dimensional Feedback Control
Several tests were carried out to demonstrate the experimental performance of the
feedback system anticipated by theory. Figure 3.4 A shows the trap acting as a
position clamp, holding a 500 nm bead fixed, while measuring an external force
applied by viscous drag. The piezo stage was moved in a triangular wave along
the x-axis (Figure 3.4 A, bottom) with a velocity of ±420 ms−1, corresponding to
a Stokes drag force of ±2.1 pN. Figure 3.4 A, top shows the displacements of the
trap and bead with no feedback. The bead displacement due to the external force

3.3. Single bead algorithms and experiments 96
Figure 3.3: Trap stiffness (A) Trap stiffness versus laser power is shown. kx (red, fullline) and ky (red, dotted line) calculated with the equipartition method have slightly lowervalue than kx (black, full line) and ky (black, dotted line) obtained from power spectrumanalysis. The kx value in both cases has a slightly higher value than ky consistent withtheoretical predictions [266]. (B) Trap stiffness versus angle is shown for 3 different laserpowers: 24.5 mW (blue), 33 mW (red) and 55.5 mW (black). Variations with angle are15.3%, 15% and 10.4 % consistent with measured variations in the laser power intensityover the range of AODs’ frequencies used to generate these angles.
is ±100 nm, as expected given the drag force and the trap stiffness of 20 pNµm−1.
Figure 3.4 A, middle shows the corresponding displacements with the following

3.3. Single bead algorithms and experiments 97
Figure 3.4: 2-D X and Y feedback. (A) Top: The response of the 500 nm bead withoutfeedback (black) to a drag force of ± 2.1 pN, and the position of the trapping laser(red). Middle: The position of the bead (black) and the trapping laser (red) when thefeedback in X and Y is turned on. Feedback parameters were set to Kp= 0.3, Ki= 0.06and trapping laser power to 18 mW (20 pNµm−1 trap stiffness). The experimental datashown was passed through a low-pass second order Chebyshev filter (available in NationalInstruments LabView software) before display, with pass frequency set to 200 Hz. Bottom- Movements of the piezo-electric stage. (B) Critical frequency above which the systembecomes unstable. Data were sampled at 10 kHz, 5 kHz and 2 kHz respectively (triangles,squares, circles). Feedback parameters Kp and Ki were increased until the bead held inthe trapping laser visibly oscillated for a given laser power (trap stiffness) and samplingrate. The oscillation frequency was obtained from the power spectrum of the QD signal.Further increasing Kp and Ki does not change this frequency. The critical frequencydepends on the laser power up to a point, above which the delays in the system, and notthe trap stiffness, limit the feedback time resolution.
feedback algorithm
Un = Kp(Rn − Xn) + Ki
n∑
j=0
(Rj − Xj) + Kd((Rn − Xn) − (Rn−1 − Xn−1)) (3.10)

3.3. Single bead algorithms and experiments 98
applied separately in the X- and Y -axis. Equation 3.10 is very similar to Equa-
tion 3.4, but the feedback is now performed on QD signal (Xn, Yn), not the bead
position. Un and Rn are QD signals corresponding to un and rn given in Equation
3.4. The polynomial fit of Equation 3.7 is used to determine the trap position un cor-
responding to the desired QD signal Un; in most cases feedback is performed in the
linear range of QD (Figure 3.1) and these are proportional. The bead displacement
due to the external force is reduced to ±0.06 nm, indicating that the effective trap
stiffness at low frequency is increased to 35 nNµm−1. To further test the feedback
performance and compare it to the theoretical predictions, the frequency at which
the system under feedback becomes unstable was measured. Figure 3.4 B shows the
critical frequency above which the system becomes unstable as a function of laser
power (trap stiffness) for different sampling rates. The critical frequency depends
upon laser power up to a point, above which trap stiffness is no longer limiting and
instead feedback is limited by the delays in the system (as previously discussed).
Horizontal lines in Figure 3.4 B correspond to the 14
and 16
of overall feedback exe-
cution frequency, floop, indicating a rough agreement with the simplified theoretical
prediction that the critical frequency should be approximatelyfloop
4. The algorithm
in Equation 3.10 can run up to floop ∼2.6 kHz, thus the minimum response time of
our system with this algorithm is ∼2 ms.
Figure 3.5 shows two methods of feedback control of the angle of a bead moving
on a circular trajectory. In the first method, the QD set-point was moved step-wise
to different points on the circle and applied feedback separately in the X- and Y -
axis, as in the experiments of Figure 3.4. The trajectories of trap and bead are
shown in Figure 3.5 A. In the second method, the trapping laser was moved on a
circle of fixed radius 300 nm (Figure 3.5 B, right). The angle at which the trap
was placed, θt, was determined using the feedback algorithm of Equation 3.5, with

3.3. Single bead algorithms and experiments 99
the bead angle, θb, determined directly from QD signals by a simple rectangular-
to-polar conversion. The resulting trajectory of the bead is shown in Figure 3.5 B,
left. During the time in which the bead was kept at the same angle θt and θb are
expected to be equal, any differences observed are due to imperfect alignment of the
AODs and QD. The algorithm in Equation 3.5 can run up to floop ∼5 kHz in this
system, thus the minimum response time of the system with this algorithm is ∼1 ms.
Figure 3.5: Control of a single bead with feedback (A) using the control law of Equation3.10 applied to X and Y independently, (B) using the control law of Equation 3.5, in whichthe radius of the bead is not controlled and the trap is held at a fixed radius of 300 nm.Left - position of the bead, right - position of the trap. Feedback parameters were set toKp = 0.04, Ki = 0.002 and Kp = 0.8, Ki = 0.2 in (A) and (B) respectively. Laser powerwas 18 mW. Experimental data was passed through a low-pass second order Chebyshevfilter (available in National Instruments LabView software), with pass frequency (fpass)set to 200.
This demonstrates that the system can control the position of a single bead in
2-dimensions using programmable feedback algorithms, and in particular that the
angle of a bead moving on a circular trajectory can be controlled. If the bead is
rigidly attached to the rotor of a molecular motor, for example to the γ-subunit of

3.3. Single bead algorithms and experiments 100
F1, then the only degree of freedom is the bead-rotor link angle and thus controlling
the position of the centre of the bead controls the motor angle as desired.

3.4. Bead pair feedback algorithms and experiments 101
3.4 Bead pair feedback algorithms and experi-
ments
A bead-pair is necessary to control the rotation angle of the bfm with an optical
trap (discussed further in Chapter 4.). It also has advantages for use with F1. The
asymmetry of a pair allows rotation to be observed directly, rather than relying on
displacement of the centre of a single bead due to eccentricity of rotation. Also,
the bead-pair acts as a lever-arm, allowing more torque to be applied to the motor.
However, the use of a bead-pair as the handle of choice results in several specific
problems which I address below.
3.4.1 Alignment
When replacing a single bead with a bead pair, the calibration of the QD for a
single bead no longer applies. Instead one notes that for experiments with rotary
motors only the angle of the projection of the long axis of the bead-pair onto the
plane perpendicular to the motor’s rotation axis is of interest. If the motor’s axis is
aligned with the microscope axis, this is the same as the angle of an image of the
bead-pair, θbp (Figure 3.6). To estimate θbp from the QD signal (X, Y ), a rectangular-
to-polar conversion (X, Y ) → (Rbp, Θbp) was performed and assumed that Θbp =
θbp. This estimate of θbp can then be used to perform 1-D angular feedback using
the algorithm of Equation 3.3, as described for single beads in section 3.2. and
illustrated in Figure 3.4 and 3.5. To ensure that this estimate of θ is reasonable
it was necessary to close the detector laser iris, extending the monotonic range of
the QD to cover the size of a bead-pair. Feedback control of the angle of pairs of
biotinylated beads each 500 nm in diameter, attached to a microscope coverslip via
streptavidin and BSA (Methods 2.3.) was demonstrated. Pairs which showed free
rotational Brownian motion (RBM), indicating a single point of attachment on one
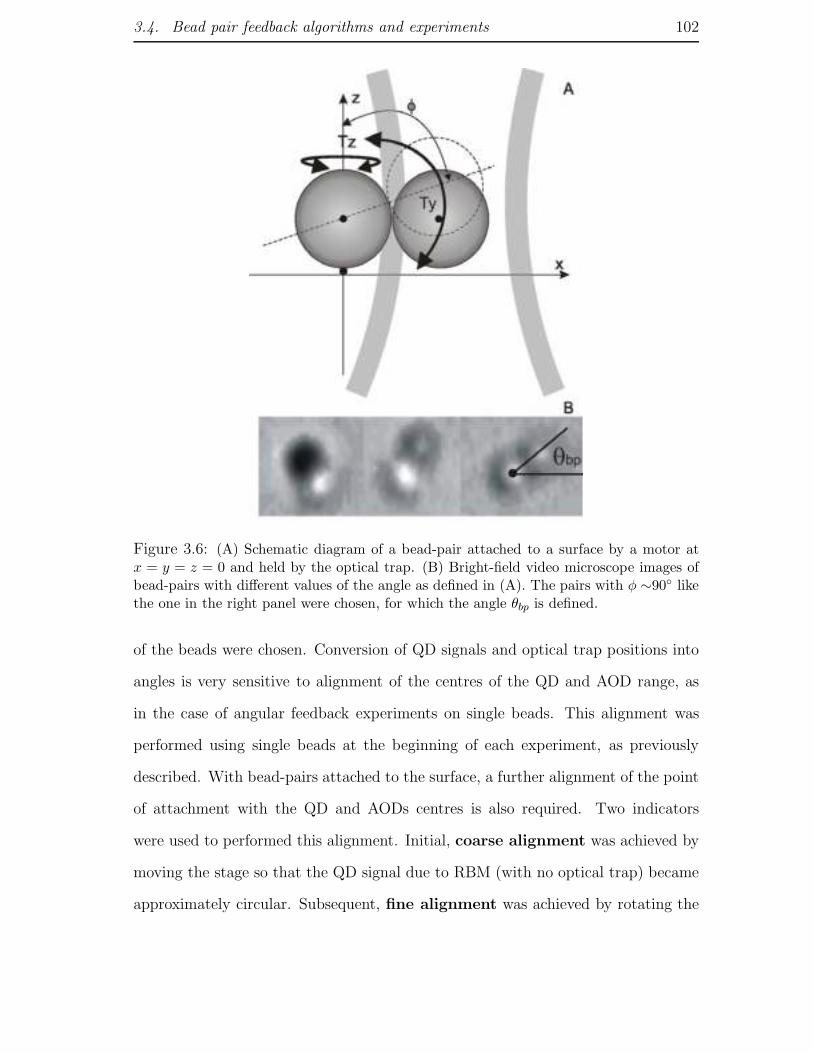
3.4. Bead pair feedback algorithms and experiments 102
Figure 3.6: (A) Schematic diagram of a bead-pair attached to a surface by a motor atx = y = z = 0 and held by the optical trap. (B) Bright-field video microscope images ofbead-pairs with different values of the angle as defined in (A). The pairs with φ ∼90◦ likethe one in the right panel were chosen, for which the angle θbp is defined.
of the beads were chosen. Conversion of QD signals and optical trap positions into
angles is very sensitive to alignment of the centres of the QD and AOD range, as
in the case of angular feedback experiments on single beads. This alignment was
performed using single beads at the beginning of each experiment, as previously
described. With bead-pairs attached to the surface, a further alignment of the point
of attachment with the QD and AODs centres is also required. Two indicators
were used to performed this alignment. Initial, coarse alignment was achieved by
moving the stage so that the QD signal due to RBM (with no optical trap) became
approximately circular. Subsequent, fine alignment was achieved by rotating the

3.4. Bead pair feedback algorithms and experiments 103
optical trap slowly in a circle centred on the AOD origin (previously aligned to
the QD origin) and moving the stage to minimize variations in θbp − θt, which was
taken to indicate that the point of attachment was at the centre of the AOD circle.
The fine alignment procedure usually optimized the circularity of the QD signal,
confirming that the attachment point, QD and AODs centres were all aligned. For
pairs of 500 nm beads, the fine alignment procedure could be successfully applied if
the radius of the circle described by the trap was between 300 and 600 nm. In most
cases the best circularity was achieved with trap radius of 400-500 nm. In angular
feedback experiments, the radius of the circle at which the trapping laser was kept
was fixed at the value that gave the best circularity during the fine alignment.
3.4.2 Feedback control of Bead Pairs
Figure 3.7 shows the results of applying the angular feedback algorithm of Equation
3.3 to a bead pair that showed free RBM with a nearly circular QD signal: an
indicator of good alignment and a single point of attachment to the surface. Figure
3.7 A shows the angles of the trap θt (red) and bead-pair θbp (black) versus time
when the set-point angle θs was changed by 15◦. The standard deviation of bead-
pair angles at each set point was ∼2◦. Figure 3.7 B (top-left) shows the power-
spectra of θt (red) and θbp (black) when a bead pair is held at a fixed angle with the
same feedback parameters and laser power as in Figure 3.7 A. Figure 3.7 B (top-
right) shows the transient response to the change in set-point on an expanded time-
scale; illustrating that the system response time is ∼2 ms. Figure 3.7 B (bottom)
shows power-spectra and transient response with the same feedback parameters and
increased laser power. In this case the rise time is reduced to ∼1 ms. In both cases
the feedback is very stiff, approaching critical behaviour as indicated by the peak
in the power-spectra and damped oscillations in the step response. The frequency
at which the instability occurs is in agreement with expectations (∼ 14floop). The

3.4. Bead pair feedback algorithms and experiments 104
differences between θt and θbp when the set-point is not changing are evidence of
imperfect alignment between the trapping laser and the bead pair, which was found
to be very difficult to eliminate.
3.4.3 Angular Trap Stiffness
Figure 3.8 A shows θt (red) and θbp (black) vs time as the trap is moved in a circle
in 10◦ steps without feedback. Bead-pairs were attached to F1 molecules (Methods
2.5.), but pairs that exhibited free RBM when not trapped were selected. (Such
non-rotating pairs were very common in F1 rotation assays, they probably represent
either damaged F1 molecules or freely rotating F1 molecules where only one of the
3 his-tags is attached to the surface.) ‘Flat’ bead-pairs, those with angles close
to φ ∼90◦ (Figure 3.6 A; Figure 3.6 B, right) were selected, for reasons discussed
in Chapter 6. Angles are averages over 40 successive rotations lasting a total of
15 s. The relaxation time of the system was calculated, ζθ
kθ(where kθ is the torsional
stiffness of the trap and ζθ is the rotational viscous drag coefficient of the bead-
pair) from an exponential fit of the response to each step (inset, lower) at each
angle. Analysis of the free RBM between steps provides an estimate of kθ (the
equipartition method was used, 12kθ〈∆θ2
bp〉 = 12kBT ). The rotational viscous drag
coefficient of the bead pair attached to the surface is not known, therefore the power
spectrum method cannot be used. Figure 3.8 B shows kθ
ζθvs θbp for 3 bead pairs on
HRP surface, obtained from the step response (Figure 3.8 A, inset). Figure 3.8 C
shows kθ vs θbp, obtained using the equipartition method, for the same bead pair as
in Figure 3.8 B (black ), and two other bead pairs on a silane surface. Figure 3.8 D
shows kθ versus laser power, for several bead pairs held at 45◦. Trap stiffness is linear
with laser power for all bead pairs, but the slope (dkθ
dP, where P is laser power) varies
from pair to pair. The different shapes of the curves for kθ
ζθand kθ most probably
reflect angular dependence of ζbp, which is often observed for the flagellar motor as

3.4. Bead pair feedback algorithms and experiments 105
Figure 3.7: Control of bead-pair angle. (A) The angular feedback algorithm of Equation3.3 was applied to bead-pairs that showed free RBM. Angles of the trap, θt, and bead-pair,θbp, are shown in red and black, respectively. The set-point angle θs was switched from45◦ to 60◦. Trapping laser power was 18 mW and radius 0.3 µm (resulting in a minimumangular movement of the trapping laser of ∼ 2◦). Feedback parameters are Kp = 0.8 andKi = 0.2. The mean bead-pair angles and standard deviations are (44.5±2.4)◦ , (59.3±2.2)◦
for θs = 45◦, 60◦. Bead-pair angle and trap angle were passed through a low-pass secondorder Chebyshev filter before display, with fpass= 450 Hz. (B) Top left: Power-spectraof θt (red) and θbp (black) for a bead-pair held at a fixed angle with the same feedbackparameters and laser power as in (A), and bottom left: with laser power increased to85 mW. Top right: θt (red) and θbp (black) versus time showing the response to a changeof a set-point, for 18 mW laser power. System response time is ∼2 ms. Bottom right:with 85 mW laser power the system response time is reduced to ∼1 ms.

3.4. Bead pair feedback algorithms and experiments 106
a variation in the speed of an un-trapped motor with angle [267]. Possible sources
of angular variation and variation between bead-pairs are discussed in Chapter 6.
Many questions can be answered by comparing relative motor torque under different
conditions. However, if an accurate measurement of absolute torque is required it
will be necessary to calibrate the angular trap stiffness for each bead pair after
inactivating the motor at the end of each experiment [260]. A calibration procedure
was developed and presented here, which can be completed in a few second and
implemented as part of experimental protocol.

3.4. Bead pair feedback algorithms and experiments 107
Figure 3.8: Calibration of the angular trap stiffness for 500 nm non-rotating bead-pairsattached to F1 molecules. (A) Bead pair angle, θbp (black), and trap angle, θt (red), vstime for a bead-pair in a trap moving in 10◦ steps without feedback. Angles are averagesover 40 successive rotations. (inset) Step-response, with exponential fit. (B) The ratio ofangular trap stiffness to rotational viscous drag coefficient, derived from the time constantsin the fits in (A) as described in the text, vs angle, for 3 bead-pairs on HRP (black) andsilane surface (blue) (Chapter 2.5.). (C) Angular trap stiffness vs angle for the bead-pairin black in (B) (black) and two additional bead-pairs (green) on a silane surface. (D) Trapstiffness at 45◦ vs laser power for several bead-pairs on a BSA surface (Chapter 2.5.). Datawere sampled at 10 kHz, laser power in (A-D) was 30 mW and the trap was kept on acircle of radius 420 nm. Bead-pairs with φ∼ 90◦ which performed free rotational Brownianmotion without the trap were chosen for all calibration experiments. Error bars in B andC are standard errors obtained by averaging values obtained from two adjacent angles.

Chapter 4
BACTERIAL FLAGELLAR
MOTOR
108
4.1. Overview 109
4.1 Overview
In this chapter the ‘angle clamp’ system is applied to the bacterial flagellar motor
(being able to stall the bfm with feedback is potentially useful for observation of
stepping behaviour of the motor).
I have also found that with my system, a 500 nm bead-pair on the bfm can be
rotated at speeds of up to ∼600 Hz, promising to be useful for investigations of the
motor torque-speed curve∗. Below I give the preliminary results of this method.
There is one more optical trapping system available in our group. This uses a
1064 nm laser wavelength for bfp detection∗. Since my system uses a 632 nm laser
wavelength for bfp detection it ‘sees’ better, allowing us to detect rotation of smaller
beads attached to the bfm (500 nm, 300 nm, 200 nm in diameter). I give a brief
example of the data obtained by other members of Dr. R.M. Berry’s group with a
short explanation of the information learned from it.
CONTRIBUTIONS AND COLLABORATIONS: The system presented in this thesis was ini-
tially designed for experiments on the F1 motor. However the experimental protocols for F1
purification and rotation assay preparation needed to be investigated and established. Apart from
a few preliminary experiments on F1 (obtained and purified by Prof. M. Futai’s group) done by
Dr. R.M. Berry, no previous research has been done on F1 in this lab. Therefore I decided to
test the performance of the system on a biological motor familiar to our group, prior to spending
a substantial amount of time and work on starting the research on F1. This reasoning was also
influenced by the fact that at the stage in my research when the feedback system was ready to go
(∼2 years after I started) I was eager for some biology and was interested in learning more about
the bfm, having been the only person in the group not working on it.
∗as an alternative to electrorotation. Tania Saxl, in this lab, has put and still is putting asubstantial effort into electrorotation experiments
∗This system is used for electrorotation experiments as well, together with a few other ongoingprojects like, for example, using a polarized laser light to apply torque to a birefringent particle.

4.2. Feedback on the bacterial flagellar motor 110
This has led to the initial feedback experiments done on the bfm as well as to the research into
the switching mechanism of the bfm, which was started together with Fan Bai. The initial data
was obtained by Fan Bai and I. Fan Bai subsequently continued this work and obtained additional
data, and Dan Nicolau (D. Phil. student in the Department of Mathematics, University of Oxford)
contributed to the theoretical modelling. Recently Richard Branch (DTC student working on an 8
week project prior to commencement of his D. Phil in our group) contributed to the experiments
and theoretical modelling by looking at the interval time distributions of CW and CCW interval
times.
Apart from Fan Bai and Richard Branch, Chien-Jung Lo and Dr. Yoshiyuki Sowa, in this lab,
use the system and QuView programs I wrote for detection of small beads attached to a sodium
driven E. coli flagellar motor. My contribution to their work is restricted to building the system
and showing them how to use it.
4.2 Feedback on the bacterial flagellar motor
Preliminary experiments in which the stall torque of the bacterial flagellar motor
was monitored demonstrate the use of the feedback system on a rotary molecular
motor. Figure 4.1 demonstrates that a bead-pair is necessary to control the flagellar
motor with an optical trap. Figure 4.1 A shows the x - and y- position and power
spectrum obtained from a 500 nm bead attached to a flagellar filament, with no
optical trap. The speed of the bead obtained from the power spectrum [173] is
∼60 Hz (inset). Figure 4.1 B shows the same signals with the bead held stationary
at a point on the original orbit by independent x - and y-axis feedback using the
algorithm of Equation 3.10, as illustrated in Figure 3.4. The motion of the bead
was severely constrained compared to the original circular orbit, but the peak in
the power spectrum indicates that the motor and bead are still rotating. This is
possible because the hook can flex in such a way as to allow the filament stub to
describe a cone, tangent to the bead with its apex at the motor, as illustrated in
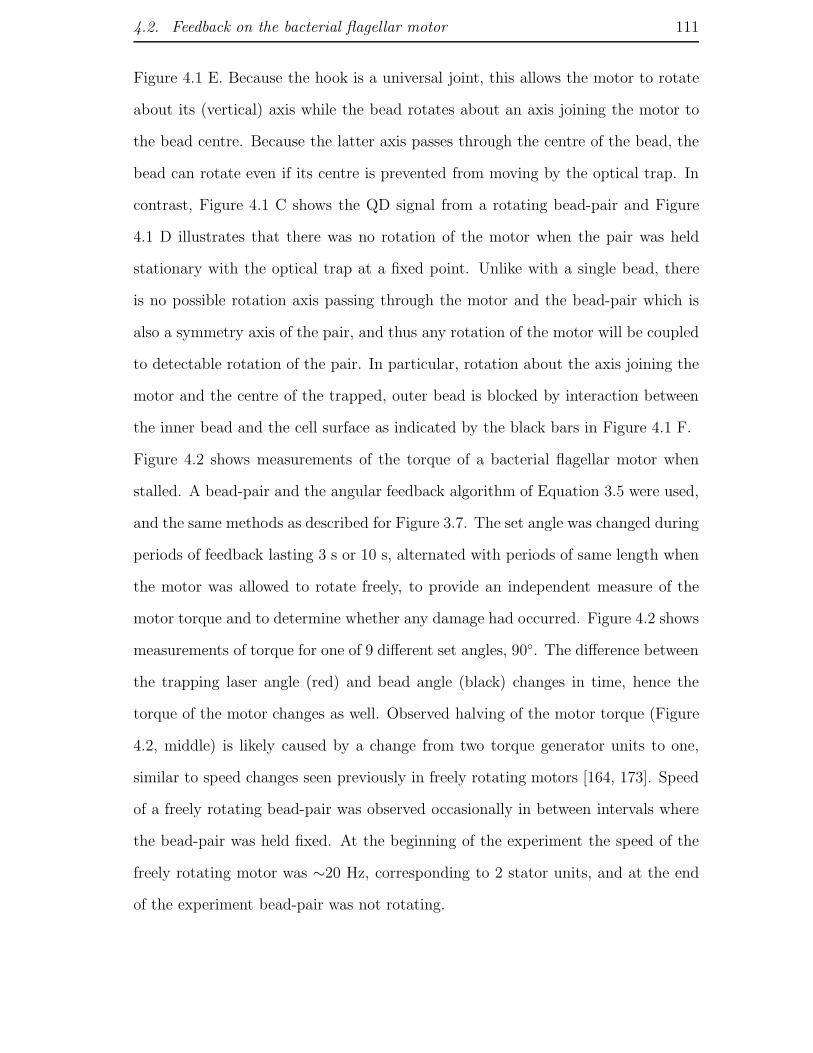
4.2. Feedback on the bacterial flagellar motor 111
Figure 4.1 E. Because the hook is a universal joint, this allows the motor to rotate
about its (vertical) axis while the bead rotates about an axis joining the motor to
the bead centre. Because the latter axis passes through the centre of the bead, the
bead can rotate even if its centre is prevented from moving by the optical trap. In
contrast, Figure 4.1 C shows the QD signal from a rotating bead-pair and Figure
4.1 D illustrates that there was no rotation of the motor when the pair was held
stationary with the optical trap at a fixed point. Unlike with a single bead, there
is no possible rotation axis passing through the motor and the bead-pair which is
also a symmetry axis of the pair, and thus any rotation of the motor will be coupled
to detectable rotation of the pair. In particular, rotation about the axis joining the
motor and the centre of the trapped, outer bead is blocked by interaction between
the inner bead and the cell surface as indicated by the black bars in Figure 4.1 F.
Figure 4.2 shows measurements of the torque of a bacterial flagellar motor when
stalled. A bead-pair and the angular feedback algorithm of Equation 3.5 were used,
and the same methods as described for Figure 3.7. The set angle was changed during
periods of feedback lasting 3 s or 10 s, alternated with periods of same length when
the motor was allowed to rotate freely, to provide an independent measure of the
motor torque and to determine whether any damage had occurred. Figure 4.2 shows
measurements of torque for one of 9 different set angles, 90◦. The difference between
the trapping laser angle (red) and bead angle (black) changes in time, hence the
torque of the motor changes as well. Observed halving of the motor torque (Figure
4.2, middle) is likely caused by a change from two torque generator units to one,
similar to speed changes seen previously in freely rotating motors [164, 173]. Speed
of a freely rotating bead-pair was observed occasionally in between intervals where
the bead-pair was held fixed. At the beginning of the experiment the speed of the
freely rotating motor was ∼20 Hz, corresponding to 2 stator units, and at the end
of the experiment bead-pair was not rotating.
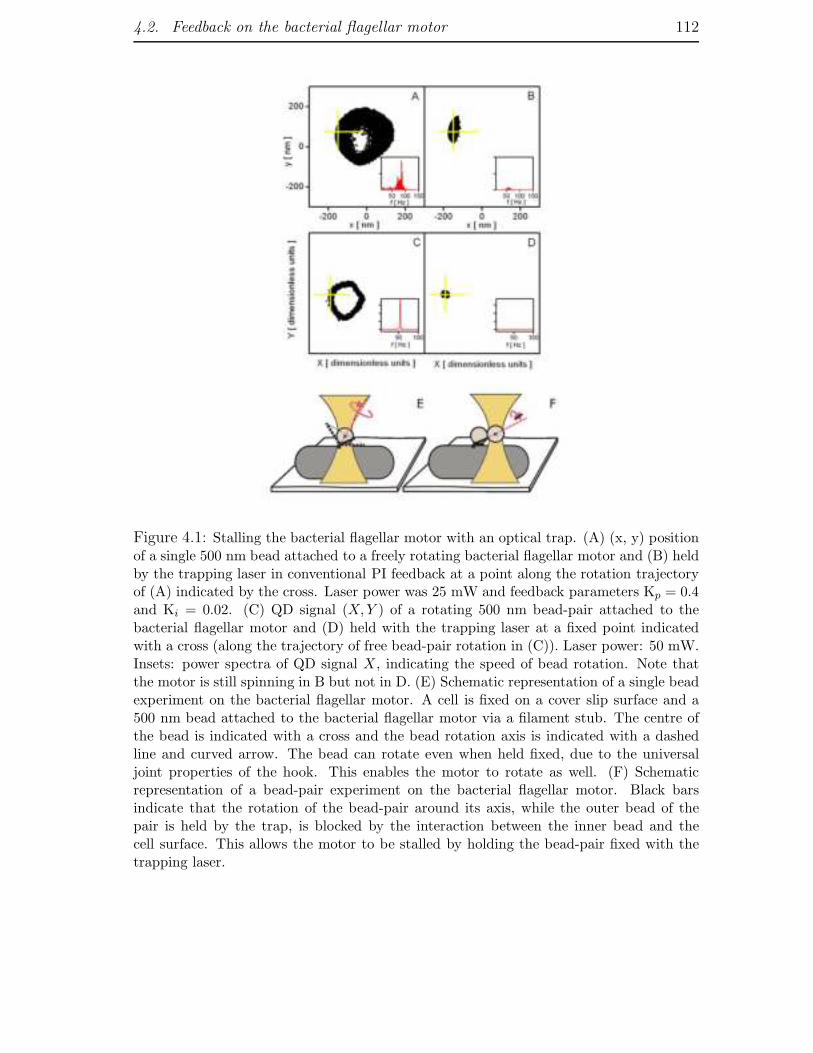
4.2. Feedback on the bacterial flagellar motor 112
Figure 4.1: Stalling the bacterial flagellar motor with an optical trap. (A) (x, y) positionof a single 500 nm bead attached to a freely rotating bacterial flagellar motor and (B) heldby the trapping laser in conventional PI feedback at a point along the rotation trajectoryof (A) indicated by the cross. Laser power was 25 mW and feedback parameters Kp = 0.4and Ki = 0.02. (C) QD signal (X,Y ) of a rotating 500 nm bead-pair attached to thebacterial flagellar motor and (D) held with the trapping laser at a fixed point indicatedwith a cross (along the trajectory of free bead-pair rotation in (C)). Laser power: 50 mW.Insets: power spectra of QD signal X, indicating the speed of bead rotation. Note thatthe motor is still spinning in B but not in D. (E) Schematic representation of a single beadexperiment on the bacterial flagellar motor. A cell is fixed on a cover slip surface and a500 nm bead attached to the bacterial flagellar motor via a filament stub. The centre ofthe bead is indicated with a cross and the bead rotation axis is indicated with a dashedline and curved arrow. The bead can rotate even when held fixed, due to the universaljoint properties of the hook. This enables the motor to rotate as well. (F) Schematicrepresentation of a bead-pair experiment on the bacterial flagellar motor. Black barsindicate that the rotation of the bead-pair around its axis, while the outer bead of thepair is held by the trap, is blocked by the interaction between the inner bead and thecell surface. This allows the motor to be stalled by holding the bead-pair fixed with thetrapping laser.

4.2. Feedback on the bacterial flagellar motor 113
This particular bead-pair was not calibrated, so an accurate estimate of the stall
torque cannot be given. If a trap stiffness typical of the laser power, bead-pair
size and radius of the circle at which the trapping laser was kept in Fig. 7 B is
assumed, kθ = 841pNnmrad−2 ± 100% , one can estimate the stall torque Tstall =
kθ〈θbp − θt〉 = 240pNnm ± 100% which is consistent with the value of 150 pNnm
estimated by other methods [171].
Figure 4.2: θbp (black) and θt (red) for a 500 nm bead-pair attached to the bfm withthe feedback algorithm of Equation 3.10 used to hold θbp=90◦. The difference betweentrap angle and bead-pair angle corresponds to the bacterial flagellar motor torque. Datais interpreted as showing a motor initially with 2 stator units losing first one and laterboth units, such that the torque goes from 2−→ 1 −→ 0 times the torque of a single unit.Feedback parameters Kp = 0.8 and Ki = 0.1, radius of the trapping laser = 420 nm, laserpower = 29 mW.
4.2.1 Control of the speed of the bacterial flagellar motor
Figure 4.3 shows the QD signal and speeds of a bead pair attached to a bacterial
flagellar motor, made to rotate at speeds up to 425 Hz by moving the trapping laser
in a circle at a constant speed without feedback. As in the feedback experiment, the
motors were allowed to rotate freely between periods of forced rotation to determine
whether any damage had occurred. The experiment was stopped when rotation of
the free motor was no longer observed.
Figures 4.2 and 4.3 indicate that damage is a significant obstacle for experiments

4.2. Feedback on the bacterial flagellar motor 114
were torque is applied to the bfm via an optical trap, and it needs to be reduced
or avoided. Several ideas on how to reduce the encountered damage are discussed
in Chapter 6. Both experiments, Figure 4.2 and 4.3, were performed at detection
and trapping laser powers where no significant laser induced photodamage occurs,
therefore most of the observed damage is expected to be mechanical [252].
Figure 4.3: Control of the bfm rotation speed with an optical trap. Trapping laser wasrotated at different speeds and applied to bfm motor via a bead-pair handle. Speeds of theexternally rotated motor are shown in black. The trap radius was changed from 0.6 µmto 0.3 µm during the experiment and the laser power was 65 mW. The motor was rotatedtwice at each speed for 1 s, and allowed to rotate freely in between. Speeds of free rotatingmotor are shown in red. Inset right: close-up of free rotating motor speeds. The reductionin speed is stepwise suggesting a change in the number of stator units present in the order3, 2, 1, 0. Inset left- The QD (X,Y ) signal for the rotating bead-pair at different speeds.

4.3. Collaborations with other group members using the optical trap 115
4.3 Collaborations with other group members us-
ing the optical trap
4.3.1 Switching
The 1-D Ising model presented in Chapter 1.2 gives a possible mechanism of the
bacterial flagellar motor switching. It can also explains pausing and slowdowns in
motor rotation observed in previous experiments [187]. Initial data obtained in the
system presented in this thesis with 500 nm, 350 nm and 200 nm beads on the wild
type strain KAF84, who’s motors switch direction, showed significant amount of
pausing and slowdowns. In addition, (X, Y ) traces of the bead rotation showed that
the trajectory of the rotation stays the same in both directions not only during the
rotation in a given direction after the switch, but also during the switch (as shown in
Figure 4.4, Inset). This is an important feature for analysis of the motor switching
(in particular for analysis of the time it takes for a motor to switch from rotating
in one direction to the opposite direction) as it suggests that the time of the motor
switch is not likely due to the universal joint properties of the hook. The switch
time was defined as the time the motor stoppes having been rotating in CCW/CW
direction, before it continues rotating in the CW/CCW direction. A stop is defined
as an event where the motor speed is 0 Hz with the error margine given by the
standard deviation in speed obtained from the records of continues CCW and CW
rotation. The speed of the motor during the switch is calculated from (X, Y ) trace by
running window method. To further verify that the switch time is not instantaneous
event, Fan Bai looked at the position of the longer and shorter switches on (X, Y )
trajectory. This allowed him to compare them with the speed fluctuations within one
rotation. He found that the longer switches happen on faster as well as slower parts
of the (X, Y ) trajectory confirming that they are not likely due to the universal joint
properties of the hook or to the bead sticking to the cell and the surfaces at certain
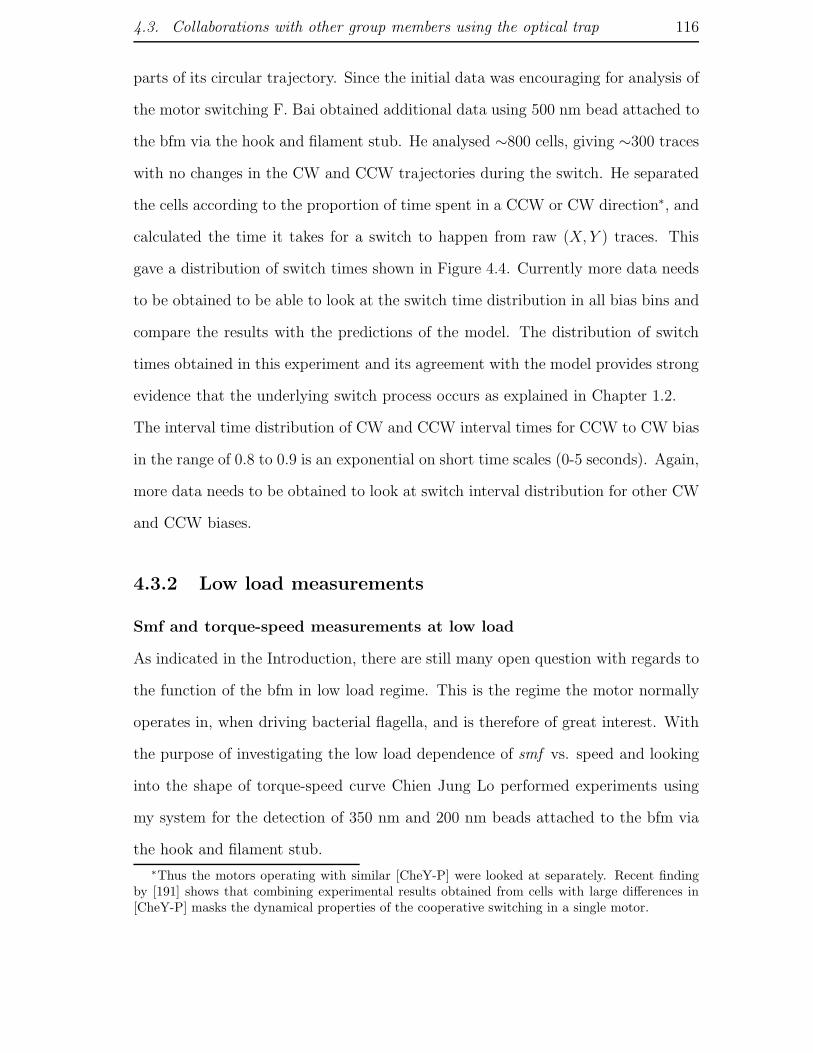
4.3. Collaborations with other group members using the optical trap 116
parts of its circular trajectory. Since the initial data was encouraging for analysis of
the motor switching F. Bai obtained additional data using 500 nm bead attached to
the bfm via the hook and filament stub. He analysed ∼800 cells, giving ∼300 traces
with no changes in the CW and CCW trajectories during the switch. He separated
the cells according to the proportion of time spent in a CCW or CW direction∗, and
calculated the time it takes for a switch to happen from raw (X, Y ) traces. This
gave a distribution of switch times shown in Figure 4.4. Currently more data needs
to be obtained to be able to look at the switch time distribution in all bias bins and
compare the results with the predictions of the model. The distribution of switch
times obtained in this experiment and its agreement with the model provides strong
evidence that the underlying switch process occurs as explained in Chapter 1.2.
The interval time distribution of CW and CCW interval times for CCW to CW bias
in the range of 0.8 to 0.9 is an exponential on short time scales (0-5 seconds). Again,
more data needs to be obtained to look at switch interval distribution for other CW
and CCW biases.
4.3.2 Low load measurements
Smf and torque-speed measurements at low load
As indicated in the Introduction, there are still many open question with regards to
the function of the bfm in low load regime. This is the regime the motor normally
operates in, when driving bacterial flagella, and is therefore of great interest. With
the purpose of investigating the low load dependence of smf vs. speed and looking
into the shape of torque-speed curve Chien Jung Lo performed experiments using
my system for the detection of 350 nm and 200 nm beads attached to the bfm via
the hook and filament stub.
∗Thus the motors operating with similar [CheY-P] were looked at separately. Recent findingby [191] shows that combining experimental results obtained from cells with large differences in[CheY-P] masks the dynamical properties of the cooperative switching in a single motor.
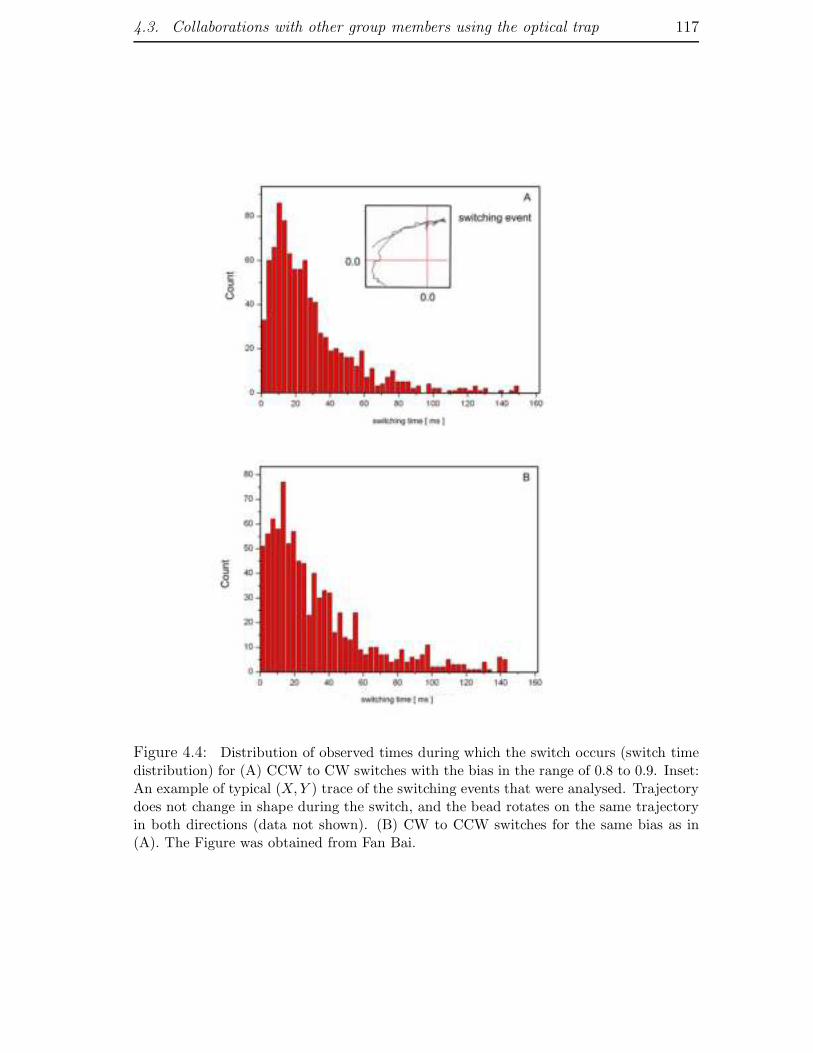
4.3. Collaborations with other group members using the optical trap 117
Figure 4.4: Distribution of observed times during which the switch occurs (switch timedistribution) for (A) CCW to CW switches with the bias in the range of 0.8 to 0.9. Inset:An example of typical (X,Y ) trace of the switching events that were analysed. Trajectorydoes not change in shape during the switch, and the bead rotates on the same trajectoryin both directions (data not shown). (B) CW to CCW switches for the same bias as in(A). The Figure was obtained from Fan Bai.
4.3. Collaborations with other group members using the optical trap 118
An example of the signal obtained with a 200 nm bead is given in Figure 4.5 A.
From the power spectral density shown in Figure 4.5 B the speed of the motor was
∼600 Hz. C. J. Lo was able to obtain speeds of up to 800 Hz. However, the image
of a 200 nm bead attached to the bfm in the bright field microscope is very small,
and the speed of its rotation is very high thus lowering the yield of the assay and
making it more difficult to obtain large enough data set of fast rotating 200 nm
beads. In addition, when using beads of this size the drag coefficient of the sheared
filament starts to significantly contribute to the overall drag coefficient (the size of
the filament varies from cell to cell), affecting the accuracy of torque estimates. To
increase the viscosity of the medium and thus overcome this problem C.H. Lo uses
Ficoll [174, 268]. Once a fast rotating 200 nm bead is found, Ficoll of different
concentrations is flowed through. The viscosity of the medium is appropriately
increased, thus effectively increasing the load of a 200 nm bead. The procedure
calibrates the shape of the torque-speed curve obtained with 200 nm beads.
Speeds of the motor, with a 200 nm and 350 nm beads attached, were obtained
for different ∆ψ and pNa values and initial data suggest that the contributions of
pNa and membrane potential in low load regime are not equivalent. If membrane
potential is changed for each different external sodium concentration the slope of
the speed and smf linear relationship will change. Further work will give additional
new and interesting information.
Steps
Apart from investigating the relationship between the bfm power source and torque
in the low load regime, independent control of ∆ψ and pNa will enable C.H. Lo to
achieve stable motor rotation at low speed required for detection of motor stepping
and precisely determine the number of stator units present. This is important in
order to be able to determine whether the number of steps changes with the number
of torque generating units. Analyses of motor fluctuations suggest that indeed the

4.3. Collaborations with other group members using the optical trap 119
Figure 4.5: (A) An example of the trace obtained from 200 nm bead attached to the bfmvia the hook and the filament stub. (B) Power spectral density (z = X + iY ), indicatingmotor rotation is ∼600 Hz. The Figure was obtained from C. J. Lo.
number of steps increases with the number of torque generating units [180, 181].
This result is consistent with high duty ratio experiments, suggesting not only that
the torque generating units are independent of each other but also that each remains
connected to the rotor most of the time. However, these analyses were done based
on the signal obtained from tethered cells, in the high load regime. The answer to
the question of step number with two or more stator units present should tell us
a lot in terms of the way the motor converts chemical energy into rotation. High
temporal and angular resolution of the system described in this thesis allows C.J. Lo
and Dr. Y. Sowa to observe steps at low motor speeds with 350 nm bead attached
to the motor via the hook and the filament stub. An example of the trace thus
obtained is given in Figure 4.6. The steps are clearly visible and the outcome of a
step-finding routine is indicated with a red line. The motor speed in this experiment
is stable, allowing C.J. Lo to precisely determine the number of stator units present.
In the future this will enable him to answer the important question of relationship
between the number of stator units present and the number of steps in the motor

4.3. Collaborations with other group members using the optical trap 120
rotation.
Figure 4.6: Steps in bfm rotation (only one revolution is shown). A 350 nm bead wasattached to the motor via a filament stub. Motor rotation was ∼10 Hz. Approximately27 steps per revolution were detected with a Chung-Kennedy filter in single revolution(shown in red). The Figure was obtained from C.J. Lo.

Chapter 5
F1- ATPase
121
5.1. Overview 122
5.1 Overview
In this chapter a summary of results obtained with the ‘angle clamp’ applied to the
E.coli and yeast mitochondrial F1 motor is given.
Initial experiments focused on obtaining a rotation assay with high yield in satu-
rating [ATP] conditions using E.coli F1. This is a sensible starting point since the
rotation speed in this condition is several Hz for a 500 nm bead-pair. Upon ob-
taining a satisfactory protocol for rotation assay preparation, the ‘angle clamp’ was
applied to a rotating F1 molecule. The freely rotating motor was successfully stalled
and once released it continued rotating. The result was very encouraging and we
subsequently focused on obtaining steps in motor rotation. This would allow us to
relate the angle at which we stall the motor to the crystal structure of F1. Also, any
changes in stepping angles before and after applying the ‘angle clamp’ would be a
good indication that the motor’s attachment to the surface is not firm enough. The
results, encountered problems and conclusions are given below.
Apart from the E.coli F1 motor, yeast mitochondrial F1 was also investigated. The
rotation of this motor was observed for the first time. Although the motor charac-
teristics are expected to be similar to E.coli and the Thermophilic bacillus F1, an
experimental confirmation of this assumption and possible differences between these
motors are of interest.
5.2 E. coli F1-ATPase rotation assay and feed-
back experiments
In previous chapters, the ‘angle clamp’ system was described, and the performance
of the system demonstrated using a bead pair. The angular and temporal resolution
achieved is promising for experiments on F1. The system performance was also
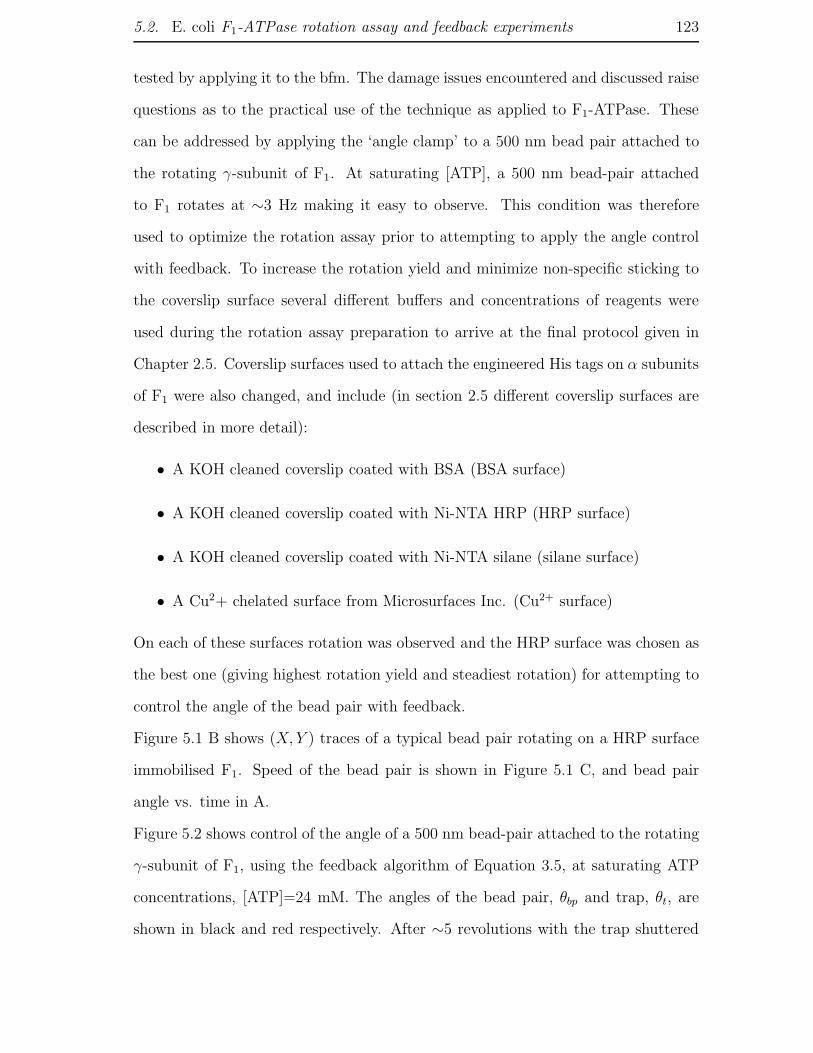
5.2. E. coli F1-ATPase rotation assay and feedback experiments 123
tested by applying it to the bfm. The damage issues encountered and discussed raise
questions as to the practical use of the technique as applied to F1-ATPase. These
can be addressed by applying the ‘angle clamp’ to a 500 nm bead pair attached to
the rotating γ-subunit of F1. At saturating [ATP], a 500 nm bead-pair attached
to F1 rotates at ∼3 Hz making it easy to observe. This condition was therefore
used to optimize the rotation assay prior to attempting to apply the angle control
with feedback. To increase the rotation yield and minimize non-specific sticking to
the coverslip surface several different buffers and concentrations of reagents were
used during the rotation assay preparation to arrive at the final protocol given in
Chapter 2.5. Coverslip surfaces used to attach the engineered His tags on α subunits
of F1 were also changed, and include (in section 2.5 different coverslip surfaces are
described in more detail):
• A KOH cleaned coverslip coated with BSA (BSA surface)
• A KOH cleaned coverslip coated with Ni-NTA HRP (HRP surface)
• A KOH cleaned coverslip coated with Ni-NTA silane (silane surface)
• A Cu2+ chelated surface from Microsurfaces Inc. (Cu2+ surface)
On each of these surfaces rotation was observed and the HRP surface was chosen as
the best one (giving highest rotation yield and steadiest rotation) for attempting to
control the angle of the bead pair with feedback.
Figure 5.1 B shows (X, Y ) traces of a typical bead pair rotating on a HRP surface
immobilised F1. Speed of the bead pair is shown in Figure 5.1 C, and bead pair
angle vs. time in A.
Figure 5.2 shows control of the angle of a 500 nm bead-pair attached to the rotating
γ-subunit of F1, using the feedback algorithm of Equation 3.5, at saturating ATP
concentrations, [ATP]=24 mM. The angles of the bead pair, θbp and trap, θt, are
shown in black and red respectively. After ∼5 revolutions with the trap shuttered

5.2. E. coli F1-ATPase rotation assay and feedback experiments 124
Figure 5.1: E. coli F1 rotation. (A) Angle of the 500 nm bead pair attached to the γ-subunit of F1 vs. time. (B) QD signal (X, Y) of a rotating bead-pair. (C) Power spectrumof QD signal X, showing the speed of the rotating bead-pair to be ∼ 3Hz.
and the motor rotating freely, the shutter is opened and the motor stalled by a fixed
trap at θt = 90◦. Approximately 0.5 s later feedback is switched on for ∼2 s, with
a set-point of θt = 90◦, and then switched off again, leaving the trap at θt = 90◦.
Finally, the trap is shuttered and the motor starts rotating as before. This was

5.2. E. coli F1-ATPase rotation assay and feedback experiments 125
repeated 8 times for the bead shown and for 12 different bead pairs attached to
F1. Preliminary experiment described demonstrates that the angle of F1 can be
Figure 5.2: Bead pair angle, θbp (black), and the trap angle, θt (red), for a 500 nm bead-pair attached to the rotating γ-subunit of F1. The bead-pair rotated at the beginning andend of the record when the trap was shuttered. The feedback algorithm of Equation 3.5was used to hold θbp = 90◦ in the middle of the record. At other times, the bead-pair washeld in the trap with no feedback. Feedback parameters Kp = 0.8 and Ki = 0.2, radius ofthe trapping laser = 480 nm, laser power = 31 mW.
controlled with high accuracy and time-resolution, and that the procedure does not
appear to damage the motor.
This particular bead-pair was not calibrated, so an accurate estimate of the stall
torque cannot be given. If the trap stiffness is estimated using the Equiparti-
tion of Energy and the signal of the stalled motor without feedback, one gets
kθ = 438 ± 116 pNnm rad−2 and a stall torque of Tstall = kθ〈θbp−θt〉 = 74±20 pNnm.
This is higher than the values of 40 pNnm and 57 pNnm estimated by other methods
[91, 250], (perhaps because the stiffness of the intact F1 adds to the trap stiffness
leading to an over-estimate of the latter), but nevertheless promises that future ex-
periments with the calibration protocol performed for each bead pair as described in
Chapter 3.3 can provide both the relative torque changes as well as absolute torque
value.

5.2. E. coli F1-ATPase rotation assay and feedback experiments 126
There are several other requirements, however, that need to be met, in order to
be able to gain detailed information about the working mechanism of F1 with the
‘angle clamp’ experiments demonstrated above, these are:
• F1 needs to be attached firmly to the surface with all available His-tags. This
is required because the signature of His tags coming on and off, or F1 sliding
along the surface will be seen in the feedback signal and can mask the motor
mechanics.
• The orientation of F1 on the surface is determined randomly. It would be ben-
eficial to observe steps during F1 rotation, and thus relate the angle at which
the motor was held with feedback to the structure of F1 (i.e. to the [ATP] de-
pendent stepping angles). Also, the position of the steps in the rotation of the
free motor, prior to and after applying the feedback, is useful for determining
whether any sliding, or uncoupling of His tags of the surface happened during
the experiment.
With the above in mind, [ATP] was lowered to 600 nM, 200 nM, 100 nM and 60 nM.
At these [ATP] rotation was observed in a total of 41 F1 molecules on HRP, silane,
BSA and Cu2+ surfaces. Clear steps were observed only in one F1 molecule shown
in Figure 5.3. After several rotations, the protein paused and resumed rotation in
∼30 s. 120◦ steps were visible again (Figure 5.3 C), however the position of the
steps changed (dotted lines in C show where the position of the steps would be if
the motor continued stepping as before the pause, Figure 5.3 B). The shift in the
position of the steps after the pause suggests that one or more of the His tags de-
tached and re-attached from the surface, after which the motor resumed rotation.
It is possible that this kind of behaviour is frequent and is the reason why clear
steps were observed in only one motor protein. Figure 5.4 shows control of the angle
of a 500 nm bead-pair attached to the rotating γ-subunit of F1 as in Figure 5.2
except at 200 nM ATP. The angles of the bead pair (θbp) and trap (θt) are shown

5.2. E. coli F1-ATPase rotation assay and feedback experiments 127
Figure 5.3: Steps in E.coli F1 rotation, [ATP] = 200 nM. (A) Revolutions of F1, with a500 nm bead-pair attached to the rotating γ -subunit, vs. time. (B) Close-up of the first10 seconds of the rotation shown in (A). Dotted lines indicate 1
3 of a rotation. Inset: QD(X,Y ) signal for the rotating bead-pair in first 10 seconds with clearly visible 120◦ steps(the signal was sampled with 10 kHz, for display in the inset every 20th point is shown.)(C) Close-up of the last 10 seconds of motor rotation. Dotted lines indicate the positionof the 1
3 of one rotation continued from (B). Steps are again visible but the position of thesteps has clearly changed after the ∼30 s pause visible in (A).
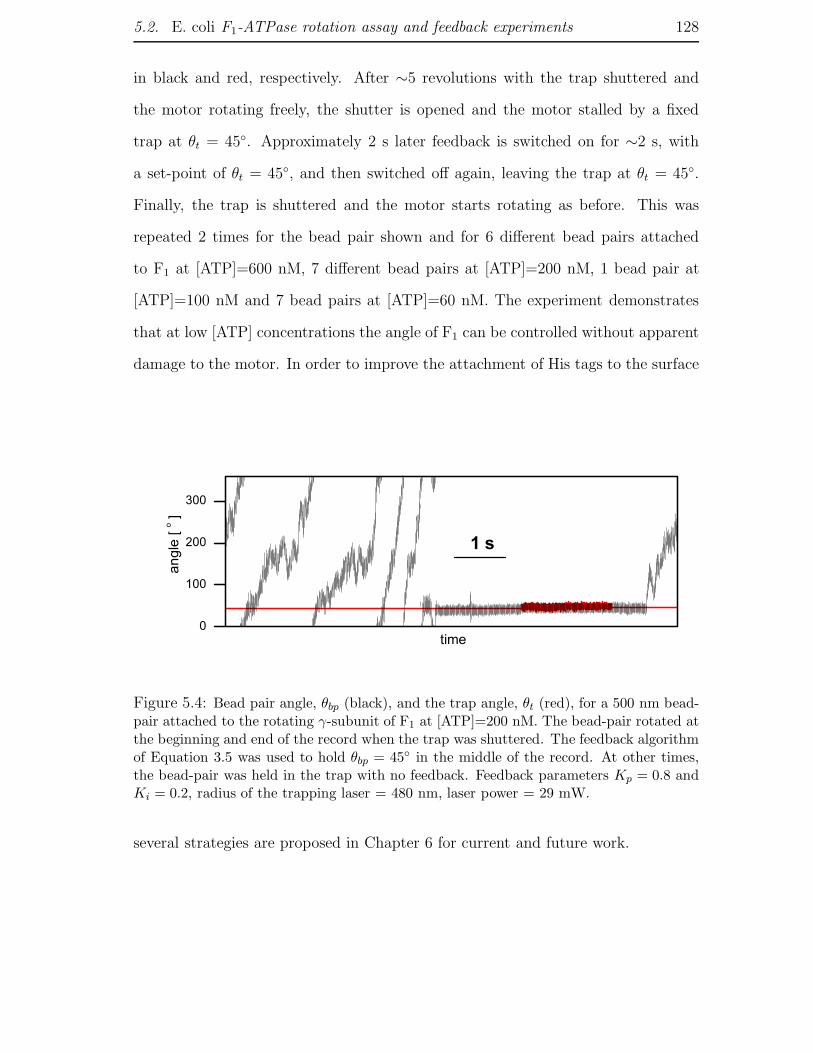
5.2. E. coli F1-ATPase rotation assay and feedback experiments 128
in black and red, respectively. After ∼5 revolutions with the trap shuttered and
the motor rotating freely, the shutter is opened and the motor stalled by a fixed
trap at θt = 45◦. Approximately 2 s later feedback is switched on for ∼2 s, with
a set-point of θt = 45◦, and then switched off again, leaving the trap at θt = 45◦.
Finally, the trap is shuttered and the motor starts rotating as before. This was
repeated 2 times for the bead pair shown and for 6 different bead pairs attached
to F1 at [ATP]=600 nM, 7 different bead pairs at [ATP]=200 nM, 1 bead pair at
[ATP]=100 nM and 7 bead pairs at [ATP]=60 nM. The experiment demonstrates
that at low [ATP] concentrations the angle of F1 can be controlled without apparent
damage to the motor. In order to improve the attachment of His tags to the surface
Figure 5.4: Bead pair angle, θbp (black), and the trap angle, θt (red), for a 500 nm bead-pair attached to the rotating γ-subunit of F1 at [ATP]=200 nM. The bead-pair rotated atthe beginning and end of the record when the trap was shuttered. The feedback algorithmof Equation 3.5 was used to hold θbp = 45◦ in the middle of the record. At other times,the bead-pair was held in the trap with no feedback. Feedback parameters Kp = 0.8 andKi = 0.2, radius of the trapping laser = 480 nm, laser power = 29 mW.
several strategies are proposed in Chapter 6 for current and future work.

5.3. Yeast F1-ATPase rotation assay 129
5.3 Yeast F1-ATPase rotation assay
Rotation of yeast mitochondrial F1 has so far not been reported. It is likely that the
rotation characteristics will be similar to E. coli and Thermophilic bacillus F1, but
the experimental confirmation of this assumption is missing. It may also reveal some
interesting characteristics due to structural differences of yeast F1 compared to E.
coli and Thermophilic bacillus. Several crystal structure of mitochondrial F1 have
been solved, thus the function of the F1 system can be studied by genetic, biochem-
ical, x-ray crystallographic and single molecule methods. The yeast F1 was isolated
from yeast mitochondria and genetically modified to incorporate a Cys mutation
in the γ subunit, and a His tag on each of the β subunits, by Prof. David Mueller
(The Chicago Medical School, USA). Observation of rotation at high and low load,
as well as characterization of steps in yeast F1 rotation will lay the ground work
for further studies using specific mutants. These would be engineered in Prof. D.
Mueller’s group, and would be used to answer the following questions: How does
the gamma subunit cause the energy transduction step? How does the binding of
nucleotides affect the conformation of the active site?
The rotation of yeast F1 at saturating [ATP]=24 mM was observed on a BSA sur-
face with a bead pair attached to the γ subunit as the rotation marker. Figure 5.5
B shows (X, Y ) traces of a typical bead pair rotating on yeast mitochondrial F1 as
in Figure 5.1. The speed of the bead pair is shown in Figure 5.5 C, and bead pair
angle vs. time in Figure 5.5 A. The speed of this bead-pair on yeast mitochondrial
F1 is slightly higher than the E.coli F1 rotation shown in Figure 5.1.
The ‘angle clamp’ was applied to yeast mitochondrial F1 at saturating [ATP] in
the same manner as for E.coli F1 in Figure 5.2. Figure 5.6 shows control of the angle
of a 500 nm bead-pair attached to the rotating γ-subunit of F1, using the feedback
algorithm of Equation 3.5 (as in Figures 5.2 and 5.4). The angle of the bead-pair,

5.3. Yeast F1-ATPase rotation assay 130
Figure 5.5: Yeast F1 rotation. (A) Angle of the 500 nm bead pair attached to the γ-subunit of yeast F1 vs. time. (B) QD signal (X,Y ) of a rotating bead-pair. (C) Powerspectrum of QD signal X showing the speed of the rotating bead-pair to be ∼4 Hz.
θbp, is shown in black and the angle of the trap, θt, is shown in red. The motor was
rotating freely before the shutter is opened and the motor stalled by a fixed trap at
θt = 45◦. The feedback is subsequently switched on, with a set-point of θt = 45◦,
and then switched off again, leaving the trap at θt = 45◦ in (A) and at θt = 38◦

5.3. Yeast F1-ATPase rotation assay 131
in (B). Finally, the trap is shuttered and the motor starts rotating as before. The
experiment shows that no damage occurs during the ‘angle clamp’ experiment on
yeast mitochondrial F1 (Figure 5.6 A). Figure 5.6 B demonstrates the sort of ‘angle
clamp’ feedback behaviour one expects at 3 stepping angles of F1, that could give
information about the energy profile of the motor at those angles. However, looking
at the X and Y trace of the bead pair shown (inset, right) it is visible that the
radius was changing while the angle was controlled. This suggests that the changes
observed in the θt during the period when feedback was active may correspond to
motor mechanics or to the His-tags coming on and off the surface. This example
stresses the importance of firm attachment of F1 by the His tags to the coverslip
surface (further discussed in Chapter 6).

5.3. Yeast F1-ATPase rotation assay 132
Figure 5.6: (A) Bead-pair angle, θbp (black), and the trap angle, θt (red), for a 500 nmbead-pair attached to the rotating γ-subunit of yeast F1 at saturating [ATP]=24 mM. Thebead-pair rotated at the beginning and end of the record when the trap was shuttered.The feedback algorithm of Equation 3.5 was used to hold θbp = 45◦ in the middle of therecord. At other times, the bead-pair was held in the trap with no feedback. Feedbackparameters Kp = 0.8 and Ki = 0.2, radius of the trapping laser = 360 nm, laser power= 30 mW. (B) As in (A). Left inset shows a close-up of the θbp and θt trace. Right insetshows X and Y trace, obtained from the QD, of the bead-pair for the same section shownin the inset on the left. The feedback trace corresponds to what one might expect for3 steps with 120◦ rotation per step at low [ATP]. However, the radius of the bead pairchanges thus it is possible that the trace corresponds to the His-tags on F1 detaching andre-ataching of the surface.

Chapter 6
DISCUSSION, CONCLUSIONS
AND FUTURE WORK
133

134
A novel system for the study of rotary molecular motors has been reported in
this thesis. A polystyrene bead duplex has been used as a handle to apply external
torque to rotary molecular motors with an optical trap designed to act as an ‘angle
clamp’. This technique achieves high temporal and angular resolution as well as
great flexibility in control. Comparison of the ‘angle clamp’ performance with other
available systems (discussed in Chapter 1.3) is given in Table 6.1.
As well as presenting the design, construction and calibration details of the ‘an-
gle clamp’, application of the system to the two rotary molecular motors has been
presented. In the case of E.coli F1, the purification protocol has been set up and the
rotation assay protocols investigated. Collaborative work on yeast mitochondrial F1
has also been started. It has been shown that stalling F1 with the ‘angle clamp’
does not damage the motor, and that the attachment of F1 to the surface presents
the biggest problem for these kinds of experiment. Several steps are planned to
overcome this problem (some are in fact on going rather than future work) and are
given towards the end of this chapter.
The performance of the system was demonstrated on the bfm as well. The mechani-
cal damage appeared to be the biggest problem. In the experiment where the motor
speed was controlled, for most of the cells observed, significant damage occurred
during the fine alignment procedure. This was indicated by a reduction in the speed
of the free motor. The time it takes for fine alignment varies from cell to cell, but
it is usually on the order of 1 min. In cases where the trajectory of the bead pair
attached to the motor was almost circular the fine alignment procedure may not be
necessary and might be omitted in the future. The torque exerted by the trap is
proportional to the difference between the trapping laser angle and the bead-pair
angle during forced rotation. If the problems of alignment and mechanical damage
can be solved, the method of Figure 4.3 will allow measurement of the torque-speed

135
relationship of the flagellar motor under a wide range of different conditions, es-
pecially when the motor is driven backwards or forwards up to and beyond the
zero-torque-speed regime which are not accessible without the application of exter-
nal torque. The technique places no special requirements on the conductivity of
the medium, allowing for example experiments in the relatively high ionic strengths
that are suitable for study of sodium-driven flagellar motors.
Finally, when the system is used for detection, it offers high spatial and temporal
resolution and was used for experiments on sodium driven bacterial flagellar mo-
tor, and a switching proton driven bacterial flagellar motor, giving several valuable
experimental results. The switch time distribution obtained gives strong evidence
that the switching event does not occur instantaneously and can be explained by
the 1-D Ising model.
The interval time distribution obtained by R. Branch for CCW to CW bias in the
range of 0.8 to 0.9 suggest an exponential. This is interesting with respect to the re-
sult obtained by Korobkova et al. [191], which shows that the probability density of
switch time intervals is gamma distributed. The reasons for this discrepancy could
be one of the following: (1) The [CheY-P] was not controlled by the chemotaxis net-
work in Korobkova et al. experiment; instead a mutant with stably pre-expressed
CheY** from an inducible vector was used. If the switching behaviour of the wild
type motor and the mutant are different, the wild type behaviour is of greater rele-
vance for in vivo function. (2) Korobkova et al. used 500 nm beads but did not shear
the filaments in their rotation assay and report that their motors never stop rotating
and exhibit only CW and CCW rotational states. It is possible that non-sheared
filaments introduce filtering in an unpredictable manner (the length of the filament
varies), causing them to miss slowdowns and pausing events. (3) The sampling rate
they used was 100 Hz giving them 10 ms resolution.
To investigate which of the possibilities given above causes us to observe a differ-
136
ent interval distribution, we plan to degrade our data according to the suspected
filtering present in the Korobkova et al. experiment. Also, more data needs to be
obtained in order to investigate the interval time distribution for all CW and CCW
biases. Finally we plan to obtain the data with the mutant carrying a plasmid with
IPTG inducible CheY** for comparison to the wild type data∗.
Experiments where 200 nm beads were attached to the motor allowed C. J. Lo to
observe that in the low load regime ∆pNa and ∆ψ contributions to the smf are not
equivalent. These experiments have also allowed him to determine the torque-speed
curve for a chimearic motor in low load regime. Using 350 nm beads enabled C. J.
Lo and Dr. Y. Sowa to observe steps in motor rotation under controlled conditions
(known pNa, ∆ψ and stable rotation at given speed), a good indication of the num-
ber of stator units present.
As seen in Table 6.1 the calibration of bead-pair stiffness needed to obtain ab-
solute torque values in this optical trap has proven to be the most difficult problem
(section 3.4.3). There are several sources of angular and bead pairs variations re-
ported in this thesis. To explain and understand these variations, I look at the
torque (T) exerted on a motor via a bead pair in a linearly polarized optical trap
This can be written as
Ttrap = Tlever + Tshape + Tpolarization (6.1)
where Tlever is the combined effect of the linear force on the bead-pair and the
reaction force at the motor, Tshape is the alignment effect of a non-spherical trap
on a non-spherical particle, and Tpolarization is a torque acting to align the long axis
of the bead pair with the polarization vector of the laser beam. Referring to Figure
∗I am currently working on obtaining this mutant with Dr. George Wadhams in Prof. J. Ar-mitage’s group

137
3.6 A, reproduced below in Figure 6.1, to define x, y and z axes, one can expect
Tshape = (0, Ty,shape, 0), as single-beam optical traps are typically extended in the z
direction and particles align with their long axes parallel to the optical axis of the
trap [234, 235, 236], and Tlever = (0, 0,−klever(θbp−θt)). When a bead-pair attached
Figure 6.1: Schematic diagram of a bead-pair attached to a surface by a motor at x =y = z = 0 and held by the optical trap
to a molecular motor is held in feedback, the trap torque will balance the torque
due to the bead-motor-surface link: Ttrap = Tlink. Considering the z-components:
Tz,link = −klever(θbp − θt) + Tz,polarization = −kθ(θbp − θt) (6.2)
In an ideal system, Tz,link would be dominated by the motor torque which is being
investigated, klever would be a constant, and Tz,polarization would negligible, in which
case kθ would also be a constant. In this case
Tmotor = −kθ(θbp − θt) = −klever(θbp − θt) (6.3)

138
In practice, however, Tz,link and kθ may vary with θbp for the following reasons.
(1) klever will vary with angle due to variations in laser intensity at different trap
positions, differences between trap stiffness in x and y, and misalignment of each
bead pair leading to different lengths of lever arm at different angles.
(2) Tz,polarization is expected to have a period of 180◦ in θbp; however, theoretical
predictions show that higher periodicities might be possible depending on the shape
and size of the particle [269, 270].
(3) The most likely contributor to Tz,link, other than Tmotor is direct interaction be-
tween the bead-pair and the surface, in parallel with the linkage via the motor. The
angular dependence of this interaction is impossible to predict, and may vary from
bead to bead, and may depend upon Ty. Minimizing Ty by selecting “flat-rotating
propeller” bead-pairs (as discussed below) is expected to minimize this effect, and
the observation of bead-pairs performing free RBM indicates that Tz,link is negligi-
ble for many bead pairs in the absence of any trap torque. Regardless of the exact
causes of angular variation in trap torque, the measurements of Chapter 3.4 indicate
that variation is considerable and not predictable, and that trap stiffness must be
calibrated for each bead-pair if absolute torques is to be measured. There are two
reasons to minimize the alignment torque, Ty. As well as the possible affect on Tz,link
discussed above, Ty will be balanced by an opposing force that consists of a verti-
cal force acting on the motor multiplied by the lever-arm between the motor and a
point of contact between the bead and the surface. The lever arm is likely to be very
short, on the order of the size of the motor, and thus the force on the motor may
be large even for relatively small Ty. Ty consists of Ty,shape and Ty,polarization, both of
which depend upon the angle φ (Figure 3.6 A). As this angle increases, bead-pairs
change from vertically stacked beads, φ = 0◦, to flat-rotating propellers, φ = 90◦,
and the radius of the circle described by the center of the outer bead increases from
zero to the bead diameter (Figure 3.6 B). At φ = 90◦ a bead pair is in an unstable

139
equilibrium and Ty = 0 [235, 269, 270]), which is the reason for choosing flat-rotating
propellers in ‘angle clamp’ experiments. For bead pairs attached to the bfm or F1,
these are common. The height of a single 500 nm bead can be judged by eye with
an accuracy of ∼30 nm, corresponding to ∼3◦ in φ. The accuracy in determining φ
may be improved since the image of the two adjacent beads is compared (Figure 3.6
B). Others have estimated Ty =∼300 pNnm at φ = 87◦ for chloroplasts of radius
500 nm and length 2 µm (in a 1064 nm laser trap at 30 mW laser power, [235]). Ty
is expected to be on the order of tens of pN nm or less in the ‘angle clamp’ exper-
iments. As well as the vertical force opposing Ty and the lateral force completing
the couple Tlever, the motor may experience a radial force pulling the bead pair
towards the centre of the trap. In these experiments, the trap moves at a radius
similar to the bead diameter, and therefore a small radial force is expected, but
whatever the actual values of the vertical and horizontal forces on the motor, the
immediate resumption of spinning when the trap is shuttered illustrated in Figures
5.2, 5.4 and 5.6 demonstrates that they are small enough not to damage F1.
As mentioned previously the attachment of F1 to the surface presents the biggest
problem for obtaining the detailed information on the motor’s energy profile. The
following steps are either on going work or are planned to overcome this problem:
(1) A silane surface has proved to be the optimal in reports by other researchers
[109, 111], but the surface quality can vary from preparation to preparation (personal
communication with Dr. Y. Sowa and Prof. H. Noji∗). Only 4 proteins were observed
rotating at lower [ATP] (200 nM) on a silane surface and the traces obtained showed
no stepping. This is probably due to the detachment and re-attachment of His tags,
but it is also a possible indication that the surface was not adequately prepared.
New protocols for silane surface preparation have been obtained from H. Hosokawa
∗Personal communication with Dr. R. Berry

140
and Dr. Y. Sowa which include several improvements. The first obvious step is to
observe more low [ATP] rotation on silane surfaces prepared in this manner.
(2) The second step planned for future work is based on the assumption that His
tag detachment is the primary cause for the lack of steps in the motor rotation.
The dissociation rate of 6-His tags from Ni-NTA is ∼1 s−1 [271, 272]. On the other
hand the dissociation rates of bis-NTA, tris-NTA and tetrakis-NTA are significantly
smaller: -0.01 s−1, 0.005 s−1 and 0.01 s−1 respectively. Bis, tris and tetrakis-NTA
are engineered to have two, three or four binding sites for His tags. If instead of
a 6-His tag, a 10-His tag is used, the time constants improve further: 0.005 s−1,
0.0005 s−1 and 0.005 s−1 for bis, tris and tetrakis-NTA, respectively [271]. The
higher dissociation time constant for tetrakis-NTA is attributed by the authors in
[271] to its topology (as shown in Figure 6.2 A). Using a 10-His tag linker on α
subunits and a coverslip surface covered with tris-NTA should significantly improve
the attachment of F1 to the surface. 10-His is currently constructed by Hiroyuki
Hosokawa in the group of Prof. M. Futai. For functionalizing the coverslip surface
with tris-NTA, DNA will be used as a linker. Currently tris-NTA is constructed by
Wei-Ming Ho in collaboration with Dr. Achillefs Kapanidis, Clarendon Laboratory,
University of Oxford. Using tris-NTA on DNA allows the option of constructing
specific 2-D DNA structures, suitable for attaching 10-His tags on F1 and further
increasing the rotation yield. A starting point would be an already constructed
structure by Dr. John Malo [273] as shown in Figure 6.2 B. Attaching DNA arrays
to the coverslip as well as further developing arrays of adequate base lattice and
size would be carried out in collaboration with Dr. J. Malo working in Prof. An-
drew Turberfield group, Clarendon Laboratory, University of Oxford.
(3) Possible improvement in the detection of stepping motors could be achieved by
using smaller beads. So far a few experiments at high [ATP] were carried out using
smaller bead pairs (300 nm and 200 nm). Rotating enyzmes with 300 nm bead-pairs

141
Figure 6.2: (A) Chemical structure of the carboxyfluorescein-conjugated chelator heads isshown. Figure is taken from [271]. Mono, bis, tris and tetrakis-NTA heads are indicated.These need to be constructed on a DNA molecule and consequently assembled in a 2-Darray as shown in (B). (B) is taken from [273] and [274].
attached were recently observed by Thomas Bilyard but no rotating enzymes were
observed with 200 nm bead-pairs.

142
To conclude I would like to mention a few ideas and possible directions for fu-
ture research opened by the work done as part of this thesis. The model given in
section 1.2.2 for the bacterial flagellar motor suggest that the soft elastic linkage
between the motor and the viscous load used to observe the rotation is the reason
behind the shape of the torque-speed curve (Figure 1.9). It would be interesting to
be able to confirm this by stiffening the hook. The hook stiffness can be measured
with the system presented in this thesis. Further more the response time of the
bead attached to the motor via bacterial flagellar motor hook can be increased by
increasing the hook stiffness, facilitating observation of steps in the presence of two
or more stator units, together with the step dwell times and backward steps. Also,
if it is possible to increase hook stiffness, controlling the angle of the bead pair with
feedback can give information on the energy profile of the motor at a given angle.
Finally, mechanism of switching can be further explored by increasing the response
time of the switch time observation by holding the bead-pair at a certain angle with
the ‘angle clamp’ feedback.
Since the system can be used to obtain detailed information on the working
mechanism of the F1-ATPase, some other unanswered questions can be addressed
as well. For example, hydrolysis seems to be insensitive, while F1 synthesis coupling
efficiency is sensitive to the presence of ǫ subunit. How does the energy profile of the
protein with and without ǫ subunit vary with angle? Is it different to the hydrolysis
direction, and if so, in what way?
As well as F1 purification, F1Fo purification was learned as part of the 2003 visit
to Prof. M. Futai, Osaka University, Japan. It was adopted to suit the conditions
of the lab in Oxford and is given in Appendix C. In Chapter 1, I have given an
introduction to the Fo motor and research carried out on it. Controlling the voltage

143
across the membrane containing an Fo motor is certainly a challenge, but since little
is known about this motor the challenge is a very rewarding one. Since F1Fo has been
successfully purified, the future research of F1Fo and Fo motor in this lab is possible.

144
System Characteristics and Advan-tages
Disadvantages
‘Angle Clamp’ up to 1◦ angular resolution;up to 2◦ angular control pre-cision; angle control with 1-2 ms time resolution; up to1 kHz rotation rates; flexibilityof implementing feedback algo-rithms; clocked output signals
Each individual bead pairneeds to be calibrated at theend of the experiment for abso-lute torque measurements; thetorque is applied on the motorin form of linear force to thebead pair resulting in observ-able mechanical damage to thebfm
Magnetic tweez-ers
up to 5◦ angular control preci-sion, angle control with severalseconds time resolution
Calibration of the absolutetorque is complicated by thenon-uniform nature of mag-netic beads
Electrorotation up to 100 Hz rotation rates;the applied torque is preciselyknow; the torque is applied di-rectly to the cell body
Conductivity of the media isimportant placing a limit onthe salt concentrations of themedia used
Birefringent par-ticles
rotation rates of usually 10-20 Hz; the torque is applied di-rectly to the microscopic parti-cle
low rotation rates; the needof a birefringent particle (po-tential problems with attach-ing the particle to the motor)
Asymmetricallyshaped particles
rotation rates of typically fewHz; the torque is applied di-rectly to the microscopic par-ticle
low rotation rates
Absorbing parti-cles
rotation rates of few Hz; thetorque is applied directly tothe microscopic particle
low rotation rates; heat ab-sorption
Rotation withinoptical tweezers
rotation rates of few Hz, greatflexibility of control
low rotation rates; complicatedsetups
Microfabricatedchiral scatteringparticles
rotation rates of few Hz, excit-ing to watch
low rotation rates; need forspecially manufactured parti-cles
Table 6.1: Performance of the system presented in this thesis compared to the otheravailable systems that allow external torque application.

Appendix A
An example of a QuVIEW
program
An example of a typical program written in QuVIEW is given in figure A.1. The
Figure A.1: A typical program written in QuVIEW. The program inputs 4 voltagescoming from the quadrant detector, calculates the right voltage level to be outputed (basedon the desired feedback scheme), checks whether it corresponds to the right frequencyrange, displays the position of the trapped object in dimensionless units and saves data.
145

146
‘INTn’ QuVIEW Virtual instrument (Vi) outside of the LabView continuous loop in
Figure A.1 initializes the DSP. Once the initialization was performed the sequence,
as shown in the LabView loop, is sent to the DSP by the host computer. The se-
quence is executed on the DSP even if the program shown is stopped in LabView.
The new sequence can be sent to the DSP and executed only after the DSP has
been re-initialized. All the blue icons in Figure A.1 represent QuVIEW Vis that are
executed only on the DSP. The blue and white Vis (for example; the first three Vis
in the LabView loop) communicate both with the DSP and the host computer and
are used to send the values of the user defined variables in LabView to the DSP. The
fourth Vi inside the LabView loop is the analog input Vi, and the fifth Vi is crucial
to set the timing on the DSP. The timing based on the board’s processor clock and
can be set as a counter with an ouput that indicates when the counter has reached
the desired value. The blue ‘PQ’ Vi in the second row is the Vi that enables the
display of inputed values on the host computer; it also enables saving of the data
on the DSP to the host computer (in a QuVIEW specific format). This Vi always
has to be the last in the sequence before the ‘Finish’ Vi. The order of the Vis is set
by the thick line (‘error’ line) coming in and out of the Vis and shown in pink.
For the purpose of feedback and detection experiments the following programs have
been written:
(1) Detection only programs. These programs input QD voltage, display and save
this voltage, and were used in section 4.3.
(2) Programs written for the purpose of calibrating the QD signal. These programs
move the AODs or the nanocube in a grid and save the output signal as well as the
inputed QD signal (used in section 3.3.1).
(3) Programs for the 2-D X and Y feedback used to control the piezo-electric stage.
These are the same programs as used in the section 3.3.3 but for the control of the
piezo-electric stage, not the AODs. They can be particularly useful when longer

147
detection experiments are needed and drift becomes a problem.
(4) Programs for the 2-D X and Y feedback used for the control of the AODs (see
section 3.3.3).
(5) Programs used to control the speed of the bacterial flagellar motor (used in sec-
tion 4.2.1).
(6) Programs used for the angular trap stiffness calibration (used in section 3.4.3).
(7) Programs for the ‘angle clamp’ feedback (used in section 3.4.2, 4.2 and Chapter
5).

Appendix B
Analog to digital converter
The analog to digital converter was designed and produced with the help of the
Central Electronics Workshop (Department of Physics, University of Oxford) for
the AODs’ driver (DDS), with 19 digital lines for control of both X and Y AOD.
This DDS had to be replaced after a fault was found (see section 2.1.3). The new
DDS was received by the manufacturer after the ADCs for the original DDS were
already produced by the Electronics Workshop.
Figure B.1 gives the arrangement of bits used to control the original DDS. For this
DDS the 25-pin connector coming out of the analog to digital converter corresponded
to the input 25-pin connector on the DDS. The replacement DDS was significantly
different, both in resolution and in the arrangements of the control bits on the 25-pin
output connector. The re-arrangement scheme for the new DDS is given in Figure
B.1 B. The re-arrangement was a much shorter but nevertheless satisfactory option;
the alternative would be designing and producing a new analog to digital converter
by the Central Electronic Workshop. Figures B.3 and B.2 give the layout of the
ADC.
148

149
Figure B.1: Bit arrangement. (A) As designed for the DDS driver with 19 digital controllines for both the X and Y AOD, and with ∼300 Hz resolution. Different bits on twoADCs are labeled. Used bits are indicated with red dots and black lines indicate unusedbits. Fixed bits are shown as well. The second line of 19 bits corresponds to the bits usedby the X or Y channel of the AODs driver. The first row corresponds to the pins on a 25pin connector (X or Y channel), which is the output of the analog to digital converter aswell as the input of the DDS. (B) As re-arranged for the DDS with 15 digital channels forboth X and Y control and with ∼15 kHz resolution. The output 25 pin connector on theADCs no longer corresponds to the 25 pin connector on the DDS. The layout of the newconnector is given in a second row. Fixed bits as well as 8 bits converted by the ADCs aregiven in two rows below. The bits marked in brackets are not used for the fastest feedbackprograms but are available when the speed of the program is not a primary concern andwhen a larger movement in both x and y-axis is required (see Chapter 2.1.3. for furtherdetails).

150
Figure B.2: Layout of the ADC board as designed by the Electornics Workshop, Depart-ment of Physics, University of Oxford.

151
Figure B.3: Base board of the ADC as designed by the Electronics Workshop, Departmentof Physics, University of Oxford.

Appendix C
F1Fo purification
E.coli F1Fo-ATPase purification is based on protocols obtained from Professor
Masamitsu Futai and is in principle very similar to the F1-ATPase purification pro-
tocols given in Chapter 2.4.
F1Fo, with six histidine residues introduced into c subunits and the transcarboxylase
biotin binding domain in the β subunit, was constructed in the pBMU13S-βTC/cHis
plasmid (modified from the pBWU13 plasmid [275]) in the DK8 bacterial strain [58].
The F1Fo was purified in four steps (each taking ∼ one day). First two steps involve
cell growth, with a cell pellet, usually of ∼1 g, as a result. At the end of the third
step, disrupted cells are collected as membrane fragments containing F1Fo as well
as other membrane proteins. During the fourth step F1Fo is separated from the
membrane by detergent and collected by glycerol gradient centrifugation.
(1) Step one is only slightly different from step one of F1 purification. The difference
is in the Tanaka medium which now containes 2 µM biotin. Since the F1Fo has a
transcarboxylase binding domain the biotinylation is now part of the growth step.
Step (2) and (3) are the same as with the F1 purification. Step (4.) is the one
with the most significant difference compared to the F1 purification protocol. The
152

153
suspension of membranes was diluted with Membrane Wash buffer (50 mM Tris-
HCl, pH=8 at 4◦C, 2 mM MgCl2, 10% clycerol, 0.5 mM EDTA, 1 mM DTT), ratio
10 mg of protein to 500 µl of Membrane wash buffer, and centrifuged for 20 min at
370 000 g average, at 4◦ C (rotor Type TLA 100.2 at 100 000 rpm in Optima TL
ultracentrifuge Beckman Coulter). The precipitate was suspended in 0.4 ml buffer
A (20 mM MES/Tris, pH=7 and 5 mM MgCl2) with 20 µl of 2 M KCl and 110 µl
10% C12E8 (final concnetrations 100 mM and 2% respectively) and incubated on ice
for 10 min. The suspension was then centrifuged for 1 hour at 180 000 g average, at
4◦ C (Type 70.1 TI rotor for 51 200 rpm in L-XP Beckman Coulter ultracentrifuge).
After centrifugation 917 µl of supernatant was layered to a glycerol gradient (pre-
pared in ultra centrifuge tubes by layering 30, 25, 20, 15 and 10 % (w/V)) glycerol
solution (in 10 mM MES/Tris pH=7.0, 5 mM MgCl2, 0.01% C12E8, 0.5 mM DTT,
5 µg/ml Leupeptin and 5 µg/ml Pepstatin A) and centrifuged for 5 hr at 250 000 g
average, at 4◦. (SW 55 Ti rotor, 51 300 rpm average, Optima L-XP Beckman Coul-
ter ultracentrifuge). After centrifugation the solution was fractioned. To determine
the peak fraction, the ATPase activity of fractions was checked. Peak fraction was
aliquoted and fast frozen for storage at -80◦ C.
Bibliography
[1] C Bustamante, D Keller, and G Oster, The physics of molecular motors, Ac-
counts of Chemical Research 34, 414–420 (2001).
[2] R M Berry, Theories of rotary motors, Philosophical Transactions of the Royal
Society B 355, 503–9 (2000).
[3] M Schliwa, editor. Molecular Motors, chapter 1: The Myosin Superfamiliy:
An Overview. Wiley-VCH, 2003.
[4] J R Sellers and C Viegel, Walking with myosin V, Current Opinion in Cell
Biology 18, 68–73 (2006).
[5] D M Warshaw, G G Kennedy, S S Work, E B Krementsova, S Beck, and
K M Trybus, Differential labeling of myosin V heads with quantum dots allows
direct visualization of hand-over-hand processivity, Biophysical Journal 88,
30–32 (2005).
[6] L S Churchman, Z Okten, R S Rock, J F Dawson, and J.A Spudich, Single
molecule high-resolution colocfalization of Cy3 and Cy5 attached to macro-
molecules measures intramolecular distance through time, Proceedings of Na-
tional Academy of Science U S A 102, 1419–1423 (2005).
[7] T Sakamoto, A Yildiz, P R Selvin, and J R Seller, Step size is determined by
neck length in myosin V, Biochemistry 44, 16210 (2005).
154

BIBLIOGRAPHY 155
[8] N Volkmann, H Liu, L Hazelwood, E B Krementsova, S Lowey, K M Try-
bus, and D Hanein, The structural basis of Myosin V processive movement as
relealed by electron cryomicroscopy, Molecular Cell 19, 595–605 (2005).
[9] C Veigel, F Wang, M L Bartoo, J R Sellers, and J E Molloy, The gated gait of
the precessive molecular motor myosin V, Nature Cell Biology 4, 59–65 (2002).
[10] E M De La Cruz, A L Wells, S S Rosenfeld, E M Ostap, and H L Sweeney, The
kinetic mechanism of myosin V, Proceedings of National Academy of Science
U S A 96, 13726–13731 (1999).
[11] A E Clemen, M Vilfan, J Jaud, J Zhang, M Barmann, and M Rief, Force-
dependent stepping kinetics of myosin-V, Biophysical Journal 88, 4402–4410
(2005).
[12] J E Baker, E B Krementsova, G G Kennedy, A Armstrong, K M Trybus, and
D M Warshaw, Myosin V processivity: multiple kinetic pathways for head-to-
head coordination, Proceedings of National Academy of Science U S A 101,
5542–5546 (2004).
[13] C Veigel, S Schmitz, F Wang, and J R Sellers, Load-dependent kinetics of
myosin-V can explain its high processivity, Nature Cell Biology 7, 861–869
(2005).
[14] M Schliwa, editor. Molecular Motors, chapter 2: Dynein Motors: Structure,
Mechanochenistry and Regulation. Wiley-VCH, 2003.
[15] S Block, C L Asbury, J W Shaevitz, and M J Lang, Probing the kinesin
reaction cycle with a 2D optical force clamp, Proceedings of National Academy
of Science U S A 100, 2351–2356 (2003).
[16] K Visscher, M J Schnitzer, and S M Block, Single kinesin molecules studied
with a molecular force clamp, Nature 400, 184–189 (1999).

BIBLIOGRAPHY 156
[17] M J Lang, C L Asbury, J W Shaevitz, and S M Block, An automated
two-dimensional optical force clamp for single molecule studies, Biophysical
Jorunal 83, 491–501 (2002).
[18] R A Cross, The kinetic mechanism of kinesin, Trends in Biochemical Sciences
29, 301–309 (2004).
[19] S P Gilbert and K A Johnson, Pre-steady-state kinetics of the microtubule-
kinesin ATPase, Biochemistry 33, 1951–1960 (1994).
[20] Y Z Ma and E W Taylor, Interacting head mechanism of microtubule-kinesin
ATPase, Journal of Biological Chemistry 272, 724–730 (1997).
[21] Y Z Ma and E W Taylor, Kinetic mechanism of a monomeric kinesin con-
struct, Journal of Biological Chemistry 272, 717–723 (1997).
[22] S S Rosenfeld, G M Jefferson, and P H King, ATP reorients the neck linker of
kinesin in two sequential steps, Journal of Biological Chemistry 276, 40167–
40174 (2001).
[23] S Uemura and S Ishiwata, Loading direction regulates the affinity of ADP for
kinesin, Nature Structural and Molecular Biology 10, 308–311 (2003).
[24] M J Schnitzer and S M Block, Kinesin hydrolyses one ATP per 8-nm step,
Nature 388, 386–390 (1997).
[25] F J Kull and S A Endow, Kinesin: switch I and II and the motor mechanism,
Journal of Cell Science 115, 15–23 (2002).
[26] L M Klumpp, A Hoenger, and S P Gilbert, Kinesin’s second step, Proceedings
of National Academy of Science U S A 101, 3444–3449 (2004).

BIBLIOGRAPHY 157
[27] S S Rosenfeld, P M Fordyce, G M Jefferson, P H King, and S M Block,
Stepping and stretching. How kinesin uses internal strain to walk processively,
Journal of Biological Chemistry 278, 18550–18556 (2003).
[28] I Crevel, N Carter, M Schliwa, and R Cross, Coupled chemical and mechanical
reaction steps in a processive Neurospora kinesin, EMBO Journal 18, 5863–
5872 (1999).
[29] K Kaseda, H Higuchi, and K Hirose, Alternate fast and slow stepping of a
heterodimeric kinesin molecule, Nature Molecular Cell Biology 5, 1079–1082
(2003).
[30] C L Asbury, A N Fehr, and S M Block, Kinesin moves by an asymmetric
hand-over-hand mechanism, Science 302, 2130–2134 (2003).
[31] M Schliwa, editor. Molecular Motors, chapter 3: Kinesin Superfamily Pro-
teins. Wiley-VCH, 2003.
[32] Z Wang, S Khan, and M P Sheetz, Single cytoplasmic dynein molecule move-
ments: characterization and comparison with kinesin, Biophysical Journal 69,
2011–2023 (1995).
[33] R D Vale and Y Y Toyoshima, Rotation and translocation of microtubules in
vitro induced by dyneins from tetrahymena cilia, Cell 52, 459–469 (1988).
[34] O Kagami and R Kamiya, Translocation and rotation of microtubules caused by
multiple species of Chlamydomonas inner-arm dynein, Journal of Cell Science
103, 653–664 (1992).
[35] K Oiwa and H Sakakibara, Recent progress in dynein structure and mechanism,
Current Opinion in Cell Biology 17, 98–103 (2005).

BIBLIOGRAPHY 158
[36] S A Burgess, M L Walker, H Sakakibara, P J Knight, and K Oiwa, Dynein
structure and power stroke, Nature 421, 715–718 (2003).
[37] S A Burgess, M L Walker, H Sakakibara, K Oiwa, and P J Knight, The struc-
ture of dynein-c by negative stain electron microscopy, Journal of Structural
Biology 146, 205–216 (2004).
[38] M A Gee, J E Heuser, and R B Vallee, An extended microtubule-binding struc-
ture within the dynein motor domain, Nature 390, 636–639 (1997).
[39] N Mizuno, S Toba, M Edamatsu, J Watai-Nishii, N Hirokawa, Y Y Toyoshima,
and M Kikkawa, Dynein and kinesin share an overlapping microtubule-binding
site, EMBO Journal 23, 2459–2467 (2004).
[40] T Kon, M Nishiura, R Ohkura, Y Y Toyoshima, and K Sutoh, Distinct func-
tions of nucleotide-binding/hydrolysis sites in the four AAA modules of cyto-
plasmic dynein, Biochemistry 43, 11266–11274 (2004).
[41] A Silvanovich, M G Li, M Serr, S Mische, and T S Hays, The third P-loop
domain in cytoplasmic dynein heavy chain is essential for dynein motor func-
tion and ATP-sensitive microtubule binding, Molecular Biology of the Cell 14,
1355–1365 (2003).
[42] M Samso and M P Koonce, 25 Angstrom resolution structure of a cytoplas-
mic dynein motor reveals a seven-member planar ring, Journal of Molecular
Biology 340, 1059–1072 (2004).
[43] C Shingyoji, H Higuchi, M Yoshimura, E Katayama, and T Yanagida, Dynein
arms are oscillating force generators, Nature 393, 711–714 (1998).
[44] H Sakakibara, H Kojima, Y Sakai, E Katayama, and K Oiwa, Inner-arm
dynein c of Chlamydomonas flagella is a single-headed processive motor, Na-
ture 400, 586–590 (1999).

BIBLIOGRAPHY 159
[45] E Hirakawa, H Higuchi, and Y Y Toyoshima, Processive movement of single
22S dynein molecules occurs only at low ATP concentrations, Proceedings of
National Academy of Science U S A 97, 2533–2537 (2000).
[46] C B Lindemann and A J Hunt, Does axonemal dynein push, pull, or oscillate?,
Cell Motility and the Cytoskeleton 56, 237–244 (2003).
[47] S Toba, T M Watanabe, L Yamaguchi-Okimoto, Y Y Toyoshima, and
H Higuchi, Overlapping hand-over-hand mechanism of single molecular motil-
ity of cytoplasmic dynein, Proceedings of National Academy of Science U S A
103, 5741–5745 (2006).
[48] M Schliwa, editor. Molecular Motors, chapter 6: RNA and DNA Poly-
merases. Wiley-VCH, 2003.
[49] M D Wang, M J Schnitzer, H Yin, R Landick, J Gelles, and S M Block, Force
and velocity measured for single molecules of rna polymerase, Science 282,
902–907 (1998).
[50] H Yin, M D Wang, K Svoboda, R Landick, S M Block, and J Gelles, Tran-
scription against an applied force., Science 270, 1653–1656 (1995).
[51] G J Wuite, S B Smith, M Young, D Keller, and C Bustamante, Single-molecule
studies of the effect of template tension on T7 DNA polymerase activity, Na-
ture 404, 103–106 (2000).
[52] M Schliwa, editor. Molecular Motors, chapter 7: Helicases as Molecular
Motors. Wiley-VCH, 2003.
[53] M Yoshida, E Muneyuki, and T Hisabori, ATP synthase-a marvellous rotary
engine of the cell, Nature Molecular Cell Biology 2, 669–77 (2001).

BIBLIOGRAPHY 160
[54] H Noji, R Yasuda, M Yoshida, and K Jr Kinosita, Direct observation of the
rotation of F1-ATPase, Nature 386, 299–302 (1997).
[55] H Kanazawa, K Mabuchi, T Kayano, T Noumi, T Sekiya, and M Futai, Nu-
cleotide sequence of the genes for F0 components of the proton-translocating
ATPase from Escherichia coli: prediction of the primary structure of Fo sub-
units, Biochemical and Biophysical Research Communications 103, 604–612
(1981).
[56] J E Walker, I M Fearnley, N J Gay, B W Gibson, F D Northrop, S J Powell,
M J Runswick, M Saraste, and V L Tybulewicz, Primary structure and subunit
stoichiometry of F1-ATPase from bovine mitochondria, Journal of Molecular
Biology 184, 677–701 (1985).
[57] G S Hudson, J G Mason, T A Holton, B Koller, G B Cox, P R Whitfeld, and
W Bottomley, A gene cluster in the spinach and pea chloroplast genomes en-
coding one CF1 and three CF0 subunits of the H+-ATP synthase complex and
the ribosomal protein S2, Journal of Molecular Biology 196, 283–98 (1987).
[58] K Nishio, A Iwamoto-Kihara, A Yamamoto, Y Wada, and M Futai, Subunit
rotation of ATP synthase embedded in membranes: a or beta subunit rotation
relative to the c subunit ring, Proceedings of National Academy of Science U
S A 99, 13448–13452 (2002).
[59] J Xing, J C Liao, and G Oster, Making ATP, Proceedings of National Academy
of Science U S A 102, 16539–16546 (2005).
[60] J P Abrahams, A G Leslie, R Lutter, and J E Walker, Structure at 2.8 A
resolution of F1-ATPase from bovine heart mitochondria, Nature 370, 621–8
(1994).
BIBLIOGRAPHY 161
[61] R Yasuda, T Masaike, K Adachi, H Noji, H Itoh, and K Kinosita, The ATP-
waiting conformation of rotating F1-ATPase revealed by single-pair fluores-
cence resonance energy transfer, Proceedings of National Academy of Science
U S A 100, 9314–9318 (2003).
[62] C Gibbons, M G Montgomery, A G Leslie, and J E Walker, The structure of
the central stalk in bovine F(1)-ATPase at 2.4 A resolution, Nature Structural
Biology 7, 1055–61 (2000).
[63] R I Menz, J E Walker, and A G Leslie, Structure of bovine mitochondrial
F(1)-ATPase with nucleotide bound to all three catalytic sites: implications
for the mechanism of rotary catalysis, Cell 106, 331–41 (2001).
[64] R Kagawa, M G Montgomery, K Braig, A G W Leslie, and J E Walker,
The structure of bovine F1-ATPase inhibited by ADP and beryllium fluoride,
EMBO Journal 23, 2734–44 (2004).
[65] K Braig, R I Menz, M G Montgomery, A G Leslie, and J E Walker, Structure of
bovine mitochondrial F(1)-ATPase inhibited by Mg(2+) ADP and aluminium
fluoride, Structure 8, 567–73 (2000).
[66] R I Menz, A G Leslie, and J E Walker, The structure and nucleotide occupancy
of bovine mitochondrial F(1)-ATPase are not influenced by crystallisation at
high concentrations of nucleotide, FEBS Letters 494, 11–4 (2001).
[67] M J van Raaij, J P Abrahams, A G Leslie, and J E Walker, The structure
of bovine F1-ATPase complexed with the antibiotic inhibitor aurovertin B,
Proceedings of the National Academy of Sciences of the U S A 93, 6913–7
(1996).
[68] J P Abrahams, S K Buchanan, M J Van Raaij, I M Fearnley, A G Leslie, and
J E Walker, The structure of bovine F1-ATPase complexed with the peptide

BIBLIOGRAPHY 162
antibiotic efrapeptin, Proceedings of the National Academy of Sciences of the
U S A 93, 9420–4 (1996).
[69] E Cabezon, M G Montgomery, A G W Leslie, and J E Walker, The struc-
ture of bovine F1-ATPase in complex with its regulatory protein IF1, Nature
Structural Biology 10, 744–50 (2003).
[70] J R Gledhill and J E Walker, Inhibition sites in F1-ATPase from bovine heart
mitochondria, Biochemical Journal 386, 591–8 (2005).
[71] Y Shirakihara, A G Leslie, J P Abrahams, J E Walker, T Ueda, Y Sekimoto,
M Kambara, K Saika, Y Kagawa, and M Yoshida, The crystal structure of the
nucleotide-free alpha 3 beta 3 subcomplex of F1-ATPase from the thermophilic
Bacillus PS3 is a symmetric trimer, Structure 5, 825–36 (1997).
[72] S Wilkens and R A Capaldi, Electron microscopic evidence of two stalks link-
ing the F1 and F0 parts of the escherichia coli ATP synthase, Biochimica et
Biophysica Acta 1365, 93–7 (1998).
[73] R A Capaldi, B Schulenberg, J Murray, and R Aggeler, Cross-linking and
electron microscopy studies of the structure and functioning of the Escherichia
coli ATP synthase, The Journal of Experimental Biology 203, 29–33 (2000).
[74] S Wilkens, J Zhou, R Nakayama, S D Dunn, and R A Capaldi, Localization
of the delta subunit in the Escherichia coli F(1)F(0)-ATPsynthase by immuno
electron microscopy: the delta subunit binds on top of the F(1), Journal of
Molecular Biology 295, 387–91 (2000).
[75] A C Hausrath, R A Capaldi, and B W Matthews, The conformation of the
epsilon- and gamma-subunits within the Escherichia coli F(1) ATPase, Journal
of Biological Chemistry 276, 47227–47232 (2001).

BIBLIOGRAPHY 163
[76] T Meier, P Polzer, K Diederichs, W Welte, and P Dimroth, Structure of the
rotor ring of F-Type Na+-ATPase from ilyobacter tartaricus, Science 308,
659–662 (2005).
[77] R J Carbajo, F A Kellas, M J Runswick, M G Montgomery, J E Walker, and
D Neuhaus, Structure of the F1-binding domain of the stator of bovine F1Fo-
ATPase and how it binds an alpha-subunit, Journal of Molecular Biology 351,
824–38 (2005).
[78] R J Carbajo, J A Silvester, M J Runswick, J E Walker, and D Neuhaus,
Solution structure of subunit F(6) from the peripheral stalk region of ATP
synthase from bovine heart mitochondria, Journal of Molecular Biology 342,
593–603 (2004).
[79] V K Dickson, J A Silvester, I M Fearnley, A G W Leslie, and J E Walker, On
the structure of the stator of the mitochondrial ATP synthase, EMBO Journal
25, 2911–8 (2006).
[80] S Wilkens, S D Dunn, J Chandler, F W Dahlquist, and R A Capaldi, So-
lution structure of the N-terminal domain of the delta subunit of the E. coli
ATPsynthase, Nature Structural and Molecular Biology 4, 198–201 (1997).
[81] O Dmitriev, P C Jones, W Jiang, and R H Fillingame, Structure of the mem-
brane domain of subunit b of the Escherichia coli F0F1 ATP synthase, The
Journal of Biological Chemistry 274, 15598–15604 (1999).
[82] P A Del Rizzo, Y Bi, S D Dunn, and B H Shilton, The “second stalk” of
Escherichia coli ATP synthase: structure of the isolated dimerization domain,
Biochemistry 41, 6875–84 (2002).
[83] J L Rubinstein, J E Walker, and R Henderson, Structure of the mitochon-

BIBLIOGRAPHY 164
drial ATP synthase by electron cryomicroscopy, EMBO Journal 22, 61826192
(2003).
[84] B E Schwem and R H Fillingame, Cross-linking between helices within subunit
a of Escherichia coli ATP synthase defines the transmembrane packing of a
four helix bundle, Journal of Biological Chemistry 281, 37861–7 (2006).
[85] Y Kato-Yamada, H Noji, R Yasuda, K Kinosita, and M Yoshida, Direct obser-
vation of the rotation of epsilon subunit in F1-ATPase, Journal of Biological
Chemistry 273, 19375–19377 (1998).
[86] B Zimmermann, M Diez, N Zarrabi, P Graber, and M Borsch, Movements of
the epsilon-subunit during catalysis and activation in single membrane-bound
H(+)-ATP synthase, EMBO Journal 24, 2053–2063 (2005).
[87] R Yasuda, H Noji, K Kinosita, and M Yoshida, F1-ATPase is a highly efficient
molecular motor that rotates with discrete 120 degree steps, Cell 93, 1117–1124
(1998).
[88] Jeremy M Berg, John L Tymoczko, and Lubert Stryer, Biochemistry (W.
H. Freeman, 5th edition edition, feb 2002).
[89] K Adachi, R Yasuda, H Noji, H Itoh, Y Harada, M Yoshida, and K Ki-
nosita, Stepping rotation of F1-ATPase visualized through angle-resolved
single-fluorophore imaging, Proceedings of National Academy of Science U
S A 97, 7243–7247 (2000).
[90] N Sakaki, R Shimo-Kon, K Adachi, H Itoh, S Furuike, E Muneyuki,
M Yoshida, and K Kinosita, One rotary mechanism for F1-ATPase over ATP
concentrations from millimolar down to nanomolar, Biophysical Journal 88,
2047–2056 (2005).

BIBLIOGRAPHY 165
[91] R Yasuda, H Noji, M Yoshida, K Kinosita, and H Itoh, Resolution of distinct
rotational substeps by submillisecond kinetic analysis of F1-ATPase, Nature
410, 898–904 (2001).
[92] K Shimabukuro, R Yasuda, E Muneyuki, K Y Hara, K Kinosita, and
M Yoshida, Catalysis and rotation of F1 motor: cleavage of ATP at the cat-
alytic site occurs in 1 ms before 40 degree substep rotation, Proceedings of
National Academy of Science U S A 100, 14731–14736 (2003).
[93] T Nishizaka, K Oiwa, H Noji, S Kimura, E Muneyuki, M Yoshida, and K Ki-
nosita, Chemomechanical coupling in F1-ATPase revealed by simultaneous ob-
servation of nucleotide kinetics and rotation, Nature Structural and Molecular
Biology 11, 142–148 (2004).
[94] K Y Hara, H Noji, D Bald, R Yasuda, K Kinosita, and M Yoshida, The role
of the DELSEED motif of the beta subunit in rotation of F1-ATPase, Journal
of Biological Chemistry 275, 14260–14263 (2000).
[95] T Ariga, T Masaike, H Noji, and M Yoshida, Stepping rotation of F(1)-ATPase
with one, two, or three altered catalytic sites that bind ATP only slowly, Jour-
nal of Biological Chemistry 277, 24870–24874 (2002).
[96] H Noji, D Bald, R Yasuda, H Itoh, M Yoshida, and K Kinosita, Purine but not
pyrimidine nucleotides support rotation of F(1)-ATPase, Journal of Biological
Chemistry 276, 25480–25486 (2001).
[97] G Oster and H Wang, Reverse engineering a protein: the mechanochemistry
of ATP synthase, Biochimica et Biophysica Acta 1458, 482–510 (2000).
[98] M D Hossain, S Furuike, Y Maki, K Adachi, M Y Ali, M Huq, H Itoh,
M Yoshida, and K Kinosita, The rotor tip inside a bearing of a thermophilic

BIBLIOGRAPHY 166
F1-ATPase is dispensable for torque generation, Biophysical Journal 90, 4195–
4203 (2006).
[99] A Iwamoto, J Miki, M Maeda, and M Futai, H(+)-ATPase gamma subunit
of Escherichia coli. Role of the conserved carboxyl-terminal region, Journal of
Biological Chemistry 265, 5043–8 (1990).
[100] M Sokolov, L Lu, W Tucker, F Gao, P A Gegenheimer, and M L Richter, The
20 C-terminal amino acid residues of the chloroplast ATP synthase gamma
subunit are not essential for activity, Journal of Biological Chemistry 274,
13824–13829 (1999).
[101] M Muller, O Panke, W Junge, and S Engelbrecht, F1-ATPase, the C-terminal
end of subunit gamma is not required for ATP hydrolysis-driven rotation, The
Journal of Biological Chemistry 277, 23308–23313 (2002).
[102] Y Hirono-Hara, H Noji, M Nishiura, E Muneyuki, K Y Hara, R Yasuda, K Ki-
nosita, and M Yoshida, Pause and rotation of F(1)-ATPase during catalysis,
Proceedings of National Academy of Science U S A 98, 13649–13654 (2001).
[103] Y M Milgrom, L L Ehler, and P D Boyer, ATP binding at noncatalytic sites of
soluble chloroplast F1-ATPase is required for expression of the enzyme activity,
Journal of Biological Chemistry 265, 18725–18728 (1990).
[104] Y M Milgrom, L L Ehler, and P D Boyer, The characteristics and effect on
catalysis of nucleotide binding to noncatalytic sites of chloroplast F1-ATPase,
Journal of Biological Chemistry 266, 11551–11558 (1991).
[105] J M Jault and W S Allison, Slow binding of ATP to noncatalytic nucleotide
binding sites which accelerates catalysis is responsible for apparent negative
cooperativity exhibited by the bovine mitochondrial F1-ATPase, Journal of Bi-
ological Chemistry 268, 1558–1566 (1993).

BIBLIOGRAPHY 167
[106] D J Hyndman, Y M Milgrom, E A Bramhall, and R L Cross, Nucleotide-
binding sites on Escherichia coli F1-ATPase. specificity of noncatalytic sites
and inhibition at catalytic sites by MgADP, Journal of Biological Chemistry
269, 28871–28877 (1994).
[107] N Mitome, S Ono, T Suzuki, K Shimabukuro, E Muneyuki, and M Yoshida,
The presence of phosphate at a catalytic site suppresses the formation of the
MgADP-inhibited form of F(1)-ATPase, European Journal of Biochemistry
269, 53–60 (2002).
[108] Y Hirono-Hara, K Ishizuka, K Kinosita, M Yoshida, and H Noji, Activation
of pausing F1 motor by external force, Proceedings of National Academy of
Science U S A 102, 4288–4293 (2005).
[109] H Itoh, A Takahashi, K Adachi, H Noji, R Yasuda, M Yoshida, and K Ki-
nosita, Mechanically driven ATP synthesis by F1-ATPase, Nature 427, 465–
468 (2004).
[110] Y Rondelez, G Tresset, K V Tabata, H Arata, H Fujita, S Takeuchi, and
H Noji, Microfabricated arrays of femtoliter chambers allow single molecule
enzymology, Nature Biotechnology 23, 361–365 (2005).
[111] Y Rondelez, G Tresset, T Nakashima, Y Kato-Yamada, H Fujita, S Takeuchi,
and H Noji, Highly coupled ATP synthesis by F1-ATPase single molecules,
Nature 433, 773–777 (2005).
[112] G Kaim, M Prummer, B Sick, G Zumofen, A Renn, U P Wild, and P Dimroth,
Coupled rotation within single F0F1 enzyme complexes during ATP synthesis
or hydrolysis, FEBS Letters 525, 156–163 (2002).
[113] M Diez, B Zimmermann, M Borsch, M Konig, E Schweinberger, S Steigmiller,
R Reuter, S Felekyan, V Kudryavtsev, C A Seidel, and P Graber, Proton-

BIBLIOGRAPHY 168
powered subunit rotation in single membrane-bound F0F1-ATP synthase, Na-
ture Structural and Molecular Biology 11, 135–141 (2004).
[114] M D Wang, H Yin, R Landick, J Gelles, and S M Block, Stretching DNA with
optical tweezers, Biophysical Journal 72, 1335–1346 (1997).
[115] T Nishi and M Forgac, The vacuolar (H+)-ATPases–nature’s most versatile
proton pumps, Nature Reviews Molecular Cell Biology 3, 94–103 (2002).
[116] K W Beyenbach and H Wieczorek, The V-type H+ ATPase: molecular struc-
ture and function, physiological roles and regulation, Journal of Experimental
Biology 209, 577–89 (2006).
[117] O Drory and N Nelson, The emerging structure of vacuolar atpases, Physiology
21, 317–325 (2006).
[118] P M Kane, Disassembly and reassembly of the yeast vacuolar H(+)-ATPase
in vivo, Journal of Biological Chemistry 270, 17025–17032 (1995).
[119] M Lu, Y Y Sautin, L S Holliday, and S L Gluck, The glycolytic enzyme aldolase
mediates assembly, expression, and activity of vacuolar H+-ATPase, Journal
of Biological Chemistry 279, 8732–8739 (2004).
[120] A M Smardon, M Tarsio, and P M Kane, The RAVE complex is essential for
stable assembly of the yeast V-ATPase, Journal of Biological Chemistry 277,
13831–13839 (2002).
[121] T Inoue, Y Wang, K Jefferies, J Qi, A Hinton, and M Forgac, Structure and
regulation of the V-ATPases, Journal of Bioenergetics and Biomembranes 37,
393–398 (2005).
[122] Y Y Sautin, M Lu, A Gaugler, L Zhang, and S L Gluck, Phosphatidylinos-
itol 3-kinase-mediated effects of glucose on vacuolar H+-ATPase assembly,
BIBLIOGRAPHY 169
translocation, and acidification of intracellular compartments in renal epithe-
lial cells, Molecular Cell Biology 25, 575–589 (2005).
[123] B Zimmermann, P Dames, B Walz, and O Baumann, Distribution and
serotonin-induced activation of vacuolar-type H+-ATPase in the salivary
glands of the blowfly Calliphora vicina, Journal of Experimental Biology 206,
1867–1876 (2003).
[124] M Grabe, H Wang, and G Oster, The mechanochemistry of V-ATPase proton
pumps, Biophysical Journal 78, 2798–2813 (2000).
[125] T Murata, I Yamato, Y Kakinuma, A G Leslie, and J E Walker, Structure of
the rotor of the V-Type Na+-ATPase from Enterococcus hirae, Science 308,
654–659 (2005).
[126] N R Francis, G E Sosinsky, D Thomas, and D J DeRosier, Isolation, char-
acterization and structure of bacterial flagellar motors containing the switch
complex, Journal of Molecular Biology 235, 1261–1270 (1994).
[127] H C Berg, The rotary motor of bacterial flagella, Annual Review of Biochem-
istry 72, 19–54 (2003).
[128] G E Murphy, J R Leadbetter, and G J Jensen, In situ structure of the complete
Treponema primitia flagellar motor, Nature 442, 1062–1064 (2006).
[129] R M Berry and J P Armitage, The Bacterial Flagella Motor, Advances in
Microbial Physiology 41, 291–337 (1997).
[130] R M Macnab, How bacteria assemble flagella, Annual Review of Biochemistry
57, 77–100 (2003).
[131] T Hirano, S Yamaguchi, K Oosawa, and S I Aizawa, Roles of FliK and FlhB

BIBLIOGRAPHY 170
in determination of flagellar hook length in Salamonella typhimurium, Journal
of Bacteriology 176, 5439–49 (1994).
[132] S M Block, D F Blair, and H C Berg, Compliance of bacterial flagella measured
with optical tweezers, Nature 338, 514–518 (1989).
[133] S M Block, D F Blair, and H C Berg, Compliance of bacterial polyhooks mea-
sured with optical tweezers, Cytometry 12, 492–496 (1991).
[134] C J Jones, R M Macnab, H Okino, and S I Aizawa, Stoichiometric analysis of
the flagellar hook-(basal-body) complex of Salmonella typhimurium, Journal of
Molecular Biology 212, 377–87 (1990).
[135] M Homma, K Kutsukake, M Hasebe, T Iiono, and R M Macnab, FlgB, FlgC,
FlgF and FlgG. A family of structurally related proteins in the flagellar basal
body of Salmonella typhimurium, Journal of Molecular Biology 211, 465–77
(1990).
[136] T Ueno, K Oosawa, and S Aizawa, M ring, S ring and proximal rod of the
flagellar basal body of Salmonella typhimurium are composed of subunits of
single protein, FliF, Journal of Molecular Biology 227, 672–7 (1992).
[137] T Ueno, K Oosawa, and S Aizawa, Domain structures of the MS ring com-
ponent protein (FliF) of the flagellar basal body of Salmonella typhimurium,
Journal of Molecular Biology 236, 546–55 (1994).
[138] S Yamaguchi, S Aizawa, M Kihara, M Isomura, C J Jones, and R M Macnab,
Genetic evidence for a switching and energy-transducing complex in the flag-
ellar motor of Salmonella typhimurium, Journal of Bacteriology 168, 1172–9
(1986).
[139] S Yamaguchi, H Fujita, A Ishihara, S Aizawa, and R M Macnab, Subdivision of
BIBLIOGRAPHY 171
flagellar genes of Salmonella typhimurium into regions for assembly, rotation
and switching, Journal of Bacteriology 166, 187–93 (1986).
[140] D R Thomas, N R Francis, C Xu, and D J Derosier, The three-dimensional
structure of the flagellar rotor from a clockwise-locked mutant of Salmonella
enterica serovar Typhimurium, Journal of Bacteriology 188, 7033–5 (2006).
[141] K Oosawa, T Ueno, and S Aizawa, Overproduction of the bacterial flagellar
switch proteins and their interactions with the MS ring complex in vitro, Jour-
nal of Bacteriology 176, 3683–91 (1994).
[142] D L Marykwas, S A Schmidt, and H C Berg, Interacting components of the
flagellar motor of Escherichia coli revealed by the two-hybrid system in yeast,
Journal of Molecular Biology 256, 564–76 (1996).
[143] N R Francis, V M Irikura, S Yamaguchi, D J DeRosier, and R M Macnab,
Localization of the Salmonella typhimurium flagellar switch protein FliG to the
cytoplasmic M-ring face of the basal body, Proceedings of National Academy
of Science U S A 89, 6304–8 (1992).
[144] D Thomas, Morgan D G, and D J DeRosier, Structures of bacterial flagellar
motors from two FliF-FliG gene fusion mutants, Journal of Bacteriology 183,
6404–12 (2001).
[145] A S Toker and R M Macnab, Distinct regions of bacterial flagellar switch
protein FliM interact with Fli, FliN and CheY, Journal of Molecular Biology
273, 623–34 (1997).
[146] H Tang, T F Braun, and D F Blair, Motility protein complexes in the bacterial
flagellar motor, Journal of Molecular Biology 261, 209–21 (1996).
[147] M Welch, K Oosawa, S Aizawa, and M Eisenbach, Phosphorylation-dependent
BIBLIOGRAPHY 172
binding of a single molecule to the flagellar switch of bacteria, Proceedings of
National Academy of Science U S A 90, 8787–91 (1993).
[148] M Welch, K Oosawa, S I Aizawa, and M Eisenbach, Effects of phosphorylation,
Mg2+, and conformation of the chemotaxis CheY on its binding to the flagellar
switch protein FliM, Biochemistry 33, 10470–6 (994).
[149] A Bren and M Eisenbach, The N terminus of the flagellar switch protein, FliM,
is the binding domain for the chemotactic response regulator, CheY, Journal
of Molecular Biology 278, 507–14 (1998).
[150] K Sato and M Homma, Multimeric structure of PomA, a component of the
Na+-driven polar flagellar motor of vibrio alginolyticus, Journal of Biological
Chemistry 275, 20223–8 (2000).
[151] T Yorimitsu, M Kojima, T Yakushi, and M Homma, Multimeric structure of
the PomA/PomB channel complex in the Na+-driven flagellar motor of Vibrio
alginolyticus, Journal of Biochemistry (Tokyo) 135, 43–51 (2004).
[152] D F Blair and H C Berg, Mutations in the MotA protein of Escherichia coli
reveal domains critical for proton conduction, Journal of Molecular Biology
173, 4049–55 (1991).
[153] J Zhou, R T Fazzio, and D F Blair, Membrane topology of the MotA protein
of escherichia coli, Journal of Molecular Biology 251, 237–42 (1995).
[154] S Y Chun and J S Parkinson, Bacterial motility: membrane topology of the
Escherichia coli MotB protein, Science 239, 276–8 (1988).
[155] R de Mot and J Vanderleyden, A conserved surface-exposed domain in major
outer membrane proteins of pathogenic pseudomonas and branhamella species
shares sequence homology with the calcium-binding repeats of the eukaryotic

BIBLIOGRAPHY 173
extracellular matrix protein thrombospondin, Molecular Microbiology 13, 379–
80 (1994).
[156] J Zhou, L L Sharp, H L Tang, S A Lloyd, S Billings, T F Braun, and D F
Blair, Function of protonatable residues in the flagellar motor of Escherichia
coli: a critical role for Asp32 of MotB, Journal of Bacteriology 180, 2729–35
(1998).
[157] D C Fung and H C Berg, Powering the flagellar motor of Escherichia coli with
an external voltage source, Nature 375, 809–812 (1995).
[158] C V Gabel and H C Berg, The speed of the flagellar rotary motor of Escherichia
coli varies linearly with protonmotive force, Proceedings of National Academy
of Science U S A 100, 8748–8751 (2003).
[159] M D Manson, P Tedesco, H C Berg, F M Harold, and C Van der Drift, A
protonmotive force drives bacterial flagella, Proceedings of National Academy
of Science U S A 74, 3060–3064 (1977).
[160] M D Manson, P M Tedesco, and H C Berg, Energetics of flagellar rotation in
bacteria, Journal of Molecular Biology 138, 541–561 (1980).
[161] Y Sowa, H Hotta, M Homma, and A Ishijima, Torque-speed relationship of
the Na+-driven flagellar motor of Vibrio alginolyticus, Journal of Molecular
Biology 327, 1043–1051 (2003).
[162] C J Lo, M C Leake, Pilizota T, and R M Berry, Nonequivalence of membrane
voltage and ion-gradient as driving forces for the bacterial flagellar motor at
low load, Biophysical Jorunal 93, 294–302 (2007).
[163] C J Lo, M C Leake, and R M Berry, Fluorescence measurement of intracellular
sodium concentration in single Escherichia coli cells, Biophysical Journal 90,
357–365 (2006).

BIBLIOGRAPHY 174
[164] Y Sowa, A D Rowe, M C Leake, T Yakushi, M Homma, A Ishijima, and R M
Berry, Direct observation of steps in rotation of the bacterial flagellar motor,
Nature 437, 916–919 (2005).
[165] Y Asai, T Yakushi, I Kawagishi, and M Homma, Ion-coupling determinants
of Na+-driven and H+-driven flagellar motors, Journal of Molecular Biology
327, 453–463 (2003).
[166] M Meister, G Lowe, and H C Berg, The proton flux through the bacterial
flagellar motor, Cell 49, 643–650 (1987).
[167] J B Armstrong and J Adler, Complementation of nonchemotactic mutants of
Escherichia coli, Genetics 61, 61–66 (1969).
[168] M Silverman, P Matsumura, and M Simon, The identification of the mot
gene product with Escherichia coli-lambda hybrids, Proceedings of National
Academy of Science U S A 73, 3126–3130 (1976).
[169] S M Block and H C Berg, Successive incorporation of force-generating units
in the bacterial rotary motor, Nature 309, 470–472 (1984).
[170] D F Blair and H C Berg, Restoration of torque in defective flagellar motors,
Science 242, 1678–1681 (1988).
[171] S W Reid, M C Leake, J H Chandler, C J Lo, J P Armitage, and R M
Berry, The maximum number of torque-generating units in the flagellar motor
of Escherichia coli is at least 11, Proceedings of National Academy of Science
U S A 103, 8066–8071 (2006).
[172] M C Leake, J H Chandler, G H Wadhams, F Bai, R M Berry, and J P
Armitage, Stoichiometry and turnover in single, functioning membrane protein
complexes, Nature 443, 355–358 (2006).
BIBLIOGRAPHY 175
[173] W S Ryu, R M Berry, and H C Berg, Torque-generating units of the flagellar
motor of Escherichia coli have a high duty ratio, Nature 403, 444–447 (2000).
[174] X Chen and H C Berg, Torque-speed relationship of the flagellar rotary motor
of Escherichia coli, Biophysical Journal 78, 1036–1041 (2000).
[175] R M Berry and H C Berg, Torque generated by the flagellar motor of Es-
cherichia coli while driven backward, Biophysical Journal 76, 580–7 (1999).
[176] H C Berg and L Turner, Torque generated by the flagellar motor of Escherichia
coli, Biophysical Journal 65, 2201–221 (1993).
[177] R M Berry, L Turner, and H C Berg, Mechanical limits of bacterial flagellar
motors probed by electrorotation, Biophysical Journal 69, 280–6 (1995).
[178] R M Berry and H C Berg, Absence of a barrier to backwards rotation of the
bacterial flagellar motor demonstrated with optical tweezers, Proceedings of
National Academy of Science U S A 94, 14433–14437 (1997).
[179] T Pilizota, T Bilyard, F Bai, H Hosokawa, M Futai, and R M Berry, A pro-
grammable optical angle clamp for rotary molecular motors, Biophysical Jour-
nal 93, 264–75 (2007).
[180] A D Samuel and H C Berg, Fluctuation analysis of rotational speeds of the
bacterial flagellar motor, Proceedings of National Academy of Science U S A
92, 3502–3506 (1995).
[181] A D Samuel and H C Berg, Torque-generating units of the bacterial flagellar
motor step independently, Biophysical Journal 71, 918–923 (1996).
[182] S M Block, J E Segall, and H C Berg, Adaptation kinetics in bacterial chemo-
taxis, Journal of Bacteriology 154, 312–323 (1983).
BIBLIOGRAPHY 176
[183] S Kudo, Y Magariyama, and S Aizawa, Abrupt changes in flagellar rotation
observed by laser dark-field microscopy, Nature 346, 677–80 (1990).
[184] B E Scharf, K A Fahrner, L Turner, and H C Berg, Control of direction of
flagellar rotation in bacterial chemotaxis, Proceedings of National Academy of
Science U S A 95, 201–206 (1998).
[185] U Alon, L Camarena, M G Suretter, B Aguera y Arcas, Y Liu, S Leibler, and
JB Stock, Response regulator output in bacterial chemotaxis, EMBO Journal
17, 4238–48 (1998).
[186] P Cluzel, M Surette, and S Leibler, An ultrasensitive bacterial motor revealed
by monitoring signaling proteins in single cells, Science 287, 1652–1655 (2000).
[187] M Eisenbach, A Wolf, M Welch, S R Caplan, I R Lapidus, R M Macnab,
H Aloni, and O Asher, Pausing, switching and speed fluctuation of the bacte-
rial flagellar motor and their relation to motility and chemotaxis, Journal of
Molecular Biology 211, 551–63 (1990).
[188] T A Duke, N Le Novere, and D Bray, Conformational spread in a ring of
proteins: a stochastic approach to allostery, Journal of Molecular Biology 308,
541–553 (2001).
[189] D Bray and Duke T, Conformational spread: The propagation of allosteric
states in large multiprotein complexes, Annual Review of Biophysics and
Biomolecular Structure 33, 53–73 (2004).
[190] E Korobkova, T Emonet, J M G Vilar, T S Shimizu, and P Cluzel, From
molecular noise to behavioural variability in a single bacterium, Nature 428,
574–8 (2004).
[191] E A Korobkova, T Emonet, H Park, and P Cluzel, Hidden stochastic nature

BIBLIOGRAPHY 177
of a single bacterial motor, Physical Review Letters 96, 058105(1)–058105(4)
(2006).
[192] F Xing, Jand Bai, R Berry, and G Oster, Torque-speed relationship of the
bacterial flagellar motor, Proceedings of the National Academy of Sciences of
the U S A 103, 1260–1265 (2006).
[193] A J Turberfield, J C Mitchell, B Yurke, A P Mills, M I Blakey, and F C
Simmel, DNA fuel for free-running nanomachines, Physical Review Letters
90, 118102–118102 (2003).
[194] J Bath, S J Gree, and A J Turberfield, A free-running DNA motor powered by
a nicking enzyme, Angewandte Chemie International Edition 44, 4358–4361
(2005).
[195] F Cozzi, A Guenzi, C A Johnson, K Mislow, Hounshell, and J F Blount,
Stereoisomerism and correlated rotation in molecular gear systems. Residual
diastereomers of bis(2,3-dimethyl-9-triptycyl)methane, Journal of the Ameri-
can Chemical 103, 957–958 (1981).
[196] J Clayden and J H Pink, Concerted rotation in a tertiary aromatic amide: To
wards a simple molecular gear, Angewandte Chemie International Edition 37,
1937–1939 (1998).
[197] T C Bedard and J S Moore, Design and synthesis of a ’molecular turnstile’,
Journal of the American Chemical Society 117, 10662–10671 (1995).
[198] C A Schalley, K Beizai, and F Vogtle, On the way to rotaxane-based molecular
motors: Studies in molecular mobility and topological chirality, Accounts of
Chemical Research 34, 465 – 476 (2001).
[199] A R Pease, J O Jeppesen, J F Stoddart, Y Luo, C P Collier, and J R Heath,

BIBLIOGRAPHY 178
Switching devices based on interlocked molecules, Accounts of Chemical Re-
search 34, 433–444 (2001).
[200] A Ashkin, Acceleration and trapping of particles by radiation pressure, Physical
Review Letters 24, 156–159 (1970).
[201] A Ashkin and J M Dziedzic, Optical levitation by radiation pressure, Applied
Physics Letters 19, 283–285 (1971).
[202] A Ashkin, J M Dziedzic, J E Bjorkholm, and S Chu, Observation of a single-
beam gradient force optical trap for dielectric particles, Optics Letters 11,
288–290 (1986).
[203] A Ashkin, History of optical trapping and manipulation of small-neutral par-
ticle, atoms, and molecules, IEEE Journal on Selected Topics in Quantum
Electronics 6, 841–856 (2000).
[204] S Chu, J E Bjorkholm, A Ashkin, and A Cable, Experimental observation of
optically trapped atoms, Physical Review Letters 57, 314 – 317 (1986).
[205] A Ashkin, JM Dziedzic, and T Yamane, Optical trapping and manipulation of
single cells using infrared laser beams, Nature 330, 769 – 771 (1987).
[206] A Ashkin and J M Dziedzic, Optical trapping and manipulation of viruses and
bacteria, Science 235, 1517 – 1520 (1987).
[207] K Svoboda and SM Block, Biological applications of optical forces, Annual
Review of Biophysics and Biomolecular Structure 23, 247–85 (1994).
[208] A D Mehta, Single-molecule biomechanics with optical methods, Science 283,
1689–1695 (1999).
[209] K C Neuman and S M Block, Optical trapping, Review of Scientific Instruments
75, 2787–2809 (2004).

BIBLIOGRAPHY 179
[210] J E Molloy and M J Padgett, Lights, action: optical tweezers, Contemporary
Physics 43, 241–258(18) (2002).
[211] T A Nieminen, H Rubinsztein-Dunlop, and N R Heckenberg, Calculation and
optical measurement of laser trapping forces on non-spherical particles, Journal
of Quantitative Spectroscopy and Radiative Transfer 70, 627–637 (2001).
[212] J D Jacskon, Classical Electrodynamics (John Wiley and Sons, 1998).
[213] J P Barton and D R Alexander, Fifth-order corrected electromagnetic field
components for a fundamental Gaussian beam, Journal of Applied Physics 66,
2800–2802 (2006).
[214] A Doicu and T Wriedt, Plane wave spectrum of electromagnetic beams, Optics
Communications 136, 114–124(11) (1997).
[215] C F Bohren and D R Huffman, Absorption and Scattering of Light by
Small Particles (John Wiley, 1998).
[216] K F Ren, G Gouesbet, and G Grehan, Integral localized approximation in
generalized Lorentz-Mie theory, Applied Optics 37, 4218–4225 (1998).
[217] M I Mishchenko and L D Travis, Capabilities and limitations of a current
FORTRAN implementation of the T-matrix method for randomly oriented,
rotationally symmetric scatterers-computational methods, Journal of Quanti-
tative Spectroscopy and Radiative Transfer 60, 309–324(16) (1998).
[218] M I Mishchenko, L D Travis, and A Macke, T-matrix method and its
applications (Academic Press, 2000).
[219] C Rockstuhl and H P Herzig, Rigorous diffraction theory applied to the analysis
of the optical force on elliptical nano- and micro-cylinders, Journal of Optics
A Pure and Applied Optics 6, 921–931 (2004).

BIBLIOGRAPHY 180
[220] J L Volakis, A Chatterjee, and L C Kempel, Finite Element Method Elec-
tromagnetics: Antennas, Microwave Circuits, and Scattering Appli-
cations (Wiley-IEEE Press, 1998).
[221] D A White, Numerical modeling of optical gradient traps using the vector finite
element method, Journal of Computational Physics 159, 13–37(25) (2000).
[222] A Taflove and S C Hagness, Computational electrodynamics: the finite-
difference time-domain method (Artech House, 2000).
[223] A G Hoekstra, M Frijlink, L Waters, and P M A Sloot, Radiation forces in
the discrete-dipole approximation, Journal of the Optical Society of America
A 18, 1944–53 (2001).
[224] K Visscher, G J Brakenhoff, and J J Krol, Micromanipulation by multiple
optical traps created by a single fast scanning trap integrated with the bilateral
confocal scanning laser microscope, Cytometry 14, 105 – 114 (1993).
[225] J E Molloy, J E Burns, J C Sparrow, R T Tregear, J Kendrick-Jones, and D C S
White, Single-molecule mechanics of heavy meromyosin and S1 interacting
with rabbit or Drosophila actins using optical tweezers, Biophysical Journal
68, 298S305S (1995).
[226] H M Warrick, R M Simmons, J T Finer, T Q Uyeda, S Chu, and J A Spu-
dich, In vitro methods for measuring force and velocity of the actin-myosin
interaction using purified proteins, Methods in Cell Biology 39, 1–21 (1993).
[227] M Reicherter, T Haist, E U Wagemann, and H J Tiziani, Optical particle
trapping with computer-generated holograms written on a liquid-crystal display,
Optics Letters 24, 608–610 (1999).
[228] T A Nieminen, N R Heckenberg, and H Rubinsztein-Dunlop, Optical measure-
ment of microscopic torques, Journal of Modern Optics 48, 405–413 (2001).

BIBLIOGRAPHY 181
[229] M E J Friese, T A Nieminen, N R Heckenberg, and H Rubinsztein-Dunlop,
Optical alignment and spinning of laser-trapped microscopic particles, Nature
394, 348–350 (1998).
[230] E Higurashi, R Sawada, and T Ito, Optically induced angular alignment of
trapped birefringent micro-objects by linearly polarized light, Physical Review
E 59, 3676–3681 (1999).
[231] W Singer, T A Nieminen, U J Gibson, N R Heckenberg, and H Rubinsztein-
Dunlop, Orientation of optically trapped nonspherical birefringent particles,
Physical Review E 73, 021911(1)–021911(5) (2006).
[232] A I Bishop, T A Nieminen, N R Heckenberg, and H Rubinsztein-Dunlop,
Optical microrheology using rotating laser-trapped particles, Physical Review
Letters 92, 198104(1)–198104(4) (2004).
[233] A L Porta and M Wang, Optical torque wrench: Angular trapping, rotation
and torque detection of quartz microparticles, Physical Review Letters 92,
190801(1)–190801(4) (2004).
[234] A I Bishop, T A Nieminen, and N R Heckenberg, Optical application and
measurement of torque on microparticles of isotropic nonabsorbing material,
Physical Review A 68, 033802(1)–033802(8) (2003).
[235] S Bayoudh, T A Nieminen, and N R Heckenberg, Orientation of biological
cells using plane-polarized Gaussina beam optical tweezers, Journal of Modern
Optics 50, 1581–1590 (2003).
[236] R C Gauthier, M Ashman, and C P Grover, Experimental confirmation of the
optical-trapping properties of cylindrical objects, Applied Optics 38, 4861–4869
(1999).

BIBLIOGRAPHY 182
[237] A I Bishop, T A Nieminen, N R Heckenberg, and H Rubinsztein-Dunlop,
Optical application and measurement of torque on microparticles of isotropic
nonabsorbing material, Physical Review A 68, 033802(1)–033802(8) (2003).
[238] H Rubinsztein-Dunlop, T A Nieminen, M E J Friese, and N R Heckenberg,
Optical trapping of absorbing particles, Advances in Quantum Chemistry 30,
469–492 (1998).
[239] M E J Friese, J Enger, H Rubinsztein-Dunlop, and N R Heckenberg, Optical
angular-momentum transfer of trapped absorbing particles, Physical Review A
pages 1593–1596 (1996).
[240] M E J. Friese, J Enger, H Rubinsztein-Dunlop, and N R Heckenberg, Optical
angular-momentum transfer to trapped absorbing particles, Physical Review A
54, 1593–1596 (1996).
[241] H He, M E J Friese, N R Heckenberg, and H Rubinsztein-Dunlop, Direct ob-
servation of transfer of angular momentum to absorptive particles from a laser
beam with a phase singularity, Physical Review Letters 75, 826–829 (1995).
[242] H He, N R Heckenberg, and H Rubinsztein-Dunlop, Optical particle trapping
with higher-order doughnut beams produced using high efficiency computer gen-
erated holograms, Journal of Modern Optics 42, 217–223(7) (1995).
[243] H Rubinsztein-Dunlop, T A Nieminen, M E J Friese, and N R Heckenberg,
Optical trapping of absorbing particles, Advances in Quantum Chemistry 30,
469–492 (2003).
[244] L Paterson, M P MacDonald, J Arlt, W Sibbett, P E Bryant, and K Dho-
lakia, Controlled rotation of optically trapped microscopic particles, Science
292, 912–914 (2001).

BIBLIOGRAPHY 183
[245] S Sato, M Ishigure, and H Inaba, Optical trapping and rotational manipulation
of microscopic particles and biological cells using higher-order mode Nd:YAG
laser beams, Electronics Letters 27, 1831–1832 (1991).
[246] E Santamato, A Sasso, B Piccirillo, and A Vella, Optical angular momen-
tum transfer to transparent isotropic particles using laser beam carrying zero
average angular momentum, Optics Express. 10, 871–878 (2002).
[247] A T O’Neil and M J Padgett, Rotational control within optical tweezers by use
of rotating aperture, Optics Letters 27, 743–745 (2002).
[248] P Galajda and P Ormos, Complex micromachines produced and driven by light,
Applied Physics Letters 78, 249–252 (2001).
[249] M Nakanishi-Matsui, S Kashiwagi, H Hosokawa, D J Cipriano, S D Dunn,
Y Wada, and M Futai, Stochastic high-speed rotation of Escherichia coli ATP
synthase F1 sector: the epsilon subunit-sensitive rotation, Journal of Biological
Chemistry 281, 4126–4131 (2006).
[250] D Spetzler, J York, D Daniel, R Fromme, D Lowry, and W Frasch, Microsec-
ond time scale rotation measurements of single F1-ATPase molecules, Bio-
chemistry 45, 3117–3124 (2006).
[251] K Berg-Sorensen and L Oddershede, Unintended filtering in a typical photo-
diode detection system for optical tweezers, Journal of Applied Physics 93,
3167–3176 (2003).
[252] K C Neuman, E H Chadd, G F Liou, K Bergman, and S M Block, Charac-
terication of photodamage to E. coli in optical traps, Biophysical Journal 77,
2856–2863 (1999).

BIBLIOGRAPHY 184
[253] E J Peterman, G A van Dijk Meindert, L C Kapitein, and C F Schmidt, Ex-
tending the bandwidth of optical-tweezers interferometry, Review of Scientific
Instruments 74, 3246–3249 (2003).
[254] H Omote, N Sambonmatsu, K Saito, Y Sambongi, A Iwamoto-Kihara,
Y Yanagida, Y Wada, and M Futai, The gamma-subunit rotation and torque
generation in F1-ATPase from wild-type or uncoupled mutant Escherichia coli,
Proceedings of National Academy of Science U S A 96, 7780–7784 (1999).
[255] Y Iko, Y Sambongi, M Tanabe, A Iwamoto-Kihara, K Saito, I Ueda, Y Wada,
and M Futai, ATP synthase F1 sector rotation, Journal of Biological Chemistry
276, 47508–47511 (2001).
[256] M M Bradford, A rapid and sensitive method for the quantitation of microgram
quantities of protein utilizing the principle of protein-dye binding, Analytical
Biochemistry 72, 248–54 (1976).
[257] O H Lowry, N J Rosebrough, A L Farr, and R J Randall, Protein measurement
with the Folin phenol reagent, Journal of Biological Chemistry 193, 265–275
(1951).
[258] JB Sumner, A method for the colorimetric determination of phosphorus, Sci-
ence 100, 413–414 (1944).
[259] U Piran and W J Riordan, Dissociation rate constant of the biotin-streptavidin
complex, Journal of Immunological Methods 133, 141–3 (1990).
[260] H C Berg and L Turner, Torque generated by the flagellar motor of Escherichia
coli, Biophysical Journal 65, 2201–2216 (1993).
[261] J Bechhoefer, Feedback for physicists: A tutorial essay on control, Reviews of
Modern Physics 77, 783–836 (2005).

BIBLIOGRAPHY 185
[262] K B Sorensen and H Flyvbjerg, Power spectrum analysis for optical tweezers,
Review of Scientific Instruments 75, 594–612 (2004).
[263] C Gosse and V Croquette, Magnetic tweezers: micromanipulation and force
measurement at the molecular level, Biophysical Journal 82, 3314–3329 (2002).
[264] K B Sorensen and H Flyvbjerg, Power spectrum analysis for optical tweezers,
Review of Scientific Instruments 75, 594–612 (2004).
[265] I Tolic-Norrleykke, K Berg-Sorensen, and H Flyvbjerg, MatLab program for
precision calibration of optical tweezers, Computer Physics Communications
159, 225–240 (2004).
[266] A Rohrbach, Stiffness of optical traps: Quantitative agreement between ex-
periment and electromagnetic theory, Physical Review Letters 95, 168102(1)–
168102(4) (2005).
[267] R M Berry and H C Berg, Torque generated by the bacterial flagellar motor
close to stall, Biophysical Journal 71, 3501–3510 (1996).
[268] A D Rowe, Rotation of a sodium driven flagellar motor, D.Phil thesis,
Univeristy of Oxford, Parks Road, OX1 3PU, 2005.
[269] RC Gauthier, Theoretical investigation of the optical trapping force and torque
on cylindrical micro-objects, Journal of the Optical Society of America B 14,
3323–3333 (1997).
[270] C Rockstuhl and H P Herzig, Calculation of the torque on dielectric elliptical
cylinders, Journal of the Optical Society of America A 22, 109–116 (2005).
[271] S Lata, A Reichel, R Brock, R Tampe, and J Piehler, High-affinity adaptors
for switchable recognition of histidine-tagged proteins, Journal of the American
Chemical Society 127, 10205–10215 (2005).
BIBLIOGRAPHY 186
[272] S Lata and J Piehler, Stable and functional immobilization of histidine-tagged
proteins via multivalent chelator headgroups on a molecular poly(ethylene gly-
col) brush, Analytical Chemistry 77, 1096–1105 (2005).
[273] J Malo, J C Mitchell, C Venien-Bryan, J R Harris, H Wille, D J Sherratt, and
A J Turberfield, Engineering a 2D protein-DNA crystal, Angewandte Chemie
International Edition 44, 3057–3061 (2005).
[274] J Malo, DNA scaffolding: a method for protein structure determina-
tion, D.Phil thesis, Univeristy of Oxford, Parks Road, OX1 3PU, 2005.
[275] A Iwamoto, H Omote, H Hanada, N Tomioka, A Itai, M Maeda, and M Futai,
Mutations in Ser174 and the glycine-rich sequence (Gly149, Gly150, and Thr
156) in the beta subunit of Escherichia coli H+-ATPase, Journal of Biological
Chemistry 266, 6350–16355 (1991).